Embed Size (px)
Citation preview
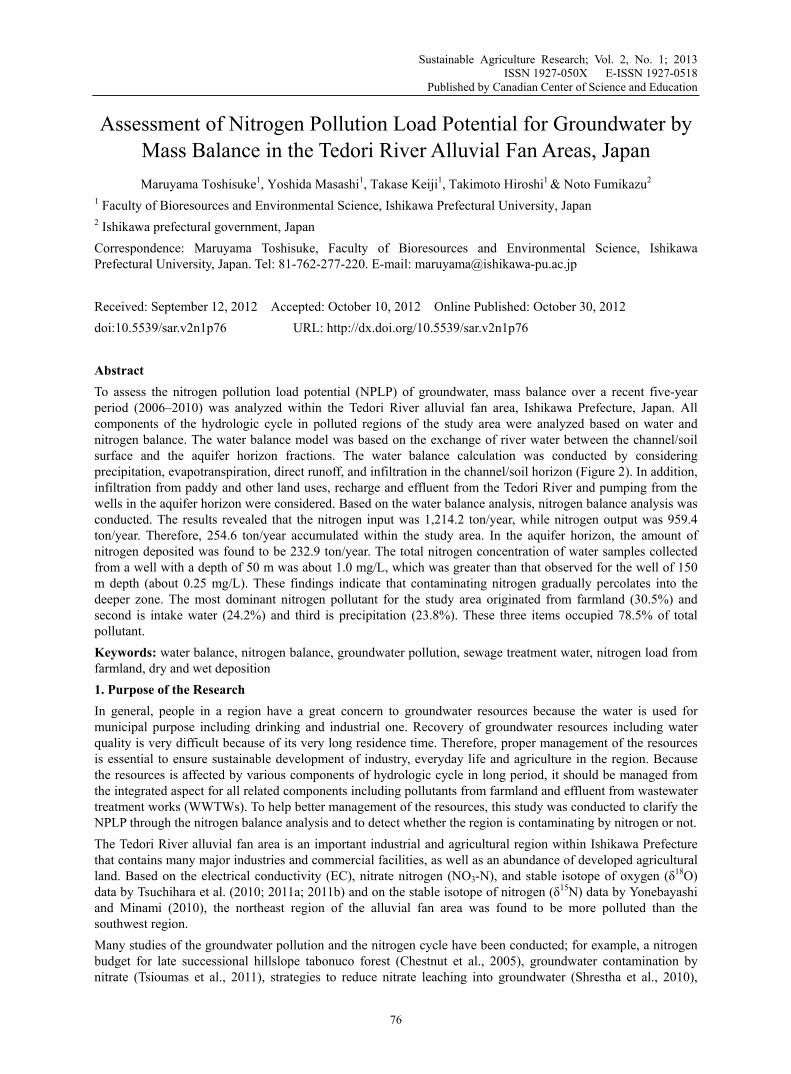
Sustainable Agriculture Research; Vol. 2, No. 1; 2013 ISSN 1927-050X E-ISSN 1927-0518
Published by Canadian Center of Science and Education
76
Assessment of Nitrogen Pollution Load Potential for Groundwater by Mass Balance in the Tedori River Alluvial Fan Areas, Japan
Maruyama Toshisuke1, Yoshida Masashi1, Takase Keiji1, Takimoto Hiroshi1 & Noto Fumikazu2 1 Faculty of Bioresources and Environmental Science, Ishikawa Prefectural University, Japan 2 Ishikawa prefectural government, Japan
Correspondence: Maruyama Toshisuke, Faculty of Bioresources and Environmental Science, Ishikawa Prefectural University, Japan. Tel: 81-762-277-220. E-mail: [email protected]
Received: September 12, 2012 Accepted: October 10, 2012 Online Published: October 30, 2012
doi:10.5539/sar.v2n1p76 URL: http://dx.doi.org/10.5539/sar.v2n1p76
Abstract
To assess the nitrogen pollution load potential (NPLP) of groundwater, mass balance over a recent five-year period (2006–2010) was analyzed within the Tedori River alluvial fan area, Ishikawa Prefecture, Japan. All components of the hydrologic cycle in polluted regions of the study area were analyzed based on water and nitrogen balance. The water balance model was based on the exchange of river water between the channel/soil surface and the aquifer horizon fractions. The water balance calculation was conducted by considering precipitation, evapotranspiration, direct runoff, and infiltration in the channel/soil horizon (Figure 2). In addition, infiltration from paddy and other land uses, recharge and effluent from the Tedori River and pumping from the wells in the aquifer horizon were considered. Based on the water balance analysis, nitrogen balance analysis was conducted. The results revealed that the nitrogen input was 1,214.2 ton/year, while nitrogen output was 959.4 ton/year. Therefore, 254.6 ton/year accumulated within the study area. In the aquifer horizon, the amount of nitrogen deposited was found to be 232.9 ton/year. The total nitrogen concentration of water samples collected from a well with a depth of 50 m was about 1.0 mg/L, which was greater than that observed for the well of 150 m depth (about 0.25 mg/L). These findings indicate that contaminating nitrogen gradually percolates into the deeper zone. The most dominant nitrogen pollutant for the study area originated from farmland (30.5%) and second is intake water (24.2%) and third is precipitation (23.8%). These three items occupied 78.5% of total pollutant.
Keywords: water balance, nitrogen balance, groundwater pollution, sewage treatment water, nitrogen load from farmland, dry and wet deposition
1. Purpose of the Research
In general, people in a region have a great concern to groundwater resources because the water is used for municipal purpose including drinking and industrial one. Recovery of groundwater resources including water quality is very difficult because of its very long residence time. Therefore, proper management of the resources is essential to ensure sustainable development of industry, everyday life and agriculture in the region. Because the resources is affected by various components of hydrologic cycle in long period, it should be managed from the integrated aspect for all related components including pollutants from farmland and effluent from wastewater treatment works (WWTWs). To help better management of the resources, this study was conducted to clarify the NPLP through the nitrogen balance analysis and to detect whether the region is contaminating by nitrogen or not.
The Tedori River alluvial fan area is an important industrial and agricultural region within Ishikawa Prefecture that contains many major industries and commercial facilities, as well as an abundance of developed agricultural land. Based on the electrical conductivity (EC), nitrate nitrogen (NO3-N), and stable isotope of oxygen (δ18O) data by Tsuchihara et al. (2010; 2011a; 2011b) and on the stable isotope of nitrogen (δ15N) data by Yonebayashi and Minami (2010), the northeast region of the alluvial fan area was found to be more polluted than the southwest region.
Many studies of the groundwater pollution and the nitrogen cycle have been conducted; for example, a nitrogen budget for late successional hillslope tabonuco forest (Chestnut et al., 2005), groundwater contamination by nitrate (Tsioumas et al., 2011), strategies to reduce nitrate leaching into groundwater (Shrestha et al., 2010),
www.ccsenet.org/sar Sustainable Agriculture Research Vol. 2, No. 1; 2013
77
impact of population, food preference and agricultural practice (Xiong et al., 2007), prediction of agriculture derived ground water nitrate distribution (Wang et al., 2006), nitrogen cycling with environmental load in farm system (Liang et al., 2005), distribution of nitrate in groundwater affected by aquitard (Nishikiori et al., 2012), new conceptual model of nitrogen saturation on an oak forest (Lovett et al., 2011), cyclic irrigation of paddy fields at Kasumigaura Lake (Kitamura et al., 2010; Kubota et al., 1979; 2000) and at Biwa Lake in the Shiga Prefecture (Hama et al., 2011).
In addition, investigations of the water and nitrogen cycles in small watersheds have also been conducted by many researchers. For example, Burt et al. (2010) suggested that atmospheric deposition was important, while Lin (2010) investigated the nitrogen cycle of a farm system within a small watershed. Eulenstein (2008) investigated leaching of nitrate from water used for agriculture and Su et al. (2010) established the Soil and Water Assessment Model (SWAT) for various spatial data. Brookshire (2009) studied the primary conveyors of terrestrial nutrients to rivers, while Borbor-Cordova (2006) studied nitrogen budgets from a comprehensive aspect.
However, because the water and nitrogen balance issue is strongly dependent upon the characteristics of the site being investigated, the results of these aforementioned studies cannot be applied directly. There is little research on these topics in alluvial fan areas. On the other hand, the alluvial fan is adequate for the purpose of the analysis because of semi closed groundwater basin. Therefore, the overall goal of this study was to clarify the NPLP and the importance of its components through the water and nitrogen balance analysis within the Tedori River Alluvial Fan Areas.
2. Outline of Research Site
2.1 The Research Site
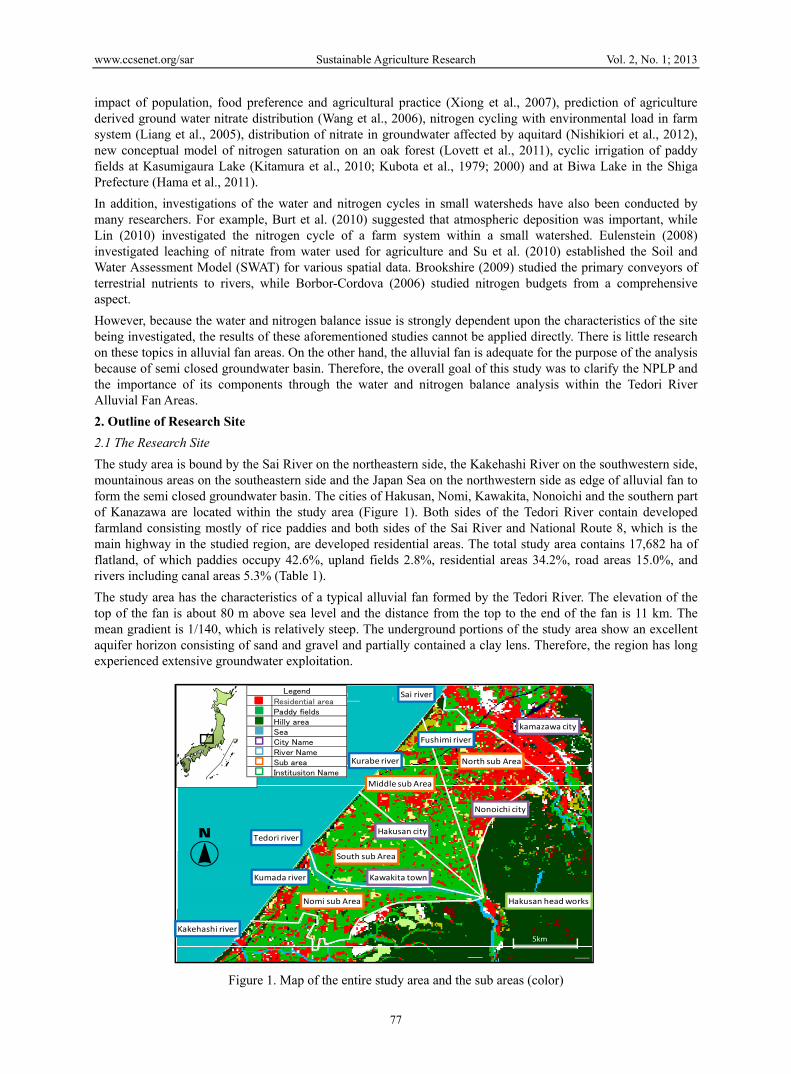
The study area is bound by the Sai River on the northeastern side, the Kakehashi River on the southwestern side, mountainous areas on the southeastern side and the Japan Sea on the northwestern side as edge of alluvial fan to form the semi closed groundwater basin. The cities of Hakusan, Nomi, Kawakita, Nonoichi and the southern part of Kanazawa are located within the study area (Figure 1). Both sides of the Tedori River contain developed farmland consisting mostly of rice paddies and both sides of the Sai River and National Route 8, which is the main highway in the studied region, are developed residential areas. The total study area contains 17,682 ha of flatland, of which paddies occupy 42.6%, upland fields 2.8%, residential areas 34.2%, road areas 15.0%, and rivers including canal areas 5.3% (Table 1).
The study area has the characteristics of a typical alluvial fan formed by the Tedori River. The elevation of the top of the fan is about 80 m above sea level and the distance from the top to the end of the fan is 11 km. The mean gradient is 1/140, which is relatively steep. The underground portions of the study area show an excellent aquifer horizon consisting of sand and gravel and partially contained a clay lens. Therefore, the region has long experienced extensive groundwater exploitation.
Figure 1. Map of the entire study area and the sub areas (color)
5km5km
5km
North sub Area
Middle sub Area
South sub Area
Nomi sub Area
Sai river
Tedori river
Kakehashi river
Kumada river
Kurabe river
Fushimi river
Hakusan head works
kamazawa city
Nonoichi city
Hakusan city
Kawakita town
Residential areaPaddy fieldsHilly areaSeaCity NameRiver NameSub areaInstitusiton Name
Legend

www.ccsenet.org/sar Sustainable Agriculture Research Vol. 2, No. 1; 2013
78
The groundwater level in the area is about 60 m above sea level at the top of the fan and 0 m above sea level at the end of the fan, but shows an upward concave shape. The mean gradient of the groundwater is 1/180, which is relatively steep, but more gently sloped than the ground surface. The groundwater level during the irrigation period is higher than in non-irrigation periods, which indicates that the groundwater is recharged by paddy irrigation water (Maruyama et al., 2012a).
2.2 Land Use within the Study Area
Land use in the area was investigated using mesh data (100 m-mesh), which is more popular than satellite image, provided by the government (Planning Bureau, Ministry of Land, Infrastructure, Transport and Tourism). Because mesh data express the largest area of land use in a mesh, these data overestimated farmland area, while underestimated roads and rivers as line-like land use. Therefore, the area occupied by paddy and upland fields was determined from statistical materials provided by the government of the Ishikawa Prefecture (Hokuriku Regional Agricultural Administration Office, 2006), which is the most reliable method for determining the total area. The area of canals, rivers and roads in the studied region was determined by fundamental land use data provided by the Geographical Survey Institute (2010). The area occupied by residential land use was determined by subtracting the area of paddies, upland, rivers and roads from the total area.
Table 1. Land use in the study area(Unit:ha)
Sub area Paddy Upland Residential River Road Total
North 796 151 2,904 163 923 4,937
Middle 2,260 127 1,454 31 648 4,520
South 2,618 113 1,041 338 606 4,716
Nomi 1,865 111 650 406 477 3,509
Total 7,539 502 6,049 938 2,654 17,682
Rate(%) 42.6% 2.8% 34.2% 5.3% 15.0% 100.0%
2.3 Small Drainage River in Study Area
Additionally, to confirm the reliability of the nitrogen balance analysis, the nitrogen content of small two rivers, the Fushimi and Kurahashi River, in the study area was analyzed by collecting water quality data from the prefectural office (Ishikawa Water Environment Creation Division, Ishikawa Prefecture). The nitrogen content of the Fushima River was investigated every month. The river is fed by 6,200 ha of the basin area and is located at the northern part of the study area, which consists mainly of residential area. The nitrogen content of the Kurabe River was investigated every two months. The river’s catchment consists of 1,700 ha of the basin area and is located in the central part of the study area, which is representative of the drainage river of the study area.
3. Analysis of the Water Balance
3.1 Water Balance Model
A water balance model was established for the study area for estimation of not observed components, surface and groundwater discharge, which require in nitrogen balance analysis. A two-horizon model was applied that simulated the exchange of water between the channel soil and aquifer horizon fractions with the Tedori River (Figure 2). To investigate the water balance, the flow from various components was estimated as shown in Equations (1)–(3).
In the atmosphere:
Pr-(Prd +Prg) =0 (1)
In the channel-soil horizon:
(Qin+Prg)- (ET +Per +Qout) =0 (2)
In the aquifer horizon:
(Per +Tin)- (Pup+Tout+Gout) =0 (3)
where Pr is precipitation, Prd is direct runoff, Prg is infiltration, Qin is the intake water to the study area from the head works, ET is evapotranspiration, Per is the percolation from the soil surface, Qout is the drainage

www.ccsenet.org/sar Sustainable Agriculture Research Vol. 2, No. 1; 2013
79
discharge from the channel, Pup is pumped water from the aquifer, Tin is recharge water from the Tedori River, Tout is effluent water into the Tedori River, and Gout is discharge from the aquifer to the lower reach of the drainage canal or the Sea of Japan directly.
Pr Pup
ETPrd Prg
Qout Qin
Per
Gout
Tout Tin
Channel/soil horizon fraction
Aquifre horizon fraction
Tedori river fraction
Symbol: Refer to section 3.1,equation (1)~(3)
Figure 2. Water balance model and their symbols in the model
3.2 Elements of the Hydrological Cycle
3.2.1 Precipitation and Evapotranspiration (ET)
Precipitation data used in this study covered five years (2006–2010) and were collected at the Kanazawa Local Meteorological Observation Station (hereafter Kanazawa), which is located about 10 km from the center of the study area. The mean annual precipitation over the study period in the region was 2,255 mm, 840 mm of which occurred during the irrigation period (13th of April–10th of September) and 1,416 mm of which occurred during the non-irrigation period (11th of September–12th of April). Daily evapotranspiration (ET) over the same period was estimated by the Penman equation using the data obtained from Kanazawa. However, the ET of the roads (15.0%) and roofs of houses (11.5%) was assumed to be zero; thus, only 73.5% of the total ET calculated by the penman equation was applied to the entire study area. According to this procedure, the daily ET in the study area was 3.32 mm day-1 during the irrigation period and 1.73 mm/day during the non-irrigation period (Figure 5).
3.2.2 Water Requirement and the Percolation
Murashima (2009) investigated the water requirement at 25 test lots of paddy fields in Shichika and at 12 test lots in the Miyatake Irrigation District. The observations were conducted twice a day at an approximately 12-hour interval and two–five times a week and the water requirement was corrected on a daily basis. The average water requirement was found to be 15.60 mm/day for the entire irrigation period.
The mean percolation during the irrigation period became 10.71 mm/day based on the actual water management depending on flooding or not flooding days. These figures correspond to 3.25 mm/day (Figure 5) for the study area based on evaluation of the entire study area (17,682 ha) and cropped rice fields (5,366 ha).
The percolation water directly supplied the aquifer, because the study area consist of gravel and sand horizon under the topsoil and the distance from the ground surface to the groundwater level was about 20 m at the top of the alluvial fan, 40 m at the center of the fan and 5 m at the end of the fan.
3.2.3 Recharge and Effluent Flow from the Tedori River
The amount of recharge (influent) into the Tedori River or effluent from the Tedori River is a very important factor when evaluating the water balance. Therefore, we conducted a survey of discharge at several sections of the Tedori River during the irrigation and non-irrigation period and calculated the difference in discharge between the two sections. As shown in Figure 5, the discharge clearly occurred between 2.2–16.4 km from the river mouth, which indicates that the water in the river recharged the aquifer underlying the area. The discharge
www.ccsenet.org/sar Sustainable Agriculture Research Vol. 2, No. 1; 2013
80
between 1.1 km–2.2 km from the river mouth increased slightly, which reflects the transport of effluent from the area into the river.
Watabe and Yamazaki (1974) estimated that the recharge would be 2.54 mm/day if the river discharge was 20 m3/day, while it would be 2.27 mm/day if the discharge was 15.0 m3 /s and 1.71 mm/day if the discharge was 10 m3 /s. The result of our investigation was supported by this information.
3.2.4 Pumping Groundwater from Wells
Ishikawa Prefecture reported the amount of groundwater pumped from wells in this area (Ishikawa Prefecture, Kanazawa, Nanao City, 2007). We organized these data into those corresponding to the irrigation and non-irrigation period for the period April of 2005–May of 2006 (Table 6). About 51.3% of all water pumped from the aquifer was used for industrial purposes, while domestic water accounted for 31.6%, the majority of which was used as drinking, bath and washing water. The remainder of the water was used for melting snow and agriculture during winter and summer season, respectively, and for building purposes. The total usage of the groundwater was 1.49 mm/day during the irrigation period and 1.65 mm/day during the non-irrigation period (Figure 5).
3.2.5 Amount of Intake Water for the Paddy Irrigation in the Area
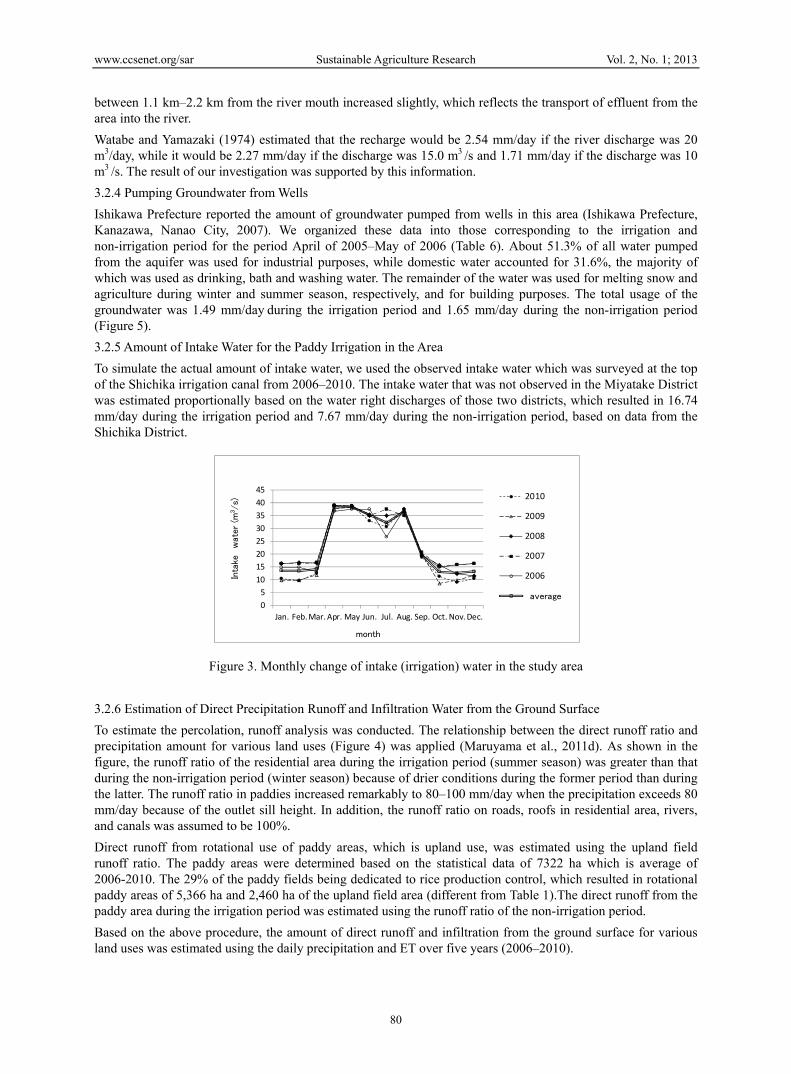
To simulate the actual amount of intake water, we used the observed intake water which was surveyed at the top of the Shichika irrigation canal from 2006–2010. The intake water that was not observed in the Miyatake District was estimated proportionally based on the water right discharges of those two districts, which resulted in 16.74 mm/day during the irrigation period and 7.67 mm/day during the non-irrigation period, based on data from the Shichika District.
0
5
10
15
20
25
30
35
40
45
1 2 3 4 5 6 7 8 9 10 11 12
2010
2009
2008
2007
2006
全域平均
取
水
量
月
取水量の月別変化
Intake
0
5
10
15
20
25
30
35
40
45
Jan. Feb.Mar. Apr. May Jun. Jul. Aug. Sep. Oct. Nov.Dec.
2010
2009
2008
2007
2006
全域平均
month
average
Inta
ke
wate
r (m
3/s)
Figure 3. Monthly change of intake (irrigation) water in the study area
3.2.6 Estimation of Direct Precipitation Runoff and Infiltration Water from the Ground Surface
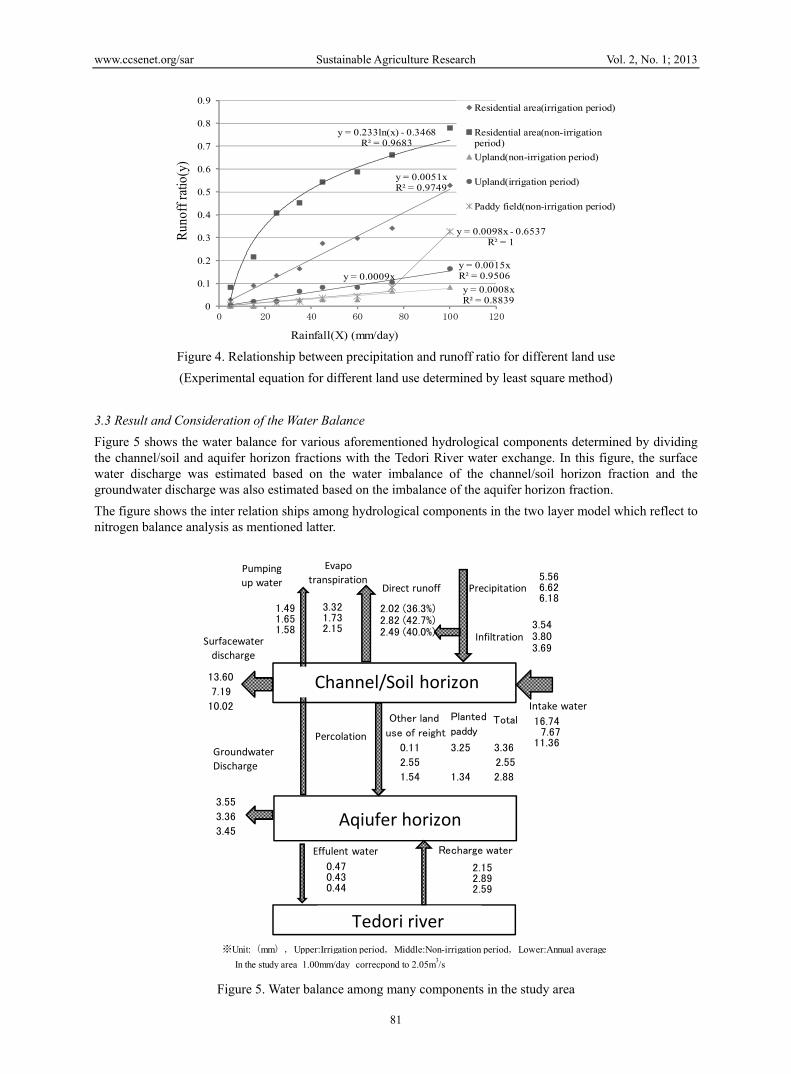
To estimate the percolation, runoff analysis was conducted. The relationship between the direct runoff ratio and precipitation amount for various land uses (Figure 4) was applied (Maruyama et al., 2011d). As shown in the figure, the runoff ratio of the residential area during the irrigation period (summer season) was greater than that during the non-irrigation period (winter season) because of drier conditions during the former period than during the latter. The runoff ratio in paddies increased remarkably to 80–100 mm/day when the precipitation exceeds 80 mm/day because of the outlet sill height. In addition, the runoff ratio on roads, roofs in residential area, rivers, and canals was assumed to be 100%.
Direct runoff from rotational use of paddy areas, which is upland use, was estimated using the upland field runoff ratio. The paddy areas were determined based on the statistical data of 7322 ha which is average of 2006-2010. The 29% of the paddy fields being dedicated to rice production control, which resulted in rotational paddy areas of 5,366 ha and 2,460 ha of the upland field area (different from Table 1).The direct runoff from the paddy area during the irrigation period was estimated using the runoff ratio of the non-irrigation period.
Based on the above procedure, the amount of direct runoff and infiltration from the ground surface for various land uses was estimated using the daily precipitation and ET over five years (2006–2010).
www.ccsenet.org/sar Sustainable Agriculture Research Vol. 2, No. 1; 2013
81
y = 0.0051xR² = 0.9749
y = 0.233ln(x) - 0.3468R² = 0.9683
y = 0.0008xR² = 0.8839
y = 0.0015xR² = 0.9506y = 0.0009x
y = 0.0098x - 0.6537R² = 1
0
0.1
0.2
0.3
0.4
0.5
0.6
0.7
0.8
0.9
0 20 40 60 80 100 120
流出
率
降水量(mm/day)
Residential area(irrigation period)
Residential area(non-irrigationperiod)
Upland(non-irrigation period)
Upland(irrigation period)
Paddy field(non-irrigation period)
Run
off r
atio
(y)
Rainfall(X) (mm/day)
Figure 4. Relationship between precipitation and runoff ratio for different land use
(Experimental equation for different land use determined by least square method)
3.3 Result and Consideration of the Water Balance
Figure 5 shows the water balance for various aforementioned hydrological components determined by dividing the channel/soil and aquifer horizon fractions with the Tedori River water exchange. In this figure, the surface water discharge was estimated based on the water imbalance of the channel/soil horizon fraction and the groundwater discharge was also estimated based on the imbalance of the aquifer horizon fraction.
The figure shows the inter relation ships among hydrological components in the two layer model which reflect to nitrogen balance analysis as mentioned latter.
※Unit:(mm),Upper:Irrigation period,Middle:Non-irrigation period,Lower:Annual average
In the study area 1.00mm/day correcpond to 2.05m3/s
Channel/Soil horizon
Aqiufer horizon
Tedori river
Intake water
Surfacewater
discharge
Groundwater
Discharge
Pumping
up water
Evapo
transpirationDirect runoff
Infiltration
Percolation
Recharge waterEffulent water
Precipitation5.566.626.18
16.747.67
11.36
3.543.803.69
2.02 (36.3%)2.82 (42.7%) 2.49 (40.0%)
3.321.732.15
1.491.651.58
13.60
7.19
10.02
3.55
3.36
3.45
0.470.430.44
2.152.892.59
0.11 3.25 3.36
2.55 2.55
1.54 1.34 2.88
Other land
use of reight TotalPlanted
paddy
Figure 5. Water balance among many components in the study area
www.ccsenet.org/sar Sustainable Agriculture Research Vol. 2, No. 1; 2013
82
4. Analysis of the Nitrogen Balance
4.1 The Sources of Nitrogen Content and Load
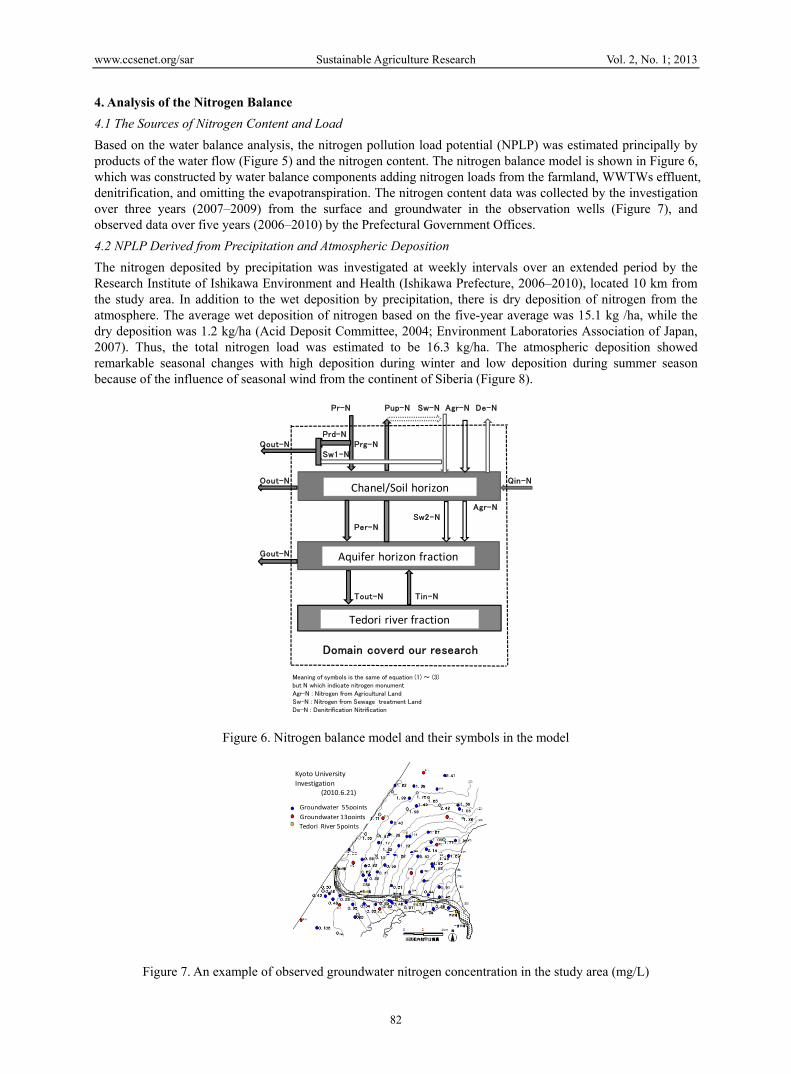
Based on the water balance analysis, the nitrogen pollution load potential (NPLP) was estimated principally by products of the water flow (Figure 5) and the nitrogen content. The nitrogen balance model is shown in Figure 6, which was constructed by water balance components adding nitrogen loads from the farmland, WWTWs effluent, denitrification, and omitting the evapotranspiration. The nitrogen content data was collected by the investigation over three years (2007–2009) from the surface and groundwater in the observation wells (Figure 7), and observed data over five years (2006–2010) by the Prefectural Government Offices.
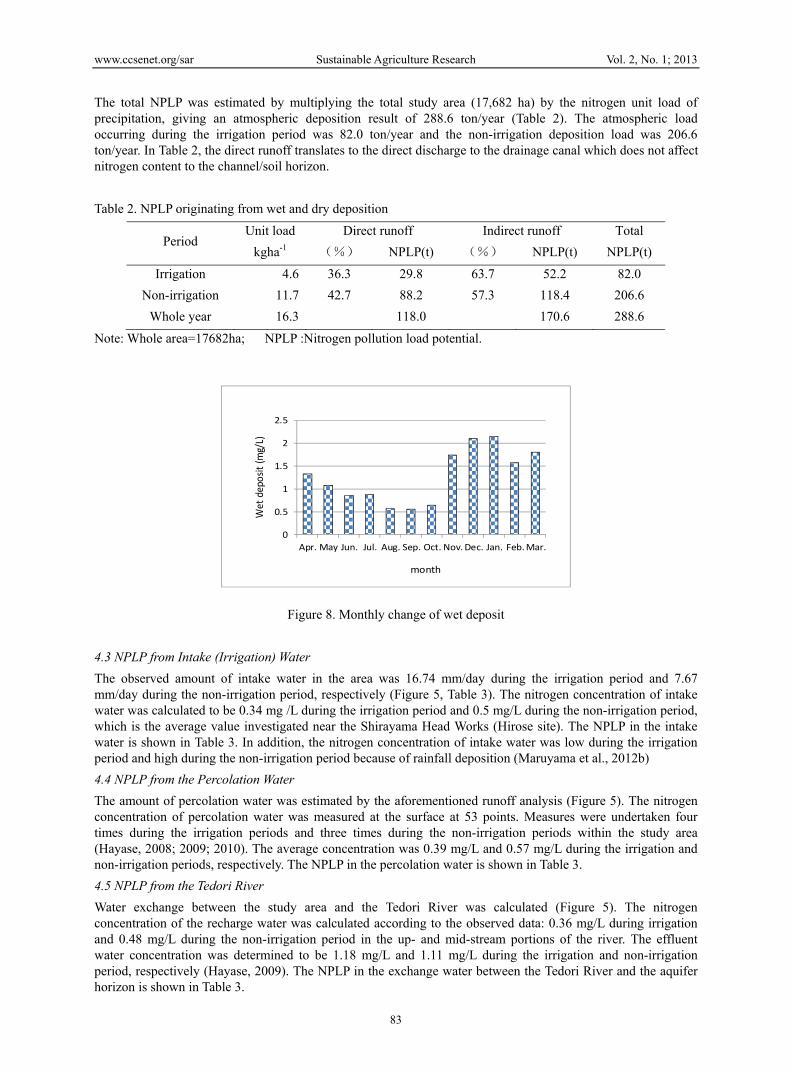
4.2 NPLP Derived from Precipitation and Atmospheric Deposition
The nitrogen deposited by precipitation was investigated at weekly intervals over an extended period by the Research Institute of Ishikawa Environment and Health (Ishikawa Prefecture, 2006–2010), located 10 km from the study area. In addition to the wet deposition by precipitation, there is dry deposition of nitrogen from the atmosphere. The average wet deposition of nitrogen based on the five-year average was 15.1 kg /ha, while the dry deposition was 1.2 kg/ha (Acid Deposit Committee, 2004; Environment Laboratories Association of Japan, 2007). Thus, the total nitrogen load was estimated to be 16.3 kg/ha. The atmospheric deposition showed remarkable seasonal changes with high deposition during winter and low deposition during summer season because of the influence of seasonal wind from the continent of Siberia (Figure 8).
Pr-N Pup-N Sw-N Agr-N De-N
Prd-NQout-N Prg-N
Sw1-N
Oout-N Qin-N
Agr-NSw2-N
Per-N
Gout-N
Tout-N Tin-N
Domain coverd our research
Meaning of symbols is the same of equation (1) ~ (3)but N which indicate nitrogen monumentAgr-N : Nitrogen from Agricultural LandSw-N : Nitrogen from Sewage treatment LandDe-N : Denitrification Nitrification
Chanel/Soil horizon
Aquifer horizon fraction
Tedori river fraction
Figure 6. Nitrogen balance model and their symbols in the model
Kyoto University
Investigation(2010.6.21)
Groundwater 55points
Groundwater 13points
Tedori River 5points
Figure 7. An example of observed groundwater nitrogen concentration in the study area (mg/L)
www.ccsenet.org/sar Sustainable Agriculture Research Vol. 2, No. 1; 2013
83
The total NPLP was estimated by multiplying the total study area (17,682 ha) by the nitrogen unit load of precipitation, giving an atmospheric deposition result of 288.6 ton/year (Table 2). The atmospheric load occurring during the irrigation period was 82.0 ton/year and the non-irrigation deposition load was 206.6 ton/year. In Table 2, the direct runoff translates to the direct discharge to the drainage canal which does not affect nitrogen content to the channel/soil horizon.
Table 2. NPLP originating from wet and dry deposition
Period Unit load Direct runoff Indirect runoff Total
kgha-1 (%) NPLP(t) (%) NPLP(t) NPLP(t)
Irrigation 4.6 36.3 29.8 63.7 52.2 82.0
Non-irrigation 11.7 42.7 88.2 57.3 118.4 206.6
Whole year 16.3 118.0 170.6 288.6
Note: Whole area=17682ha; NPLP :Nitrogen pollution load potential.
月
0
0.5
1
1.5
2
2.5
Apr. May Jun. Jul. Aug. Sep. Oct. Nov.Dec. Jan. Feb.Mar.
Wet deposit (m
g/L)
month
Figure 8. Monthly change of wet deposit
4.3 NPLP from Intake (Irrigation) Water
The observed amount of intake water in the area was 16.74 mm/day during the irrigation period and 7.67 mm/day during the non-irrigation period, respectively (Figure 5, Table 3). The nitrogen concentration of intake water was calculated to be 0.34 mg /L during the irrigation period and 0.5 mg/L during the non-irrigation period, which is the average value investigated near the Shirayama Head Works (Hirose site). The NPLP in the intake water is shown in Table 3. In addition, the nitrogen concentration of intake water was low during the irrigation period and high during the non-irrigation period because of rainfall deposition (Maruyama et al., 2012b)
4.4 NPLP from the Percolation Water
The amount of percolation water was estimated by the aforementioned runoff analysis (Figure 5). The nitrogen concentration of percolation water was measured at the surface at 53 points. Measures were undertaken four times during the irrigation periods and three times during the non-irrigation periods within the study area (Hayase, 2008; 2009; 2010). The average concentration was 0.39 mg/L and 0.57 mg/L during the irrigation and non-irrigation periods, respectively. The NPLP in the percolation water is shown in Table 3.
4.5 NPLP from the Tedori River
Water exchange between the study area and the Tedori River was calculated (Figure 5). The nitrogen concentration of the recharge water was calculated according to the observed data: 0.36 mg/L during irrigation and 0.48 mg/L during the non-irrigation period in the up- and mid-stream portions of the river. The effluent water concentration was determined to be 1.18 mg/L and 1.11 mg/L during the irrigation and non-irrigation period, respectively (Hayase, 2009). The NPLP in the exchange water between the Tedori River and the aquifer horizon is shown in Table 3.
www.ccsenet.org/sar Sustainable Agriculture Research Vol. 2, No. 1; 2013
84
4.6 NPLP by Pumping of Water
As shown in Figure 5, the amount of water pumped within the region was 1.49 mm/day during the irrigation period and 1.65 mm/day during the non-irrigation period. The nitrogen concentration of the pumped water was assumed to be the average nitrogen concentration of the groundwater observed from the 53 points in the entire study area (Hayase, 2010). The concentration was not remarkably different between the irrigation and non-irrigation periods.
4.7 NPLP of Surface Drainage Discharge
The NPLP in the surface drainage discharge was estimated based on the nitrogen concentration measured in water and the estimated surface drainage discharge. The average nitrogen concentration of water in the surface drainage discharge was assumed to be applicable to the observed data at the lower reaches of the drainage canal. The concentration was investigated four times at 5–6 points during the irrigation periods (n=22, σ=0.19) and four times at 6–8 points during the non-irrigation period (N=28, σ=0.17) near the Sea of Japan (Hayase, 2008; 2009). The estimated NPLP is shown in Table 3.
4.8 NPLP of Groundwater Discharge
The NPLP in the groundwater discharge was estimated based on the nitrogen concentration measured in groundwater and the estimated groundwater discharge. The nitrogen concentration was investigated at 63 points during the irrigation period (σ= 0.60) and at 55 points (σ=0.70) during the non-irrigation periods (Hayase, 2008; Nakamura, 2009 unpublished). The nitrogen concentration was low around the Tedori River and high in the northern part of the study area (Figure 7), which was theorized to be because of the recharge from the Tedori River and the sewage treatment water originating from predominantly unconnected public sewage facilities.
Table 3. NPLP from various components
Period
Irrigation Non-irrigation
Whole
year
T-N Discharge NPLP T-N Discharge NPLP NPLP
items (mg/L) mm/day ton/year (mg/L) mm/day ton/year ton/year
Irrigation water 0.34 16.74 149.7 0.50 7.67 144.5 294.2
Percolation water 0.39 3.36 35.0 0.57 2.55 55.0 90.0
Tedori river
Recharge 0.36 2.15 20.7 0.48 2.89 52.5 73.2
Efulent 1.18 0.47 14.8 1.11 0.43 18.1 32.9
Pumping water 1.10 1.49 43.7 1.10 1.65 68.6 112.4
Surface discharge 0.48 13.60 174.3 0.65 7.19 176.8 351.1
Groundwater
discharge 1.18 3.55 111.8 1.11 3.36 141.5 253.3
T-N: Total nitrogen content
NPLP:Nitrogen pollution load potential.
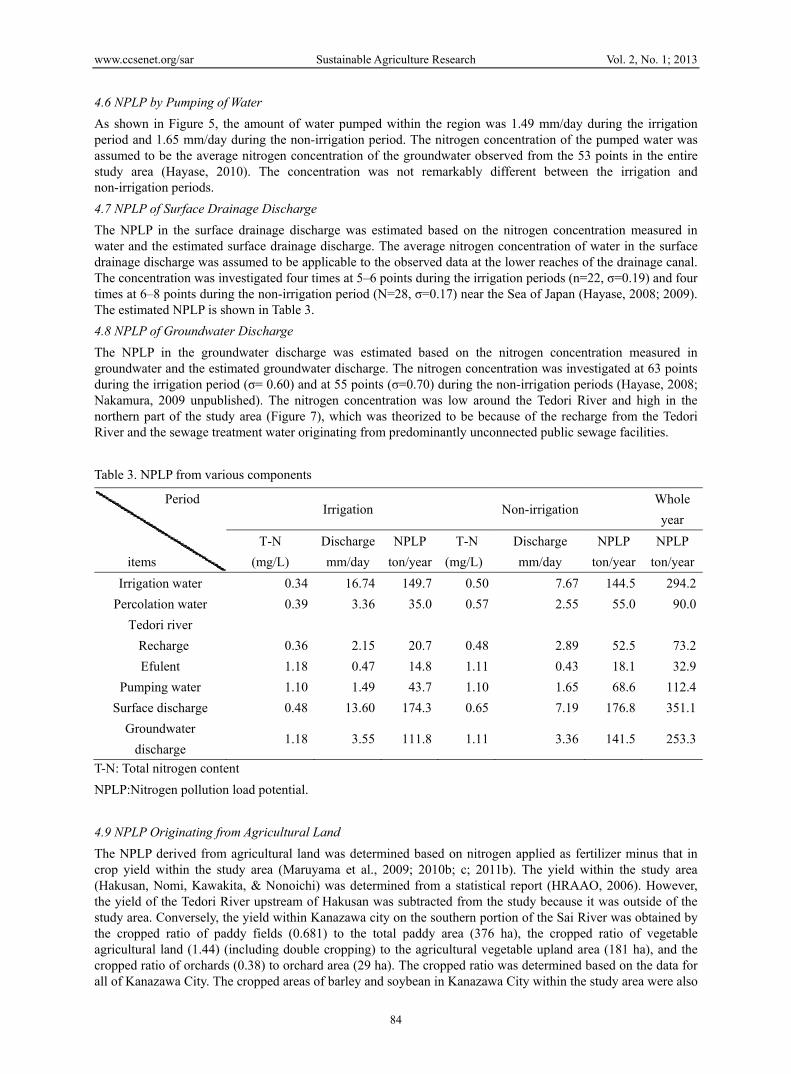
4.9 NPLP Originating from Agricultural Land
The NPLP derived from agricultural land was determined based on nitrogen applied as fertilizer minus that in crop yield within the study area (Maruyama et al., 2009; 2010b; c; 2011b). The yield within the study area (Hakusan, Nomi, Kawakita, & Nonoichi) was determined from a statistical report (HRAAO, 2006). However, the yield of the Tedori River upstream of Hakusan was subtracted from the study because it was outside of the study area. Conversely, the yield within Kanazawa city on the southern portion of the Sai River was obtained by the cropped ratio of paddy fields (0.681) to the total paddy area (376 ha), the cropped ratio of vegetable agricultural land (1.44) (including double cropping) to the agricultural vegetable upland area (181 ha), and the cropped ratio of orchards (0.38) to orchard area (29 ha). The cropped ratio was determined based on the data for all of Kanazawa City. The cropped areas of barley and soybean in Kanazawa City within the study area were also
www.ccsenet.org/sar Sustainable Agriculture Research Vol. 2, No. 1; 2013
85
determined using the cropped ratio of the paddy fields for all of Kanazawa City, and were found to be 2.2% and 2.7%, respectively. The NPLP determined for the study area using the above procedure is shown in Figure 9.
NPLP : Nitrogen pollution load potential
0
50
100
150
200
250
300
350
400
450
2006 2007 2008 2009 2010
果樹
蔬菜
大豆
大麦
水稲
orchard
vegetable
soybean
barley
rice
NPLP (ton/year)
Figure 9. NPLP for different crops in the study area during 2006-2010
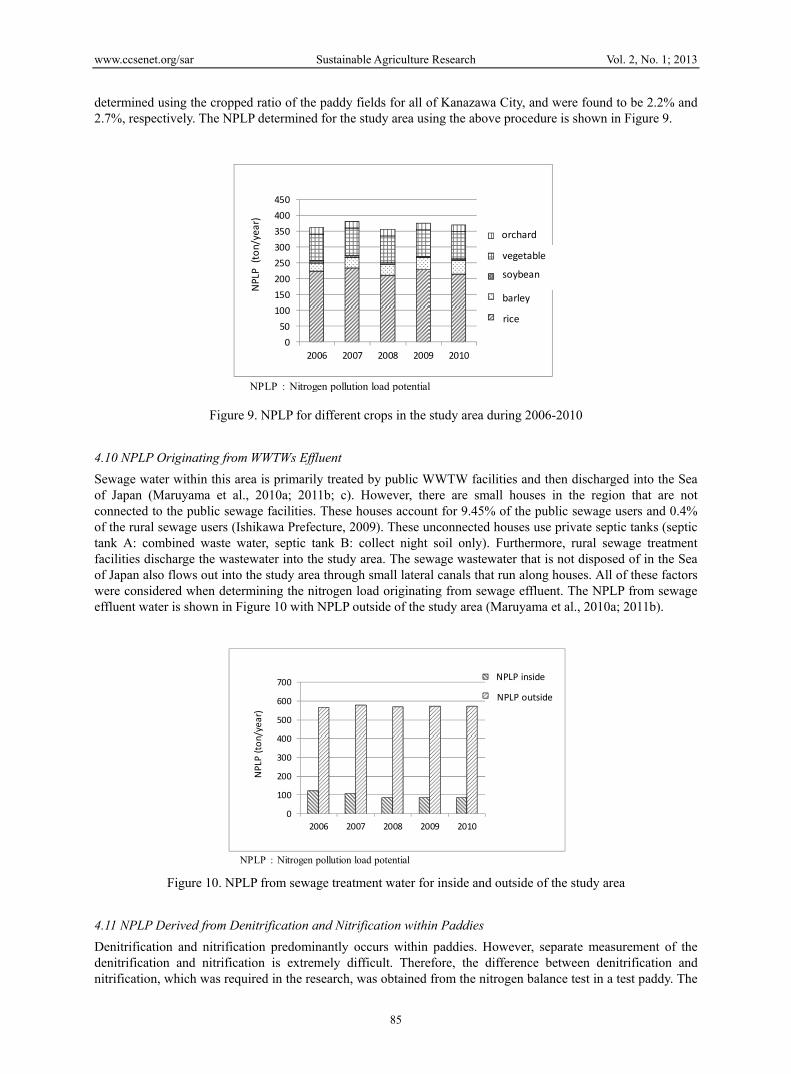
4.10 NPLP Originating from WWTWs Effluent
Sewage water within this area is primarily treated by public WWTW facilities and then discharged into the Sea of Japan (Maruyama et al., 2010a; 2011b; c). However, there are small houses in the region that are not connected to the public sewage facilities. These houses account for 9.45% of the public sewage users and 0.4% of the rural sewage users (Ishikawa Prefecture, 2009). These unconnected houses use private septic tanks (septic tank A: combined waste water, septic tank B: collect night soil only). Furthermore, rural sewage treatment facilities discharge the wastewater into the study area. The sewage wastewater that is not disposed of in the Sea of Japan also flows out into the study area through small lateral canals that run along houses. All of these factors were considered when determining the nitrogen load originating from sewage effluent. The NPLP from sewage effluent water is shown in Figure 10 with NPLP outside of the study area (Maruyama et al., 2010a; 2011b).
NPLP : Nitrogen pollution load potential
0
100
200
300
400
500
600
700
2006 2007 2008 2009 2010
地区内NPLP
地区外NPLP
NPLP (ton/year)
NPLP inside
NPLP outside
Figure 10. NPLP from sewage treatment water for inside and outside of the study area
4.11 NPLP Derived from Denitrification and Nitrification within Paddies
Denitrification and nitrification predominantly occurs within paddies. However, separate measurement of the denitrification and nitrification is extremely difficult. Therefore, the difference between denitrification and nitrification, which was required in the research, was obtained from the nitrogen balance test in a test paddy. The
www.ccsenet.org/sar Sustainable Agriculture Research Vol. 2, No. 1; 2013
86
test paddy used irrigation water, fertilizer and atmospheric deposition as nitrogen input, and drainage water, yield and percolation as nitrogen output. The imbalance of the input and output shows the difference of denitrification and nitrification, giving a result of 17.1 kg/ha as shown in Table 4. NPLP derived by denitrification and nitrification was estimated by multiplying cultivated paddy area (5,366 ha, difference from Table 1), resulting in 91.7 ton/year as shown in Table 4.
Table 4. Nitrogen balance at the test paddies to collect denitrification data
University Genpeijima Otomaru Average
Item paddy A paddy B paddy A paddy B paddy
kg/ha kg/ha kg/ha kg/ha kg/ha kg/ha
Irrigation 5.1 7.3 3.5 1.1 1.6 3.7
Input Fertilizer 82 81 81 97 97 87.6
Deposition 16.0 16.0 18.4 18.4 18.4 17.5
Sub-total 103.1 104.3 102.9 116.5 117 108.8
Drainage 2.5 5.3 12.6 4 4 5.7
Output Yield 63.8 89.3 69 73.1 68 72.6
Percolation 13.9 22 0.9 12.7 17.3 13.4
Unbalance 22.9 -12.3 20.4 26.7 27.7 17.1
Sub-total 103.1 104.3 102.9 116.5 117 108.8
Unbalance: Denitrification-Nitrification.
NPLP: (Denitrification-Nitrification) ×Pddy area.
Paddy area: 7539×0.712
NPLP: 17.1kg/ha×5366ha=91.76t
5. Results and Discussion of NPLP
The annual nitrogen balance for all components, as well as that of the irrigation period and non-irrigation period, are shown in Table 5 based on the aforementioned procedure.
5.1 Annual Nitrogen Balance in the Entire Area
The total input of nitrogen into the study area was calculated to be 1,214.2 ton/year, while the output is 959.4 t on/year. This indicates a difference of 254.6 ton/year that is polluting the area. Intake water (irrigation) accounted for 294.2 ton/year as input and for 351.1 ton/year surface drainage as output, resulting in 56.9 ton/year being purified. Input from precipitation accounted for 288.6 ton/year, of which 118.0 ton/year flows out via direct runoff. Nitrogen removal by extraction and outflow of groundwater of 253.3 ton/year also plays a role in the purification of nitrogen. The nitrogen loads from precipitation were relatively large because of the wide study area, although the intensity was not that high. These results confirm those reported by Burst et al. (2010).
The NPLP derived from farmland of 369.8 ton/year consisted of nitrogen from fertilizer that was not absorbed in the yields. The load from paddy rice did not make a remarkable contribution to the pollution, even though it had a large cropped area. Conversely, the load derived from the vegetable cropland and orchard was remarkably large (Figure 8). The load derived from WWTWs effluent was also found to be problematic because there are houses that are not connected to the public sewage treatment systems (Table 5).
5.2 Annual Nitrogen Balance in the Aquifer
The possibility of nitrogen contamination of the aquifer horizon is of great concern. Table 6 shows the nitrogen balance of the aquifer horizon only, which is derived from Table 5. The total input of nitrogen was 631.4 ton/year
and total output was 398.5 ton/year, resulting in 232.9 ton/year that was contaminating the aquifer.

www.ccsenet.org/sar Sustainable Agriculture Research Vol. 2, No. 1; 2013
87
Table 5. Nitrogen balance of various components for the entire horizon in the study area (ton/year)
Components Symbol Irrigation period
Non-irrigation
period Whole year
Input Output Input Output Input (%) Output (%)
Precipitation Pre-N 82.0 29.8 206.6 88.2 288.6 23.8 118.0 12.3
Intake water Qin-N 149.7 144.5 294.2 24.2
Percolation water Per-N 35.0 55.0 90.0 7.4
Surface drainage Qout-N 174.3 176.8 351.1 36.6
Pumping water Pup-N 43.7 68.6 112.4 11.7
Rechage from Tedori Tin,Tout-N 20.7 14.8 52.5 18.1 73.2 6.0 32.9 3.4
Groundwater outflow Gout-N 111.8 141.5 253.3 26.4
Farmland Agr-N 153.0 216.8 369.8 30.5
Sewage water Sw-N 40.7 57.7 98.4 8.1
Dentrification-Nitrification De-N 91.7 9.6
Total 481.1 374.4 733.1 493.3 1214.2 100.0 959.4 100.0
Difference 106.8 239.8 254.6
Symbol: refer to Figure 6.
The nitrogen concentration of water samples collected from a test well setting at our university campus, located at middle part of the Fan Areas, with a depth of 50 m was about 1.0 mg/L, which was greater than that observed for the well of 150 m depth (about 0.25 mg/L). These findings indicate that contaminating nitrogen gradually percolates into the deeper zone.
Table 6. Nitrogen balance of various components for the aquifer horizon in the study area (ton/year)
Components Symbol Irrigation period
Non-irrigation period
Whole year
Input Output Input Output Input (%) Output (%)
Percolation water Per-N 35.0 55.0 90.0 14.3
Pumping water Pup-N 43.7 68.6 112.4 28.2
Rechage from Tedori Tin,Tout-N 20.7 14.8 52.5 18.1 73.2 11.6 32.9 8.3
Groundwater outflow Gout-N 111.8 141.5 253.3 63.5
Farmland Agr-N 153.0 216.8 369.8 58.6
Sewage water Sw-N 40.7 57.7 98.4 15.6
Total 249.4 170.3 382.0 228.3 631.4 100.0 398.5 100.0
Difference 79.1 153.7 232.9
Symbol: refer to Figure 6.
5.3 Outflow of Nitrogen from the Small Drainage River
To confirm the reliability of the aforementioned nitrogen balance analysis, the nitrogen concentration of the Fushimi and Kurabe River was analyzed. Figures 11 and 12 shows the average nitrogen concentration of type NH4
+-N, NO3--N and Organic Nitrogen-N during the five years. The Fushimi River contains higher NH4
+ concentrations (0.52 mg/L) than the Kurabe River (0.14 mg/L), which indicates that the drainage water of the former contains more WWTWs effluent than the latter. The average concentration of nitrogen of the Fushimi River is 1.23 mg/L, while the nitrogen concentration of groundwater at the northern part of the study area is 1.60 mg/L. This fact also shows that the Fushimi River received a lot of ground water discharge. Similarly, the

www.ccsenet.org/sar Sustainable Agriculture Research Vol. 2, No. 1; 2013
88
nitrogen concentration of the Kurabe River is 0.98 mg/L and the nitrogen concentration of groundwater in the entire area except the northern part is 0.97 mg/L. This fact also shows that the nitrogen outflow of the Kurabe River consists mainly of nitrogen found in groundwater. Using the simulated groundwater discharge of 3.45 mm/day from the water balance analysis (Figure 5), the NPLP of the Fushimi River was estimated as 77.6 ton/year and that of the Kurabe River to be 145.6 ton/year if the nitrogen load applied to the whole area except that of the Fushimi River basin. The total nitrogen load was estimated to be 223.2 ton/year, which is almost similar with 253.3 ton/year in the Table 5 and 6.
0
0.2
0.4
0.6
0.8
1
1.2
1.4
1.6
2006 2007 2008 2009 2010
アンモニア性
全有機性
硝酸性窒素
Nitrogen concentration (m
g/L)
NH4‐N
NO3‐N
Organic‐N
Figure 11. Nitrogen concentration of the Fushimi River located at the northern part of the study area
0
0.2
0.4
0.6
0.8
1
1.2
2006 2007 2008 2009 2010
アンモニア性
全有機性
硝酸性窒素
Nitrogen
con
centratio
n (m
g/L)
NH4‐N
Organic‐N
NO3‐N
Figure 12. Nitrogen concentration of the Kurabe River located at the central part of the study area
5.4 Discussion
The ratio of each component of nitrogen balance to the whole (all) input and output is very important factor for reducing NPLP. Table 5 shows the input ratio of the component for whole items in a year. The most dominant NPLP in the input is farmland (30.5%), the second is intake water (24.2%), and the third is precipitation (23.8%). These three components occupied 78.5% of the total input. Therefore, reducing of the NPLP from farmland is the most important things for decreasing groundwater pollution potential. Conversely, the dominant factor of output is surface drainage (36.6%) and next is groundwater outflow (26.4%)
In the aquifer, the most dominant input component is NPLP from farmland (58.6%), second is effluent of sewage water (15.6%), third is percolation water (14.3%) and forth is the recharge from the Tedori River (11.6%). Conversely the most dominant output component is groundwater outflow (63.5%), next is pumping water (28.2%). These data shows that the most important things for preventing groundwater pollution in the study area are how to decrease the nitrogen pollution from farmland.
Nevertheless all components of nitrogen balance analysis in the region are required for effective management of groundwater quality, the assessments of NPLP from the nitrogen balance aspect was very limited until nowadays.
6. Conclusion
Water resources, especially groundwater resources, within the Tedoi River Alluvial Fan Area are of vital
www.ccsenet.org/sar Sustainable Agriculture Research Vol. 2, No. 1; 2013
89
importance to Ishikawa Prefecture because the water is used for industrial processes, domestic purposes and agriculture. To date, many researchers have conducted studies to investigate specialized problems associated with water resources in the area. This study differs from the specialized approach in that it attempts to provide a water and nitrogen balance from an integrated aspect to assess groundwater pollution load potential.
The hydrological components were estimated qualitatively in the two-layer model of the Tedori River system. The hydrological components consist of precipitation, evapotranspiration, intake irrigation water from Hakusan Head Works, infiltration from the soil surface, percolation into the groundwater, recharge and effluent water between the Tedori River, and discharges of surface and groundwater. The results provided by this model are very useful for management and planning of water resources (Figure 5).
The nitrogen balance was analyzed using the nitrogen content of the surface and subsurface water and the water balance analysis. As shown in Table 5, nitrogen input was found to be 1,214.2 ton/year and the output was 959.4 ton/year, resulting in an accumulation of 254.6 ton/year. Additionally, the nitrogen concentration of the 50 m well (total nitrogen 1.0 mg/L) was greater than that of the 150 m well (total nitrogen 0.25 mg/L) in the test well, which demonstrates that nitrogen pollutants gradually percolate into the deeper zone.
The estimated NPLP from surface and groundwater discharge in the nitrogen balance analysis was compared with investigated NPLP of a small drainage river in the study area. The total nitrogen load was estimated to be 223.2 ton/year, which is similar with 253.3 ton/year in the Table 5 and 6.
The most dominant nitrogen pollutant for the study area originated from farmland (30.5%) and second is intake water (24.2%) and precipitation (23.8%). These three items occupied 78.5% of total pollutant. In the aquifer, the most dominant component of the input in the NPLP is load originated from farmland (58.6%) These data shows that the most important things for preventing groundwater pollution in the study area are how to decrease the nitrogen pollution from farmland, which is required for agriculture practice.
The NPLP from farmland and sewage treatment water during a longer period should be considered in future studies because the residence time of groundwater is a relatively long (Watabe, 1974) (Maruyama et al., 2011b). In our water and nitrogen balance analysis, we estimated some of the components of them such as the surface water and groundwater discharge. The more intensive analysis which includes the observations of them will be necessary for more perfect assessment.
Our research is the first step for estimation of NPLP; therefore, we hope further development of the groundwater quality assessment
Acknowledgments
Ishikawa Prefecture is sincerely thanked for providing valuable data. The researchers conducting the study entitled “Normal hydrologic cycle as a core of irrigation water in the Tedori River basin” at Ishikawa Prefectural University, supported by the Ministry of Agriculture, Forests and Fishery, are also thanked for many valuable comments.
References
Acid Deposit Committee. (2004). Report on acid deposit, p.300, 314, 315.
Borbor-Cordova, M. J., Boyer, E. W., McDowell, W. H., & Hall, C. A. (2006). Nitrogen and phosphorus budget for a tropical watershed impacted by agricultural land use, Guayas, Ecuador. Biogeochemistry, 79(1-2), 135-161. http://dx.doi.org/10.1007/s10533-006-9009-7
Brookshire, E. N. (2009). Maintenance of terrestrial nutrient loss signatures during in-stream transport. Ecology, 90(2), 293-299. http://dx.doi.org/10.1890/08-0949.1
Burt, T. P., Howden, T. P., Warrall, F., Whelan, M. J., & Bieroza, M. (2010). Nitrogen in United Kingdom Rivers; Policy and its outcomes since 1970. Environ. Sci. Technol., 45(1), 175-181. http://dx.doi.org/10.1021/es101395s
Chestnut, T. J., Zarin, D. J., McDowell, W. H., & Keller, M. (1999). A nitrogen budget for late-successional hillslope tabonuco forest, Puerto Rico. Biogeochemistry, 46(1/3), 85-108. http://dx.doi.org/10.1023/A:1006104229691
Environment Laboratories Association of Japan. (2007). Environmental Laboratories Report of 4th acid deposit. J. of Environmental Laboratories Association, 3(3), 132-133.
Eulenstein, F. (2008). Model based scenario to optimize the regional nitrogen balance and reduce leaching of nitrate an surface of an agriculturally used water catchment. Nutrient Cycling in Agro ecosystems, 82(1),

www.ccsenet.org/sar Sustainable Agriculture Research Vol. 2, No. 1; 2013
90
33-49. http://dx.doi.org/10.1007/s10705-008-9167-1
Geographical Survey Institute (2010). Geographic Information System (GIS). Retrived from http://www.gsi.go.jp/kiban/index.html
Hama, T., Nakamura, K., Kawashima, S., Kaneki, R., & Mitsuno, T. (2011). Effects of cyclic irrigation on water and nitrogen mass balances in a paddy field. Ecological Engineering, 37(10), 1563-1566. http://dx.doi.org/10.1016/j.ecoleng.2011.03.032
Hayase, Y. (2008). Analysis of water quality of flow, forest and paddy dynamics in the Tedori River. Study on normal hydrologic cycle as a core of irrigation water Annual Report, p. 55 (in Japanese).
Hayase, Y. (2009). Analysis of water quality of flow, forest and paddy dynamics in the Tedori River. Study on normal hydrologic cycle as a core of irrigation water Annual Report, p. 83 (in Japanese).
Hayase, Y. (2010). Analysis of water quality of flow, forest and paddy dynamics in the Tedori River. Study on normal hydrologic cycle as a core of irrigation water Annual Report 73 (in Japanese).
Hokuriku Regional Agricultural Administration Office. (2006). Annual report of agriculture, forestry and fishery of Ishikawa Prefecture 2004-2005 (in Japanese).
Ishikawa Prefecture. (2006-2010). Investigation report on Environment and Air. Research Institute of Ishikawa Environment and Health.
Ishikawa Prefecture, Kanazawa, Nanao City. (2007). Investigation report on conservation of groundwater in Ishikawa Prefecture, p. 50 (in Japanese).
Ishikawa Prefecture. (2009). Domestic sewage treatment facilities of Ishikawa Prefecture, p45, p56 (in Japanese).
Kitamura, T., Kuroda, H., Yamamoto, M., Negishi, M., & Tabuchi, T. (2010). Water and mass balance in paddy field area with a cycle irrigation system situated along Kasumigaura, Trans, JSIDRE, 269, 35-41 (in Japanese with English Abstract).
Kubota, H., Tabuchi, T., Takamura, Y., & Suzuki, S. (1979). Water and mass balance (N, P) in paddy field along Lake Trans, JSIDRE, 84, 22-28 (in Japanese with English Abstract).
Kubota, T., & Kobayashi, H. (2000). A simulation of nitrogen flow and runoff model for rural area based on spatial distribution pattern of cropping types. The Association of Rural Planning, 229-235 (in Japanese with English Abstract).
Lin, S. (2010). Characteristics of nitrogen cycling in farm systems in a small watershed of three gorges reservoir area. China Huanjing Kexue (250-3301), 31(3), 632-638.
Liang, L., Nagumo, T., & Hatano, R. (2005). Nitrogen Cycling with Respect to Environmental Load in Farm Systems in Southwest China. Nutrient Cycling in Agro ecosystems, 73(2-3), 119-134. http://dx.doi.org/10.1007/s10705-005-0074-4
Lovett, G. M., & Goodale, C. L. (2011) A New Conceptual Model of Nitrogen Saturation Based on Experimental Nitrogen Addition to an Oak Forest. Ecosystems, 14(4), 615-631. http://dx.doi.org/10.1007/s10021-011-9432-z
Maruyama, T., Hashimoto, I., Takimoto, H., & Nakade, D. (2009). Assessment of nitrogen pollution loads from farmland, Japan, by objective yield and standard fertilizer usage. Paddy Water Environ, 7, 151-159. http://dx.doi.org/10.1007/s10333-009-157-y
Maruyama, T., Noto, F., Takahashi, T., Tsuchihara, T., & Tanaka, T. (2010a). Analysis of nitrogen pollution load by domestic waste water treatment in the Tedori River Alluvial Fan Areas, Trans. JSIDRE, 269, 113-119 (in Japanese with English Abstract).
Maruyama, T., Noto, F., Murashima, K., Hashimoto, I., & Kitada, K. (2010b). Analysis of the nitrogen pollution load potential from farmland in the Tedori River Alluvial Fan Areas in Japan. Paddy Water Environ, 8, 293-300. http://dx.doi.org/10.1007/s10333-010-0202-x
Maruyama, T., Takimoto, H., Hashimoto, I., Nakade, D., & Murashima, K. (2010c). Evaluation of nitrogen load potential from agricultural land. - By objective yield and standard fertilizer usage-. Association of Upland Agriculture Promotion of Japan, Upland Agriculture (in Japanese with English abstract), 615, 1-11.
Maruyama, T., Noto, F., Takahashi, T., Nakamura, K., & Onishi, T. (2011a). Assessment of environmental nitrogen pollution load potential from sewage treatment water in the Tedori River Alluvial Fan Area, Japan.

www.ccsenet.org/sar Sustainable Agriculture Research Vol. 2, No. 1; 2013
91
Paddy and Environ, 9(2), 267-274. http://dx.doi.org/10.1007/s10333-010-0248-9
Maruyama, T., Noto, F., Takimoto, H., Nakamura, K., & Onishi, T. (2011b). Assessment of the long-term variation in the nitrogen pollution load potential from farmland to groundwater in the Tedori River Basin. Paddy Water Environ, 9, 441-449. http://dx.doi.org/10.1007/s 10333-011-0254-6
Maruyama, T., Noto, F., Takimoto, H., Nakamura, K. Y., oshida, M., Onishi, T., & Kawashima, S. (2011c). Assessment from sewage treatment water of long-term changes of nitrogen pollution load potential In the Tedori River Alluvial Fan Area, Japan. Paddy Water Environ, 9, 451-459. http://dx.doi.org/10.1007/ s10333-011-0281-3
Maruyama, T., Kobayashi, S., & Mitsuno, T. (2011d). Evaluation of Groundwater recharge by precipitation. Association of Upland Agriculture Promotion of Japan. Upland Agriculture. (in Japanese with English abstract), 66, 2-10.
Maruyama, T., Noto, F., Horino, H., Nakamura, K., Murashima, K., Yoshida, T., & Takimoto, H. (2012a) Analysis of water balance at the Tedori river alluvial fan areas in Japan. Journal of Japan society of hydrology and water resources (in Japanese with English abstract), 2(1), 20-29.
Maruyama, T., Yoshida, M., Takase, K., & Takimoto, H. (2012b). Research on nitrogen balance in the mountainous Tedori River basin of Japan. Journal of Japan Society of Hydrology and Water (submitted)
Ministry of Internal Affairs and Communications. (2010). 2005 Census, Statistics of machi and block Data. Retrieved from http://www.jps-net.com/database/statistics/h17kokucho_choaza.html
Murashima, K. (2009). Research on sound hydrologic cycle as a core of irrigation. Annual Report, 35-38.
Nishikiori, T., Takamatsu, T., Kohzu, A., Nakajima, Y., & Watanabe, M. (2012). Distribution of nitrate in groundwater affected by the presence of an aquitard at an agricultural area in Chiba, Japan. Environmental Earth Sciences, 67(5), 1531-1545. http://dx.doi.org/10.1007/s12665-012-1598-y
Shrestha, R. K., Cooperband, L. R., & MacGuidwin, A. E. (2010). Strategies to Reduce Nitrate Leaching into Groundwater in Potato Grown in Sandy Soils: Case Study from North Central USA. American Journal of Potato Research, 87(3), 229-244. http://dx.doi.org/10.1007/s12230-010-9131-x
Su, B. L., Cai, X. T., Sun, Y. L., & Xu, Z. X. (2010). Application of SWAT model to Zhangweinan canal sub-watershed, Bioinformatics and Biomedical Engineering 2010 4th International Conference on (2151-7614) (978-1-4244-4712-1).
Tsioumas, V., Zorapas, V., Pavlidou, E., Lappas, I., & Voudouris, K. (2011). Groundwater contamination by nitrates and seawater intrusion in Atlanta basin (Fthiotida, Greece). Environmental Earth Sciences, 3, 317-325.
Tsuchihara, T., Yoshimoto, M., Ishida, S., Minagawa, H., Masumoto, T., & Imaizumi, M. (2010). Stable isotope-based investigation of hydrological aspects of ground water recharge and discharge in Tedori River Alluvial Fan, Appl. Hydrol, 22, 11-20 (in Japanese with English Abstract).
Tsuchihara, T. (2011a). Classification of recharge into groundwater of alluvial fan area as an index of stable isotope ratio of hydrogen and oxygen. Japan Cooperation for Promotion of Agriculture and Rural Engineering, 736, 30-31 (in Japanese).
Tsuchihara, T. (2011b). Analysis of groundwater movement using stable-isotope index at the Tedori river alluvial fan areas, Study on normal hydrologic cycle as a core of irrigation water. Annual Report, 68-73 (in Japanese).
Yonebayashi, K., & Minami, T. (2010). Analysis of groundwater quality in the Tedori River Basin, Study on normal hydrologic cycle as a core of irrigation water. Annual Report, 112-119 (in Japanese).
Watabe, K., & Yamazaki, Y. (1974). Water use and geology on Alluvial Fan -an example Tedori River (1), Water Use Science, 18(4), 1-25 (in Japanese).
Wang, M. X., Liu, G. D., Wu, W. L., Bao, Y. H., & Liu, W. N. (2006). Prediction of agriculture derived groundwater nitrate distribution in North China Plain with GIS-based BPNN. Environmental Geology, 50(5), 637-644. http://dx.doi.org/10.1007/s00254-006-0237-x
Xiong, Z. Q., Freney, J. R., Mosier, A. R., Zhu, Z. L., Lee, Y., & Yagi, K. (2008). Impacts of population growth, hanging food preferences and agricultural practices on the nitrogen cycle in East Asia. Nutrient Cycling in Agro ecosystems, 80(2), 189-198. http://dx.doi.org/10.1007/s10705-007-9132-4