Embed Size (px)
Citation preview

Kentucky State UniversityKentucky State UniversityKentucky State University
FACT BOOK 2010FACT BOOK 2010FACT BOOK 2010---201120112011

Kentucky State University Message from the President
Fact Book 2010‐2011
Welcome to the 2010‐2011 Kentucky State University Fact Book.
Each year, the fact book presents an overview of KSU’s makeup and trends, highlighting an exciting mix of enrollment, program and survey facts and statistics. In it, you will find trends that affirm the university’s commitment to academic excellence, as well as its challenges. Always, the university’s commitment is to teaching, research, service‐learning and community engagement.
The data contained in the Fact Book were gathered and published by the Office of Institutional Research and Effectiveness. Thank you for your contin‐ued interest, feedback and contributions to this annual report.
Sincerely,
Mary Evans Sias, Ph.D.
i

Kentucky State University Table of Content
Fact Book 2010‐2011
Message from the President ………………………………………………………………………………………………………………………………………………………………………………..……… i
At A Glance …………………………………………………………………………………………………………………………………………………………………………………………………………..…….. 1
Campus
Campus Location …………………………………………………………………………………………………………………………………………………………………………………….……………. 3
Main Campus Map …………………………………………………………………………………………………………………………………………………………………………………..…………… 4
South Campus Map …………………………………………………………………………………………………………………………………………………………………………………..………….. 5
Campus Size ………………………………………………………………………………………………………………………………………………………………………………………………..……….. 6
Library
Library Mission …………………………………………………………………………………………………………………………………………………………………………………..………………… 8
Collections and Holdings ……………………………………………………………………………………………………………………………………………………………………..……………….. 9
Administration
University’s Vision and Mission …………………………………………………………………………………………………………………………………………………………..……………….. 11
Board of Regents …………………………………………………………………………………………………………………………………………………………………………………..……………… 12
President’s Cabinet …………………………………………………………………………………………………………………………………………………………………………………..………….. 13
Senior Staff ………………………………………………………………………………………………………………………………………………………………………………………………..…………. 14
KSU Organization Chart ………………………………………………………………………………………………………………………………………………………………………………..………. 15
Accreditation
Accreditation and Institutional Membership ……………………………………………………………………………………………………………………………………..…………………. 17
History
KSU History …………………………………………………………………………………………………………………………………………………………………………………..………………………. 19
KSU Presidents: Past and Present …………………………………………………………………………………………………………………………………………………..…………………….. 20
Applied, Admitted, Enrolled ………………………………………………………………………………………………………………………………………………………..……………………….. 22
Admission
ii

Kentucky State University Table of Content
Fact Book 2010‐2011
Freshman Application Among Kentucky Public Institutions ………………………………………………………………………………………………………………………………….. 23
Freshman Admission Among Kentucky Public Institutions ……………………………………………………………………………………………………………………………………. 24
Freshman First‐Time Among Kentucky Public Institutions ……………………………………………………………………………………………………………………………………. 25
Undergraduate Application …………………………………………………………………………………………………………………………………………………..……………………………… 26
Undergraduate Admission …………………………………………………………………………………………………………………………………………………..……………………………….. 27
Undergraduate New Enrollment …………………………………………………………………………………………………………………………………………………..……………………… 28
First‐Time Freshmen Test Scores …………………………………………………………………………………………………………………………………………………..……………………… 29
First‐Time Freshmen High School GPA …………………………………………………………………………………………………………………………………………………..……………… 30
Residence Halls
Percent Students Live in Residence Halls …………………………………………………………………………………………………………………………………………………..…………. 32
Residence Halls Utilization …………………………………………………………………………………………………………………………………………………..……………………………….. 33
Residence Halls Occupancy and Rate …………………………………………………………………………………………………………………………………………………..……………….. 34
Residence Halls Occupancy by Gender …………………………………………………………………………………………………………………………………………………..…………….. 35
Residence Halls Occupancy by Class …………………………………………………………………………………………………………………………………………………..………………… 36
Financial Aid
Financial Aid Awarded …………………………………………………………………………………………………………………………………………………..……………………………………… 38
Undergraduate Received Financial Aid Awarded and Disbursed …………………………………………………………………………………………………………………………… 39
Undergraduate Degree Seeking Received Financial Aid ………………………………………………………………………………………………………………………………………… 40
Financial Aid Disbursed by Source …………………………………………………………………………………………………………………………………………………..……………………. 41
Undergraduate Received any Athletic Aid Disbursed ……………………………………………………………………………………………………………………………………………. 42
Athletic Aid Disbursed by Sport …………………………………………………………………………………………………………………………………………………..……………………….. 43
Academic Fields of Study …………………………………………………………………………………………………………………………………………………..…………………………………. 45
Academic Major
iii
Kentucky State University Table of Content
Fact Book 2010‐2011
Count of Majors, Certification, and Minor …………………………………………………………………………………………………………………………………………………..……….. 48
Enrollment
First‐Time Freshmen Enrollment …………………………………………………………………………………………………………………………………………………..……………………… 55
First‐Time Freshmen Enrollment by Gender, Race, and Age …………………………………………………………………………………………………………………………… 56
First‐Time Freshmen Enrollment by Major …………………………………………………………………………………………………………………………………………………….. 57
First‐Time Freshmen Enrollment by State Origin ……………………………………………………………………………………………………………………………………………. 58
First‐Time Freshmen Enrollment by Kentucky County Origin ………………………………………………………………………………………………………………………….. 60
First‐Time Transfer Enrollment 63
First‐Time Transfer Enrollment by Gender, Race, and Age ……………………………………………………………………………………………………………………………… 64
First‐Time Transfer Enrollment by Major ……………………………………………………………………………………………………………………………………………………….. 65
First‐Time Transfer Enrollment by State Origin ………………………………………………………………………………………………………………………………………………. 66
First‐Time Transfer Enrollment by Kentucky County Origin …………………………………………………………………………………………………………………………….. 68
Enrollment Among Kentucky Public Institutions …………………………………………………………………………………………………………………………………………………... 70
Total Enrollment …………………………………………………………………………………………………………………………………………………..………………………………………………. 72
Total Enrollment by Gender and Race ………………………………………………………………………………………………………………………………………………….………… 72
Total Enrollment by Status and Residency ……………………………………………………………………………………………………………………………………………………… 73
Total Enrollment by Class and Status …………………………………………………………………………………………………………………………………………………..…………. 74
Total Enrollment by Major …………………………………………………………………………………………………………………………………………………..………………………… 75
Total Enrollment by Gender and Age …………………………………………………………………………………………………………………………………………………..…………. 77
Total Enrollment by State Origin …………………………………………………………………………………………………………………………………………………..……………….. 78
Total Enrollment by Kentucky County Origin ………………………………………………………………………………………………………………………………………………….. 80
Total Enrollment by Country Origin …………………………………………………………………………………………………………………………………………………..…………… 83
85 Undergraduate Enrollment …………………………………………………………………………………………………………………………………………………..……………………………...
iv

Kentucky State University Table of Content
Fact Book 2010‐2011
Undergraduate Enrollment by Gender and Race ……………………………………………………………………………………………………………………………………………. 85
Undergraduate Enrollment by Status and Residency ……………………………………………………………………………………………………………………………………… 86
Undergraduate Enrollment by Gender and Age ……………………………………………………………………………………………………………………………………………… 87
Undergraduate Enrollment by State Origin …………………………………………………………………………………………………………………………………………………….. 88
Undergraduate Enrollment by Kentucky County Origin ………………………………………………………………………………………………………………………………….. 90
Undergraduate Enrollment by Country Origin ………………………………………………………………………………………………………………………………………………… 93
Graduate Enrollment …………………………………………………………………………………………………………………………………………………..……………………………………….. 94
Graduate Enrollment by Gender and Race …………………………………………………………………………………………………………………………………………………..… 94
Graduate Enrollment by Status and Residency ……………………………………………………………………………………………………………………………………………….. 95
Graduate Enrollment by Gender and Age …………………………………………………………………………………………………………………………………………………..….. 96
Graduate Enrollment by State Origin …………………………………………………………………………………………………………………………………………………..………… 97
Graduate Enrollment by Kentucky County Origin …………………………………………………………………………………………………………………………………………… 99
Graduate Enrollment by Country Origin …………………………………………………………………………………………………………………………………………………..…….. 102
Full‐Time Equivalent …………………………………………………………………………………………………………………………………………………..………………………………………… 103
Summer Enrollment …………………………………………………………………………………………………………………………………………………..………………………………………… 105
Spring Enrollment …………………………………………………………………………………………………………………………………………………..……………………………………………. 107
Unduplicated Enrollment …………………………………………………………………………………………………………………………………………………..…………………………………. 109
KSU Area of Geographic Responsibility …………………………………………………………………………………………………………………………………………………..……………. 112
Student Credit Hours …………………………………………………………………………………………………………………………………………………..……………………………………….. 113
Retention Rate
KSU Retention Rate …………………………………………………………………………………………………………………………………………………..…………………………………………. 118
State‐Wide Retention Rate Among Kentucky Public Institutions ………………………………………………………………………………………………………………………….. 118
119 Retention Rate by Degree and Status …………………………………………………………………………………………………………………………………………………..……………….
v

Kentucky State University Table of Content
Fact Book 2010‐2011
Retention Rate by Gender and Race …………………………………………………………………………………………………………………………………………………..……………….. 120
Graduation Rate
KSU Graduation Rate …………………………………………………………………………………………………………………………………………………..……………………………………….. 122
Graduation Rate Among Kentucky Public Institutions …………………………………………………………………………………………………………………………………………… 122
Graduation Rate Over Years …………………………………………………………………………………………………………………………………………………..…………………………….. 123
Graduation Rate by Gender and Race …………………………………………………………………………………………………………………………………………………..………………. 124
Athletic Graduation Rate …………………………………………………………………………………………………………………………………………………..…………………………………. 125
Athletic Graduation Rate by Gender and Race …………………………………………………………………………………………………………………………………………………..…. 126
Degrees Awarded
Degrees Offered …………………………………………………………………………………………………………………………………………………..………………………………………………. 128
Degrees Awarded by College …………………………………………………………………………………………………………………………………………………..…………………………… 130
Degrees Awarded Among Kentucky Public Institutions ………………………………………………………………………………………………………………………………………… 131
Degrees Awarded by Major …………………………………………………………………………………………………………………………………………………..…………………………….. 132
Associate Degrees by Gender and Race …………………………………………………………………………………………………………………………………………………..…………… 134
Bachelor Degrees by Gender and Race …………………………………………………………………………………………………………………………………………………..……………. 135
Master’s Degrees by Gender and Race …………………………………………………………………………………………………………………………………………………..……………. 136
Career Placement
Activity Upon Graduation by Gender and Race …………………………………………………………………………………………………………………………………………………….. 138
Activity Upon Graduation by State …………………………………………………………………………………………………………………………………………………..…………………… 139
Graduating Survey …………………………………………………………………………………………………………………………………………………..……………………………………………. 140
Total Employee by Gender and Race …………………………………………………………………………………………………………………………………………………..……………….. 143
Employee by Status and Job (EEO) Group …………………………………………………………………………………………………………………………………………………..………... 144
Faculty and Staff
vi

Kentucky State University Table of Content
Fact Book 2010‐2011
Department Deans and Chairs …………………………………………………………………………………………………………………………………………………..…………………………. 145
Instructional Faculty …………………………………………………………………………………………………………………………………………………..………………………………………… 146
Full‐Time Instructional Faculty …………………………………………………………………………………………………………………………………………………..…………………………. 147
Student to Faculty Ratio …………………………………………………………………………………………………………………………………………………..………………………………….. 148
9‐Month Instructional Faculty …………………………………………………………………………………………………………………………………………………..………………………….. 149
12‐Month Instructional Faculty …………………………………………………………………………………………………………………………………………………..……………………….. 150
Finance
Tuition and Fees …………………………………………………………………………………………………………………………………………………..………………………………………………. 152
Revenues and Expenditures …………………………………………………………………………………………………………………………………………………..…………………………….. 153
Alumni
Notable Alumni …………………………………………………………………………………………………………………………………………………..……………………………………………….. 155
Alumni by State …………………………………………………………………………………………………………………………………………………..……………………………………………….. 156
Alumni by Class Year and Gender …………………………………………………………………………………………………………………………………………………..…………………….. 157
vii

Kentucky State University At A Glance
Fact Book 2010‐2011
KSU At‐A‐Glance
Fall 2010 Undergraduate Admission Fall 2010 Enrollment 2009‐2010 Degrees Awarded
Total Applied 13,085 ↑ Total Enrollment 2,851 ↑ Total Degrees 304 ↑
Total Admitted 3,393 ↑ Undergraduate 2,606 ↓ Associate 37 ↓
Total Enrolled 809 ↑ Graduate 245 ↑ Bachelor 213 ↑
Full‐Time 2,256 ↑ Master's 54 ↑
Fall 2010 Student Characteristics Part‐Time 595 ↓
Percent Live In Dorms 35% — Female 1,682 ↑ Fall 2010 Employee
Percent Received Aid 83% ↑ Male 1,169 ↓ Total Employee 640 ↑
Retention Rate 54% ↑ Black, Non Hispanic 1,651 ↑ Faculty 185 ↓
Graduation Rate 25% ↑ White, Non Hispanic 633 ↓ Instructional Faculty 180 —
Other Races 567 ↑ Staff 455 ↑
Fall 2010 First‐Time Enrollment Resident 1,638 ↓ Full‐Time 514 ↓
First‐Time Freshmen 635 ↑ Non Resident 1,213 ↑ Part‐Time 126 ↑
First‐Time Transfer 148 ↑ Freshmen 1,224 ↑ Female 326 ↓
Average ACT Comp 17 — Sophomores 420 ↑ Male 314 ↑
Average SAT Total 818 ↑ Juniors 313 ↓ Black, Non Hispanic 285 ↓
Seniors 482 ↑ White, Non Hispanic 281 ↑
Fall 2010 Unduplicated Enrollment Master's 233 ↑ Other Races 74 ↑
Total Unduplicated Enrollment 3,462 ↑ Non Degree 179 ↓ Tenured Faculty 70 ↑
Undergraduate 3,147 ↑ Age 24 and younger 2,060 ↑ Tenure Track Faculty 38 ↓
Graduate 315 ↑ Age 25 and older 791 ↓ Non Tenured Faculty 72 ↑
↑ Increased from last year ↓ Decreased from last year — No change from last year Note:
1

CAMPUSCAMPUS
Fact Book 2010‐2011
Kentucky State University Campus
Fact Book 2010‐2011
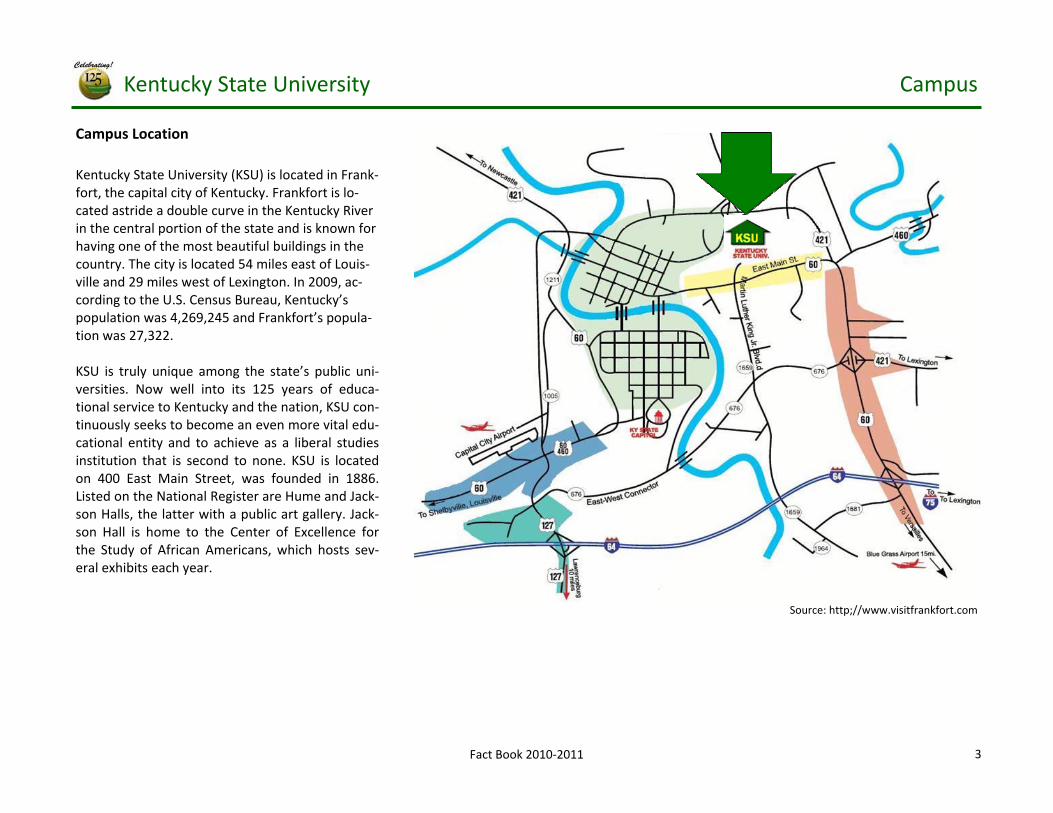
Campus Location
Kentucky State University (KSU) is located in Frank‐fort, the capital city of Kentucky. Frankfort is lo‐cated astride a double curve in the Kentucky River in the central portion of the state and is known for having one of the most beautiful buildings in the country. The city is located 54 miles east of Louis‐ville and 29 miles west of Lexington. In 2009, ac‐cording to the U.S. Census Bureau, Kentucky’s population was 4,269,245 and Frankfort’s popula‐tion was 27,322. KSU is truly unique among the state’s public uni‐versities. Now well into its 125 years of educa‐tional service to Kentucky and the nation, KSU con‐tinuously seeks to become an even more vital edu‐cational entity and to achieve as a liberal studies institution that is second to none. KSU is located on 400 East Main Street, was founded in 1886. Listed on the National Register are Hume and Jack‐son Halls, the latter with a public art gallery. Jack‐son Hall is home to the Center of Excellence for the Study of African Americans, which hosts sev‐eral exhibits each year.
Source: http;//www.visitfrankfort.com
3
Kentucky State University Campus
Fact Book 2010‐2011
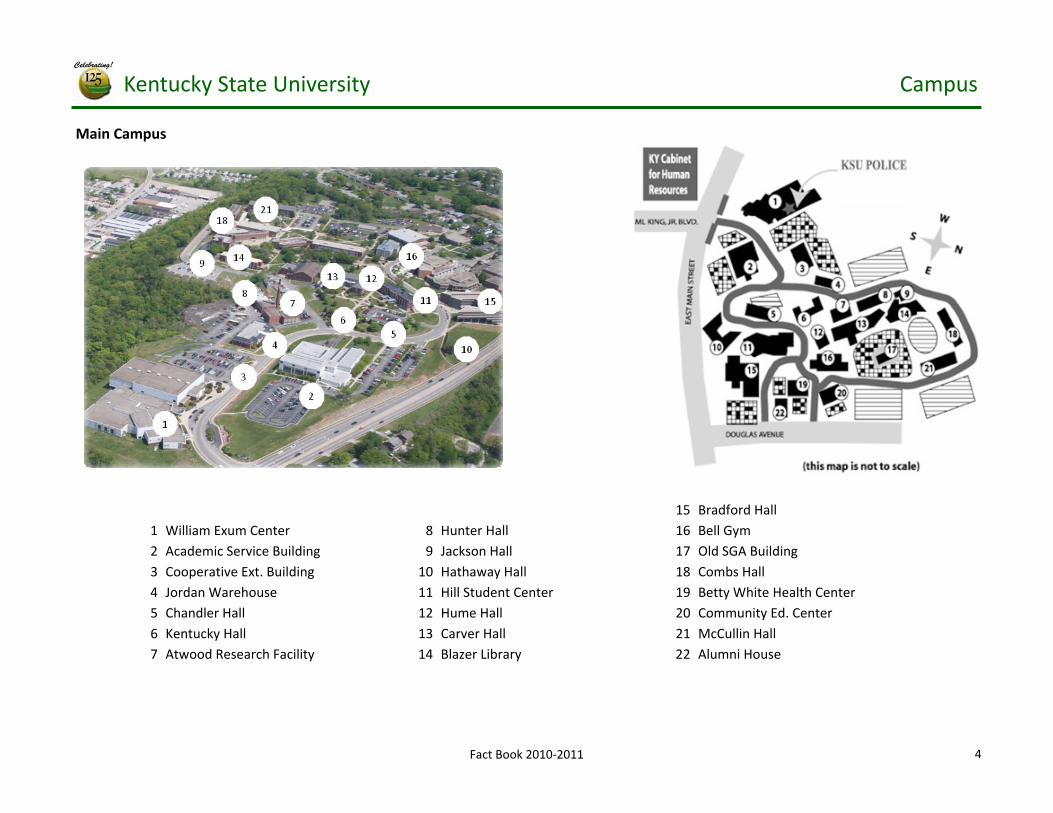
Main Campus
15 Bradford Hall 1 William Exum Center 8 Hunter Hall 16 Bell Gym 2 Academic Service Building 9 Jackson Hall 17 Old SGA Building 3 Cooperative Ext. Building 10 Hathaway Hall 18 Combs Hall 4 Jordan Warehouse 11 Hill Student Center 19 Betty White Health Center 5 Chandler Hall 12 Hume Hall 20 Community Ed. Center 6 Kentucky Hall 13 Carver Hall 21 McCullin Hall 7 Atwood Research Facility 14 Blazer Library 22 Alumni House
4

Kentucky State University Campus
Fact Book 2010‐2011
South Campus
1 Aquaculture Research Center 8 Hillcrest (President’s Home) 2 Baseball Field 9 Track 3 Alumni Stadium 10 Practice Fields 4 Russell Court Apartments 11 Tennis Courts
5

Kentucky State University Campus
Fact Book 2010‐2011
Campus Size
Land Holdings Acres Main Campus 311.8 University Farm 167.0 University Farm 37.0 University Farm 92.6 Environmental Education Center 306.0 Total Acres 914.4
Building Name Year Built Building Name Year Built Building Name Year Built Soils & Lab Office 1986 Jordan Maint Bldg 1969 Amphitheater 1989 Agriculture Greenhouse 1986 Hathaway Hall 1967 Fish Hatchery Building 1984 Hume Hall 1909 Shauntee Hall 1971 Pole Barn/Aquaculture 1986 Atwood Ag Research 1935 W Dugout‐Baseball Field 1978 Aquaculture Classroom 2004 Jackson Hall 1887 Hill Student Center 1971 Motorpool 1995 Blazer Library 1958 Hillcrest 1972 Chappell Community Ed Center 1999 McCullin Hall 1949 White Health Center 1971 Rosenwald Center For Families 2011 Jordan Shop/Warehouse 1939 Jonesfield House 1971 Aquaculture Production‐ 2011 Cross Walk Tunnel ‐‐ E Dugout‐Baseball Field 1978 Technology Lab Carver Hall/Annex 1952 Press Building 1978 Maryland Warehouse 2010 Coop Ext Prog Facility 1993 Restroom/Storage Bldg 1978 Shop Barn/On Farm 1986 Nutrition Laboratory 1993 Whitney M. Young Jr. 2008 Silo 1986 Kentucky Hall 1929 QEP House 2009 Cattle Feed Shed/Auger 1986 Chandler Hall 1939 Academic Annex 1976 Aquaculture Ct. Shed 1986 Alumni House 1961 Boiler Plant Addn 1977 Corn Crib 1986 Combs Hall 1964 Alumni Stadium Dress Rm Bldg 1978 MPU Docking Station 2003 Hunter Hall 1964 Alumni Stadium 1978 Hay Storage Barn 2006 Rosenwald Building 1954 Old Federal Building 2009 Poultry Building 2007 Bradford Hall 1965 Barn 2009 Cafetaria Bldg 1985 Bell Health Building 1962 Chilled Water Plant 1981 Hill Student Ctr Add 2 2003 Russell Fac Apts 1967 Academic Service Building 1981 Center For Sustainability For‐ 2010 Young Hall (The Halls) 1967 William Exum Center 1994 Farms And Families
6

LIBRARYLIBRARY
Fact Book 2010‐2011

Kentucky State University Library
Fact Book 2010‐2011
Paul G. Blazer Library
Paul G. Blazer Library's collections of more than 800,000 items are for the reference, electronic, periodical, media, and circulating collections. Books, ebooks, journals, videos/DVDs, microforms, sound recordings are available for students and faculty in their course work and research. The Library sub‐scribes to electronic databases on various subjects to support the curriculum. The University community is encouraged to use the Library for personal enrichment and leisure reading.
The Library has specialized collections for faculty, students, and researchers. Special Collections and Archives, which contain rare and historical docu‐ments relating to African‐American culture and history, Kentuckiana, and University's records, are located on the Library's second floor. The Education Curriculum Lab, located on the ground floor, contains a specialized state approved textbook collection and provides education curriculum materials (grades preschool through 12) for students and faculty in the School of Education. The Library is a selective depository for the United States Govern‐ment Document Program and houses a variety of federal documents. The Aquaculture Collection, located in the Reading Room of the University's Aquaculture Research Center, supports the research of faculty and students in the Aquaculture Program, the University's Program of Distinction. Needed materials not available in the Library can be obtained through Interlibrary Loan. PC work‐stations and photocopy facilities are available onsite for student use.
Librarians and support personnel assist students and faculty in using the Library's resources and facilities. Special library tours or individualized instruc‐tion can be scheduled by contacting the Reference Desk.
Mission Statement
Paul G. Blazer Library supports the library and informational needs of the Kentucky State University community. Included in this goal is a commitment to enhancing the use of the Library's electronic and information technologies, strengthening collections in support of the University's curricula for both undergraduate and graduate programs, and assisting faculty in their quest for excellence in teaching, scholarship, and service.
8

Kentucky State University Library
Fact Book 2010‐2011
Blazer Library Collection Holdings
5‐Year
2006 2007 2008 2009 2010 Change
Volumes (all printed materials) 443,275 445,386 449,381 452,246 469,289 6%
Audio/Video/CDs/DVDs 4,863 4,958 5,192 5,469 7,017 44%
Periodicals (current titles) 809 922 864 27,919 * 864 7%
Microforms 326,666 326,884 327,097 328,101 328,458 1%
Electronic Databases (number of collections) ‐‐ ‐‐ ‐‐ ‐‐ 58 ‐‐
Other materials 14,453 14,447 14,447 13,390 ‐‐ ‐‐
Ebook Collections (monographic, number of title) 16,362 16,699 20,244 20,088 20,199 23%
Total Library Holdings 806,428 809,296 817,225 847,213 825,885 2%
As Of June 30:
* Number for both current paper and electronic subscriptions
700,000
725,000
750,000
775,000
800,000
825,000
850,000
2006 2007 2008 2009 2010
Total Library Holdings
9

ADMINISTRATIONADMINISTRATION
Fact Book 2010‐2011

Kentucky State University Administration
Fact Book 2010‐2011
Vision
In the 21st century, Kentucky State University, a diverse and unique liberal studies, 1890 land grant institute, will be a comprehensive institution that effectively utilizes its resources to create an exceptional learning community. In its curricula, services and outreach, Kentucky State University will re‐main committed to its rich heritage and dedicated to its future. Outstanding faculty and staff will prepare leaders committed to continuous improve‐ment in the opportunities for expression and participation in the life of the University, the Commonwealth, the nation and the world.
Mission
Kentucky State University, building on its legacy of achievement as a historically black, liberal arts, and 1890 land‐grant university, affords access to and prepares a diverse student population of traditional and non‐traditional students to compete in a multifaced, ever‐changing global society by providing student‐centered learning while integrating teaching, research, and service through high�]quality undergraduate and select graduate programs. Ken‐tucky State University is committed to keeping relevant its legacy of service by proactively engaging the community in partnerships on civic projects driven by the objective of positively impacting the quality of life of the citizens on the Commonwealth.
Institution Name Kentucky State University Established 1886 President Dr. Mary Evans Sias Address 400 East Main Street, Frankfort, KY 40601 Telephone (502) 597‐6000 Institution Type 4‐year Public Website www.kysu.edu
: : : : : : :
11

Kentucky State University Administration
Fact Book 2010‐2011
Board of Regents
Attorney Laura Douglas, Chair
Mr. Wilbert James Jr., Vice Chair
Dr. Edwin Conner, Faculty Regent
Mr. Ron Banks, Staff Regent
Mr. Michael Fuller, Student Regent
Dr. Karen Bearden
Attorney Mindy Barfield
Dr. Syamala H. K. Reddy
Attorney David J. Guarnieri
Mrs. Phyllis M. Williams
Mr. Charles Whitehead
12

Kentucky State University Administration
Fact Book 2010‐2011
Cabinet
Dr. Mary Evans Sias,
Dr. James Chapman, Interim Provost/Vice President for Academic Affairs
Mr. Stephen A. Mason, Chief of Staff/Executive Assistant to the President
Mrs. Alice B. Johnson, Vice President for Finance and Business Affairs
Dr. Rubye W. Jones, Vice President for Student Affairs and Enrollment Management
Mr. Hinfred McDuffie,
Attorney Lori Davis, General Council
Vice President for Administration, External Relations and Development
President
13

Kentucky State University Administration
Fact Book 2010‐2011
President’s Senior Staff
Ms. Stephanie Bastin, Chief of University Police
Ms. Vernell Bennett, Assistant Vice President of Student Affairs
Dr. Harold Benson, Director, Land Grant Program/Acting Dean, College of Agriculture
Ms. Donna Covington, Director of Title III
Mr. Edward Fields, Director, Information Technology
Ms. Claudine Gee, Director of Budget
Dr. Robin Geiger, Director, Institutional Research and Effectiveness
Dr. Ivory Griskell, Director, Compliance and Risk Management
Mr. Harold Hayes, Director, Auxiliary Services
Dr. Denisha Hendricks, Director, Athletics
Dr. Ralph Kimbrough, Internal Auditor
Ms. Felicia Lewis, Assistant Vice President of External Relations/Director, Communications
Mr. Jack McNear, Associate VP of Capital Planning, Construction, and Facilities
Mr. Gary Meiseles, Director, Human Resources
Dr. Cornell Menking, Interim Assistant VP for International Affairs/Director, Global Ed & Programs
Ms. Katherine Napier, Associate Vice President of Business Operations
Dr. Roosevelt Shelton, Associate VP of Enrollment Management
Dr. Penny Smith, Assistant Provost for Outreach and Extended Programs/Director of Distance Learning
Dr. Mary Stephens‐Frazier, Director, Sponsored Projects, Grants, and Contracts
Dr. Titilayo Ufomata, Associate Provost, Academic Affairs
Mr. William Wilson, Associate VP for Development and Major Gifts
14

Kentucky State University Administration
Fact Book 2010‐2011
Organization Chart
Approved: October 2010
15

ACCREDITATIONACCREDITATION
Fact Book 2010‐2011

Kentucky State University Accreditation
Fact Book 2010‐2011
Accreditation and Institutional Memberships
Kentucky State University is accredited by the Commission on Colleges of the Southern Association of Colleges and Schools to award associate, bacca‐laureate, and master's degrees. Credit earned at Kentucky State University are accepted by other accredited institutions of higher education through‐out the country for transfer credit, graduate study, professional placement, and employment opportunities. The University also holds full membership in and/or accreditation from the following state, regional, and national educational or professional organizations:
American Alliance of Physical Education, Health, Recreation, Kentucky Board of Nursing and Dance Kentucky Council for International Education American Association for Higher Education Kentucky Council of Associate Degree Nursing American Association of Colleges for Teacher Education Kentucky Education Professional Standards Board American Association of Collegiate Registrars and Admissions Officers The Kentucky Institute for International Studies American Association of State Colleges and Universities National Association for Equal Opportunity in Higher Education American College Health Association National Association for the Education of Young Children American Council on Education National Association of College Deans, Registrars and Admissions Officers American Library Association National Association of Colleges and University Business Officers Association for Institutional Research National Association of Schools of Music Association for Student Judicial Affairs National Association of Schools of Public Affairs and Administration Association of American Colleges and Universities National Association of Student Affairs Professionals Association of College and University Auditors National Association of Student Financial Aid Administrators Association of Collegiate Business Schools and Programs National Association of Student Personnel Administrators Association of Gerontology in Higher Education National Collegiate Athletic Association Association of Governing Boards of Universities and Colleges National Collegiate Honors Council Association of Public and Land‐Grant Colleges Universities National Council for Accreditation of Teacher Education Association to Advance Collegiate Schools of Business (AACSB) National Council for Education Opportunity Associations The College Board National League for Nursing The Cooperative Center for Study Abroad National League for Nursing Accrediting Commission Council for Adult and Experiential Learning Professional and Organizational Development Network in Higher Education Council for the Advancement and Support of Education Society for College and University Planning Council of National Alumni Associations, Inc. South‐East Consortium for International Development Council on Social Work Education Southern Association of College and University Business Officers HBCU Library Alliance Southern Association of Collegiate Registrars and Admissions Officers International Studies Association Southern Council of Collegiate Education for Nursing Kentucky Academy of Science Southern Intercollegiate Athletic Conference Kentucky Association of Baccalaureate and Higher Degree Programs Southeastern Library Network Kentucky Association of Collegiate Registrars and Admissions Officers 1890 Land Grant and Tuskegee Library Director’s Association
17

KSU HISTORYKSU HISTORY
Fact Book 2010‐2011

Kentucky State University History
Fact Book 2010‐2011
KSU History
Since its doors first opened on October 11, 1887, Kentucky State University has played a critical role in providing opportunities for students seeking ac‐cess to higher education within the commonwealth of Kentucky. The school's founding is linked directly to a small cadre of teachers who were gradu‐ates of Berea College . at the time, the only institution of higher learning available for African Americans in the state. Their vision embraced the ideal that a school dedicated to the sole purpose of training teachers for the African American school‐age population was both needed and could have posi‐tive and far‐reaching effects. Led by John H. Jackson, a teacher in Lexington, the group petitioned legislators to lobby for a school. On May 17, 1886, a majority of the legislators voted affirmatively and passed an act that authorized both a charter and funds for the school. Jackson was selected later to become the school's first president.
The State Normal School for Colored Persons became only the second institution of higher learning approved to receive state‐level financial support from the commonwealth. Several cities competed for an opportunity to host the school. The offer made by the capital city of Frankfort was accepted largely because it included the donation of a 24‐acre tract of land on which the school could be built.
The journey from normal school to university spanned a period of 86 years, from 1886 to 1972, and included five name changes. In 1890, provisions under the Second Morrill Act enabled State Normal to acquire land grant status. This represented the first shift in curriculum design. The departments of agriculture, domestic economy, and mechanics and manual training were added along with a new emphasis on the creation of new knowledge and public service. Gradually, in addition to offering the two‐year teacher training program, the school expanded to include educational offerings targeting primary‐ and secondary‐level students.
The impact of Booker T. Washington's Tuskegee Institute philosophy, coupled with the broader progressive education movement, influenced Kentucky legislators to adopt the industrial education model for the school. The State Normal School for Colored Persons became Kentucky Normal and Industrial Institute in 1902. By the early 1930s, however, KNII began to re‐emphasize a classical education. The institution transitioned to a four‐year college in 1938, gained accreditation in 1939 through the Southern Association of Colleges and Schools and has since been approved for reaccreditation on a con‐tinual basis. The institution finally acquired university status and began offering graduate programs in 1972.
Today, with President Mary Evans Sias at the helm as its 13th president, Kentucky State University has evolved into the most diverse institution in the state. Moreover, KSU continues to embrace the ideals of its founders, a value for access to education and a commitment to service, along with its land grant programs and a strong liberal studies core that prepares students well for life in a global community.
19

Kentucky State University History
Fact Book 2010‐2011
John H. Jackson 1887‐1898 James E. Givens 1898‐1900 James S. Hathaway 1900‐1907 John H. Jackson 1907‐1910 James S. Hathaway 1910‐1912 Green P. Russell 1912‐1923 Francis M. Wood 1923‐1924 Green P. Russell 1924‐1929 Rufus B. Atwood 1929‐1962 Carl M. Hill 1962‐1975 W. A. Butts 1975‐1982 Raymond M. Burse 1982‐1989 Mary L. Smith, Interim 1989‐1990 John T. Wolfe 1990 Mary L. Smith 1990‐1998 George W. Reid 1998‐2002 Paul E. Bibbins, Interim 2002 William Turner, Interim 2003‐2004 Mary E. Sias 2004‐present
KSU Presidents: Past and Present
First President: John H. Jackson
Current President: Mary E. Sias
20

ADMISSIONADMISSION
Fact Book 2010‐2011

Kentucky State University Admission
Fact Book 2010‐2011
KSU Undergraduate Admission
Class Status Fall 2006 Fall 2007 Fall 2008 Fall 2009 Fall 2010 5‐Yr Change Freshman Applied 5,572 6,644 7,770 10,765 12,271 120% Admitted 2,104 2,559 2,400 2,610 3,116 48% Enrolled 542 678 687 540 635 17% Transfer Applied 502 450 499 597 725 44% Admitted 206 167 172 215 232 13% Enrolled 89 94 90 116 148 66% Non Degree Applied 205 218 117 214 89 ‐57% Admitted 182 171 108 208 45 ‐75% Enrolled 75 121 51 65 26 ‐65% Total Applied 6,279 7,312 8,386 11,576 13,085 108% Admitted 2,492 2,897 2,680 3,033 3,393 36% Enrolled 706 893 828 721 809 15%
Fall 2006 Fall 2007 Fall 2008 Fall 2009 Fall 2010 5‐Yr Change Percent Admitted to Applied Freshman 38% 39% 31% 24% 25% ‐13% Transfer 41% 37% 34% 36% 32% ‐9% Non Degree 89% 78% 92% 97% 51% ‐38%
Freshman 26% 26% 29% 21% 20% ‐6% Transfer 43% 56% 52% 54% 64% 21% Non Degree 28% 31% 31% 24% 24% ‐4%
Percent Enrolled to Admitted
22

Kentucky State University Admission
Fact Book 2010‐2011
Freshman Application Among Kentucky Public Institutions
Institution Fall
2006 Fall
2007 Fall
2008 Fall
2009 Fall
2010 5‐Yr
Change
Eastern Kentucky University (EKU) 6,208 6,776 6,948 7,213 8,339 34%
Kentucky State University (KSU) 5,572 6,644 7,770 10,765 12,271 120%
Morehead State University (MoSU) 5,092 4,757 5,257 5,720 2,768 ‐46%
Murray State University (MuSU) 3,057 2,916 3,108 3,072 4,233 38%
Northern Kentucky University (NKU) 5,337 5,535 5,367 6,887 7,202 35%
University of Kentucky (UK) 10,516 10,024 10,619 11,120 12,195 16%
University of Louisville (UL) 5,712 6,323 7,280 7,861 7,755 36%
Western Kentucky University (WKU) 6,953 6,857 7,409 7,757 7,757 12%
Source: IPEDS
‐80%
‐40%
0%
40%
80%
120%
160%
EKU KSU MoSU MuSU NKU UK UL WKU
Five‐Year Growth Undergraduate Application Among KY Public Institutions
23

Kentucky State University Admission
Fact Book 2010‐2011
Freshman Admission Among Kentucky Public Institutions
Institution Fall 2006 Fall 2007 Fall 2008 Fall 2009 Fall 2010 5‐Yr Change Eastern Kentucky University 4,552 4,410 4,788 5,213 5,742 26% Kentucky State University 2,104 2,559 2,400 2,610 3,116 48% Morehead State University 3,528 3,528 3,740 3,118 2,181 ‐38%
Murray State University 2,509 2,509 2,636 2,629 3,108 24% Northern Kentucky University 3,787 3,787 4,167 4,767 4,772 26%
University of Kentucky 8,124 8,124 8,172 8,757 8,966 10% University of Louisville 4,515 4,515 5,109 5,473 5,625 25% Western Kentucky University 6,305 6,305 6,976 7,331 7,331 16% Source: IPEDS
Institution Fall 2006 Fall 2007 Fall 2008 Fall 2009 Fall 2010 5‐Yr Change Eastern Kentucky University 73% 65% 69% 72% 69% ‐4% Kentucky State University 38% 39% 31% 24% 25% ‐13% Morehead State University 69% 74% 71% 55% 79% 10%
Murray State University 82% 86% 85% 86% 73% ‐9% Northern Kentucky University 71% 68% 78% 69% 66% ‐5%
University of Kentucky 77% 81% 77% 79% 74% ‐3% University of Louisville 79% 71% 70% 70% 73% ‐6% Western Kentucky University 91% 92% 94% 95% 95% 4%
Percent Admitted over Applied
24

Kentucky State University Admission
Fact Book 2010‐2011
Freshman First‐Time Enrollment Among Kentucky Public Institutions
Institution Fall 2006 Fall 2007 Fall 2008 Fall 2009 Fall 2010 5‐Yr Change Eastern Kentucky University 2,500 2,487 2,493 2,495 2,564 3% Kentucky State University 542 678 687 540 635 17% Morehead State University 1,300 1,306 1,409 1,338 1,260 ‐3%
Murray State University 1,337 1,276 1,339 1,311 1,391 4% Northern Kentucky University 2,016 2,025 2,183 2,268 2,294 14%
University of Kentucky 3,835 4,190 3,865 4,110 4,153 8% University of Louisville 2,318 2,443 2,569 2,609 2,478 7% Western Kentucky University 3,235 3,121 3,303 3,387 3,387 5% Source: IPEDS
Institution Fall 2006 Fall 2007 Fall 2008 Fall 2009 Fall 2010 5‐Yr Change Eastern Kentucky University 55% 56% 52% 48% 45% ‐10% Kentucky State University 26% 26% 29% 21% 20% ‐6% Morehead State University 37% 37% 38% 43% 58% 21%
Murray State University 53% 51% 51% 50% 45% ‐8% Northern Kentucky University 53% 53% 52% 48% 48% ‐5%
University of Kentucky 47% 52% 47% 47% 46% ‐1% University of Louisville 51% 54% 50% 48% 44% ‐7% Western Kentucky University 51% 50% 47% 46% 46% ‐5%
Percent Admitted over Applied
25

Kentucky State University Admission
Fact Book 2010‐2011
Gender Fall
2006 Fall
2007 Fall
2008 Fall
2009 Fall
2010 5‐Yr
Change
Female 3,474 4,284 4,419 6,367 6,759 95%
Male 2,345 2,567 3,149 4,336 4,367 86%
Not Reported 460 461 818 873 1,959 326%
Total Applied 6,279 7,312 8,386 11,576 13,085 108%
KSU Undergraduate Application
Race Fall
2006 Fall
2007 Fall
2008 Fall
2009 Fall
2010 5‐Yr
Change
Nonresident Alien 0 0 32 3 2 ‐‐
Black, Non Hispanic 4,773 5,630 5,581 2,978 929 ‐81%
American Indian/Alaskan 8 9 15 32 30 275%
Asian 48 48 45 32 11 ‐77%
Hispanic 55 63 87 194 140 155%
White, Non Hispanic 526 576 639 1,152 889 69%
Unknown 869 986 1,987 7,185 11,084 1175%
Total Applied 6,279 7,312 8,386 11,576 13,085 108%
Two or More Races 0 0 0 0 0 ‐‐
Hawaiian/Pacific Islander 0 0 0 0 0 ‐‐
Class Fall
2006 Fall
2007 Fall
2008 Fall
2009 Fall
2010 5‐Yr
Change
Freshman 5,572 6,644 7,770 10,765 12,271 120%
Transfer 502 450 499 597 725 44%
Non Degree 205 218 117 214 89 ‐57%
Total Applied 6,279 7,312 8,386 11,576 13,085 108%
0
4,000
8,000
12,000
16,000
Fall 2006 Fall 2007 Fall 2008 Fall 2009 Fall 2010
UG Application by Class
Freshman Transfer Non Degree
0
2,000
4,000
6,000
8,000
Fall 2006 Fall 2007 Fall 2008 Fall 2009 Fall 2010
UG Application by Gender
Female Male
0
2,000
4,000
6,000
8,000
10,000
12,000
14,000
Fall 2006 Fall 2007 Fall 2008 Fall 2009 Fall 2010
UG Total Application
26
Kentucky State University Admission
Fact Book 2010‐2011
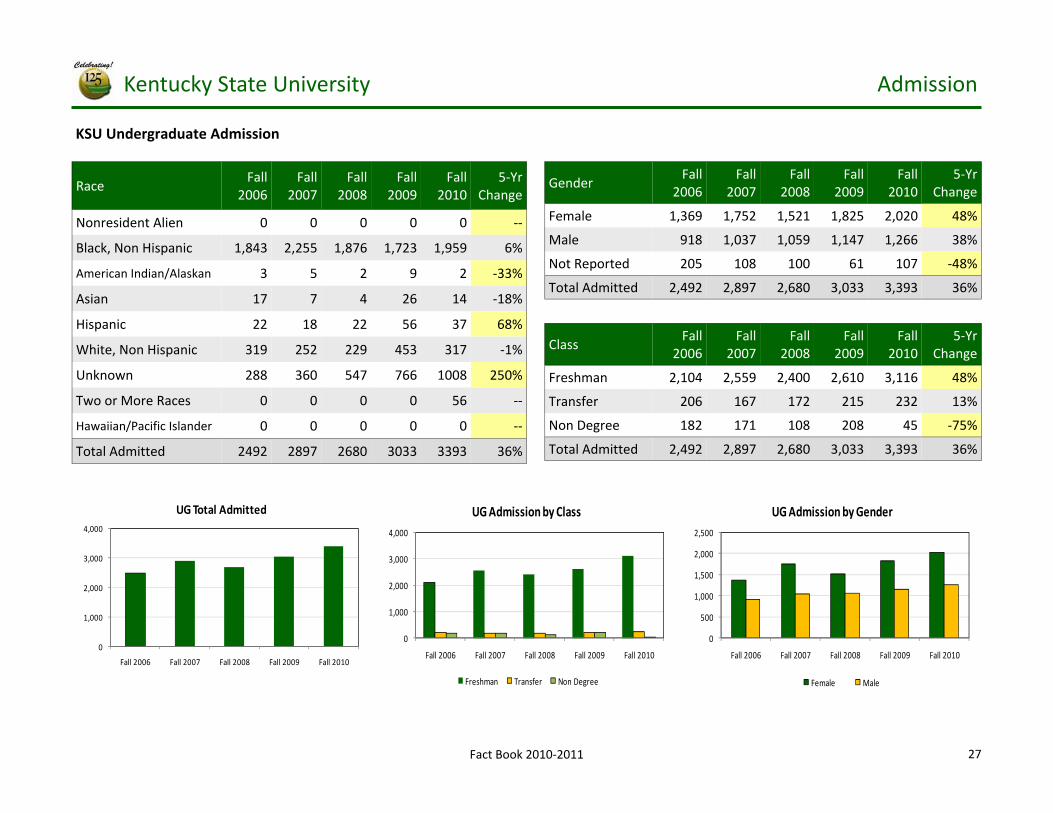
Race Fall
2006 Fall
2007 Fall
2008 Fall
2009 Fall
2010 5‐Yr
Change
Nonresident Alien 0 0 0 0 0 ‐‐
Black, Non Hispanic 1,843 2,255 1,876 1,723 1,959 6%
American Indian/Alaskan 3 5 2 9 2 ‐33%
Asian 17 7 4 26 14 ‐18%
Hispanic 22 18 22 56 37 68%
White, Non Hispanic 319 252 229 453 317 ‐1%
Unknown 288 360 547 766 1008 250%
Total Admitted 2492 2897 2680 3033 3393 36%
Two or More Races 0 0 0 0 56 ‐‐
Hawaiian/Pacific Islander 0 0 0 0 0 ‐‐
Gender Fall
2006 Fall
2007 Fall
2008 Fall
2009 Fall
2010 5‐Yr
Change
Female 1,369 1,752 1,521 1,825 2,020 48%
Male 918 1,037 1,059 1,147 1,266 38%
Not Reported 205 108 100 61 107 ‐48%
Total Admitted 2,492 2,897 2,680 3,033 3,393 36%
Class Fall
2006 Fall
2007 Fall
2008 Fall
2009 Fall
2010 5‐Yr
Change
Freshman 2,104 2,559 2,400 2,610 3,116 48%
Transfer 206 167 172 215 232 13%
Non Degree 182 171 108 208 45 ‐75%
Total Admitted 2,492 2,897 2,680 3,033 3,393 36%
KSU Undergraduate Admission
0
1,000
2,000
3,000
4,000
Fall 2006 Fall 2007 Fall 2008 Fall 2009 Fall 2010
UG Total Admitted
0
1,000
2,000
3,000
4,000
Fall 2006 Fall 2007 Fall 2008 Fall 2009 Fall 2010
UG Admission by Class
Freshman Transfer Non Degree
0
500
1,000
1,500
2,000
2,500
Fall 2006 Fall 2007 Fall 2008 Fall 2009 Fall 2010
UG Admission by Gender
Female Male
27

Kentucky State University Admission
Fact Book 2010‐2011
Race Fall
2006 Fall
2007 Fall
2008 Fall
2009 Fall
2010 5‐Yr
Change
Nonresident Alien 0 45 6 11 12 ‐‐
Black, Non Hispanic 537 564 523 411 482 ‐10%
American Indian/Alaskan 2 2 0 0 0 ‐100%
Asian 8 4 0 4 0 ‐100%
Hispanic 4 4 4 22 8 100%
White, Non Hispanic 146 142 131 113 133 ‐9%
Unknown 9 132 164 160 156 1633%
Total Applied 706 893 828 721 809 15%
Two or More Races 0 0 0 0 18 ‐‐
Hawaiian/Pacific Islander 0 0 0 0 0 ‐‐
Gender Fall
2006 Fall
2007 Fall
2008 Fall
2009 Fall
2010 5‐Yr
Change
Female 358 501 452 412 467 30%
Male 348 392 376 309 342 ‐2%
Total Applied 706 893 828 721 809 15%
Class Fall
2006 Fall
2007 Fall
2008 Fall
2009 Fall
2010 5‐Yr
Change
Freshman 542 678 687 540 635 17%
Transfer 89 94 90 116 148 66%
Non Degree 75 121 51 65 26 ‐65%
Total Applied 706 893 828 721 809 15%
KSU Undergraduate New Enrollment
0
200
400
600
800
1,000
Fall 2006 Fall 2007 Fall 2008 Fall 2009 Fall 2010
UG Total Enrolled
0
200
400
600
800
Fall 2006 Fall 2007 Fall 2008 Fall 2009 Fall 2010
UG Enrolled by Class
Freshman Transfer Non Degree
0
150
300
450
600
Fall 2006 Fall 2007 Fall 2008 Fall 2009 Fall 2010
UG Enrolled by Gender
Female Male
28

Kentucky State University Admission
Fact Book 2010‐2011
Test Scores Submitted by KSU First‐Time Freshmen
Number of KSU Fall 2010 First‐Time Freshmen Submitted ACT: 469 Number of KSU Fall 2010 First‐Time Freshmen Submitted SAT: 91
Percent of KSU Fall 2010 First‐Time Freshmen Submitted ACT: 74% Percent of KSU Fall 2010 First‐Time Freshmen Submitted SAT: 14%
Fall 2006 Fall 2007 Fall 2008 Fall 2009 Fall 2010
25th 75th 25th 75th 25th 75th 25th 75th 25th 75th 25th 75th
Percentile Percentile Percentile Percentile Percentile Percentile Percentile Percentile Percentile Percentile Percentile Percentile
ACT English 13 18 13 19 13 19 13 19 13 19 0% 6%
ACT Math 15 18 15 18 15 18 15 18 15 18 0% 0%
ACT Reading 14 20 14 20 14 20 14 20 14 20 0% 0%
ACT Comp 15 19 15 19 15 19 15 19 15 19 0% 0%
SAT Verbal 370 470 370 468 360 460 360 460 348 480 ‐6% 2%
SAT Math 360 460 360 450 360 460 340 460 350 440 ‐3% ‐4%
SAT Total (V+M) 740 940 730 900 720 920 720 920 710 920 ‐4% ‐2%
5‐Yr Change
Fall 2006 Fall 2007 Fall 2008 Fall 2009 Fall 2010 5‐Yr Change
Average Average Average Average Average Average
ACT English 16 16 16 16 16 0%
ACT Math 16 17 17 17 17 6%
ACT Reading 17 17 18 17 18 6%
ACT Comp 17 17 17 17 17 0%
SAT Verbal 416 421 408 409 408 ‐2%
SAT Math 419 409 404 403 410 ‐2%
SAT Total (V+M) 835 830 811 813 818 ‐2%
29

Kentucky State University Admission
Fact Book 2010‐2011
High School GPA Submitted by KSU First‐Time Freshmen
Number of KSU Fall 2010 First‐Time Freshmen Submitted High School GPA: 634 Percent of KSU Fall 2010 First‐Time Freshmen Submitted High School GPA: 100%
Fall 2006 Fall 2007 Fall 2008 Fall 2009 Fall 2010 5‐Yr
n % n % n % n % n % Change
3.75 & higher 15 3% 16 4% 23 3% 10 2% 21 3% 1%
3.50 to 3.74 18 3% 28 7% 38 6% 30 6% 28 4% 1%
3.00 to 3.49 96 18% 128 34% 129 19% 85 16% 110 17% 0%
2.50 to 2.99 135 25% 180 48% 192 28% 162 30% 167 26% 1%
2.00 to 2.49 195 36% 228 60% 228 33% 170 31% 225 35% ‐1%
1.00 to 1.99 80 15% 88 23% 77 11% 73 14% 83 13% ‐2%
Below 1.00 0 0% 0 0% 0 0% 0 0% 0 0% 0%
The admissions index was established to quantify an assessment of a student’s high school activities and ACT assessment. The admissions index is a numerical score calculated by multiplying the ACT by 10, the grade‐point average by 100, and by adding the two sums. The equation is as follows: ACT x 10 + GPA x 100 = index. SAT I verbal and math scores are converted to ACT composite scores for use in the admissions index according to a table of equivalencies developed by the Kentucky Council on Postsecondary Education (www.cpe.state.ky.us).
Unconditional Admission for First‐Time Freshmen Kentucky State University requires students to meet an admission index of 430 or greater and to complete the Pre‐College Curriculum (PCC) in order to be admitted unconditionally to the University.
30

RESIDENCE HALLSRESIDENCE HALLS
Fact Book 2010‐2011

Kentucky State University Residence Halls
Fact Book 2010‐2011
Residence Halls
Each student desiring to reside in university housing will be required to sign a Kentucky State University Two Semester Residence Hall Contract and pay a $250 Housing Reservation Fee. A signed, completed contract and full payment of the Housing Reservation Fee is required for acceptance into univer‐sity housing. The university also requires that each resident purchase a Theft, Fire, Natural Disaster and Accidental Damage policy, which is $60.
The $75 Room Reservation Fee will be credited to the student’s account. Residents are eligible for a $50 refund from their Damage/Maintenance Fee at the end of their occupancy in university housing, provided they do not have any outstanding damage charges. Residents must complete a Damage De‐posit Return Card in the Office of Residence Life within 90 days of the end of their occupancy in university housing to receive the refund. If a prospec‐tive resident has completed the housing reservation process by the appropriate deadline and is not granted university housing due to occupancy levels, he or she will be refunded the Housing Reservation Fee. HOUSING FEES ARE NONREFUNDABLE. For detailed requirements, please visit http://www.kysu.edu/about/divisions/externalrelations/housing
Fall 2006 Fall 2007 Fall 2008 Fall 2009 Fall 2010 5‐Yr Change
Total Enrollment 2,500 2,696 2,659 2,834 2,851 14%
Hall Residents 788 862 823 983 992 26%
Percent Resident 32% 32% 31% 35% 35% 3%
Percent Commute 68% 68% 69% 65% 65% ‐3%
0%
10%
20%
30%
40%
Fall 2006 Fall 2007 Fall 2008 Fall 2009 Fall 2010
Percent Hall Residence of Enrollment
32

Kentucky State University Residence Halls
Fact Book 2010‐2011
Residence Halls Utilization
Buildings Fall 2006 Fall 2007 Fall 2008 Fall 2009 Fall 2010 5‐Yr Change
Chandler Hall 90% 97% 93% 93% 95% 5%
Combs Hall 94% 97% 85% 94% 100% 6%
Whitney Young Hall ‐‐ ‐‐ 96% 94% 96% ‐‐
Total 92% 99% 91% 94% 96% 4%
Hunter Hall 77% 100% 92% 95% 100% 23%
Kentucky Hall 88% 96% 91% 99% 99% 11%
McCullin Hall 91% 100% 97% 91% 100% 9%
The Halls 98% 100% 87% 92% 92% ‐6%
Capacity*
114
106
104
136
97
323
150
1,030
* Capacity as of Fall 2010 Note: Capacity may changed over the years due to renovation
0%
25%
50%
75%
100%
Chandler Combs Hunter Kentucky McCullin The Halls W. Young
Fall 2010 Halls Utilization
Utilized Vacant
Chandler Hall
33

Kentucky State University Residence Halls
Fact Book 2010‐2011
Residence Halls Occupancy
Buildings Fall
2006 Fall
2007 Fall
2008 Fall
2009 Fall
2010 5‐Yr
Change
Chandler Hall 98 107 91 111 108 10%
Combs Hall 97 99 89 101 106 9%
Hunter Hall 76 100 96 97 104 37%
Kentucky Hall 119 133 110 136 136 14%
McCullin Hall 85 99 87 92 97 14%
The Halls 313 324 215 303 297 ‐5%
Whitney Young Hall ‐‐ ‐‐ 135 143 144 ‐‐
Total 788 862 823 983 992 26%
Fall
Buildings Fall
2006 Fall
2007 Fall
2008 Fall
2009 Fall
2010 5‐Yr
Change
Chandler Hall 84 105 81 109 107 27%
Combs Hall 81 82 87 80 90 11%
Hunter Hall 71 94 89 96 97 37%
Kentucky Hall 121 115 112 129 124 2%
McCullin Hall 83 123 127 76 80 ‐4%
The Halls 243 274 219 281 245 1%
Whitney Young Hall ‐‐ ‐‐ 125 138 119 ‐‐
Total 683 793 840 909 862 26%
Spring
Room Rate (per semester)
Buildings Single Room Double Room Triple Room Suite
Chandler Hall $2,170 $1,620 N/A $2,100
Combs Hall N/A $1,620 N/A N/A
Hunter Hall N/A $1,620 N/A N/A
Kentucky Hall $2,170 $1,620 $1,600 $2,100
McCullin Hall $2,170 N/A N/A $2,100
The Halls $2,170 $1,620 N/A $2,100
Whitney Young Hall N/A N/A N/A $2,100
Whitney Young Hall
34

Kentucky State University Residence Halls
Fact Book 2010‐2011
Residence Halls Occupancy by Gender
Gender Residence Halls Fall 2006 Fall 2007 Fall 2008 Fall 2009 Fall 2010 5‐Yr Change Female Chandler Hall 98 107 91 111 108 10% Combs Hall 50 71 0 27 28 ‐44% Hunter Hall 76 100 64 32 0 ‐100% Kentucky Hall 119 133 110 136 136 14% McCullin Hall 60 66 62 68 70 17% The Halls 0 0 46 100 191 ‐‐ Whitney Young Hall 0 0 75 79 75 ‐‐ Total Female Residents 403 477 448 553 608 51% Male Combs Hall 47 28 89 74 78 66% Hunter Hall 0 0 32 65 104 ‐‐ McCullin Hall 25 33 25 24 27 8% The Halls 0 0 169 203 106 ‐‐ Whitney Young Hall 313 324 60 64 69 ‐78% Total Male Residents 385 385 375 430 384 0%
Residence Hall Type Chandler Hall Female Housing Combs Hall Co‐Ed Housing Hunter Hall Male Housing Kentucky Hall Female Housing McCullin Hall Co‐Ed Housing The Halls Co‐Ed Housing Whitney Young Hall Co‐Ed Housing As of Fall 2010
Fall 2010 Housing Residents
0%
25%
50%
75%
100%
Chandler Combs Hunter Kentucky McCullin The Halls W. Young
Fall 2010 Housing Residents
Female Male
Female61%
Male39%
35

Kentucky State University Residence Halls
Fact Book 2010‐2011
Residence Halls Occupancy by Class
All full‐time freshmen and sophomore students, except veterans of at least two years’ active military service, students who commute from their par‐ents’ or legal guardians’ homes, married students, or students 21 years of age or older, are required to live in campus housing.
Class Buildings Fall 2006 Fall 2007 Fall 2008 Fall 2009 Fall 2010 5‐Yr Change Freshman & Sophomore Chandler Hall 100 101 104 104 100 0% Combs Hall 77 84 84 87 92 19% Hunter Hall 76 98 90 91 99 30% Kentucky Hall 98 115 120 112 109 9% McCullins Hall 49 69 77 75 72 47% The Halls 302 320 217 292 294 ‐3% Whitey Young Hall ‐‐ ‐‐ 96 86 95 ‐‐ Total 702 787 788 847 859 22% Other Classes Chandler Hall 2 12 1 7 8 300% Combs Hall 23 19 6 14 14 ‐39% Hunter Hall 1 6 2 6 5 400% Kentucky Hall 24 19 7 24 27 13% McCullins Hall 37 42 15 17 25 ‐32% The Halls 16 12 7 11 3 ‐81% Whitey Young Hall ‐‐ ‐‐ 46 57 49 ‐‐ Total 103 110 84 136 131 27%
87% 88% 90% 86% 87%
13% 12% 10% 14% 13%
0%
25%
50%
75%
100%
Fall 2006 Fall 2007 Fall 2008 Fall 2009 Fall 2010
Freshman & Sophomore Other Classes
Combs Hall
36

FINANCIAL AIDFINANCIAL AID
Fact Book 2010‐2011

Kentucky State University Financial Aid
Fact Book 2010‐2011
Financial Aid Awarded
Total dollar amounts shown on this page is the awarded, not disbursed, to enrolled degree‐seeking undergraduates are presented in the following cate‐gories, as used for the Common Data Sets. Include aid awarded to international students. Aid that is non‐need‐based but that was used to meet need is reported in the need‐based aid. The figure reported in this section is estimated, as of Fall 2010.
Need Based Non Need Scholarships/Grants Federal Scholarships/Grants $6,129,199 $1,573,327 State Scholarships/Grants $445,900 $717,379 Institutional (excluding athletic aid and tuition waivers) $556,022 $2,625,139 Scholarships/grants from external sources $123,735 $375,903 Total Scholarships/Grants $7,254,856 $5,291,748 Self‐Help Student Loans from all sources (excluding parent loans) $3,338,192 $12,156,743 Federal Work Study $847,900 $0 Total Self‐Help $4,186,092 $12,156,743
Parent Loans $189,300 $2,911,805 Tuition Waiver $16,688 $110,849 Athletic Awards $19,250 $918,625
Other
Federal23%
State4%
Institutional10%
External1%
Loans47%
Workstudy3%
Parent Loans9%
Waiver0.4%
Athletic3%
Fall 2010 Aid Awarded
38

Kentucky State University Financial Aid
Fact Book 2010‐2011
Undergraduate Received Financial Aid
Fall 2006 Fall 2007 Fall 2008 Fall 2009 Fall 2010 5‐Yr Change Total Undergraduate Enrolled 2,341 2,510 2,497 2,638 2,606 11%
Total Received any Disbursed Aid 1,893 2,010 1,954 2,135 2,151 14% Percent Disbursed 81% 80% 78% 81% 83% 2%
Total Awarded any Aid 1,952 2,070 2,024 2,168 2,185 12% Percent Awarded 83% 82% 81% 82% 84% 0%
Undergraduate Received any Disbursed Aid
Gender Race Fall 2006 Fall 2007 Fall 2008 Fall 2009 Fall 2010 5‐Yr Change Female Nonresident Alien 0 32 16 2 14 ‐‐
Black, Non Hispanic 674 723 687 772 787 17% American Indian/Alaskan 0 1 0 3 ‐‐ Asian/Pacific Islander 9 7 3 3 1 ‐89% Hispanic 4 2 4 18 12 200% White, Non Hispanic 361 335 293 305 298 ‐17% Unknown 35 84 120 147 178 409% Two or More Races 0 0 0 0 19 ‐‐ Hawaiian or Pacific Islander 0 0 0 0 0 ‐‐ Total Female 1083 1184 1123 1250 1309 21%
Male Nonresident Alien 0 25 16 4 11 ‐‐ Black, Non Hispanic 632 596 587 580 532 ‐16% American Indian/Alaskan 1 0 1 0 ‐100% Asian/Pacific Islander 15 8 4 4 2 ‐87% Hispanic 6 2 3 14 13 117% White, Non Hispanic 135 130 120 134 138 2% Unknown 21 65 100 149 133 533% Two or More Races 0 0 0 0 11 ‐‐ Hawaiian or Pacific Islander 0 0 0 0 2 ‐‐ Total Male 810 826 831 885 842 4%
39

Kentucky State University Financial Aid
Fact Book 2010‐2011
a) Number of degree‐seeking undergraduate students 585 1,992 229 b) Number of students in line a who applied for need‐based financial aid 557 1,825 188 c) Number of students in line b who were determined to have financial need 555 1,818 187 d) Number of students in line c who were awarded any financial aid 523 1,761 155 e) Number of students in line d who were awarded any need‐based scholarship or grant aid 423 1,432 100 f) Number of students in line d who were awarded any need‐based self‐help aid 480 1,605 130 g) Number of students in line d who were awarded any non‐need‐based scholarship or grant 239 688 19 h) Number of students in line d whose need was fully met (exclude PLUS loans, unsubsidized 56 247 31 loans, and private alternative loans) i) On average, the percentage of need that was met of students who were awarded any need‐ 53% 55% 38% based aid. Exclude any aid that was awarded in excess of need as well as any resources that were awarded to replace EFC (PLUS loans, unsubsidized loans, and private alternative loans) j) The average financial aid package of those in line d. Exclude any resources that were $10,765 $11,028 $6,191 to replace EFC (PLUS loans, unsubsidized loans, and private alternative loans) k) Average need‐based scholarship or grant awarded of those in line e $6,180 $5,920 $3,289 l) Average need‐based self‐help award (excluding PLUS loans, unsubsidized loans, and private $3,877 $4,438 $4,406 alternative loans) of those in line f m Average need‐based loan (excluding PLUS loans, unsubsidized loans, and private alternative $3,434 $3,988 $4,428 loans) of those in line f who received a need‐based loan
First‐time, full‐time freshmen
Full‐time under‐graduate
Part‐time under‐graduate
Number of enrolled degree‐seeking undergraduates who were awarded financial aid from any source. Aid that is non‐need‐based but that was used to meet need should be counted as need‐based aid. Note: in the chart below, students may be counted in more than one row.
Degree Seeking Undergraduate Received Financial Aid
Note: The aid received by students is the awarded aid, not disbursed, as used for the Common Data Sets.
40
Kentucky State University Financial Aid
Fact Book 2010‐2011
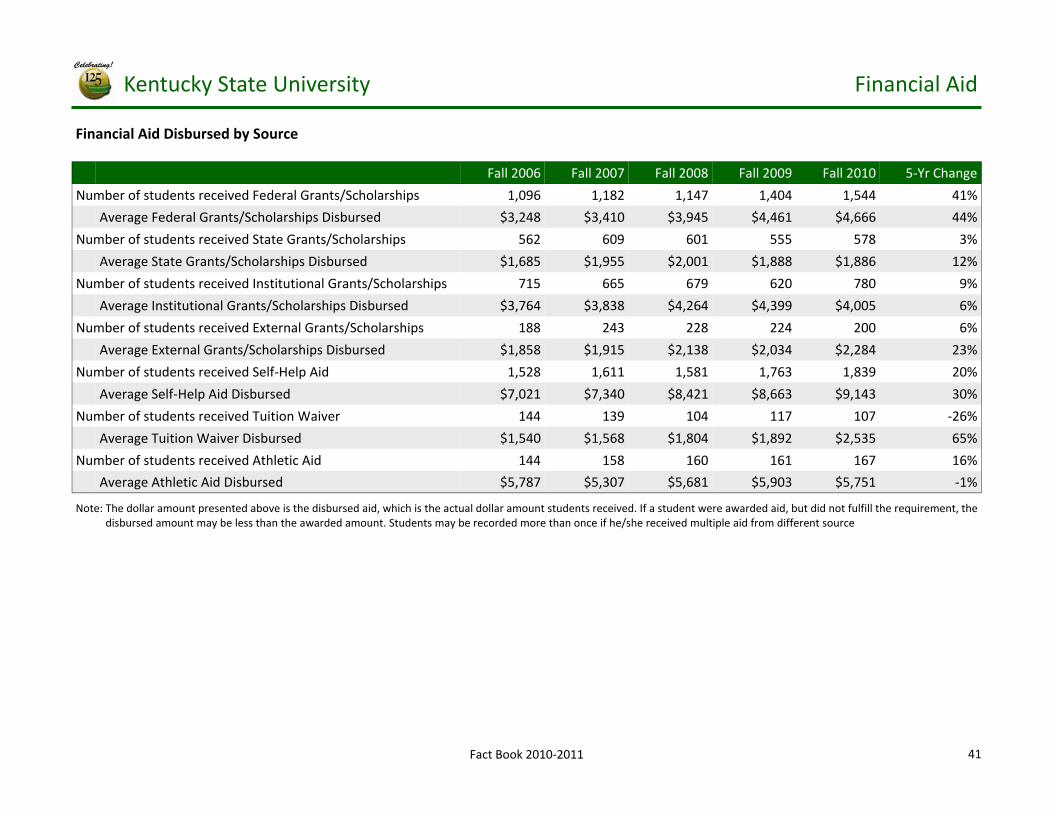
Financial Aid Disbursed by Source
Fall 2006 Fall 2007 Fall 2008 Fall 2009 Fall 2010 5‐Yr Change
Number of students received Federal Grants/Scholarships 1,096 1,182 1,147 1,404 1,544 41%
Average Federal Grants/Scholarships Disbursed $3,248 $3,410 $3,945 $4,461 $4,666 44%
Number of students received State Grants/Scholarships 562 609 601 555 578 3%
Average State Grants/Scholarships Disbursed $1,685 $1,955 $2,001 $1,888 $1,886 12%
Number of students received Institutional Grants/Scholarships 715 665 679 620 780 9%
Average Institutional Grants/Scholarships Disbursed $3,764 $3,838 $4,264 $4,399 $4,005 6%
Number of students received External Grants/Scholarships 188 243 228 224 200 6%
Average External Grants/Scholarships Disbursed $1,858 $1,915 $2,138 $2,034 $2,284 23%
Number of students received Self‐Help Aid 1,528 1,611 1,581 1,763 1,839 20%
Average Self‐Help Aid Disbursed $7,021 $7,340 $8,421 $8,663 $9,143 30%
Number of students received Tuition Waiver 144 139 104 117 107 ‐26%
Average Tuition Waiver Disbursed $1,540 $1,568 $1,804 $1,892 $2,535 65%
144 158 160 161 167 16%
Average Athletic Aid Disbursed $5,787 $5,307 $5,681 $5,903 $5,751 ‐1%
Number of students received Athletic Aid
Note: The dollar amount presented above is the disbursed aid, which is the actual dollar amount students received. If a student were awarded aid, but did not fulfill the requirement, the disbursed amount may be less than the awarded amount. Students may be recorded more than once if he/she received multiple aid from different source
41

Kentucky State University Financial Aid
Fact Book 2010‐2011
Undergraduate Received any Athletic Aid Disbursed
Gender Race Fall 2006 Fall 2007 Fall 2008 Fall 2009 Fall 2010 5‐Yr Change Female Nonresident Alien 0 0 0 0 0 ‐‐
Black, Non Hispanic 34 43 34 35 39 15% American Indian/Alaskan 0 0 0 0 0 ‐‐ Asian/Pacific Islander 0 0 0 0 0 ‐‐ Hispanic 0 0 1 2 3 ‐‐ White, Non Hispanic 7 2 4 2 2 ‐71% Unknown 2 4 3 5 7 250% Two or More Races 0 0 0 0 0 ‐‐ Hawaiian or Pacific Islander 0 0 0 0 0 ‐‐ Total Female 43 49 42 44 51 19%
Male Nonresident Alien 0 2 2 1 1 ‐‐ Black, Non Hispanic 90 94 93 84 77 ‐14% American Indian/Alaskan 0 0 0 0 0 ‐‐ Asian/Pacific Islander 1 1 0 0 0 ‐100% Hispanic 2 0 1 2 3 50% White, Non Hispanic 8 6 4 13 16 100% Unknown 0 6 18 17 16 ‐‐ Two or More Races 0 0 0 0 2 ‐‐ Hawaiian or Pacific Islander 0 0 0 0 1 ‐‐ Total Male 101 109 118 117 116 15%
42

Kentucky State University Financial Aid
Fact Book 2010‐2011
Athletic Aid Disbursed by Sport
Sport Fall 2006 Fall 2007 Fall 2008 Fall 2009 Fall 2010 5‐Yr Change Football Number of Students 59 67 71 69 74 25%
Softball Number of Students 13 23 12 16 16 23% Total Aid Disbursed $25,160 $38,300 $49,000 $54,050 $74,100 195%
Volleyball Number of Students 9 10 10 11 10 11% Total Aid Disbursed $53,945 $50,089 $52,800 $78,750 $74,500 38%
All Sports Number of Students 158 165 166 178 182 15% Total Aid Disbursed $833,376 $838,507 $908,933 $950,437 $960,422 15%
Total Aid Disbursed $381,903 $367,727 $395,089 $410,351 $389,971 2% Baseball Number of Students 12 12 17 21 12 0%
Total Aid Disbursed $21,700 $24,086 $29,100 $52,543 $41,514 91% Basketball Number of Students 33 28 27 27 24 ‐27%
Total Aid Disbursed $289,618 $297,637 $322,324 $261,766 $255,710 ‐12% CC/Track Number of Students 30 23 27 29 37 23%
Total Aid Disbursed $51,049 $50,669 $52,620 $76,976 $101,370 99% Golf Number of Students 2 2 2 5 9 350%
Total Aid Disbursed $10,000 $10,000 $8,000 $16,000 $23,257 133%
43

ACADEMIC MAJORACADEMIC MAJOR
Fact Book 2010‐2011

Kentucky State University Academic Majors
Fact Book 2010‐2011
Academic Fields of Study
With Number of Semester Credit Hours Required for Completion
College of Arts, Social Sciences, and Interdisciplinary Studies ASSOCIATE OF ARTS DEGREE BACHELOR OF ARTS DEGREE PROGRAMS LEADING TO TEACHER CERTIFICATION Majors Art AUTHORIZED BY THE ED PROF STANDARD BOARD Liberal Studies Art with Teaching Certification (137) Art Education (137) Option: Seminar‐based Honors Studio Art (132) (Minor required) English Education (125) Program (64) Studio Art with one area of specialization Music Education (141‐142) Option: General Liberal Studies required from Art History, Ceramics, Digital Option: Instrumental Core (64) Imaging, Drawing, Painting, Photography, Option: Keyboard or Sculpture (130) Option: Vocal English (120) Social Studies Education (122) BACHELOR OF MUSIC DEGREE English: Creative Writing Majors English: Literature MINOR PROGRAMS Music Education with Teaching English with Secondary Certification (125) African‐American Studies (18) Certification General Social Sciences English (21) Instrumental (141) Specializations: French (18) Keyboard (142) History (131) (Minor required) History (21) Vocal (139) Sociology (128) (Minor required) International Studies (21) Music Performance (131‐136) Social Studies Education (CA, 122) Journalism (21) Instrumental Liberal Studies Liberal Studies (18) Keyboard Option: Honors (128) (Minor or Second Music Performance (21) Vocal Major Required) Philosophy (18) Option: Student‐designed (120) Political Science (18) BACHELOR OF ARTS DEGREE Option: General Studies (120) Psychology (18) Majors Mass Communication and Journalism (120) Sociology (18) Africana Studies (120) Music (128) Spanish (18) Interdisciplinary Early Childhood Political Science (128) (Minor Required) Speech Communication (18) Education (IECE) (Birth to Primary Psychology (120) (Minor Required) Studio Art (21) Certification) (130) Spanish (120) Theatre (18)
* Teaching minors are available only to students who have teaching majors
45

Kentucky State University Academic Majors
Fact Book 2010‐2011
College of Mathematics, Science, Technology, and Health ASSOCIATE IN APPLIED SCIENCE DEGREE BACHELOR OF SCIENCE DEGREE MASTER OF SCIENCE IN ENVIRONMENTAL Majors Majors STUDIES DEGREE (30) Computer Graphics and Multimedia Biology (128‐140) Production Technology (60) Biology with Teaching Certification Computer Electronics Technology (60) (136‐137) Nursing (70) Biotechnology track PROGRAMS LEADING TO TEACHER General Track CERTIFICATION AUTHORIZED BY THE BACHELOR OF ARTS DEGREE Pre‐Professional Track EDUCATIONAL PROFESSIONAL Majors Chemistry (128) STANDARDS BOARD Mathematics (128‐137) Computer Science Biology Education (136‐137) Mathematics/Applied Option: Business (123) Computer Science Endorsement (23) (Pre‐Engineering) Option: Information Security (123) Mathematics Education (125) Pure Mathematics Option: Mathematics (129‐133) Mathematics with Teaching Nursing (128) Certification (125) Actuarial Science MINOR PROGRAMS Double major in Mathematics and MASTER OF SCIENCE IN COMPUTER Applied Information Technology (21) Computer Science SCIENCE TECHNOLOGY DEGREE (30‐36) Aquaculture (19) Information Technology Biology (21) BACHELOR OF SCIENCE DEGREE Security and Network Chemistry (20) Majors Computer Information Systems (21) Applied Information Technology (128) Computer Science (21) Option: Web Development MASTER OF SCIENCE IN AQUACULTURE/ Mathematics (19) Option: Network Engineering AQUATIC SCIENCES DEGREE (37) Physics (20)
* Teaching minors are available only to students who have teaching majors
46

Kentucky State University Academic Majors
Fact Book 2010‐2011
College of Professional Studies BACHELOR OF ARTS DEGREE MASTER OF ARTS IN SPECIAL EDUCATION PROGRAMS LEADING TO TEACHER Business Administration (120) WITH CERTIFICATION (LBD, P‐12) (30) CERTIFICATION AUTHORIZED BY THE Specializations: EDUCATIONAL PROFESSIONAL Accounting MASTER OF BUSINESS ADMINISTRATION STANDARDS BOARD Finance DEGREE (30) Physical Education and Health (143) General Business Management MASTER OF PUBLIC ADMINISTRATION Management Information Systems DEGREE (42) MINOR PROGRAMS Marketing Specialty Areas: Accounting (18) Child Development and Family Human Resource Management Athletic Coaching (23) Relations (Non‐Teaching) (128) Management Information Systems (MIS) Athletic Training (26) Criminal Justice (128) International Development Child Development and Family Relations (18) Elementary Education (125) Nonprofit Management Criminal Justice (18) Physical Education (Non‐Teaching) (144) Economics (18) (Minor required) PROGRAMS LEADING TO TEACHER Finance (21) Public Administration (131) CERTIFICATION AUTHORIZED BY THE Gerontology (21) Social Work (133) EDUCATIONAL PROFESSIONAL Management (21) STANDARDS BOARD Marketing (21) BACHELOR OF SCIENCE DEGREE Elementary Education (125) Public Administration (18) Physical Education and Health Interdisciplinary Early Childhood Education Recreation (27) (Teaching) (143) (Birth to Primary Certification) (130) Sports Management (24)
* Teaching minors are available only to students who have teaching majors
47

Kentucky State University Academic Majors
Fact Book 2010‐2011
Academic Fields of Study
Fall 2006 Fall 2007 Fall 2008 Fall 2009 Fall 2010 5‐Yr Change ASSOCIATE DEGREE
Office Administration 3 2 0 0 0 ‐100% Computer Electronic Technology 11 11 14 13 13 18% Computer Graphic & Multimedia 10 12 11 8 8 ‐20% Liberal Studies (Total) 13 5 5 9 23 77% Liberal Studies AA Whitney Young 13 5 4 7 23 77% Liberal Studies AA Whitney Young (Honors) 0 0 1 2 0 ‐‐ Nursing 251 292 268 287 329 31%
BACHELOR DEGREE Applied Information Technology (Total) 20 28 34 39 42 110% No Specialization 18 24 31 27 32 78% Network Engineering 2 4 3 7 4 100% Web Development 0 0 0 5 6 ‐‐ African Studies 0 0 0 0 1 ‐‐ Biology (Total) 113 113 132 131 152 35% No Specialization 66 82 105 102 122 85% Teaching Certification 5 3 2 6 6 20% General Track 32 20 7 3 1 ‐97% Pre‐Professional Track 10 7 18 20 23 130% Business Administration (Total) 354 385 357 316 294 ‐17% No Specialization 189 220 221 191 192 2% Accounting 42 46 33 28 27 ‐36% Finance 0 3 8 8 2 ‐‐ General Business 58 49 28 23 16 ‐72% Management 32 35 39 31 24 ‐25% Management Information System 1 2 2 2 0 ‐100% Marketing 32 32 26 32 33 3%
Major
48

Kentucky State University Academic Majors
Fact Book 2010‐2011
Fall 2006 Fall 2007 Fall 2008 Fall 2009 Fall 2010 5‐Yr Change BACHELOR DEGREE
Child Development & Family Relations 32 30 27 38 26 ‐19% Chemistry 12 11 13 16 24 100% Criminal Justice 127 117 141 157 179 41% Computer Science (Total) 97 73 60 66 67 ‐31% No Specialization 67 56 49 57 59 ‐12% Business 19 10 9 5 5 ‐74% Information Security 4 2 0 1 2 ‐50% Mathematics 7 5 2 3 1 ‐86% Interdisciplinary Early Childhood Education 5 19 19 21 25 400% Elementary Education 115 102 109 137 143 24% English (Total) 46 54 40 43 40 ‐13% No Specialization 36 39 29 26 27 ‐25% Creative Writing 0 2 0 3 4 ‐‐ Secondary Certification 10 13 11 13 8 ‐20% Literature 0 0 0 1 1 ‐‐ Liberal Studies (Total) 22 39 47 68 62 182% Liberal Studies BA Arts & Sci.(Designed) 2 8 4 7 6 200% Liberal Studies BA Whitney Young (Honors) 4 12 18 17 15 275% Liberal Studies BA General Studies 16 19 25 44 41 156% Mathematics (Total) 47 46 46 60 61 30% No Specialization 27 28 30 43 44 63% Applied Math 10 7 7 9 7 ‐30% Teaching Certification 5 6 4 5 7 40% Pure Math 4 4 4 2 1 ‐75% Actuarial Science 1 1 1 1 2 100%
Major
49
Kentucky State University Academic Majors
Fact Book 2010‐2011
Fall 2006 Fall 2007 Fall 2008 Fall 2009 Fall 2010 5‐Yr Change BACHELOR DEGREE
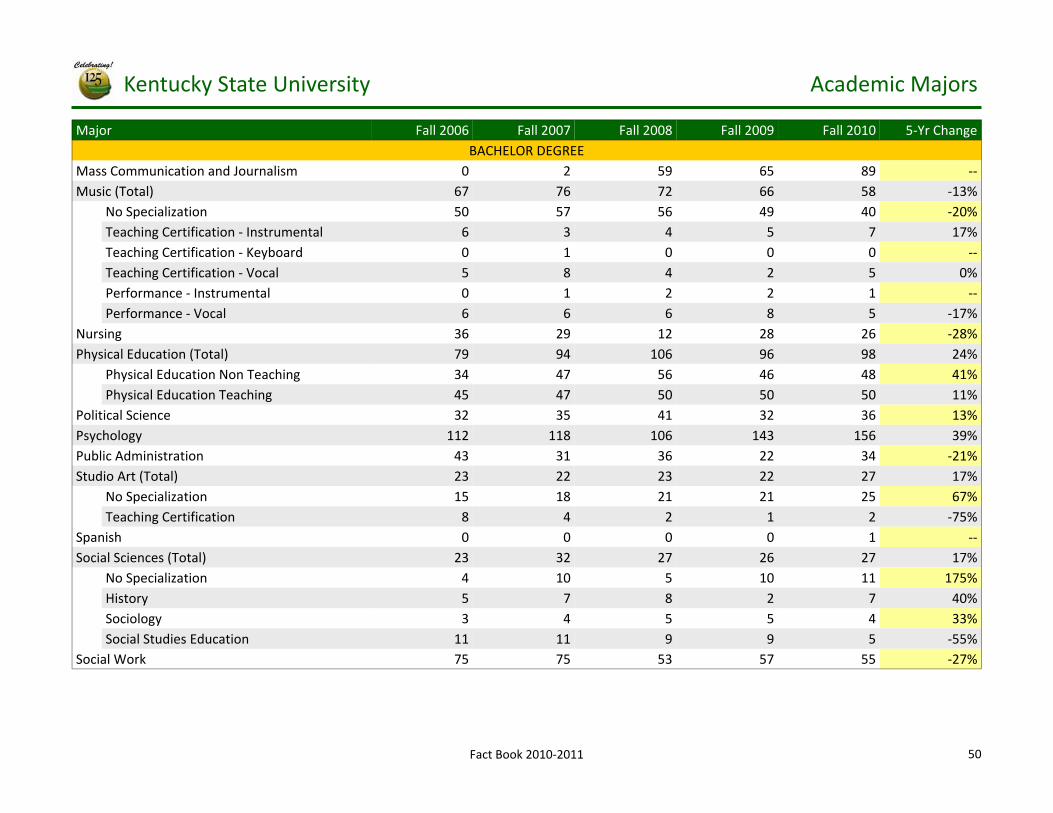
Mass Communication and Journalism 0 2 59 65 89 ‐‐ Music (Total) 67 76 72 66 58 ‐13% No Specialization 50 57 56 49 40 ‐20% Teaching Certification ‐ Instrumental 6 3 4 5 7 17% Teaching Certification ‐ Keyboard 0 1 0 0 0 ‐‐ Teaching Certification ‐ Vocal 5 8 4 2 5 0% Performance ‐ Instrumental 0 1 2 2 1 ‐‐ Performance ‐ Vocal 6 6 6 8 5 ‐17% Nursing 36 29 12 28 26 ‐28% Physical Education (Total) 79 94 106 96 98 24% Physical Education Non Teaching 34 47 56 46 48 41% Physical Education Teaching 45 47 50 50 50 11% Political Science 32 35 41 32 36 13% Psychology 112 118 106 143 156 39% Public Administration 43 31 36 22 34 ‐21% Studio Art (Total) 23 22 23 22 27 17% No Specialization 15 18 21 21 25 67% Teaching Certification 8 4 2 1 2 ‐75% Spanish 0 0 0 0 1 ‐‐ Social Sciences (Total) 23 32 27 26 27 17% No Specialization 4 10 5 10 11 175% History 5 7 8 2 7 40% Sociology 3 4 5 5 4 33% Social Studies Education 11 11 9 9 5 ‐55% Social Work 75 75 53 57 55 ‐27%
Major
50

Kentucky State University Academic Majors
Fact Book 2010‐2011
Major Fall 2006 Fall 2007 Fall 2008 Fall 2009 Fall 2010 5‐Yr Change MASTER DEGREE
Aquaculture/Aquatic Sciences 14 10 14 10 15 7% Computer Science 27 19 20 26 35 30% Environmental Studies 0 0 0 0 16 ‐‐ Business Administration 22 19 22 22 23 5% Special Education 0 50 53 69 75 ‐‐ Public Administration (Total) 91 70 48 54 69 ‐24% No Specialization 83 65 43 52 69 ‐17% Human Resource Management 5 2 4 2 0 ‐100% International Development 2 3 1 0 0 ‐100% Management Information Systems 1 0 0 0 0 ‐100%
OTHER Non Degree 276 327 293 327 179 ‐35% Undeclared 302 346 351 360 337 12% Teaching Certification Fall 2006 Fall 2007 Fall 2008 Fall 2009 Fall 2010 5‐Yr Change
PROGRAM LEADING TO TEACHER CERTIFICATION BY KENTUCKY DEPARTMENT OF EDUCATION
Music Education ‐ Instrumental 6 3 4 5 7 17% Music Education ‐ Keyboard 0 1 0 0 0 ‐‐ Music Education ‐ Vocal 5 8 4 2 5 0% Physical Education Teaching 45 47 50 50 50 11% Social Studies Education 11 11 9 9 5 ‐55%
Art Education 8 4 2 1 2 ‐75% Biology Education 5 3 2 6 6 20% Elementary Education 115 102 109 137 143 24% Interdisciplinary Early Childhood Education 5 19 19 21 25 400% Mathematics Education 5 6 4 5 7 40%
51

Kentucky State University Academic Majors
Fact Book 2010‐2011
Minor Fall 2006 Fall 2007 Fall 2008 Fall 2009 Fall 2010 5‐Yr Change MINOR PROGRAMS
African‐American Studies 0 0 0 0 1 ‐‐ Accounting 4 7 7 6 8 100% Applied Information Technology 0 0 0 0 1 ‐‐ Athletic Coaching 1 5 4 6 12 1100% Athletic Training 8 5 5 6 7 ‐13% Aquaculture 0 0 1 2 2 ‐‐ Biology 1 1 1 1 3 200% Child Development & Family Relations 5 2 2 5 6 20% Chemistry 15 10 16 12 14 ‐7% Computer Information System 2 2 0 2 1 ‐50% Criminal Justice 9 9 10 12 10 11% Computer Science 1 2 2 0 1 0% Economics 1 1 1 1 2 100% Elementary Education 0 0 1 1 0 ‐‐ English 1 2 2 3 3 200% Finance 6 6 2 2 2 ‐67% Gerontology 10 4 2 0 0 ‐100% History 4 6 3 0 1 ‐75% International Studies 0 0 0 0 1 ‐‐ Journalism 4 6 3 1 4 0% Liberal Studies 2 2 4 2 2 0% Mathematics 2 3 7 7 3 50% Management 7 8 6 10 8 14% Marketing 11 5 10 9 5 ‐55% Music Performance 0 2 1 1 0 ‐‐
52

Kentucky State University Academic Majors
Fact Book 2010‐2011
Minor Fall 2006 Fall 2007 Fall 2008 Fall 2009 Fall 2010 5‐Yr Change MINOR PROGRAMS
Philosophy 2 3 3 4 4 100% Physics 1 1 1 0 0 ‐100% Political Science 3 1 3 4 2 ‐33% Psychology 5 5 9 11 10 100% Public Administration 8 8 6 2 2 ‐75% Recreation 4 6 3 1 1 ‐75% Studio Art 0 2 1 1 2 ‐‐ Sociology 5 0 2 3 4 ‐20% Spanish 9 10 12 13 14 56% Speech Management 2 1 1 0 1 ‐50% Sport Management 3 1 3 5 7 133% Theatre 4 4 4 3 1 ‐75%

ENROLLMENTENROLLMENT
Fact Book 2010‐2011

Kentucky State University Enrollment
Fact Book 2010‐2011
KSU First‐Time Freshmen Enrollment
Degree Fall 2006 Fall 2007 Fall 2008 Fall 2009 Fall 2010 5‐Yr Change Associate 60 90 90 72 97 62% Baccalaureate 332 401 402 313 373 12% Undeclared 150 187 195 155 165 10% Total First‐Time Freshmen 542 678 687 540 635 17%
Status Residency Fall 2006 Fall 2007 Fall 2008 Fall 2009 Fall 2010 5‐Yr Change
Full‐Time In‐State 242 276 189 217 218 ‐10%
Out‐of‐State 291 386 475 309 394 35%
Total Full‐Time 533 662 664 526 612 15%
Part‐Time In‐State 5 16 6 9 6 20%
Out‐of‐State 4 0 17 5 17 325%
Total Part‐Time 9 16 23 14 23 156%
542 678 687 540 635 17% Total First‐Time Freshmen
0
100
200
300
400
500
600
700
Fall 2006 Fall 2007 Fall 2008 Fall 2009 Fall 2010
First‐Time Freshmen by Status
Full‐Time Part‐Time
0
100
200
300
400
500
600
Fall 2006 Fall 2007 Fall 2008 Fall 2009 Fall 2010
First‐Time Freshmen by Residency
In‐State Out‐of‐State
0
50
100
150
200
250
300
350
400
450
Fall 2006 Fall 2007 Fall 2008 Fall 2009 Fall 2010
First‐Time Freshmen by Degree
Associate Bachelor Undeclared
55

Kentucky State University Enrollment
Fact Book 2010‐2011
KSU First‐Time Freshmen Enrollment by Gender, Race, and Age
Gender Race Fall
2006 Fall
2007 Fall
2008 Fall
2009 Fall
2010 5‐Yr
Change
Female Nonresident Alien 0 1 1 0 0 ‐‐
Black, Non Hispanic 214 284 264 211 240 12%
American Indian/Alaskan 0 1 0 0 0 ‐‐
Asian 1 0 0 1 0 ‐100%
Hispanic 0 2 2 4 2 ‐‐
White, Non Hispanic 48 49 35 32 29 ‐40%
Unknown 3 42 69 55 79 2533%
Two or More Races 0 0 0 0 7 ‐‐
Total Female 266 379 371 303 357 34%
Male Nonresident Alien 0 1 1 0 0 ‐‐
Black, Non Hispanic 248 231 220 155 191 ‐23%
American Indian/Alaskan 0 0 0 0 0 ‐‐
Asian 2 3 0 1 0 ‐100%
Hispanic 3 1 2 4 3 0%
White, Non Hispanic 20 22 28 29 29 45%
Unknown 3 41 65 48 49 1533%
Two or More Races 0 0 0 0 6 ‐‐
Total Male 276 299 316 237 278 1%
Gender Age Fall
2006 Fall
2007 Fall
2008 Fall
2009 Fall
2010 5‐Yr
Change
Female Under 18 0 10 2 5 2 ‐‐
18‐19 237 324 346 263 334 41%
20‐21 15 19 13 19 10 ‐33%
22‐24 3 8 3 9 2 ‐33%
25‐29 5 11 5 6 3 ‐40%
30‐34 2 5 1 1 2 0%
35‐39 3 2 0 0 2 ‐33%
40‐49 1 0 1 0 2 100%
Total Female 266 379 371 303 357 34%
Male Under 18 1 6 2 0 0 ‐100%
18‐19 236 255 283 192 242 3%
20‐21 29 24 22 24 26 ‐10%
22‐24 3 8 7 10 1 ‐67%
25‐29 3 3 2 6 5 67%
30‐34 3 1 0 2 3 0%
35‐39 1 2 0 1 0 ‐100%
40‐49 0 0 0 2 1 ‐‐
Total Male 276 299 316 237 278 1%
56

Kentucky State University Enrollment
Fact Book 2010‐2011
KSU First‐Time Freshmen Enrollment by Major
Major Fall 2006 Fall 2007 Fall 2008 Fall 2009 Fall 2010 5‐Yr Change Undeclared 150 187 195 155 165 10% Mass Communication & Journalism 0 0 25 12 21 ‐‐ Computer Sciences 16 18 11 15 15 ‐6% Information Technology 0 0 0 0 1 ‐‐ Web Multimedia 8 1 2 0 0 ‐100% Elementary Education 26 21 24 28 24 ‐8% Physical Education 20 23 20 15 21 5% Electronic Technology 6 4 10 4 8 33% Drafting 1 9 6 6 5 400% Spanish 0 0 0 0 1 ‐‐ Human Development & Family Studies 6 9 6 7 2 ‐67% English 9 12 9 1 6 ‐33% Liberal Arts 7 8 4 5 4 ‐43% Biology 21 27 43 30 42 100% Mathematics 11 5 9 14 14 27% Chemistry 2 6 3 5 10 400% Psychology 25 38 28 33 37 48% Criminal Justice 24 34 44 37 39 63% Public Administration 1 0 2 0 2 100% Social Work 10 14 14 14 7 ‐30% Social Sciences 1 7 3 2 3 200% Political Sciences 7 5 7 5 11 57% Fine/Studio Arts 5 6 9 3 5 0% Music 24 38 27 16 18 ‐25% Nursing 60 86 74 65 85 42% Business 102 119 112 68 89 ‐13% Executive Assistant/Secretary 0 1 0 0 0 ‐‐ Total First‐Time Freshmen 542 678 687 540 635 17%
57

Kentucky State University Enrollment
Fact Book 2010‐2011
KSU First‐Time Freshmen Enrollment by State Origin
State Origin Fall
2006 Fall
2007 Fall
2008 Fall
2009 Fall
2010 5‐Yr
Change State Origin
Fall 2006
Fall 2007
Fall 2008
Fall 2009
Fall 2010
5‐Yr Change
Alabama 1 7 1 2 3 200% Michigan 48 110 119 71 92 92%
Alaska 1 0 0 0 0 ‐100% Minnesota 0 0 0 1 0 ‐‐
Arizona 0 1 0 0 0 ‐‐ Mississippi 0 0 0 1 2 ‐‐
California 4 2 5 6 7 75% Missouri 3 7 10 14 14 367%
Colorado 1 0 1 0 1 0% Nebraska 0 1 0 0 0 ‐‐
Connecticut 0 0 3 2 1 ‐‐ New Jersey 1 1 2 2 2 100%
Delaware 0 1 0 0 1 ‐‐ New York 8 6 4 0 2 ‐75%
District of Columbia 1 6 12 6 5 400% North Carolina 1 0 6 2 1 0%
Florida 1 0 7 4 10 900% Ohio 102 117 137 89 100 ‐2%
Georgia 19 12 13 2 6 ‐68% Oklahoma 0 0 1 0 0 ‐‐
Illinois 42 47 95 59 100 138% Pennsylvania 3 2 4 0 1 ‐67%
Indiana 41 39 44 43 51 24% South Carolina 3 0 0 0 0 ‐100%
Kansas 0 1 1 0 0 ‐‐ Tennessee 14 7 5 4 4 ‐71%
Kentucky 234 291 195 218 221 ‐6% Texas 2 0 0 2 1 ‐50%
Louisiana 1 2 0 0 0 ‐100% Virginia 4 7 3 1 1 ‐75%
Maine 1 0 0 0 0 ‐100% West Virginia 0 0 2 0 2 ‐‐
Maryland 1 1 5 6 2 100% Wisconsin 1 7 8 5 4 300%
Massachusetts 2 0 1 0 1 ‐50% Foreign Countries 2 3 3 0 0 ‐100%
58

Kentucky State University Enrollment
Fact Book 2010‐2011
KSU First‐Time Freshmen Enrollment by State Origin
59
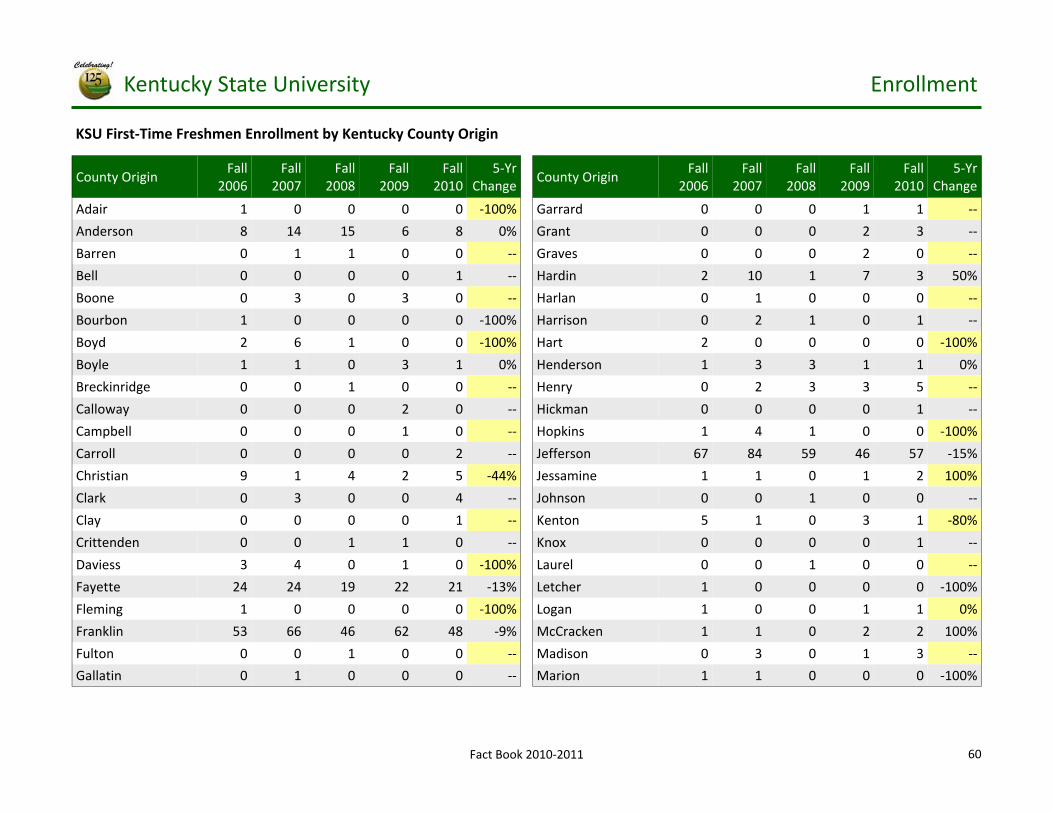
Kentucky State University Enrollment
Fact Book 2010‐2011
KSU First‐Time Freshmen Enrollment by Kentucky County Origin
County Origin Fall
2006 Fall
2007 Fall
2008 Fall
2009 Fall
2010 5‐Yr
Change County Origin
Fall 2006
Fall 2007
Fall 2008
Fall 2009
Fall 2010
5‐Yr Change
Adair 1 0 0 0 0 ‐100% Garrard 0 0 0 1 1 ‐‐
Anderson 8 14 15 6 8 0% Grant 0 0 0 2 3 ‐‐
Barren 0 1 1 0 0 ‐‐ Graves 0 0 0 2 0 ‐‐
Bell 0 0 0 0 1 ‐‐ Hardin 2 10 1 7 3 50%
Boone 0 3 0 3 0 ‐‐ Harlan 0 1 0 0 0 ‐‐
Bourbon 1 0 0 0 0 ‐100% Harrison 0 2 1 0 1 ‐‐
Boyd 2 6 1 0 0 ‐100% Hart 2 0 0 0 0 ‐100%
Boyle 1 1 0 3 1 0% Henderson 1 3 3 1 1 0%
Breckinridge 0 0 1 0 0 ‐‐ Henry 0 2 3 3 5 ‐‐
Calloway 0 0 0 2 0 ‐‐ Hickman 0 0 0 0 1 ‐‐
Campbell 0 0 0 1 0 ‐‐ Hopkins 1 4 1 0 0 ‐100%
Carroll 0 0 0 0 2 ‐‐ Jefferson 67 84 59 46 57 ‐15%
Christian 9 1 4 2 5 ‐44% Jessamine 1 1 0 1 2 100%
Clark 0 3 0 0 4 ‐‐ Johnson 0 0 1 0 0 ‐‐
Clay 0 0 0 0 1 ‐‐ Kenton 5 1 0 3 1 ‐80%
Crittenden 0 0 1 1 0 ‐‐ Knox 0 0 0 0 1 ‐‐
Daviess 3 4 0 1 0 ‐100% Laurel 0 0 1 0 0 ‐‐
Fayette 24 24 19 22 21 ‐13% Letcher 1 0 0 0 0 ‐100%
Fleming 1 0 0 0 0 ‐100% Logan 1 0 0 1 1 0%
Franklin 53 66 46 62 48 ‐9% McCracken 1 1 0 2 2 100%
Fulton 0 0 1 0 0 ‐‐ Madison 0 3 0 1 3 ‐‐
Gallatin 0 1 0 0 0 ‐‐ Marion 1 1 0 0 0 ‐100%
60

Kentucky State University Enrollment
Fact Book 2010‐2011
KSU First‐Time Freshmen Enrollment by Kentucky County Origin
County Origin Fall
2006 Fall
2007 Fall
2008 Fall
2009 Fall
2010 5‐Yr
Change County Origin
Fall 2006
Fall 2007
Fall 2008
Fall 2009
Fall 2010
5‐Yr Change
Mason 0 1 2 1 0 ‐‐ Shelby 14 17 13 16 14 0%
Meade 0 2 0 0 0 ‐‐ Simpson 1 1 0 3 0 ‐100%
Monroe 0 1 0 1 0 ‐‐ Spencer 0 3 0 2 0 ‐‐
Montgomery 0 0 0 0 1 ‐‐ Todd 1 0 0 0 0 ‐100%
Nelson 4 0 0 3 0 ‐100% Trigg 3 0 0 0 0 ‐100%
Oldham 1 2 0 0 1 0% Union 0 1 0 0 1 ‐‐
Owen 12 9 10 12 13 8% Warren 4 2 1 0 8 100%
Perry 2 0 1 0 0 ‐100% Washington 1 0 0 1 0 ‐100%
Pike 0 0 0 1 0 ‐‐ Wayne 1 0 1 0 0 ‐100%
Pulaski 0 1 0 0 0 ‐‐ Webster 0 0 1 0 0 ‐‐
Rowan 0 0 2 0 0 ‐‐ Woodford 4 7 4 3 5 25%
Scott 0 7 1 2 5 ‐‐ Non Kentucky 308 387 492 322 414 34%
61

Kentucky State University Enrollment
Fact Book 2010‐2011
KSU First‐Time Freshmen Enrollment by Kentucky County Origin
62

Kentucky State University Enrollment
Fact Book 2010‐2011
KSU First‐Time Transfer Undergraduate Enrollment
Status Residency Fall 2006 Fall 2007 Fall 2008 Fall 2009 Fall 2010 5‐Yr Change
Full‐Time In‐State 43 43 44 65 68 58%
Out‐of‐State 26 26 30 27 43 65%
Total Full‐Time 69 69 74 92 111 61%
Part‐Time In‐State 19 23 13 19 35 84%
Out‐of‐State 1 2 3 5 2 100%
Total Part‐Time 20 25 16 24 37 85%
89 94 90 116 148 66% Total First‐Time Transfer
Degree Fall 2006 Fall 2007 Fall 2008 Fall 2009 Fall 2010 5‐Yr Change Associate 23 20 16 22 43 87% Baccalaureate 53 55 57 72 85 60% Undeclared 13 19 17 22 20 54% Total First‐Time Transfer 89 94 90 116 148 66%
0
20
40
60
80
100
120
Fall 2006 Fall 2007 Fall 2008 Fall 2009 Fall 2010
First‐Time Transfer by Status
Full‐Time Part‐Time
0
20
40
60
80
100
120
Fall 2006 Fall 2007 Fall 2008 Fall 2009 Fall 2010
First‐Time Transfer by Residency
In‐State Out‐of‐State
0
10
20
30
40
50
60
70
80
90
Fall 2006 Fall 2007 Fall 2008 Fall 2009 Fall 2010
First‐Time Transfer by Degree
Associate Bachelor Undeclared
63

Kentucky State University Enrollment
Fact Book 2010‐2011
KSU First‐Time Transfer Enrollment by Gender, Race and Age
Gender Race Fall 2006
Fall 2007
Fall 2008
Fall 2009
Fall 2010
5‐Yr Change
Female Nonresident Alien 0 1 3 2 2 ‐‐
Black, Non Hispanic 24 17 16 21 35 46%
American Indian/Alaskan 0 0 0 0 0 ‐‐
Asian 0 1 0 1 0 ‐‐
Hispanic 0 0 0 0 3 ‐‐
White, Non Hispanic 27 25 28 32 46 70%
Unknown 2 6 6 13 10 400%
Two or More Races 0 0 0 0 2 ‐‐
Total Female 53 50 53 69 98 85%
Male Nonresident Alien 0 0 0 1 3 ‐‐
Black, Non Hispanic 20 24 19 21 13 ‐35%
American Indian/Alaskan 1 1 0 0 0 ‐100%
Asian 1 0 0 1 0 ‐100%
Hispanic 0 1 0 0 0 ‐‐
White, Non Hispanic 13 13 12 12 22 69%
Unknown 1 5 6 12 9 800%
Two or More Races 0 0 0 0 3 ‐‐
Total Male 36 44 37 47 50 39%
Gender Age Fall 2006
Fall 2007
Fall 2008
Fall 2009
Fall 2010
5‐Yr Change
Female Under 18 12 7 7 7 19 58%
18‐19 12 7 14 20 21 75%
20‐21 12 7 9 8 11 ‐8%
22‐24 9 15 5 12 16 78%
25‐29 4 7 3 3 9 125%
30‐34 3 4 10 4 11 267%
35‐39 1 3 4 12 7 600%
40‐49 0 0 1 3 4 ‐‐
Total Female 53 50 53 69 98 85%
Male Under 18 7 4 5 7 10 43%
18‐19 16 17 18 10 16 0%
20‐21 5 7 7 14 11 120%
22‐24 7 4 3 4 3 ‐57%
25‐29 0 4 1 3 5 ‐‐
30‐34 1 1 1 5 2 100%
35‐39 0 5 1 2 3 ‐‐
40‐49 0 2 1 2 0 ‐‐
Total Male 36 44 37 47 50 39%
64

Kentucky State University Enrollment
Fact Book 2010‐2011
KSU First‐Time Transfer Enrollment by Major
Major Fall 2006 Fall 2007 Fall 2008 Fall 2009 Fall 2010 5‐Yr Change Undeclared 13 19 17 22 20 54% African Studies 0 0 0 0 1 ‐‐ Mass Communication & Journalism 0 0 2 3 3 ‐‐ Computer Sciences 5 1 2 2 8 60% Information Technology 0 0 0 2 2 ‐‐ Web Multimedia 0 1 2 0 0 ‐‐ Elementary Education 4 8 4 11 6 50% Physical Education 4 3 7 4 6 50% Electronic Technology 1 2 0 0 0 ‐100% Drafting 1 0 0 0 0 ‐100% Human Development & Family Studies 0 0 1 0 0 ‐‐ English 0 1 2 4 3 ‐‐ Liberal Arts 1 2 3 4 1 0% Biology 2 6 4 4 7 250% Mathematics 2 2 2 2 2 0% Psychology 7 6 4 8 16 129% Criminal Justice 12 5 6 3 7 ‐42% Public Administration 0 2 2 2 6 ‐‐ Social Work 1 2 2 1 2 100% Social Sciences 0 2 1 2 1 ‐‐ Political Sciences 2 1 1 1 2 0% Fine/Studio Arts 1 0 1 1 0 ‐100% Music 1 0 0 3 2 100% Nursing 23 20 15 29 44 91% Business 9 11 12 8 9 0% Total First‐Time Transfer 89 94 90 116 148 66%
65

Kentucky State University Enrollment
Fact Book 2010‐2011
KSU First‐Time Transfer Undergraduate Enrollment by State Origin
State Origin Fall
2006 Fall
2007 Fall
2008 Fall
2009 Fall
2010 5‐Yr
Change State Origin
Fall 2006
Fall 2007
Fall 2008
Fall 2009
Fall 2010
5‐Yr Change
Alabama 0 0 0 0 1 ‐‐ Missouri 2 0 2 0 1 ‐50%
Arizona 0 0 1 0 0 ‐‐ New Jersey 1 0 0 0 0 ‐100%
California 3 2 1 1 1 ‐67% New York 1 2 0 0 0 ‐100%
Connecticut 0 0 0 0 2 ‐‐ North Carolina 0 1 0 0 0 ‐‐
Florida 0 2 3 1 0 ‐‐ Ohio 5 5 9 5 13 160%
Georgia 0 3 0 0 2 ‐‐ Rhode Island 0 0 0 0 1 ‐‐
Illinois 6 3 1 7 5 ‐17% Tennessee 2 2 3 3 0 ‐100%
Indiana 0 1 3 4 6 ‐‐ Texas 1 3 0 0 2 100%
Iowa 1 0 0 0 0 ‐100% Virginia 0 0 1 0 0 ‐‐
Kentucky 60 65 58 85 103 72% West Virginia 0 0 0 1 0 ‐‐
Michigan 6 4 3 8 6 0% Wisconsin 1 0 1 0 1 0%
Mississippi 0 0 1 0 0 ‐‐ Foreign Countries 0 1 3 1 4 ‐‐
66

Kentucky State University Enrollment
Fact Book 2010‐2011
KSU First‐Time Transfer Undergraduate Enrollment by State Origin
67

Kentucky State University Enrollment
Fact Book 2010‐2011
KSU First‐Time Transfer Undergraduate Enrollment by Kentucky County Origin
County Origin Fall
2006 Fall
2007 Fall
2008 Fall
2009 Fall
2010 5‐Yr
Change County Origin
Fall 2006
Fall 2007
Fall 2008
Fall 2009
Fall 2010
5‐Yr Change
Anderson 6 5 4 11 13 117% Johnson 0 1 0 0 0 ‐‐
Boyd 0 1 0 0 0 ‐‐ Kenton 0 0 1 0 0 ‐‐
Boyle 1 2 0 0 1 0% Laurel 0 0 0 0 1 ‐‐
Campbell 0 0 0 1 1 ‐‐ Lawrence 1 0 0 0 0 ‐100%
Carlisle 0 0 0 1 0 ‐‐ Letcher 0 0 0 0 2 ‐‐
Carroll 0 0 0 1 0 ‐‐ Lincoln 0 1 0 0 0 ‐‐
Christian 0 1 1 2 0 ‐‐ Madison 2 0 0 0 0 ‐100%
Daviess 1 0 0 0 0 ‐100% Mason 0 1 0 1 0 ‐‐
Edmonson 0 0 1 0 0 ‐‐ Mercer 1 1 0 0 2 100%
Estill 0 0 0 1 0 ‐‐ Ohio 0 1 0 0 0 ‐‐
Fayette 7 11 8 21 19 171% Owen 0 2 1 1 4 ‐‐
Fleming 0 0 0 1 0 ‐‐ Perry 0 1 0 0 0 ‐‐
Floyd 0 0 1 2 0 ‐‐ Pike 1 0 0 0 0 ‐100%
Franklin 24 20 23 23 26 8% Pulaski 0 0 1 0 0 ‐‐
Graves 0 0 0 1 1 ‐‐ Scott 3 0 2 3 3 0%
Hancock 0 0 1 0 0 ‐‐ Shelby 3 6 5 4 8 167%
Hardin 0 0 0 1 1 ‐‐ Spencer 0 1 0 1 0 ‐‐
Henderson 1 0 0 0 0 ‐100% Warren 1 1 0 0 0 ‐100%
Henry 0 0 2 0 2 ‐‐ Woodford 3 2 0 3 8 167%
Jefferson 5 5 5 6 10 100% Non Kentucky 29 29 32 31 45 55%
Jessamine 0 2 2 0 1 ‐‐ Total 89 94 90 116 148 66%
68

Kentucky State University Enrollment
Fact Book 2010‐2011
KSU First‐Time Transfer Undergraduate Enrollment by Kentucky County Origin
69

Kentucky State University Enrollment
Fact Book 2010‐2011
Enrollment Among Kentucky Public Institutions
Institution Level Fall 2006 Fall 2007 Fall 2008 Fall 2009 Fall 2010 5‐Yr Change Eastern Kentucky University (EKU) Undergraduate 13,623 13,659 13,839 13,991 14,396 6% Graduate 2,140 2,180 2,192 2,277 2,171 1% Total 15,763 15,839 16,031 16,268 16,567 5% Kentucky State University (KSU) Undergraduate 2,341 2,510 2,497 2,638 2,606 11% Graduate 159 186 162 196 245 54% Total 2,500 2,696 2,659 2,834 2,851 14% Morehead State University (MoSU) Undergraduate 7,515 7,625 7,487 7,550 7,399 ‐2% Graduate 1,510 1,441 1,494 1,496 1,443 ‐4% Total 9,025 9,066 8,981 9,046 8,842 ‐2% Murray State University (MuSU) Undergraduate 8,607 8,361 8,179 8,249 8,429 ‐2% Graduate 1,697 1,795 1,843 1,829 1,987 17% Total 10,304 10,156 10,022 10,078 10,416 1% Northern Kentucky University (NKU) Undergraduate 12,668 12,725 13,030 13,206 13,517 7% Graduate 1,970 2,082 2,079 2,199 2,231 13% Total 14,638 14,807 15,109 15,405 15,748 8% University of Kentucky (UK)* Undergraduate 19,328 18,830 18,988 19,217 19,988 3% Graduate 7,090 7,086 7,112 7,112 7,181 1% Total 26,418 25,916 26,100 26,329 27,169 3% University of Louisville (UL)* Undergraduate 15,103 15,125 15,495 15,619 15,818 5% Graduate 6,005 5,841 5,557 5,704 5,757 ‐4% Total 21,108 20,966 21,052 21,323 21,575 2% Western Kentucky University (WKU) Undergraduate 16,067 16,508 16,966 17,645 17,827 11% Graduate 2,597 5,757 5,795 3,067 3,076 18% Total 18,664 22,265 22,761 20,712 20,903 12%
Source: Kentucky Council on Postsecondary Education Note: * Exclude Post‐Doctoral and House Staff
70

Kentucky State University Enrollment
Fact Book 2010‐2011
‐4%
‐2%
0%
2%
4%
6%
8%
EKU KSU MoSU MuSU NKU UK UL WKU
Undergraduate Enrollment AnnualPercentage Growth
2006‐07 2007‐08 2008‐09 2009‐10
‐80%
‐40%
0%
40%
80%
120%
160%
EKU KSU MoSU MuSU NKU UK UL WKU
Graduate Enrollment Annual Percentage Growth
2006‐07 2007‐08 2008‐09 2009‐10
‐4%
‐2%
0%
2%
4%
6%
8%
10%
12%
14%
16%
EKU KSU MoSU MuSU NKU UK UL WKU
5‐Yr Total Enrollment Growth
‐10%
‐5%
0%
5%
10%
15%
20%
EKU KSU MoSU MuSU NKU UK UL WKU
Total Enrollment Annual Percentage Growth
2006‐07 2007‐08 2008‐09 2009‐10
71

Kentucky State University Enrollment
Fact Book 2010‐2011
KSU Total Enrollment by Gender and Race
Gender Fall
2006 Fall
2007 Fall
2008 Fall
2009 Fall
2010 5‐Yr
Change
Female 1,403 1,555 1,507 1,616 1,682 20%
Male 1,097 1,141 1,152 1,218 1,169 7%
Total Enrollment 2,500 2,696 2,659 2,834 2,851 14%
Race Fall
2006 Fall
2007 Fall
2008 Fall
2009 Fall
2010 5‐Yr
Change
Nonresident Alien 1 98 75 39 63 6200% Hispanic 15 8 12 37 31 107% American Indian/ 3 3 1 4 3 0% Asian 73 22 18 12 7 ‐90% Black, Non Hispanic 1,580 1,581 1,568 1,620 1,651 4% Native Hawaiian/Pacific 0 0 0 0 3 ‐‐ White, Non Hispanic 758 762 669 701 633 ‐16% Two or More Races 0 0 0 0 39 ‐‐ Unknown 70 222 316 421 421 501% Total Enrollment 2,500 2,696 2,659 2,834 2,851 14%
Gender/Race Fall
2006 Fall
2007 Fall
2008 Fall
2009 Fall
2010 5‐Yr
Change
Female Nonresident Alien 0 51 40 20 35 ‐‐
Hispanic 6 3 7 20 16 167% American Indian/Alaskan 0 2 0 3 2 ‐‐
Asian 37 10 9 8 4 ‐89% Black, Non Hispanic 800 861 838 915 959 20%
Native Hawaiian/Pacific 0 0 0 0 0 ‐‐ White, Non Hispanic 518 509 441 437 413 ‐20%
Two or More Races 0 0 0 0 24 ‐‐ Unknown 42 119 172 213 229 445%
Total Female 1,403 1,555 1,507 1,616 1,682 20%
Nonresident Alien 1 47 35 19 28 2700% Hispanic 9 5 5 17 15 67%
American Indian/Alaskan 3 1 1 1 1 ‐67% Asian 36 12 9 4 3 ‐92%
Black, Non Hispanic 780 720 730 705 692 ‐11% Native Hawaiian/Pacific 0 0 0 0 3 ‐‐
White, Non Hispanic 240 253 228 264 220 ‐8% Two or More Races 0 0 0 0 15 ‐‐ Unknown 28 103 144 208 192 586% Total Male 1,097 1,141 1,152 1,218 1,169 7%
Male
2,200
2,400
2,600
2,800
3,000
Fall 2006 Fall 2007 Fall 2008 Fall 2009 Fall 2010
72

Kentucky State University Enrollment
Fact Book 2010‐2011
KSU Total Enrollment by Status and Residency
Status Fall
2006 Fall
2007 Fall
2008 Fall
2009 Fall
2010 5‐Yr
Change
Full‐Time 1,823 1,964 1,984 2,204 2,256 24%
Part‐Time 677 732 675 630 595 ‐12%
Total Enrollment 2,500 2,696 2,659 2,834 2,851 14%
Residency Fall
2006 Fall
2007 Fall
2008 Fall
2009 Fall
2010 5‐Yr
Change
In‐State 1,635 1,738 1,542 1,726 1,638 0% Out‐of‐State 865 958 1,117 1,108 1,213 40% Total Enrollment 2,500 2,696 2,659 2,834 2,851 14%
Status/Residency Fall
2006 Fall
2007 Fall
2008 Fall
2009 Fall
2010 5‐Yr
Change
Full‐Time
In‐State 1,030 1,069 942 1,157 1,137 10%
Out‐of‐State 793 895 1,042 1,047 1,119 41%
Total Full‐Time 1,823 1,964 1,984 2,204 2,256 24%
Part‐Time
In‐State 605 669 600 569 501 ‐17%
Out‐of‐State 72 63 75 61 94 31%
Total Part‐Time 677 732 675 630 595 ‐12%
0
500
1,000
1,500
2,000
2,500
Fall 2006 Fall 2007 Fall 2008 Fall 2009 Fall 2010
KSU Enrollment by Status
Full‐Time Part‐Time
0
400
800
1,200
1,600
2,000
Fall 2006 Fall 2007 Fall 2008 Fall 2009 Fall 2010
KSU Enrollment by Residency
In‐State Out‐of‐State
73

Kentucky State University Enrollment
Fact Book 2010‐2011
KSU Total Enrollment by Class and Status
Class Fall
2006 Fall
2007 Fall
2008 Fall
2009 Fall
2010 5‐Yr
Change
Freshman 923 1,023 1,042 1,132 1,224 33% Sophomore 349 395 414 388 420 20% Junior 343 295 321 344 313 ‐9% Senior 455 488 432 462 482 6% UG Non Degree 271 309 288 312 167 ‐38% Master's 154 168 157 181 233 51% GR Non Degree 5 18 5 15 12 140% Total Enrollment 2,500 2,696 2,659 2,834 2,851 14%
Status/Class Fall
2006 Fall
2007 Fall
2008 Fall
2009 Fall
2010 5‐Yr
Change
Full‐Time Freshman 862 944 978 1,068 1,127 31%
Sophomore 279 332 363 346 369 32% Junior 281 227 255 292 261 ‐7%
Senior 326 361 292 331 363 11% UG Non Degree 21 12 38 69 13 ‐38%
Master's 54 86 58 97 122 126% GR Non Degree 0 2 0 1 1 ‐‐
Total Full‐Time 1,823 1,964 1,984 2,204 2,256 24%
Freshman 61 79 64 64 97 59% Sophomore 70 63 51 42 51 ‐27%
Junior 62 68 66 52 52 ‐16% Senior 129 127 140 131 119 ‐8%
UG Non Degree 250 297 250 243 154 ‐38% Master's 100 82 99 84 111 11% GR Non Degree 5 16 5 14 11 120% Total Part‐Time 677 732 675 630 595 ‐12%
Part‐Time
UG = Undergraduate GR = Graduate
0
200
400
600
800
1000
1200
1400
Fall 2006 Fall 2007 Fall 2008 Fall 2009 Fall 2010
Freshman Sophomore Junior Senior Master's
74

Kentucky State University Enrollment
Fact Book 2010‐2011
KSU Total Enrollment by Major
Degree CIP ‐ 2000 Major Fall 2006 Fall 2007 Fall 2008 Fall 2009 Fall 2010 5‐Yr Change
Associate 15.0303 Electronic Technology 11 11 14 13 13 18%
15.1301 Drafting Technology 10 12 11 8 8 ‐20%
24.0101 Liberal Studies 13 5 5 9 23 77%
52.0402 Office Administrationa 3 2 0 0 0 ‐100%
51.3801 Nursing 251 292 266 287 329 31%
Total Associate Majors 288 322 296 317 373 30%
Bachelor 05.0101 African Studiesb 0 0 0 0 1 ‐‐
09.0499 Journalism, Other 0 2 59 65 89 ‐‐
11.0101 Computer Sciences 97 73 60 66 67 ‐31%
11.0103c Information Technology 20 28 34 39 42 110%
13.1202 Elementary Education 120 122 128 158 168 40%
13.1314 Physical Education 79 93 106 96 98 24%
16.0905 Spanishb 0 0 0 0 1 ‐‐
19.0701 Child Development 32 30 27 38 26 ‐19%
23.0101 English 46 54 40 43 40 ‐13%
24.0101 Liberal Studies 22 39 47 68 62 182%
26.0101 Biology 113 113 133 131 152 35%
27.0101 Mathematics 47 46 46 60 61 30%
40.0501 Chemistry 12 11 13 16 24 100%
42.0101 Psychology 112 118 106 143 156 39%
43.0104 Criminal Justice 127 117 141 157 179 41% a Currently no longer being offered b New majors offered starting in Fall 2010 c Realligned, was previously CIP 11.1004
75

Kentucky State University Enrollment
Fact Book 2010‐2011
Degree CIP ‐ 2000 Major Fall 2006 Fall 2007 Fall 2008 Fall 2009 Fall 2010 5‐Yr Change
44.0401 Public Administration 43 31 36 22 34 ‐21%
44.0701 Social Work 75 75 53 57 55 ‐27%
45.0101 Social Science 23 32 27 26 27 17%
45.1001 Political Science 32 35 41 32 36 13%
50.0702 Fine/Studio Arts 23 22 23 22 27 17%
50.0901 Music 67 76 72 66 58 ‐13%
52.0101 Business 354 387 357 316 294 ‐17%
51.3801 Nursing 36 29 12 28 26 ‐28%
Total Bachelor Majors 1,480 1,533 1,561 1,649 1,723 16%
Master's 03.0103 Environmental Studiesb 0 0 0 0 16 ‐‐
03.0301 Aquaculture 14 10 14 10 15 7%
11.0101 Computer Sciences 27 19 20 26 35 30%
13.1001 Special Education 0 50 53 69 75 ‐‐
44.0401 Public Administration 91 70 48 54 69 ‐24%
52.0201 Business Administration 22 19 22 22 23 5%
154 168 157 181 233 51%
Other 00.0000 Undeclared 302 346 352 360 343 14%
90.0000 Non Degree 276 327 293 327 179 ‐35%
Total Enrolled Students 2,500 2,696 2,659 2,834 2,851 14%
Total Master's Majors
a Currently no longer being offered b New majors offered starting in Fall 2010 c Realligned, was previously CIP 11.1004
76

Kentucky State University Enrollment
Fact Book 2010‐2011
KSU Total Enrollment by Gender and Age
Gender Age Fall
2006 Fall
2007 Fall
2008 Fall
2009 Fall
2010 5‐Yr
Change
Female Under 18 8 12 7 55 29 263%
18‐19 365 471 528 529 537 47%
20‐21 247 255 253 364 399 62%
22‐24 228 221 182 190 226 ‐1%
25‐29 190 197 157 154 159 ‐16%
30‐34 120 119 102 88 91 ‐24%
35‐39 87 85 86 71 81 ‐7%
40‐49 87 115 113 100 96 10%
50‐64 44 42 56 39 45 2%
65 and over 27 38 23 26 19 ‐30%
Male Under 18 11 19 5 40 9 ‐18%
18‐19 342 356 396 389 381 11%
20‐21 220 219 226 245 259 18%
22‐24 206 221 200 210 219 6%
25‐29 138 136 127 125 121 ‐12%
30‐34 59 55 52 63 55 ‐7%
35‐39 41 41 50 46 41 0%
40‐49 45 53 55 58 50 11%
50‐64 23 27 29 29 27 17%
65 and over 12 14 12 13 7 ‐42%
Age Fall
2006 Fall
2007 Fall
2008 Fall
2009 Fall
2010 5‐Yr
Change
Traditional 1,627 1,774 1,797 2,037 2,060 27%
Non‐Traditional 873 922 862 797 791 ‐9%
Note: Traditional student is defined as student with age of 24 or younger Non Traditional student is defined as student with age of 25 or older
65% 66% 68% 72% 72%
35% 34% 32% 28% 28%
0%
20%
40%
60%
80%
100%
Fall 2006 Fall 2007 Fall 2008 Fall 2009 Fall 2010
Total Enrollment by Age
Traditional Non Traditional
77

Kentucky State University Enrollment
Fact Book 2010‐2011
KSU Total Enrollment by State Origin
State Origin Fall
2006 Fall
2007 Fall
2008 Fall
2009 Fall
2010 5‐Yr
Change State Origin
Fall 2006
Fall 2007
Fall 2008
Fall 2009
Fall 2010
5‐Yr Change
Alabama 6 10 9 8 11 83% Mississippi 3 4 6 8 5 67%
Alaska 1 1 1 0 0 ‐100% Missouri 23 23 22 36 35 52%
Arizona 1 2 2 1 0 ‐100% Nebraska 1 2 1 0 2 100%
Arkansas 3 1 2 2 0 ‐100% Nevada 0 0 1 0 2 ‐‐
California 16 16 13 20 22 38% New Jersey 5 5 10 10 9 80%
Colorado 1 1 1 0 1 0% New Mexico 0 1 0 0 0 ‐‐
Connecticut 0 0 3 3 3 ‐‐ New York 13 18 16 11 5 ‐62%
Delaware 1 2 2 2 3 200% North Carolina 7 4 9 11 6 ‐14%
District of Columbia 3 9 19 21 18 500% Ohio 314 334 372 374 366 17%
Florida 19 14 21 23 21 11% Oklahoma 0 0 1 0 0 ‐‐
Georgia 37 38 36 31 33 ‐11% Oregon 0 1 1 0 0 ‐‐
Illinois 121 121 173 188 236 95% Pennsylvania 6 6 8 0 5 ‐17%
Indiana 84 85 102 128 150 79% Puerto Rico 2 1 0 0 0 ‐100%
Iowa 3 1 0 0 0 ‐100% Rhode Island 0 0 0 0 1 ‐‐
Kansas 0 2 3 2 1 ‐‐ South Carolina 5 5 3 2 2 ‐60%
Kentucky 1,483 1,576 1,387 1,559 1,473 ‐1% South Dakota 0 0 1 3 1 ‐‐
Louisiana 2 5 1 3 1 ‐50% Tennessee 33 27 24 19 20 ‐39%
Maine 2 0 0 0 0 ‐100% Texas 11 7 5 8 9 ‐18%
Maryland 7 4 9 11 11 57% Virginia 11 11 11 9 10 ‐9%
Massachusetts 2 1 1 0 1 ‐50% Washington 0 2 0 0 0 ‐‐
Michigan 175 234 273 269 293 67% West Virginia 6 6 5 3 6 0%
Minnesota 2 3 1 1 1 ‐50% Wisconsin 13 12 18 15 15 15%
78

Kentucky State University Enrollment
Fact Book 2010‐2011
KSU Total Enrollment by State Origin
79

Kentucky State University Enrollment
Fact Book 2010‐2011
KSU Total Enrollment by Kentucky County Origin
County Origin Fall
2006 Fall
2007 Fall
2008 Fall
2009 Fall
2010 5‐Yr
Change County Origin
Fall 2006
Fall 2007
Fall 2008
Fall 2009
Fall 2010
5‐Yr Change
Allen 0 0 0 0 1 ‐‐ Estill 1 1 0 2 3 200% Adair 3 1 1 0 0 ‐100% Fayette 153 157 145 155 155 1% Anderson 96 94 91 92 77 ‐20% Fleming 2 0 0 1 1 ‐50% Ballard 0 0 0 0 1 ‐‐ Floyd 3 5 2 2 1 ‐67% Barren 3 2 5 0 1 ‐67% Franklin 548 580 498 596 511 ‐7% Bell 3 3 0 1 2 ‐33% Fulton 3 2 3 2 1 ‐67% Boone 4 6 2 10 9 125% Gallatin 0 2 1 1 0 ‐‐ Bourbon 8 5 1 0 0 ‐100% Garrard 0 0 0 2 2 ‐‐ Boyd 9 12 6 6 6 ‐33% Grant 5 3 2 5 4 ‐20% Boyle 8 12 7 9 9 13% Grayson 0 1 0 0 0 ‐‐ Breathitt 0 0 0 1 0 ‐‐ Graves 1 0 0 3 3 200% Breckinridge 1 0 1 0 0 ‐100% Greenup 0 0 1 1 1 ‐‐ Bullitt 2 2 3 0 0 ‐100% Hancock 0 0 1 0 0 ‐‐ Caldwell 0 1 1 0 0 ‐‐ Hardin 22 24 21 14 12 ‐45% Calloway 0 0 0 2 3 ‐‐ Harlan 0 1 1 1 1 ‐‐ Campbell 1 2 2 5 3 200% Harrison 0 3 5 6 4 ‐‐ Carlisle 0 0 0 2 0 ‐‐ Hart 2 4 2 2 0 ‐100% Carroll 0 1 1 2 3 ‐‐ Henderson 9 12 7 6 4 ‐56% Carter 0 0 1 0 0 ‐‐ Henry 13 15 19 18 21 62% Christian 25 15 15 20 18 ‐28% Hickman 1 1 1 0 2 100% Clark 5 9 0 1 5 0% Hopkins 9 10 4 2 4 ‐56% Clay 2 0 1 0 1 ‐50% Jefferson 221 242 238 256 258 17% Clinton 1 1 2 1 0 ‐100% Jessamine 7 12 13 59 41 486% Crittenden 0 0 1 2 2 ‐‐ Johnson 2 4 2 2 1 ‐50% Daviess 7 7 6 6 5 ‐29% Kenton 7 4 5 7 10 43% Edmonson 0 0 1 0 0 ‐‐ Knott 0 0 1 0 11 ‐‐
80

Kentucky State University Enrollment
Fact Book 2010‐2011
County Origin Fall
2006 Fall
2007 Fall
2008 Fall
2009 Fall
2010 5‐Yr
Change County Origin
Fall 2006
Fall 2007
Fall 2008
Fall 2009
Fall 2010
5‐Yr Change
Knox 0 0 0 0 3 ‐‐ Owen 54 49 43 50 49 ‐9% Larue 0 1 0 0 0 ‐‐ Pendleton 0 0 1 0 1 ‐‐ Laurel 3 0 3 2 4 33% Perry 3 2 2 2 2 ‐33% Lawrence 1 1 1 1 1 0% Pike 3 4 5 1 1 ‐67% Letcher 1 0 0 1 3 200% Powell 1 1 2 1 1 0% Lewis 0 0 1 1 0 ‐‐ Pulaski 3 4 3 1 0 ‐100% Lincoln 1 2 1 0 0 ‐100% Rockcastle 1 1 0 0 0 ‐100% Logan 3 2 1 3 4 33% Rowan 2 1 2 0 0 ‐100% Lyon 1 0 0 0 0 ‐100% Russell 0 0 1 1 1 ‐‐ McCracken 6 6 5 3 5 ‐17% Scott 31 35 32 24 32 3% McCreary 1 0 0 0 0 ‐100% Shelby 82 90 76 79 84 2% Madison 10 12 7 6 6 ‐40% Simpson 2 3 2 5 5 150% Marion 1 1 0 0 0 ‐100% Spencer 8 11 8 10 9 13% Martin 2 1 0 0 0 ‐100% Taylor 2 2 1 0 0 ‐100% Mason 0 2 5 3 1 ‐‐ Todd 1 1 0 0 0 ‐100% Meade 0 3 2 1 1 ‐‐ Trigg 5 3 2 4 0 ‐100% Menifee 0 0 0 1 0 ‐‐ Trimble 0 0 1 1 0 ‐‐ Mercer 7 7 4 3 3 ‐57% Union 1 2 1 1 2 100% Metcalfe 2 1 1 0 0 ‐100% Warren 8 13 8 8 12 50% Monroe 0 2 1 2 0 ‐‐ Washington 5 5 5 3 2 ‐60% Montgomery 4 3 4 1 2 ‐50% Wayne 2 1 1 0 0 ‐100% Morgan 1 0 0 0 0 ‐100% Webster 0 1 1 1 0 ‐‐ Nelson 8 7 6 3 4 ‐50% Whitley 1 0 2 1 0 ‐100% Nicholas 2 3 0 0 0 ‐100% Wolfe 0 1 0 0 0 ‐‐ Ohio 0 1 1 0 0 ‐‐ Woodford 25 31 25 31 36 44% Oldham 2 4 1 1 2 0% Non‐Kentucky 1,017 1,120 1,271 1,275 1,378 35%
81

Kentucky State University Enrollment
Fact Book 2010‐2011
KSU Total Enrollment by Kentucky County Origin
82

Kentucky State University Enrollment
Fact Book 2010‐2011
KSU Total Enrollment by Country Origin
Country Origin Fall
2006 Fall
2007 Fall
2008 Fall
2009 Fall
2010 5‐Yr
Change Country Origin
Fall 2006
Fall 2007
Fall 2008
Fall 2009
Fall 2010
5‐Yr Change
Australia 0 0 1 0 0 ‐‐ Kenya 0 2 3 1 1 ‐‐ Barbados 0 1 0 0 0 ‐‐ Korea, Rep 37 29 27 10 17 ‐54% Bahamas 1 0 1 0 1 0% Kuwait 1 0 1 1 2 100% Bangladesh 0 0 1 1 0 ‐‐ Lebanon 0 0 0 0 1 ‐‐ Belize 0 0 1 0 0 ‐‐ Lithuania 0 0 1 1 0 ‐‐ Burma 0 0 1 1 0 ‐‐ Mauritius 1 0 0 0 0 ‐100% Canada 0 1 1 1 1 ‐‐ Mexico 0 5 3 2 2 ‐‐ Congo 1 1 1 0 1 0% Nigeria 2 2 3 4 2 0% China 2 3 2 7 3 50% Netherlands 0 1 0 0 0 ‐‐ Cameroon 7 6 4 4 2 ‐71% Nepal 0 0 0 0 2 ‐‐ Colombia 0 1 0 1 1 ‐‐ Nicaragua 0 1 1 0 3 ‐‐ Dominican Rep 1 3 3 0 3 200% Peru 0 0 0 1 0 ‐‐ Egypt 1 1 0 0 0 ‐100% Pakistan 0 2 0 0 0 ‐‐ El Salvador 1 4 4 0 3 200% Romania 0 1 0 0 0 ‐‐ Ethiopia 2 1 0 0 1 ‐50% Philippines 0 0 0 1 0 ‐‐ Gambia 9 7 6 5 5 ‐44% Rwanda 1 1 0 0 0 ‐100% Ghana 0 3 2 3 2 ‐‐ Saudi Arabia 0 1 1 1 1 ‐‐ Guatemala 0 3 3 0 2 ‐‐ Senegal 0 0 0 1 0 ‐‐ Guyana 0 0 0 1 1 ‐‐ Singapore 1 0 0 0 0 ‐100% Haiti 0 4 4 1 4 ‐‐ Somalia 0 0 1 0 0 ‐‐ Honduras 1 3 4 0 2 100% Thailand 0 1 0 0 0 ‐‐ Indonesia 0 1 1 1 0 ‐‐ Taiwan 0 2 0 0 0 ‐‐ India 5 7 4 2 8 60% Venezuela 1 0 0 0 0 ‐100% Israel 1 0 0 0 0 ‐100% Yugoslavia 0 1 0 0 0 ‐‐ Iraq 1 1 0 0 1 0% Zambia 0 0 0 0 1 ‐‐ Jamaica 0 1 1 2 0 ‐‐ Zimbabwe 1 0 0 0 0 ‐100%
83

Kentucky State University Enrollment
Fact Book 2010‐2011
KSU Total Enrollment by Country Origin
84
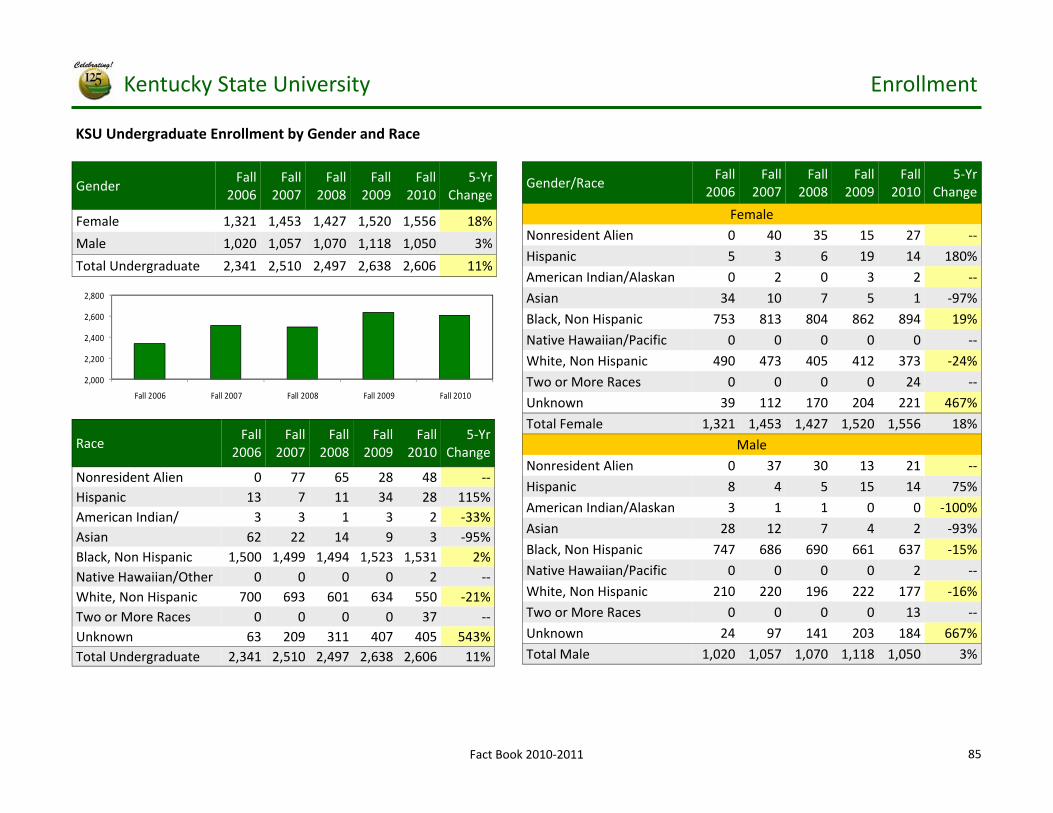
Kentucky State University Enrollment
Fact Book 2010‐2011
KSU Undergraduate Enrollment by Gender and Race
Gender Fall
2006 Fall
2007 Fall
2008 Fall
2009 Fall
2010 5‐Yr
Change
Female 1,321 1,453 1,427 1,520 1,556 18%
Male 1,020 1,057 1,070 1,118 1,050 3%
Total Undergraduate 2,341 2,510 2,497 2,638 2,606 11%
Race Fall
2006 Fall
2007 Fall
2008 Fall
2009 Fall
2010 5‐Yr
Change
Nonresident Alien 0 77 65 28 48 ‐‐ Hispanic 13 7 11 34 28 115% American Indian/ 3 3 1 3 2 ‐33% Asian 62 22 14 9 3 ‐95% Black, Non Hispanic 1,500 1,499 1,494 1,523 1,531 2% Native Hawaiian/Other 0 0 0 0 2 ‐‐ White, Non Hispanic 700 693 601 634 550 ‐21% Two or More Races 0 0 0 0 37 ‐‐ Unknown 63 209 311 407 405 543% Total Undergraduate 2,341 2,510 2,497 2,638 2,606 11%
Gender/Race Fall
2006 Fall
2007 Fall
2008 Fall
2009 Fall
2010 5‐Yr
Change
Female Nonresident Alien 0 40 35 15 27 ‐‐
Hispanic 5 3 6 19 14 180% American Indian/Alaskan 0 2 0 3 2 ‐‐
Asian 34 10 7 5 1 ‐97% Black, Non Hispanic 753 813 804 862 894 19%
Native Hawaiian/Pacific 0 0 0 0 0 ‐‐ White, Non Hispanic 490 473 405 412 373 ‐24%
Two or More Races 0 0 0 0 24 ‐‐ Unknown 39 112 170 204 221 467%
Total Female 1,321 1,453 1,427 1,520 1,556 18%
Nonresident Alien 0 37 30 13 21 ‐‐ Hispanic 8 4 5 15 14 75%
American Indian/Alaskan 3 1 1 0 0 ‐100% Asian 28 12 7 4 2 ‐93%
Black, Non Hispanic 747 686 690 661 637 ‐15% Native Hawaiian/Pacific 0 0 0 0 2 ‐‐
White, Non Hispanic 210 220 196 222 177 ‐16% Two or More Races 0 0 0 0 13 ‐‐ Unknown 24 97 141 203 184 667% Total Male 1,020 1,057 1,070 1,118 1,050 3%
Male
2,000
2,200
2,400
2,600
2,800
Fall 2006 Fall 2007 Fall 2008 Fall 2009 Fall 2010
85

Kentucky State University Enrollment
Fact Book 2010‐2011
KSU Undergraduate Enrollment by Status and Residency
Status Fall
2006 Fall
2007 Fall
2008 Fall
2009 Fall
2010 5‐Yr
Change
Full‐Time 1,769 1,876 1,926 2,106 2,133 21%
Part‐Time 572 634 571 532 473 ‐17%
Total Undergraduate 2,341 2,510 2,497 2,638 2,606 11%
Residency Fall
2006 Fall
2007 Fall
2008 Fall
2009 Fall
2010 5‐Yr
Change
In‐State 1,499 1,575 1,397 1,554 1,423 ‐5% Out‐of‐State 842 935 1,100 1,084 1,183 40% Total Undergraduate 2,341 2,510 2,497 2,638 2,606 11%
Status/Residency Fall
2006 Fall
2007 Fall
2008 Fall
2009 Fall
2010 5‐Yr
Change
Full‐Time
In‐State 989 995 892 1,072 1,030 4%
Out‐of‐State 780 881 1,034 1,034 1,103 41%
Total Full‐Time 1,769 1,876 1,926 2,106 2,133 21%
Part‐Time
In‐State 510 580 505 482 393 ‐23%
Out‐of‐State 62 54 66 50 80 29%
Total Part‐Time 572 634 571 532 473 ‐17%
0
400
800
1200
1600
2000
Fall 2006 Fall 2007 Fall 2008 Fall 2009 Fall 2010
Undergraduate Enrollment by Residency
In‐State Out‐of‐State
0
500
1,000
1,500
2,000
2,500
Fall 2006 Fall 2007 Fall 2008 Fall 2009 Fall 2010
Undergraduate Enrollment by Status
Full‐Time Part‐Time
86

Kentucky State University Enrollment
Fact Book 2010‐2011
KSU Undergraduate Enrollment by Gender and Age
Gender Age Fall
2006 Fall
2007 Fall
2008 Fall
2009 Fall
2010 5‐Yr
Change
Female Under 18 8 12 7 55 29 263%
18‐19 365 471 528 529 537 47%
20‐21 247 255 253 364 399 62%
22‐24 208 208 173 176 209 0%
25‐29 163 157 132 125 122 ‐25%
30‐34 101 101 86 68 73 ‐28%
35‐39 83 77 78 63 63 ‐24%
40‐49 78 99 98 83 70 ‐10%
50‐64 42 35 50 32 35 ‐17%
65 and over 26 38 22 25 19 ‐27%
Male Under 18 11 19 5 40 9 ‐18%
18‐19 342 356 396 389 381 11%
20‐21 220 219 226 245 258 17%
22‐24 196 210 189 198 201 3%
25‐29 113 110 101 98 85 ‐25%
30‐34 45 41 39 44 36 ‐20%
35‐39 27 31 38 36 30 11%
40‐49 38 37 41 38 29 ‐24%
50‐64 19 24 25 19 16 ‐16%
65 and over 9 10 10 11 5 ‐44%
Age Fall
2006 Fall
2007 Fall
2008 Fall
2009 Fall
2010 5‐Yr
Change
Traditional 1,597 1,750 1,777 2,009 2,024 27%
Non‐Traditional 744 760 720 629 582 ‐22%
Note: Traditional student is defined as student with age of 24 or younger Non Traditional student is defined as student with age of 25 or older
68% 70% 71% 76% 78%
32% 30% 29% 24% 22%
0%
20%
40%
60%
80%
100%
Fall 2006 Fall 2007 Fall 2008 Fall 2009 Fall 2010
KSU Undergraduate Enrollment by Age
Traditional Non Traditional
87

Kentucky State University Enrollment
Fact Book 2010‐2011
KSU Undergraduate Enrollment by State Origin
State Origin Fall
2006 Fall
2007 Fall
2008 Fall
2009 Fall
2010 5‐Yr
Change State Origin
Fall 2006
Fall 2007
Fall 2008
Fall 2009
Fall 2010
5‐Yr Change
Alabama 5 8 7 5 10 100% Mississippi 3 3 5 6 4 33%
Alaska 1 1 1 0 0 ‐100% Missouri 21 22 22 36 34 62%
Arizona 1 2 2 1 0 ‐100% Nebraska 1 1 1 0 2 100%
Arkansas 1 1 1 1 0 ‐100% Nevada 0 0 0 0 2 ‐‐
California 16 16 11 18 22 38% New Jersey 5 4 10 9 8 60%
Colorado 1 0 1 0 1 0% New Mexico 0 1 0 0 0 ‐‐
Connecticut 0 0 3 3 3 ‐‐ New York 13 17 14 8 5 ‐62%
Delaware 1 2 2 2 3 200% North Carolina 6 4 8 9 5 ‐17%
District of Columbia 3 9 18 20 17 467% Ohio 308 327 363 356 340 10%
Florida 16 11 21 22 21 31% Oklahoma 0 0 1 0 0 ‐‐
Georgia 36 36 34 28 30 ‐17% Oregon 0 1 1 0 0 ‐‐
Illinois 117 117 169 184 233 99% Pennsylvania 5 6 8 0 4 ‐20%
Indiana 79 81 100 123 144 82% Puerto Rico 2 1 0 0 0 ‐100%
Iowa 2 1 0 0 0 ‐100% Rhode Island 0 0 0 0 1 ‐‐
Kansas 0 1 2 1 1 ‐‐ South Carolina 5 5 3 2 1 ‐80%
Kentucky 1,380 1,453 1,279 1,447 1,318 ‐4% South Dakota 0 0 1 1 0 ‐‐
Louisiana 2 5 0 3 1 ‐50% Tennessee 31 23 24 17 18 ‐42%
Maine 1 0 0 0 0 ‐100% Texas 9 7 5 6 9 0%
Maryland 7 4 9 9 7 0% Virginia 11 10 10 9 9 ‐18%
Massachusetts 2 1 1 0 1 ‐50% Washington 0 2 0 0 0 ‐‐
Michigan 173 231 269 264 284 64% West Virginia 5 5 4 2 4 ‐20%
Minnesota 1 1 0 1 1 0% Wisconsin 12 10 16 15 14 17%
88

Kentucky State University Enrollment
Fact Book 2010‐2011
KSU Undergraduate Enrollment by State Origin
89

Kentucky State University Enrollment
Fact Book 2010‐2011
KSU Undergraduate Enrollment by Kentucky County Origin
County Origin Fall
2006 Fall
2007 Fall
2008 Fall
2009 Fall
2010 5‐Yr
Change County Origin
Fall 2006
Fall 2007
Fall 2008
Fall 2009
Fall 2010
5‐Yr Change
Allen 0 0 0 0 0 ‐‐ Estill 1 1 0 2 3 200% Adair 3 1 1 0 0 ‐100% Fayette 132 135 120 137 126 ‐5% Anderson 91 89 89 89 71 ‐22% Fleming 1 0 0 1 1 0% Ballard 0 0 0 0 1 ‐‐ Floyd 3 5 2 2 1 ‐67% Barren 1 1 4 0 1 0% Franklin 503 538 465 566 471 ‐6% Bell 3 3 0 1 2 ‐33% Fulton 3 2 3 2 1 ‐67% Boone 4 6 2 9 7 75% Gallatin 0 2 1 1 0 ‐‐ Bourbon 8 5 1 0 0 ‐100% Garrard 0 0 0 2 2 ‐‐ Boyd 9 12 5 5 5 ‐44% Grant 5 3 2 5 4 ‐20% Boyle 7 11 6 8 9 29% Grayson 0 1 0 0 0 ‐‐ Breathitt 0 0 0 1 0 ‐‐ Graves 1 0 0 3 3 200% Breckinridge 1 0 1 0 0 ‐100% Greenup 0 0 1 1 1 ‐‐ Bullitt 2 2 3 0 0 ‐100% Hancock 0 0 1 0 0 ‐‐ Caldwell 0 1 1 0 0 ‐‐ Hardin 22 22 18 14 11 ‐50% Calloway 0 0 0 2 3 ‐‐ Harlan 0 1 1 1 1 ‐‐ Campbell 1 2 2 4 3 200% Harrison 0 2 3 5 3 ‐‐ Carlisle 0 0 0 2 0 ‐‐ Hart 2 4 2 2 0 ‐100% Carroll 0 0 1 2 3 ‐‐ Henderson 8 11 7 5 3 ‐63% Carter 0 0 1 0 0 ‐‐ Henry 13 14 16 14 18 38% Christian 24 14 13 16 14 ‐42% Hickman 1 1 1 0 2 100% Clark 5 9 0 1 4 ‐20% Hopkins 9 10 4 1 3 ‐67% Clay 2 0 1 0 1 ‐50% Jefferson 211 222 226 234 224 6% Clinton 1 1 2 1 0 ‐100% Jessamine 7 12 11 58 40 471% Crittenden 0 0 1 2 2 ‐‐ Johnson 2 4 2 1 1 ‐50% Daviess 7 6 5 5 3 ‐57% Kenton 7 4 5 7 6 ‐14% Edmonson 0 0 1 0 0 ‐‐ Knott 0 0 1 0 11 ‐‐
90

Kentucky State University Enrollment
Fact Book 2010‐2011
County Origin Fall
2006 Fall
2007 Fall
2008 Fall
2009 Fall
2010 5‐Yr
Change County Origin
Fall 2006
Fall 2007
Fall 2008
Fall 2009
Fall 2010
5‐Yr Change
Knox 0 0 0 0 3 ‐‐ Owen 53 47 41 48 46 ‐13% Larue 0 1 0 0 0 ‐‐ Pendleton 0 0 1 0 1 ‐‐ Laurel 3 0 3 2 4 33% Perry 3 2 2 2 2 ‐33% Lawrence 1 1 1 0 0 ‐100% Pike 3 4 5 1 0 ‐100% Letcher 1 0 0 0 2 100% Powell 1 1 2 1 1 0% Lewis 0 0 1 1 0 ‐‐ Pulaski 3 4 2 1 0 ‐100% Lincoln 1 1 1 0 0 ‐100% Rockastle 1 1 0 0 0 ‐100% Logan 3 2 1 3 4 33% Rowan 2 1 2 0 0 ‐100% Lyon 1 0 0 0 0 ‐100% Russell 0 0 1 1 1 ‐‐ McCracken 6 5 4 2 4 ‐33% Scott 31 33 30 20 27 ‐13% McCreary 1 0 0 0 0 ‐100% Shelby 75 84 71 76 78 4% Madison 9 12 6 6 5 ‐44% Simpson 2 3 2 5 5 150% Marion 1 1 0 0 0 ‐100% Spencer 8 11 8 10 9 13% Martin 2 1 0 0 0 ‐100% Taylor 1 1 1 0 0 ‐100% Mason 0 2 5 3 1 ‐‐ Todd 1 1 0 0 0 ‐100% Meade 0 2 1 1 1 ‐‐ Trigg 4 3 2 1 0 ‐100% Menifee 0 0 0 0 0 ‐‐ Trimble 0 0 1 1 0 ‐‐ Mercer 7 7 4 3 3 ‐57% Union 1 2 1 1 2 100% Metcalfe 2 1 1 0 0 ‐100% Warren 8 10 8 7 10 25% Monroe 0 2 1 2 0 ‐‐ Washington 4 5 5 3 2 ‐50% Montgomery 3 2 3 1 2 ‐33% Wayne 2 1 1 0 0 ‐100% Morgan 1 0 0 0 0 ‐100% Webster 0 1 1 0 0 ‐‐ Nelson 8 5 4 3 4 ‐50% Whitley 1 0 1 1 0 ‐100% Nicholas 2 3 0 0 0 ‐100% Wolfe 0 1 0 0 0 ‐‐ Ohio 0 1 1 0 0 ‐‐ Woodford 22 28 22 29 34 55% Oldham 2 3 1 0 2 0% Non‐Kentucky 961 1,057 1,217 1,191 1,288 34%
91

Kentucky State University Enrollment
Fact Book 2010‐2011
KSU Undergraduate Enrollment by Kentucky County Origin
92

Kentucky State University Enrollment
Fact Book 2010‐2011
KSU Undergraduate Enrollment by Country Origin
Country Origin Fall
2006 Fall
2007 Fall
2008 Fall
2009 Fall
2010 5‐Yr
Change Country Origin
Fall 2006
Fall 2007
Fall 2008
Fall 2009
Fall 2010
5‐Yr Change
Barbados 0 1 0 0 0 ‐‐ Israel 1 0 0 0 0 ‐100% Bahamas 1 0 1 0 1 0% Jamaica 0 1 1 0 0 ‐‐ Bangladesh 0 0 0 1 0 ‐‐ Kenya 0 2 3 1 1 ‐‐ Belize 0 0 1 0 0 ‐‐ Korea, Rep 37 29 27 10 17 ‐54% Canada 0 1 0 0 1 ‐‐ Kuwait 0 0 1 1 1 ‐‐ Congo 1 1 1 0 0 ‐100% Lithuania 0 0 1 0 0 ‐‐ China 1 1 0 5 2 100% Mexico 0 4 3 1 2 ‐‐ Cameroon 4 3 3 1 2 ‐50% Nigeria 2 2 2 2 1 ‐50% Dominican Rep 0 3 3 0 3 ‐‐ Netherlands 0 1 0 0 0 ‐‐ El Salvador 1 4 4 0 3 200% Nicaragua 0 1 1 0 3 ‐‐ Ethiopia 2 1 0 0 0 ‐100% Pakistan 0 1 0 0 0 ‐‐ Gambia 7 7 6 5 3 ‐57% Somalia 0 0 1 0 0 ‐‐ Ghana 0 3 1 2 0 ‐‐ Thailand 0 1 0 0 0 ‐‐ Guatemala 0 3 3 0 2 ‐‐ Taiwan 0 2 0 0 0 ‐‐ Haiti 0 4 4 1 4 ‐‐ Venezuela 1 0 0 0 0 ‐100% Honduras 0 3 4 0 2 ‐‐ Yugoslavia 0 1 0 0 0 ‐‐ India 1 0 0 0 0 ‐100% Zambia 0 0 0 0 1 ‐‐
93

Kentucky State University Enrollment
Fact Book 2010‐2011
KSU Graduate Enrollment by Gender and Race
Gender Fall
2006 Fall
2007 Fall
2008 Fall
2009 Fall
2010 5‐Yr
Change
Female 82 102 80 96 126 54%
Male 77 84 82 100 119 55%
Total Graduate 159 186 162 196 245 54%
Race Fall
2006 Fall
2007 Fall
2008 Fall
2009 Fall
2010 5‐Yr
Change
Nonresident Alien 1 21 10 11 15 1400% Hispanic 2 1 1 3 3 50% American Indian/ 0 0 0 1 1 ‐‐ Asian 11 0 4 3 4 ‐64% Black, Non Hispanic 80 82 74 97 120 50% Native Hawaiian/Other 0 0 0 0 1 ‐‐ White, Non Hispanic 58 69 68 67 83 43% Two or More Races 0 0 0 0 2 ‐‐ Unknown 7 13 5 14 16 129% Total Graduate 159 186 162 196 245 54%
Gender/Race Fall
2006 Fall
2007 Fall
2008 Fall
2009 Fall
2010 5‐Yr
Change
Female Nonresident Alien 0 11 5 5 8 ‐‐
Hispanic 1 0 1 1 2 100% American Indian/Alaskan 0 0 0 0 0 ‐‐
Asian 3 0 2 3 3 0% Black, Non Hispanic 47 48 34 53 65 38%
Native Hawaiian/Pacific 0 0 0 0 0 ‐‐ White, Non Hispanic 28 36 36 25 40 43%
Two or More Races 0 0 0 0 0 ‐‐ Unknown 3 7 2 9 8 167%
Total Female 82 102 80 96 126 54%
Nonresident Alien 1 10 5 6 7 600% Hispanic 1 1 0 2 1 0%
American Indian/Alaskan 0 0 0 1 1 ‐‐ Asian 8 0 2 0 1 ‐88%
Black, Non Hispanic 33 34 40 44 55 67% Native Hawaiian/Pacific 0 0 0 0 1 ‐‐
White, Non Hispanic 30 33 32 42 43 43% Two or More Races 0 0 0 0 2 ‐‐ Unknown 4 6 3 5 8 100% Total Male 77 84 82 100 119 55%
Male
0
200
400
Fall 2006 Fall 2007 Fall 2008 Fall 2009 Fall 2010
94
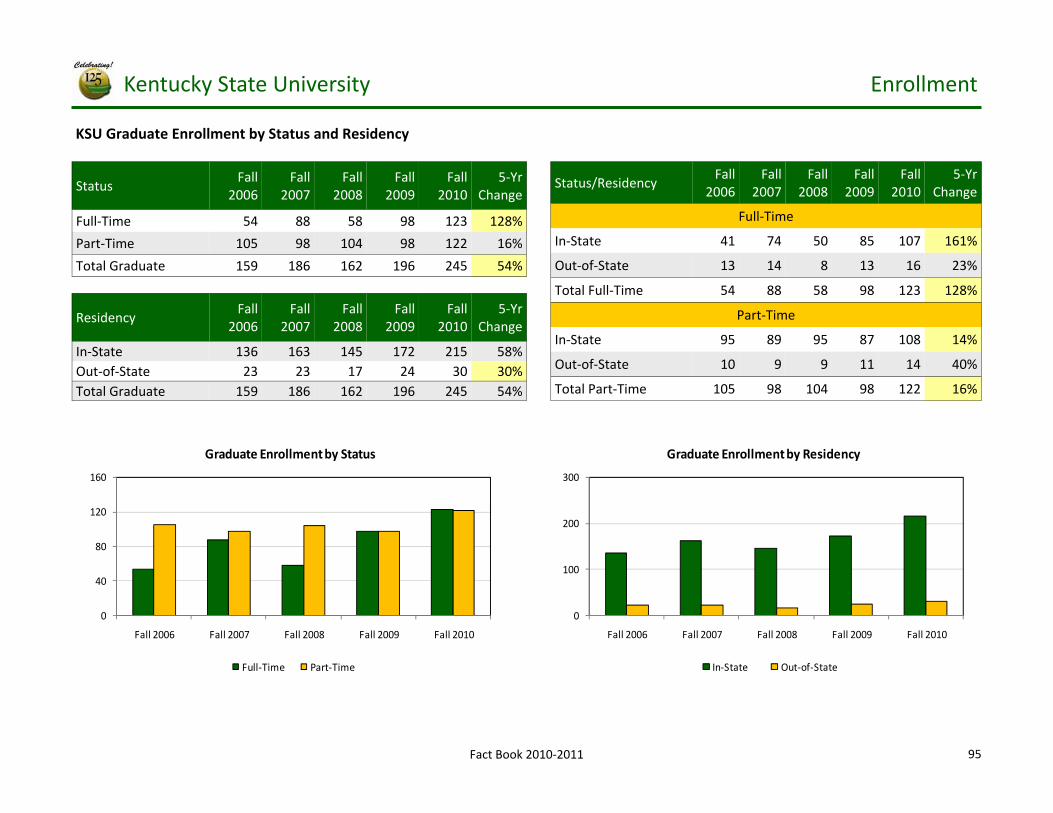
Kentucky State University Enrollment
Fact Book 2010‐2011
KSU Graduate Enrollment by Status and Residency
Status Fall
2006 Fall
2007 Fall
2008 Fall
2009 Fall
2010 5‐Yr
Change
Full‐Time 54 88 58 98 123 128%
Part‐Time 105 98 104 98 122 16%
Total Graduate 159 186 162 196 245 54%
Residency Fall
2006 Fall
2007 Fall
2008 Fall
2009 Fall
2010 5‐Yr
Change
In‐State 136 163 145 172 215 58% Out‐of‐State 23 23 17 24 30 30% Total Graduate 159 186 162 196 245 54%
Status/Residency Fall
2006 Fall
2007 Fall
2008 Fall
2009 Fall
2010 5‐Yr
Change
Full‐Time
In‐State 41 74 50 85 107 161%
Out‐of‐State 13 14 8 13 16 23%
Total Full‐Time 54 88 58 98 123 128%
Part‐Time
In‐State 95 89 95 87 108 14%
Out‐of‐State 10 9 9 11 14 40%
Total Part‐Time 105 98 104 98 122 16%
0
40
80
120
160
Fall 2006 Fall 2007 Fall 2008 Fall 2009 Fall 2010
Graduate Enrollment by Status
Full‐Time Part‐Time
0
100
200
300
Fall 2006 Fall 2007 Fall 2008 Fall 2009 Fall 2010
Graduate Enrollment by Residency
In‐State Out‐of‐State
95

Kentucky State University Enrollment
Fact Book 2010‐2011
KSU Graduate Enrollment by Gender and Age
Gender Age Fall
2006 Fall
2007 Fall
2008 Fall
2009 Fall
2010 5‐Yr
Change
Female Under 18 0 0 0 0 0 ‐‐
18‐19 0 0 0 0 0 ‐‐
20‐21 0 0 0 0 0 ‐‐
22‐24 20 13 9 14 17 ‐15%
25‐29 27 40 25 29 37 37%
30‐34 19 18 16 20 18 ‐5%
35‐39 4 8 8 8 18 350%
40‐49 9 16 15 17 26 189%
50‐64 2 7 6 7 10 400%
65 and over 1 0 1 1 0 ‐100%
Male Under 18 0 0 0 0 0 ‐‐
18‐19 0 0 0 0 0 ‐‐
20‐21 0 0 0 0 1 ‐‐
22‐24 10 11 11 12 18 80%
25‐29 25 26 26 27 36 44%
30‐34 14 14 13 19 19 36%
35‐39 14 10 12 10 11 ‐21%
40‐49 7 16 14 20 21 200%
50‐64 4 3 4 10 11 175%
65 and over 3 4 2 2 2 ‐33%
Age Fall
2006 Fall
2007 Fall
2008 Fall
2009 Fall
2010 5‐Yr
Change
Traditional 30 24 20 28 36 20%
Non‐Traditional 129 162 142 168 209 62%
Note: Traditional student is defined as student with age of 24 or younger Non Traditional student is defined as student with age of 25 or older
19%13% 12% 14% 15%
81%87% 88% 86% 85%
0%
20%
40%
60%
80%
100%
Fall 2006 Fall 2007 Fall 2008 Fall 2009 Fall 2010
KSU Graduate Enrollment by Age
Traditional Non Traditional
96

Kentucky State University Enrollment
Fact Book 2010‐2011
KSU Graduate Enrollment by State Origin
State Origin Fall
2006 Fall
2007 Fall
2008 Fall
2009 Fall
2010 5‐Yr
Change State Origin
Fall 2006
Fall 2007
Fall 2008
Fall 2009
Fall 2010
5‐Yr Change
Alabama 1 2 2 3 1 0% Minnesota 1 2 1 0 0 ‐100%
Alaska 2 0 0 0 0 ‐100% Mississippi 0 1 1 2 1 ‐‐
Arkansas 0 0 1 1 0 ‐‐ Missouri 2 1 0 0 1 ‐50%
California 0 0 2 2 0 ‐‐ Nebraska 0 1 0 0 0 ‐‐
Colorado 0 1 0 0 0 ‐‐ Nevada 0 0 1 0 0 ‐‐
District of Columbia 0 0 1 1 1 ‐‐ New Jersey 0 1 0 1 1 ‐‐
Florida 3 3 0 1 0 ‐100% New York 0 1 2 3 0 ‐‐
Georgia 1 2 2 3 3 200% North Carolina 1 0 1 2 1 0%
Illinois 4 4 4 4 3 ‐25% Ohio 6 7 9 18 26 333%
Indiana 5 4 2 5 6 20% Pennsylvania 1 0 0 0 1 0%
Iowa 1 0 0 0 0 ‐100% South Carolina 0 0 0 0 1 ‐‐
Kansas 0 1 1 1 0 ‐‐ South Dakota 0 0 0 2 1 ‐‐
Kentucky 103 123 108 112 155 50% Tennessee 2 4 0 2 2 0%
Louisiana 0 0 1 0 0 ‐‐ Texas 2 0 0 2 0 ‐100%
Maine 1 0 0 0 0 ‐100% Virginia 0 1 1 0 1 ‐‐
Maryland 0 0 0 2 4 ‐‐ West Virginia 1 1 1 1 2 100%
Michigan 2 3 4 5 9 350% Wisconsin 1 2 2 0 1 0%
97
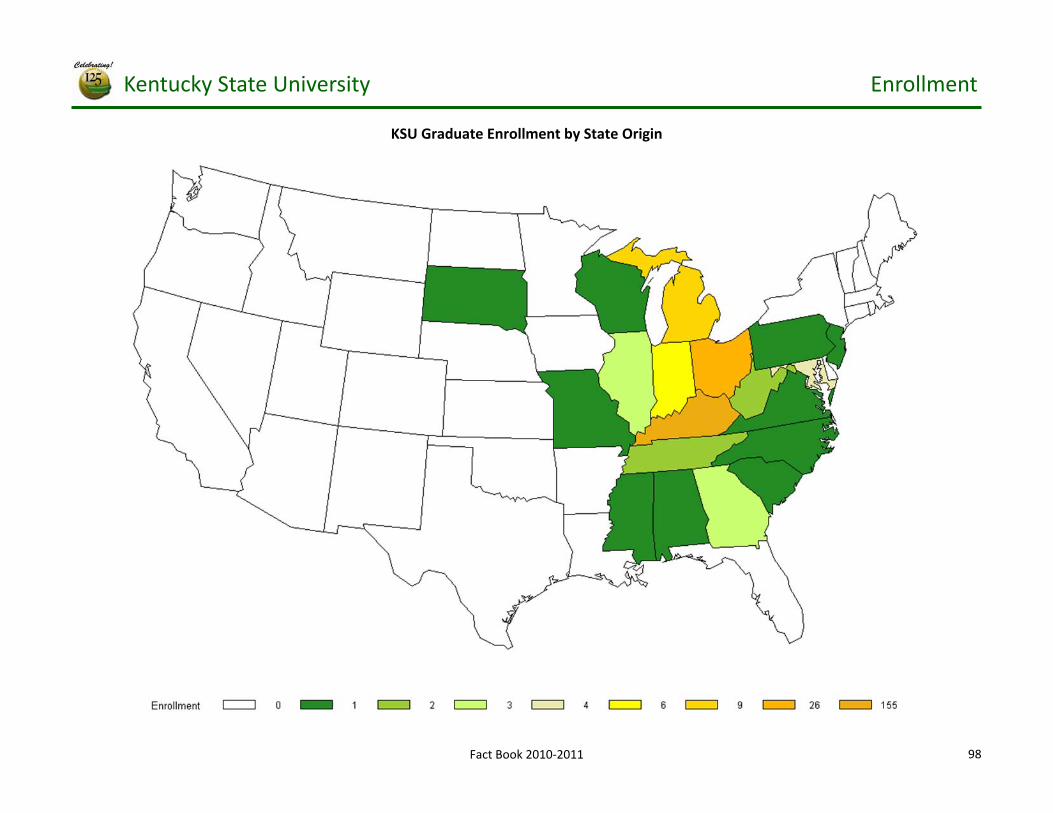
Kentucky State University Enrollment
Fact Book 2010‐2011
KSU Graduate Enrollment by State Origin
98

Kentucky State University Enrollment
Fact Book 2010‐2011
KSU Graduate Enrollment by Kentucky County Origin
County Origin Fall
2006 Fall
2007 Fall
2008 Fall
2009 Fall
2010 5‐Yr
Change County Origin
Fall 2006
Fall 2007
Fall 2008
Fall 2009
Fall 2010
5‐Yr Change
Allen 0 0 0 0 1 ‐‐ Estill 0 0 0 0 0 ‐‐ Adair 0 0 0 0 0 ‐‐ Fayette 21 22 25 18 29 38% Anderson 5 5 2 3 6 20% Fleming 1 0 0 0 0 ‐100% Ballard 0 0 0 0 0 ‐‐ Floyd 0 0 0 0 0 ‐‐ Barren 2 1 1 0 0 ‐100% Franklin 45 42 33 30 40 ‐11% Bell 0 0 0 0 0 ‐‐ Fulton 0 0 0 0 0 ‐‐ Boone 0 0 0 1 2 ‐‐ Gallatin 0 0 0 0 0 ‐‐ Bourbon 0 0 0 0 0 ‐‐ Garrard 0 0 0 0 0 ‐‐ Boyd 0 0 1 1 1 ‐‐ Grant 0 0 0 0 0 ‐‐ Boyle 1 1 1 1 0 ‐100% Grayson 0 0 0 0 0 ‐‐ Breathitt 0 0 0 0 0 ‐‐ Graves 0 0 0 0 0 ‐‐ Breckinridge 0 0 0 0 0 ‐‐ Greenup 0 0 0 0 0 ‐‐ Bullitt 0 0 0 0 0 ‐‐ Hancock 0 0 0 0 0 ‐‐ Caldwell 0 0 0 0 0 ‐‐ Hardin 0 2 3 0 1 ‐‐ Calloway 0 0 0 0 0 ‐‐ Harlan 0 0 0 0 0 ‐‐ Campbell 0 0 0 1 0 ‐‐ Harrison 0 1 2 1 1 ‐‐ Carlisle 0 0 0 0 0 ‐‐ Hart 0 0 0 0 0 ‐‐ Carroll 0 1 0 0 0 ‐‐ Henderson 1 1 0 1 1 0% Carter 0 0 0 0 0 ‐‐ Henry 0 1 3 4 3 ‐‐ Christian 1 1 2 4 4 300% Hickman 0 0 0 0 0 ‐‐ Clark 0 0 0 0 1 ‐‐ Hopkins 0 0 0 1 1 ‐‐ Clay 0 0 0 0 0 ‐‐ Jefferson 10 20 12 22 34 240% Clinton 0 0 0 0 0 ‐‐ Jessamine 0 0 2 1 1 ‐‐ Crittenden 0 0 0 0 0 ‐‐ Johnson 0 0 0 1 0 ‐‐ Daviess 0 1 1 1 2 ‐‐ Kenton 0 0 0 0 4 ‐‐ Edmonson 0 0 0 0 0 ‐‐ Knott 0 0 0 0 0 ‐‐
99

Kentucky State University Enrollment
Fact Book 2010‐2011
County Origin Fall
2006 Fall
2007 Fall
2008 Fall
2009 Fall
2010 5‐Yr
Change County Origin
Fall 2006
Fall 2007
Fall 2008
Fall 2009
Fall 2010
5‐Yr Change
Knox 0 0 0 0 0 ‐‐ Owen 1 2 2 2 3 200% Larue 0 0 0 0 0 ‐‐ Pendleton 0 0 0 0 0 ‐‐ Laurel 0 0 0 0 0 ‐‐ Perry 0 0 0 0 0 ‐‐ Lawrence 0 0 0 1 1 ‐‐ Pike 0 0 0 0 1 ‐‐ Letcher 0 0 0 1 1 ‐‐ Powell 0 0 0 0 0 ‐‐ Lewis 0 0 0 0 0 ‐‐ Pulaski 0 0 1 0 0 ‐‐ Lincoln 0 1 0 0 0 ‐‐ Rockastle 0 0 0 0 0 ‐‐ Logan 0 0 0 0 0 ‐‐ Rowan 0 0 0 0 0 ‐‐ Lyon 0 0 0 0 0 ‐‐ Russell 0 0 0 0 0 ‐‐ McCracken 0 1 1 1 1 ‐‐ Scott 0 2 2 4 5 ‐‐ McCreary 0 0 0 0 0 ‐‐ Shelby 7 6 5 3 6 ‐14% Madison 1 0 1 0 1 0% Simpson 0 0 0 0 0 ‐‐ Marion 0 0 0 0 0 ‐‐ Spencer 0 0 0 0 0 ‐‐ Martin 0 0 0 0 0 ‐‐ Taylor 1 1 0 0 0 ‐100% Mason 0 0 0 0 0 ‐‐ Todd 0 0 0 0 0 ‐‐ Meade 0 1 1 0 0 ‐‐ Trigg 1 0 0 3 0 ‐100% Menifee 0 0 0 1 0 ‐‐ Trimble 0 0 0 0 0 ‐‐ Mercer 0 0 0 0 0 ‐‐ Union 0 0 0 0 0 ‐‐ Metcalfe 0 0 0 0 0 ‐‐ Warren 0 3 0 1 2 ‐‐ Monroe 0 0 0 0 0 ‐‐ Washington 1 0 0 0 0 ‐100% Montgomery 1 1 1 0 0 ‐100% Wayne 0 0 0 0 0 ‐‐ Morgan 0 0 0 0 0 ‐‐ Webster 0 0 0 1 0 ‐‐ Nelson 0 2 2 0 0 ‐‐ Whitley 0 0 1 0 0 ‐‐ Nicholas 0 0 0 0 0 ‐‐ Wolfe 0 0 0 0 0 ‐‐ Ohio 0 0 0 0 0 ‐‐ Woodford 3 3 3 2 2 ‐33% Oldham 0 1 0 1 0 ‐‐ Non‐Kentucky 56 63 54 84 90 61%
100

Kentucky State University Enrollment
Fact Book 2010‐2011
KSU Graduate Enrollment by Kentucky County Origin
101

Kentucky State University Enrollment
Fact Book 2010‐2011
KSU Graduate Enrollment by Country Origin
Country Origin Fall
2006 Fall
2007 Fall
2008 Fall
2009 Fall
2010 5‐Yr
Change Country Origin
Fall 2006
Fall 2007
Fall 2008
Fall 2009
Fall 2010
5‐Yr Change
Australia 0 0 1 0 0 ‐‐ Jamaica 0 0 0 2 0 ‐‐ Bangladesh 0 0 1 0 0 ‐‐ Kuwait 1 0 0 0 1 0% Burma 0 0 1 1 0 ‐‐ Lebanon 0 0 0 0 1 ‐‐ Canada 0 0 1 1 0 ‐‐ Lithuania 0 0 0 1 0 ‐‐ Congo 0 0 0 0 1 ‐‐ Mauritius 1 0 0 0 0 ‐100% China 1 2 2 2 1 0% Mexico 0 1 0 1 0 ‐‐ Cameroon 3 3 1 3 0 ‐100% Nigeria 0 0 1 2 1 ‐‐ Colombia 0 1 0 1 1 ‐‐ Nepal 0 0 0 0 2 ‐‐ Dominican Rep 1 0 0 0 0 ‐100% Peru 0 0 0 1 0 ‐‐ Egypt 1 1 0 0 0 ‐100% Pakistan 0 1 0 0 0 ‐‐ Ethiopia 0 0 0 0 1 ‐‐ Romania 0 1 0 0 0 ‐‐ Gambia 2 0 0 0 2 0% Philippines 0 0 0 1 0 ‐‐ Ghana 0 0 1 1 2 ‐‐ Rwanda 1 1 0 0 0 ‐100% Guyana 0 0 0 1 1 ‐‐ Saudi Arabia 0 1 1 1 1 ‐‐ Honduras 1 0 0 0 0 ‐100% Senegal 0 0 0 1 0 ‐‐ Indonesia 0 1 1 1 0 ‐‐ Singapore 1 0 0 0 0 ‐100% India 4 7 4 2 8 100% Zimbabwe 1 0 0 0 0 ‐100% Iraq 1 1 0 0 1 0%
102

Kentucky State University Enrollment
Fact Book 2010‐2011
KSU Full‐Time Equivalent
There are several different techniques used to calculate the Full‐Time Equivalent (FTE). Kentucky Council on Postsecondary Education (CPE) has been using the formula (1), but since Fall 2010 CPE started using the new formula (2). Combining the enrollment number with credit hours, formula (3) is used to illustrate the actual FTE, while the Federal IPEDS uses different technique as describe in formula (4).
(1) CPE Previous Formula FTE = Full‐time enrollment + 1/3 Part‐time enrollment
Level Status Fall 2006 Fall 2007 Fall 2008 Fall 2009 Fall 2010 5‐Yr Change Undergraduate Full‐Time 1,769 1,876 1,926 2,106 2,133 Part‐Time 572 634 571 532 473 Undergraduate FTE 1,960 2,087 2,116 2,283 2,291 17% Graduate Full‐Time 54 88 58 98 123 Part‐Time 105 98 104 98 122 Graduate FTE 89 121 93 131 164 84% Total Full‐Time 1,823 1,964 1,984 2,204 2,256 Part‐Time 677 732 675 630 595 Total FTE 2,049 2,208 2,209 2,414 2,454 20%
(2) CPE Current Formula FTE = (undergraduate student credit hours/15) + (graduate student credit hours/12)
Level Fall 2006 Fall 2007 Fall 2008 Fall 2009 Fall 2010 5‐Yr Change Undergraduate Student Credit Hours 29,060 31,305 30,555 32,389 32,907 Undergraduate FTE 1,937 2,087 2,037 2,159 2,194 13% Graduate Student Credit Hours 1,066 1,464 1,062 1,466 1,847 Graduate FTE 89 122 89 122 154 73% Total Student Credit Hours 30,126 32,769 31,617 33,855 34,754 Total FTE 2,026 2,209 2,125 2,281 2,348 16%
103

Kentucky State University Enrollment
Fact Book 2010‐2011
(3) Actual FTE Formula FTE = Full‐time enrollment + (undergraduate part‐time credit hours/12) + (graduate student credit hours/9)
Level Status Fall 2006 Fall 2007 Fall 2008 Fall 2009 Fall 2010 5‐Yr Change Undergraduate Full‐Time 1,769 1,876 1,926 2,106 2,133 Part‐Time Credit Hours 3,409 3,463 3,176 2,810 2,881 Undergraduate FTE 2,053 2,165 2,191 2,340 2,373 16% Graduate Full‐Time 54 88 58 98 123 Part‐Time Credit Hours 528 496 478 489 617 Graduate FTE 113 143 111 152 192 70% Total Full‐Time 1,823 1,964 1,984 2,204 2,256 Part‐Time Proportion 343 344 318 288 309 Total FTE 2,166 2,308 2,302 2,492 2,565 18%
(4) Federal IPEDS FTE Formula FTE = Undergraduate full‐time enrollment + 0.403543 undergraduate part‐time enrollment + graduate full‐time enrollment + 0.361702 graduate
part‐time enrollment
Level Status Fall 2006 Fall 2007 Fall 2008 Fall 2009 Fall 2010 5‐Yr Change Undergraduate Full‐Time 1,769 1,876 1,926 2,106 2,133 Part‐Time 572 634 571 532 473 Undergraduate FTE 2,000 2,132 2,156 2,321 2,324 16% Graduate Full‐Time 54 88 58 98 123 Part‐Time 105 98 104 98 122 Graduate FTE 92 123 96 133 167 82% Total Full‐Time 1,823 1,964 1,984 2,204 2,256 Part‐Time 677 732 675 630 595 Total FTE 2,092 2,255 2,252 2,454 2,491 19%
104

Kentucky State University Enrollment
Fact Book 2010‐2011
KSU Summer Enrollment
Level Summer
2006 Summer
2007 Summer
2008 Summer
2009 Summer
2010 5‐Yr
Change
Undergraduate 834 767 776 750 849 2% Graduate 71 107 70 36 72 1%
Total 905 874 846 786 921 2%
Gender Race Summer 2006 Summer 2007 Summer 2008 Summer 2009 Summer 2010 5‐Yr Change Female Nonresident Alien 0 2 14 0 37 ‐‐ Black, Non‐Hispanic 316 279 225 256 302 ‐4% American Indian/Alaskan 0 0 1 0 2 ‐‐ Asian 6 5 5 0 1 ‐83% Hispanic 1 0 2 4 3 200% White, Non‐Hispanic 236 191 157 137 110 ‐53% Unknown 13 53 53 66 66 408% Male Nonresident Alien 1 4 10 0 29 2800% Black, Non‐Hispanic 240 205 240 191 246 3% American Indian/Alaskan 0 0 0 0 1 ‐‐ Asian 12 6 2 0 1 ‐92% Hispanic 2 1 3 2 5 150% White, Non‐Hispanic 70 106 87 81 65 ‐7% Unknown 8 22 47 49 53 563%
Gender Summer
2006 Summer
2007 Summer
2008 Summer
2009 Summer
2010 5‐Yr
Change
Female 572 530 457 463 521 ‐9% Male 333 344 389 323 400 20%
Total 905 874 846 786 921 2%
Race Summer
2006 Summer
2007 Summer
2008 Summer
2009 Summer
2010 5‐Yr
Change
NR Alien 1 6 24 0 66 6500% Black 556 484 465 447 548 ‐1%
Am. Indian 0 0 1 0 3 ‐‐ Asian 18 11 7 0 2 ‐89%
Hawaiian 0 0 0 0 0 ‐‐ Two or More 0 0 0 0 0 ‐‐
Hispanic 3 1 5 6 8 167% White 306 297 244 218 175 ‐43%
Unknown 21 75 100 115 119 467%
105
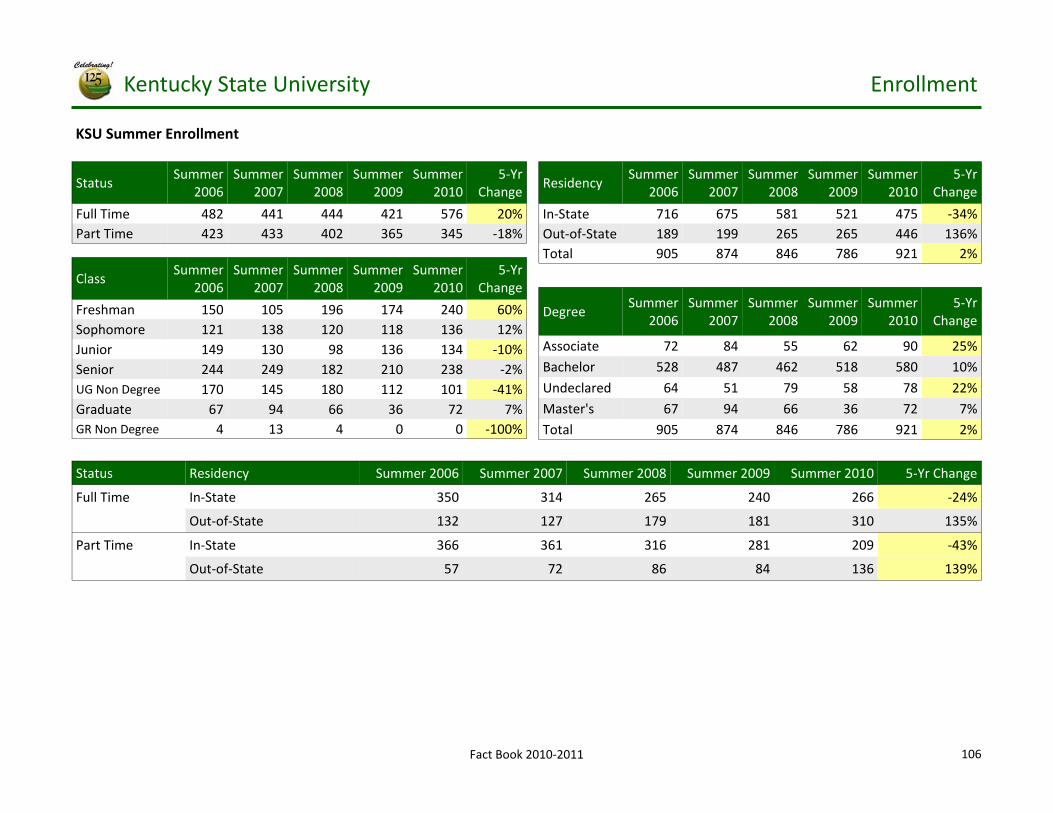
Kentucky State University Enrollment
Fact Book 2010‐2011
KSU Summer Enrollment
Status Residency Summer 2006 Summer 2007 Summer 2008 Summer 2009 Summer 2010 5‐Yr Change
Full Time In‐State 350 314 265 240 266 ‐24%
Out‐of‐State 132 127 179 181 310 135%
Part Time In‐State 366 361 316 281 209 ‐43%
Out‐of‐State 57 72 86 84 136 139%
Class Summer
2006 Summer
2007 Summer
2008 Summer
2009 Summer
2010 5‐Yr
Change
Freshman 150 105 196 174 240 60% Sophomore 121 138 120 118 136 12% Junior 149 130 98 136 134 ‐10% Senior 244 249 182 210 238 ‐2% UG Non Degree 170 145 180 112 101 ‐41% Graduate 67 94 66 36 72 7% GR Non Degree 4 13 4 0 0 ‐100%
Degree Summer
2006 Summer
2007 Summer
2008 Summer
2009 Summer
2010 5‐Yr
Change
Associate 72 84 55 62 90 25% Bachelor 528 487 462 518 580 10%
Undeclared 64 51 79 58 78 22% Master's 67 94 66 36 72 7% Total 905 874 846 786 921 2%
Status Summer
2006 Summer
2007 Summer
2008 Summer
2009 Summer
2010 5‐Yr
Change
Full Time 482 441 444 421 576 20% Part Time 423 433 402 365 345 ‐18%
Residency Summer
2006 Summer
2007 Summer
2008 Summer
2009 Summer
2010 5‐Yr
Change
In‐State 716 675 581 521 475 ‐34% Out‐of‐State 189 199 265 265 446 136% Total 905 874 846 786 921 2%
106

Kentucky State University Enrollment
Fact Book 2010‐2011
KSU Spring Enrollment
Level Spring 2007
Spring 2008
Spring 2009
Spring 2010
Spring 2011
5‐Yr Change
Undergraduate 2,107 2,306 2,173 2,300 2,307 9% Graduate 166 165 152 205 224 35% Total 2,273 2,471 2,325 2,505 2,531 11%
Gender Race Spring 2007 Spring 2008 Spring 2009 Spring 2010 Spring 2011 5‐Yr Change Female Nonresident Alien 14 45 28 17 43 207% Black, Non‐Hispanic 723 769 712 829 841 16% American Indian/Alaskan 0 3 0 2 0 ‐‐ Asian 9 11 9 7 4 ‐56% Hispanic 4 4 4 23 19 375% White, Non‐Hispanic 505 459 380 419 389 ‐23% Unknown 49 113 163 159 198 304%
Male Nonresident Alien 26 46 23 17 28 8% Black, Non‐Hispanic 633 630 609 617 582 ‐8% American Indian/Alaskan 3 1 0 1 1 ‐67% Asian 11 14 11 2 3 ‐73% Hispanic 6 4 3 18 14 133% White, Non‐Hispanic 254 250 197 246 216 ‐15% Unknown 36 122 186 148 154 328%
Two or More Races 0 0 0 0 18 ‐‐ Native Hawaiian/Other Pacific 0 0 0 0 0 ‐‐
Two or More Races 0 0 0 0 18 ‐‐ Native Hawaiian/Other Pacific 0 0 0 0 3 ‐‐
Gender Spring 2007
Spring 2008
Spring 2009
Spring 2010
Spring 2011
5‐Yr Change
Female 1,304 1,404 1,296 1,456 1,512 16% Male 969 1,067 1,029 1,049 1,019 5% Total 2,273 2,471 2,325 2,505 2,531 11%
Race Spring 2007
Spring 2008
Spring 2009
Spring 2010
Spring 2011
5‐Yr Change
NR Alien 40 91 51 34 71 78% Black 1,356 1,399 1,321 1,446 1,423 5% Am. Indian 3 4 0 3 1 ‐‐ Asian 20 25 20 9 7 ‐65%
Unknown 85 235 349 307 352 314% Two or More 0 0 0 0 36 ‐‐
Hispanic 10 8 7 41 33 230% White 759 709 577 665 605 ‐20%
Hawaiian 0 0 0 0 3 ‐‐
107

Kentucky State University Enrollment
Fact Book 2010‐2011
KSU Spring Enrollment
Status Residency Spring 2007 Spring 2008 Spring 2009 Spring 2010 Spring 2011 5‐Yr Change
Full Time In‐State 987 976 932 1062 1074 9%
Out‐of‐State 648 763 793 831 908 40%
Part Time In‐State 592 655 540 555 458 ‐23%
Out‐of‐State 46 77 60 57 91 98%
Class Spring 2007
Spring 2008
Spring 2009
Spring 2010
Spring 2011
5‐Yr Change
Freshman 638 791 742 754 841 32% Sophomore 381 370 392 416 477 25% Junior 316 294 298 343 304 ‐4% Senior 515 481 461 495 486 ‐6% UG Non Degree 257 370 280 292 199 ‐23% Graduate 156 154 146 195 211 35% GR Non Degree 10 11 6 10 13 30%
Degree Spring 2007
Spring 2008
Spring 2009
Spring 2010
Spring 2011
5‐Yr Change
Associate 277 287 247 261 339 22% Bachelor 1,350 1,390 1,423 1,514 1,530 13%
Undeclared 223 259 223 233 239 7% Master's 156 154 146 195 211 35% Total 2,273 2,471 2,325 2,505 2,531 11%
Status Spring 2007
Spring 2008
Spring 2009
Spring 2010
Spring 2011
5‐Yr Change
Full Time 1,635 1,739 1,725 1,893 1,982 21% Part Time 638 732 600 612 549 ‐14%
Residency Spring 2007
Spring 2008
Spring 2009
Spring 2010
Spring 2011
5‐Yr Change
In‐State 1,579 1,631 1,472 1,617 1,532 ‐3% Out‐of‐State 694 840 853 888 999 44% Total 2,273 2,471 2,325 2,505 2,531 11%
108

Kentucky State University Enrollment
Fact Book 2010‐2011
KSU Unduplicated Enrollment (Summer‐Fall‐Spring)
Level 2006‐2007
2007‐2008
2008‐2009
2009‐2010
2010‐2011
5‐Yr Change
Undergraduate 2,880 3,033 2,947 3,140 3,147 9%
Graduate 233 234 214 257 315 35%
Total Unduplicated 3,113 3,267 3,161 3,397 3,462 11%
New Students 2006‐2007
2007‐2008
2008‐2009
2009‐2010
2010‐2011
5‐Yr Change
First‐Time Freshmen 627 729 742 595 696 11%
First‐Time Transfer 157 144 132 180 219 39%
Total Unduplicated 3,113 3,267 3,161 3,397 3,462 11%
Continuing 2,329 2,394 2,287 2,622 2,547 9%
0
500
1,000
1,500
2,000
2,500
3,000
3,500
2006‐07 2007‐08 2008‐09 2009‐10 2010‐11
Unduplicated Enrollment by Level
Undergraduate Graduate
0%
20%
40%
60%
80%
100%
2006‐07 2007‐08 2008‐09 2009‐10 2010‐11
Unduplicated First‐Time Enrollment
Total Enrollment First‐Time Freshmen First‐Time Transfer
Gender 2006‐2007
2007‐2008
2008‐2009
2009‐2010
2010‐2011
5‐Yr Change
Female 2,880 3,033 2,947 3,140 3,147 9% Male 233 234 214 257 315 35%
Race 2006‐2007
2007‐2008
2008‐2009
2009‐2010
2010‐2011
5‐Yr Change
NR Alien 40 126 76 45 130 225% Hispanic 15 12 13 45 39 160% Am. Indian 3 5 2 6 4 33% Asian 62 31 25 15 10 ‐84% Black 1,818 1,799 1,761 1,869 1,884 4%
Unknown 102 348 469 487 522 412%
Hawaiian 0 0 0 0 3 ‐‐ White 1,073 946 815 930 821 ‐23% Two or More 0 0 0 0 49 ‐‐
109

Kentucky State University Enrollment
Fact Book 2010‐2011
KSU Unduplicated Undergraduate Enrollment (Summer‐Fall‐Spring)
Gender Race 2006‐07 2007‐08 2008‐09 2009‐10 2010‐11 5‐Yr Change Female Nonresident Alien 12 58 33 18 66 450% Hispanic 5 5 7 24 21 320% American Indian/Alaskan 0 3 0 4 2 ‐‐
Asian 33 14 10 7 2 ‐94% Black, Non Hispanic 872 917 886 987 985 13%
Native Hawaiian/Other Pacific 0 0 0 0 0 ‐‐ White, Non Hispanic 682 570 478 536 473 ‐31%
Two or More Races 0 0 0 0 28 ‐‐ Unknown 48 170 223 238 265 452%
Total Female Undergraduate 1,652 1,737 1,637 1,814 1,842 12%
Male Nonresident Alien 20 52 30 16 44 120% Hispanic 9 6 5 18 13 44% American Indian/Alaskan 3 2 1 1 1 ‐67%
Asian 24 11 10 4 3 ‐88% Black, Non Hispanic 833 784 778 757 741 ‐11%
Native Hawaiian/Other Pacific 0 0 0 0 2 ‐‐ White, Non Hispanic 305 287 252 302 245 ‐20%
Two or More Races 0 0 0 0 18 ‐‐ Unknown 34 154 234 228 238 600% Total Male Undergraduate 1,228 1,296 1,310 1,326 1,305 6%
110
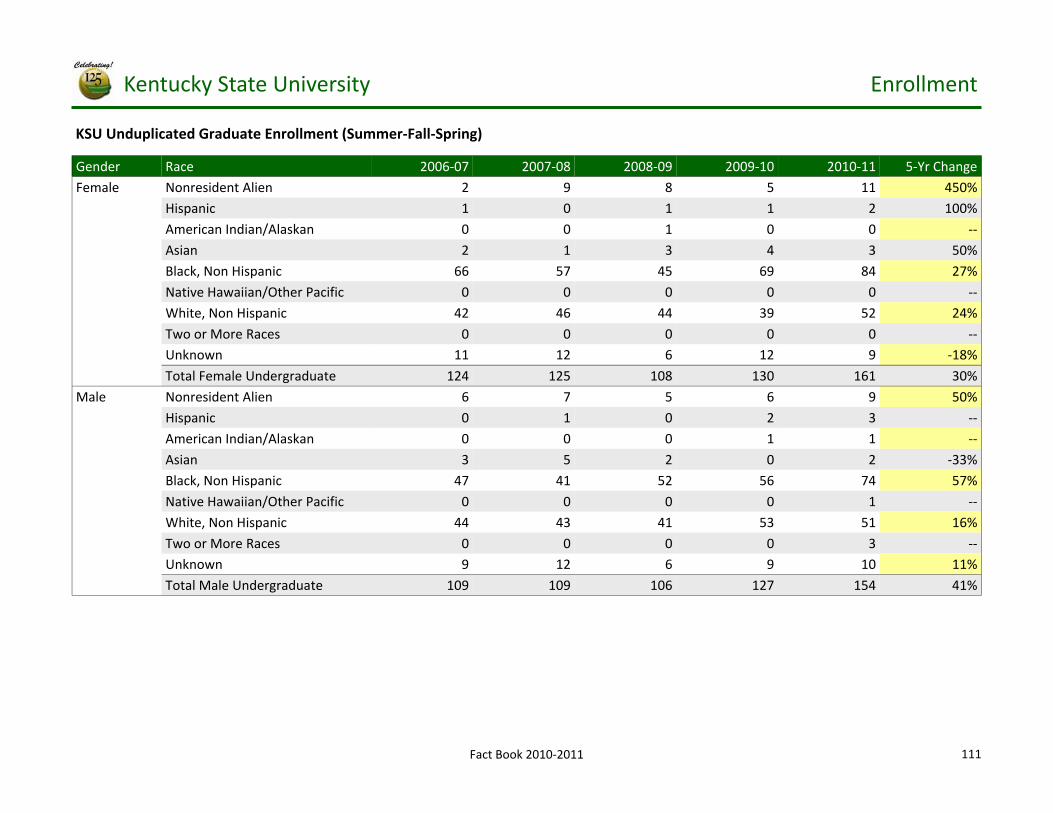
Kentucky State University Enrollment
Fact Book 2010‐2011
KSU Unduplicated Graduate Enrollment (Summer‐Fall‐Spring)
Gender Race 2006‐07 2007‐08 2008‐09 2009‐10 2010‐11 5‐Yr Change Female Nonresident Alien 2 9 8 5 11 450% Hispanic 1 0 1 1 2 100% American Indian/Alaskan 0 0 1 0 0 ‐‐
Asian 2 1 3 4 3 50% Black, Non Hispanic 66 57 45 69 84 27%
Native Hawaiian/Other Pacific 0 0 0 0 0 ‐‐ White, Non Hispanic 42 46 44 39 52 24%
Two or More Races 0 0 0 0 0 ‐‐ Unknown 11 12 6 12 9 ‐18%
Total Female Undergraduate 124 125 108 130 161 30%
Male Nonresident Alien 6 7 5 6 9 50% Hispanic 0 1 0 2 3 ‐‐ American Indian/Alaskan 0 0 0 1 1 ‐‐
Asian 3 5 2 0 2 ‐33% Black, Non Hispanic 47 41 52 56 74 57%
Native Hawaiian/Other Pacific 0 0 0 0 1 ‐‐ White, Non Hispanic 44 43 41 53 51 16%
Two or More Races 0 0 0 0 3 ‐‐ Unknown 9 12 6 9 10 11% Total Male Undergraduate 109 109 106 127 154 41%
111
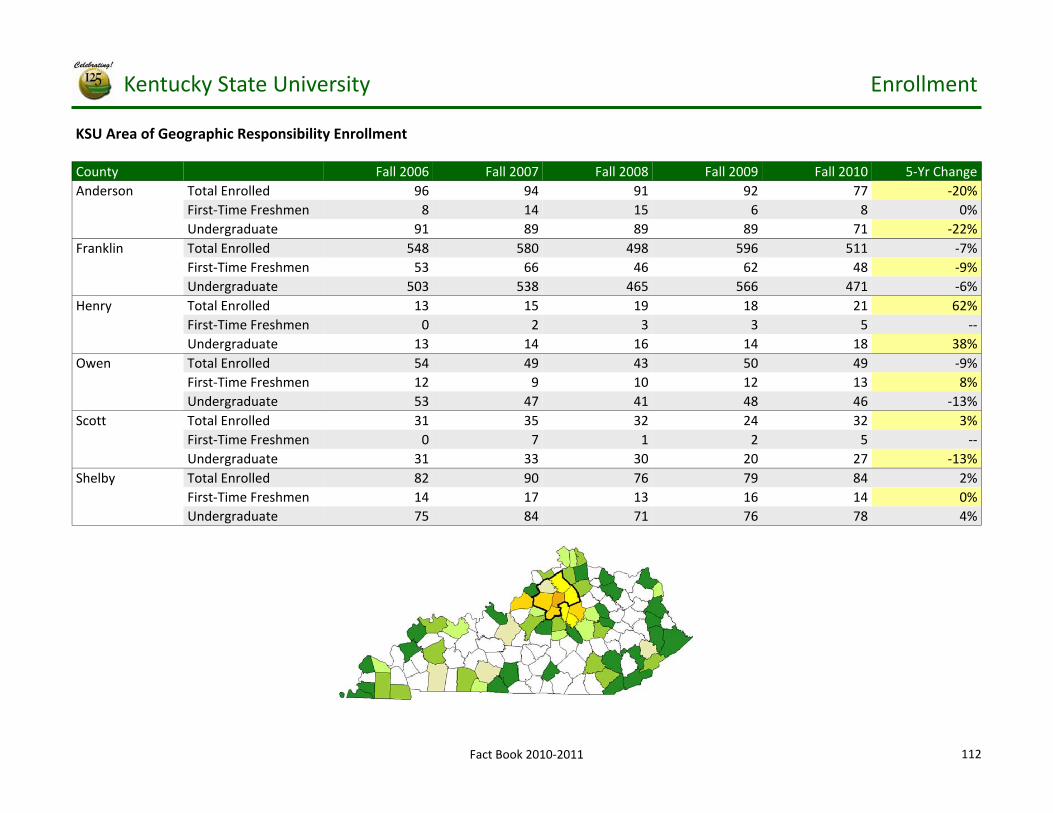
Kentucky State University Enrollment
Fact Book 2010‐2011
KSU Area of Geographic Responsibility Enrollment
County Fall 2006 Fall 2007 Fall 2008 Fall 2009 Fall 2010 5‐Yr Change Anderson Total Enrolled 96 94 91 92 77 ‐20% First‐Time Freshmen 8 14 15 6 8 0% Undergraduate 91 89 89 89 71 ‐22% Franklin Total Enrolled 548 580 498 596 511 ‐7% First‐Time Freshmen 53 66 46 62 48 ‐9% Undergraduate 503 538 465 566 471 ‐6% Henry Total Enrolled 13 15 19 18 21 62% First‐Time Freshmen 0 2 3 3 5 ‐‐ Undergraduate 13 14 16 14 18 38% Owen Total Enrolled 54 49 43 50 49 ‐9% First‐Time Freshmen 12 9 10 12 13 8% Undergraduate 53 47 41 48 46 ‐13% Scott Total Enrolled 31 35 32 24 32 3% First‐Time Freshmen 0 7 1 2 5 ‐‐ Undergraduate 31 33 30 20 27 ‐13% Shelby Total Enrolled 82 90 76 79 84 2% First‐Time Freshmen 14 17 13 16 14 0% Undergraduate 75 84 71 76 78 4%
112

Kentucky State University Student Credit Hours
Fact Book 2010‐2011
Undergraduate Student Credit Hours (SCH) by College
College Division Department Fall 2006 Fall 2007 Fall 2008 Fall 2009 Fall 2010 5‐Yr Change CA ‐ College of Arts, Social Sciences & In‐terdisciplinary Studies
BSSC ‐ Behavioral & Social Sciences
African American Studies 39 12 3 0 9 ‐77% Geography 54 0 30 42 90 67% History 720 885 894 600 747 4% Political Science 654 780 735 762 732 12% Psychology 1,019 1,096 965 1,464 1,527 50% Sociology 499 564 609 606 663 33% Total BSSC 2,985 3,337 3,236 3,474 3,768 26%
FIAR ‐ Fine Arts Art 722 645 660 666 630 ‐13% Communication 0 36 21 0 0 ‐‐ Music ‐ Applied 83 108 91 90 56 ‐32% Music ‐ Class Instruction 22 37 23 26 58 164% Music Education 8 24 51 58 56 600% Music Industry 0 0 24 0 6 ‐‐ Music ‐ Performance 224 237 208 208 268 20% Music 644 683 725 571 562 ‐13% Speech 903 825 750 807 981 9% Theatre 33 84 150 156 162 391% Total FIAR 2,639 2,679 2,703 2,582 2,779 5%
LLPH ‐ Lit. Language & Philosophy
American Sign Language 102 117 114 108 120 18% English 4,938 5,589 5,490 5,880 6,054 23% English Second Language 0 0 0 225 84 ‐‐ French 90 87 111 129 132 47% Journalism 0 0 6 144 228 ‐‐ Korean 6 0 0 0 0 ‐100% Philosophy 42 87 84 69 54 29% Spanish 927 939 951 999 942 2% Total LLPH 6,105 6,819 6,756 7,554 7,614 25% Honor Core 582 659 656 696 784 35% Integrative Studies 1,179 1,353 1,509 1,494 1,395 18% Liberal Studies ‐ Honors 151 143 79 134 144 ‐5% Total WYSL 1,912 2,155 2,244 2,324 2,323 21%
WYSL ‐ Whitney Young School of Honors & Liberal Studies
113
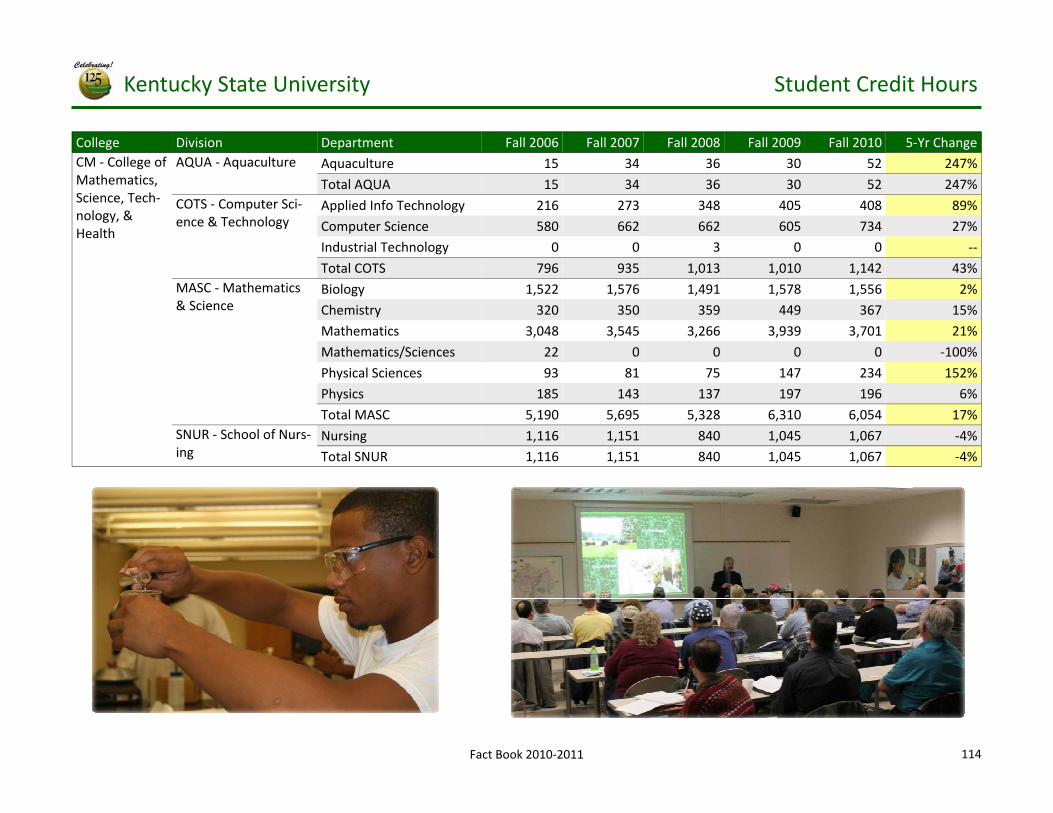
Kentucky State University Student Credit Hours
Fact Book 2010‐2011
College Division Department Fall 2006 Fall 2007 Fall 2008 Fall 2009 Fall 2010 5‐Yr Change CM ‐ College of Mathematics, Science, Tech‐nology, & Health
AQUA ‐ Aquaculture Aquaculture 15 34 36 30 52 247%
Total AQUA 15 34 36 30 52 247% COTS ‐ Computer Sci‐ence & Technology
Applied Info Technology 216 273 348 405 408 89% Computer Science 580 662 662 605 734 27% Industrial Technology 0 0 3 0 0 ‐‐
Total COTS 796 935 1,013 1,010 1,142 43% MASC ‐ Mathematics & Science
Biology 1,522 1,576 1,491 1,578 1,556 2% Chemistry 320 350 359 449 367 15% Mathematics 3,048 3,545 3,266 3,939 3,701 21%
Mathematics/Sciences 22 0 0 0 0 ‐100% Physical Sciences 93 81 75 147 234 152% Physics 185 143 137 197 196 6%
Total MASC 5,190 5,695 5,328 6,310 6,054 17%
Nursing 1,116 1,151 840 1,045 1,067 ‐4% Total SNUR 1,116 1,151 840 1,045 1,067 ‐4%
SNUR ‐ School of Nurs‐ing
114
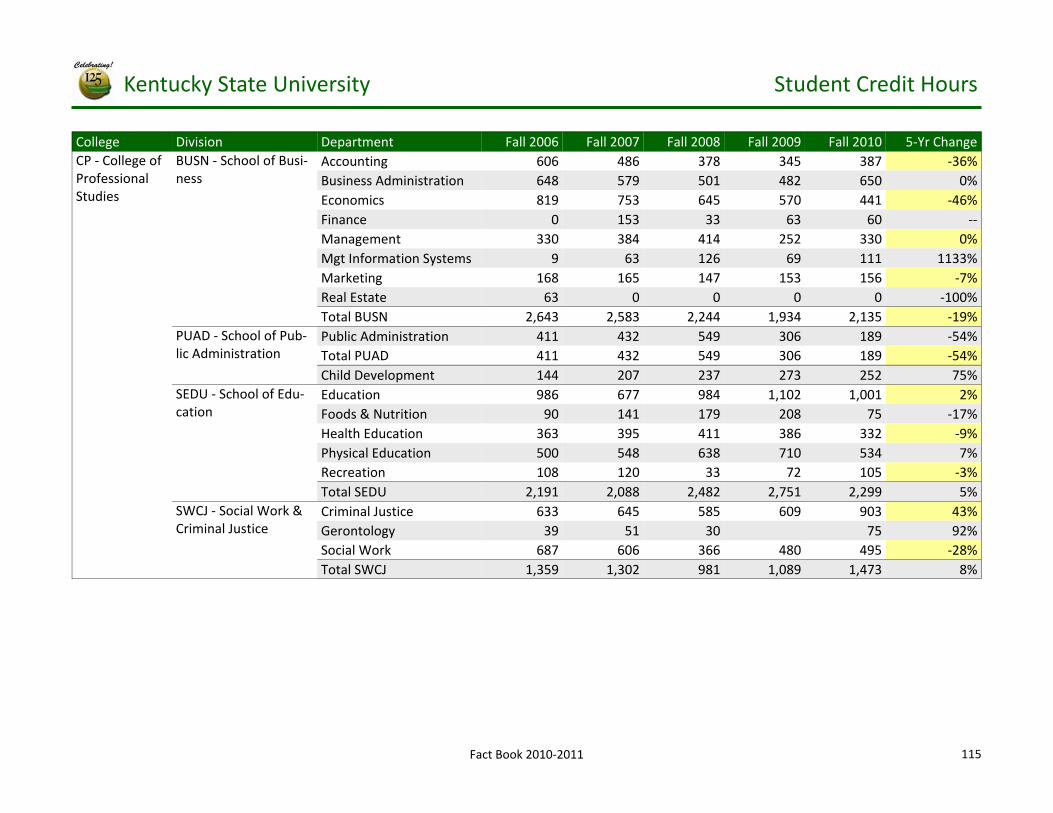
Kentucky State University Student Credit Hours
Fact Book 2010‐2011
College Division Department Fall 2006 Fall 2007 Fall 2008 Fall 2009 Fall 2010 5‐Yr Change BUSN ‐ School of Busi‐ness
Accounting 606 486 378 345 387 ‐36% Business Administration 648 579 501 482 650 0% Economics 819 753 645 570 441 ‐46% Finance 0 153 33 63 60 ‐‐ Management 330 384 414 252 330 0% Mgt Information Systems 9 63 126 69 111 1133% Marketing 168 165 147 153 156 ‐7% Real Estate 63 0 0 0 0 ‐100% Total BUSN 2,643 2,583 2,244 1,934 2,135 ‐19%
PUAD ‐ School of Pub‐lic Administration
Public Administration 411 432 549 306 189 ‐54% Total PUAD 411 432 549 306 189 ‐54% Child Development 144 207 237 273 252 75%
SEDU ‐ School of Edu‐cation
Education 986 677 984 1,102 1,001 2% Foods & Nutrition 90 141 179 208 75 ‐17% Health Education 363 395 411 386 332 ‐9% Physical Education 500 548 638 710 534 7% Recreation 108 120 33 72 105 ‐3% Total SEDU 2,191 2,088 2,482 2,751 2,299 5%
SWCJ ‐ Social Work & Criminal Justice
Criminal Justice 633 645 585 609 903 43% Gerontology 39 51 30 75 92% Social Work 687 606 366 480 495 ‐28% Total SWCJ 1,359 1,302 981 1,089 1,473 8%
CP ‐ College of Professional Studies
115

Kentucky State University Student Credit Hours
Fact Book 2010‐2011
College Division Department Fall 2006 Fall 2007 Fall 2008 Fall 2009 Fall 2010 5‐Yr Change KS ‐ Kentucky State Under‐graduate
CCOL ‐ Community College
Credit for Life Experience 18 9 15 18 36 100%
Total CCOL 18 9 15 18 36 100% CPCO ‐ Community Programs
Air Force Studies 3 2 2 16 14 367% Army Military Studies 7 15 10 20 11 57% Consortium 0 0 0 12 0 ‐‐
Total CPCO 10 17 12 48 25 150%
Africana Studies 0 0 0 0 9 ‐‐ Cooperative Education 171 168 303 255 369 116% University Orientation 1,539 1,839 1,788 1,583 1,437 ‐7%
Total KSUG 1,710 2,007 2,091 1,838 1,815 6%
KSUG ‐ Kentucky State University
116
RETENTION RATERETENTION RATE
Fact Book 2010‐2011

Kentucky State University Retention Rate
Fact Book 2010‐2011
Retention Rate
Retention Rate is a measure of the rate at which students persist in their educational program at the Kentucky State University, expressed as a percentage. This is a percent‐age of first‐time degree seeking undergraduate (freshman) who entered the Kentucky State University in a given fall semester and re‐enrolled in the following fall semester.
5‐Yr 2005 2006 2007 2008 2009 Change Cohort Size 416 577 678 687 540 Returned next Fall 228 278 331 360 290 Retention Rate 54.8% 48.2% 48.8% 52.4% 53.7% ‐1%
Cohort Year
State‐Wide Retention Rate Among Kentucky Public Institutions
The proportion of first‐time postsecondary undergraduate degree‐seeking students who enter a public Kentucky institution in a given fall semester and return to any Kentucky institution the following fall semester.
Cohort Year 5‐Yr
2005 2006 2007 2008 2009 Change
Eastern Kentucky University 73.5% 72.9% 71.3% 75.9% 74.8% 1%
Kentucky State University 59.8% 53.0% 53.0% 55.9% 56.2% ‐4%
Morehead State University 72.6% 74.7% 75.8% 78.8% 75.2% 3%
Murray State University 79.6% 81.7% 80.8% 80.3% 75.8% ‐4%
University of Kentucky 87.1% 85.5% 88.2% 86.8% 88.1% 1%
University of Louisville 82.3% 84.5% 84.4% 84.5% 83.3% 1%
Western Kentucky University 75.6% 76.7% 77.1% 77.4% 76.7% 1%
Northern Kentucky University 75.9% 72.1% 69.8% 69.6% 71.4% ‐4%
Source: CPE
‐6.0%
‐4.0%
‐2.0%
0.0%
2.0%
4.0%
EKU KSU MoSU MuSU UK UL WKU NKU
2‐Yr Growth of Retention Rate
44.0%
46.0%
48.0%
50.0%
52.0%
54.0%
56.0%
2005 2006 2007 2008 2009
KSU Retention Rates
118

Kentucky State University Retention Rate
Fact Book 2010‐2011
KSU Retention Rate by Degree and Status
Degree 2005‐2006
2006‐2007
2007‐2008
2008‐2009
2009‐2010
5‐Yr Change
Associate Cohort Size 47 63 90 90 72
Returned 30 37 42 58 40
Retention Rate 63.8% 58.7% 46.7% 64.4% 55.6% ‐8%
Bachelor Cohort Size 245 361 401 402 313
Returned 133 176 195 208 170
Retention Rate 54.3% 48.8% 48.6% 51.7% 54.3% 0%
Undeclared Cohort Size 124 153 187 195 155
Returned 65 65 94 94 80
Retention Rate 52.4% 42.5% 50.3% 48.2% 51.6% ‐1%
All Degree Seeking Cohort Size 416 577 678 687 540
Returned 228 278 331 360 290
Retention Rate 54.8% 48.2% 48.8% 52.4% 53.7% ‐1%
Status 2005‐2006
2006‐2007
2007‐2008
2008‐2009
2009‐2010
5‐Yr Change
Full‐Time Cohort Size 407 567 662 664 526
Returned 226 273 319 357 289
Retention Rate 55.5% 48.1% 48.2% 53.8% 54.9% ‐0.6%
Part‐Time Cohort Size 9 10 16 23 14
Returned 2 5 12 3 1
Retention Rate 22.2% 50.0% 75.0% 13.0% 7.1% ‐15.1%
0.0%
20.0%
40.0%
60.0%
80.0%
2005‐06 2006‐07 2007‐08 2008‐09 2009‐10
Retention Rate by Status
Full‐Time Part‐Time
0%
10%
20%
30%
40%
50%
60%
70%
2005‐06 2006‐07 2007‐08 2008‐09 2009‐10
Retention Rate by Degree
Associate Bachelor Undeclared
119

Kentucky State University Retention Rate
Fact Book 2010‐2011
KSU Retention Rate by Gender and Race
Gender Race 2005‐2006 2006‐2007 2007‐2008 2008‐2009 2009‐2010 5‐Yr Change Female Nonresident Alien ‐‐ ‐‐ 100.0% 100.0% ‐‐ ‐‐ Black, Non Hispanic 55.8% 55.4% 57.7% 58.0% 59.7% 4% American Indian/Alaskan ‐‐ ‐‐ 0.0% ‐‐ ‐‐ ‐‐
Asian 33.3% 0.0% ‐‐ ‐‐ 100.0% 67% Hispanic 0.0% ‐‐ 100.0% 50.0% 25.0% 25%
White, Non Hispanic 59.1% 62.5% 38.8% 60.0% 40.6% ‐18% Other Races 66.7% 0.0% 52.4% 55.1% 58.2% ‐8%
Total Female 56.6% 55.8% 54.9% 57.7% 57.1% 1%
Male Nonresident Alien ‐‐ ‐‐ 0.0% 100.0% ‐‐ ‐‐ Black, Non Hispanic 52.3% 42.1% 39.8% 49.1% 49.0% ‐3% American Indian/Alaskan ‐‐ ‐‐ ‐‐ ‐‐ ‐‐ ‐‐
Asian 100.0% 50.0% 66.7% ‐‐ 0.0% ‐100% Hispanic ‐‐ 0.0% 0.0% 50.0% 75.0% ‐‐
White, Non Hispanic 44.4% 35.0% 45.5% 21.4% 41.4% ‐3% Other Races 61.5% 0.0% 46.3% 46.2% 54.2% ‐7%
Total Male 52.7% 40.8% 41.1% 46.2% 49.4% ‐3%
Total Nonresident Alien ‐‐ ‐‐ 50.0% 100.0% ‐‐ ‐‐ Black, Non Hispanic 54.1% 48.3% 49.7% 53.9% 55.2% 1% American Indian/Alaskan ‐‐ ‐‐ 0.0% ‐‐ ‐‐ ‐‐
Asian 60.0% 33.3% 66.7% ‐‐ 50.0% ‐10% Hispanic 0.0% 0.0% 66.7% 50.0% 50.0% 50%
White, Non Hispanic 54.8% 54.4% 40.8% 42.9% 41.0% ‐14% Other Races 64.3% 0.0% 49.4% 50.7% 56.3% ‐8% Total Female & Male 54.8% 48.2% 48.8% 52.4% 53.7% ‐1%
120

GRADUATION RATEGRADUATION RATE
Fact Book 2010‐2011

Kentucky State University Graduation Rate
Fact Book 2010‐2011
Graduation Rate
Graduation Rate is calculated as the percentage of students entering the Kentucky State University as first‐time, full‐time bachelor or equivalent degree‐seeking in Fall term (Cohort) including the ones enrolled as first‐time in Summer prior, who completing their programs within 150 percent of normal time or within six years. For example, Graduation Rate of Cohort 2004 is calculated as the percentage of full‐time freshmen bachelor or equivalent de‐gree‐seeking students who first‐time enrolled at Kentucky State University in Fall 2004, including the Summer prior, who completed their programs by Summer 2010.
5‐Yr 2000 2001 2002 2003 2004 Change Cohort Size 316 350 358 275 306 Graduated within 6 years 104 86 82 63 75 Graduation Rate 32.9% 24.6% 22.9% 22.9% 24.5% ‐8%
Cohort Year
Graduation Rates Among Kentucky Public Institutions
5‐Yr 1999 2000 2001 2002 2003 Change Eastern Kentucky University 36.6% 34.6% 38.9% 37.7% 36.9% 0% Kentucky State University 29.7% 32.9% 24.6% 22.9% 22.9% ‐7% Morehead State University 42.2% 42.9% 41.1% 39.1% 39.9% ‐2% Murray State University 57.0% 56.0% 50.7% 49.1% 49.6% ‐7% University of Kentucky 41.0% 40.1% 31.8% 32.3% 31.8% ‐9% University of Louisville 59.8% 59.0% 61.1% 57.7% 59.5% ‐0% Western Kentucky University 36.8% 40.7% 43.7% 45.7% 48.4% 12% Northern Kentucky University 45.5% 49.2% 49.3% 47.3% 49.5% 4%
Cohort Year
Source: IPEDS Note: Cohort 2004 Graduation Rate is currently not available on IPEDS
122

Kentucky State University Graduation Rate
Fact Book 2010‐2011
KSU Graduation Rate By Years
Cohort Year
Cohort Size
Graduation Rate
4 yrs 5 yrs 6 yrs 7 yrs 8 yrs 9 yrs 10 yrs 11 yrs 12 yrs 13 yrs 14 yrs 15 yrs
150% normal time 200% Extended
1995 174 31 57 61 63 63 64 64 64 65 65 66 66
17.8% 32.8% 35.1% 36.2% 36.2% 36.8% 36.8% 36.8% 37.4% 37.4% 37.9% 37.9%
1996 213 28 55 60 66 68 68 68 70 70 71 71
13.1% 25.8% 28.2% 31.0% 31.9% 31.9% 31.9% 32.9% 32.9% 33.3% 33.3%
1997 195 38 69 80 83 87 90 91 92 92 92
19.5% 35.4% 41.0% 42.6% 44.6% 46.2% 46.7% 47.2% 47.2% 47.2%
1998 234 38 65 81 87 90 94 95 97 97
16.2% 27.8% 34.6% 37.2% 38.5% 40.2% 40.6% 41.5% 41.5%
1999 337 48 79 100 107 112 114 119 120
14.2% 23.4% 29.7% 31.8% 33.2% 33.8% 35.3% 35.6%
2000 316 54 90 104 114 116 117 119
17.1% 28.5% 32.9% 36.1% 36.7% 37.0% 37.7%
2001 350 31 70 86 98 107 107
8.9% 20.0% 24.6% 28.0% 30.6% 30.6%
2002 358 34 67 82 95 100
9.5% 18.7% 22.9% 26.5% 27.9%
2003 275 23 55 63 66
8.4% 20.0% 22.9% 24.0%
2004 306 36 64 75
11.8% 20.9% 24.5%
123

Kentucky State University Graduation Rate
Fact Book 2010‐2011
KSU Graduation Rate by Gender and Race
Gender Cohort Year 5‐Yr
2000 2001 2002 2003 2004 Change
Female Black, Non Hispanic 42.0% 30.9% 39.1% 32.0% 36.0% ‐6%
American Indian/Alaskan ‐‐ ‐‐ ‐‐ ‐‐ ‐‐ ‐‐
Asian/Pacific Islander ‐‐ 100.0% 0.0% ‐‐ 100.0% ‐‐
Hispanic 100.0% 33.3% 33.3% 0.0% ‐‐ ‐‐
White, Non Hispanic 54.5% 12.9% 13.3% 14.8% 27.6% ‐27%
Other Races 0.0% ‐‐ 25.0% 62.5% 33.3% 33%
Total Female 44.8% 28.2% 34.4% 30.1% 35.0% ‐10%
Male Black, Non Hispanic 22.6% 22.3% 8.8% 20.2% 11.5% ‐11%
American Indian/Alaskan 0.0% ‐‐ ‐‐ ‐‐ ‐‐ ‐‐
Asian/Pacific Islander 0.0% ‐‐ ‐‐ 0.0% 0.0% ‐‐
Hispanic ‐‐ 0.0% ‐‐ 0.0% 0.0% ‐‐
White, Non Hispanic 5.9% 14.3% 23.5% 25.0% 20.0% 14%
Other Races 50.0% 0.0% 0.0% 57.1% 15.8% ‐34%
Total Male 21.6% 21.0% 10.1% 21.8% 13.0% ‐9%
Total Black, Non Hispanic 31.6% 26.4% 24.2% 25.6% 24.2% ‐7%
American Indian/Alaskan 0.0% ‐‐ ‐‐ ‐‐ ‐‐ ‐‐
Asian/Pacific Islander 0.0% 100.0% 0.0% 0.0% 66.7% 67%
Hispanic 100.0% 20.0% 33.3% 0.0% 0.0% ‐100%
White, Non Hispanic 38.0% 13.3% 17.0% 18.6% 24.5% ‐14%
Other Races 42.9% 0.0% 11.1% 60.0% 24.3% ‐19%
Total Female & Male 32.9% 24.6% 22.9% 25.8% 24.5% ‐8%
Race
124

Kentucky State University Graduation Rate
Fact Book 2010‐2011
Graduation Rate of Student Athletes
Graduation Rate of student athlete is calculated as the percentage of student entering Kentucky State University as first‐time, full‐time freshmen bachelor or equivalent degree seeking in Fall term (Cohort*) including the Summer term prior, who completed their programs within 150 percent of normal time or within six years, who received any athletic‐related financial aid in their first year. For example, Athletic Graduation Rate of Cohort 2004 is calculated as the percentage of full‐time freshmen bachelor or equivalent degree seeking students who first‐time enrolled at Kentucky State Univer‐sity in Fall 2004, including Summer prior, who received any athletically‐related financial aid in their first year and completed their programs by Summer 2010.
5‐Yr 2000 2001 2002 2003 2004 Change Athletic Cohort Size 25 39 43 27 17 Graduated within 6 years 7 15 17 12 6 Athletic Graduation Rate 28.0% 38.5% 39.5% 44.4% 35.3% 7%
Cohort Year
If one student received athletic aids in more than one sport, the federal (NCAA) hierarchy was used, so that the student is only reported once. The hier‐archy is football, basketball, baseball, cross country/track, then other sports.
Cohort Year 5‐Yr 1999 2000 2001 2002 2003 Change
Football 0.0% 20.0% 15.4% 28.6% 20.0% 20% Basketball 20.0% 16.7% 37.5% 33.3% 100.0% 80% Baseball ‐‐ 25.0% 0.0% ‐‐ 0.0% ‐‐ CC/Track 20.0% 50.0% 28.6% 50.0% ‐‐ ‐‐ Other Sports 55.6% 58.8% 71.4% 60.0% 40.0% ‐16% Total Athletic Graduation Rate 28.0% 38.5% 39.5% 44.4% 35.3% 7%
Sport
125

Kentucky State University Graduation Rate
Fact Book 2010‐2011
KSU Athletic Graduation Rate by Gender and Race
Gender Cohort Year 5‐Yr
2000 2001 2002 2003 2004 Change
Female Black, Non Hispanic 33.3% 55.6% 75.0% 62.5% 44.4% 11%
American Indian/Alaskan ‐‐ ‐‐ ‐‐ ‐‐ ‐‐ ‐‐
Asian/Pacific Islander ‐‐ ‐‐ ‐‐ ‐‐ ‐‐ ‐‐
Hispanic ‐‐ ‐‐ 50.0% 0.0% ‐‐ ‐‐
White, Non Hispanic ‐‐ 100.0% 100.0% 50.0% ‐‐ ‐‐
Other Races ‐‐ ‐‐ ‐‐ 0.0% 0.0% ‐‐
Total Female 33.3% 57.9% 73.7% 50.0% 40.0% 7%
Male Black, Non Hispanic 22.2% 25.0% 13.6% 42.9% 33.3% 11%
American Indian/Alaskan ‐‐ ‐‐ ‐‐ ‐‐ ‐‐ ‐‐
Asian/Pacific Islander ‐‐ ‐‐ ‐‐ ‐‐ ‐‐ ‐‐
Hispanic ‐‐ 0.0% ‐‐ 0.0% ‐‐ ‐‐
White, Non Hispanic 0.0% 0.0% 0.0% ‐‐ 33.3% 33%
Other Races ‐‐ ‐‐ 0.0% ‐‐ 0.0% ‐‐
Total Male 20.0% 20.0% 12.5% 40.0% 28.6% 9%
Total Black, Non Hispanic 29.2% 41.2% 39.5% 50.0% 41.7% 13%
American Indian/Alaskan ‐‐ ‐‐ ‐‐ ‐‐ ‐‐ ‐‐
Asian/Pacific Islander ‐‐ ‐‐ ‐‐ ‐‐ ‐‐ ‐‐
Hispanic ‐‐ 0.0% 50.0% 0.0% ‐‐ ‐‐
White, Non Hispanic 0.0% 33.3% 50.0% 50.0% 33.3% 33%
Other Races ‐‐ ‐‐ 0.0% 0.0% 0.0% ‐‐
Total Female & Male 28.0% 38.5% 39.5% 44.4% 35.3% 7%
Race
126

DEGREE AWARDEDDEGREE AWARDED
Fact Book 2010‐2011

Kentucky State University Degree
Fact Book 2010‐2011
Degrees Offered
Degree Majors CIP 2000 Code College ASSOCIATE IN APPLIED SCIENCE Computer Graphics and Multimedia Production Technology 15.1301 CM Computer Electronics Technology 15.0303 CM Nursing 51.3801 CM ASSOCIATE OF ARTS Liberal Studies 24.0101 CA BACHELOR OF MUSIC Music Education with Teaching Certification 50.0901 CA Music Performance 50.0901 CA BACHELOR OF ARTS Africana Studies 05.0101 CA Art 50.0702 CA Business Administration 52.0101 CS Child Development and Family Relations (Non‐Teaching) 19.0701 CS Interdisciplinary Early Childhood Education (IECE) 13.1202 CA Criminal Justice 43.0104 CS Elementary Education 13.1202 CS
Physical Education (Non‐Teaching) 13.1314 CS Political Science 45.1001 CA Psychology 42.0101 CA Public Administration 44.0401 CS Social Work 44.0701 CS Spanish 16.0905 CA
English 23.0101 CA General Social Sciences 45.0101 CA Liberal Studies 24.0101 CA Mass Communication and Journalism 09.0499 CA Mathematics 27.0101 CM Music 50.0901 CA
Note:
CA = College of Arts, Social Sciences, and Interdisciplinary Studies CM = College of Mathematics, Science, Technology, and Health
CS = College of Professional Studies
128

Kentucky State University Degree
Fact Book 2010‐2011
Degrees Offered
Degree Majors CIP 2000 Code College BACHELOR OF SCIENCE Applied Information Technology 11.0103 CM Biology 26.0101 CM Chemistry 40.0501 CM Computer Science 11.0101 CM Nursing 51.3801 CM Physical Education and Health (Teaching) 13.1314 CS MASTER OF ARTS Special Education (with Certification) 13.1001 CS MASTER OF BUSINESS ADMINISTRATION Business Administration 52.0201 CS MASTER OF PUBLIC ADMINISTRATION Public Administration 44.0401 CS MASTER OF SCIENCE Aquaculture/Aquatic Science 03.0301 CM Computer Science Technology 11.0101 CM Environmental Studies 03.0103 CM Note:
CA = College of Arts, Social Sciences, and Interdisciplinary Studies CM = College of Mathematics, Science, Technology, and Health
CS = College of Professional Studies
129

Kentucky State University Degree
Fact Book 2010‐2011
Degrees Awarded
Degree 2005‐2006
2007‐2008
2008‐2009
2009‐2010
5‐Yr Change
Associate Degree 51 37 39 37 ‐27%
Bachelor Degree 198 231 184 213 8%
Master's Degree 31 47 40 54 74%
Total Degrees Awarded 280 315 263 304 9%
2006‐2007
50
193
47
290
Degrees Awarded by Colleges
College Degree 2005‐2006
2006‐2007
2007‐2008
2008‐2009
2009‐2010
5‐Yr Change
CA—College of Arts, Social Sci‐ences, and Inter‐disciplinary Stud‐
Associate 12 6 4 7 14 17% Bachelor 52 46 59 62 76 46%
Master's ‐‐ ‐‐ ‐‐ ‐‐ ‐‐ ‐‐ Total Degrees 64 52 63 69 90 41%
CM—College of Mathematics, Sci‐ence, Technology, and Health
Associate 39 43 33 32 23 ‐41% Bachelor 42 42 48 47 41 ‐2%
Master's 5 18 10 8 16 220% Total Degrees 86 103 91 87 80 ‐7%
Associate ‐‐ 1 ‐‐ ‐‐ ‐‐ ‐‐ Bachelor 104 105 124 75 96 ‐8%
Master's 26 29 37 32 38 46% Total Degrees 130 135 161 107 134 3%
CS—College of Professional Stud‐ies
0
50
100
150
200
250
2005‐2006 2006‐2007 2007‐2008 2008‐2009 2009‐2010
Degrees by Level
Associate Bachelor Master's
0
40
80
120
160
200
2005‐2006 2006‐2007 2007‐2008 2008‐2009 2009‐2010
Degrees by College
CA CM CS
130

Kentucky State University Degree
Fact Book 2010‐2011
Degrees Awarded Among Kentucky Public Institutions
Institutions Degree 2005‐2006 2006‐2007 2007‐2008 2008‐2009 2009‐2010 5‐Yr Change
Eastern Kentucky University Associate 252 210 189 195 203 ‐19%
Bachelor 1,980 1,979 2,030 2,128 2,125 7%
Master's 835 687 621 734 705 ‐16%
Kentucky State University Associate 51 50 37 39 37 ‐27%
Bachelor 198 193 231 184 213 8%
Master's 31 47 47 40 54 74%
Morehead State University Associate 143 128 149 150 158 10%
Bachelor 1,055 1,072 973 930 926 ‐12%
Master's 406 408 385 410 368 ‐9%
Murray State University Associate 20 19 17 10 12 ‐40%
Bachelor 1,521 1,550 1,632 1,542 1,535 1%
Master's 570 566 540 638 638 12%
Northern Kentucky University Associate 272 258 226 124 127 ‐53%
Bachelor 1,584 1,624 1,706 1,836 1,988 26%
Master's 376 395 466 491 461 23%
University of Kentucky Associate 0 0 0 0 0 ‐‐
Bachelor 3,519 3,613 3,775 3,650 3,521 0%
Master's 1,350 1,371 1,311 1,334 1,211 ‐10%
University of Louisville Associate 51 22 19 20 18 ‐65%
Bachelor 2,253 2,328 2,298 2,482 2,550 13%
Master's 1,368 1,395 1,369 1,394 1,310 ‐4%
Western Kentucky University Associate 300 258 240 217 234 ‐22%
Bachelor 2,313 2,383 2,391 2,382 2,676 16%
Master's 724 822 835 757 858 19%
Source: CPE
131

Kentucky State University Degree
Fact Book 2010‐2011
Degrees Awarded by Major
CIP Code Major Degree 2005‐2006 2006‐2007 2007‐2008 2008‐2009 2009‐2010 5‐Yr Change
03.0301 Aquaculture Master's 2 5 1 3 6 200%
09.0499 Mass Communication & Journalism Bachelor 0 0 0 3 6 ‐‐
11.0101 Computer Science Bachelor 13 13 11 7 8 ‐38%
11.0101 Computer Science Master's 3 13 9 5 10 233%
11.0103 Information Technology Bachelor 0 0 0 4 6 ‐‐
11.0301 Computer Science Associate Associate 1 0 0 0 0 ‐100%
11.1004 Web/Multimedia Management Bachelor 0 0 1 0 0 ‐‐
13.1001 Special Education Master's 0 0 9 17 14 ‐‐
13.1202 Elementary Education Bachelor 16 13 15 7 18 13%
13.1314 Physical Education Bachelor 11 12 13 5 13 18%
15.0303 Electronic Technology Associate 1 0 0 0 0 ‐100%
15.1301 Drafting Associate 0 2 0 0 0 ‐‐
19.0701 Human Development/Family Studies Bachelor 3 10 5 7 8 167%
23.0101 English Bachelor 10 5 5 6 6 ‐40%
24.0101 Liberal Studies Associate 12 6 4 7 14 17%
24.0101 Liberal Studies Bachelor 21 10 14 32 37 76%
26.0101 Biology Bachelor 17 11 16 18 11 ‐35%
27.0101 Mathematics Bachelor 6 7 4 7 1 ‐83%
40.0501 Chemistry Bachelor 1 3 3 1 1 0%
42.0101 Psychology Bachelor 8 15 21 6 14 75%
43.0104 Criminal Justice Bachelor 12 17 18 15 21 75%
132

Kentucky State University Degree
Fact Book 2010‐2011
Degrees Awarded by Major
CIP Code Major Degree 2005‐2006 2006‐2007 2007‐2008 2008‐2009 2009‐2010 5‐Yr Change
44.0401 Public Administration Bachelor 11 10 8 3 8 ‐27%
44.0401 Public Administration Master's 26 26 26 12 17 ‐35%
44.0701 Social Work Bachelor 9 14 17 10 5 ‐44%
45.0101 Social Sciences Bachelor 7 3 8 3 4 ‐43%
45.1001 Political Science Bachelor 3 3 5 8 7 133%
50.0702 Fine/Studio Arts Bachelor 3 4 2 1 1 ‐67%
50.0901 Music Bachelor 0 6 4 3 1 ‐‐
51.3801 Nursing Associate 37 41 33 32 23 ‐38%
51.3801 Nursing Bachelor 5 8 13 10 14 180%
52.0101 Business Bachelor 42 29 48 28 23 ‐45%
52.0201 Business Administration Master's 0 3 2 3 7 ‐‐
52.0402 Office Administration Associate 0 1 0 0 0 ‐‐
133

Kentucky State University Degree
Fact Book 2010‐2011
Degrees Awarded by Gender and Race
Degree Gender Race 2005‐2006
2006‐2007
2007‐2008
2008‐2009
2009‐2010
5‐Yr Change
Associate Female Nonresident Alien 0 2 0 0 0 ‐‐ Black, Non Hispanic 15 7 5 9 12 ‐20%
American Indian/Alaskan 0 0 0 0 0 ‐‐ Asian 1 0 0 0 0 ‐100%
Hispanic 0 1 0 0 1 ‐‐ White, Non Hispanic 29 35 24 25 20 ‐31% Other Races 2 0 1 1 0 ‐100%
Male Nonresident Alien 0 0 0 0 0 ‐‐ Black, Non Hispanic 2 3 1 3 1 ‐50% American Indian/Alaskan 0 0 0 0 0 ‐‐
Asian 0 0 1 0 0 ‐‐ Hispanic 0 0 0 0 0 ‐‐
White, Non Hispanic 2 1 5 1 3 50% Other Races 0 1 0 0 0 ‐‐
Total Nonresident Alien 0 2 0 0 0 ‐‐ Black, Non Hispanic 17 10 6 12 13 ‐24%
American Indian/Alaskan 0 0 0 0 0 ‐‐ Asian 1 0 1 0 0 ‐100%
Hispanic 0 1 0 0 1 ‐‐ White, Non Hispanic 31 36 29 26 23 ‐26% Other Races 2 1 1 1 0 ‐100%
134

Kentucky State University Degree
Fact Book 2010‐2011
Degrees Awarded by Gender and Race
Degree Gender Race 2005‐2006
2006‐2007
2007‐2008
2008‐2009
2009‐2010
5‐Yr Change
Bachelor Female Nonresident Alien 1 4 1 0 1 0% Black, Non Hispanic 85 71 96 68 76 ‐11%
American Indian/Alaskan 31 0 29 26 23 ‐26% Asian 2 0 2 2 0 ‐100%
Hispanic 1 0 0 0 0 ‐100% White, Non Hispanic 30 33 50 26 49 63% Other Races 0 1 7 5 8 ‐‐
Male Nonresident Alien 0 0 1 0 3 ‐‐ Black, Non Hispanic 58 63 50 57 56 ‐3% American Indian/Alaskan 31 1 29 26 23 ‐26%
Asian 0 2 0 4 1 ‐‐ Hispanic 0 0 0 3 0 ‐‐
White, Non Hispanic 18 16 21 18 16 ‐11% Other Races 3 2 3 1 3 0%
Total Nonresident Alien 1 4 2 0 4 300% Black, Non Hispanic 143 134 146 125 132 ‐8%
American Indian/Alaskan 62 1 58 52 46 ‐26% Asian 2 2 2 6 1 ‐50%
Hispanic 1 0 0 3 0 ‐100% White, Non Hispanic 48 49 71 44 65 35% Other Races 3 3 10 6 11 267%
135

Kentucky State University Degree
Fact Book 2010‐2011
Degrees Awarded by Gender and Race
Degree Gender Race 2005‐2006
2006‐2007
2007‐2008
2008‐2009
2009‐2010
5‐Yr Change
Master's Female Nonresident Alien 0 0 1 0 2 ‐‐ Black, Non Hispanic 9 17 14 9 13 44%
American Indian/Alaskan 0 0 0 0 0 ‐‐ Asian 1 2 0 2 3 200%
Hispanic 0 0 0 0 0 ‐‐ White, Non Hispanic 6 7 5 10 12 100% Other Races 0 0 2 1 3 ‐‐
Male Nonresident Alien 0 2 3 0 1 ‐‐ Black, Non Hispanic 8 7 7 10 14 75% American Indian/Alaskan 0 0 0 0 0 ‐‐
Asian 0 4 1 1 0 ‐‐ Hispanic 0 0 0 1 1 ‐‐
White, Non Hispanic 6 6 13 6 5 ‐17% Other Races 1 2 1 0 0 ‐100%
Total Nonresident Alien 0 2 4 0 3 ‐‐ Black, Non Hispanic 17 24 21 19 27 59%
American Indian/Alaskan 0 0 0 0 0 ‐‐ Asian 1 6 1 3 3 200%
Hispanic 0 0 0 1 1 ‐‐ White, Non Hispanic 12 13 18 16 17 42% Other Races 1 2 3 1 3 200%
136

CAREER PLACEMENTCAREER PLACEMENT
Fact Book 2010‐2011
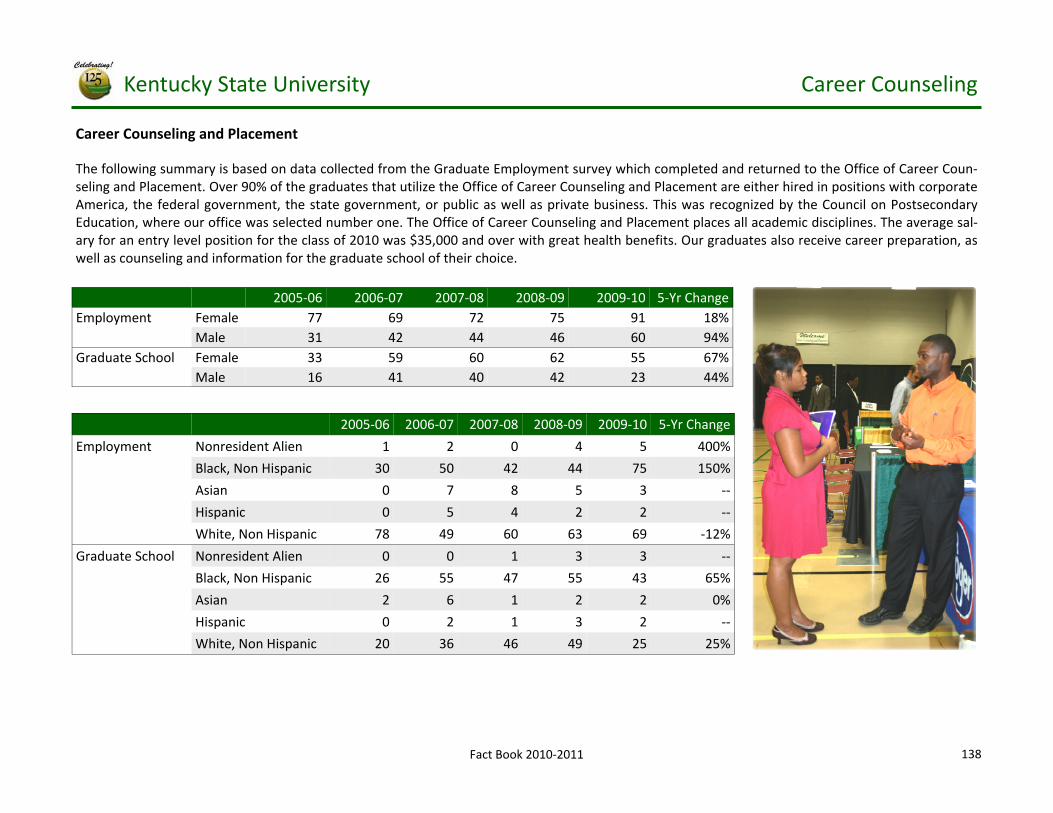
Kentucky State University Career Counseling
Fact Book 2010‐2011
Career Counseling and Placement
The following summary is based on data collected from the Graduate Employment survey which completed and returned to the Office of Career Coun‐seling and Placement. Over 90% of the graduates that utilize the Office of Career Counseling and Placement are either hired in positions with corporate America, the federal government, the state government, or public as well as private business. This was recognized by the Council on Postsecondary Education, where our office was selected number one. The Office of Career Counseling and Placement places all academic disciplines. The average sal‐ary for an entry level position for the class of 2010 was $35,000 and over with great health benefits. Our graduates also receive career preparation, as well as counseling and information for the graduate school of their choice.
2005‐06 2006‐07 2007‐08 2008‐09 2009‐10 5‐Yr Change Employment Female 77 69 72 75 91 18% Male 31 42 44 46 60 94% Graduate School Female 33 59 60 62 55 67% Male 16 41 40 42 23 44%
2005‐06 2006‐07 2007‐08 2008‐09 2009‐10 5‐Yr Change
Employment Nonresident Alien 1 2 0 4 5 400%
Black, Non Hispanic 30 50 42 44 75 150%
Graduate School Nonresident Alien 0 0 1 3 3 ‐‐
Black, Non Hispanic 26 55 47 55 43 65%
Asian 0 7 8 5 3 ‐‐
White, Non Hispanic 78 49 60 63 69 ‐12%
Hispanic 0 5 4 2 2 ‐‐
Asian 2 6 1 2 2 0%
White, Non Hispanic 20 36 46 49 25 25%
Hispanic 0 2 1 3 2 ‐‐
138

Kentucky State University Career Counseling
Fact Book 2010‐2011
Activity Upon Graduation by State
2005‐06 2006‐07 2007‐08 2008‐09 2009‐10 5‐Yr Change
Employment
Kentucky 100 104 105 112 118 18%
Michigan 0 3 2 3 3 ‐‐
Illinois 0 0 1 4 2 ‐‐
Virginia 0 0 1 2 0 ‐‐
Indiana 4 1 0 3 0 ‐100%
Tennessee 1 1 0 2 0 ‐100%
Georgia 0 1 2 2 0 ‐‐
Ohio 0 1 2 7 10 ‐‐
Missouri 1 0 0 2 0 ‐100%
Alabama 0 0 1 1 0 ‐‐
Florida 0 0 1 3 0 ‐‐
Arizona 0 0 0 0 1 ‐‐
Canada 1 0 0 0 0 ‐100%
England 1 0 0 0 0 ‐100%
Other
2005‐06 2006‐07 2007‐08 2008‐09 2009‐10 5‐Yr Change
Kentucky 41 74 66 70 72 76%
Missouri 0 1 1 0 0 ‐‐
Michigan 3 0 0 3 0 ‐100%
Illinois 0 3 3 3 2 ‐‐
Alabama 0 1 1 0 0 ‐‐
Ohio 1 9 10 14 4 300%
Texas 0 0 3 5 0 ‐‐
Indiana 0 3 1 4 1 ‐‐
Louisiana 0 1 0 0 0 ‐‐
Oregon 0 0 0 0 0 ‐‐
Oklahoma 0 0 0 0 0 ‐‐
New York 0 1 0 0 0 ‐‐
Florida 0 1 1 2 1 ‐‐
Wisconsin 1 1 1 2 0 ‐100%
California 0 1 2 1 0 ‐‐
N. Carolina 0 1 1 2 0 ‐‐
Iowa 0 0 0 0 0 ‐‐
Utah 0 0 0 0 0 ‐‐
W. Virginia 0 1 0 0 0 ‐‐
Pennsylvania 0 0 0 0 0 ‐‐
Tennessee 1 1 2 2 1 0%
Georgia 0 1 6 3 6 ‐‐
Minnesota 0 2 2 0 0 ‐‐
Graduate School
0
40
80
120
160
2005‐06 2006‐07 2007‐08 2008‐09 2009‐10
Activity Upon Graduation
Employment
Grad School
139

Kentucky State University Career Counseling
Fact Book 2010‐2011
Graduating Survey
The office of Institutional Research requires students who graduating to take a survey, in order to clear them for graduation. Starting in Spring 2008, a question has been added in the Graduating Survey to determine what activity will be most likely to be pursued upon graduation from the Kentucky State University.
Gender 2006‐2007 2007‐2008 2008‐2009 2009‐2010 2010‐2011 5‐Yr Change
Female 156 212 149 181 170 9%
Male 87 95 89 94 87 0%
No response 2 1 0 1 0 ‐100%
Total Respondents 245 308 238 276 257 5%
Ethnicity 2006‐2007 2007‐2008 2008‐2009 2009‐2010 2010‐2011 5‐Yr Change
Black, Non Hispanic 151 171 141 168 150 ‐1%
White, Non‐Hispanic 81 118 85 93 91 12%
Asian 7 9 5 6 9 29%
Total 245 308 238 276 257 5%
Hispanic 2 2 4 3 2 0%
Hawaii/Pacific 1 1 0 0 1 0%
No response 2 4 2 3 2 0%
Am. Indian/Alaskan 0 2 0 1 0 ‐‐
Two or more Races 1 1 1 2 2 100%
140

Kentucky State University Career Counseling
Fact Book 2010‐2011
Where will you live after graduation?
2006‐2007 2007‐2008 2008‐2009 2009‐2010 2010‐2011 5‐Yr
Change
Kentucky 169 232 177 193 184 9%
Other State 70 73 55 81 67 ‐4%
Foreign Country 0 2 3 1 5 ‐‐
No response 6 1 3 1 1 ‐83%
Total Respondents 245 308 238 276 257 5%
What is MOST LIKELY to be your PRINCIPAL activity upon graduation?* 2008‐2009 2009‐2010 2010‐2011 3‐Yr Change
Employment 167 159 147 ‐12%
Starting or raising a family 1 4 2 100%
Military service 2 1 4 100%
Volunteer activity (e.g., Peace Corps) 1 3 3 200%
Additional Undergraduate Coursework 9 12 5 ‐44%
Graduate or Professional School 62 90 91 47%
Other 1 6 5 400%
No response 3 1 0 ‐100%
Total 246 276 257 4% * Respondent may select more than one answer. Question was added in Spring 2008.
0
40
80
120
160
200
2006‐2007 2007‐2008 2008‐2009
Principal Activity Upon Graduation
Employment Grad School
0
50
100
150
200
250
2006‐2007 2007‐2008 2008‐2009 2009‐2010 2010‐2011
Residence After Graduation
Kentucky Other
141

FACULTY & STAFFFACULTY & STAFF
Fact Book 2010‐2011

Kentucky State University Faculty and Staff
Fact Book 2010‐2011
KSU Employee
EEO Code Job Group 2006‐2007 2007‐2008 2008‐2009 2009‐2010 2010‐2011 5‐Yr Change H10 Executive/Administrative/Management 47 44 43 45 48 2% H20 Faculty 192 190 191 188 185 ‐4% H30 Other Professional 138 147 163 154 161 17% H40 Clerical/Secretarial 35 37 35 39 38 9% H50 Tech/Paraprofessional 124 126 113 108 116 ‐6% H60 Skilled Craft 21 23 23 17 18 ‐14% H70 Service/Maintenance 60 59 59 57 52 ‐13% H80 Graduate Assistant 18 10 16 19 22 22%
635 636 643 627 640 1% Total Employee
Employee by Gender and Race
Gender Race 2006‐2007 2007‐2008 2008‐2009 2009‐2010 2010‐2011 5‐Yr Change Female Black, Non Hispanic 154 159 158 168 156 1% Asian 4 7 8 5 8 100% Hispanic 2 1 1 3 4 100% White, Non Hispanic 125 126 131 138 135 8% Two or More Races 0 0 0 0 1 ‐‐ Other Races 29 25 36 15 22 ‐24% Total Female Employees 314 318 334 329 326 4% Male Black, Non Hispanic 134 146 137 124 129 ‐4% Asian 15 15 11 14 16 7% Hispanic 0 0 0 1 0 ‐‐ White, Non Hispanic 126 134 138 137 146 16% Two or More Races 0 0 0 0 0 ‐‐ Other Races 46 23 23 22 23 ‐50% Total Male Employees 321 318 309 298 314 ‐2%
143

Kentucky State University Faculty and Staff
Fact Book 2010‐2011
Employee by Full‐/Part‐Time Status
Status 2006‐2007 2007‐2008 2008‐2009 2009‐2010 2010‐2011 5‐Yr Change Full‐Time Executive/Administrative/Management 47 44 43 45 48 2% Faculty — Primarily Instruction 138 139 131 128 129 ‐7% — Primarily Research 6 5 6 7 5 ‐17% — Primarily Public Service 10 11 0 1 0 ‐100% Other Professional 132 139 148 148 144 9% Clerical/Secretarial 32 33 32 35 33 3% Tech/Paraprofessional 116 112 101 95 92 ‐21% Skilled Craft 18 20 21 16 16 ‐11% Service/Maintenance 52 53 48 50 47 ‐10% Graduate Assistant 0 0 0 0 0 ‐‐ Total Full‐Time Employee 551 556 530 525 514 ‐7% Part‐Time Executive/Administrative/Management 0 0 0 0 0 ‐‐ Faculty — Primarily Instruction 38 35 54 52 51 34% Other Professional 6 8 15 6 17 183% Clerical/Secretarial 3 4 3 4 5 67% Tech/Paraprofessional 8 14 12 13 24 200% Skilled Craft 3 3 2 1 2 ‐33% Service/Maintenance 8 6 11 7 5 ‐38% Graduate Assistant 18 10 16 19 22 22% Total Part‐Time Employee 84 80 113 102 126 50%
Job Group
144

Kentucky State University Faculty and Staff
Fact Book 2010‐2011
Department Deans and Chairs
College of Arts, Social Sciences and Interdisciplinary Studies
Dean: Dr. Sam O. Oleka
Division: Chair:
Literature, Language, and Philosophy Dr. April Fallon
Fine Arts Dr. Barbara Bucks
Behavioral and Social Sciences Dr. Egbunam Amadife
Whitney Young School of Honors and Liberal Studies Dr. Thomas McPartland
Dean: Dr. Charles Bennett
Division: Chair:
Nursing Dr. Betty Ollinger
Mathematics and Sciences Dr. Fariba Bigdeli
Aquaculture Dr. James Tidwell
Computer and Technical Sciences Dr. John English
Division: Chair:
Education Dr. Beverly Downing
Business Dr. Stephen Graham‐Hill
Public Administration, Social Work, and Criminal Justice Dr. Cherie Dawson‐Edwards
Dean: Dr. Gashaw Lake
College of Mathematics, Sciences, Technology, and Health
College of Mathematics, Sciences, Technology, and Health
Dr. Sam O. Oleka
Dr. Charles Bennett
Dr. Gashaw Lake
145

Kentucky State University Faculty and Staff
Fact Book 2010‐2011
Instructional Faculty (Primarily Teaching)
Gender Race 2006 ‐2007
2007 ‐2008
2008 ‐2009
2009 ‐2010
2010 ‐2011
5‐Yr Change
Female Black, Non Hispanic 16 17 22 25 20 25% Asian 1 2 2 2 2 100% Hispanic 0 0 0 1 3 ‐‐ White, Non Hispanic 41 43 40 53 51 24% Other Races 17 11 23 9 6 ‐65% Male Black, Non Hispanic 32 34 29 27 29 ‐9% Asian 9 7 5 6 6 ‐33% Hispanic 0 0 0 1 0 ‐‐ White, Non Hispanic 48 53 49 49 52 8% Other Races 12 7 15 7 11 ‐8%
Status Rank 2006 ‐2007
2007 ‐2008
2008 ‐2009
2009 ‐2010
2010 ‐2011
5‐Yr Change
Full‐Time Professor 24 23 25 20 22 ‐8%
Associate Prof 42 41 38 38 44 5%
Assistant Prof 58 57 52 54 48 ‐17%
Instructor 14 18 16 16 15 7%
Part‐Time Professor 1 1 1 1 1 0%
Associate Prof 0 0 0 0 0 ‐‐
Assistant Prof 0 0 0 0 1 ‐‐
Instructor 1 1 0 3 2 100%
Lecturer 5 4 4 3 0 ‐100%
Adjunct 31 29 49 45 47 52%
Total Full‐Time 138 139 131 128 129 ‐7%
Total Part‐Time 38 35 54 52 51 34%
Gender 2006 ‐2007
2007 ‐2008
2008 ‐2009
2009 ‐2010
2010 ‐2011
5‐Yr Change
Female 75 73 87 90 82 9%
Male 101 101 98 90 98 ‐3%
Total 176 174 185 180 180 2%
Status Tenure 2006 ‐2007
2007 ‐2008
2008 ‐2009
2009 ‐2010
2010 ‐2011
5‐Yr Change
Full‐Time Tenure 73 68 67 68 69 ‐5%
Tenure Track 40 41 39 41 37 ‐8%
Non Tenure 25 30 25 19 23 ‐8%
Part‐Time Tenure 1 1 1 1 1 0%
Tenure Track 0 0 0 0 1 ‐‐
Non Tenure 37 34 53 51 49 32%
146

Kentucky State University Faculty and Staff
Fact Book 2010‐2011
Full‐Time Instructional Faculty (Primarily Teaching)
Rank Contract Gender 2006 ‐2007
2007 ‐2008
2008 ‐2009
2009 ‐2010
2010 ‐2011
5‐Yr Change
Profes‐sor
9‐Month Female 2 2 3 3 3 50%
Male 17 17 18 15 17 0%
12‐Month Female 0 0 0 0 0 ‐‐
Male 5 4 4 2 2 ‐60%
Associate Profes‐sor
9‐Month Female 13 13 12 9 9 ‐31%
Male 24 21 18 22 28 17%
12‐Month Female 3 3 4 6 5 67%
Male 2 4 4 1 2 0%
Assistant Profes‐sor
9‐Month Female 21 23 24 28 28 33%
Male 34 32 27 24 18 ‐47%
12‐Month Female 0 0 0 0 0 ‐‐
Male 3 2 1 2 2 ‐33%
9‐Month Female 12 14 11 10 11 ‐8%
Male 2 3 3 6 4 100%
12‐Month Female 0 0 0 0 0 ‐‐
Male 0 1 2 0 0 ‐‐
Instruc‐tor
Race 2006 ‐2007
2007 ‐2008
2008 ‐2009
2009 ‐2010
2010 ‐2011
5‐Yr Change
Black, Non Hispanic 42 43 39 34 37 ‐12%
Asian 10 8 7 8 8 ‐20%
Hispanic 0 0 0 2 3 ‐‐
White, Non Hispanic 76 83 75 82 80 5%
Two or More Races 0 0 0 0 0 ‐‐
Other Races 10 5 10 2 1 ‐90%
Gender 2006 ‐2007
2007 ‐2008
2008 ‐2009
2009 ‐2010
2010 ‐2011
5‐Yr Change
Female 51 55 54 56 56 10%
Male 87 84 77 72 73 ‐16%
Contract 2006 ‐2007
2007 ‐2008
2008 ‐2009
2009 ‐2010
2010 ‐2011
5‐Yr Change
9‐Month 125 125 116 117 118 ‐6%
12‐Month 13 14 15 11 11 ‐15%
147

Kentucky State University Faculty and Staff
Fact Book 2010‐2011
Full‐Time Instructional Faculty (Primarily Teaching)
Gender Race 2006‐2007 2007‐2008 2008‐2009 2009‐2010 2010‐2011 5‐Yr Change Female Black, Non Hispanic 13 13 13 12 13 0% Asian 1 1 2 2 2 100% Hispanic 0 0 0 1 3 ‐‐ White, Non Hispanic 33 38 33 40 37 12% Two or More Races 0 0 0 0 0 ‐‐ Other Races 4 3 6 1 1 ‐75% Total Female Instructional Faculty 51 55 54 56 56 10% Male Black, Non Hispanic 29 30 26 22 24 ‐17% Asian 9 7 5 6 6 ‐33% Hispanic 0 0 0 1 0 ‐‐ White, Non Hispanic 43 45 42 42 43 0% Two or More Races 0 0 0 0 0 ‐‐ Other Races 6 2 4 1 0 ‐100% Total Male Instructional Faculty 87 84 77 72 73 ‐16%
Fall 2010 Student to Faculty Ratio is 16 : 1, based on FTE students over FTE instructional faculty.
Full‐Time Undergraduate Students 2,133 Part‐Time Undergraduate Students 473
FTE Students 2291 Full‐Time Instructional Faculty 129
Part‐Time Instructional Faculty 51 FTE Faculty 146 Note: For this purpose, FTE was calculated as full‐time plus one‐third part‐time.
148

Kentucky State University Faculty and Staff
Fact Book 2010‐2011
Full‐Time Instructional 9‐Month Faculty
Rank Tenure Gender 2006‐2007 2007‐2008 2008‐2009 2009‐2010 2010‐2011 5‐Yr Change Professor Tenure Female 2 2 3 3 3 50% Male 18 16 15 15 16 ‐11% Tenure Track Female 0 2 0 0 0 ‐‐ Male 0 4 3 0 1 ‐‐ Non Tenure Female 0 0 0 0 0 ‐‐ Male 0 1 0 0 0 ‐‐ Associate Professor Tenure Female 10 10 9 8 8 ‐20% Male 20 17 15 16 24 20% Tenure Track Female 3 0 1 1 1 ‐67% Male 3 0 3 6 4 33% Non Tenure Female 0 1 2 0 0 ‐‐ Male 1 0 0 0 0 ‐100% Assistant Professor Tenure Female 5 4 7 8 7 40% Male 11 10 11 12 6 ‐45% Tenure Track Female 14 15 13 19 17 21% Male 14 16 12 10 8 ‐43% Non Tenure Female 2 4 4 1 4 100% Male 7 6 4 2 4 ‐43% Instructor Tenure Female 0 0 0 0 0 ‐‐ Male 0 0 0 0 0 ‐‐ Tenure Track Female 0 0 1 0 0 ‐‐ Male 0 0 0 0 0 ‐‐ Non Tenure Female 12 14 10 10 11 ‐8% Male 2 3 3 6 4 100%
149

Kentucky State University Faculty and Staff
Fact Book 2010‐2011
Full‐Time Instructional 12‐Month Faculty
Rank Tenure Gender 2006‐2007 2007‐2008 2008‐2009 2009‐2010 2010‐2011 5‐Yr Change Professor Tenure Female 0 0 0 0 0 ‐‐ Male 4 4 4 2 1 ‐75% Tenure Track Female 0 0 0 0 0 ‐‐ Male 0 0 0 0 1 ‐‐ Non Tenure Female 0 0 0 0 0 ‐‐ Male 0 0 0 0 0 ‐‐ Associate Professor Tenure Female 2 2 2 3 3 50% Male 1 3 1 1 1 0% Tenure Track Female 1 1 2 3 2 100% Male 1 1 3 0 1 0% Non Tenure Female 0 0 0 0 0 ‐‐ Male 0 0 0 0 0 ‐‐ Assistant Professor Tenure Female 0 0 0 0 0 ‐‐ Male 0 0 0 0 0 ‐‐ Tenure Track Female 0 0 0 0 0 ‐‐ Male 4 2 1 2 2 ‐50% Non Tenure Female 0 0 0 0 0 ‐‐ Male 1 0 0 0 0 ‐100% Instructor Tenure Female 0 0 0 0 0 ‐‐ Male 0 0 0 0 0 ‐‐ Tenure Track Female 0 0 0 0 0 ‐‐ Male 0 0 0 0 0 ‐‐ Non Tenure Female 0 0 0 0 0 ‐‐ Male 0 1 2 0 0 ‐‐
150
FINANCEFINANCE
Fact Book 2010‐2011

Kentucky State University Finance
Fact Book 2010‐2011
Tuition and Fees
2006‐2007 2007‐2008 2008‐2009 2009‐2010 2010‐2011 5‐Yr Change
Full‐Time Undergraduate Tuition and Fees
In‐State $4,950 $5,320 $5,692 $5,686 $5,520 12%
Out‐of‐State $11,500 $12,490 $13,490 $14,058 $12,144 6%
Destiny & Legacy ‐‐ ‐‐ $9,828 $11,372 $11,040 ‐‐
Full‐Time Graduate Tuition and Fees
In‐State $5,130 $5,400 $5,850 $6,084 $6,336 24%
Out‐of‐State $12,330 $12,600 $13,680 $15,048 $9,504 ‐23%
Per Credit Hour Undergraduate Tuition and Fees
In‐State $180 $175 $190 $197 $230 28%
Out‐of‐State $430 $415 $335 $395 $506 18%
Destiny & Legacy ‐‐ ‐‐ $335 $395 $460 ‐‐
Online Program $225 $240 $260 $280 $294 31%
Per Credit Hour Graduate Tuition and Fees
In‐State $285 $265 $325 $338 $352 24%
Out‐of‐State $685 $665 $760 $811 $528 ‐23%
Online Program $300 $300 $325 $350 $368 23%
Room and Board $6,274 $6,840 $6,594 $6,792 $7,132 14%
Room Only 3,234 3,800 3,442 3,552 3,892 20%
Board Only 3,040 3,040 3,152 3,240 3,240 7%
Books and Supplies $1,000 $1,200 $1,200 $1,300 $1,300 30%
Others
Application Fee (Domestic) $30
Application Fee (International) $100
Activity Fee $170
Health Insurance $151
In Service Counties $104 per course
Outside Service Co. $83 per credit
High School Students:
2010‐2011 Other Fees
Destiny: Student must enroll as a full‐time undergraduate student and be an official resident of a high school within one of the following target states: Ohio, Michigan, Mis‐souri, Illinois, or Indiana.
High School Students in Service County Area includes: Anderson, Henry, Franklin, Owen, Scott, Shelby, Woodford counties — up to a maximum of 3 credit hours.
Students residing in residence halls are required to have a meal plan.
152
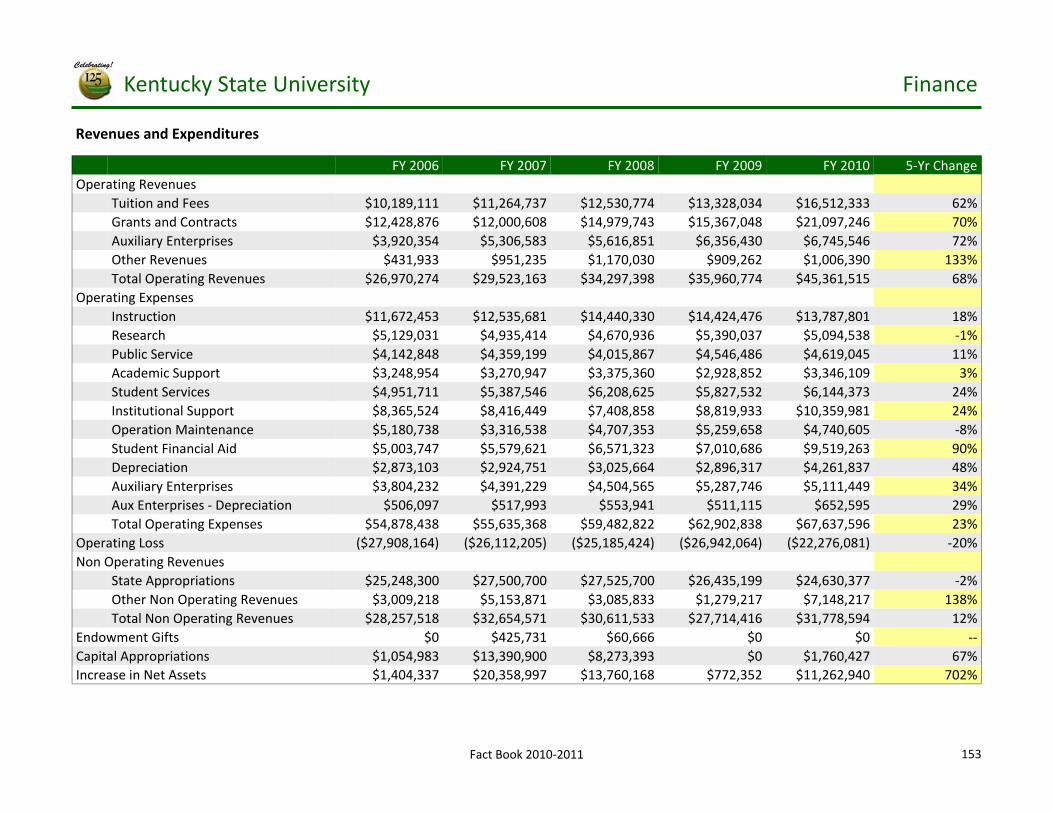
Kentucky State University Finance
Fact Book 2010‐2011
Revenues and Expenditures
FY 2006 FY 2007 FY 2008 FY 2009 FY 2010 5‐Yr Change Operating Revenues Tuition and Fees $10,189,111 $11,264,737 $12,530,774 $13,328,034 $16,512,333 62% Grants and Contracts $12,428,876 $12,000,608 $14,979,743 $15,367,048 $21,097,246 70% Auxiliary Enterprises $3,920,354 $5,306,583 $5,616,851 $6,356,430 $6,745,546 72% Other Revenues $431,933 $951,235 $1,170,030 $909,262 $1,006,390 133% Total Operating Revenues $26,970,274 $29,523,163 $34,297,398 $35,960,774 $45,361,515 68% Operating Expenses Instruction $11,672,453 $12,535,681 $14,440,330 $14,424,476 $13,787,801 18% Research $5,129,031 $4,935,414 $4,670,936 $5,390,037 $5,094,538 ‐1% Public Service $4,142,848 $4,359,199 $4,015,867 $4,546,486 $4,619,045 11% Academic Support $3,248,954 $3,270,947 $3,375,360 $2,928,852 $3,346,109 3% Student Services $4,951,711 $5,387,546 $6,208,625 $5,827,532 $6,144,373 24% Institutional Support $8,365,524 $8,416,449 $7,408,858 $8,819,933 $10,359,981 24% Operation Maintenance $5,180,738 $3,316,538 $4,707,353 $5,259,658 $4,740,605 ‐8% Student Financial Aid $5,003,747 $5,579,621 $6,571,323 $7,010,686 $9,519,263 90% Depreciation $2,873,103 $2,924,751 $3,025,664 $2,896,317 $4,261,837 48% Auxiliary Enterprises $3,804,232 $4,391,229 $4,504,565 $5,287,746 $5,111,449 34% Aux Enterprises ‐ Depreciation $506,097 $517,993 $553,941 $511,115 $652,595 29% Total Operating Expenses $54,878,438 $55,635,368 $59,482,822 $62,902,838 $67,637,596 23% Operating Loss ($27,908,164) ($26,112,205) ($25,185,424) ($26,942,064) ($22,276,081) ‐20% Non Operating Revenues State Appropriations $25,248,300 $27,500,700 $27,525,700 $26,435,199 $24,630,377 ‐2% Other Non Operating Revenues $3,009,218 $5,153,871 $3,085,833 $1,279,217 $7,148,217 138% Total Non Operating Revenues $28,257,518 $32,654,571 $30,611,533 $27,714,416 $31,778,594 12% Endowment Gifts $0 $425,731 $60,666 $0 $0 ‐‐ Capital Appropriations $1,054,983 $13,390,900 $8,273,393 $0 $1,760,427 67%
$1,404,337 $20,358,997 $13,760,168 $772,352 $11,262,940 702% Increase in Net Assets
153

ALUMNIALUMNI
Fact Book 2010‐2011

Kentucky State University Alumni
Fact Book 2010‐2011
Alumni
The mission of the KSU National Alumni Association is to promote a spirit of cooperation and to preserve the University's values, traditions and heritage that will support the University's mission and vision. The vision of the KSU National Alumni Association is to be a globally association recognized alumni that has a historically black college/university perspective, that is financially independent that uses its resources to promote the University's land grant status and programs, and that engage strategies which provide financial support, human resource assistance, performance recognition systems, and increase visibility and influence.
Notable Alumni
Dr. Henry E. Cheaney 1936 Educator and nationally‐recognized expert on the history of African Americans in Kentucky.
Anna Mac Clarke 1941 Member of Women's Army Corps during WWII; First African American officer of an all‐white company.
Paul William Lawrence Jones 1898 Educator, historian and athlete; Preserved much of what Kentucky State now has in the way of books and documents about the early years of Kentucky State; Started some of the first football, baseball and track teams at KSU, known as the Father of Athletics at Kentucky State.
James L. McCullin 1941 Tuskegee Airman whose plane was lost over Sicily during WWII.
Ersa Hines Poston 1942 Member of the U.S. Civil Service Commission; Appointed by President Carter and confirmed by the Senate; First Black to hold a presidential cabinet position.
H.C. Russell, Jr. Ensign in Coast Guard during WWII; Became the Third African American commissioned officer in the Coast Guard; Later became executive with Pepsi Cola.
Winnie A. Scott 1890 Educator and helped establish a hospital for African Americans in Frankfort; Member of first graduating class at KSU.
Frank Simpson 1942 Educator; High School principal for 21 years and administrator in the Louisville schools.
Moneta Sleet, Jr. 1947 Photographer; Became the first African American to win the Pulitzer Prize for photography; photo of Coretta King at Martin Luther King Jr.'s funeral.
Effie Waller Smith ca. 1900. Educator and poet; Poet James Still called her "Kentucky's Emily Dickinson".
Luska Twyman 1938 Former mayor of Glasgow, KY; First Black mayor of a Kentucky city.
Dr. Harrison Wilson 1950 President of Norfolk State University.
Whitney M. Young, Jr. 1941 Civil Rights, Executive Director of the National Urban League from 1961‐1971.
155

Kentucky State University Alumni
Fact Book 2010‐2011
KSU Alumni by State (as of May 5, 2011)
State Total State Total State Total State Total
Alaska 1 Maine 1 Montana 2 New Mexico 2
Alabama 90 Michigan 386 North Carolina 77 Nevada 7
Arkansas 17 Minnesota 14 Nebraska 8 New York 70
Arizona 28 Missouri 77 New Hampshire 3 Ohio 784
California 103 Mississippi 39 New Jersey 46 Oklahoma 13
Colorado 12 Oregon 3
Connecticut 6 Pennsylvania 45
District of Columbia 36 South Carolina 32
Delaware 3 South Dakota 1
Florida 205 Tennessee 167
Georgia 309 Texas 134
Hawaii 3 Utah 3
Iowa 7 Virginia 105
Idaho 1 Vermont 2
Illinois 310 Washington 16
Indiana 368 Wisconsin 53
Kansas 10 West Virginia 12
Kentucky 4,606 Wyoming 1
Louisiana 13 Other/Unknown 3,444
Massachussetts 12
Maryland 98 Total KSU Alumni 11,785
156

Kentucky State University Alumni
Fact Book 2010‐2011
KSU Alumni by Class Year and Gender (as of May 5, 2011)
Class Total Class Total Class Total Class Total
1918 1 1949 34 1970 164 1991 211
1926 1 1950 78 1971 176 1992 216
1930 1 1951 69 1972 188 1993 260
1931 4 1952 58 1973 169 1994 254
1932 18 1953 59 1974 154 1995 331
1933 14 1954 54 1975 211 1996 171
1934 16 1955 72 1976 184 1997 239
1935 68 1956 68 1977 232 1998 309
1936 28 1957 52 1978 186 1999 212
1937 42 1958 59 1979 186 2000 312
1938 44 1959 72 1980 171 2001 272
1939 50 1960 71 1981 191 2002 273
1940 45 1961 71 1982 178 2003 182
1941 37 1962 73 1983 201 2004 311
1942 55 1963 91 1984 190 2005 291
1943 32 1964 89 1985 193 2006 255
1944 30 1965 90 1986 219 2007 300
1945 35 1966 81 1987 197 2008 282
1946 30 1967 99 1988 215 2009 250
1947 30 1968 129 1989 192 2010 298
1948 39 1969 154 1990 195 321 Unknown
Gender Total
Female 6,821
Male 4,717
Declined to answer 247
KSU Band 1957
KSU Honor Graduates 1958
157