Embed Size (px)
Citation preview
Automated Pavement Condition Survey Manual
Pavement Program, Maintenance Division | California Department of Transportation | 2015
A U T O M A T E D P A V E M E N T C O N D I T I O N S U R V E Y M A N U A L
This report is prepared by the California Department of Transportation, Division of Maintenance, Pavement Program, Office of Pavement Management and Performance. It summarizes the automated pavement condition survey data collection and aggregation on the entire Caltrans network.
Prepared by Dulce Rufino Feldman, Ph.D., P.E. Thomas Pyle, P.E. James Lee, Ph.D., P.E.
Graphical Design by Gabriele Höppel, Cake Farm
Division of Maintenance Tony Tavares, P.E., Maintenance Division Chief
Pavement Program Jesse Bhullar, P.E.,T.E., Maintenance Assistant Division Chief and State Pavement Engineer
Office of Pavement Management and Performance Thomas Pyle, P.E., Office Chief
Pavement Condition Survey Team Dennis Vonada, Acting Maintenance Supervisor Superintendent Gary Kenyon, Maintenance Supervisor Scott Stevenson, Maintenance Supervisor Tom Portlock, Maintenance Supervisor
A U T O M A T E D P A V E M E N T C O N D I T I O N S U R V E Y M A N U A L
Table of Contents
List of Figures, Tables and Abbreviations............................................................................................. iii
LIST OF FIGURES ............................................................................................................................... ........ iii
LIST OF TABLES ............................................................................................................................... .......... iv
LIST OF ABBREVIATIONS .......................................................................................................................... iv
CHAPTER 1 Introduction....................................................................................................................... 1
1.1 THE AUTOMATED PAVEMENT CONDITION SURVEY ........................................................................... 2
1.2 OBJECTIVES OF THE APCS ................................................................................................................... 4
1.3 SCOPE AND USE OF THIS MANUAL ..................................................................................................... 4
CHAPTER 2 General Definitions ............................................................................................................ 6
2.1 PAVEMENT SURFACE TYPES ................................................................................................................ 7
2.2 PAVEMENT STRUCTURE TYPES ........................................................................................................... 7
2.3 DISTRESS/CONDITION REPORTING SEGMENTS .................................................................................. 8
2.4 LINEAR REFERENCE ........................................................................................................................... 11
2.5 LANE AND WHEEL PATH.................................................................................................................... 11
2.6 MIXED LANES ............................................................................................................................... ..... 11
Chapter 3 Asphalt Pavement Distress/Condition Measurement and Reporting .................................. 14
3.1 ALLIGATOR A ............................................................................................................................... ...... 15
3.2 ALLIGATOR B ............................................................................................................................... ...... 17
3.3 BLOCK CRACKING .............................................................................................................................. 18
3.4 EDGE CRACKING ............................................................................................................................... . 19
3.5 LONGITUDINAL CRACKING ................................................................................................................ 20
3.6 TRANSVERSE CRACKING .................................................................................................................... 21
3.7 POTHOLE ............................................................................................................................... ............ 22
3.8 BLEEDING ............................................................................................................................... ........... 23
3.9 RAVELING ............................................................................................................................... ........... 24
Chapter 4 Jointed Plain Concrete Pavement Distress/Condition Measurement and Reporting .......... 26
4.1 CORNER CRACKING ........................................................................................................................... 27
i
A U T O M A T E D P A V E M E N T C O N D I T I O N S U R V E Y M A N U A L
4.2 LONGITUDINAL CRACKING ................................................................................................................ 28
4.3 TRANSVERSE CRACKING .................................................................................................................... 29
4.4 SPALLING............................................................................................................................... ............ 30
4.5 THIRD STAGE CRACKING ................................................................................................................... 31
4.6 LANE/SHOULDER DROP‐OFF ............................................................................................................. 32
4.7 LANE/SHOULDER JOINT WIDTH ........................................................................................................ 33
4.8 LONGITUDINAL JOINT ....................................................................................................................... 34
4.9 TRANSVERSE JOINT ........................................................................................................................... 35
Chapter 5 Continuously Reinforced Concrete Pavement Distress/Condition Measurement and
Reporting ........................................................................................................................................... 37
5.1 LONGITUDINAL CRACKING ................................................................................................................ 38
5.2 TRANSVERSE CRACKING .................................................................................................................... 39
5.3 PUNCHOUTS............................................................................................................................... ....... 40
Chapter 6 Sensor Data Reporting...................................................................................................... 42
6.1 INTERNATIONAL ROUGHNESS INDEX ............................................................................................... 43
6.2 MEAN PROFILE DEPTH ...................................................................................................................... 43
6.3 RUTTING ............................................................................................................................... ............. 44
6.4 FAULTING ............................................................................................................................... ........... 45
Appendix 1 – APCS Data Aggregation for 0.1‐mi Section..................................................................... 46
Appendix 2 – Aggregation Example for 0.1‐mi Section........................................................................ 47
Glossary............................................................................................................................................. 48
ii

A U T O M A T E D P A V E M E N T C O N D I T I O N S U R V E Y
List of Figures, Tables and Abbreviations
LIST OF FIGURES
Figure 1‐1 Annual APCS data flow
Figure 2‐1 Screen shot from pavement structure tool called iGPR
Figure 2‐2 Distress/condition report segments
Figure 2‐3 Data collection areas and distress location by lane
Figure 3‐1 Examples of alligator A cracking
Figure 3‐2 Examples of alligator B cracking
Figure 3‐3 Examples of block cracking
Figure 3‐4 Examples of edge cracking
Figure 3‐5 Examples of longitudinal cracking
Figure 3‐6 Examples of transverse cracking
Figure 3‐7 Examples of pothole
Figure 3‐8 Examples of bleeding
Figure 3‐9 Examples of ravelling
Figure 4‐1 Examples of corner cracking
Figure 4‐2 Examples of longitudinal cracking
Figure 4‐3 Examples of transverse cracking
Figure 4‐4 Examples of spalling
Figure 4‐5 Examples of third stage cracking
Figure 4‐6 Examples of lane/shoulder drop‐off
Figure 4‐7 Examples of lane/shoulder joint width
Figure 4‐8 Examples of longitudinal joint
Figure 4‐9 Examples of transverse joint
Figure 5‐1 Examples of longitudinal cracking
Figure 5‐2 Examples of transverse cracking
Figure 5‐3 Examples of punchouts
Figure 6‐1 Examples of rutting in asphalt
Figure 6‐2 Examples of rutting in concrete
Figure 6‐3 Examples of faulting
M A N U A L
iii
A U T O M A T E D P A V E M E N T C O N D I T I O N S U R V E Y M A N U A L
LIST OF TABLES
Table 2‐1 DCE length for different pavement surface types
Table 2‐2 Calculation of DCS extent for alligator B
Table 2‐3 Calculation of PRS extent for alligator B
LIST OF ABBREVIATIONS
AASHTO American Association of State Highway and Transportation Officials
APCS Automated Pavement Condition Survey
ASTM American Society for Testing and Materials
BWC Bonded Wearing Course
CLR Crack Length Ratio
CRCP Continuously Reinforced Concrete Pavement
CTB Cement Treated Base
CTPB Cement Treated Permeable Base
DCS Data Collection Segment
DCE Data Collection Element
DMI Distance Measuring Instrument
EB Eastbound
GPS Global Positioning System
HMA Hot Mix Asphalt
IRI International Roughness Index
JPCP Jointed Plain Concrete Pavement
LCB Lean Concrete Base
LWP Left Wheel Path
MPD Mean Profile Depth
MS Management Segment
NB Northbound
OGFC Open Graded Friction Course
PCC Portland Cement Concrete
PCS Pavement Condition Survey
PM Postmile
PMS Pavement Management System
iv

A U T O M A T E D P A V E M E N T C O N D I T I O N S U R V E Y M A N U A L
QA Quality Assurance
QC Quality Control
RHMA Rubberized Hot Mix Asphalt
RHMA‐G Gap Graded Rubberized Hot Mix Asphalt
RHMA‐O Open Graded Rubberized Hot Mix Asphalt
ROW Right‐of‐Way
RWP Right Wheel Path
SB Southbound
WB Westbound
v

A U T O M A T E D P A V E M E N T C O N D I T I O N S U R V E Y M A N U A L
Notes:
vi

A U T O M A T E D P A V E M E N T C O N D I T I O N S U R V E Y M A N U A L
CHAPTER 1 Introduction
1

A U T O M A T E D P A V E M E N T C O N D I T I O N S U R V E Y M A N U A L
1.1 THE AUTOMATED PAVEMENT CONDITION SURVEY
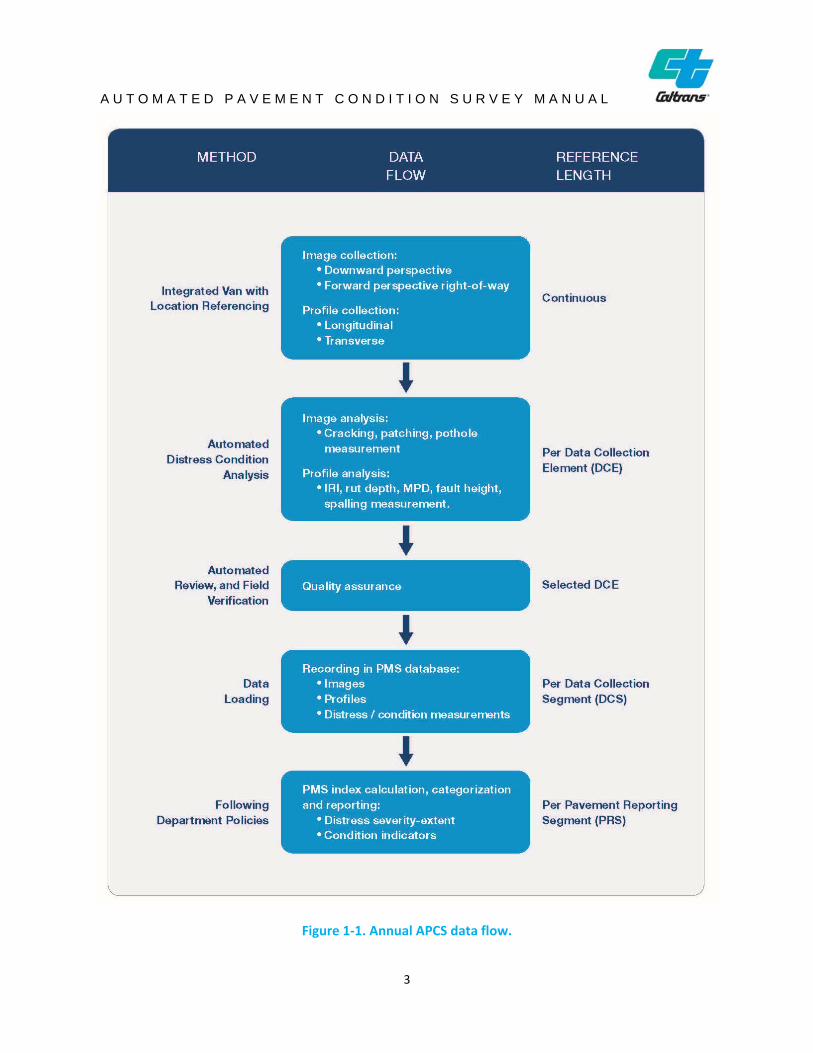
The Automated Pavement Condition Survey (APCS) uses customized vehicles fitted with sensing equipment, traveling on the roadway at or near highway speeds, to quickly and efficiently collect pavement condition data.
The APCS process consists of:
Data Collection
Data collected for each data collection element (DCE) includes: longitudinal and transverse pavement surface profiles, downward perspective images, forward perspective right‐of‐way (ROW) images, and geo‐reference data from global positioning systems (GPS), inertial referencing systems, and distance measuring instruments (DMI).
The types of APCS data collected in the field are surface profiles, images, and associated geo‐referencing information.
Data Analysis
Data collected in the field is organized, analyzed, evaluated, and reported in an office setting. However very little human intervention is mandated for the California Department of Transportation (Caltrans) APCS to lessen the cost of data analysis and reduce the subjectivity of data interpretation. Since the current APCS technology cannot accurately find sealed cracks in an automated fashion, Caltrans APCS does not require sealed cracks to be reported.
Field data is analyzed to categorize and quantify pavement distresses as follows:
Image‐based: cracking, pothole and spalling. Profile‐based: rutting, faulting, International Roughness Index (IRI), and Mean Profile Depth
(MPD).
Quantified pavement condition parameters, including the severity of each distress type are considered “output” of the APCS.
Data Reporting
DCE is aggregated into 0.1‐mile segments called data collection segment (DCS) for faster software processing. The data is further aggregated into pavement report segment (PRS) to optimize project selection and therefore improve decision‐making by the Department. These segments are defined in greater detail in Section 2.3.
The APCS data flow is illustrated in Figure 1‐1.
2
A U T O M A T E D P A V E M E N T C O N D I T I O N S U R V E Y M A N U A L
Figure 1‐1. Annual APCS data flow.
3
A U T O M A T E D P A V E M E N T C O N D I T I O N S U R V E Y M A N U A L
1.2 OBJECTIVES OF THE APCS
The APCS data is used in PaveM for calculation, categorization and reporting of distress severity‐extent and condition indicators to assist the Department with pavement management decisions, including maintenance and project programming. The data produced by the APCS is also used to report the current condition of the pavement network and perform a number of other analysis and reporting functions for the PMS.
The network‐level data is used with other information to accomplish these primary objectives:
To develop pavement performance models used to predict the future condition of the network for different management scenarios.
To identify appropriate levels of pavement treatment, including pavement preservation, rehabilitation or reconstruction.
To measure performance and cost‐effectiveness of different treatments and strategies. To measure the amount of distress in each district.
1.3 SCOPE AND USE OF THIS MANUAL
This APCS Manual is intended for use by pavement managers and engineers who require a basic understanding of the distress and condition definitions used and measurements collected in the APCS, and who should be familiar with the calculation and categorization of distresses and condition indicators.
It includes:
General Definitions. Chapter 2 contains important information regarding definitions used in the APCS data collection and reporting for all pavements. Topics include: pavement surface and structure types and other features; data collection segments, and pavement reporting segments; and wheel paths, lanes, and mixed lanes. Additional definitions can be found in the Glossary.
Distress/Condition Measurement and Reporting. Chapters 3, 4 and 5 describe and provide photo examples of each pavement distress type or condition and how it is measured for each data collection segment. Chapters 3, 4 and 5 cover Asphalt Pavements, Jointed Plain Concrete Pavements (JPCP) and Continuously Reinforced Concrete Pavements (CRCP), respectively. Chapter 6 describes the calculations used to produce smoothness texture data using the International Roughness Index (IRI), macrotexture using the Mean Profile Depth (MPD) and rutting for asphalt and concrete pavements. This chapter also presents faulting data, which is calculated only for concrete pavements.
4

A U T O M A T E D P A V E M E N T C O N D I T I O N S U R V E Y M A N U A L
Notes:
5

A U T O M A T E D P A V E M E N T C O N D I T I O N S U R V E Y M A N U A L
CHAPTER 2 General Definitions
6
A U T O M A T E D P A V E M E N T C O N D I T I O N S U R V E Y M A N U A L
2.1 PAVEMENT SURFACE TYPES
For the purposes of APCS, pavements are rated according to the surface material types regardless of the underlying structures. Different stress types and condition indicators apply to different types of pavements. For highway lanes consisting of two types of pavement surface types, please refer to Section 2.7, Mixed Lanes. Structural characteristics are considered when the APCS data are analyzed with the corresponding pavement structure information in PaveM.
Asphalt Pavement
If the pavement surface is covered by any asphaltic material, then it is considered an “asphalt pavement.” Asphalt surface types include the following asphaltic materials: Hot Mix Asphalt (HMA, Open‐graded friction course (OGFC), Rubberized Hot Mix Asphalt, open‐graded or gap‐graded (RHMA‐G, RHMA‐O), Chip seal, Slurry seal, Bonded Wearing Course (BWC), and others.
Concrete Pavement
If the pavement surface is covered by concrete material, then it is considered a “concrete pavement.” There is one type of concrete surface but three types of concrete pavements: jointed plain concrete pavement (JPCP), precast pavement, and continuously reinforced concrete pavement (CRCP). For the time being, precast pavements are rated the same way as JPCP.
2.2 PAVEMENT STRUCTURE TYPES
Asphalt and concrete pavements may have different types of base and subbase material including but not limited to aggregate, existing JPCP or CRCP, Cement Treated Base (CTB), Lean Concrete Based (LCB), Asphalt Treated Permeable Base (ATPB) or Cement Treated Permeable Base (CTPB).
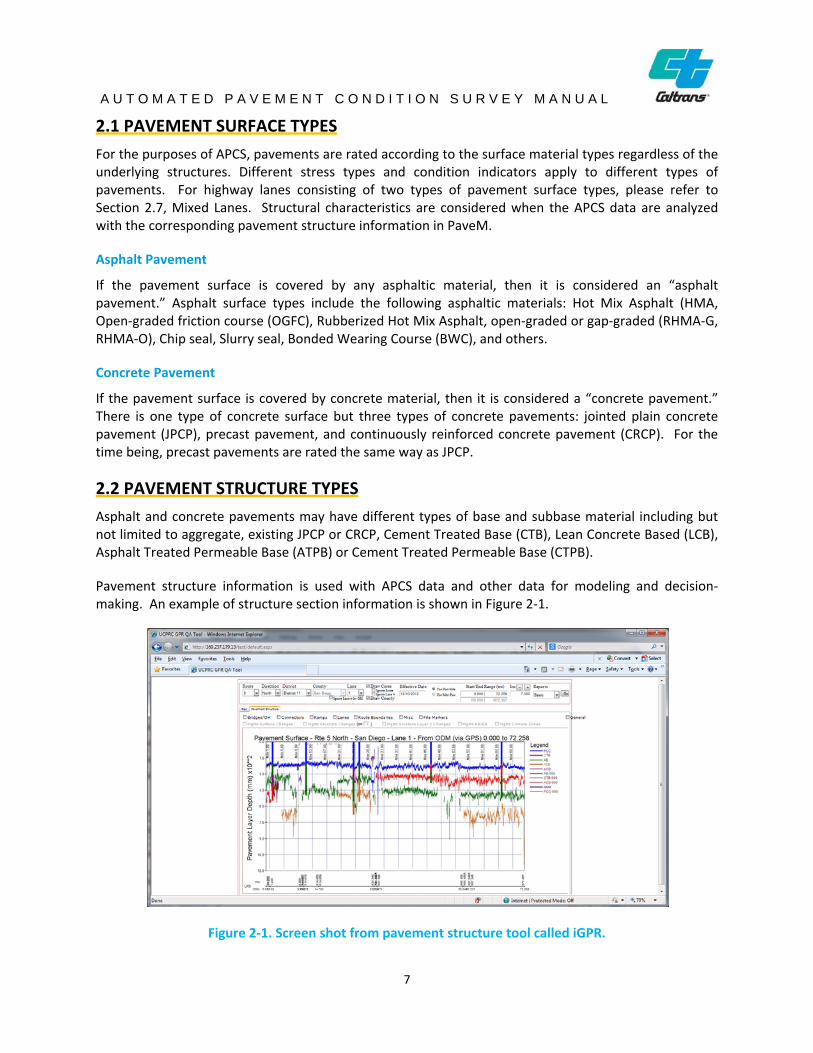
Pavement structure information is used with APCS data and other data for modeling and decision‐making. An example of structure section information is shown in Figure 2‐1.
Figure 2‐1. Screen shot from pavement structure tool called iGPR.
7
A U T O M A T E D P A V E M E N T C O N D I T I O N S U R V E Y M A N U A L
2.3 DISTRESS/CONDITION REPORTING SEGMENTS
Pavement condition data is collected continuously by the survey equipment. This data is then aggregated into larger segments.
Data Collection Element (DCE)
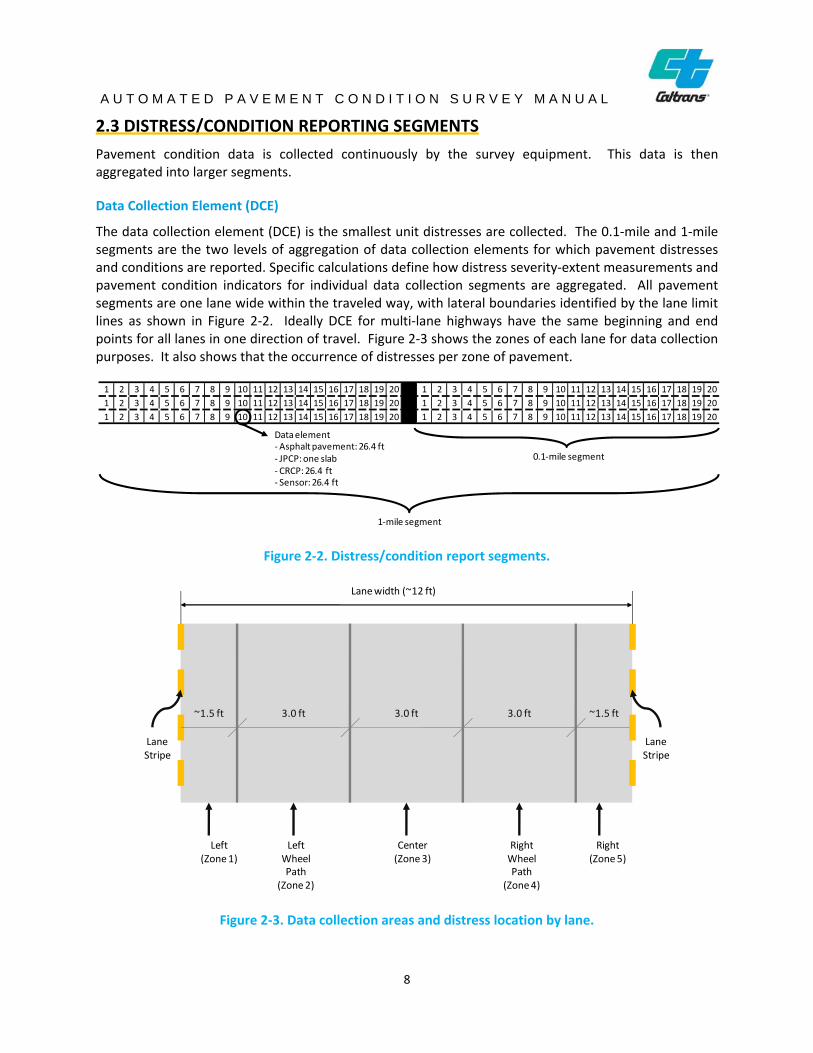
The data collection element (DCE) is the smallest unit distresses are collected. The 0.1‐mile and 1‐mile segments are the two levels of aggregation of data collection elements for which pavement distresses and conditions are reported. Specific calculations define how distress severity‐extent measurements and pavement condition indicators for individual data collection segments are aggregated. All pavement segments are one lane wide within the traveled way, with lateral boundaries identified by the lane limit lines as shown in Figure 2‐2. Ideally DCE for multi‐lane highways have the same beginning and end points for all lanes in one direction of travel. Figure 2‐3 shows the zones of each lane for data collection purposes. It also shows that the occurrence of distresses per zone of pavement.
1 2 3 4 5 6 7 8 9 10 11 12 13 14 15 16 17 18 19 20 1 2 3 4 5 6 7 8 9 10 11 12 13 14 15 16 17 18 19 20
1 2 3 4 5 6 7 8 9 10 11 12 13 14 15 16 17 18 19 20 1 2 3 4 5 6 7 8 9 10 11 12 13 14 15 16 17 18 19 20
1 2 3 4 5 6 7 8 9 10 11 12 13 14 15 16 17 18 19 20 1 2 3 4 5 6 7 8 9 10 11 12 13 14 15 16 17 18 19 20
Data element ‐Asphalt pavement: 26.4 ft ‐ JPCP: one slab 0.1‐mile segment
‐CRCP: 26.4 ft ‐ Sensor: 26.4 ft
1‐mile segment
Figure 2‐2. Distress/condition report segments.
Lane width (~12 ft)
Lane
3.0 ft 3.0 ft 3.0 ft ~1.5 ft ~1.5 ft
Lane Stripe Stripe
Left Left Center Right Right (Zone 1) Wheel (Zone 3) Wheel (Zone 5)
Path Path (Zone 2) (Zone 4)
Figure 2‐3. Data collection areas and distress location by lane.
8
S
A U T O M A T E D P A V E M E N T C O N D I T I O N S U R V E Y M A N U A L
Data Collection Segment (DCS)
The pavement data collection segment (DCS) is the smallest unit for which pavement distresses and conditions are stored in PaveM. DCS is 0.1 mile or 528 ft in length, measured in the longitudinal direction. A DCS is comprised of data collection elements (DCE) whose length depends on the pavement surface type and the pavement distresses or conditions being measured, as shown in Table 2‐1.
Table 2‐1. DCE length for different pavement surface types.
For jointed plain concrete pavements (JPCP), each slab is treated as one DCE. Since there is more than one concrete slab in 26.5 ft, DCE length cannot be standardized to 26.4 ft lengths. For JPCP pavements the DCE generally corresponds to the length of the slab, with short slabs being the exception. The minimum DCE length in the APCS is 8 ft, so if the length of any JPCP slab is less than 8 ft, it is considered as a short slab and the short slab is combined with the preceding slab into one DCE that contains both slabs. In this case, for the purpose of the APCS, the transverse joint between the two slabs that have been combined into one DCE is considered a crack within the DCE. For those distresses and conditions based on pavement surface profiles (see Chapter 6), the DCE length for JPCP pavements is the standard 26.4 ft.
In order to compute the severity for an entire DCS, simply compute the weighted average of all DCE for each severity as follows:
ܥܦ_ݐݐݔܧ
ݎൌ ݎݖ ሺ ݏݏݎݐݏሻ,ݓ, ݑ ݕݐݎݒݏ ݏݏݎݐݏൌ ݎݑ ܧܥܦ ݐݓ ݎݖ ሺ ݏݏݎݐݏሻ,ݓ, ݑ ݕݐݎݒݏ
ൌ ݑݔ ݎݑ ܧܥܦ ݐݓ ݎݖ ሺ ݏݏݎݐݏሻ,ݓ, ݑ ݕݐݎݒݏ
ܧܥܦ_ݐݐݔܧ
ሺ%ሻ ൌ 100 ൈ ௫ܥܦ_ݐݐݔܧ
ୀଵ
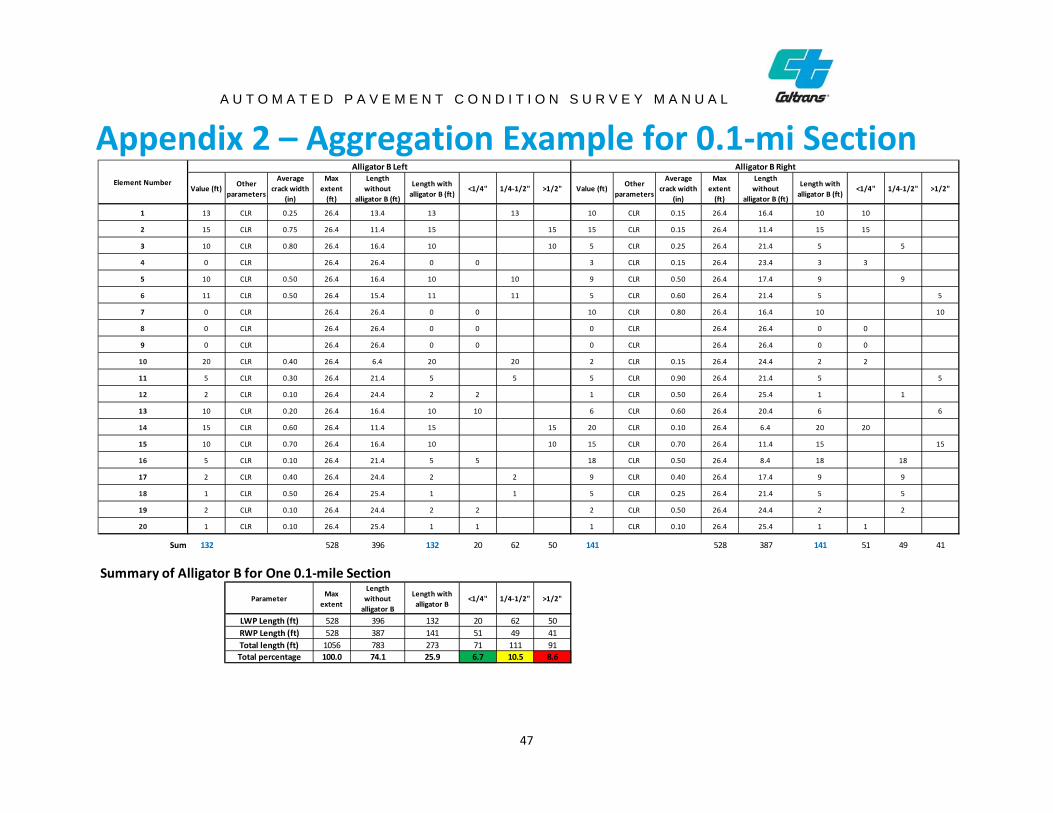
As a result, each DCE will be placed in a bin of low, medium or high severity according to the severity definition for each distress along with its extent, which can be a number, a length or an area depending on how the distress is measured. The summation of extent of a particular distress divided by the maximum extent for that DCS result in the extent of the DCS for that particular severity. Table 2‐2 illustrates how to calculate alligator B from the DCE. Since alligator cracking is calculated for both wheel paths, the maximum DCS extent is 2x20x26.4 ft=1056ft. A summary of the aggregation rules for 0.1‐mile segments is shown in Appendix 1, whereas Appendix 2 shows the example in Table 2‐2 in more detail.
9
S
S
A U T O M A T E D P A V E M E N T C O N D I T I O N S U R V E Y M A N U A L
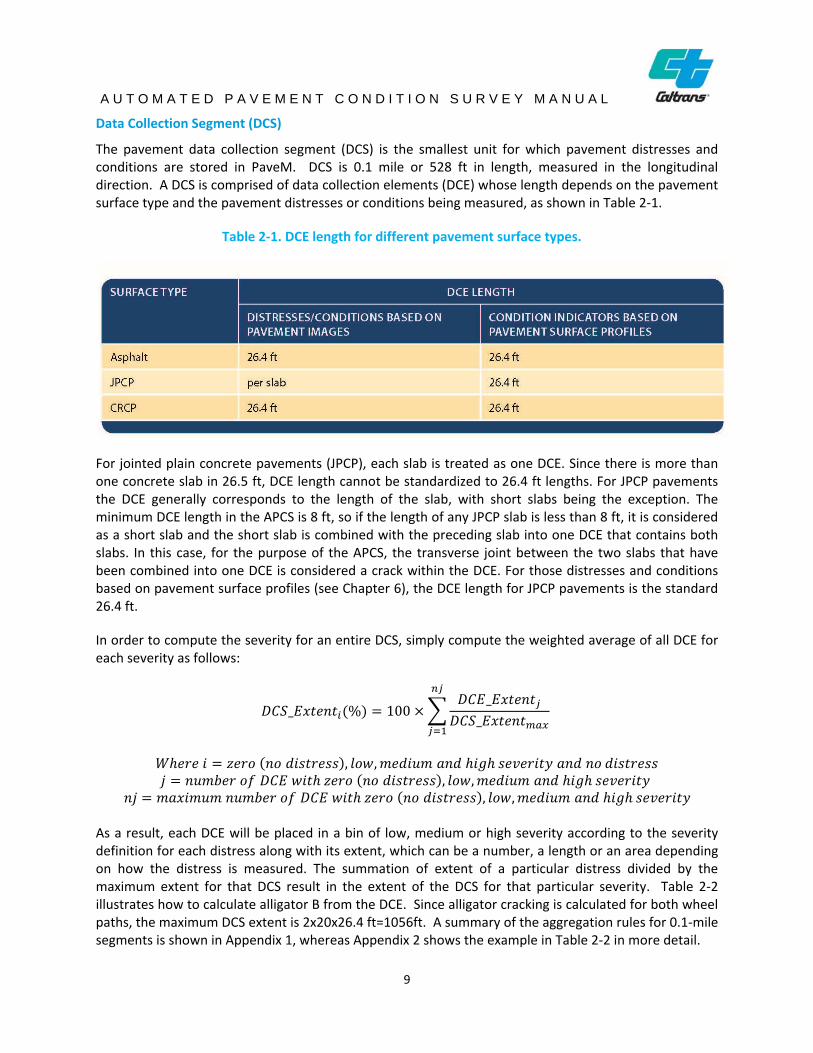
Table 2‐2. Calculation of DCS extent for alligator B.
Problem: Calculate the extent of alligator B for one DCS with 20 DCE of 26.4 ft
Severity DCE Extent (ft) DCS Extent (%) No Distress 783 100x783/1056 = 74.1
Low 71 100x71/1056 = 6.7 Medium 111 100x111/1056 = 10.5 High 91 100x91/1056 = 8.6
Pavement Reporting Segment (PRS)
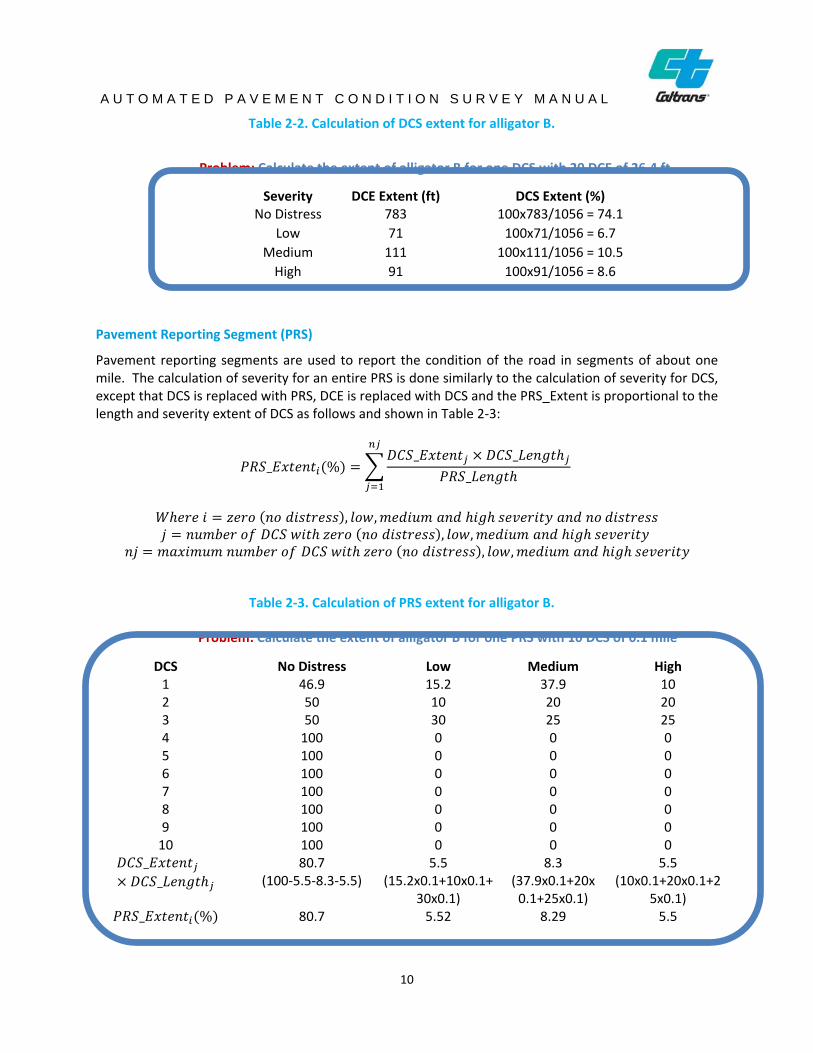
Pavement reporting segments are used to report the condition of the road in segments of about one mile. The calculation of severity for an entire PRS is done similarly to the calculation of severity for DCS, except that DCS is replaced with PRS, DCE is replaced with DCS and the PRS_Extent is proportional to the length and severity extent of DCS as follows and shown in Table 2‐3:
ݐ ݐݔܧݐ_
ݎൌ ݎݖ ሺ ݏݏݎݐݏሻ,ݓ, ݑ ݕݐݎݒݏ ݏݏݎݐݏൌ ݎݑ ܥܦ ݐݓ ݎݖ ሺ ݏݏݎݐݏሻ,ݓ, ݑ ݕݐݎݒݏ
ൌ ݑݔ ݎݑ ܥܦ ݐݓ ݎݖ ሺ ݏݏݎݐݏሻ,ݓ, ݑ ݕݐݎݒݏ
ൈܥ_ܮ ܥܦ_ݐݐݔܧܦ
ሺ%ሻ ൌ _ݐܮ
ୀଵ
Table 2‐3. Calculation of PRS extent for alligator B.
Problem: Calculate the extent of alligator B for one PRS with 10 DCS of 0.1 mile
DCS No Distress Low Medium High 1 46.9 15.2 37.9 10 2 50 10 20 20 3 50 30 25 25 4 100 0 0 0 5 100 0 0 0 6 100 0 0 0 7 100 0 0 0 8 100 0 0 0 9 100 0 0 0
ܥܦ_ݐݐݔܧൈܥ_ܮݐ ܦ
100 0 0 0 80.7 5.5 8.3 5.5
(100‐5.5‐8.3‐5.5) (15.2x0.1+10x0.1+ (37.9x0.1+20x (10x0.1+20x0.1+2 30x0.1) 0.1+25x0.1) 5x0.1)
10
5.58.295.5280.7ݐݔܧݐ_
10
ሺ%ሻ
A U T O M A T E D P A V E M E N T C O N D I T I O N S U R V E Y M A N U A L
2.4 LINEAR REFERENCE
Caltrans primarily uses the district‐county‐route‐traffic direction‐lane number‐postmile convention for identifying locations in the state highway system. Additionally, all collected data are linked to longitude and latitude values measured by the GPS unit installed on the image acquisition and profile measurement vehicles. The linear reference location and GPS coordinates of the midpoint in the center of each DCE is the reference location for the DCE. The same is true for the DCS. The location of a management segment is indicated by a beginning and an end district‐county‐route‐traffic direction‐lane number‐postmile. The beginning and end points of each management segment and their GPS coordinates will be derived in the database based on the locations of the data collection segments within it.
The linear reference system used in the APCS is based on the California Highway Log. Typically, the postmile on each route is reset to zero at the first crossing of each southern or western county line. The direction—eastbound (EB), westbound (WB), southbound (SB), or northbound (NB)—of a data collection segment or a management segment indicates the predominant direction of the route/lane. Lane numbers in each direction start from one for the lane closest to the centerline or median of the roadway, and increase to the outside shoulder.
For instance, “D6‐Fre‐33‐NB‐Lane#1‐PM24.563” refers to a location in District 6 in Fresno County along California State Route 33, in the #1 (the lane closest to the centerline) lane in the northbound direction, at postmile 24.563. This route has an north‐south overall direction, and postmileage values increase as the road goes east.
Postmiles are recorded in the APCS with at least three decimal places. The longitude and latitude values are reported in degrees with at least eight decimal places.
2.5 LANE AND WHEEL PATH
The term “lane” in this manual refers to the lane for which boundaries in the transverse direction are marked by lane limit lines. There are two wheel paths in each lane, defined as the left wheel path (LWP) and the right wheel path (RWP). The geometrical definition of wheel paths is shown in Figure 2‐1. Both wheel paths are parallel to the centerline of the lane and their inner edges are 1.5 ft from the centerline. Each wheel path is 3 ft wide. For a typical 12 ft lane the distances between the outer edges of the wheel paths and the lane limit lines are typically more than 1.5 ft. In this manual, the longitudinal direction refers to the direction parallel to the lane centerline, and the lateral or transverse direction is perpendicular to the longitudinal direction.
2.6 MIXED LANES
It is possible that two surface material types coexist in the same data collection segment, or that one lane includes a longitudinal joint between JPCP slabs, or strips of CRCP. This is often due to road widening, so that the lane is partially on the originally constructed material and partially on a newly constructed material. These situations are identified as “mixed lanes,” and special considerations are needed when measuring distresses from pavement image data. Two special situations should be noted:
11
A U T O M A T E D P A V E M E N T C O N D I T I O N S U R V E Y M A N U A L
If one of the surface materials is less than 3.3 ft wide in the data collection segment, it is not rated as a mixed lane.
If a lane covers two strips of different asphalt pavement surface materials, it is not considered a mixed lane. If the construction joint between the two strips of different asphalt surface materials is open or has apparent defects, it is considered a longitudinal crack.
There are two types of mixed lanes: asphalt‐concrete mixed lanes (asphalt‐JPCP mixed lanes and asphalt‐CRCP mixed lanes) and concrete‐concrete mixed lanes (JPCP‐JPCP mixed lanes, CRCP‐CRCP mixed lanes and JPCP‐CRCP mixed lanes). For pavement image‐based distress and condition evaluation, only one type of pavement surface can be evaluated for each mixed lane data collection segment following the rules below, and the other pavement surface type present in the segment is not included in the analysis and reporting. For pavement surface profiled‐based distress, condition and ride quality evaluation, calculations are performed on profiles as measured.
Asphalt‐Concrete Mixed Lanes
If both asphalt and concrete surfaces are present in the same lane and more than 50% of the area of either wheel path is asphalt, the data collection segment is rated as an asphalt pavement and the concrete portion of the lane is not rated. If less than 50% of the area of either? wheel path is asphalt then rate this lane as a concrete pavement (either JPCP or CRCP), and the distresses and conditions of the asphalt portion are ignored.
Concrete‐Concrete Mixed Lanes
Concrete‐concrete mixed lanes occur where the lane markings significantly deviate from the longitudinal joints between slabs/strips. When JPCP slabs are on both sides of the longitudinal joint, the slab occupying more than half of the data collection segment area is termed the “primary slab” of the data collection segment, and the other “secondary slab.” Only the conditions and distresses of the primary slab are rated, and the conditions and distresses of the secondary slab in the same data collection segment are ignored. If CRCP pavements are on both sides of the longitudinal joint, only the strip with more than half the width of the lane is rated for pavement image‐based distresses and conditions, and distresses/conditions on the other strip are ignored. When one side is CRCP and the other is JPCP, the side with the greater area is rated.
12

A U T O M A T E D P A V E M E N T C O N D I T I O N S U R V E Y M A N U A L
Notes:
13
A U T O M A T E D P A V E M E N T C O N D I T I O N S U R V E Y M A N U A L
Chapter 3 Asphalt Pavement Distress/Condition Measurement and Reporting
14
A U T O M A T E D P A V E M E N T C O N D I T I O N S U R V E Y M A N U A L
3.1 ALLIGATOR A
Description
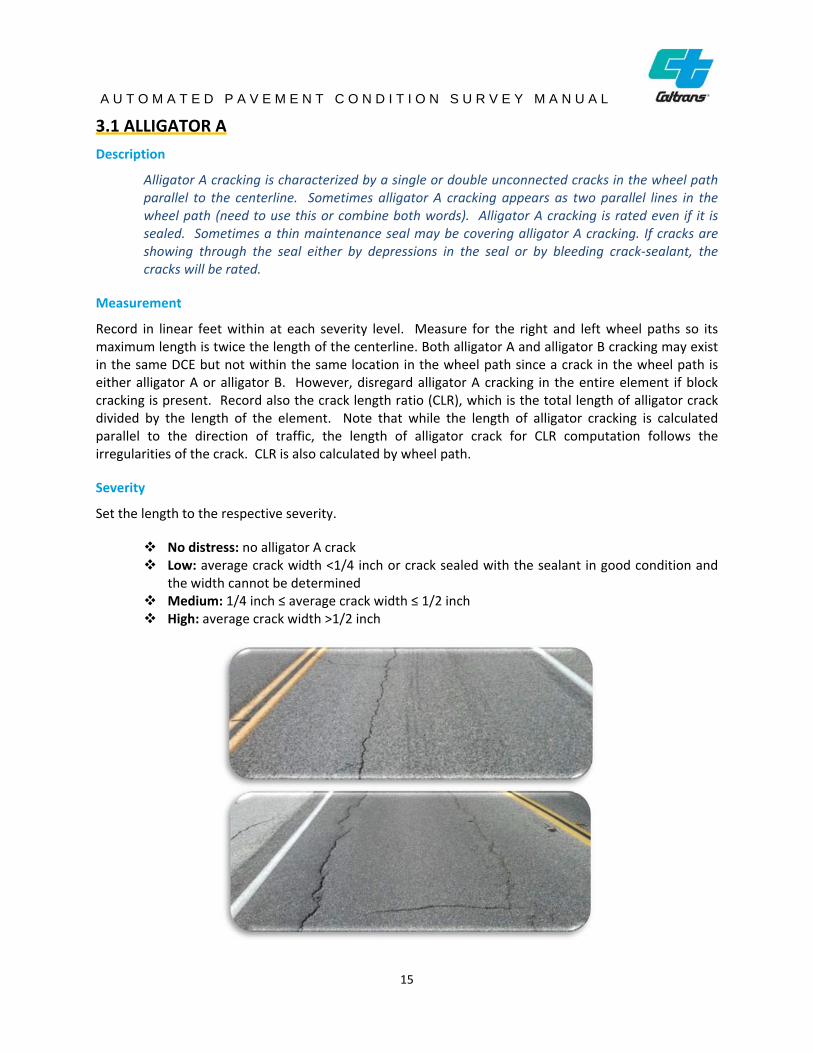
Alligator A cracking is characterized by a single or double unconnected cracks in the wheel path parallel to the centerline. Sometimes alligator A cracking appears as two parallel lines in the wheel path (need to use this or combine both words). Alligator A cracking is rated even if it is sealed. Sometimes a thin maintenance seal may be covering alligator A cracking. If cracks are showing through the seal either by depressions in the seal or by bleeding crack‐sealant, the cracks will be rated.
Measurement
Record in linear feet within at each severity level. Measure for the right and left wheel paths so its maximum length is twice the length of the centerline. Both alligator A and alligator B cracking may exist in the same DCE but not within the same location in the wheel path since a crack in the wheel path is either alligator A or alligator B. However, disregard alligator A cracking in the entire element if block cracking is present. Record also the crack length ratio (CLR), which is the total length of alligator crack divided by the length of the element. Note that while the length of alligator cracking is calculated parallel to the direction of traffic, the length of alligator crack for CLR computation follows the irregularities of the crack. CLR is also calculated by wheel path.
Severity
Set the length to the respective severity.
No distress: no alligator A crack Low: average crack width <1/4 inch or crack sealed with the sealant in good condition and
the width cannot be determined Medium: 1/4 inch ≤ average crack width ≤ 1/2 inch High: average crack width >1/2 inch
15

A U T O M A T E D P A V E M E N T C O N D I T I O N S U R V E Y M A N U A L
Figure 3‐1: Examples of alligator A cracking.
16
A U T O M A T E D P A V E M E N T C O N D I T I O N S U R V E Y M A N U A L
3.2 ALLIGATOR B
Description
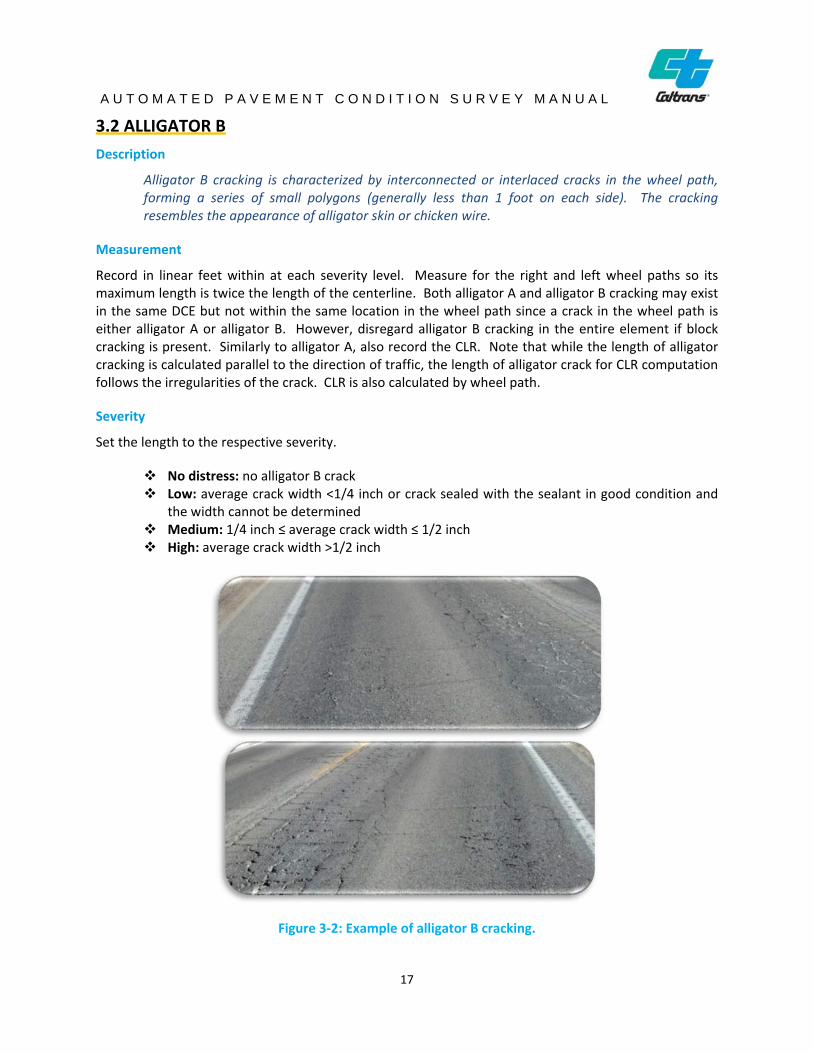
Alligator B cracking is characterized by interconnected or interlaced cracks in the wheel path, forming a series of small polygons (generally less than 1 foot on each side). The cracking resembles the appearance of alligator skin or chicken wire.
Measurement
Record in linear feet within at each severity level. Measure for the right and left wheel paths so its maximum length is twice the length of the centerline. Both alligator A and alligator B cracking may exist in the same DCE but not within the same location in the wheel path since a crack in the wheel path is either alligator A or alligator B. However, disregard alligator B cracking in the entire element if block cracking is present. Similarly to alligator A, also record the CLR. Note that while the length of alligator cracking is calculated parallel to the direction of traffic, the length of alligator crack for CLR computation follows the irregularities of the crack. CLR is also calculated by wheel path.
Severity
Set the length to the respective severity.
No distress: no alligator B crack Low: average crack width <1/4 inch or crack sealed with the sealant in good condition and
the width cannot be determined Medium: 1/4 inch ≤ average crack width ≤ 1/2 inch High: average crack width >1/2 inch
Figure 3‐2: Example of alligator B cracking.
17
A U T O M A T E D P A V E M E N T C O N D I T I O N S U R V E Y M A N U A L
3.3 BLOCK CRACKING
Description
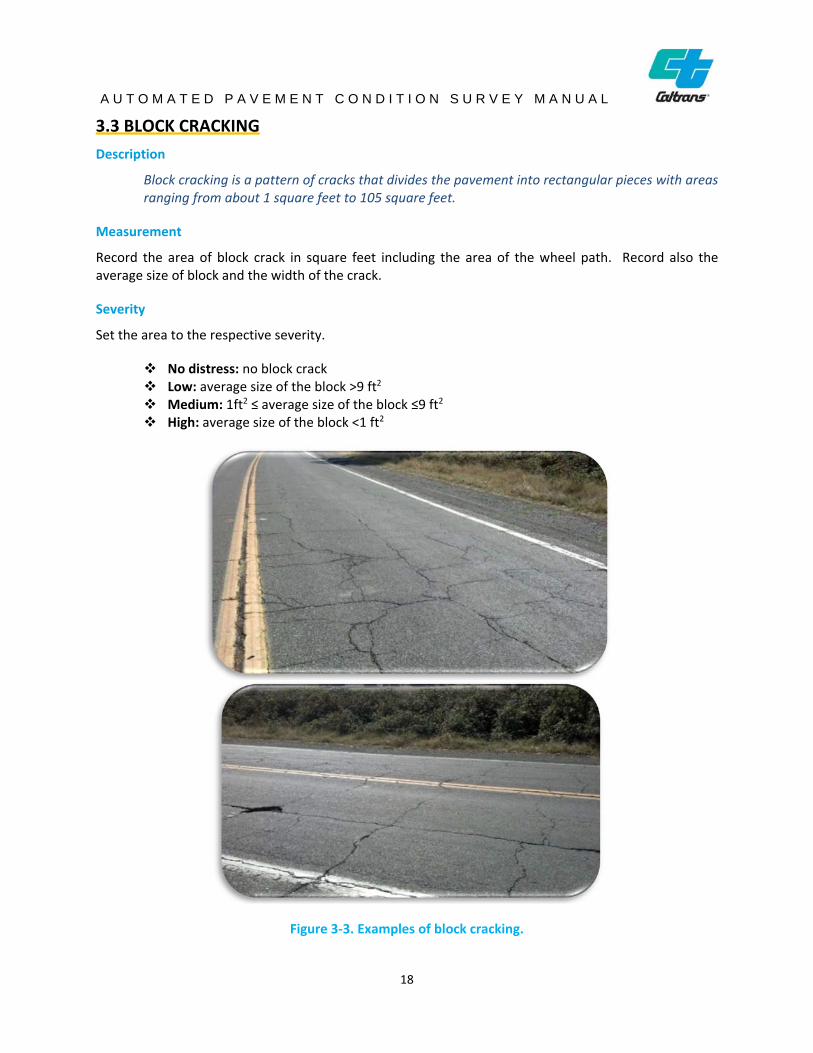
Block cracking is a pattern of cracks that divides the pavement into rectangular pieces with areas ranging from about 1 square feet to 105 square feet.
Measurement
Record the area of block crack in square feet including the area of the wheel path. Record also the average size of block and the width of the crack.
Severity
Set the area to the respective severity.
No distress: no block crack Low: average size of the block >9 ft2
Medium: 1ft2 ≤ average size of the block ≤9 ft2
High: average size of the block <1 ft2
Figure 3‐3. Examples of block cracking.
18
A U T O M A T E D P A V E M E N T C O N D I T I O N S U R V E Y M A N U A L
3.4 EDGE CRACKING
Description
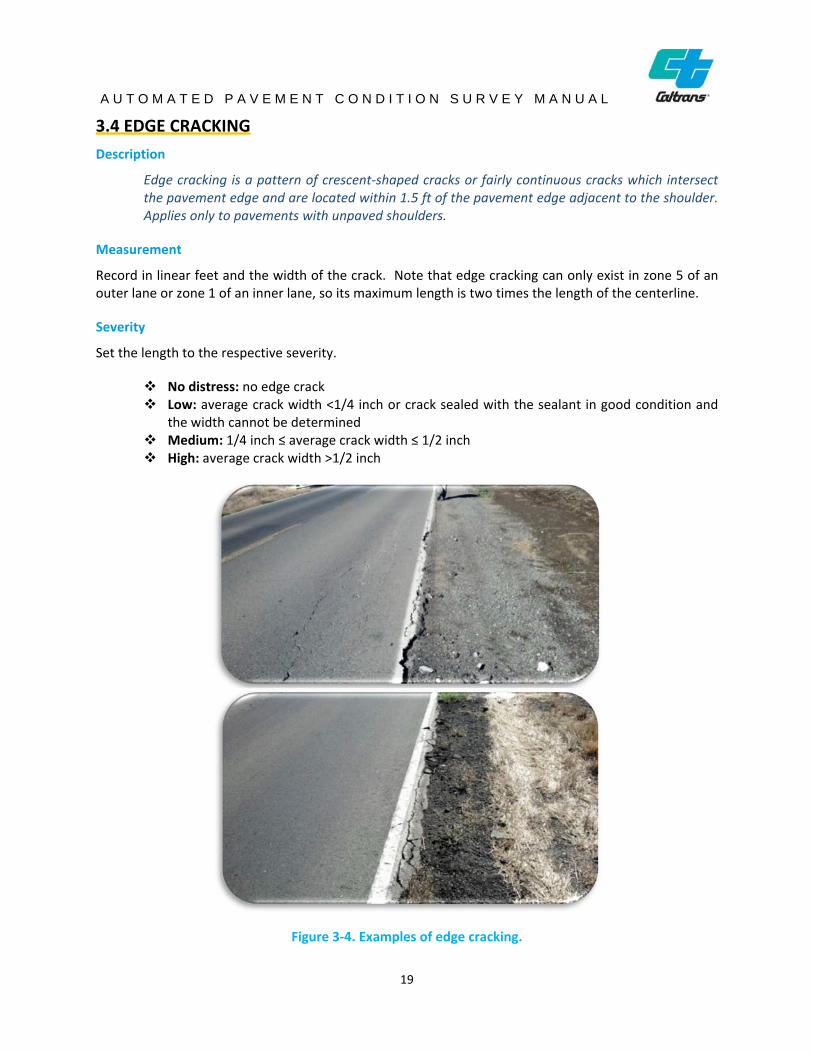
Edge cracking is a pattern of crescent‐shaped cracks or fairly continuous cracks which intersect the pavement edge and are located within 1.5 ft of the pavement edge adjacent to the shoulder. Applies only to pavements with unpaved shoulders.
Measurement
Record in linear feet and the width of the crack. Note that edge cracking can only exist in zone 5 of an outer lane or zone 1 of an inner lane, so its maximum length is two times the length of the centerline.
Severity
Set the length to the respective severity.
No distress: no edge crack Low: average crack width <1/4 inch or crack sealed with the sealant in good condition and
the width cannot be determined Medium: 1/4 inch ≤ average crack width ≤ 1/2 inch High: average crack width >1/2 inch
Figure 3‐4. Examples of edge cracking.
19
A U T O M A T E D P A V E M E N T C O N D I T I O N S U R V E Y M A N U A L
3.5 LONGITUDINAL CRACKING
Description
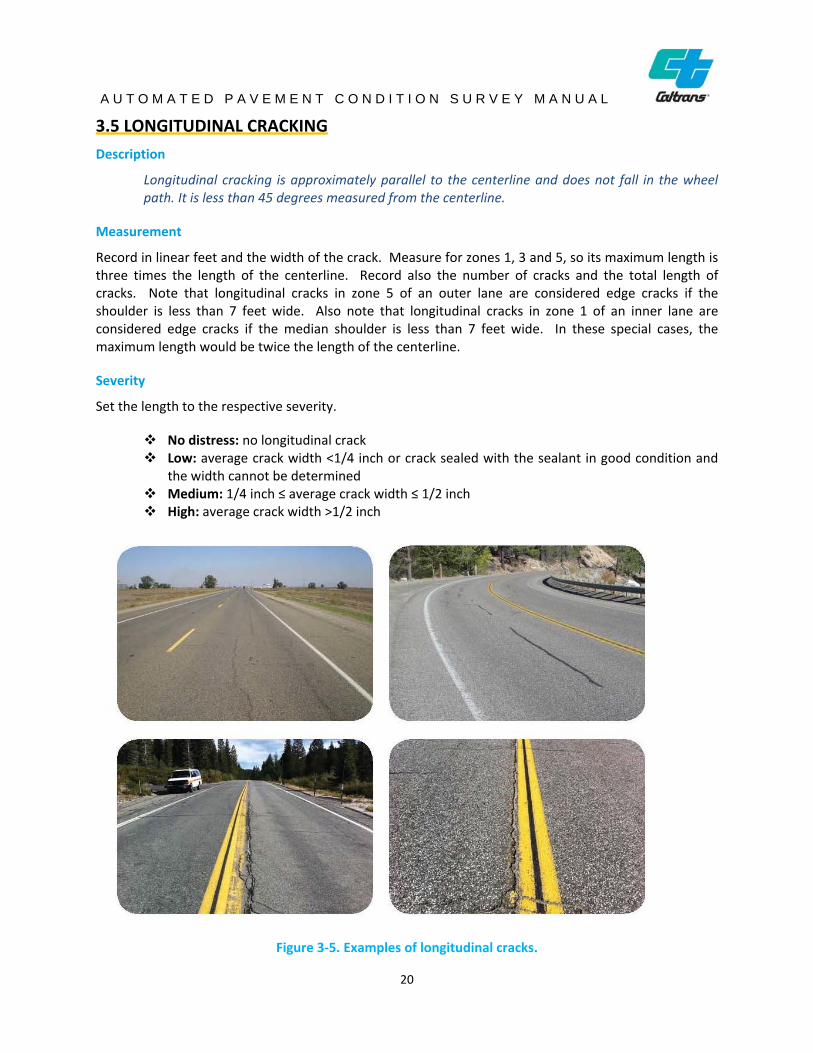
Longitudinal cracking is approximately parallel to the centerline and does not fall in the wheel path. It is less than 45 degrees measured from the centerline.
Measurement
Record in linear feet and the width of the crack. Measure for zones 1, 3 and 5, so its maximum length is three times the length of the centerline. Record also the number of cracks and the total length of cracks. Note that longitudinal cracks in zone 5 of an outer lane are considered edge cracks if the shoulder is less than 7 feet wide. Also note that longitudinal cracks in zone 1 of an inner lane are considered edge cracks if the median shoulder is less than 7 feet wide. In these special cases, the maximum length would be twice the length of the centerline.
Severity
Set the length to the respective severity.
No distress: no longitudinal crack Low: average crack width <1/4 inch or crack sealed with the sealant in good condition and
the width cannot be determined Medium: 1/4 inch ≤ average crack width ≤ 1/2 inch High: average crack width >1/2 inch
Figure 3‐5. Examples of longitudinal cracks.
20
A U T O M A T E D P A V E M E N T C O N D I T I O N S U R V E Y M A N U A L
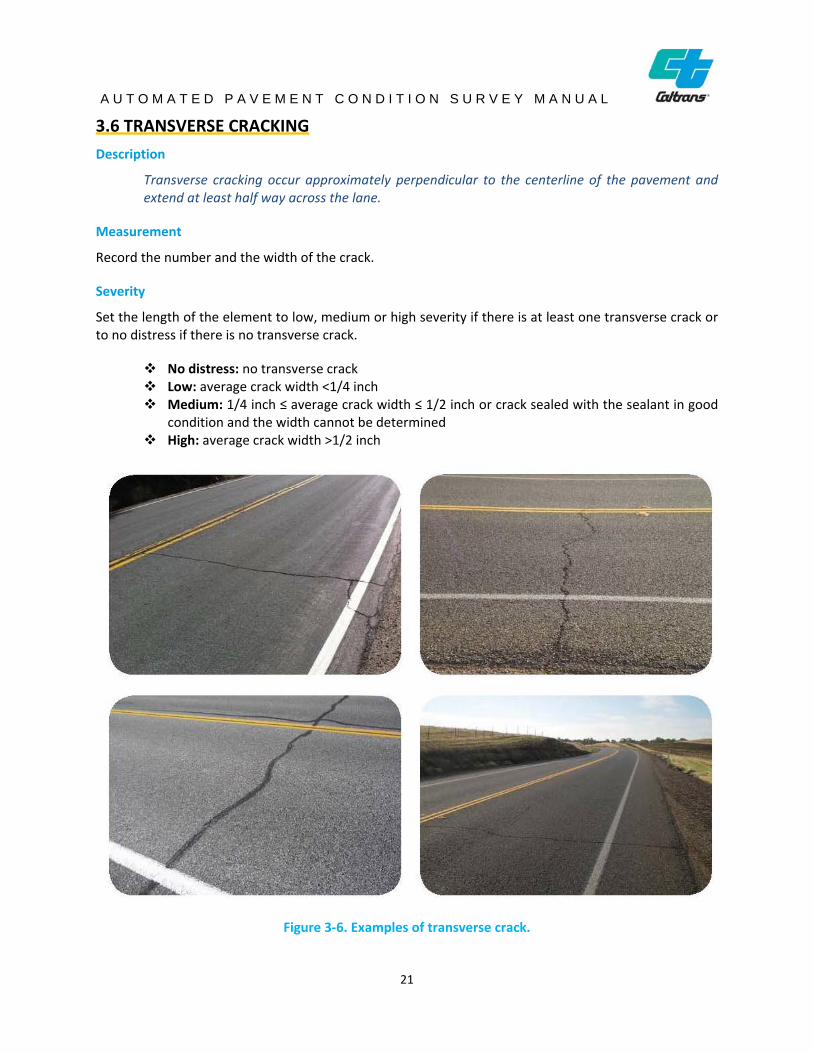
3.6 TRANSVERSE CRACKING
Description
Transverse cracking occur approximately perpendicular to the centerline of the pavement and extend at least half way across the lane.
Measurement
Record the number and the width of the crack.
Severity
Set the length of the element to low, medium or high severity if there is at least one transverse crack or to no distress if there is no transverse crack.
No distress: no transverse crack Low: average crack width <1/4 inch Medium: 1/4 inch ≤ average crack width ≤ 1/2 inch or crack sealed with the sealant in good
condition and the width cannot be determined High: average crack width >1/2 inch
Figure 3‐6. Examples of transverse crack.
21
A U T O M A T E D P A V E M E N T C O N D I T I O N S U R V E Y M A N U A L
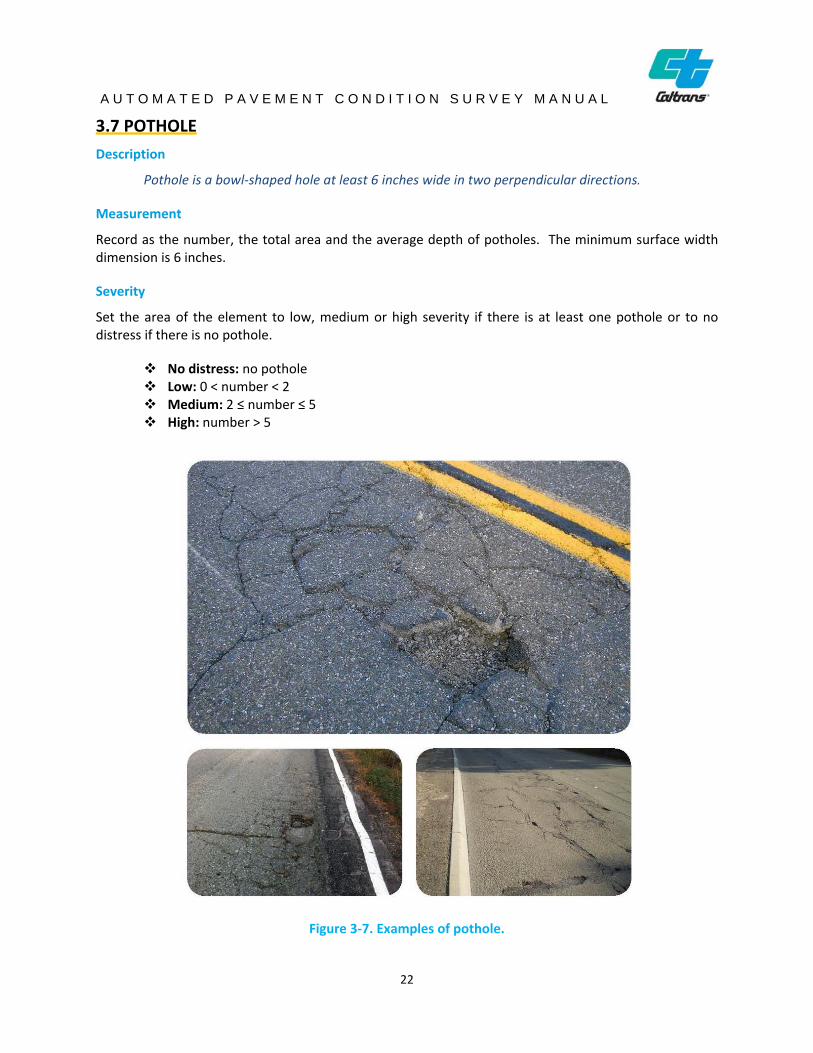
3.7 POTHOLE
Description
Pothole is a bowl‐shaped hole at least 6 inches wide in two perpendicular directions.
Measurement
Record as the number, the total area and the average depth of potholes. The minimum surface width dimension is 6 inches.
Severity
Set the area of the element to low, medium or high severity if there is at least one pothole or to no distress if there is no pothole.
No distress: no pothole Low: 0 < number < 2 Medium: 2 ≤ number ≤ 5 High: number > 5
Figure 3‐7. Examples of pothole.
22
A U T O M A T E D P A V E M E N T C O N D I T I O N S U R V E Y M A N U A L
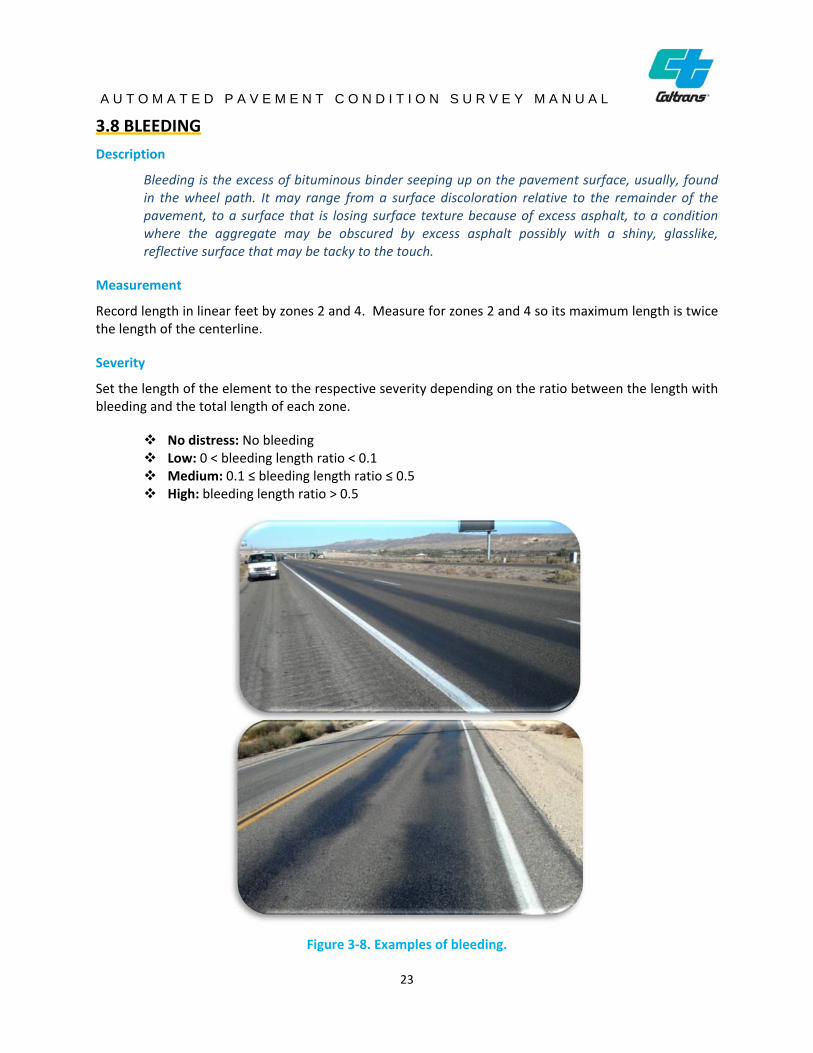
3.8 BLEEDING
Description
Bleeding is the excess of bituminous binder seeping up on the pavement surface, usually, found in the wheel path. It may range from a surface discoloration relative to the remainder of the pavement, to a surface that is losing surface texture because of excess asphalt, to a condition where the aggregate may be obscured by excess asphalt possibly with a shiny, glasslike, reflective surface that may be tacky to the touch.
Measurement
Record length in linear feet by zones 2 and 4. Measure for zones 2 and 4 so its maximum length is twice the length of the centerline.
Severity
Set the length of the element to the respective severity depending on the ratio between the length with bleeding and the total length of each zone.
No distress: No bleeding Low: 0 < bleeding length ratio < 0.1 Medium: 0.1 ≤ bleeding length ratio ≤ 0.5 High: bleeding length ratio > 0.5
Figure 3‐8. Examples of bleeding.
23
A U T O M A T E D P A V E M E N T C O N D I T I O N S U R V E Y M A N U A L
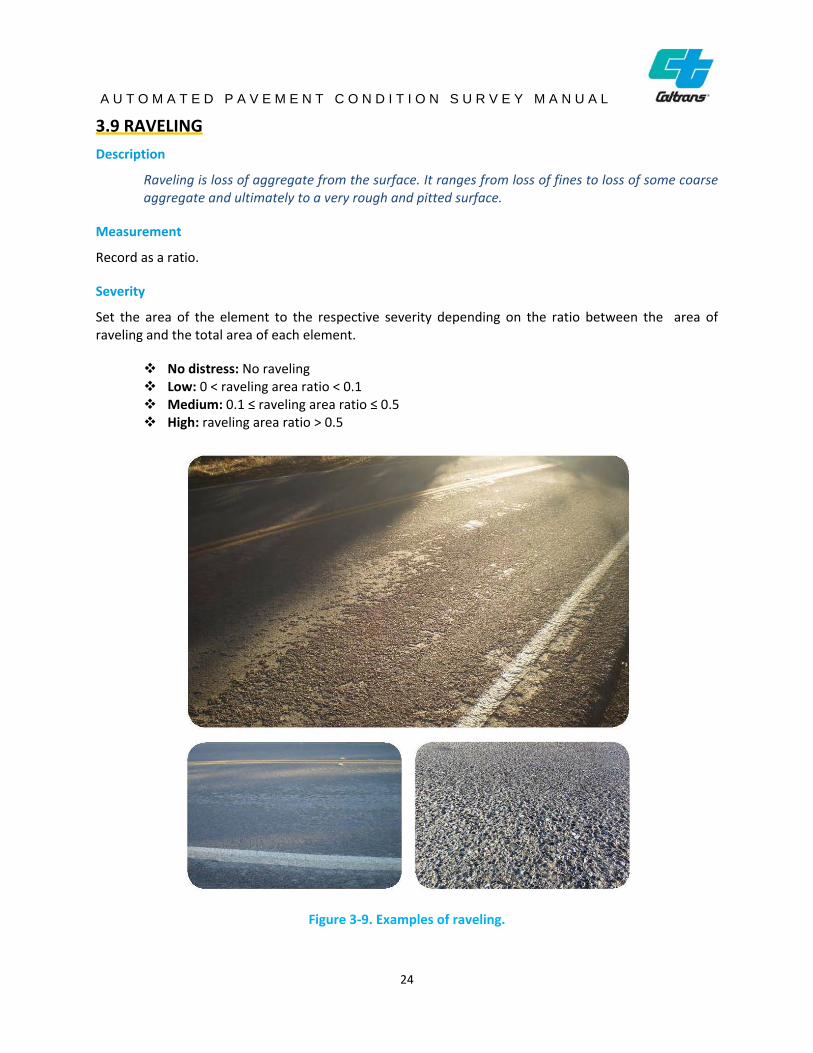
3.9 RAVELING
Description
Raveling is loss of aggregate from the surface. It ranges from loss of fines to loss of some coarse aggregate and ultimately to a very rough and pitted surface.
Measurement
Record as a ratio.
Severity
Set the area of the element to the respective severity depending on the ratio between the area of raveling and the total area of each element.
No distress: No raveling Low: 0 < raveling area ratio < 0.1 Medium: 0.1 ≤ raveling area ratio ≤ 0.5 High: raveling area ratio > 0.5
Figure 3‐9. Examples of raveling.
24

A U T O M A T E D P A V E M E N T C O N D I T I O N S U R V E Y M A N U A L
Notes:
25

A U T O M A T E D P A V E M E N T C O N D I T I O N S U R V E Y M A N U A L
Chapter 4 Jointed Plain Concrete Pavement Distress/Condition Measurement and Reporting
26
A U T O M A T E D P A V E M E N T C O N D I T I O N S U R V E Y M A N U A L
4.1 CORNER CRACKING
Description
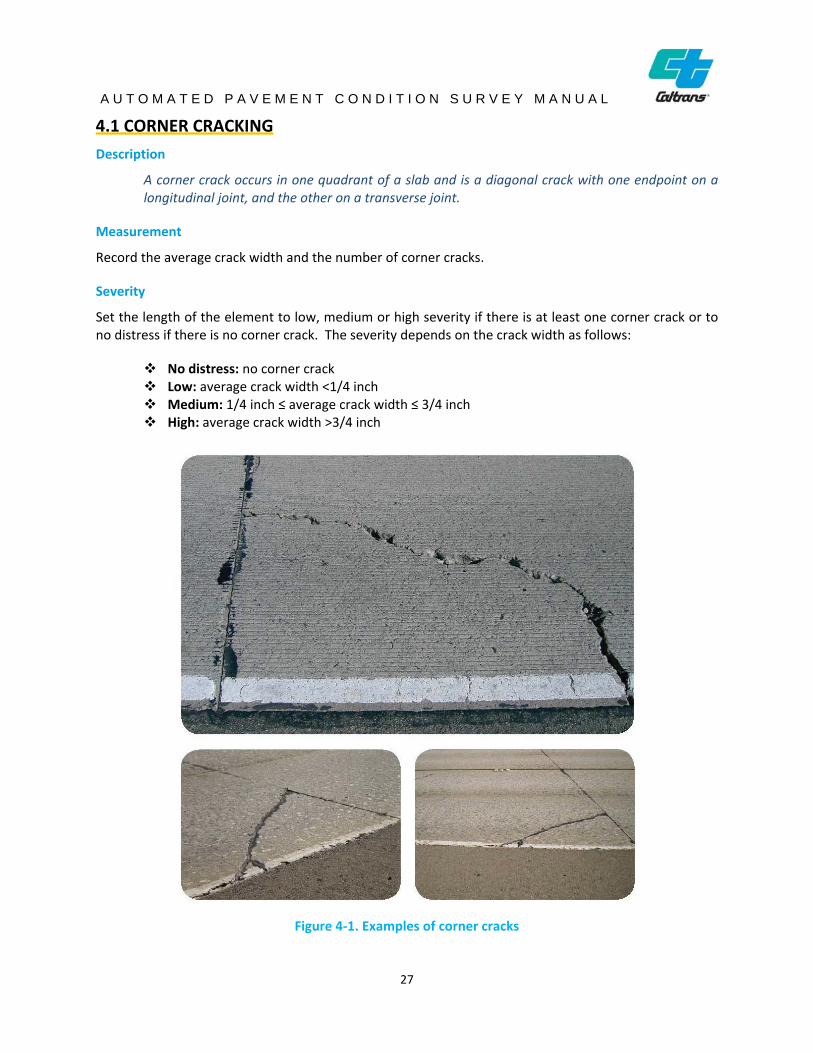
A corner crack occurs in one quadrant of a slab and is a diagonal crack with one endpoint on a longitudinal joint, and the other on a transverse joint.
Measurement
Record the average crack width and the number of corner cracks.
Severity
Set the length of the element to low, medium or high severity if there is at least one corner crack or to no distress if there is no corner crack. The severity depends on the crack width as follows:
No distress: no corner crack Low: average crack width <1/4 inch Medium: 1/4 inch ≤ average crack width ≤ 3/4 inch High: average crack width >3/4 inch
Figure 4‐1. Examples of corner cracks
27
A U T O M A T E D P A V E M E N T C O N D I T I O N S U R V E Y M A N U A L
4.2 LONGITUDINAL CRACKING
Description
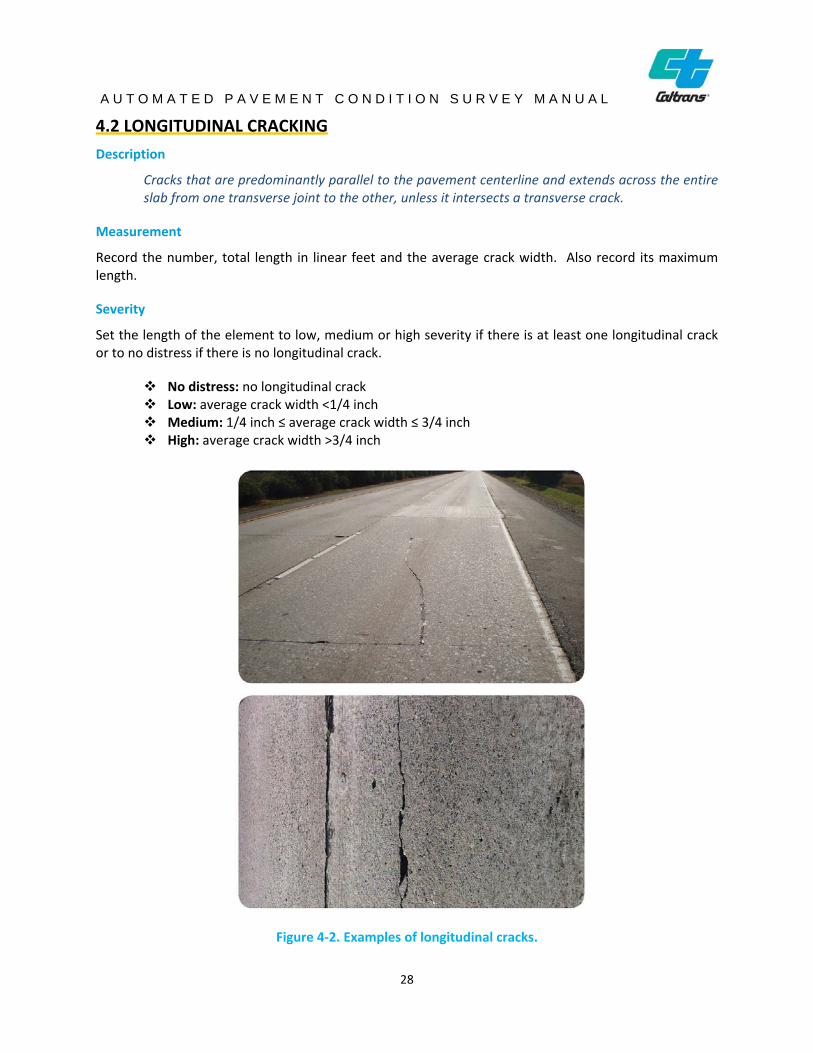
Cracks that are predominantly parallel to the pavement centerline and extends across the entire slab from one transverse joint to the other, unless it intersects a transverse crack.
Measurement
Record the number, total length in linear feet and the average crack width. Also record its maximum length.
Severity
Set the length of the element to low, medium or high severity if there is at least one longitudinal crack or to no distress if there is no longitudinal crack.
No distress: no longitudinal crack Low: average crack width <1/4 inch Medium: 1/4 inch ≤ average crack width ≤ 3/4 inch High: average crack width >3/4 inch
Figure 4‐2. Examples of longitudinal cracks.
28
A U T O M A T E D P A V E M E N T C O N D I T I O N S U R V E Y M A N U A L
4.3 TRANSVERSE CRACKING
Description
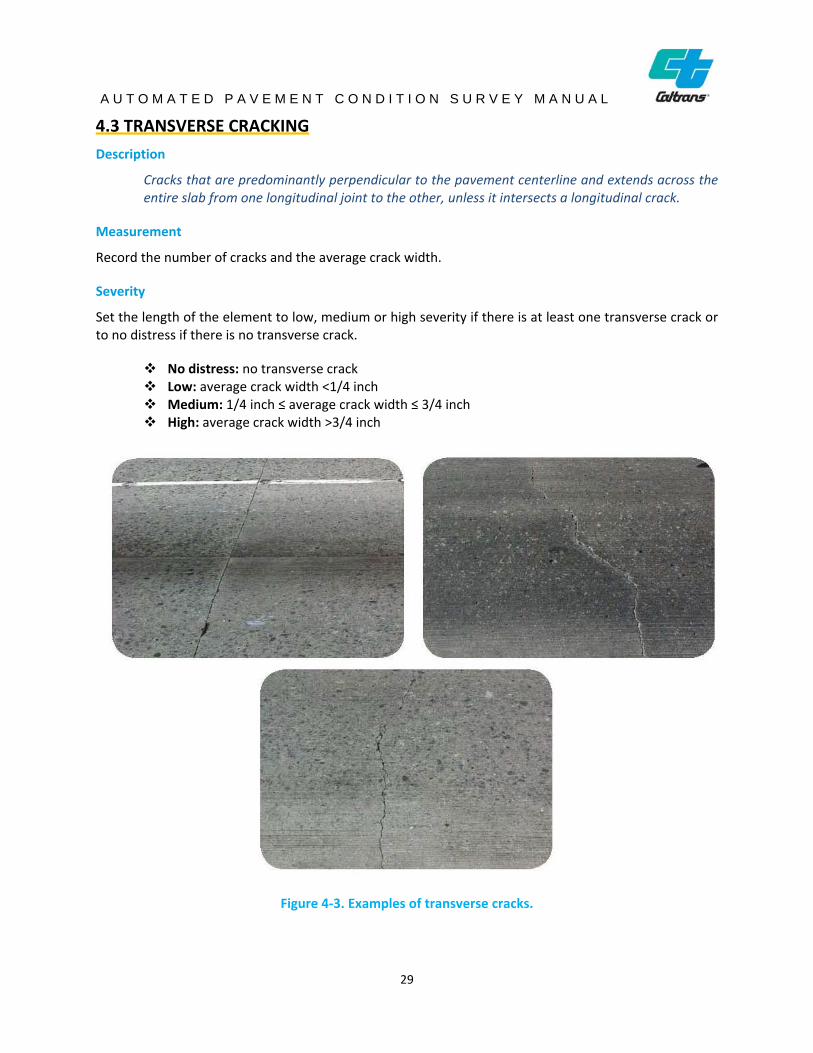
Cracks that are predominantly perpendicular to the pavement centerline and extends across the entire slab from one longitudinal joint to the other, unless it intersects a longitudinal crack.
Measurement
Record the number of cracks and the average crack width.
Severity
Set the length of the element to low, medium or high severity if there is at least one transverse crack or to no distress if there is no transverse crack.
No distress: no transverse crack Low: average crack width <1/4 inch Medium: 1/4 inch ≤ average crack width ≤ 3/4 inch High: average crack width >3/4 inch
Figure 4‐3. Examples of transverse cracks.
29
A U T O M A T E D P A V E M E N T C O N D I T I O N S U R V E Y M A N U A L
4.4 SPALLING
Description
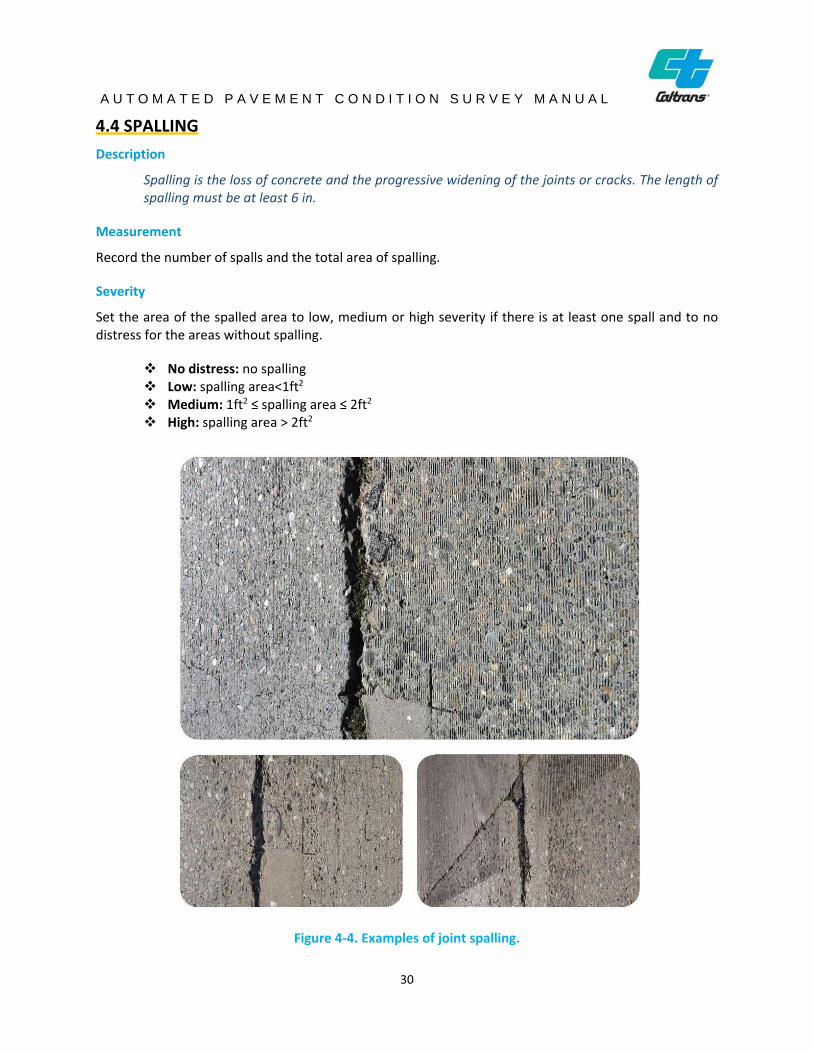
Spalling is the loss of concrete and the progressive widening of the joints or cracks. The length of spalling must be at least 6 in.
Measurement
Record the number of spalls and the total area of spalling.
Severity
Set the area of the spalled area to low, medium or high severity if there is at least one spall and to no distress for the areas without spalling.
No distress: no spalling Low: spalling area<1ft2
Medium: 1ft2 ≤ spalling area ≤ 2ft2
High: spalling area > 2ft2
Figure 4‐4. Examples of joint spalling.
30
A U T O M A T E D P A V E M E N T C O N D I T I O N S U R V E Y M A N U A L
4.5 THIRD STAGE CRACKING
Description
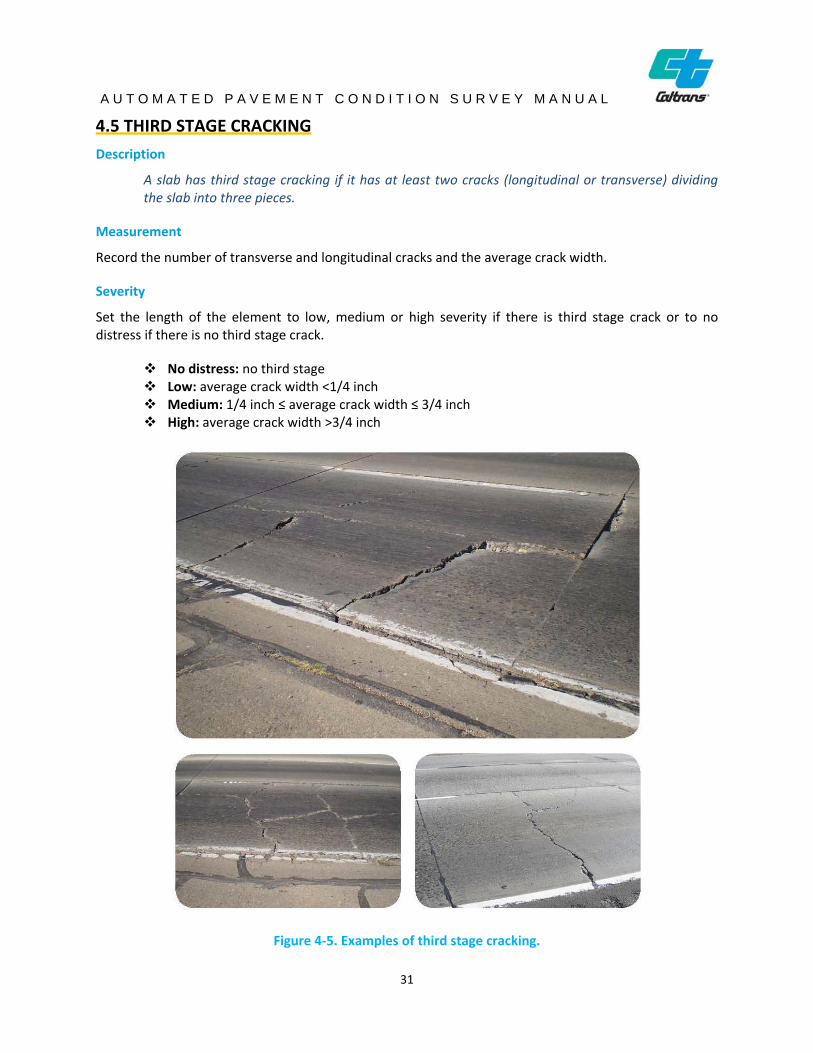
A slab has third stage cracking if it has at least two cracks (longitudinal or transverse) dividing the slab into three pieces.
Measurement
Record the number of transverse and longitudinal cracks and the average crack width.
Severity
Set the length of the element to low, medium or high severity if there is third stage crack or to no distress if there is no third stage crack.
No distress: no third stage Low: average crack width <1/4 inch Medium: 1/4 inch ≤ average crack width ≤ 3/4 inch High: average crack width >3/4 inch
Figure 4‐5. Examples of third stage cracking.
31
A U T O M A T E D P A V E M E N T C O N D I T I O N S U R V E Y M A N U A L
4.6 LANE/SHOULDER DROP‐OFF
Description
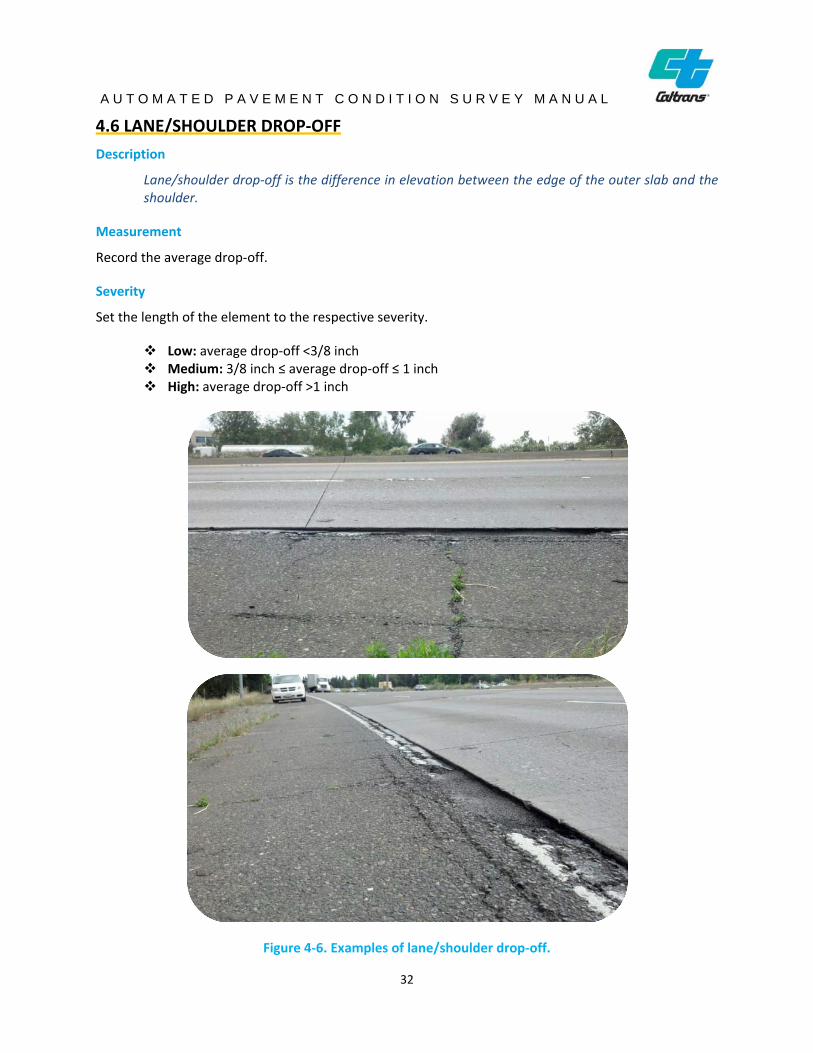
Lane/shoulder drop‐off is the difference in elevation between the edge of the outer slab and the shoulder.
Measurement
Record the average drop‐off.
Severity
Set the length of the element to the respective severity.
Low: average drop‐off <3/8 inch Medium: 3/8 inch ≤ average drop‐off ≤ 1 inch High: average drop‐off >1 inch
Figure 4‐6. Examples of lane/shoulder drop‐off.
32
A U T O M A T E D P A V E M E N T C O N D I T I O N S U R V E Y M A N U A L
4.7 LANE/SHOULDER JOINT WIDTH
Description
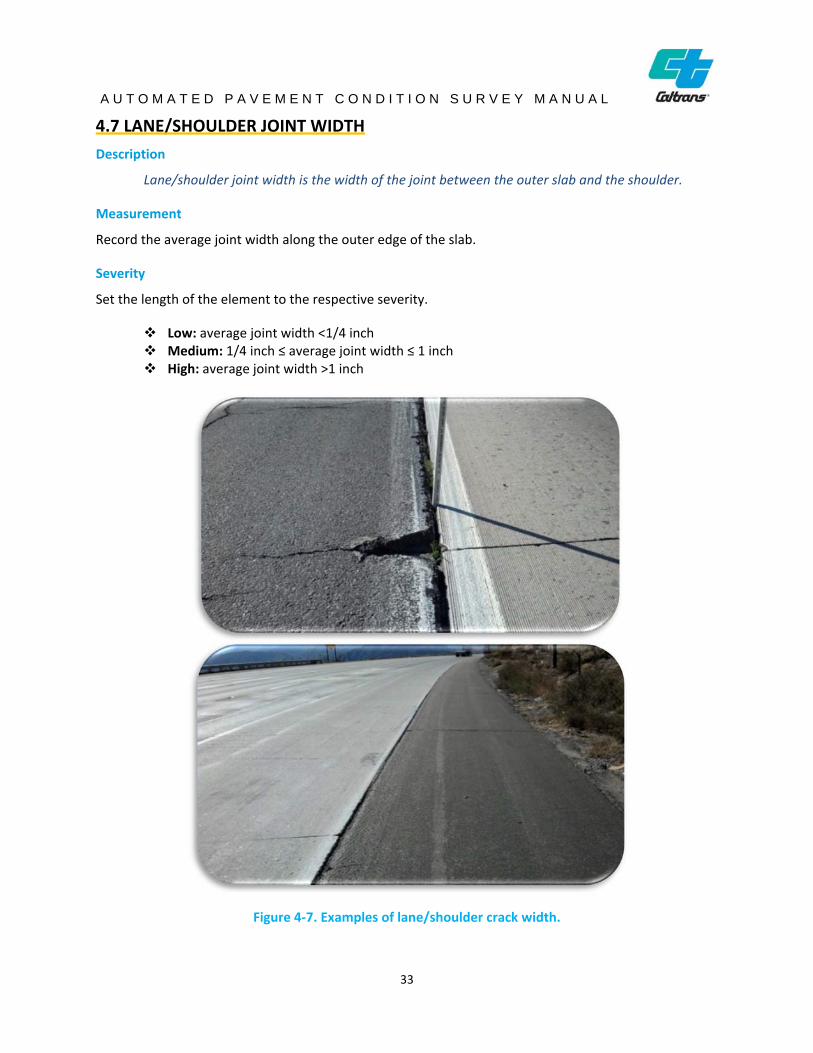
Lane/shoulder joint width is the width of the joint between the outer slab and the shoulder.
Measurement
Record the average joint width along the outer edge of the slab.
Severity
Set the length of the element to the respective severity.
Low: average joint width <1/4 inch Medium: 1/4 inch ≤ average joint width ≤ 1 inch High: average joint width >1 inch
Figure 4‐7. Examples of lane/shoulder crack width.
33
A U T O M A T E D P A V E M E N T C O N D I T I O N S U R V E Y M A N U A L
4.8 LONGITUDINAL JOINT
Description
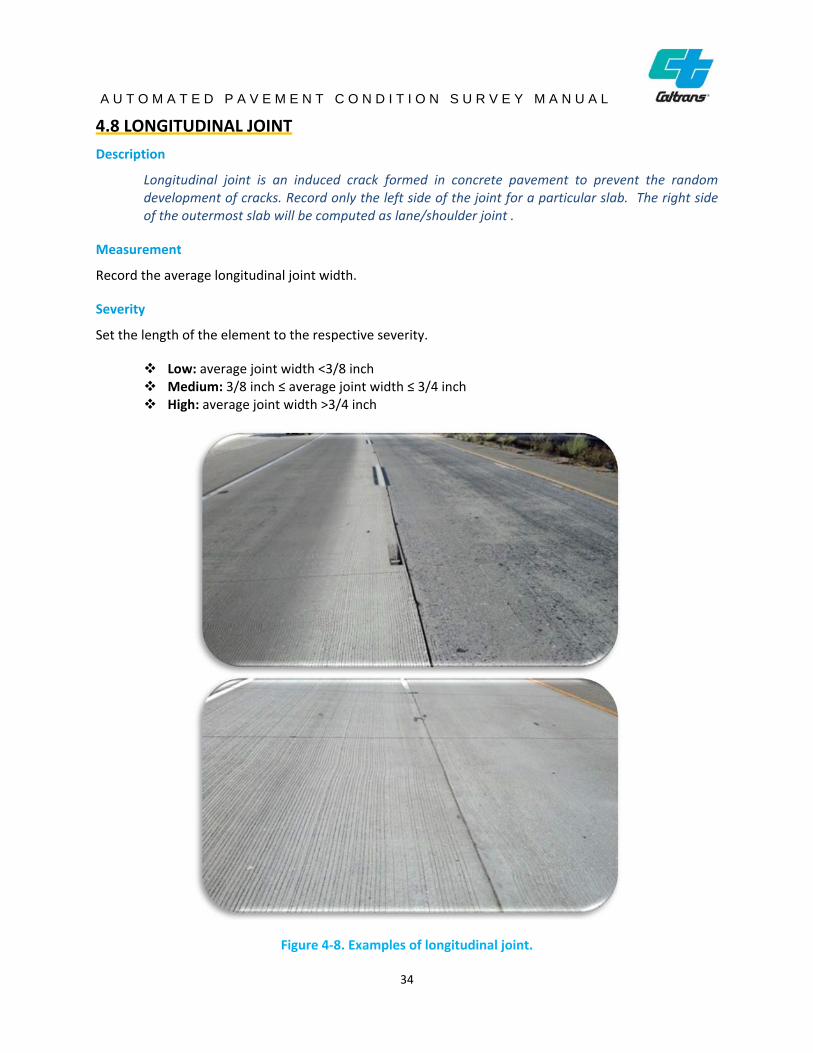
Longitudinal joint is an induced crack formed in concrete pavement to prevent the random development of cracks. Record only the left side of the joint for a particular slab. The right side of the outermost slab will be computed as lane/shoulder joint .
Measurement
Record the average longitudinal joint width.
Severity
Set the length of the element to the respective severity.
Low: average joint width <3/8 inch Medium: 3/8 inch ≤ average joint width ≤ 3/4 inch High: average joint width >3/4 inch
Figure 4‐8. Examples of longitudinal joint.
34
A U T O M A T E D P A V E M E N T C O N D I T I O N S U R V E Y M A N U A L
4.9 TRANSVERSE JOINT
Description
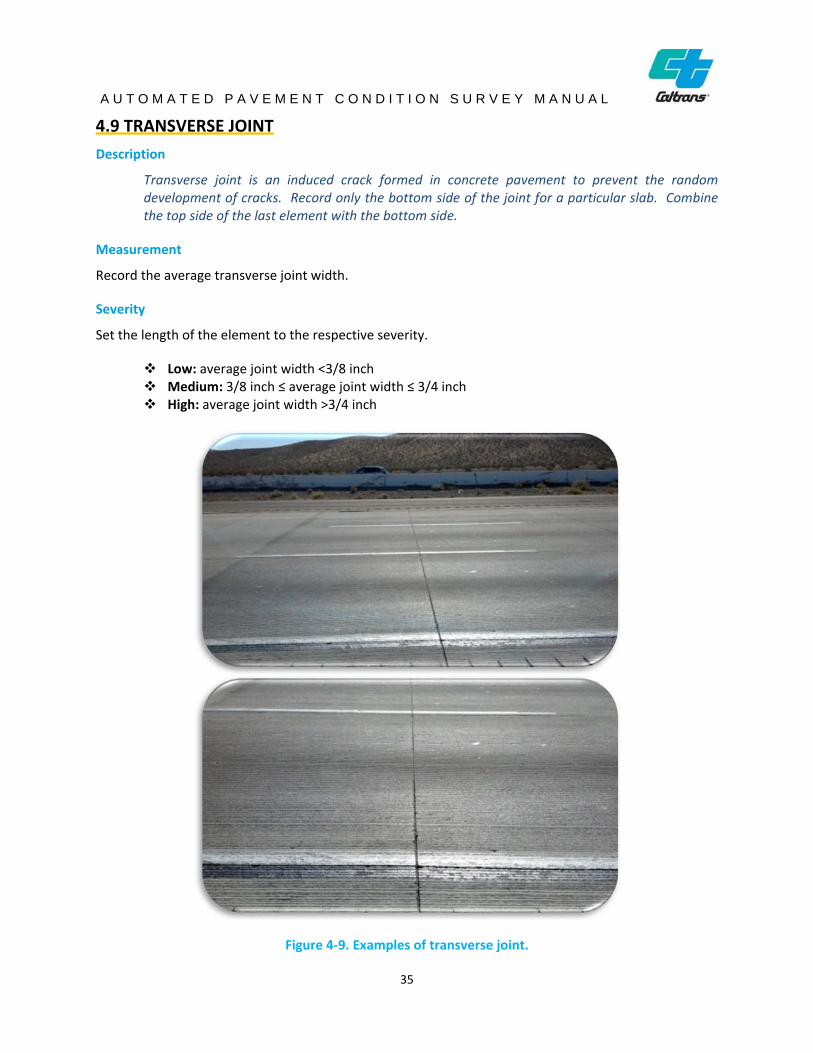
Transverse joint is an induced crack formed in concrete pavement to prevent the random development of cracks. Record only the bottom side of the joint for a particular slab. Combine the top side of the last element with the bottom side.
Measurement
Record the average transverse joint width.
Severity
Set the length of the element to the respective severity.
Low: average joint width <3/8 inch Medium: 3/8 inch ≤ average joint width ≤ 3/4 inch High: average joint width >3/4 inch
Figure 4‐9. Examples of transverse joint.
35

A U T O M A T E D P A V E M E N T C O N D I T I O N S U R V E Y M A N U A L
Notes:
36
A U T O M A T E D P A V E M E N T C O N D I T I O N S U R V E Y M A N U A L
Chapter 5 Continuously Reinforced Concrete Pavement Distress/Condition Measurement and Reporting
37
A U T O M A T E D P A V E M E N T C O N D I T I O N S U R V E Y M A N U A L
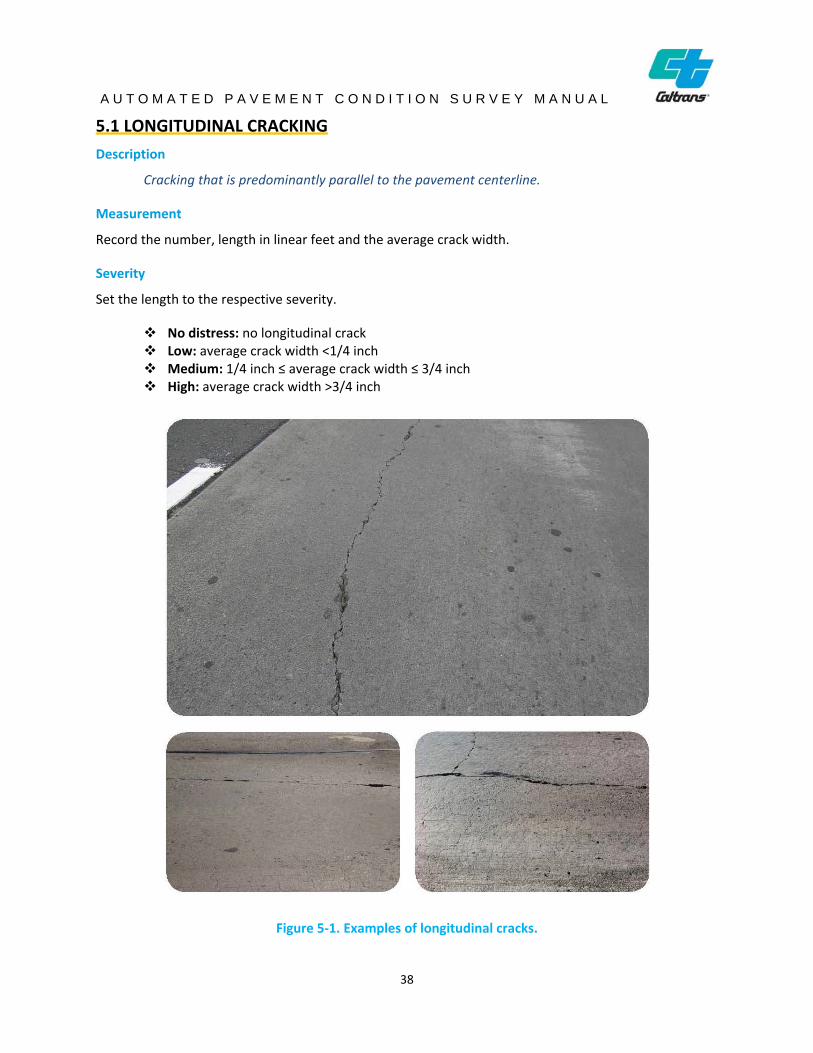
5.1 LONGITUDINAL CRACKING
Description
Cracking that is predominantly parallel to the pavement centerline.
Measurement
Record the number, length in linear feet and the average crack width.
Severity
Set the length to the respective severity.
No distress: no longitudinal crack Low: average crack width <1/4 inch Medium: 1/4 inch ≤ average crack width ≤ 3/4 inch High: average crack width >3/4 inch
Figure 5‐1. Examples of longitudinal cracks.
38

A U T O M A T E D P A V E M E N T C O N D I T I O N S U R V E Y M A N U A L
5.2 TRANSVERSE CRACKING
Description
Cracking that is predominantly perpendicular to the pavement centerline.
Measurement
Record the number of cracks and the average crack width.
Severity
Set the length of the element to the respective severity.
No distress: no transverse crack or transverse crack with an average crack width of 1/20 inch or less
Low: average crack width 1/20 inch‐1/4 inch Medium: 1/4 inch ≤ average crack width ≤ 3/4 inch High: average crack width >3/4 inch
Figure 5‐2. Examples of transverse cracks.
39
A U T O M A T E D P A V E M E N T C O N D I T I O N S U R V E Y M A N U A L
5.3 PUNCHOUTS
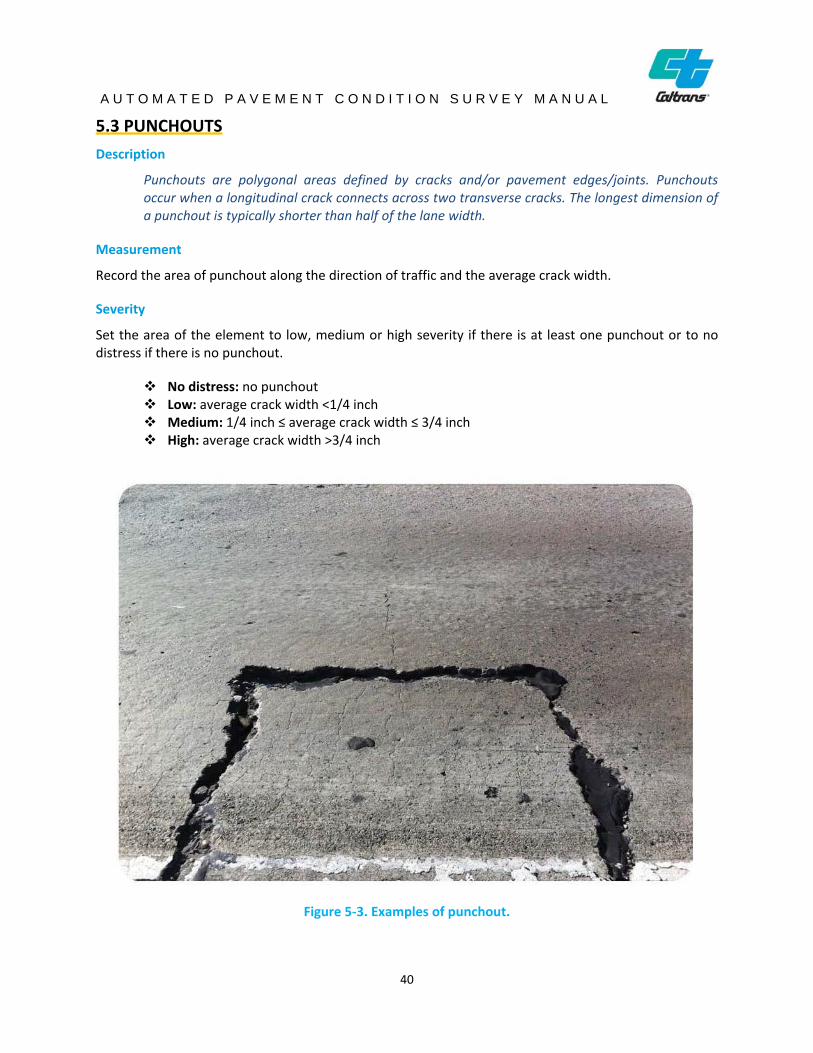
Description
Punchouts are polygonal areas defined by cracks and/or pavement edges/joints. Punchouts occur when a longitudinal crack connects across two transverse cracks. The longest dimension of a punchout is typically shorter than half of the lane width.
Measurement
Record the area of punchout along the direction of traffic and the average crack width.
Severity
Set the area of the element to low, medium or high severity if there is at least one punchout or to no distress if there is no punchout.
No distress: no punchout Low: average crack width <1/4 inch Medium: 1/4 inch ≤ average crack width ≤ 3/4 inch High: average crack width >3/4 inch
Figure 5‐3. Examples of punchout.
40

A U T O M A T E D P A V E M E N T C O N D I T I O N S U R V E Y M A N U A L
Notes:
41

A U T O M A T E D P A V E M E N T C O N D I T I O N S U R V E Y M A N U A L
Chapter 6 Sensor Data Reporting
42
A U T O M A T E D P A V E M E N T C O N D I T I O N S U R V E Y M A N U A L
6.1 INTERNATIONAL ROUGHNESS INDEX
Description
International Roughness Index (IRI) is calculated for all pavement surface types. The longitudinal pavement surface profiles in both wheel paths are measured following ASTM E950‐98 (2004) “Standard Test Method for Measuring the Longitudinal Profile of Traveled Surfaces with an Accelerometer Established Inertial Profiling Reference.” The IRI values are computed following ASTM E1926‐98 (2003) “Standard Practice for Computing International Roughness Index of Roads from Longitudinal Profile Measurements,” or using a Department approved/certified software package.
Measurement
The IRI values are reported for each wheel path in each DCE. IRI values less than 15 in/mile should be ignored and not entered in the calculation
Severity
Set the length of the element to the respective severity.
Do not record: IRI < 15 in/mile Low: 15≤IRI < 95 in/mile Medium: 95 in/mile ≤ IRI ≤ 170 in/mile High: IRI > 170 in/mile
6.2 MEAN PROFILE DEPTH
Description
Mean Profile Depth (MPD) is only calculated for the right wheel path on asphalt pavements, and can provide an indicator of surface raveling, texture, and bleeding. MPD is calculated following ASTM E1845‐01 (2005) “Standard Practice for Calculating Pavement Macrotexture Mean Profile Depth” for every 4 inches (100 mm) length of the wheel path. The MPD calculation is affected by wheel path cracking and potholes.
Measurement
MPD values calculated for each 4 inch (100 mm) long segment are averaged for each DCE, and the mean value is recorded for the DCE.
Severity
Set the length of the element to the respective severity.
Low: MPD < 0.02 inch Medium: 0.02 inch ≤ MPD ≤ 0.06 inch High: MPD > 0.06 inch
43
A U T O M A T E D P A V E M E N T C O N D I T I O N S U R V E Y M A N U A L
6.3 RUTTING
Description
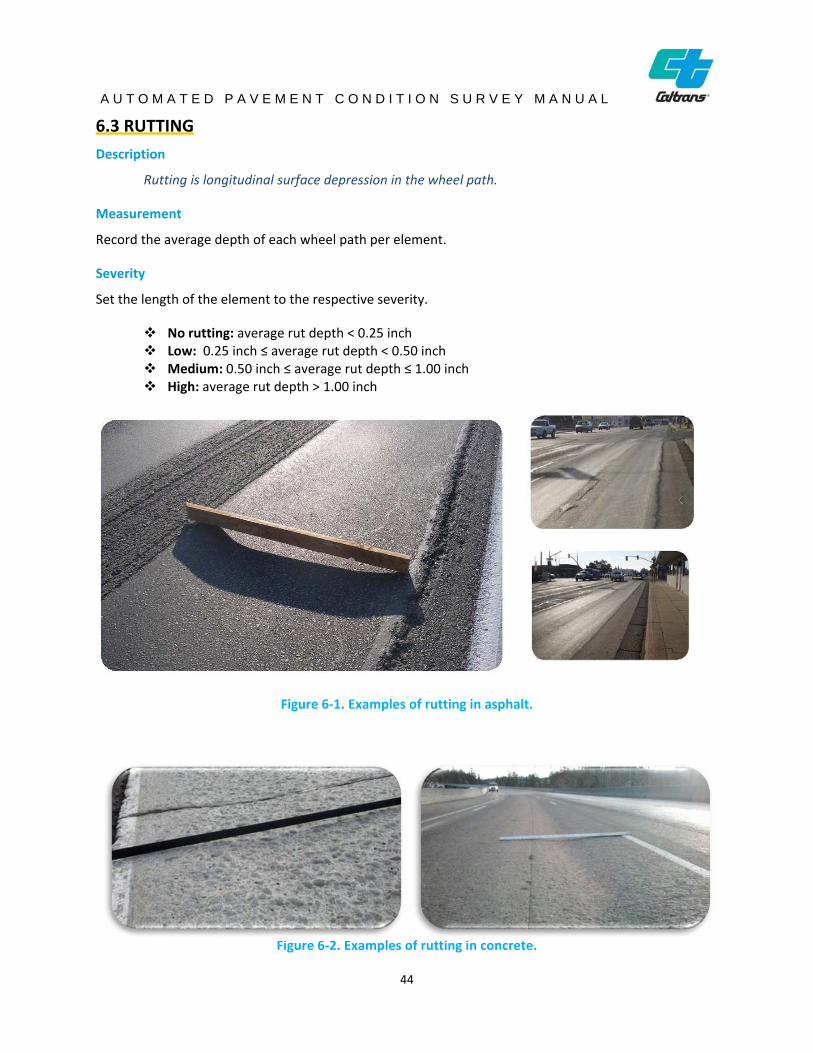
Rutting is longitudinal surface depression in the wheel path.
Measurement
Record the average depth of each wheel path per element.
Severity
Set the length of the element to the respective severity.
No rutting: average rut depth < 0.25 inch Low: 0.25 inch ≤ average rut depth < 0.50 inch Medium: 0.50 inch ≤ average rut depth ≤ 1.00 inch High: average rut depth > 1.00 inch
Figure 6‐1. Examples of rutting in asphalt.
Figure 6‐2. Examples of rutting in concrete.
44
A U T O M A T E D P A V E M E N T C O N D I T I O N S U R V E Y M A N U A L
6.4 FAULTING
Description
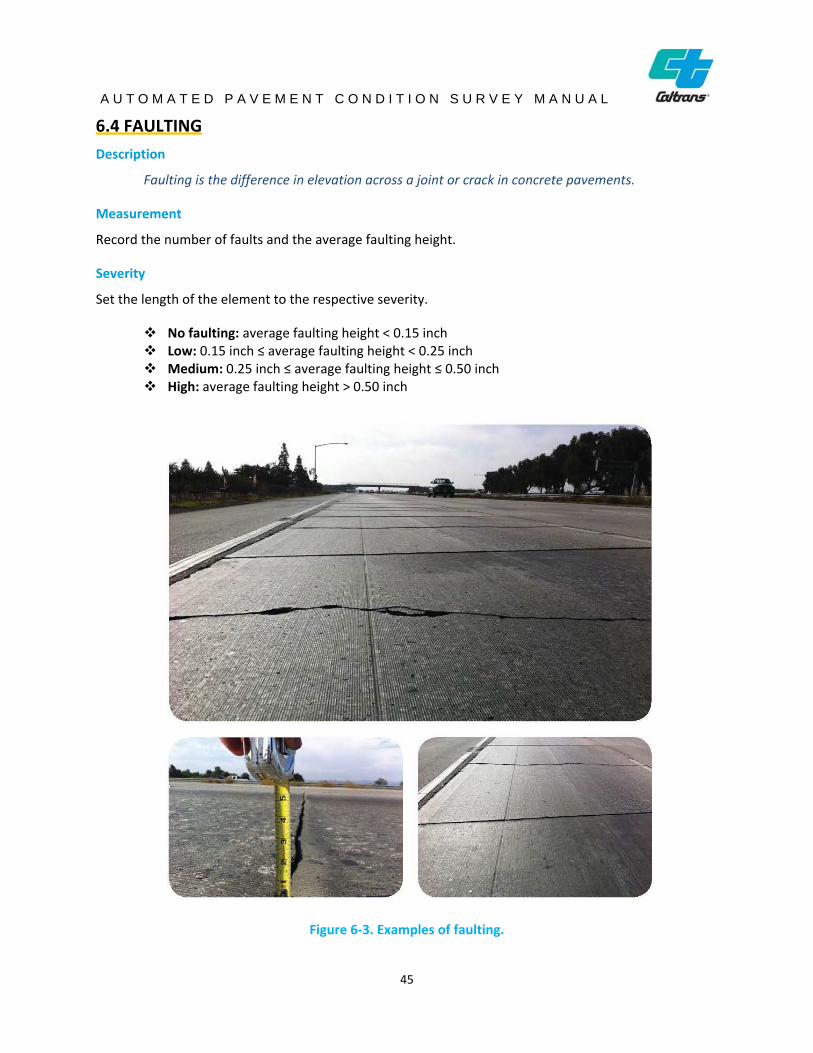
Faulting is the difference in elevation across a joint or crack in concrete pavements.
Measurement
Record the number of faults and the average faulting height.
Severity
Set the length of the element to the respective severity.
No faulting: average faulting height < 0.15 inch Low: 0.15 inch ≤ average faulting height < 0.25 inch Medium: 0.25 inch ≤ average faulting height ≤ 0.50 inch High: average faulting height > 0.50 inch
Figure 6‐3. Examples of faulting.
45
A U T O M A T E D P A V E M E N T C O N D I T I O N S U R V E Y M A N U A L
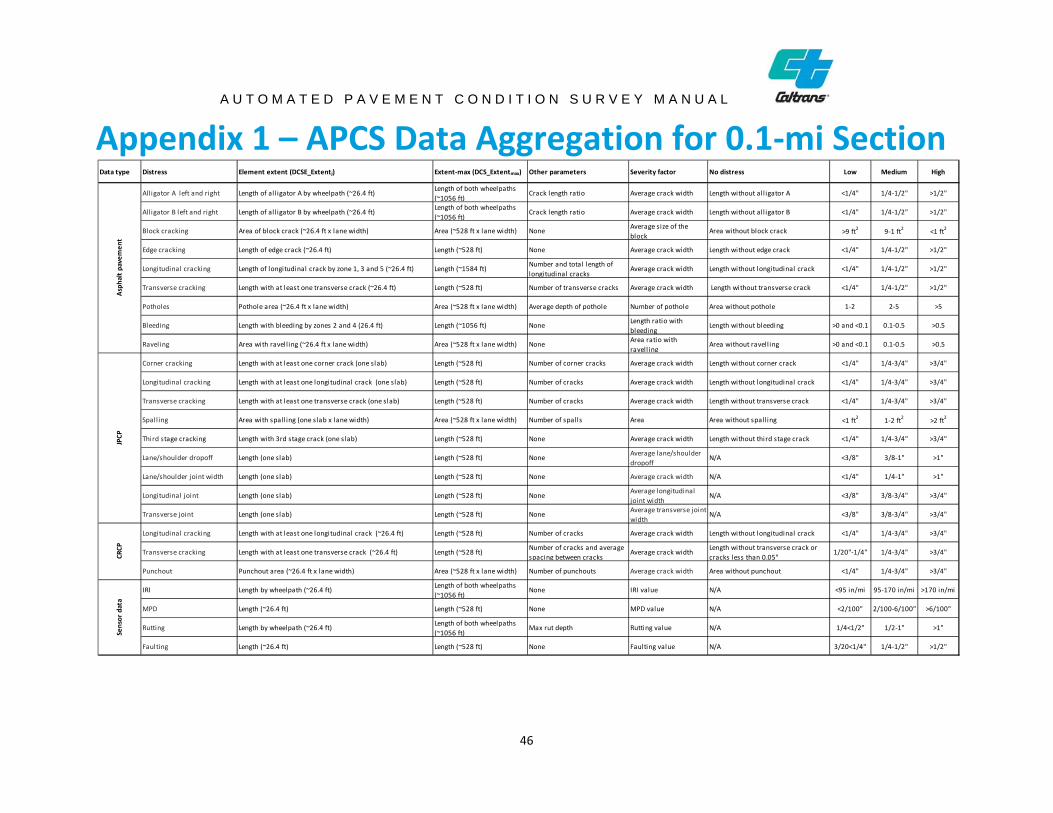
Appendix 1 – APCS Data Aggregation for 0.1‐mi Section Dat a t ype Dist ress Element extent (DCSE_Ext e nt j) Extent‐max (DCS_Extentmax) Other parameters Severity fact or N o distress Low Medium High
Asphalt pavement
Al l i ga tor A left and right Length of all igator A by wheel pa th (~26.4 ft) Length of both wheel pa ths (~1056 ft)
Crack length rati o Average cra ck wi dth Length wi thout all igator A <1/4" 1/4‐1/2" >1/2"
Al l i ga tor B left and ri ght Length of all igator B by wheel pa th (~26.4 ft) Length of both wheel pa ths (~1056 ft)
Crack length rati o Average cra ck wi dth Length wi thout all igator B <1/4" 1/4‐1/2" >1/2"
Bl ock cra cki ng Area of block crack (~26.4 ft x lane wi dth) Area (~528 ft x lane wi dth) None Avera ge size of the bl ock
Area wi thout block crack >9 ft2 9‐1 ft2
<1 ft2
Edge cra cki ng Length of edge crack (~26.4 ft) Length (~528 ft) None Average cra ck wi dth Length wi thout edge crack <1/4" 1/4‐1/2" >1/2"
Longitudinal cracki ng Length of l ongi tudi nal crack by zone 1, 3 and 5 (~26.4 ft) Length (~1584 ft) Number and tota l length of longitudinal cracks
Avera ge cra ck wi dth Length wi thout l ongi tudi nal crack <1/4" 1/4‐1/2" >1/2"
Transverse cracki ng Length wi th at least one transverse crack (~26.4 ft) Length (~528 ft) Number of transverse cracks Average cra ck wi dth Length wi thout transverse crack <1/4" 1/4‐1/2" >1/2"
Potholes Pothole area (~26.4 ft x lane wi dth) Area (~528 ft x lane wi dth) Average depth of pothol e Number of pothole Area wi thout pothol e 1‐2 2‐5 >5
Bl eedi ng Length wi th bl eedi ng by zones 2 and 4 (26.4 ft) Length (~1056 ft) None Length rati o wi th bl eeding
Length wi thout bl eedi ng >0 and <0.1 0.1‐0.5 >0.5
Raveling Area wi th ravell ing (~26.4 ft x lane wi dth) Area (~528 ft x lane wi dth) None Area ra ti o wi th ravell ing
Area wi thout ravell ing >0 and <0.1 0.1‐0.5 >0.5
JPCP
Corner cracki ng Length wi th at least one corner crack (one slab) Length (~528 ft) Number of corner cracks Average cra ck wi dth Length wi thout corner crack <1/4" 1/4‐3/4" >3/4"
Longitudinal cracki ng Length wi th at least one l ongi tudi nal crack (one slab) Length (~528 ft) Number of cracks Average cra ck wi dth Length wi thout l ongi tudi nal crack <1/4" 1/4‐3/4" >3/4"
Transverse cracki ng Length wi th at least one transverse crack (one slab) Length (~528 ft) Number of cracks Average cra ck wi dth Length wi thout transverse crack <1/4" 1/4‐3/4" >3/4"
Spall i ng Area wi th spall i ng (one slab x lane wi dth) Area (~528 ft x lane wi dth) Number of s pa l l s Area Area wi thout spal l ing <1 ft2 1‐2 ft2
>2 ft2
Thi rd s ta ge cracki ng Length wi th 3rd stage crack (one sl ab) Length (~528 ft) None Average cra ck wi dth Length wi thout thi rd stage crack <1/4" 1/4‐3/4" >3/4"
Lane/shoul der dropoff Length (one sl ab) Length (~528 ft) None Avera ge l ane/shoul der dropoff
N/A <3/8" 3/8‐1" >1"
Lane/shoul der joint wi dth Length (one sl ab) Length (~528 ft) None Avera ge cra ck wi dth N/A <1/4" 1/4‐1" >1"
Longitudinal joint Length (one sl ab) Length (~528 ft) None Avera ge longitudinal joi nt wi dth
N/A <3/8" 3/8‐3/4" >3/4"
Transverse joi nt Length (one sl ab) Length (~528 ft) None Avera ge transverse joint wi dth
N/A <3/8" 3/8‐3/4" >3/4"
CRCP
Longitudinal cracki ng Length wi th at least one l ongi tudi nal crack (~26.4 ft) Length (~528 ft) Number of cracks Average cra ck wi dth Length wi thout l ongi tudi nal crack <1/4" 1/4‐3/4" >3/4"
Transverse cracki ng Length wi th at least one transverse crack (~26.4 ft) Length (~528 ft) Number of cracks and avera ge spaci ng between cracks
Avera ge cra ck wi dth Length wi thout transverse crack or cracks less tha n 0.05"
1/20"‐1/4" 1/4‐3/4" >3/4"
Punchout Punchout area (~26.4 ft x lane width) Area (~528 ft x lane wi dth) Number of punchouts Avera ge cra ck wi dth Area wi thout punchout <1/4" 1/4‐3/4" >3/4"
Sensor data
IRI Length by wheel pa th (~26.4 ft) Length of both wheel pa ths (~1056 ft)
None IRI val ue N/A <95 in/mi 95‐170 in/mi >170 in/mi
MPD Length (~26.4 ft) Length (~528 ft) None MPD val ue N/A <2/100" 2/100‐6/100" >6/100"
Rutti ng Length by wheel pa th (~26.4 ft) Length of both wheel pa ths (~1056 ft)
Max rut depth Rutti ng value N/A 1/4<1/2" 1/2‐1" >1"
Faul ti ng Length (~26.4 ft) Length (~528 ft) None Faulting value N/A 3/20<1/4" 1/4‐1/2" >1/2"
46
A U T O M A T E D P A V E M E N T C O N D I T I O N S U R V E Y M A N U A L
Appendix 2 – Aggregation Example for 0.1‐mi Section Element Number
Alligator B Left Alligator B Ri ght
Value (ft) Ot her
parameters
Average crack width
(in)
Max extent (ft )
Length without
alligator B (ft )
Lengt h with alligat or B (ft )
<1/4" 1/4‐1/2" >1/2" Value (ft ) Othe r
parameters
Average crack width
(in)
Max extent (ft)
Length wit hout
alligat or B (ft)
Length with alligat or B (ft)
<1/4" 1/4‐1/2" >1/2"
1 13 CLR 0.25 26.4 13.4 13 13 10 CLR 0.15 26.4 16.4 10 10
2 15 CLR 0.75 26.4 11.4 15 15 15 CLR 0.15 26.4 11.4 15 15
3 10 CLR 0.80 26.4 16.4 10 10 5 CLR 0.25 26.4 21.4 5 5
4 0 CLR 26.4 26.4 0 0 3 CLR 0.15 26.4 23.4 3 3
5 10 CLR 0.50 26.4 16.4 10 10 9 CLR 0.50 26.4 17.4 9 9
6 11 CLR 0.50 26.4 15.4 11 11 5 CLR 0.60 26.4 21.4 5 5
7 0 CLR 26.4 26.4 0 0 10 CLR 0.80 26.4 16.4 10 10
8 0 CLR 26.4 26.4 0 0 0 CLR 26.4 26.4 0 0
9 0 CLR 26.4 26.4 0 0 0 CLR 26.4 26.4 0 0
10 20 CLR 0.40 26.4 6.4 20 20 2 CLR 0.15 26.4 24.4 2 2
11 5 CLR 0.30 26.4 21.4 5 5 5 CLR 0.90 26.4 21.4 5 5
12 2 CLR 0.10 26.4 24.4 2 2 1 CLR 0.50 26.4 25.4 1 1
13 10 CLR 0.20 26.4 16.4 10 10 6 CLR 0.60 26.4 20.4 6 6
14 15 CLR 0.60 26.4 11.4 15 15 20 CLR 0.10 26.4 6.4 20 20
15 10 CLR 0.70 26.4 16.4 10 10 15 CLR 0.70 26.4 11.4 15 15
16 5 CLR 0.10 26.4 21.4 5 5 18 CLR 0.50 26.4 8.4 18 18
17 2 CLR 0.40 26.4 24.4 2 2 9 CLR 0.40 26.4 17.4 9 9
18 1 CLR 0.50 26.4 25.4 1 1 5 CLR 0.25 26.4 21.4 5 5
19 2 CLR 0.10 26.4 24.4 2 2 2 CLR 0.50 26.4 24.4 2 2
20 1 CLR 0.10 26.4 25.4 1 1 1 CLR 0.10 26.4 25.4 1 1
Sum 132 528 396 132 20 62 50 141 528 387 141 51 49
Summary of Alligator B for One 0.1‐mile Section
Parameter Max
extent
Length without alligat or B
Lengt h with alligator B
<1/4" 1/4‐1/2" >1/2"
LW P Le ngth (ft) 528 396 132 20 62 50 RWP Le ngth (ft) 528 387 141 51 49 41 Total length (ft) 1056 783 273 71 111 91 Total percentage 100.0 74.1 25.9 6.7 10.5 8.6
47
41
C
A U T O M A T E D P A V E M E N T C O N D I T I O N S U R V E Y M A N U A L
Glossary A
Aggregate Base (AB): A granular, dense aggregate used as a base in a pavement structure.
Asphalt Pavement: Pavement that has a surface consisting of an asphalt‐bound layer, including but not limited to hot‐mix asphalt (HMA), rubberized HMA (RHMA), open‐graded mixes, chip seals, and other asphalt‐bound surface treatments. Asphalt pavement can be flexible, semi‐rigid and composite pavement structure.
Automated Pavement Condition Survey (APCS): A pavement condition survey that uses customized vehicles fitted with sensing equipment, traveling on the roadway at or near highway speeds, to quickly and efficiently measure and collect pavement condition data.
California Highway Log: A list of definitions of each of the signed routes in California, including interstate and US highways, state roads, and other roads listed in the state’s legislative code, and the linear reference system (LRS) of postmiles that define the length of the route and the locations of features on the route.
Cement‐Treated Base (CTB): A mixture of hydraulic cement and granular aggregate with a dense gradation used to provide a strong base layer within a pavement structure.
Cement‐Treated Permeable Base (CTPB): A mixture of hydraulic cement and granular aggregate with an open gradation used to provide a strong, highly permeable drainage layer within a pavement structure.
Chip Seal: A common pavement maintenance practice that extends pavement life and provides a skid‐resistant driving surface, consisting of a thin film of asphalt sprayed on an existing asphalt surface, followed by the placement of small aggregates (“chips”) that are embedded into the asphalt film by rollers.
Composite Pavement: A pavement composed of a hot‐mix asphalt (HMA) layer placed on concrete pavement (either jointed plain concrete pavement or continuously reinforced concrete pavement).
Continuously Reinforced Concrete Pavement (CRCP): A concrete pavement type that is made of concrete with continuous longitudinal steel reinforcement and no intermediate transverse expansion or contraction joints.
Corner Crack: A type of crack found in a jointed plain concrete pavement, which connects a longitudinal joint with a transverse joint.
D
Data Collection Segment (DCS): The aggregation of elements used in the pavement management system (PMS); it is typically 0.1‐mile section for which distresses and conditions are reported in the PMS database.
Distress Extent: A quantitative measure of the magnitude of a distress type and the degree to which it has spread.
48
A U T O M A T E D P A V E M E N T C O N D I T I O N S U R V E Y M A N U A L
Distress Severity: A quantitative or qualitative measure defining the stage of deterioration of a distress type.
F
Faulting: A form of distress in jointed plain concrete pavement slabs defined as the difference in elevation across a joint or crack.
G
Geo‐Referencing: The practice of establishing the spatial location of geographical features in terms of map projections or coordinate systems.
Global Positioning System (GPS): A space‐based global navigation satellite system that provides location and time information in all weather and at all times, anywhere on or near the Earth, where there is an unobstructed line of sight to four or more GPS satellites.
H
Hot Mix Asphalt (HMA): A mixture of asphalt and aggregates commonly used in construction projects such as road surfaces, airports, and parking lots. HMA consists of approximately 95 percent stone, sand, or gravel bound together in a mix by asphalt (the binder), laid down in layers and compacted.
I
International Roughness Index (IRI): The roughness index most commonly obtained from measured longitudinal road profiles. It is calculated using a mathematical model that simulates the vertical response of a quarter‐car vehicle, whose movement is accumulated relative to the distance traveled to yield a roughness index with units of slope (inches/mile, meter/kilometer, etc.).
J
Jointed Plain Concrete Pavement (JPCP): A concrete pavement type comprised of unreinforced concrete slabs that are separated by contraction joints. JPCP may include short smooth steel bars (dowel bars) to provide load transfer across the transverse joints and reinforcing steel (tie bars) may be used to tie slabs together across longitudinal joints.
L
Lane: A part of the roadway marked out for use typically by single line of vehicles.
Lean Concrete Base (LCB): A mixture of hydraulic cement and granular aggregate with a dense gradation and with more cement and greater strength and erosion resistance than CTB, used to provide a strong base layer within a pavement structure.
Linear Reference System (LRS): A reference system in which the locations of features are identified by a relative measure along a linear element, for example a postmile along a road. Each feature is located by either a point known as a “postmile” or a linear event know as a “segment.” The system is designed so that if a segment of a route is changed only those postmiles on the changed segment need to be updated.
49
A U T O M A T E D P A V E M E N T C O N D I T I O N S U R V E Y M A N U A L
Longitudinal Crack: A type of pavement crack that occurs approximately parallel to the pavement’s centerline or laydown direction.
Longitudinal Direction: The principal direction of traffic flow on a highway.
Longitudinal Joint: A joint parallel to the direction of travel. For asphalt pavement, a longitudinal joint is an interface between two adjacent passes of the paver while constructing. For concrete pavement, both JPCP and CRCP, a longitudinal joint is either sawn into the pavement, or is a cold joint between two passes of the paver. Longitudinal joints also exist between different pavement types placed in parallel, such as an asphalt pavement placed next to a concrete pavement, or JPCP and CRCP placed next to each other.
Low‐Speed Area: In the APCS, low‐speed areas are those locations where the data collection van could not continuously operate at speeds above 12.5 mph (20 km/hr), the minimum speed needed to obtain sensor data.
M
Mean Profile Depth (MPD): Pavement texture is defined as deviations of pavement surface from a planar surface, and it affects vehicle/tire interaction. Pavement texture is divided into microtexture, with wavelengths from 0 inches (0 mm) to 0.02 inches (0.5 mm); macrotexture, with wavelengths from 0.02 inches (0.5 mm) to 2 inches (50 mm); and megatexture, with wavelengths from 2 inches (50 mm) to 20 inches (500 mm). Mean Profile Depth (MPD) is a measure of pavement macrotexture that affects wet pavement friction, especially at high speeds, noise and vehicle fuel use.
Mixed Lane: There are two situations classified as mixed lanes: (1) where two surface material types coexist in the same data segment or (2) where one lane includes a longitudinal joint between JPCP slabs or strips of CRCP, or the two existing in the same lane separated by a longitudinal joint. These typically result from road widening, which leaves the lane partly on the originally constructed material and partly on the newly constructed material.
N
Network‐Level Pavement Management: A methodology for combining methods, procedures, data, software, policies, and decisions to produce solutions optimized for an entire pavement network, in this case the state highway network. The network‐level approach uses multiple aggregated data (e.g., traffic, safety, inventory, pavement condition) to identify optimal network strategies.
O
Open‐Graded Friction Course (OGFC): A type of hot‐mix asphalt or rubberized hot‐mix asphalt designed to be water permeable. The mix uses an open‐graded aggregate gradation. This type of mix is typically characterized by a high void content that generally results in improved overall skid resistance and reduced noise emissions.
P
Patch: A small area of pavement that has been replaced with new material to repair the existing pavement.
50
A U T O M A T E D P A V E M E N T C O N D I T I O N S U R V E Y M A N U A L
PaveM: The Department’s PMS software used for calculations, analysis and reporting using APCS and other Department data.
Pavement Reporting Segment (PRS): The pavement 1‐mile segment stored and reported in PaveM, consisting of a small number of contiguous data collection segments on the same route in the same lane.
Pavement Images: High‐definition pictures of the pavement surface taken by a specially equipped data collection van.
Pavement Management Segment (MS): The unit used by the PMS database and PaveM software for management purposes, such as network condition reporting, performance prediction, and prioritization and assignment of treatment.Regardless of the surface type, a pavement management segment consists of a number of contiguous data collection segments on the same route in the same lane or in adjacent lanes with similar pavement structure (materials and layer thicknesses), traffic, maintenance and rehabilitation history, and climate conditions.
Pavement Management System (PMS): A process designed for effective and efficient directing of the various activities involved in providing and sustaining pavements in a condition acceptable to the traveling public at the lowest life‐cycle cost.
Pavement Performance Model: A deterministic or probabilistic mathematical expression that is used to estimate objectively the future condition of pavements. Results obtained from the model can be used in formulating a management plan of action.
Pothole: A small, bowl‐shaped depression in a pavement surface that penetrates partially pr completely through the wearing course.
Punchout: A distress found in continuously reinforced concrete pavements, defined as a localized slab portion broken into several pieces.
R
Raveling: Loss of aggregate from a pavement surface, generally accelerated by traffic abrasion, binder aging, or segregation of the mix during construction.
Right‐of‐Way (ROW): A strip of land that is owned or granted through an easement or other mechanism for transportation purposes, such as for a trail, driveway, rail line, or highway. ROW generally extends beyond the roadway, and is often reserved for the purposes of maintenance or expansion of existing services.
Right‐of‐Way Pavement Image: A picture taken from a highway right‐of‐way that is used for collecting road inventory information such as signs, guardrails, etc.
Concrete Pavement: Pavement that has a surface consisting of concrete, typically Portland cement concrete, but can also include other types of hydraulic cement concrete. Concrete pavement may be either jointed plain concrete pavement (JPCP) or continuously reinforced concrete pavement (CRCP), and may have a number of different base and/or subbase types.
Rubberized Hot‐Mix Asphalt (RHMA): A hot‐mix asphalt concrete mixture with aggregates and rubberized asphalt binder, containing a minimum amount of crumb rubber modifier (CRM) from recycled tires.
51
A U T O M A T E D P A V E M E N T C O N D I T I O N S U R V E Y M A N U A L
Rutting: A type of pavement distress on asphalt surface pavement that occurs as a pavement surface depression in the wheel path. For asphalt pavements, there are two basic types of rutting: asphalt mix rutting and unbound layer rutting, depending on which layer in the pavement deforms to cause the wheel path depression. In the APCS the type of rutting is not distinguished.
S
Sealed Crack: A crack treated with sealant to minimize water entering through the pavement.
Semi‐Rigid Pavement Structure: A pavement where an asphalt surface material has been placed over hydraulic cement stabilized base layer, such as CTB, LCB or CTPB.
Shoulder Type: The type of surface on the portion of roadway contiguous with the traveled way that is used to accommodate vehicles stopping for emergencies, as well as for lateral support of the base and surface courses.
Slurry Seal: A cold‐mix paving system used to seal the pavement surface and restore some skid resistance. The principal materials used to create slurry seal are aggregate, asphalt emulsion, and fillers, which are mixed according to a laboratory’s mix design formula. Water is also added for workability.
Spalling: Cracking, breaking, or chipping of a joint or crack edge which occurs within about 2 ft (0.6 m) of the joint or crack edge.
T
Third Stage Cracking: The state of cracking in a jointed plain concrete slab where there is at least one longitudinal crack and one other crack classified as a transverse crack or at least two longitudinal cracks or at least two transverse cracks.
Transverse Crack: A type of pavement crack that occurs approximately perpendicular to the pavement’s centerline.
Transverse Direction: The direction perpendicular to the principal direction of traffic flow on a highway.
Transverse Joint: A joint perpendicular to the direction of travel. In JPCP, a transverse joint is typically sawn into the pavement, although for both JPCP and CRCP it may also be a cold joint where paving was stopped and then begun again. Transverse joints also exist between different pavement types placed in sequence, such as an asphalt pavement placed after a concrete pavement.
52

A U T O M A T E D P A V E M E N T C O N D I T I O N S U R V E Y M A N U A L
U
Unsealed Crack: A crack that has not been treated with sealant to minimize water entering through the pavement surface.
W
Wheel Path Crack: Crack in the wheel paths of an asphalt pavement caused by fatigue failure due to repeated traffic loading of asphalt surface or of a stabilized base and then reflected up through the HMA.
53