Embed Size (px)
Citation preview

May 11 2018
www.citihandlowy.plBank Handlowy w Warszawie S.A.
Bank Handlowy w Warszawie S.A.Consolidated financial results for 1Q 2018
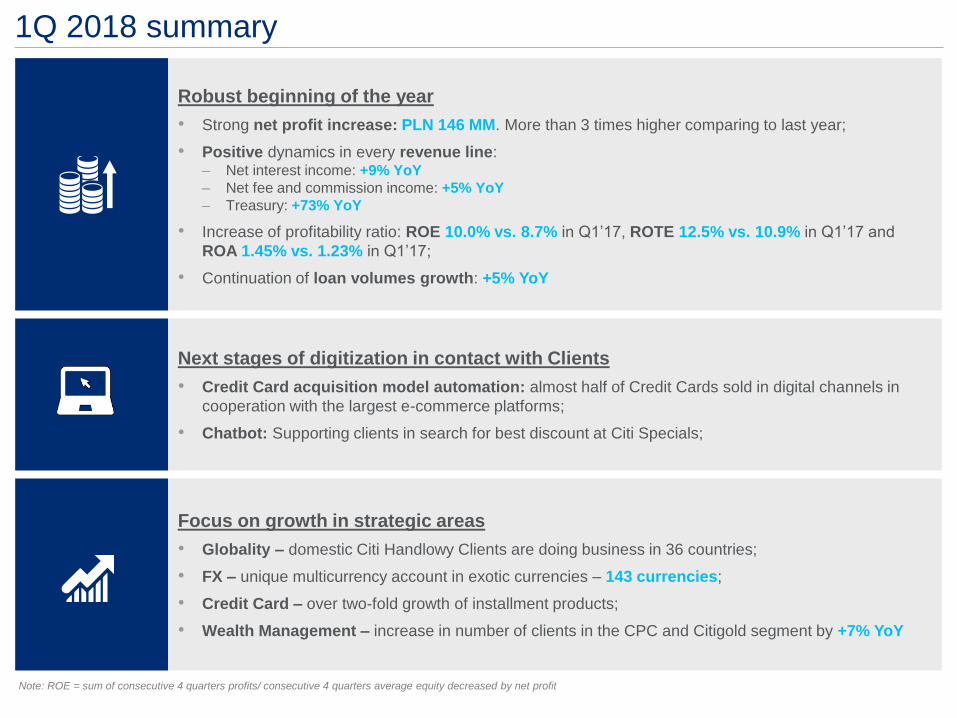
1Q 2018 summary
Robust beginning of the year
• Strong net profit increase: PLN 146 MM. More than 3 times higher comparing to last year;
• Positive dynamics in every revenue line:– Net interest income: +9% YoY
– Net fee and commission income: +5% YoY
– Treasury: +73% YoY
• Increase of profitability ratio: ROE 10.0% vs. 8.7% in Q1’17, ROTE 12.5% vs. 10.9% in Q1’17 and
ROA 1.45% vs. 1.23% in Q1’17;
• Continuation of loan volumes growth: +5% YoY
Next stages of digitization in contact with Clients
• Credit Card acquisition model automation: almost half of Credit Cards sold in digital channels in
cooperation with the largest e-commerce platforms;
• Chatbot: Supporting clients in search for best discount at Citi Specials;
Focus on growth in strategic areas
• Globality – domestic Citi Handlowy Clients are doing business in 36 countries;
• FX – unique multicurrency account in exotic currencies – 143 currencies;
• Credit Card – over two-fold growth of installment products;
• Wealth Management – increase in number of clients in the CPC and Citigold segment by +7% YoY
Note: ROE = sum of consecutive 4 quarters profits/ consecutive 4 quarters average equity decreased by net profit
3
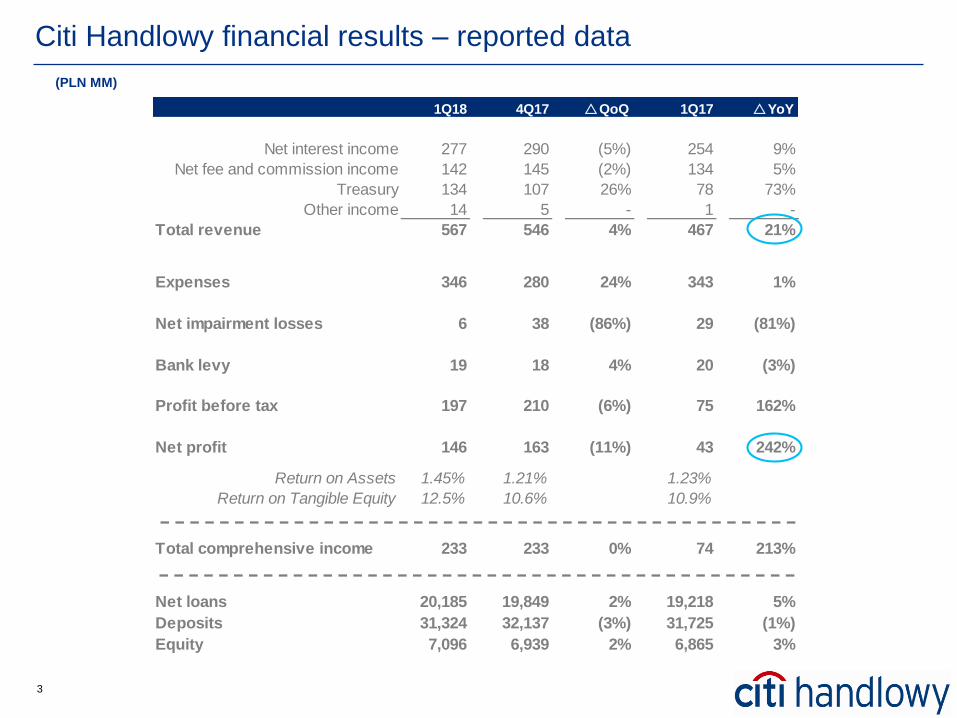
1Q18 4Q17 rQoQ 1Q17 rYoY
Net interest income 277 290 (5%) 254 9%
Net fee and commission income 142 145 (2%) 134 5%
Treasury 134 107 26% 78 73%
Other income 14 5 - 1 -
Total revenue 567 546 4% 467 21%
Expenses 346 280 24% 343 1%
Net impairment losses 6 38 (86%) 29 (81%)
Bank levy 19 18 4% 20 (3%)
Profit before tax 197 210 (6%) 75 162%
Net profit 146 163 (11%) 43 242%
Return on Assets 1.45% 1.21% 1.23%
Return on Tangible Equity 12.5% 10.6% 10.9%
Net loans 20,185 19,849 2% 19,218 5%
Deposits 31,324 32,137 (3%) 31,725 (1%)
Equity 7,096 6,939 2% 6,865 3%
Total comprehensive income 233 233 0% 74 213%
Citi Handlowy financial results – reported data
(PLN MM)

4
12,47314,125
11,138
8,7627,472
9,309
21,235 21,596 20,447
1Q17 4Q17 1Q18
12,751 13,052 13,425
1Q17 4Q17 1Q18
8,364 8,536 8,638
1,919 1,812 2,013
10,283 10,349 10,652
1Q17 4Q17 1Q18
2,702 2,736 2,679
2,328 2,535 2,524
1,3231,474 1,488
6,4106,797 6,760
1Q17 4Q17 1Q18
Client volumes
+5%
37%
25%
34%
38%
20%
38%
Corporate Clients
(+4% YoY)
Global Clients
(+24% YoY)
SME Clients
(+1% YoY)
Institutional clients loans – non banking sector
(excl. reverse repo)
Demand deposits
(-11% YoY)
Time deposits
(+6% YoY)
Institutional clients deposits – non banking sector
37%
24%
36%
-4%
Individual clients loans
+5%
Mortgage loans
+12% YoY
Credit cards
+8% YoY
Cash loans
-1% YoY
Individual clients deposits
Time deposits
(+5% YoY)
Demand deposits
(incl. saving accounts)
(+3% YoY)
+4%
Other
Loans/
Deposits
65%
310 344 342
157203 225
467
546 567
1Q17 4Q17 1Q18
Customer business Treasury & other
Revenue and net income
Revenue (PLN MM)
Key ratiosNet income (PLN MM)
Tier 1
NPL
17.3%
3.2%
ROA 1)
ROTE 3)
145 bps
1) ROA = 4 consecutive quarters net income sum /4 consecutive quarters average assets volume;
2) ROE = 4 consecutive quarters net income sum / 4 consecutive quarters equity volume;
3) ROTE = 4 consecutive quarters net income sum / 4 consecutive quarters equity volume decreased by net profit
and goodwill;
+21%
+242%
• Customer revenue growth +10% YoY;
• Main engine of core revenue growth is net interest
income.
• Treasury result +33% YoY confirming leading
position on treasury securities market.
ROE 2)
0 p.p.
+0.3 p.p
1.6 p.p.
+22 bps
+1.3 p.p.
Q1’18 YoY
12.5%
10.0%
2.56%
2.47%
2.58%
2.66%
2.89%
2.76%
4Q16 1Q17 2Q17 3Q17 4Q17 1Q18
NIM on interest bearing assets (annualized)
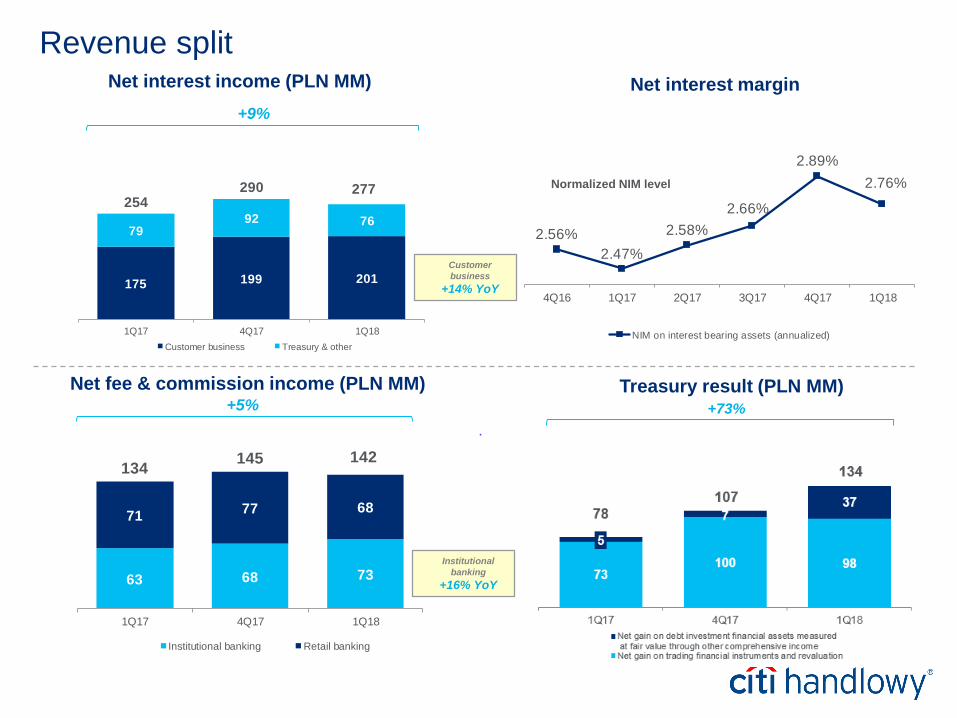
63 68 73
7177 68
134145 142
1Q17 4Q17 1Q18
Institutional banking Retail banking
175 199 201
7992 76
254290 277
1Q17 4Q17 1Q18
Customer business Treasury & other
+73%
Revenue splitNet interest margin
Net fee & commission income (PLN MM)
Net interest income (PLN MM)
Treasury result (PLN MM)+5%
+9%
Normalized NIM level
Customer
business
+14% YoY
Institutional
banking
+16% YoY
7
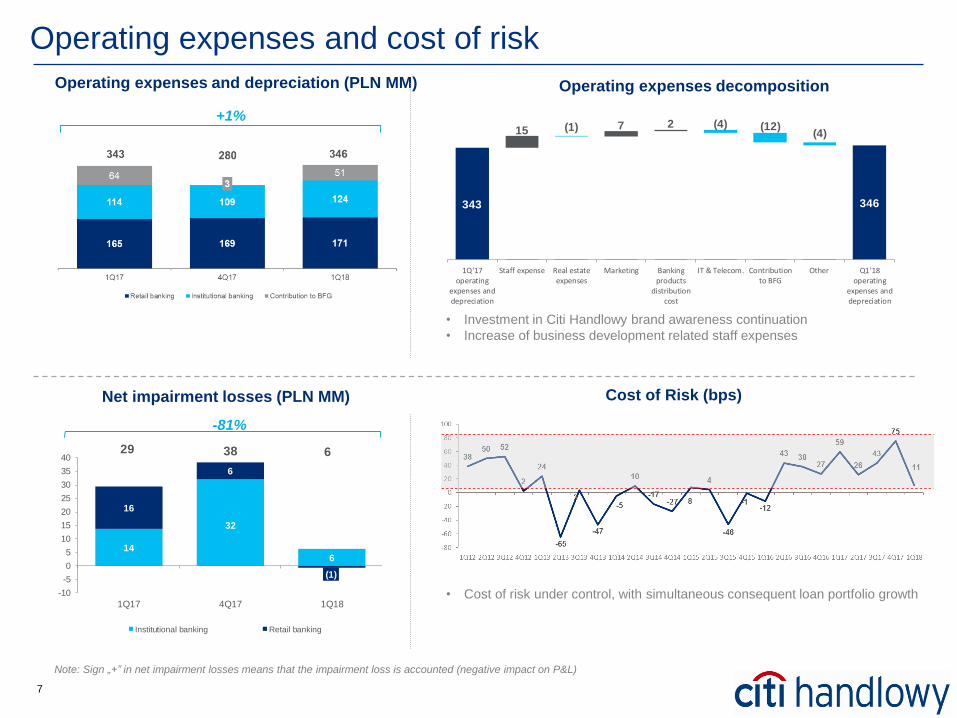
343 346
(1) (4) (12)(4)15 7 2
1Q'17operating
expenses anddepreciation
Staff expense Real estateexpenses
Marketing Bankingproducts
distributioncost
IT & Telecom. Contributionto BFG
Other Q1'18operating
expenses anddepreciation
+1%
Net impairment losses (PLN MM)
Operating expenses and cost of risk
Operating expenses and depreciation (PLN MM)
Cost of Risk (bps)
Operating expenses decomposition
• Cost of risk under control, with simultaneous consequent loan portfolio growth
• Investment in Citi Handlowy brand awareness continuation
• Increase of business development related staff expenses
-81%
Note: Sign „+” in net impairment losses means that the impairment loss is accounted (negative impact on P&L)
14
32
6
16
6
(1)
29 38 6
-10
-5
0
5
10
15
20
25
30
35
40
1Q17 4Q17 1Q18
Institutional banking Retail banking
9
14
19
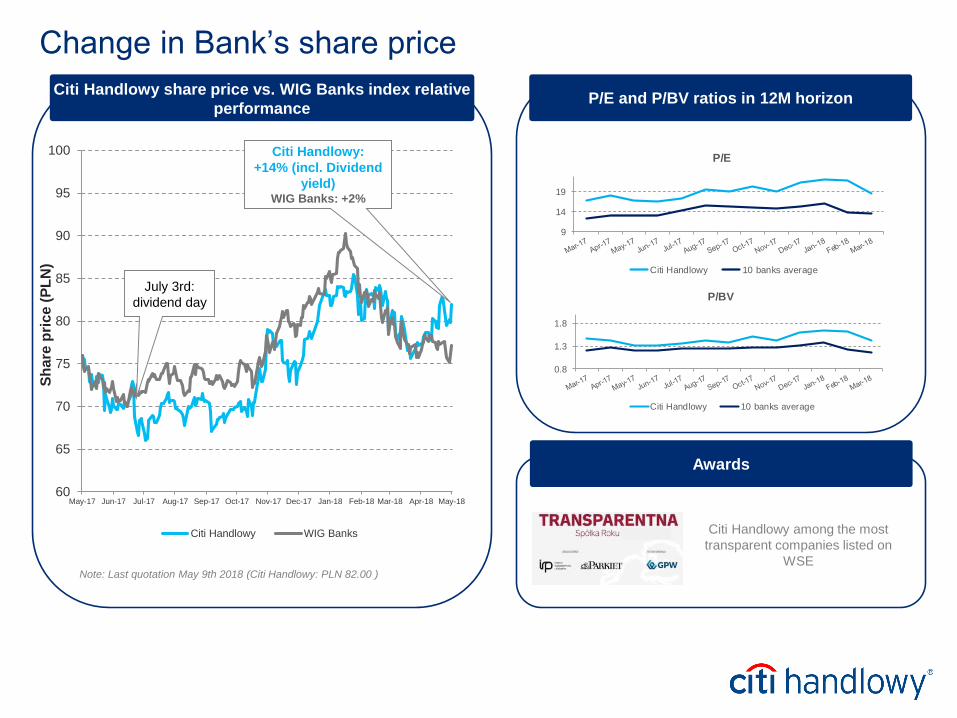
P/E
Citi Handlowy 10 banks average
0.8
1.3
1.8
P/BV
Citi Handlowy 10 banks average
Citi Handlowy share price vs. WIG Banks index relative
performance
Change in Bank’s share price
60
65
70
75
80
85
90
95
100
May-17 Jun-17 Jul-17 Aug-17 Sep-17 Oct-17 Nov-17 Dec-17 Jan-18 Feb-18 Mar-18 Apr-18 May-18
Sh
are
pri
ce (
PL
N)
Citi Handlowy WIG Banks
Citi Handlowy:
+14% (incl. Dividend
yield)WIG Banks: +2%
Note: Last quotation May 9th 2018 (Citi Handlowy: PLN 82.00 )
July 3rd:
dividend day
P/E and P/BV ratios in 12M horizon
Awards
Citi Handlowy among the most
transparent companies listed on
WSE

Citi and Citi Handlowy are registered trademarks of Citigroup Inc.. used under license. Citigroup Inc. and its subsidiaries are also entitled to rights to certain other trademarks contained
herein. Bank Handlowy w Warszawie S.A. with its registered office in Warsaw at ul. Senatorska 16. 00-923 Warszawa. entered in the Register of Entrepreneurs of the National Court
Register by the District Court for the capital city of Warsaw in Warsaw. 12th Commercial Department of the National Court Register. under KRS No. 000 000 1538. NIP 526-030-02-91; the
share capital is PLN 522.638.400. fully paid-up.

Appendix
10
11
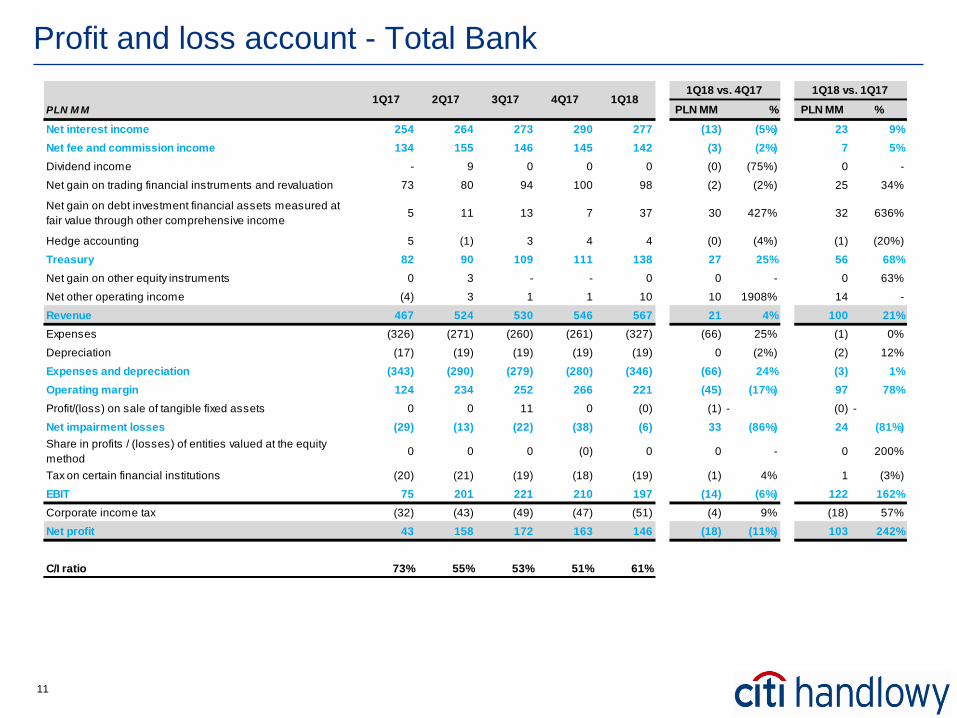
Profit and loss account - Total Bank
PLN M M PLN MM % PLN MM %
Net interest income 254 264 273 290 277 (13) (5%) 23 9%
Net fee and commission income 134 155 146 145 142 (3) (2%) 7 5%
Dividend income - 9 0 0 0 (0) (75%) 0 -
Net gain on trading financial instruments and revaluation 73 80 94 100 98 (2) (2%) 25 34%
Net gain on debt investment financial assets measured at
fair value through other comprehensive income 5 11 13 7 37 30 427% 32 636%
Hedge accounting 5 (1) 3 4 4 (0) (4%) (1) (20%)
Treasury 82 90 109 111 138 27 25% 56 68%
Net gain on other equity instruments 0 3 - - 0 0 - 0 63%
Net other operating income (4) 3 1 1 10 10 1908% 14 -
Revenue 467 524 530 546 567 21 4% 100 21%
Expenses (326) (271) (260) (261) (327) (66) 25% (1) 0%
Depreciation (17) (19) (19) (19) (19) 0 (2%) (2) 12%
Expenses and depreciation (343) (290) (279) (280) (346) (66) 24% (3) 1%
Operating margin 124 234 252 266 221 (45) (17%) 97 78%
Profit/(loss) on sale of tangible fixed assets 0 0 11 0 (0) (1) - (0) -
Net impairment losses (29) (13) (22) (38) (6) 33 (86%) 24 (81%)
Share in profits / (losses) of entities valued at the equity
method 0 0 0 (0) 0 0 - 0 200%
Tax on certain financial institutions (20) (21) (19) (18) (19) (1) 4% 1 (3%)
EBIT 75 201 221 210 197 (14) (6%) 122 162%
Corporate income tax (32) (43) (49) (47) (51) (4) 9% (18) 57%
Net profit 43 158 172 163 146 (18) (11%) 103 242%
C/I ratio 73% 55% 53% 51% 61%
1Q181Q17 2Q17 3Q17 4Q171Q18 vs. 4Q17 1Q18 vs. 1Q17
12
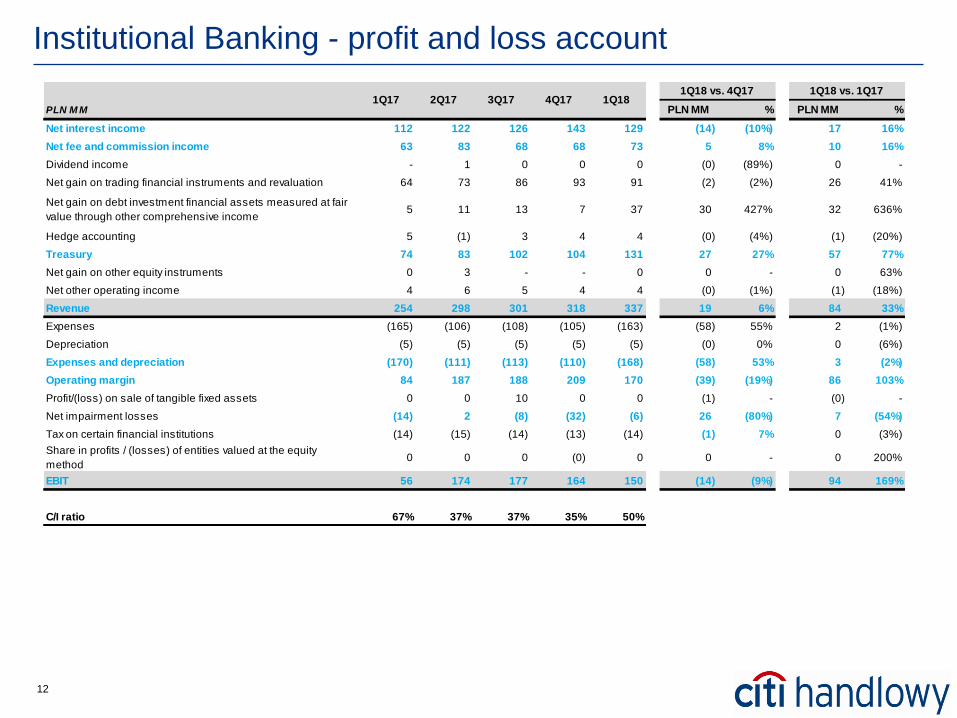
Institutional Banking - profit and loss account
PLN M M PLN MM % PLN MM %
Net interest income 112 122 126 143 129 (14) (10%) 17 16%
Net fee and commission income 63 83 68 68 73 5 8% 10 16%
Dividend income - 1 0 0 0 (0) (89%) 0 -
Net gain on trading financial instruments and revaluation 64 73 86 93 91 (2) (2%) 26 41%
Net gain on debt investment financial assets measured at fair
value through other comprehensive income 5 11 13 7 37 30 427% 32 636%
Hedge accounting 5 (1) 3 4 4 (0) (4%) (1) (20%)
Treasury 74 83 102 104 131 27 27% 57 77%
Net gain on other equity instruments 0 3 - - 0 0 - 0 63%
Net other operating income 4 6 5 4 4 (0) (1%) (1) (18%)
Revenue 254 298 301 318 337 19 6% 84 33%
Expenses (165) (106) (108) (105) (163) (58) 55% 2 (1%)
Depreciation (5) (5) (5) (5) (5) (0) 0% 0 (6%)
Expenses and depreciation (170) (111) (113) (110) (168) (58) 53% 3 (2%)
Operating margin 84 187 188 209 170 (39) (19%) 86 103%
Profit/(loss) on sale of tangible fixed assets 0 0 10 0 0 (1) - (0) -
Net impairment losses (14) 2 (8) (32) (6) 26 (80%) 7 (54%)
Tax on certain financial institutions (14) (15) (14) (13) (14) (1) 7% 0 (3%)
Share in profits / (losses) of entities valued at the equity
method 0 0 0 (0) 0 0 - 0 200%
EBIT 56 174 177 164 150 (14) (9%) 94 169%
C/I ratio 67% 37% 37% 35% 50%
1Q18 vs. 4Q171Q17 3Q172Q17 4Q17 1Q18
1Q18 vs. 1Q17
13
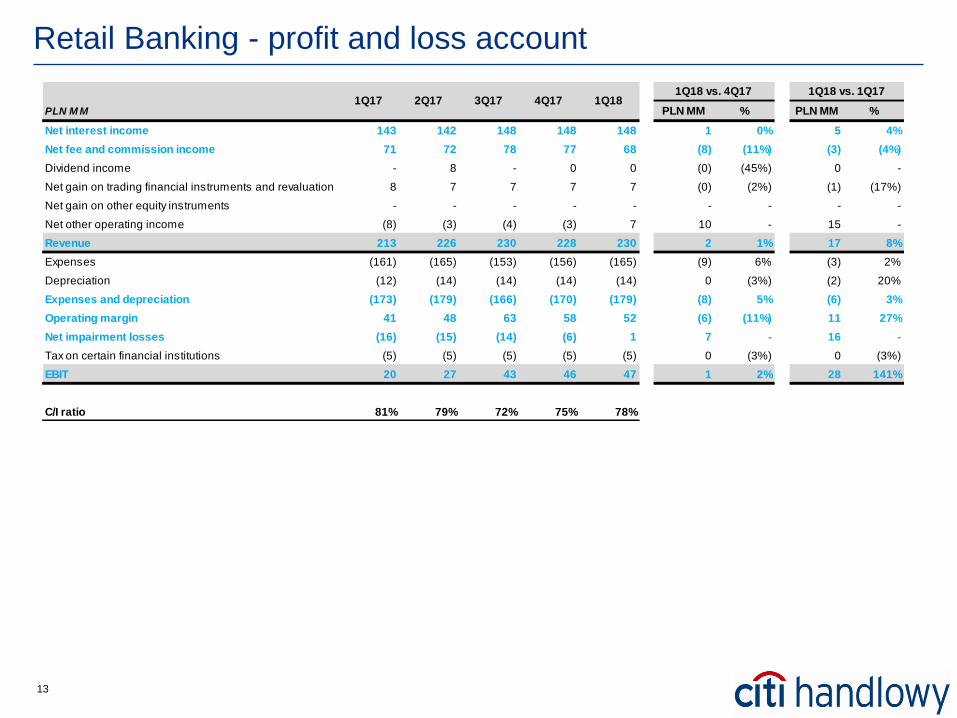
Retail Banking - profit and loss account
PLN M M PLN MM % PLN MM %
Net interest income 143 142 148 148 148 1 0% 5 4%
Net fee and commission income 71 72 78 77 68 (8) (11%) (3) (4%)
Dividend income - 8 - 0 0 (0) (45%) 0 -
Net gain on trading financial instruments and revaluation 8 7 7 7 7 (0) (2%) (1) (17%)
Net gain on other equity instruments - - - - - - - - -
Net other operating income (8) (3) (4) (3) 7 10 - 15 -
Revenue 213 226 230 228 230 2 1% 17 8%
Expenses (161) (165) (153) (156) (165) (9) 6% (3) 2%
Depreciation (12) (14) (14) (14) (14) 0 (3%) (2) 20%
Expenses and depreciation (173) (179) (166) (170) (179) (8) 5% (6) 3%
Operating margin 41 48 63 58 52 (6) (11%) 11 27%
Net impairment losses (16) (15) (14) (6) 1 7 - 16 -
Tax on certain financial institutions (5) (5) (5) (5) (5) 0 (3%) 0 (3%)
EBIT 20 27 43 46 47 1 2% 28 141%
C/I ratio 81% 79% 72% 75% 78%
1Q17 2Q17 3Q17 4Q17 1Q181Q18 vs. 1Q171Q18 vs. 4Q17
14
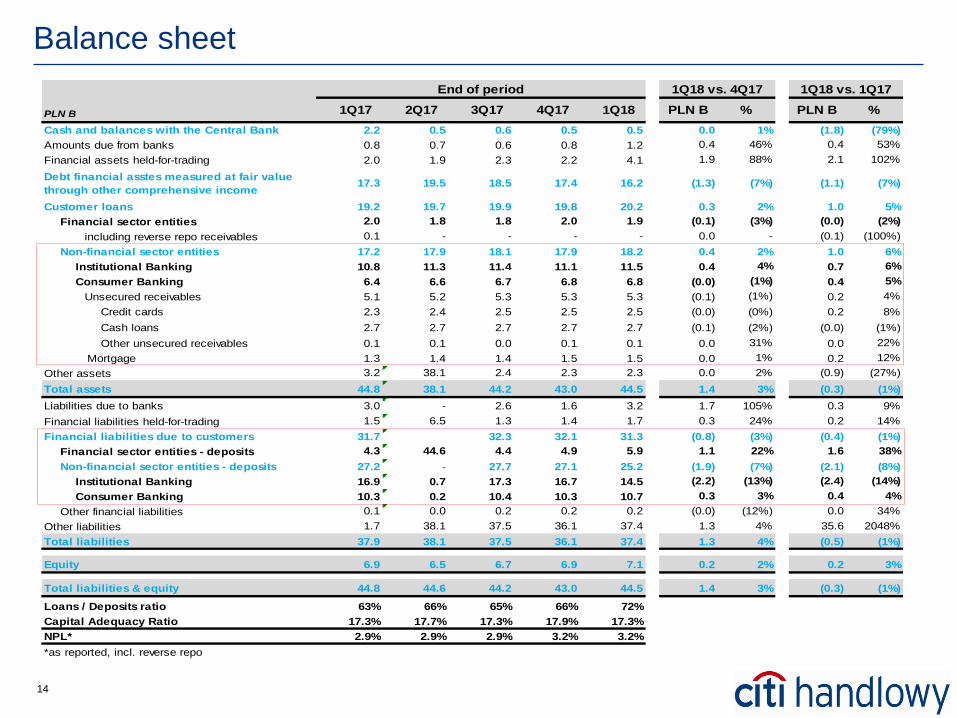
Cash and balances with the Central Bank 2.2 0.5 0.6 0.5 0.5 0.0 1% (1.8) (79%)
Amounts due from banks 0.8 0.7 0.6 0.8 1.2 0.4 46% 0.4 53%
Financial assets held-for-trading 2.0 1.9 2.3 2.2 4.1 1.9 88% 2.1 102%
Debt financial asstes measured at fair value
through other comprehensive income 17.3 19.5 18.5 17.4 16.2 (1.3) (7%) (1.1) (7%)
Customer loans 19.2 19.7 19.9 19.8 20.2 0.3 2% 1.0 5%
Financial sector entities 2.0 1.8 1.8 2.0 1.9 (0.1) (3%) (0.0) (2%)
including reverse repo receivables 0.1 - - - - 0.0 - (0.1) (100%)
Non-financial sector entities 17.2 17.9 18.1 17.9 18.2 0.4 2% 1.0 6%
Institutional Banking 10.8 11.3 11.4 11.1 11.5 0.4 4% 0.7 6%
Consumer Banking 6.4 6.6 6.7 6.8 6.8 (0.0) (1%) 0.4 5%
Unsecured receivables 5.1 5.2 5.3 5.3 5.3 (0.1) (1%) 0.2 4%
Credit cards 2.3 2.4 2.5 2.5 2.5 (0.0) (0%) 0.2 8%
Cash loans 2.7 2.7 2.7 2.7 2.7 (0.1) (2%) (0.0) (1%)
Other unsecured receivables 0.1 0.1 0.0 0.1 0.1 0.0 31% 0.0 22%
Mortgage 1.3 1.4 1.4 1.5 1.5 0.0 1% 0.2 12%
Other assets 3.2 38.1 2.4 2.3 2.3 0.0 2% (0.9) (27%)
Total assets 44.8 38.1 44.2 43.0 44.5 1.4 3% (0.3) (1%)
Liabilities due to banks 3.0 - 2.6 1.6 3.2 1.7 105% 0.3 9%
Financial liabilities held-for-trading 1.5 6.5 1.3 1.4 1.7 0.3 24% 0.2 14%
Financial liabilities due to customers 31.7 32.3 32.1 31.3 (0.8) (3%) (0.4) (1%)
Financial sector entities - deposits 4.3 44.6 4.4 4.9 5.9 1.1 22% 1.6 38%
Non-financial sector entities - deposits 27.2 - 27.7 27.1 25.2 (1.9) (7%) (2.1) (8%)
Institutional Banking 16.9 0.7 17.3 16.7 14.5 (2.2) (13%) (2.4) (14%)
Consumer Banking 10.3 0.2 10.4 10.3 10.7 0.3 3% 0.4 4%
Other financial liabilities 0.1 0.0 0.2 0.2 0.2 (0.0) (12%) 0.0 34%
Other liabilities 1.7 38.1 37.5 36.1 37.4 1.3 4% 35.6 2048%
Total liabilities 37.9 38.1 37.5 36.1 37.4 1.3 4% (0.5) (1%)
Equity 6.9 6.5 6.7 6.9 7.1 0.2 2% 0.2 3%
Total liabilities & equity 44.8 44.6 44.2 43.0 44.5 1.4 3% (0.3) (1%)
Loans / Deposits ratio 63% 66% 65% 66% 72%
Capital Adequacy Ratio 17.3% 17.7% 17.3% 17.9% 17.3%
NPL* 2.9% 2.9% 2.9% 3.2% 3.2%
*as reported, incl. reverse repo
1Q18 vs. 4Q17
PLN B %1Q17 3Q172Q17
1Q18 vs. 1Q17
PLN B %
End of period
PLN B 1Q184Q17
Balance sheet