Embed Size (px)
Citation preview
รศ.ดร.นพ. สมพงษ ศรีแสนปาง M.D., Ph.D. http://home.kku.ac.th/sompong1
STATISTICSBASIC CONCEPTS
DESCRIPTIVE STATISTICSINFERENTIAL STATISTICS
รศ.ดร.นพ. สมพงษ ศรีแสนปาง M.D., Ph.D.http://home.kku.ac.th/sompong
รศ.ดร.นพ. สมพงษ ศรีแสนปาง M.D., Ph.D. http://home.kku.ac.th/sompong2
ความเดิม จากตอนที่แลว• Scales of measurement• Distribution, Central tendency• Variability, Probability• Prevalence, Incidence• Disease outcomes
– Fatality rates• Confidence intervals• Association
– Pearson chi-square, Fisher’s exact test– 4 คําถามกับ P-value
รศ.ดร.นพ. สมพงษ ศรีแสนปาง M.D., Ph.D. http://home.kku.ac.th/sompong3
งานวจิัย• ระดับความสุขและปจจัยที่เกี่ยวของ
ของนักเรียนมัธยมศึกษาตอนปลาย โรงเรียนขอนแกนวิทยายน
• วรรัตน กัจฉมาภรณ และคณะ (2550)
• นักศึกษาแพทยชั้นปที ่5 กองเวชศาสตรชุมชน คณะแพทย
ม.ขอนแกน
• SMJ 2550; 22: 254-60.
รศ.ดร.นพ. สมพงษ ศรีแสนปาง M.D., Ph.D. http://home.kku.ac.th/sompong4
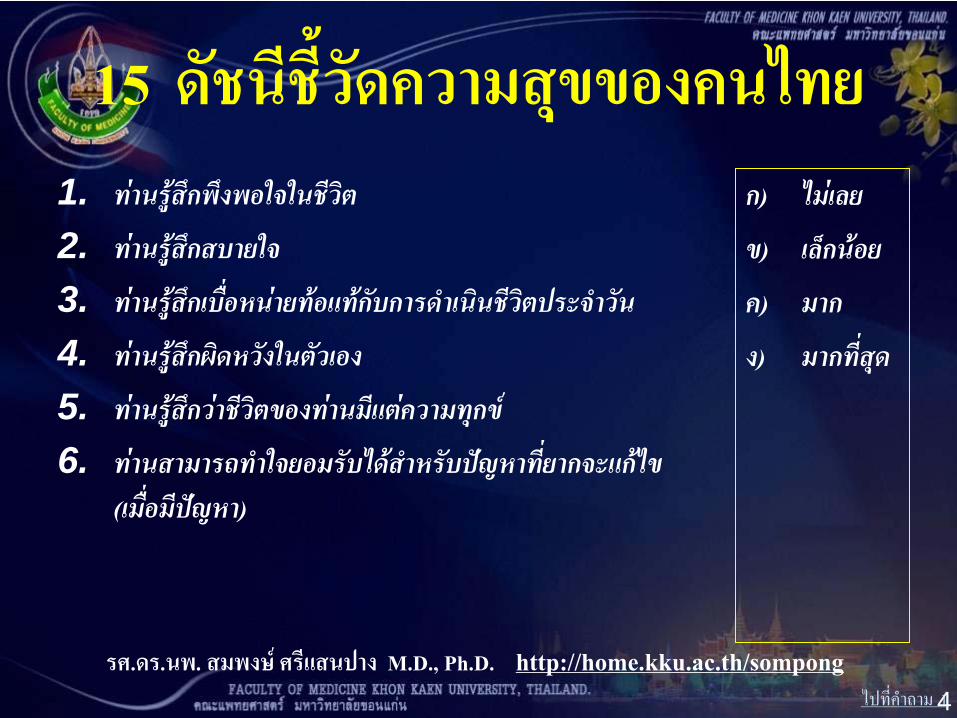
15 ดัชนีชี้วัดความสุขของคนไทย1. ทานรูสึกพึงพอใจในชีวิต 2. ทานรูสึกสบายใจ 3. ทานรูสึกเบื่อหนายทอแทกับการดําเนินชีวิตประจําวัน 4. ทานรูสึกผิดหวังในตัวเอง 5. ทานรูสึกวาชีวิตของทานมีแตความทกุข
6. ทานสามารถทาํใจยอมรับไดสําหรับปญหาที่ยากจะแกไข (เมื่อมปีญหา)
ก
)
ไมเลย
ข
)
เล็กนอย
ค
)
มาก
ง
)
มากที่สดุ
ไปที่คําถาม 1
รศ.ดร.นพ. สมพงษ ศรีแสนปาง M.D., Ph.D. http://home.kku.ac.th/sompong5
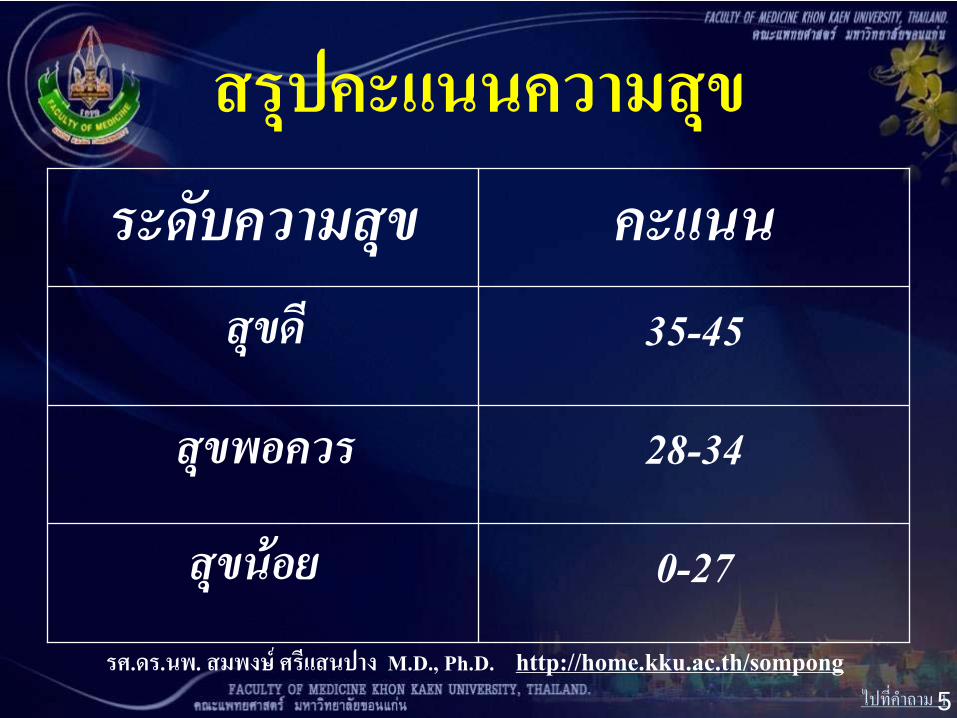
สรุปคะแนนความสุข
ระดับความสุข คะแนน
35-45
28-34
0-27
ไปที่คําถาม 1
สุขดี
สุขพอควร
สุขนอย
รศ.ดร.นพ. สมพงษ ศรีแสนปาง M.D., Ph.D. http://home.kku.ac.th/sompong6
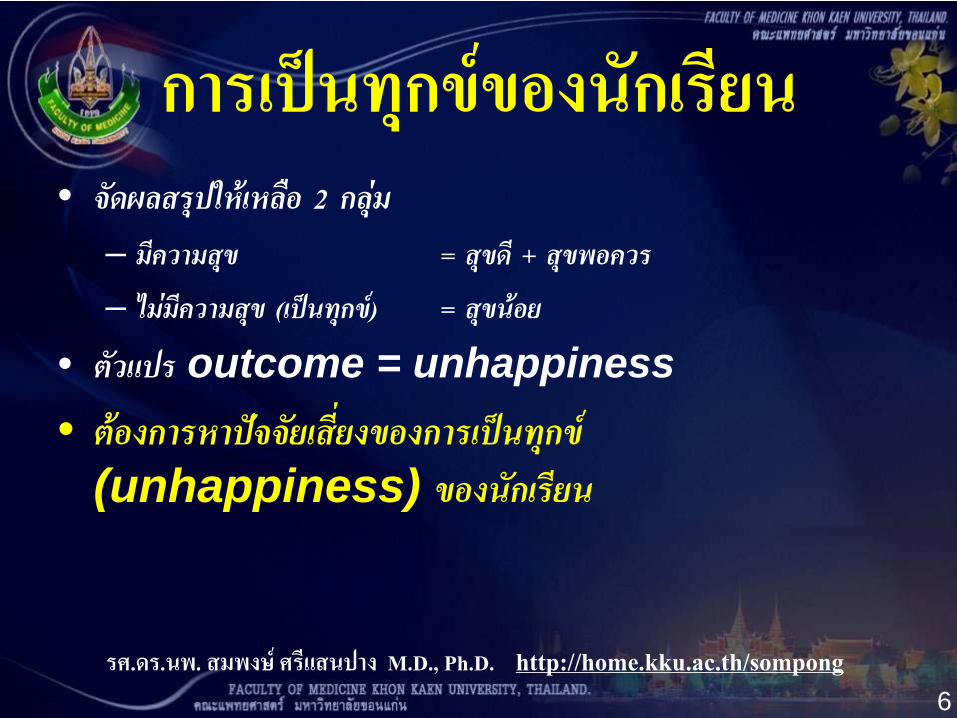
การเปนทุกขของนักเรยีน• จัดผลสรุปใหเหลือ 2 กลุม
– มีความสุข = สุขดี + สุขพอควร– ไมมีความสุข (เปนทุกข) = สุขนอย
• ตัวแปร outcome = unhappiness • ตองการหาปจจัยเสี่ยงของการเปนทุกข
(unhappiness) ของนักเรียน
รศ.ดร.นพ. สมพงษ ศรีแสนปาง M.D., Ph.D. http://home.kku.ac.th/sompong7
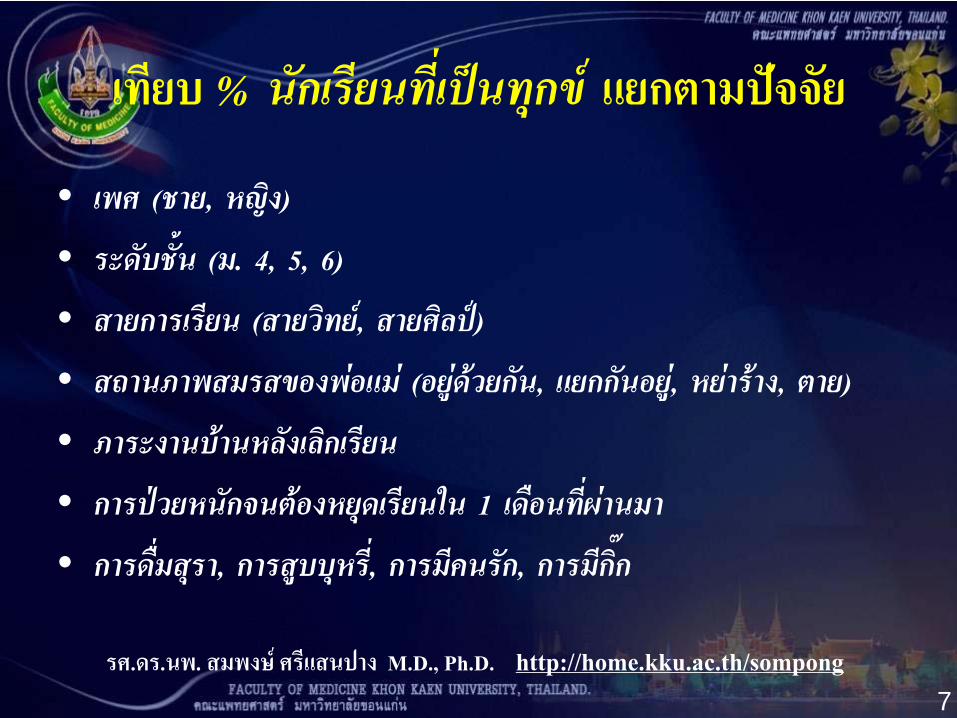
เทียบ % นักเรียนที่เปนทุกข แยกตามปจจัย• เพศ (ชาย, หญิง)
• ระดับชั้น (ม. 4, 5, 6)
• สายการเรียน (สายวิทย, สายศิลป)• สถานภาพสมรสของพอแม (อยูดวยกัน, แยกกันอยู, หยาราง, ตาย)
• ภาระงานบานหลังเลิกเรียน• การปวยหนักจนตองหยุดเรียนใน 1 เดือนที่ผานมา• การดื่มสุรา, การสูบบุหรี่, การมีคนรัก, การมีกิ๊ก
รศ.ดร.นพ. สมพงษ ศรีแสนปาง M.D., Ph.D. http://home.kku.ac.th/sompong8
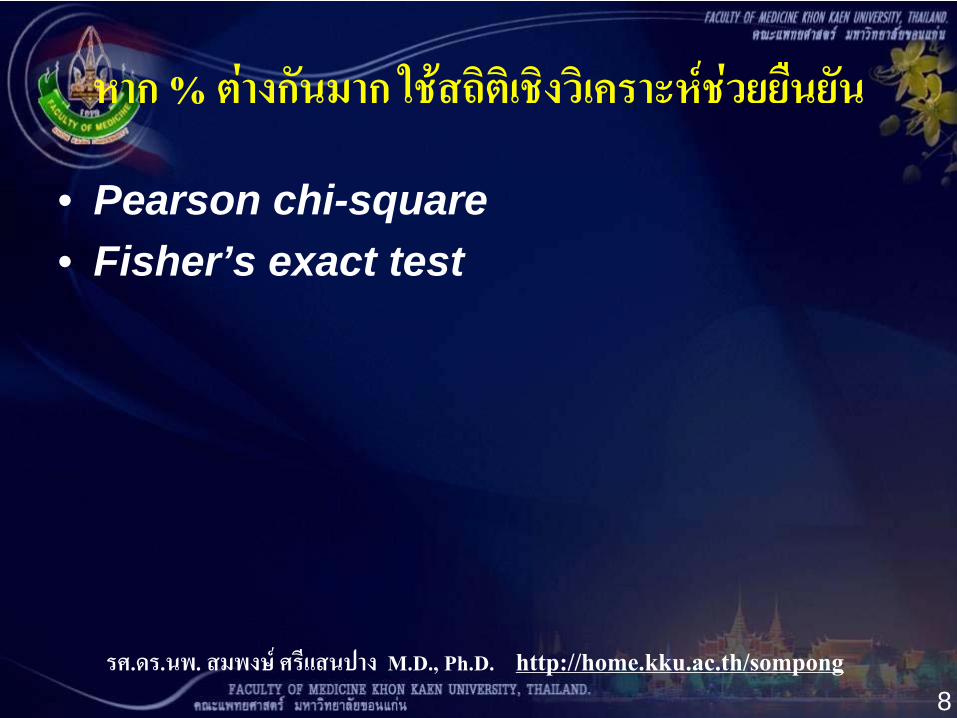
หาก % ตางกันมาก ใชสถิติเชิงวิเคราะหชวยยืนยัน
• Pearson chi-square• Fisher’s exact test
รศ.ดร.นพ. สมพงษ ศรีแสนปาง M.D., Ph.D. http://home.kku.ac.th/sompong9
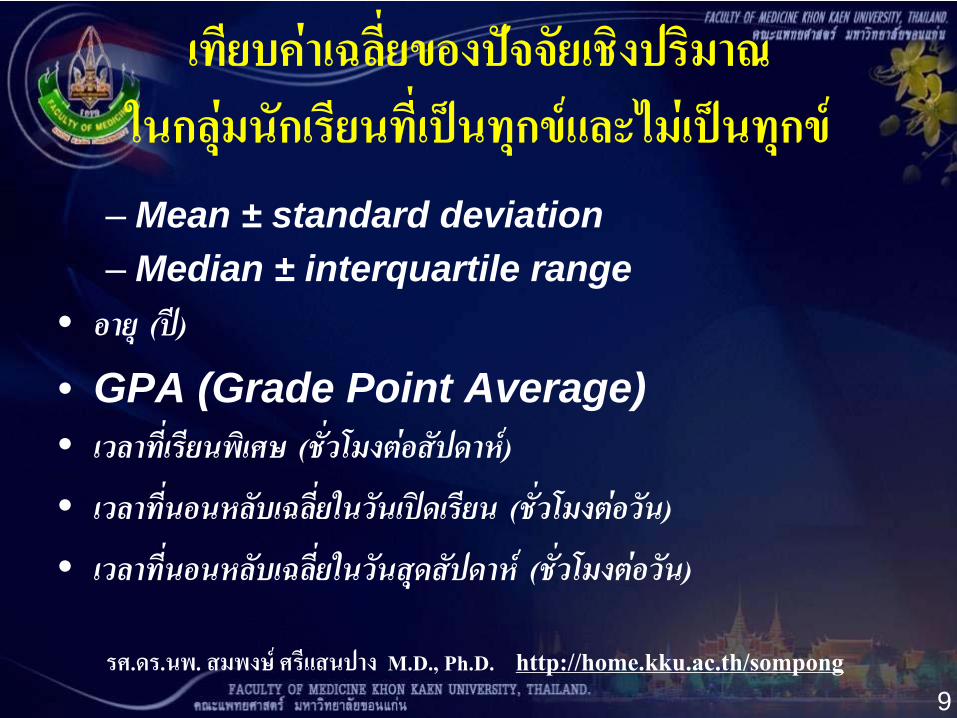
เทียบคาเฉลี่ยของปจจัยเชิงปริมาณ ในกลุมนักเรียนที่เปนทุกขและไมเปนทุกข
– Mean ± standard deviation– Median ± interquartile range
• อายุ (ป)
• GPA (Grade Point Average)• เวลาที่เรียนพิเศษ (ชั่วโมงตอสัปดาห)
• เวลาที่นอนหลับเฉลี่ยในวันเปดเรียน (ชั่วโมงตอวัน)
• เวลาที่นอนหลับเฉลี่ยในวันสุดสัปดาห (ชั่วโมงตอวัน)
รศ.ดร.นพ. สมพงษ ศรีแสนปาง M.D., Ph.D. http://home.kku.ac.th/sompong10
หากคาเฉลี่ยตางกันมาก
ใชสถิติเชิงวิเคราะหชวยยืนยัน
• T-test• Mann-Whitney U test
รศ.ดร.นพ. สมพงษ ศรีแสนปาง M.D., Ph.D. http://home.kku.ac.th/sompong11
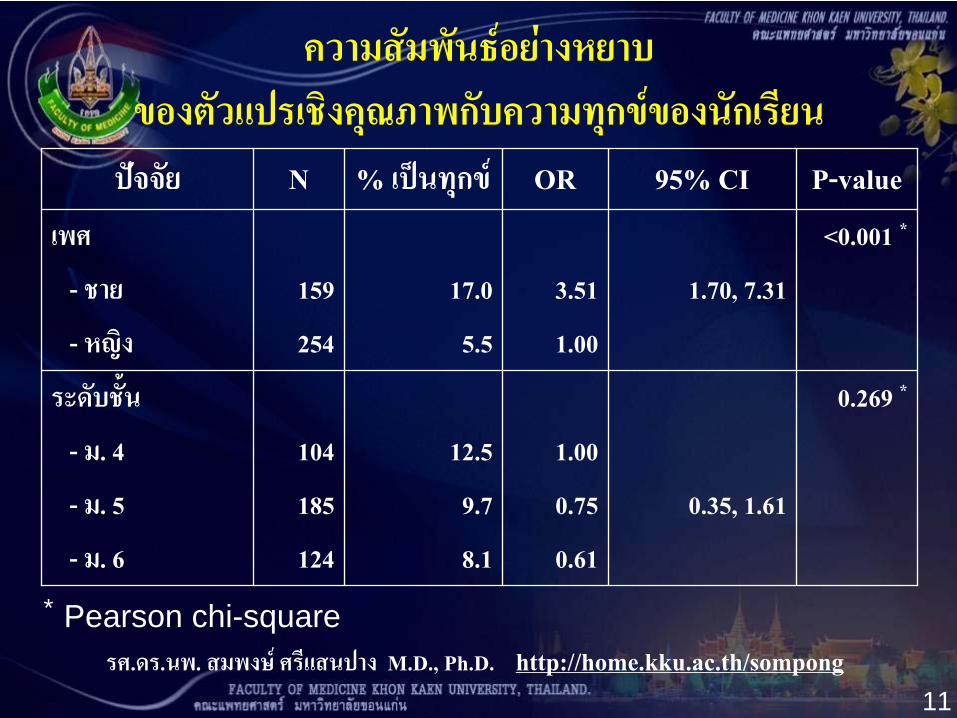
ความสัมพันธอยางหยาบ
ของตัวแปรเชิงคุณภาพกับความทุกขของนักเรียน
ปจจัย N % เปนทุกข OR 95% CI P-value
เพศ
- ชาย
- หญิง
159
254
17.0
5.5
3.51
1.00
1.70, 7.31
<0.001 *
ระดับชั้น
- ม. 4
- ม. 5
- ม. 6
104
185
124
12.5
9.7
8.1
1.00
0.75
0.61
0.35, 1.61
0.269 *
* Pearson chi-square
รศ.ดร.นพ. สมพงษ ศรีแสนปาง M.D., Ph.D. http://home.kku.ac.th/sompong12
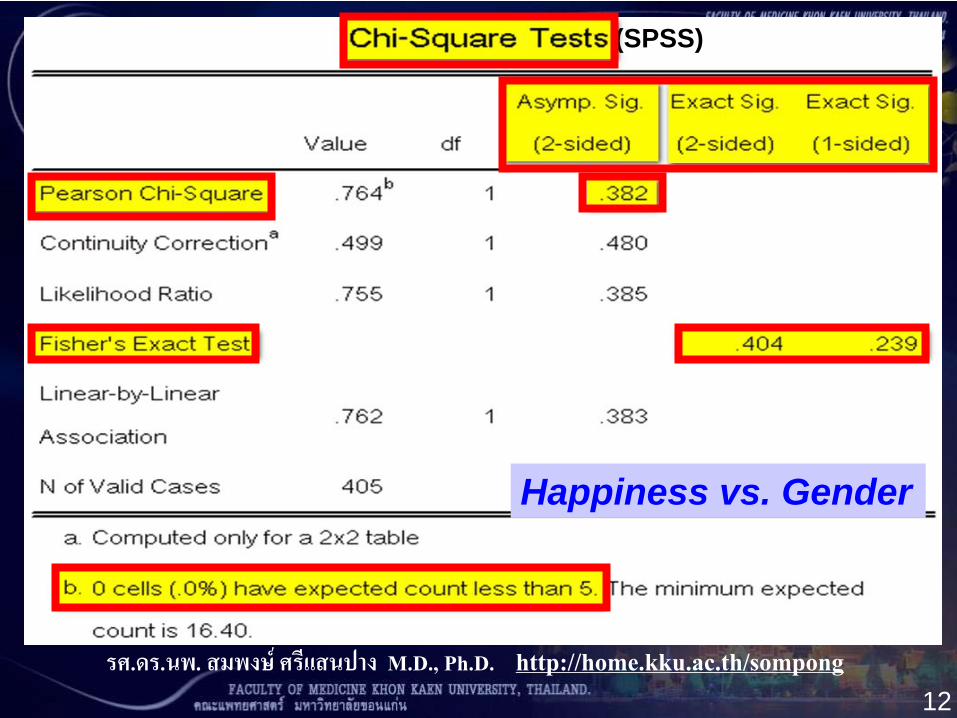
(SPSS)
Happiness vs. Gender
รศ.ดร.นพ. สมพงษ ศรีแสนปาง M.D., Ph.D. http://home.kku.ac.th/sompong13
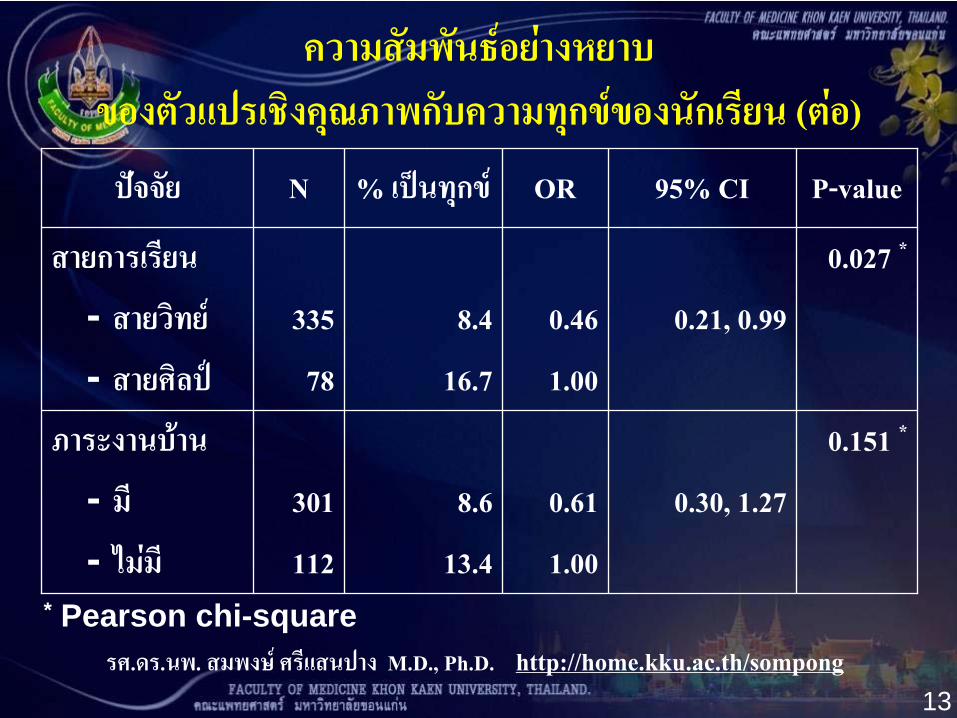
ความสัมพันธอยางหยาบ
ของตัวแปรเชิงคุณภาพกับความทุกขของนักเรียน (ตอ)
ปจจัย N % เปนทุกข OR 95% CI P-value
สายการเรียน
- สายวิทย- สายศิลป
335
78
8.4
16.7
0.46
1.00
0.21, 0.99
0.027 *
ภาระงานบาน
- มี- ไมมี
301
112
8.6
13.4
0.61
1.00
0.30, 1.27
0.151 *
* Pearson chi-square
รศ.ดร.นพ. สมพงษ ศรีแสนปาง M.D., Ph.D. http://home.kku.ac.th/sompong14
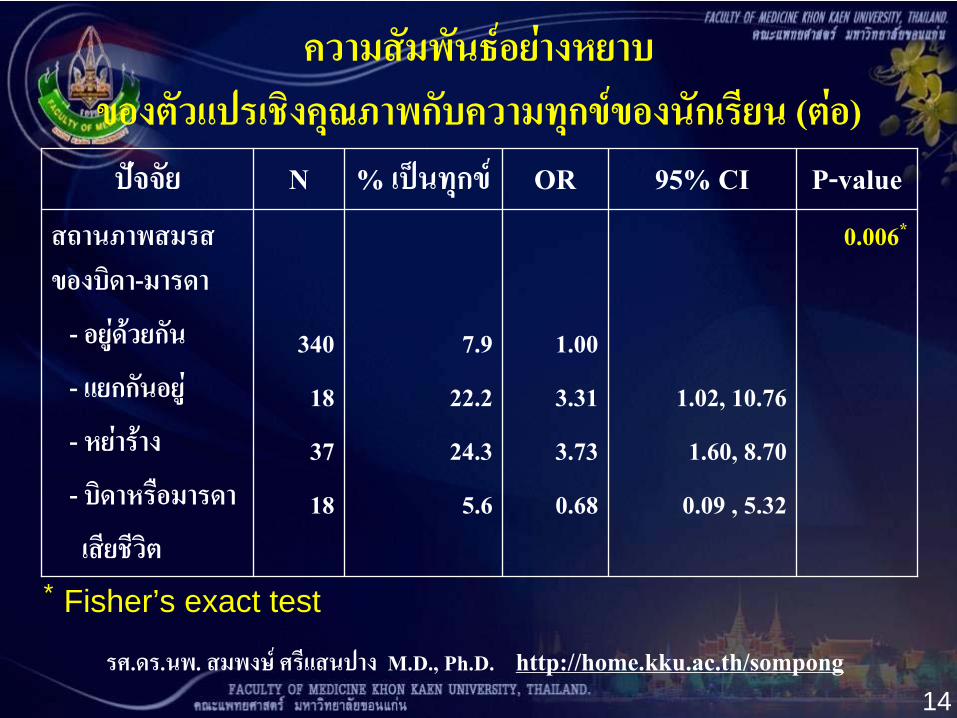
ความสัมพันธอยางหยาบ
ของตัวแปรเชิงคุณภาพกับความทุกขของนักเรียน (ตอ)
ปจจัย N % เปนทุกข OR 95% CI P-value
สถานภาพสมรส ของบิดา-มารดา
- อยูดวยกัน
- แยกกันอยู
- หยาราง
- บิดาหรือมารดา
เสียชีวิต
340
18
37
18
7.9
22.2
24.3
5.6
1.00
3.31
3.73
0.68
1.02, 10.76
1.60, 8.70
0.09 , 5.32
0.006*
* Fisher’s exact test
รศ.ดร.นพ. สมพงษ ศรีแสนปาง M.D., Ph.D. http://home.kku.ac.th/sompong15
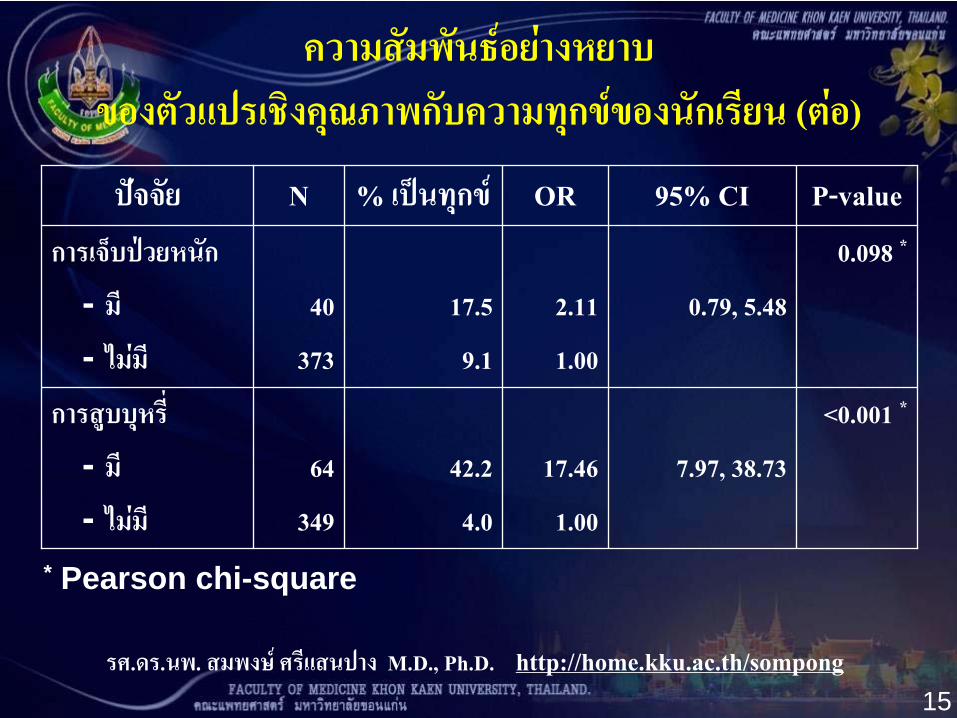
ความสัมพันธอยางหยาบ
ของตัวแปรเชิงคุณภาพกับความทุกขของนักเรียน (ตอ)
ปจจัย N % เปนทุกข OR 95% CI P-value
การเจ็บปวยหนกั
- มี- ไมมี
40
373
17.5
9.1
2.11
1.00
0.79, 5.48
0.098 *
การสูบบุหรี่
- มี- ไมมี
64
349
42.2
4.0
17.46
1.00
7.97, 38.73
<0.001 *
* Pearson chi-square
รศ.ดร.นพ. สมพงษ ศรีแสนปาง M.D., Ph.D. http://home.kku.ac.th/sompong16
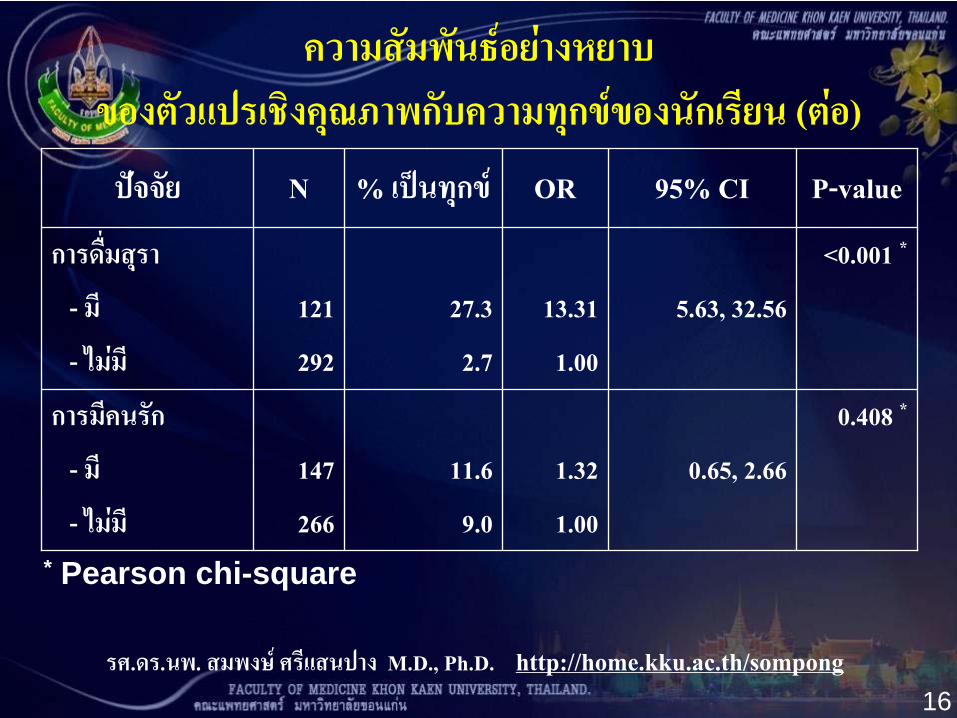
ความสัมพันธอยางหยาบ
ของตัวแปรเชิงคุณภาพกับความทุกขของนักเรียน (ตอ)
ปจจัย N % เปนทุกข OR 95% CI P-value
การดื่มสุรา
- มี
- ไมมี
121
292
27.3
2.7
13.31
1.00
5.63, 32.56
<0.001 *
การมีคนรัก
- มี
- ไมมี
147
266
11.6
9.0
1.32
1.00
0.65, 2.66
0.408 *
* Pearson chi-square
รศ.ดร.นพ. สมพงษ ศรีแสนปาง M.D., Ph.D. http://home.kku.ac.th/sompong17
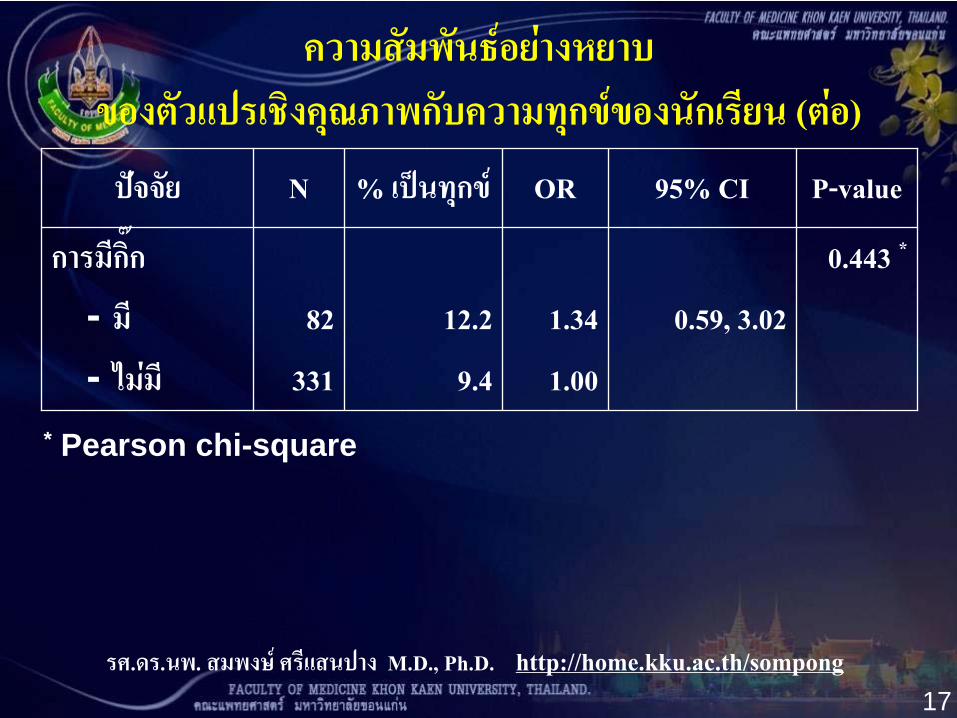
ความสัมพันธอยางหยาบ
ของตัวแปรเชิงคุณภาพกับความทุกขของนักเรียน (ตอ)
ปจจัย N % เปนทุกข OR 95% CI P-value
การมีกิ๊ก
- มี- ไมมี
82
331
12.2
9.4
1.34
1.00
0.59, 3.02
0.443 *
* Pearson chi-square
รศ.ดร.นพ. สมพงษ ศรีแสนปาง M.D., Ph.D. http://home.kku.ac.th/sompong18
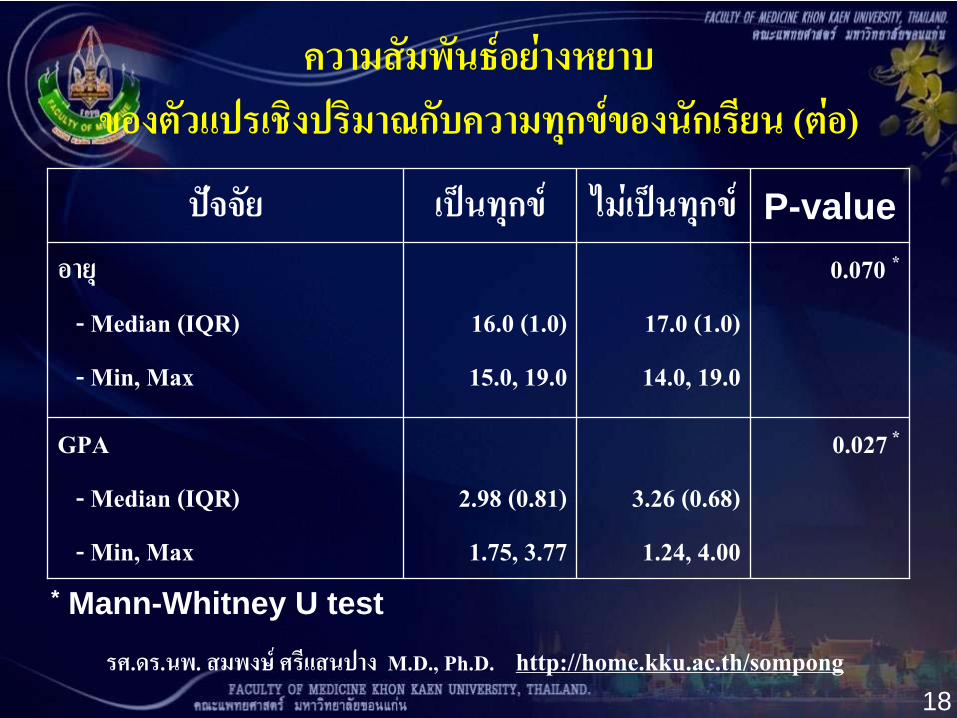
ความสัมพันธอยางหยาบ
ของตัวแปรเชิงปริมาณกับความทุกขของนักเรียน (ตอ)
ปจจัย เปนทุกข ไมเปนทุกข P-valueอายุ
-
Median (IQR)
- Min, Max
16.0 (1.0)
15.0,
19.0
17.0 (1.0)
14.0, 19.0
0.070 *
GPA
-
Median (IQR)
- Min, Max
2.98
(0.81)
1.75,
3.77
3.26
(0.68)
1.24,
4.00
0.027
*
* Mann-Whitney U test
รศ.ดร.นพ. สมพงษ ศรีแสนปาง M.D., Ph.D. http://home.kku.ac.th/sompong19
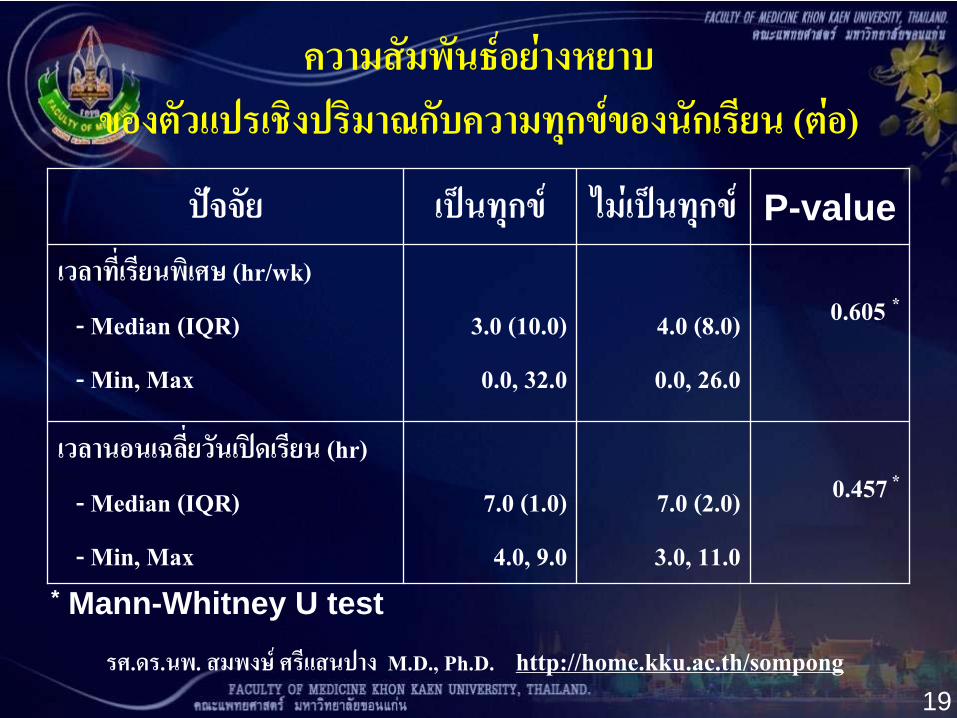
ความสัมพันธอยางหยาบ
ของตัวแปรเชิงปริมาณกับความทุกขของนักเรียน (ตอ)
ปจจัย เปนทุกข ไมเปนทุกข P-valueเวลาที่เรียนพิเศษ (hr/wk)
-
Median (IQR)
- Min, Max
3.0
(10.0)
0.0,
32.0
4.0
(8.0)
0.0, 26.0
0.605
*
เวลานอนเฉลี่ยวันเปดเรียน (hr)
-
Median (IQR)
- Min, Max
7.0 (1.0)
4.0, 9.0
7.0 (2.0)
3.0, 11.0
0.457
*
* Mann-Whitney U test
รศ.ดร.นพ. สมพงษ ศรีแสนปาง M.D., Ph.D. http://home.kku.ac.th/sompong20
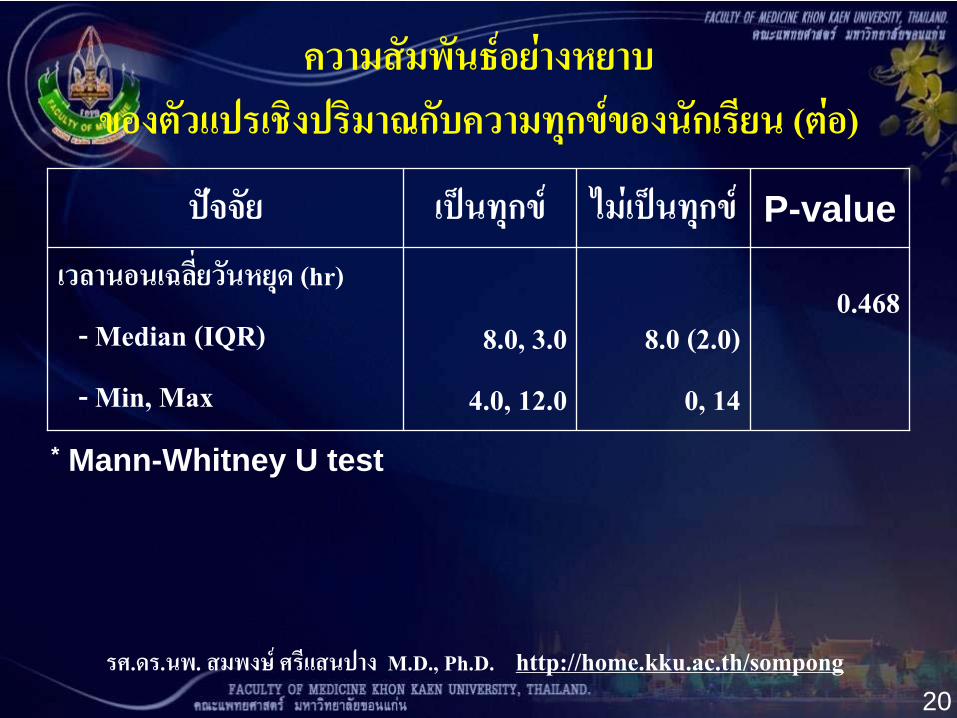
ความสัมพันธอยางหยาบ
ของตัวแปรเชิงปริมาณกับความทุกขของนักเรียน (ตอ)
ปจจัย เปนทุกข ไมเปนทุกข P-valueเวลานอนเฉลี่ยวนัหยุด (hr)
-
Median (IQR)
-
Min, Max
8.0, 3.0
4.0, 12.0
8.0 (2.0)
0, 14
0.468
* Mann-Whitney U test
รศ.ดร.นพ. สมพงษ ศรีแสนปาง M.D., Ph.D. http://home.kku.ac.th/sompong21
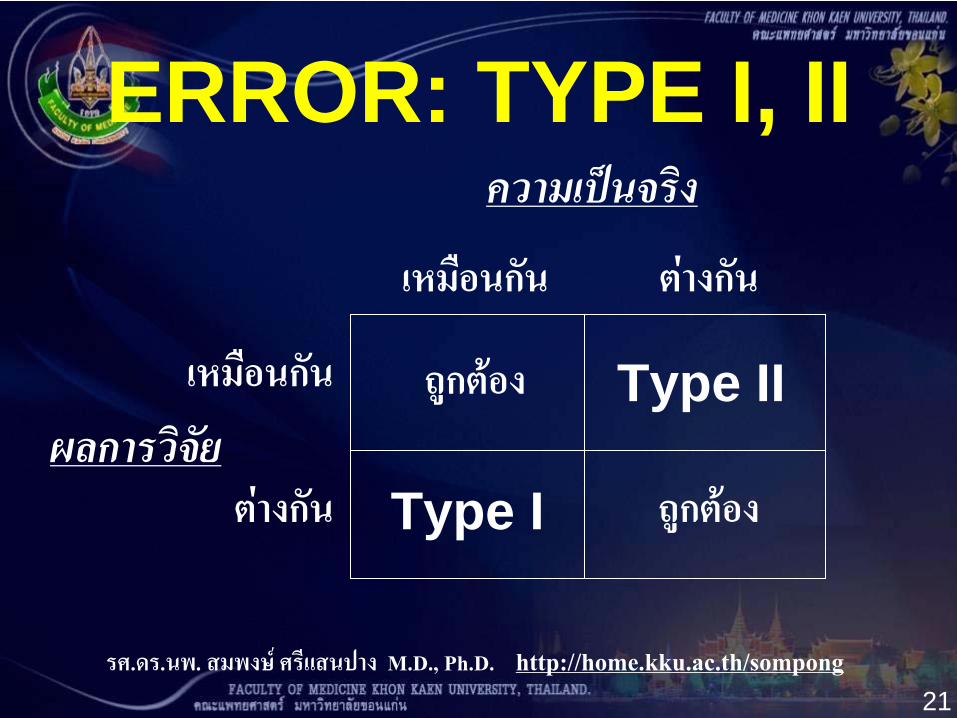
ERROR: TYPE I, IIความเปนจริง
ผลการวิจัย
เหมือนกัน ตางกัน
ตางกัน
เหมือนกัน Type II
ถูกตอง
ถูกตอง
Type I
รศ.ดร.นพ. สมพงษ ศรีแสนปาง M.D., Ph.D. http://home.kku.ac.th/sompong22
CONFOUNDING FACTOR MODIFYING FACTOR
AND INTERACTION
รศ.ดร.นพ. สมพงษ ศรีแสนปาง M.D., Ph.D. http://home.kku.ac.th/sompong23
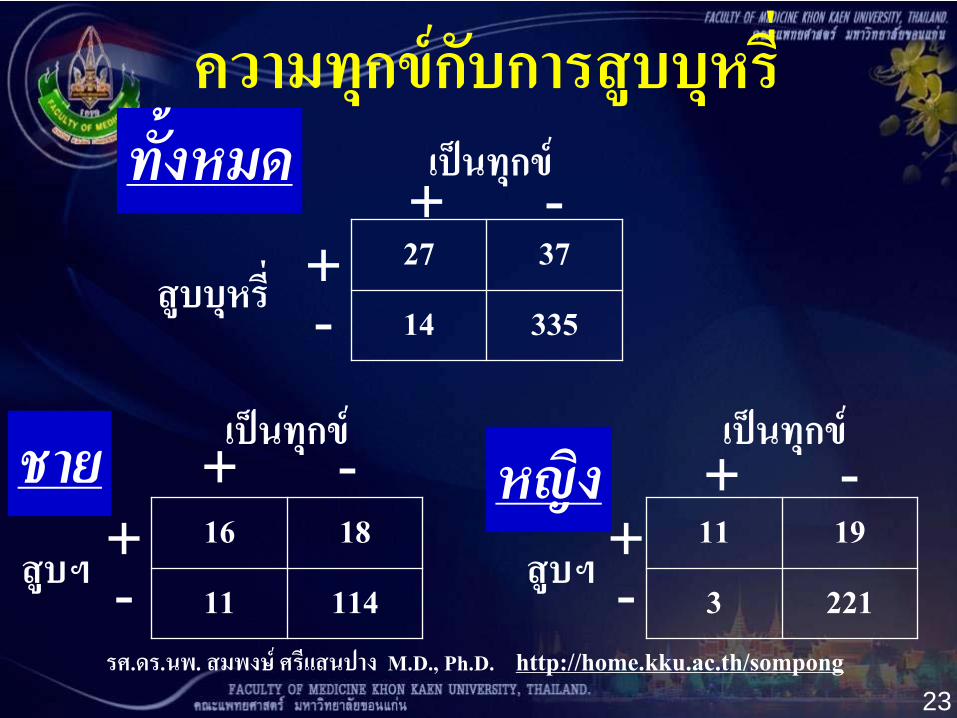
ความทุกขกบัการสูบบุหรี่
27 37
14 335
16 18
11 114
11 19
3 221
+ - + -
+ -+-
+-
+-
ทั้งหมด
หญิงชาย
เปนทุกข
เปนทุกขเปนทุกข
สบูบหุรี่
สบูฯ สบูฯ
รศ.ดร.นพ. สมพงษ ศรีแสนปาง M.D., Ph.D. http://home.kku.ac.th/sompong24
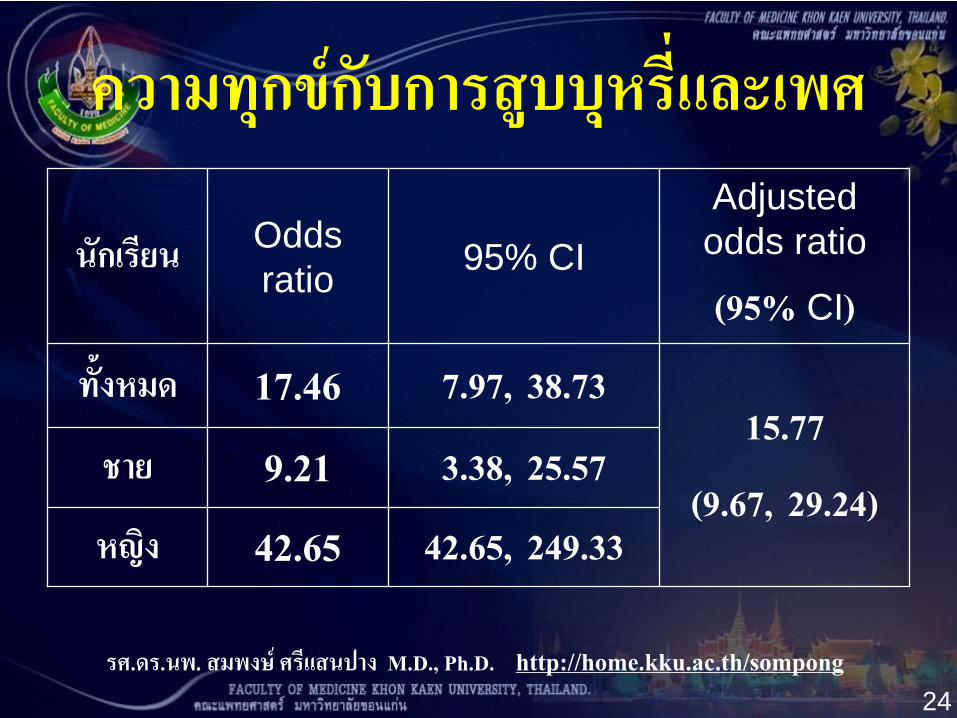
ความทุกขกบัการสูบบุหรี่และเพศ
นกัเรียน Odds ratio 95% CI
Adjusted odds ratio
(95%
CI)
ทั้งหมด 17.46 7.97,
38.7315.77
(9.67,
29.24)ชาย 9.21 3.38,
25.57
หญิง 42.65 42.65,
249.33
รศ.ดร.นพ. สมพงษ ศรีแสนปาง M.D., Ph.D. http://home.kku.ac.th/sompong25
RISK FACTOR PROTECTIVE FACTOR
VS. PROMOTIVE FACTOR
OBSTRUCTIVE FACTOR
รศ.ดร.นพ. สมพงษ ศรีแสนปาง M.D., Ph.D. http://home.kku.ac.th/sompong26
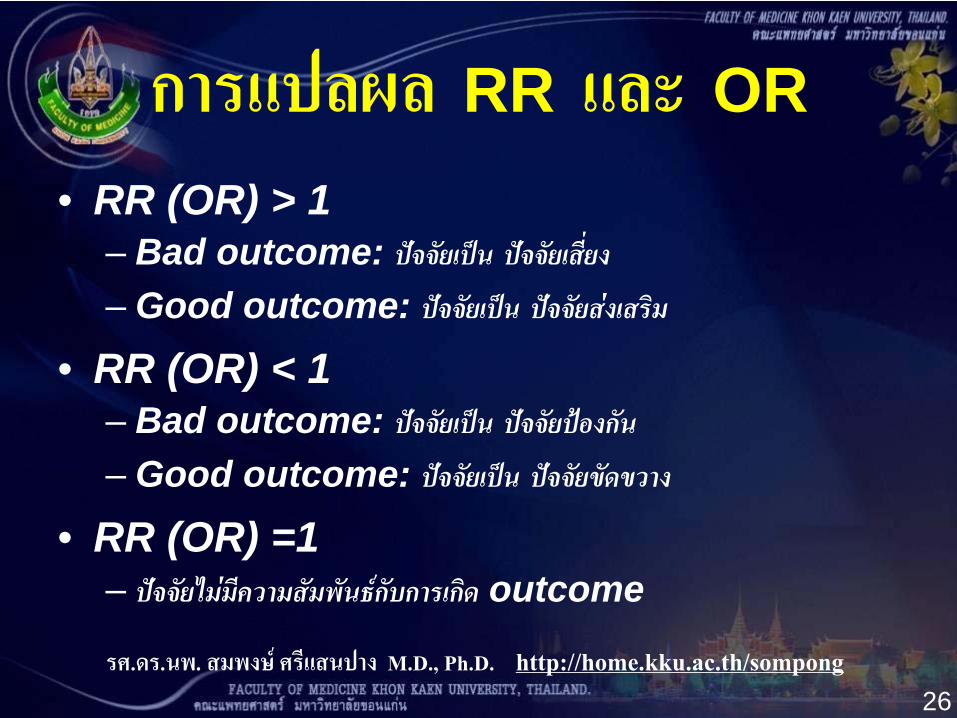
การแปลผล RR และ OR• RR (OR) > 1
– Bad outcome: ปจจัยเปน ปจจัยเสี่ยง– Good outcome: ปจจัยเปน ปจจัยสงเสริม
• RR (OR) < 1– Bad outcome: ปจจัยเปน ปจจัยปองกัน– Good outcome: ปจจัยเปน ปจจัยขัดขวาง
• RR (OR) =1– ปจจัยไมมีความสมัพนัธกับการเกิด outcome
รศ.ดร.นพ. สมพงษ ศรีแสนปาง M.D., Ph.D. http://home.kku.ac.th/sompong27
MULTIPLE LOGISTIC REGRESSION
TO DETERMINERISK / PROTECTIVE FACTOR
รศ.ดร.นพ. สมพงษ ศรีแสนปาง M.D., Ph.D. http://home.kku.ac.th/sompong28
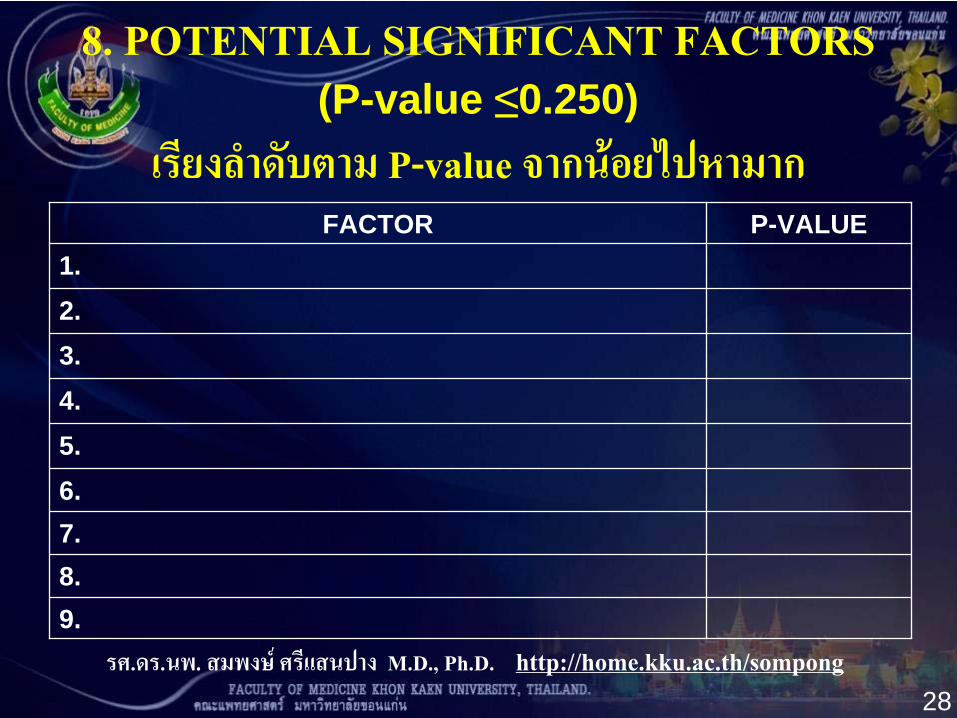
8. POTENTIAL SIGNIFICANT FACTORS (P-value ≤0.250) เรียงลําดับตาม P-value จากนอยไปหามาก
FACTOR P-VALUE1.2.3.4.5.6.7.8.9.

รศ.ดร.นพ. สมพงษ ศรีแสนปาง M.D., Ph.D. http://home.kku.ac.th/sompong29
ผลลัพธของ MODEL ตั้งตน
รศ.ดร.นพ. สมพงษ ศรีแสนปาง M.D., Ph.D. http://home.kku.ac.th/sompong30
RISK DIFFERENCE
• อีกชื่อคือ attributable risk• เปน absolute risk• Risk1 – Risk2
รศ.ดร.นพ. สมพงษ ศรีแสนปาง M.D., Ph.D. http://home.kku.ac.th/sompong31
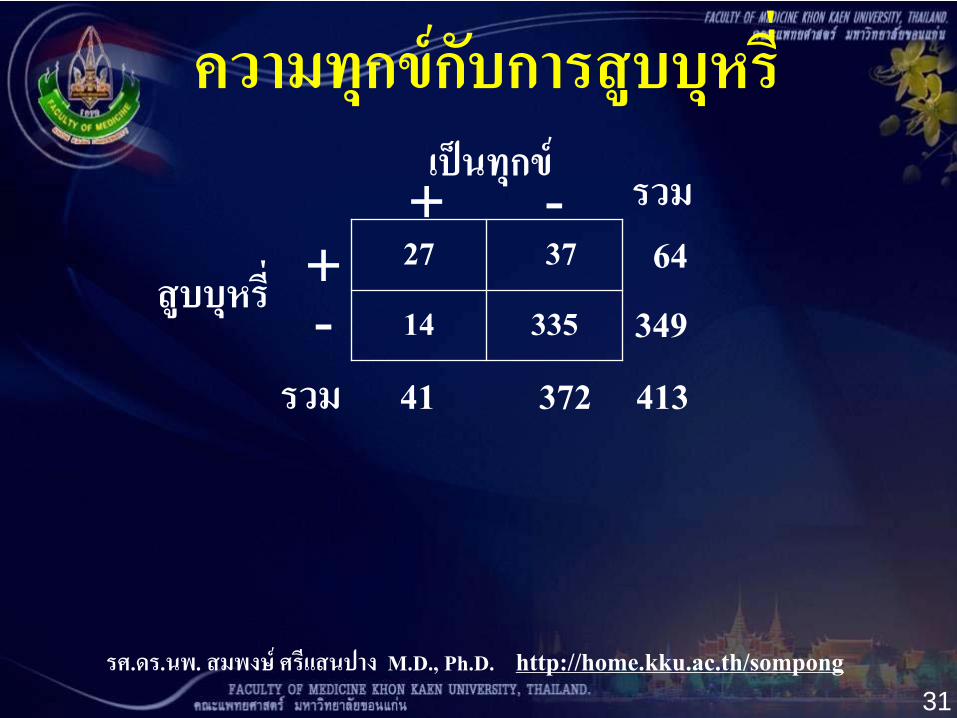
ความทุกขกบัการสูบบุหรี่
27 37
14 335
+ -+-
เปนทุกข
สบูบหุรี่
รวม 41
372
413
รวม
64
349
รศ.ดร.นพ. สมพงษ ศรีแสนปาง M.D., Ph.D. http://home.kku.ac.th/sompong32
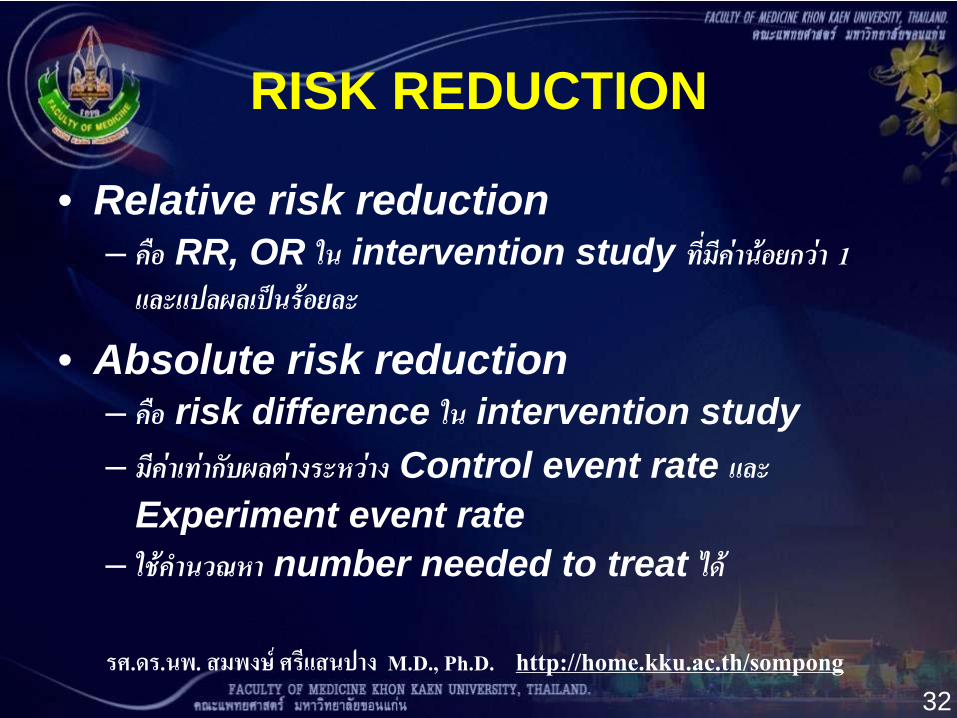
RISK REDUCTION
• Relative risk reduction– คือ RR, OR ใน intervention study ทีม่ีคานอยกวา 1
และแปลผลเปนรอยละ
• Absolute risk reduction– คือ risk difference ใน intervention study – มีคาเทากับผลตางระหวาง Control event rate และ
Experiment event rate– ใชคํานวณหา number needed to treat ได
รศ.ดร.นพ. สมพงษ ศรีแสนปาง M.D., Ph.D. http://home.kku.ac.th/sompong33
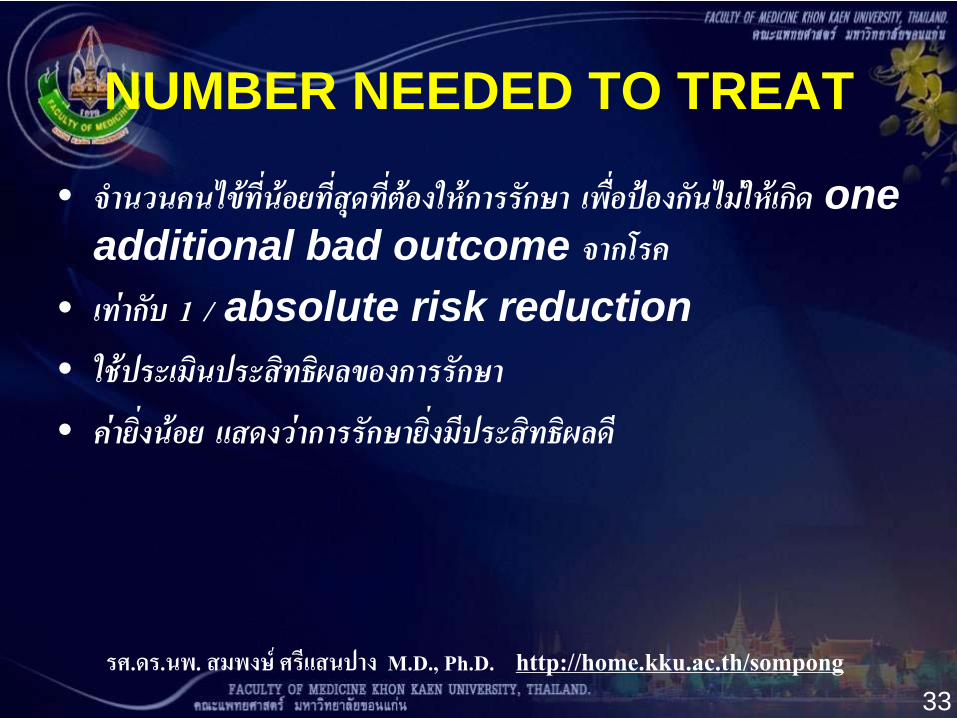
NUMBER NEEDED TO TREAT
• จํานวนคนไขที่นอยที่สุดที่ตองใหการรักษา เพื่อปองกันไมใหเกิด one additional bad outcome จากโรค
• เทากับ 1 / absolute risk reduction• ใชประเมินประสิทธิผลของการรักษา• คายิ่งนอย แสดงวาการรักษายิ่งมีประสิทธิผลดี
รศ.ดร.นพ. สมพงษ ศรีแสนปาง M.D., Ph.D. http://home.kku.ac.th/sompong34
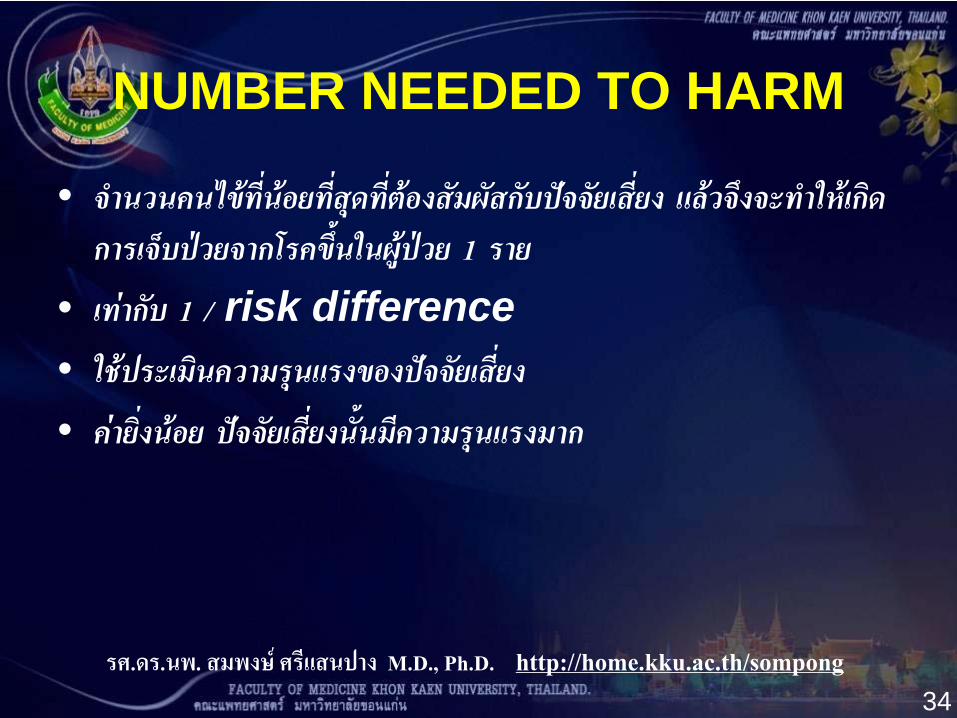
NUMBER NEEDED TO HARM
• จํานวนคนไขที่นอยที่สุดที่ตองสัมผัสกับปจจัยเสี่ยง แลวจึงจะทําใหเกิด การเจ็บปวยจากโรคขึ้นในผูปวย 1 ราย
• เทากับ 1 / risk difference• ใชประเมินความรุนแรงของปจจัยเสี่ยง• คายิ่งนอย ปจจัยเสี่ยงนั้นมีความรนุแรงมาก
รศ.ดร.นพ. สมพงษ ศรีแสนปาง M.D., Ph.D. http://home.kku.ac.th/sompong35
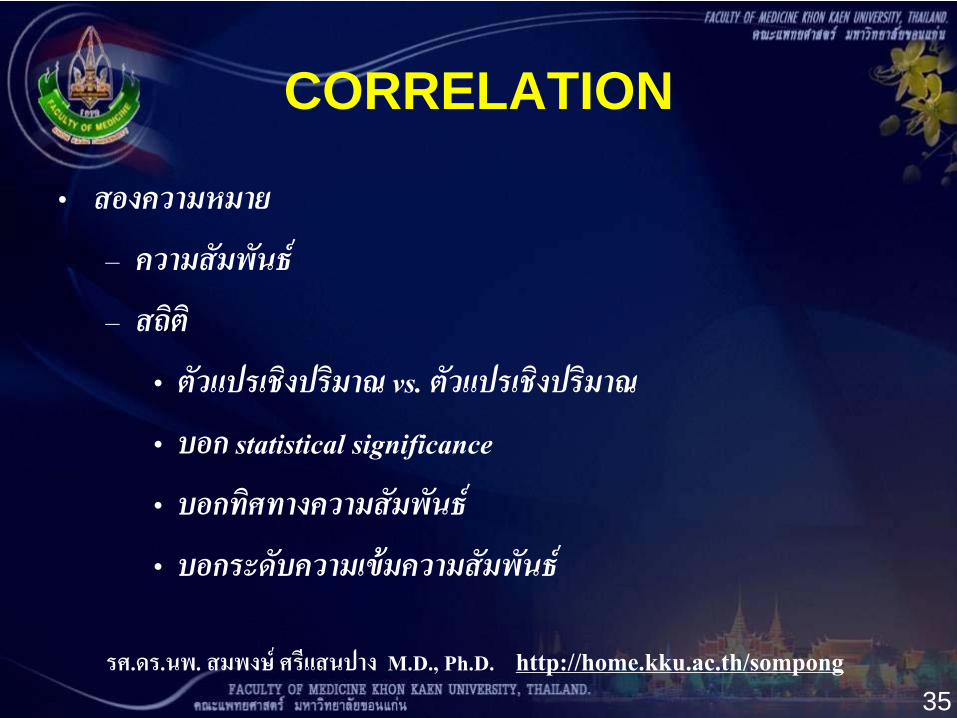
CORRELATION
•
สองความหมาย
–
ความสัมพันธ
–
สถิติ
•
ตัวแปรเชิงปริมาณ vs. ตัวแปรเชิงปริมาณ
•
บอก statistical significance
•
บอกทศิทางความสัมพันธ
•
บอกระดับความเขมความสัมพันธ
รศ.ดร.นพ. สมพงษ ศรีแสนปาง M.D., Ph.D. http://home.kku.ac.th/sompong36
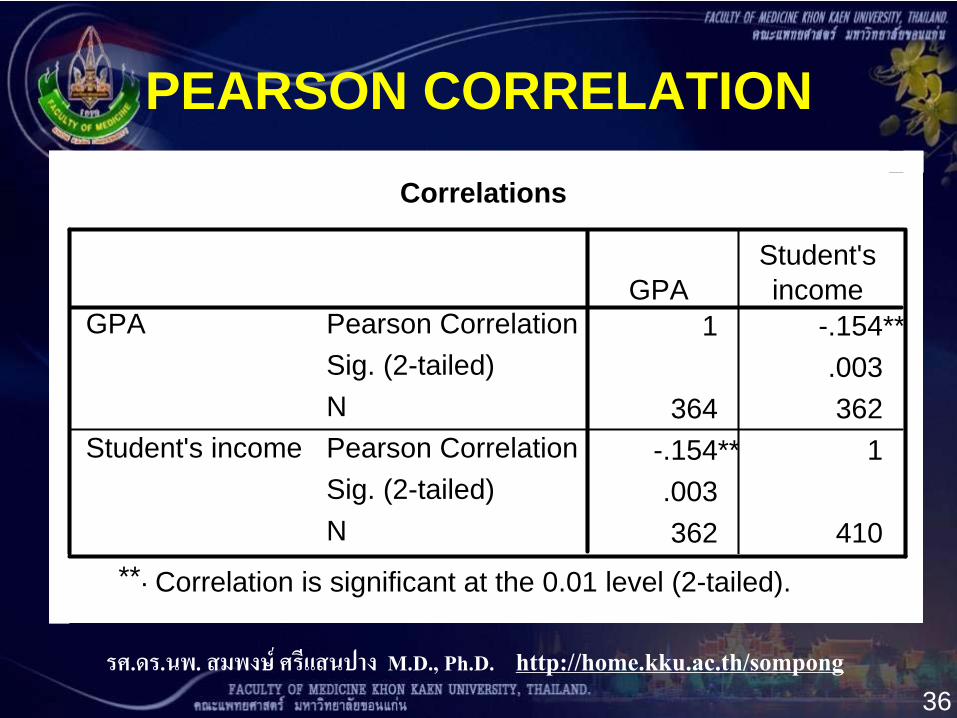
PEARSON CORRELATION
Correlations
1 -.154**.003
364 362-.154** 1.003362 410
Pearson CorrelationSig. (2-tailed)NPearson CorrelationSig. (2-tailed)N
GPA
Student's income
GPAStudent'sincome
Correlation is significant at the 0.01 level (2-tailed).**.
รศ.ดร.นพ. สมพงษ ศรีแสนปาง M.D., Ph.D. http://home.kku.ac.th/sompong37
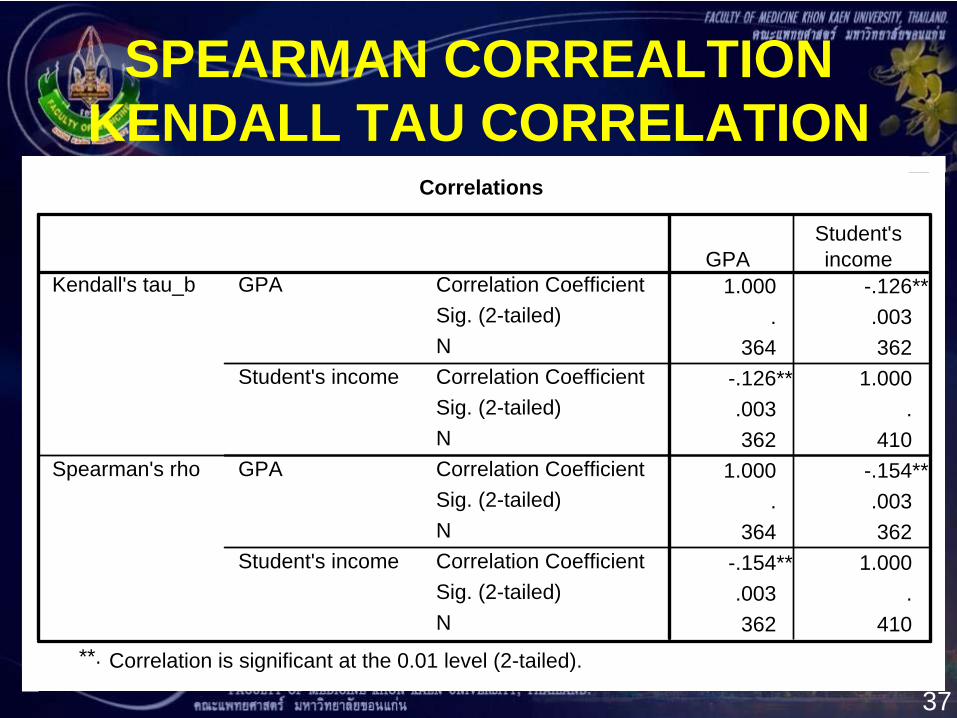
SPEARMAN CORREALTION KENDALL TAU CORRELATION
Correlations
1.000 -.126**. .003
364 362-.126** 1.000.003 .362 410
1.000 -.154**. .003
364 362-.154** 1.000.003 .362 410
Correlation CoefficientSig. (2-tailed)NCorrelation CoefficientSig. (2-tailed)NCorrelation CoefficientSig. (2-tailed)NCorrelation CoefficientSig. (2-tailed)N
GPA
Student's income
GPA
Student's income
Kendall's tau_b
Spearman's rho
GPAStudent'sincome
Correlation is significant at the 0.01 level (2-tailed).**.
รศ.ดร.นพ. สมพงษ ศรีแสนปาง M.D., Ph.D. http://home.kku.ac.th/sompong38