Embed Size (px)
Citation preview
8/10/2019 Bio112-EcologicalFootprint
http://slidepdf.com/reader/full/bio112-ecologicalfootprint 1/44

8/10/2019 Bio112-EcologicalFootprint
http://slidepdf.com/reader/full/bio112-ecologicalfootprint 2/44
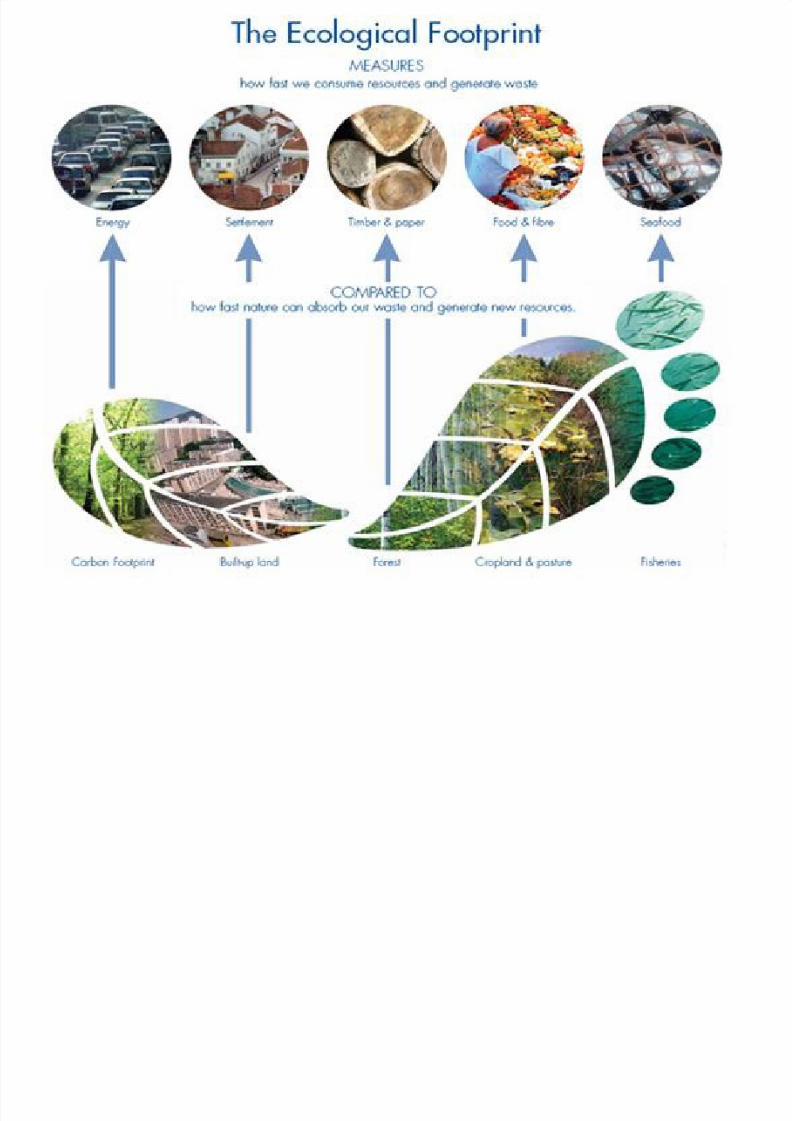
What are ecological footprints?
• Ecological footprints measure the extent towhich humans are using the Earth
sbioproductive capacity
• Units are global hectares
– A hectare of land with average bio-productivecapacity (for agriculture, forest, nutrient cycling,
energy production, etc.)
– A hectare = 2.5 acres(1 acre is about a football field between the 5 yard lines)(1 hectare is 2 complete football fields with endzones)
8/10/2019 Bio112-EcologicalFootprint
http://slidepdf.com/reader/full/bio112-ecologicalfootprint 3/44
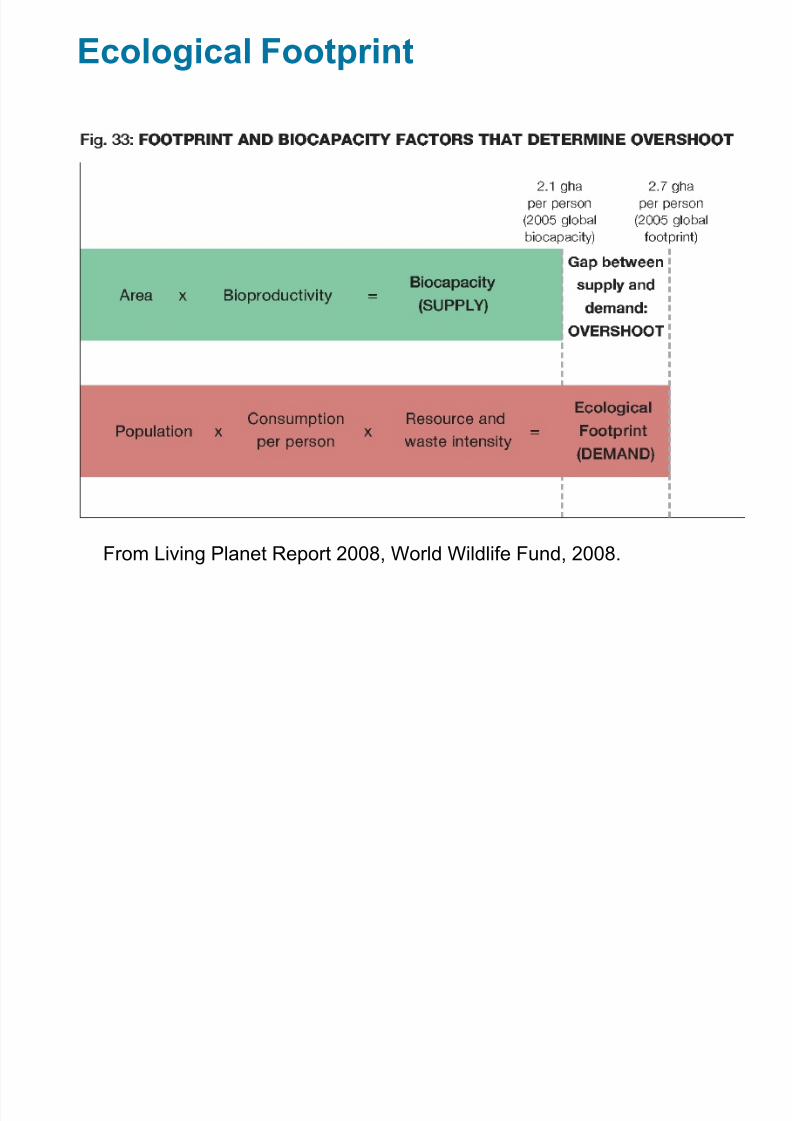
Ecological Footprint
From Living Planet Report 2008, World Wildlife Fund, 2008.
8/10/2019 Bio112-EcologicalFootprint
http://slidepdf.com/reader/full/bio112-ecologicalfootprint 4/44
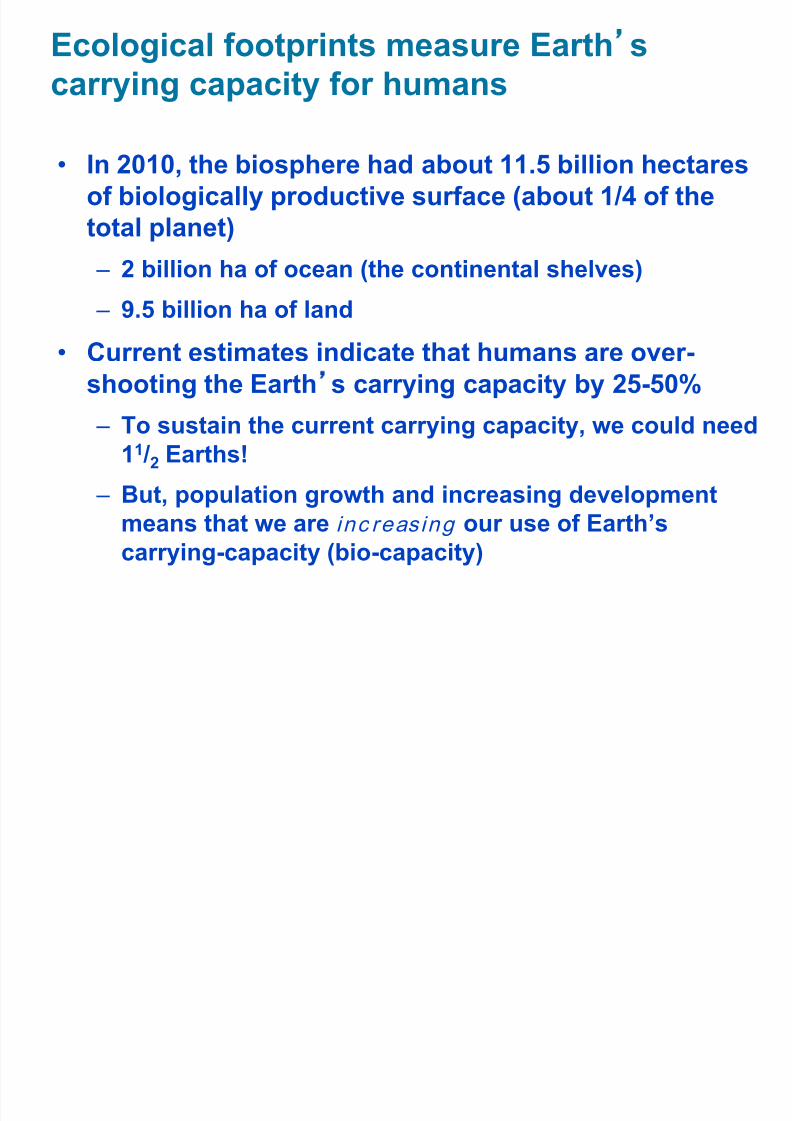
Ecological footprints measure Earth
scarrying capacity for humans
• In 2010, the biosphere had about 11.5 billion hectaresof biologically productive surface (about 1/4 of thetotal planet)
– 2 billion ha of ocean (the continental shelves) – 9.5 billion ha of land
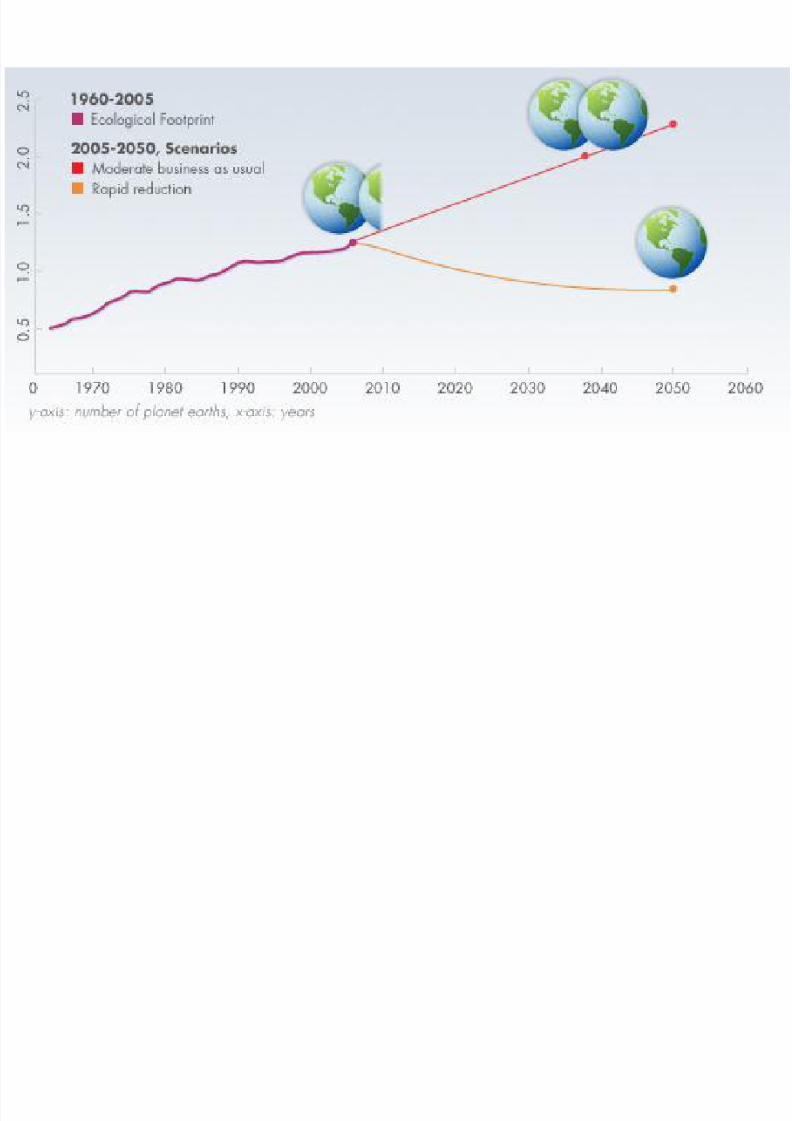
• Current estimates indicate that humans are over-shooting the Earth s carrying capacity by 25-50%
– To sustain the current carrying capacity, we could need11 /2 Earths!
– But, population growth and increasing developmentmeans that we are inc reasing our use of Earth’s
carrying-capacity (bio-capacity)

8/10/2019 Bio112-EcologicalFootprint
http://slidepdf.com/reader/full/bio112-ecologicalfootprint 5/44
From Living Planet Report 2008, World Wildlife Fund, 2008.
8/10/2019 Bio112-EcologicalFootprint
http://slidepdf.com/reader/full/bio112-ecologicalfootprint 6/44
8/10/2019 Bio112-EcologicalFootprint
http://slidepdf.com/reader/full/bio112-ecologicalfootprint 7/44
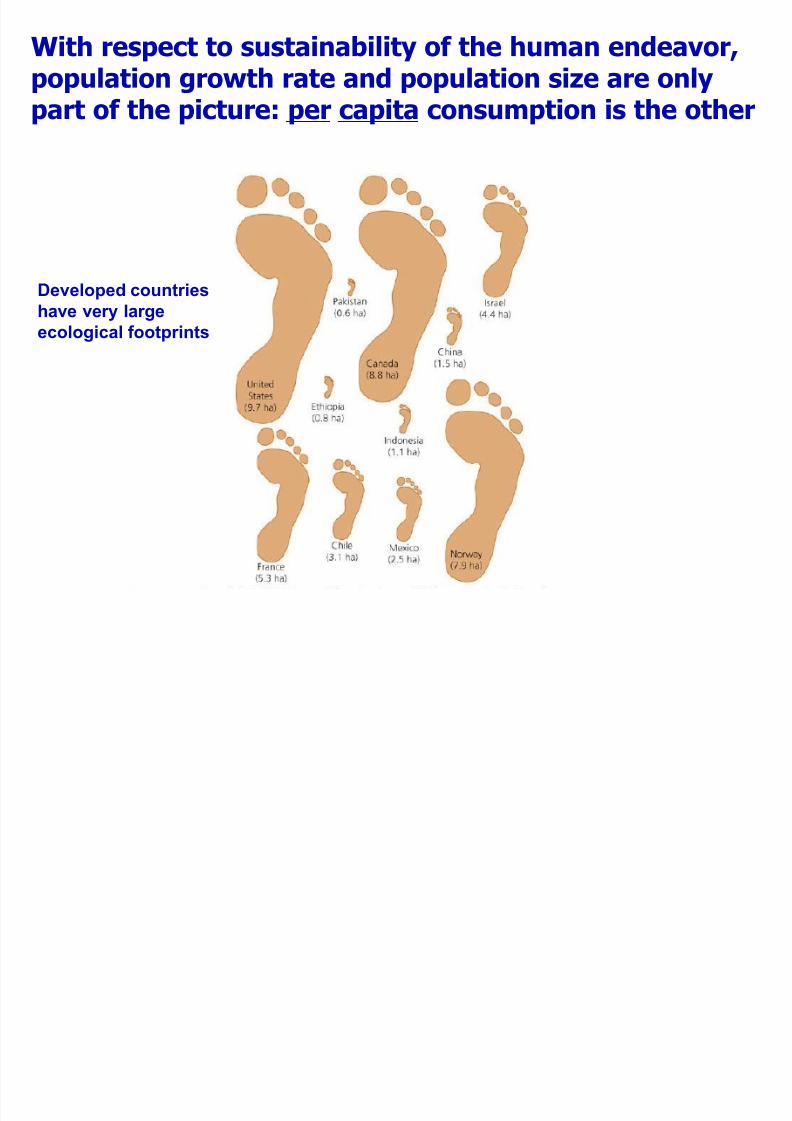
With respect to sustainability of the human endeavor,population growth rate and population size are onlypart of the picture: per capita consumption is the other
Developed countrieshave very largeecological footprints
8/10/2019 Bio112-EcologicalFootprint
http://slidepdf.com/reader/full/bio112-ecologicalfootprint 8/44
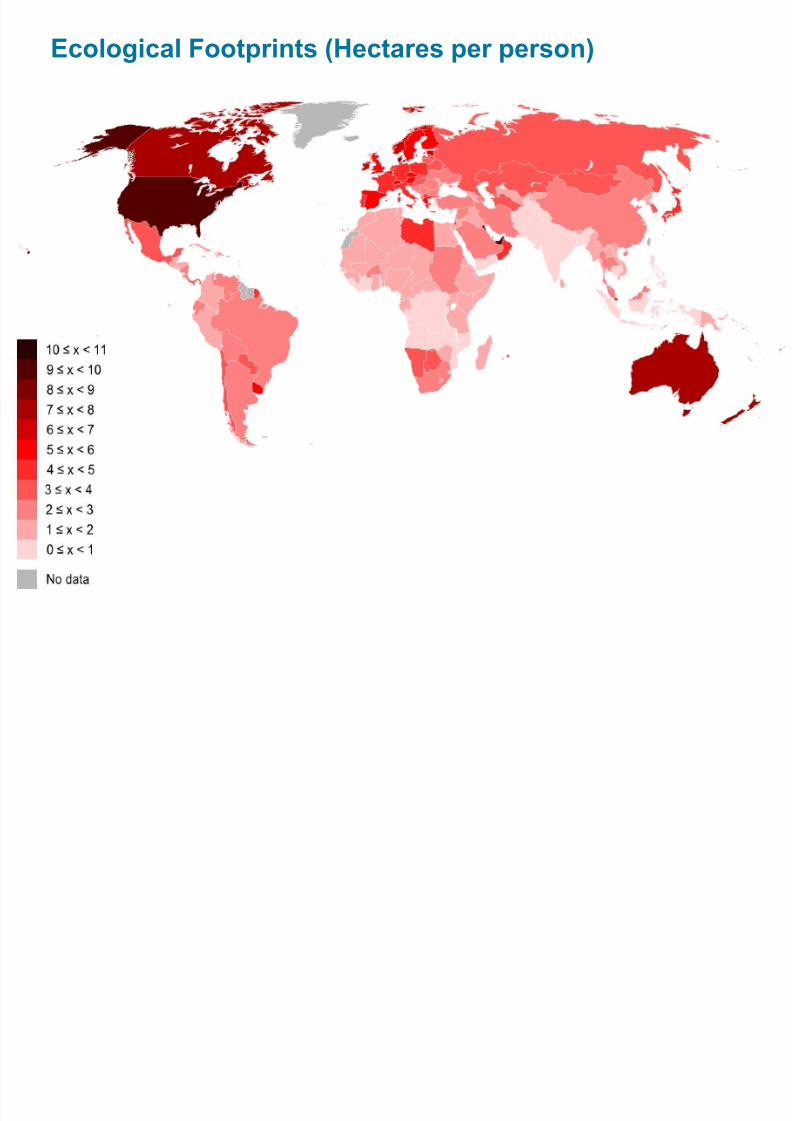
Ecological Footprints (Hectares per person)
8/10/2019 Bio112-EcologicalFootprint
http://slidepdf.com/reader/full/bio112-ecologicalfootprint 9/44
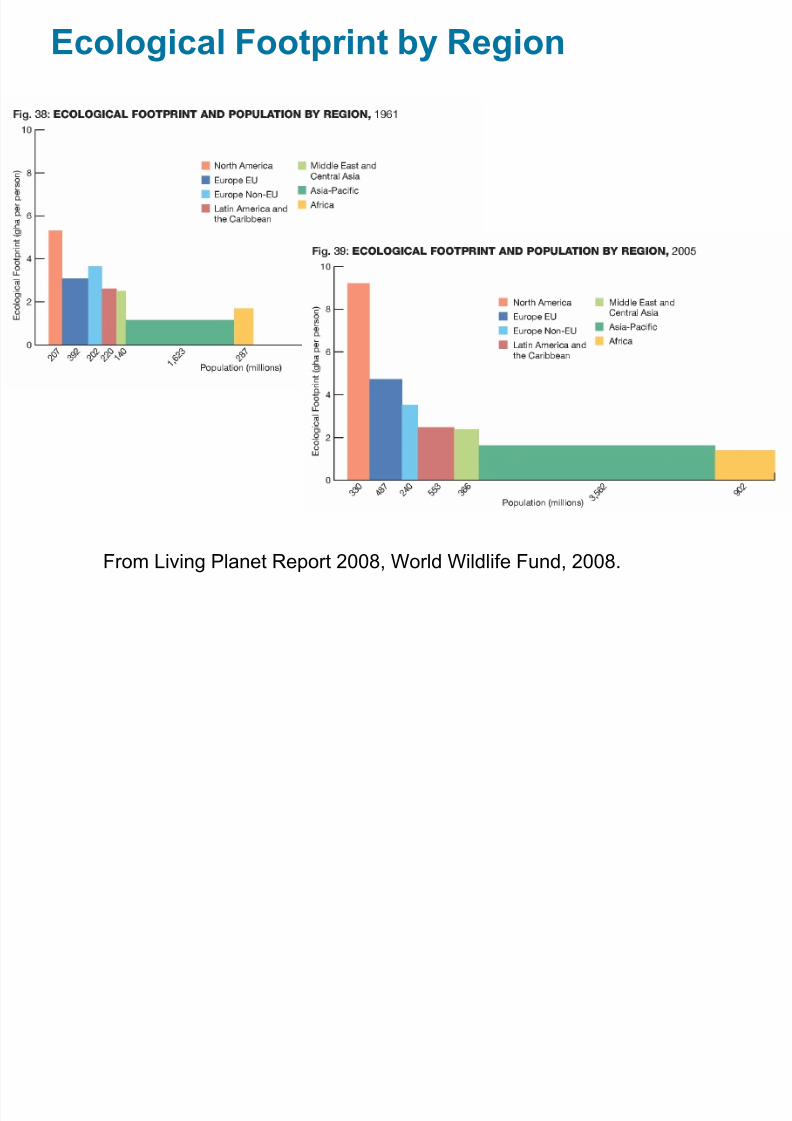
Ecological Footprint by Region
From Living Planet Report 2008, World Wildlife Fund, 2008.
8/10/2019 Bio112-EcologicalFootprint
http://slidepdf.com/reader/full/bio112-ecologicalfootprint 10/44
8/10/2019 Bio112-EcologicalFootprint
http://slidepdf.com/reader/full/bio112-ecologicalfootprint 11/44

8/10/2019 Bio112-EcologicalFootprint
http://slidepdf.com/reader/full/bio112-ecologicalfootprint 12/44
8/10/2019 Bio112-EcologicalFootprint
http://slidepdf.com/reader/full/bio112-ecologicalfootprint 13/44
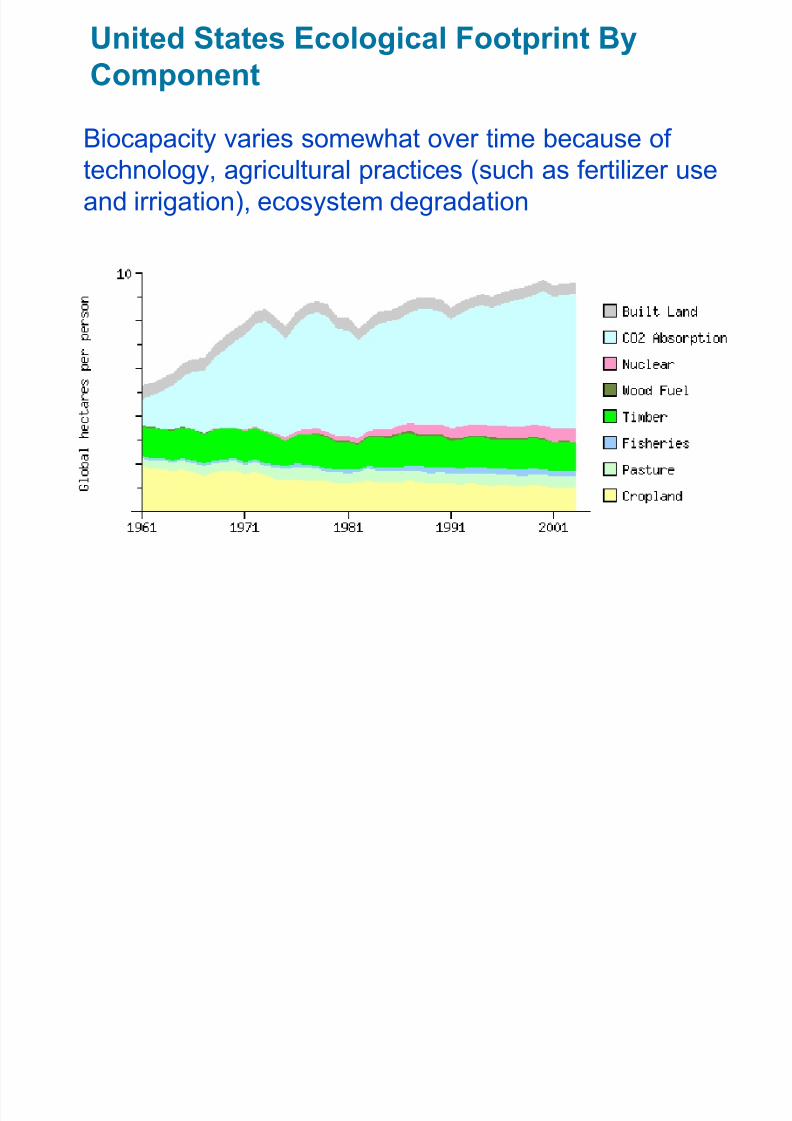
United States Ecological Footprint ByComponent
Biocapacity varies somewhat over time because oftechnology, agricultural practices (such as fertilizer use
and irrigation), ecosystem degradation
8/10/2019 Bio112-EcologicalFootprint
http://slidepdf.com/reader/full/bio112-ecologicalfootprint 14/44
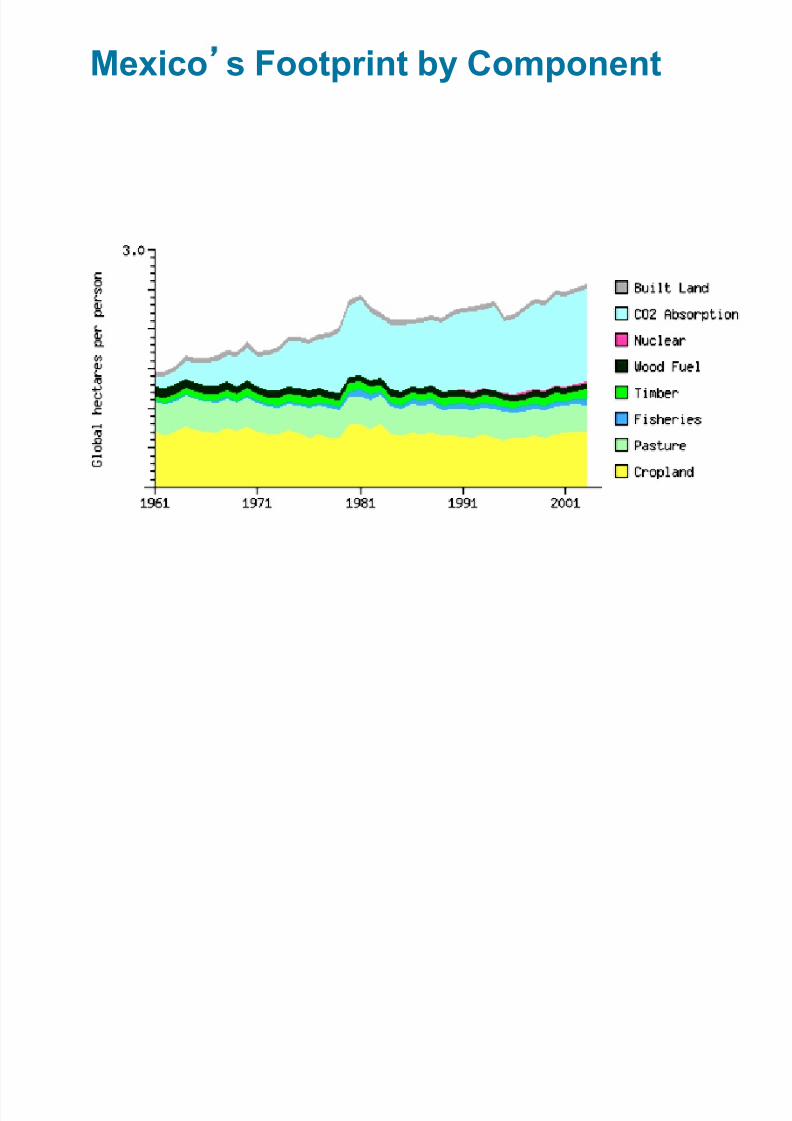
Mexico
s Footprint by Component
8/10/2019 Bio112-EcologicalFootprint
http://slidepdf.com/reader/full/bio112-ecologicalfootprint 15/44
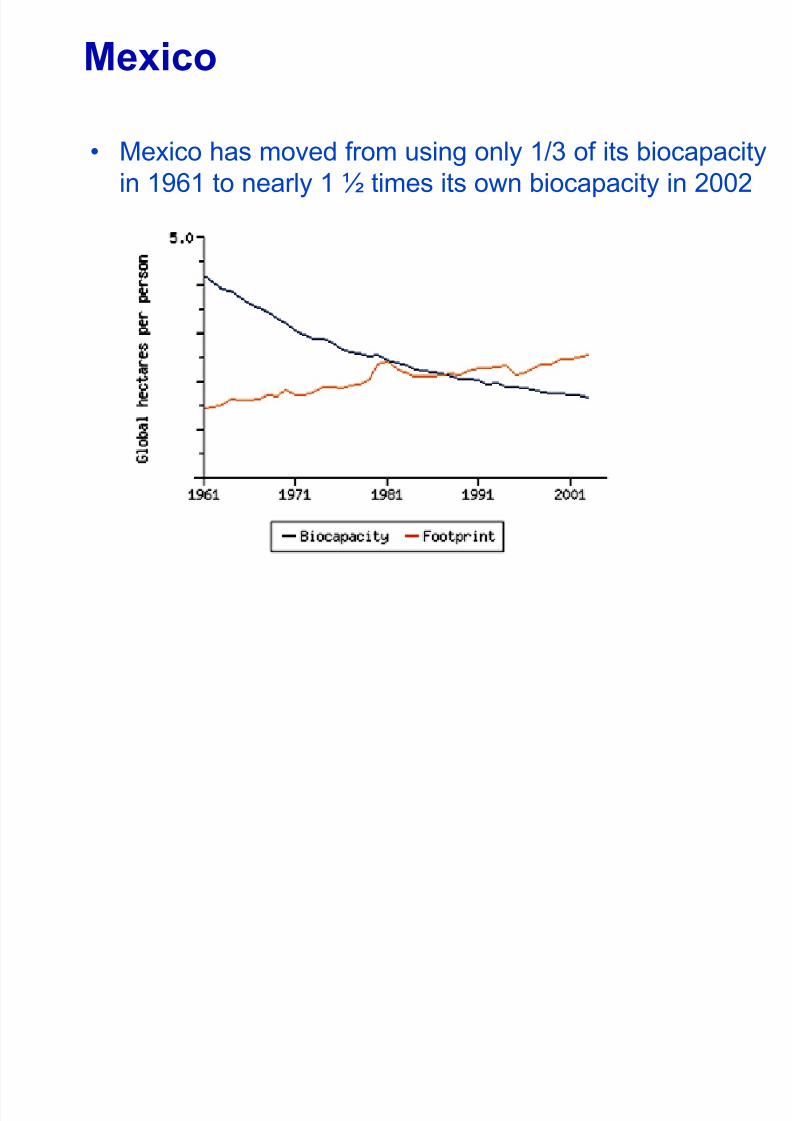
Mexico
• Mexico has moved from using only 1/3 of its biocapacity
in 1961 to nearly 1 ½ times its own biocapacity in 2002

8/10/2019 Bio112-EcologicalFootprint
http://slidepdf.com/reader/full/bio112-ecologicalfootprint 16/44
Calculate your own ecological footprint(Can you realistically reduce your footprint to 1 planet?)
8/10/2019 Bio112-EcologicalFootprint
http://slidepdf.com/reader/full/bio112-ecologicalfootprint 17/44
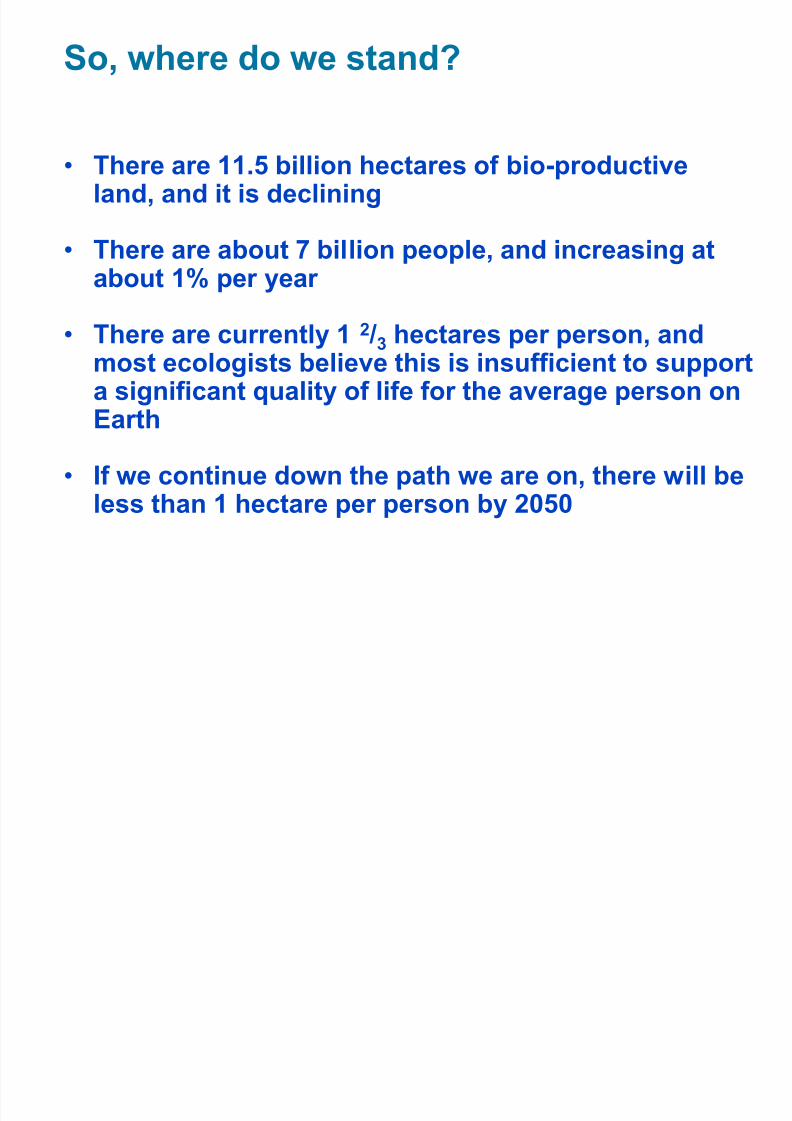
So, where do we stand?
• There are 11.5 billion hectares of bio-productiveland, and it is declining
• There are about 7 billion people, and increasing at
about 1% per year
• There are currently 1 2 /3 hectares per person, andmost ecologists believe this is insufficient to supporta significant quality of life for the average person on
Earth
• If we continue down the path we are on, there will beless than 1 hectare per person by 2050
8/10/2019 Bio112-EcologicalFootprint
http://slidepdf.com/reader/full/bio112-ecologicalfootprint 18/44
8/10/2019 Bio112-EcologicalFootprint
http://slidepdf.com/reader/full/bio112-ecologicalfootprint 19/44
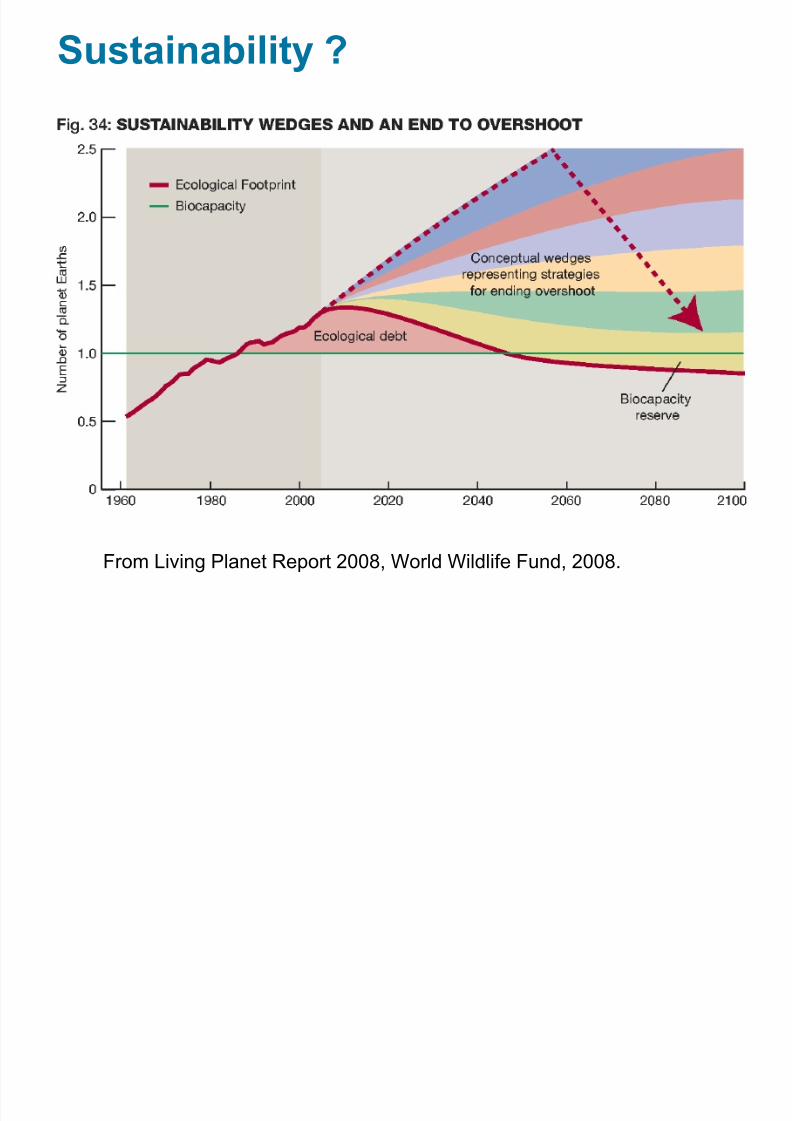
Sustainability ?
From Living Planet Report 2008, World Wildlife Fund, 2008.
8/10/2019 Bio112-EcologicalFootprint
http://slidepdf.com/reader/full/bio112-ecologicalfootprint 20/44
Envisioning Solutions
• Former president Bill Clinton has argued that
combating climate change doesn’t have to mean
economic hardship (Clinton Initiative Topic)
• It could be the biggest development stimulus since
World War II, creating millions of jobs and saving
trillions of dollars in foreign fuel imports
• What are some of the strategies we have available?
9-20
8/10/2019 Bio112-EcologicalFootprint
http://slidepdf.com/reader/full/bio112-ecologicalfootprint 21/44
Controlling Emissions is Cheap
Compared to Climate Change
• A 2010 study by the Pew Trust estimates the cost of lost
ecological services by 2100
• Costs included factors such as lost agricultural
productivity from drought, damage to infrastructure fromflooding and storms, lost biological productivity, health
costs from heat stress, and lost water supplies
•The Pew report found that climate change is likely to cost
between $5 trillion and $90 trillion by 2100
• The Stern Review (2006) estimates a cost of only about 1%
of global GDP to avoid the worst impacts of climate change
8/10/2019 Bio112-EcologicalFootprint
http://slidepdf.com/reader/full/bio112-ecologicalfootprint 22/44
There Are Many Ways We Can Control
Greenhouse Emissions
• We can reduce dependence on coal, which produces
more CO2 per energy unit than any other fuel
• We could institute fees for selling fossil fuels – these wouldhelp fossil fuel prices represent their many hidden costs
• We can invest in new technologies and energy efficiency
• We can institute emissions trading, by instituting a legalcap on emissions, then allowing companies to buy and
sell shares of that total cap (California
s AB-32 does
this)
8/10/2019 Bio112-EcologicalFootprint
http://slidepdf.com/reader/full/bio112-ecologicalfootprint 23/44
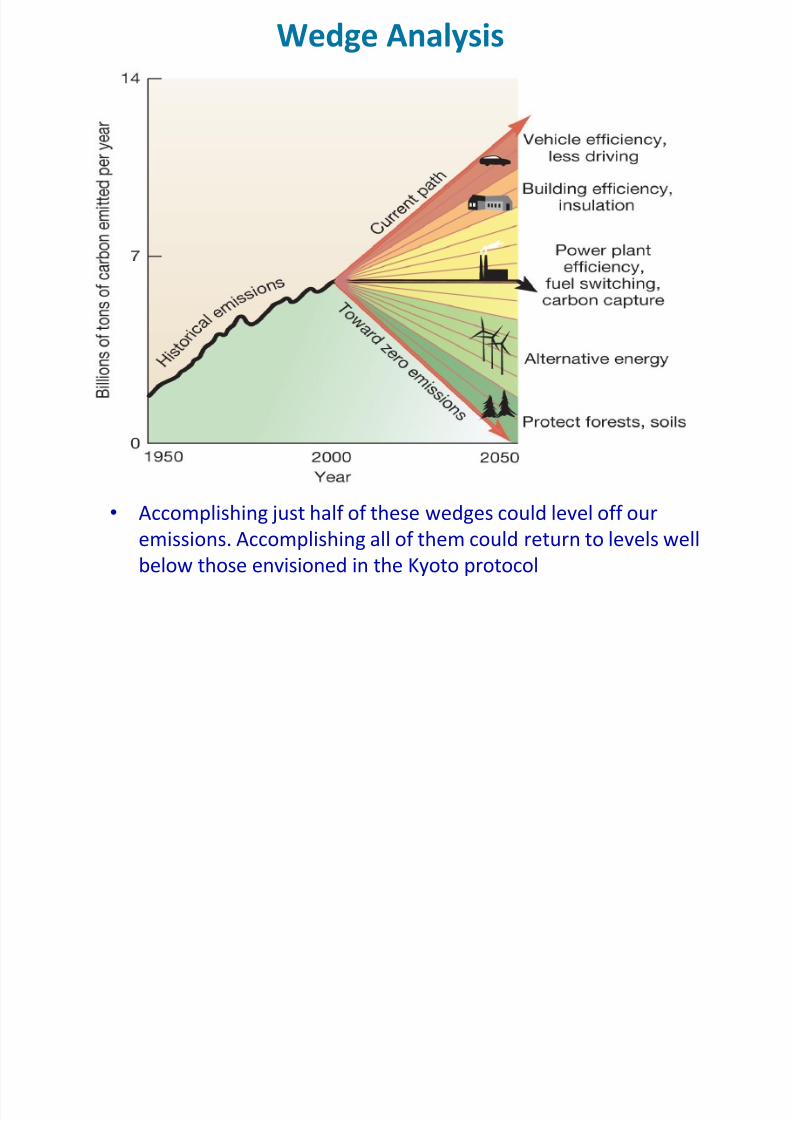
A Wedge Approach Involves Dissecting
the Problem into Stepwise Solutions
• To avoid a doubling of atmospheric CO2 we need to
reduce our annual carbon emissions by about 7
billion tons (=7 gigatons or GT) by 2060• Scientists have divided these emissions into 14
wedges”
, each of which represents 1 GT of
carbon emissions avoided in the year 2060
8/10/2019 Bio112-EcologicalFootprint
http://slidepdf.com/reader/full/bio112-ecologicalfootprint 24/44
Local Initiatives Are Effective
• California has greatly reduced Carbon emisions by
switching all coal burning power plants to natural gas
(decreased CO2 by 30%) & switching to green energy
production• New Zealand Prime Minister Helen Clark pledged that
her country will be the first to be carbon neutral”
• Germany has reduced its CO2 emissions at least 10percent by switching from coal to gas and by
encouraging energy efficiency throughout society
• Denmark now gets 20% of its electricity from windmills
8/10/2019 Bio112-EcologicalFootprint
http://slidepdf.com/reader/full/bio112-ecologicalfootprint 25/44
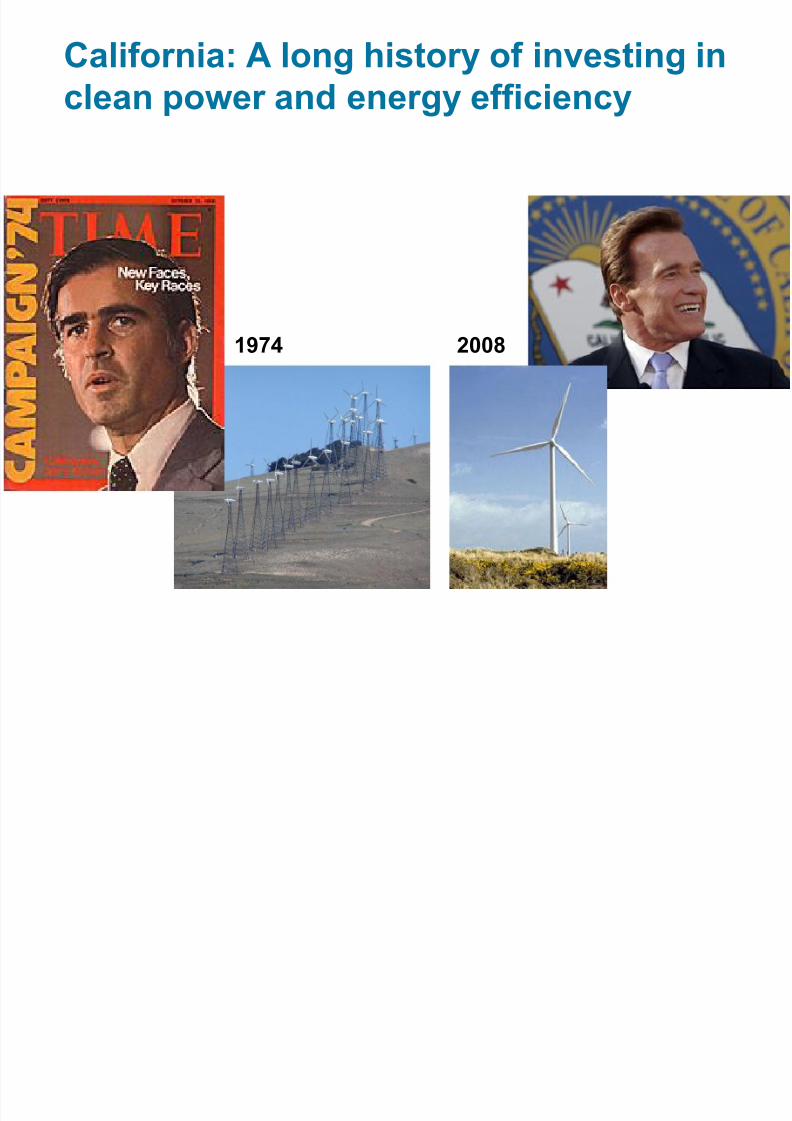
California: A long history of investing inclean power and energy efficiency
1974 2008
8/10/2019 Bio112-EcologicalFootprint
http://slidepdf.com/reader/full/bio112-ecologicalfootprint 26/44
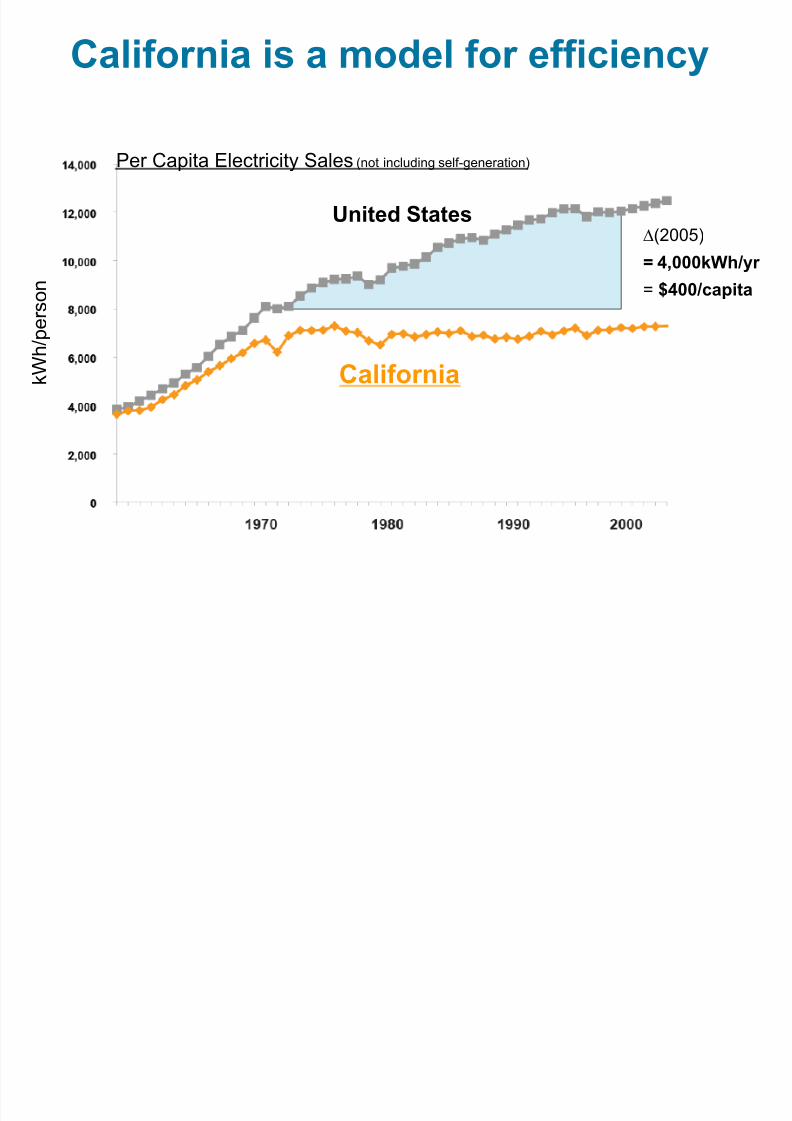
California is a model for efficiency
∆(2005)
= 4,000kWh/yr
= $400/capita
k W h / p e r s o n
United States
California
Per Capita Electricity Sales (not including self-generation)

8/10/2019 Bio112-EcologicalFootprint
http://slidepdf.com/reader/full/bio112-ecologicalfootprint 27/44
Energy Efficiency Strategies
• Flattening out the curve – yesterday – Decouple sales from revenues – eliminate disincentive
– Set and strengthen building and appliance standards
– Invest in utility energy efficiency programs
• Bending the curve downward – tomorrow
– Strengthen incentives – Decoupling Plus”
– Set long term goals to achieve durable, broad-based
reductions
– Enhance strategic planning: work backwards from goals
– Improve branding, messaging and marketing
– Invest in workforce and research and development
8/10/2019 Bio112-EcologicalFootprint
http://slidepdf.com/reader/full/bio112-ecologicalfootprint 28/44
• Accomplishing just half of these wedges could level off our
emissions. Accomplishing all of them could return to levels well
below those envisioned in the Kyoto protocol
Wedge Analysis
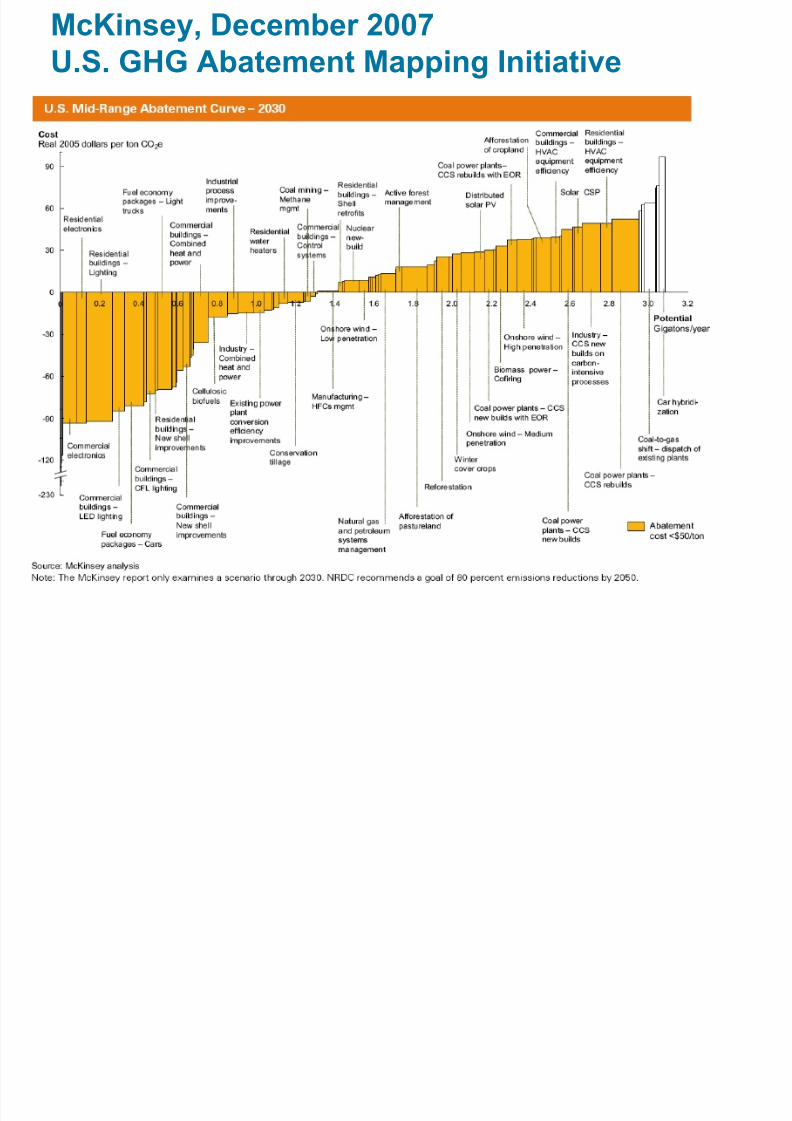
McKinse December 2007
8/10/2019 Bio112-EcologicalFootprint
http://slidepdf.com/reader/full/bio112-ecologicalfootprint 29/44
McKinsey, December 2007U.S. GHG Abatement Mapping Initiative
22 S C C

8/10/2019 Bio112-EcologicalFootprint
http://slidepdf.com/reader/full/bio112-ecologicalfootprint 30/44
22 States Committed to Regional CarbonMarkets (w/ an additional 8 observing
”
)
Source:
Pew Center

8/10/2019 Bio112-EcologicalFootprint
http://slidepdf.com/reader/full/bio112-ecologicalfootprint 31/44
Products and the Environment
• At first glance,the relationshipbetween products& our environment
may seem clear,
BUT….
8/10/2019 Bio112-EcologicalFootprint
http://slidepdf.com/reader/full/bio112-ecologicalfootprint 32/44
Let
s consider the simple French fry
• What are itsconnects to the
environment?
• What impact does ithave?
8/10/2019 Bio112-EcologicalFootprint
http://slidepdf.com/reader/full/bio112-ecologicalfootprint 33/44
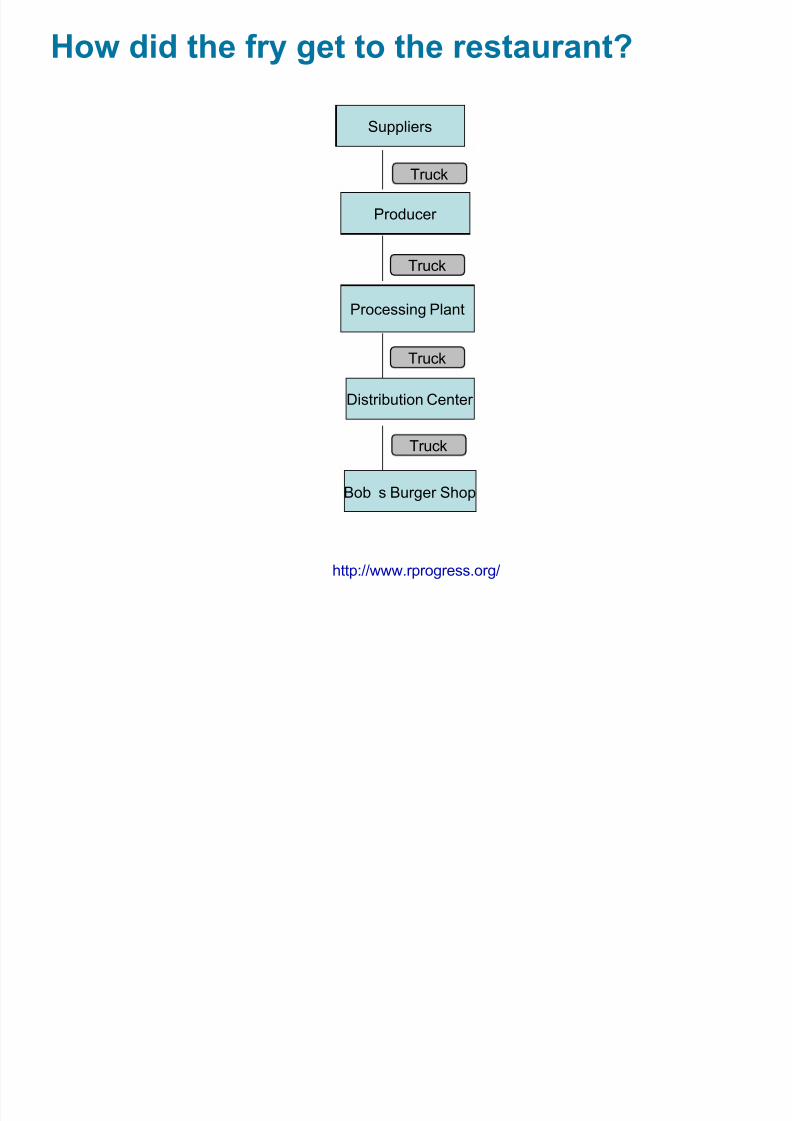
How did the fry get to the restaurant?
Producer
Distribution Center
Processing Plant
Suppliers
Bob’s Burger Shop
Truck
Truck
Truck
Truck
http://www.rprogress.org/

8/10/2019 Bio112-EcologicalFootprint
http://slidepdf.com/reader/full/bio112-ecologicalfootprint 34/44
What impact did its journey have?
Producer
Distribution Center
Processing Plant
Suppliers
Bob’s Burger Shop
Truck
Truck
Truck
Truck
Fossil Fuels
Fossil Fuels
Freezer
Fertilizers
Pesticides
Machinery
Hydropower
Fossil Fuels
Machinery
Fossil Fuels
Packaging
Hydroflourocarbons
Irrigation
Hydropower
Freezer
Food waste
Machinery
Fossil Fuels
Fossil Fuels
Fossil Fuels
Hydroelectric dam
Fossil Fuels
Animal Feed
Irrigation
Seeds
http://www.rprogress.org/
8/10/2019 Bio112-EcologicalFootprint
http://slidepdf.com/reader/full/bio112-ecologicalfootprint 35/44
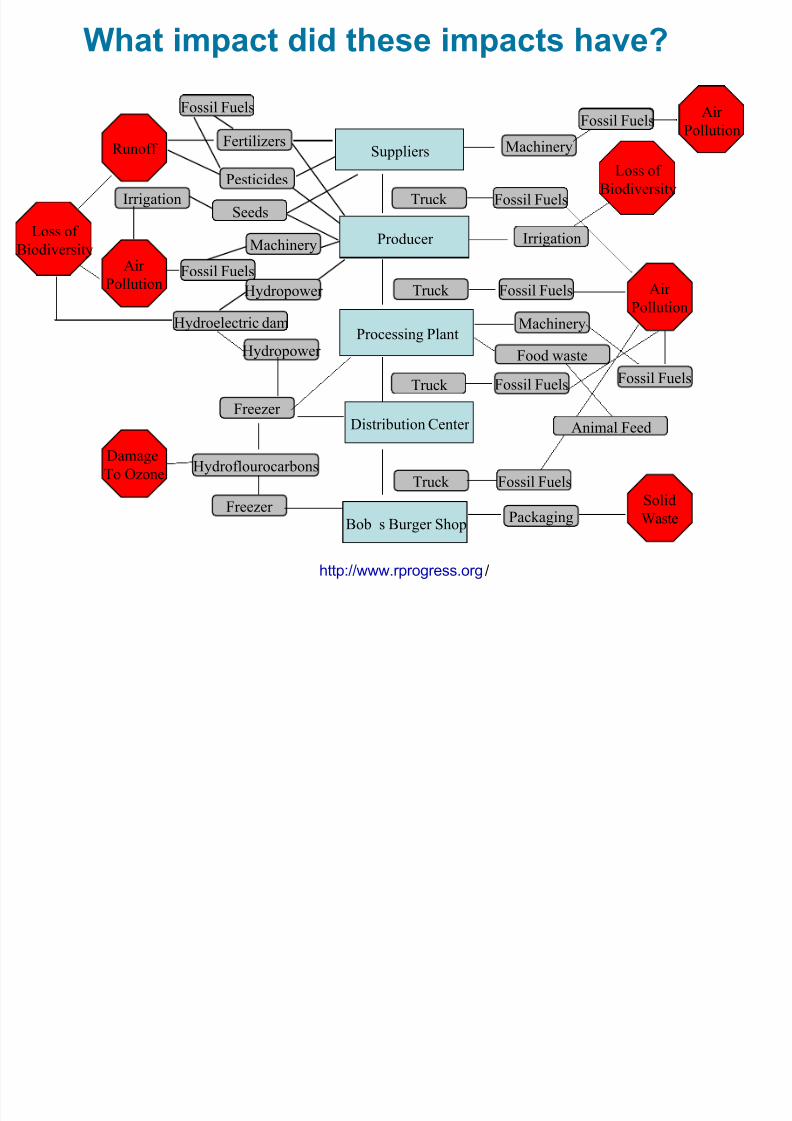
What impact did these impacts have?
Runoff
Air
Pollution
Solid
Waste
Air
Pollution Fossil Fuels
Fossil Fuels
Freezer
Fertilizers
Pesticides
Truck
Truck
Machinery
Hydropower
Truck
Fossil Fuels
Machinery
Fossil Fuels
Damage
To Ozone
Packaging
Hydroflourocarbons
Irrigation
Hydropower
Freezer
Food waste
Machinery Producer
Distribution Center
Processing Plant
Suppliers
Fossil Fuels
Fossil Fuels
Fossil Fuels
Truck
Hydroelectric dam
Loss of
Biodiversity
Fossil Fuels
Animal Feed
Loss of
BiodiversityIrrigation
Seeds
Fossil Fuels
Bob’s Burger Shop
Air
Pollution
http://www.rprogress.org/
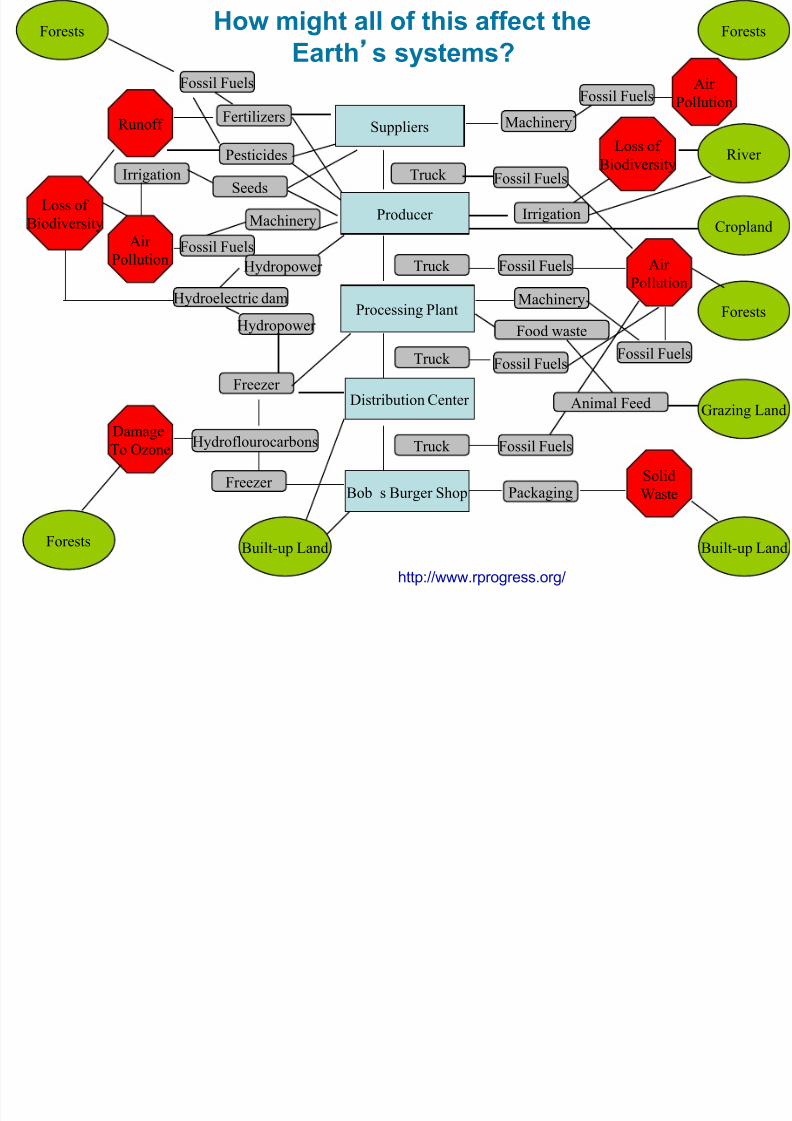
How might all of this affect the
8/10/2019 Bio112-EcologicalFootprint
http://slidepdf.com/reader/full/bio112-ecologicalfootprint 36/44
How might all of this affect theEarth
s systems?
Runoff
Air
Pollution
Solid
Waste
Air
Pollution Fossil Fuels
Fossil Fuels
Freezer
Fertilizers
Pesticides
Truck
Truck
Machinery
Hydropower
Truck
Fossil Fuels
Machinery
Fossil Fuels
Damage
To Ozone
Packaging
Hydroflourocarbons
Forests
Irrigation
Forests Built-up Land
Grazing Land
Forests
River
Cropland
Hydropower
Freezer
Food waste
Machinery Producer
Distribution Center
Processing Plant
Suppliers
Bob’s Burger Shop
Fossil Fuels
Fossil Fuels
Fossil Fuels
Truck
Hydroelectric dam
Loss ofBiodiversity
Fossil Fuels
Built-up Land
Animal Feed
Loss of
BiodiversityIrrigation
Seeds
Air
Pollution
Forests
http://www.rprogress.org/
8/10/2019 Bio112-EcologicalFootprint
http://slidepdf.com/reader/full/bio112-ecologicalfootprint 37/44
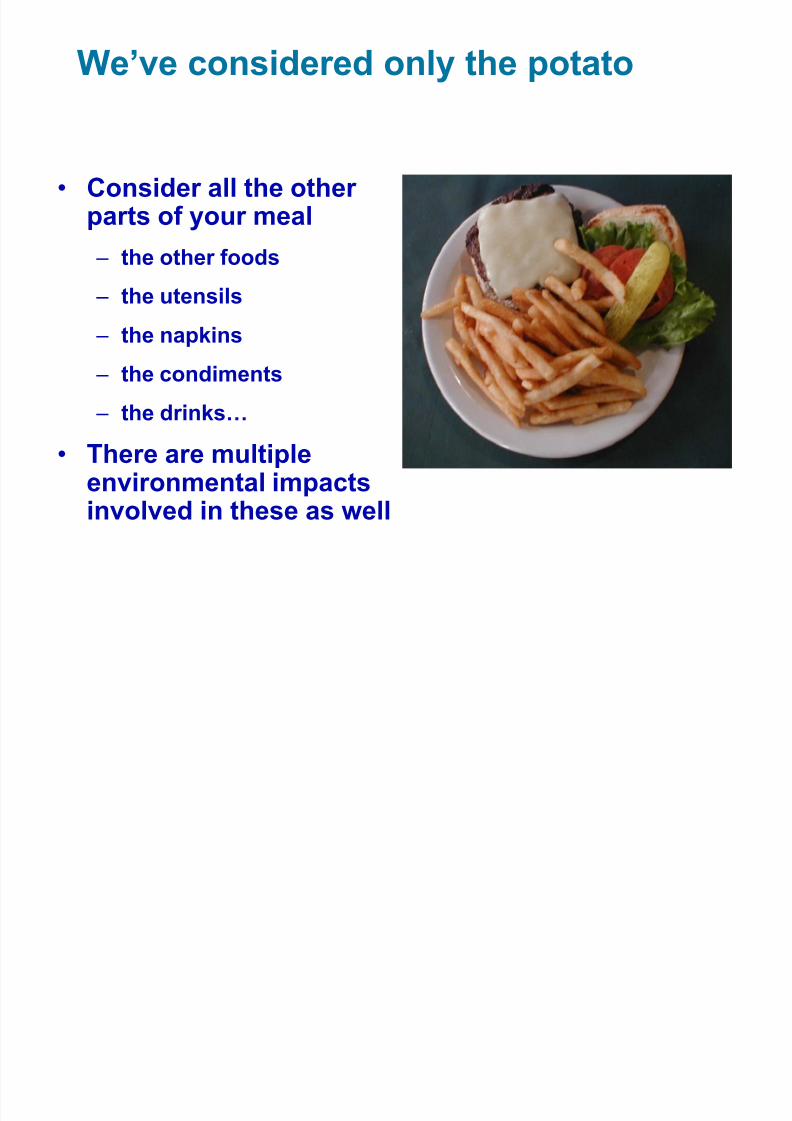
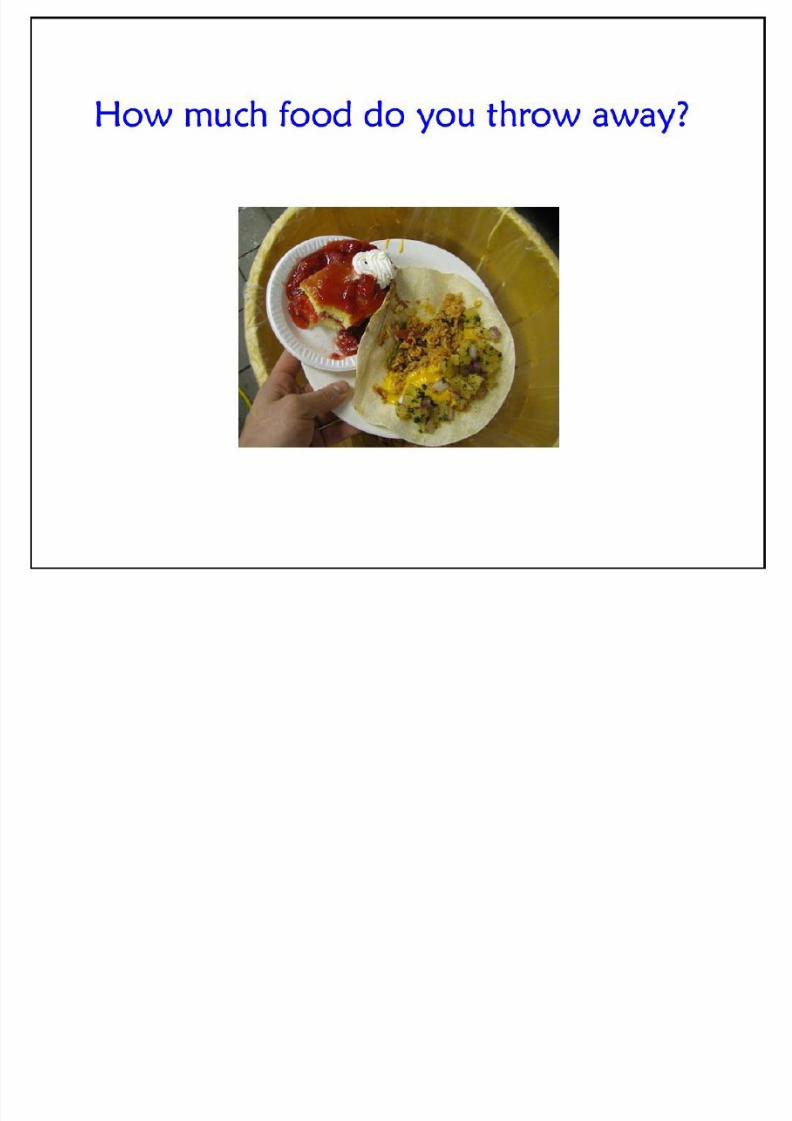
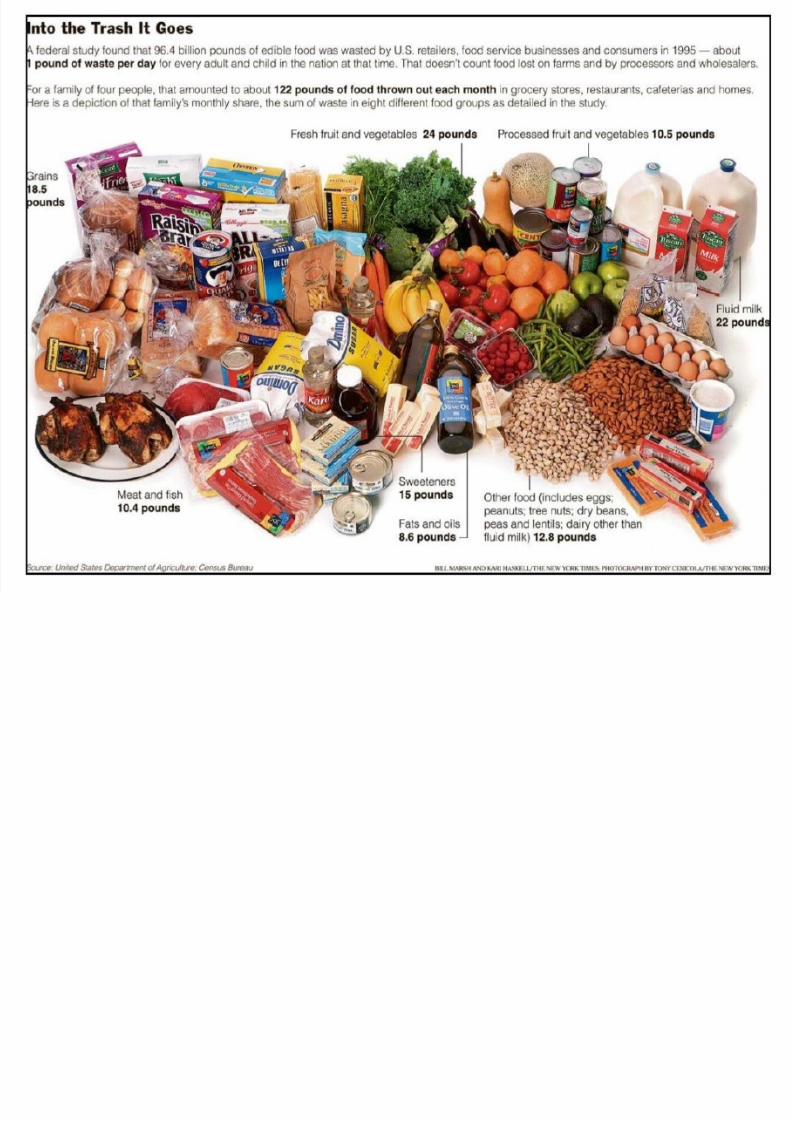
We’ve considered only the potato
• Consider all the otherparts of your meal
– the other foods
– the utensils
– the napkins
– the condiments
– the drinks… • There are multiple
environmental impactsinvolved in these as well
8/10/2019 Bio112-EcologicalFootprint
http://slidepdf.com/reader/full/bio112-ecologicalfootprint 38/44
8/10/2019 Bio112-EcologicalFootprint
http://slidepdf.com/reader/full/bio112-ecologicalfootprint 39/44

8/10/2019 Bio112-EcologicalFootprint
http://slidepdf.com/reader/full/bio112-ecologicalfootprint 40/44

8/10/2019 Bio112-EcologicalFootprint
http://slidepdf.com/reader/full/bio112-ecologicalfootprint 41/44
8/10/2019 Bio112-EcologicalFootprint
http://slidepdf.com/reader/full/bio112-ecologicalfootprint 42/44
8/10/2019 Bio112-EcologicalFootprint
http://slidepdf.com/reader/full/bio112-ecologicalfootprint 43/44
8/10/2019 Bio112-EcologicalFootprint
http://slidepdf.com/reader/full/bio112-ecologicalfootprint 44/44


