Embed Size (px)
Citation preview

Pessimism Preserved:
Real Wages in the British Industrial Revolution
By
Robert C. Allen
Nuffield CollegeNew Road
Oxford OX1 1NF
email: [email protected]
Abstract
The paper compares Feinstein’s and Clark’s consumer price and real wage indices for theBritish industrial revolution. The sources for their weights and component price series areevaluated. While some of Clark’s innovations are improvements, many of his changesdegrade the price index. A new price index is developed using the best components ofClark’s and Feinstein’s. This index is much closer to Feinstein’s than to Clark’s. Theimplied growth in real wages is also close to Feinstein’s and contradicts Clark’s ‘optimistic’view of rising working class living standards during the industrial revolution.
Oxford University Department of Economics Working Paper 314
2007

1Clark (2001) has also proposed a new consumer price index and real wage index forfarm workers. It suffers from some of the same problems as the JPE index, in particular, thesubstitution of wheat prices for bread prices before 1816.
The standard of living of British workers during the industrial revolution is one of thegreat questions of economic history. There have been many attempts to measure the trend inreal wages. Lindert and Williamson (1983) was a turning point, for they were the first to treatthe problem comprehensively with the tools of modern economics. They derived an economywide nominal wage index and computed a cost of living index based on worker’s budgetshares and corresponding prices. They supported the ‘optimistic view’ that real wages roserapidly after Waterloo. Optimism was always controversial, however, and Feinstein’s‘Pessimism Perpetuated’ (1998) swung the balance in the opposite direction with his(surprisingly optimistic!) conclusion that the average real wage rose by about 30% between1780 and 1850. The ‘pessimism’ of the title was warranted, however, since real wagegrowth equalled only half of the increase in output per worker over the same period (62%)and occurred entirely post-1830 with the preceding fifty years exhibiting real wagestagnation. Allen’s (2001) comparison of British and continental living standardscorroborated this conclusion by applying a different weighting scheme to many of the sameprice series. Recently, however, Clark (2005) has argued that real wages grew much morerapidly than Feinstein and Allen thought.1 He has brought new prices sources and methods tobear on the problem, so his conclusion deserves careful consideration. The purpose of thispaper is to review the data and methods used in these inquiries in order to compute the bestpossible real wage index with the evidence currently at hand. Despite incorporating much ofClark’s new material, the result confirms Feinstein’s picture of real wage trends between 1770 and 1860. Pessimism is preserved.
A frequent question in economic history is how to measure the standard of living. In atime of rising prices like the Napoleonic Wars, for instance, the historian wants to knowwhether wages also rose enough to allow workers to live as well as they did before. Thequestion is answered by computing the’ real wage’ which is the ratio of the money wage tothe consumer price index. If money wages rose faster than prices, then workers pulled aheadof inflation and the real wage, by this definition, was also rising. The first step in any realwage inquiry is to measure the course of money wages. In this respect, there is consensusbetween Lindert, Williamson, Feinstein and later writers. All of the differences amongFeinstein, Clark, and Allen come down to differences in the price index. This paper will,therefore, concentrate on the cpi and accept Feinstein’s nominal wage series for real wagecalculations.
Measuring the rate of inflation raises index number problems that recur in many areasin economic history. Measurement is an issue because consumers buy many things, and theirprices inflate at different rates. These differences must be collapsed into ‘the’ rate ofinflation. There are three aspects to this problem–measuring the prices of the various goods and services that consumers bought, choosing the appropriate formula to aggregate theseprices, and choosing the weights to use in that formula. All of these questions require goodinformation. Choosing the index number formula also involves making assumptions aboutthe view point from which prices are aggregated. The same or analogous problems arise inmeasuring the rate of economic growth during the industrial revolution or in combininginputs in order to measure total factor productivity.
The first step in this research was to assemble a data base of prices in order toreplicate both Clark’s and Feinstein’s calculations. With that information in hand, one can

2
2I have not located the appendices referred to in Feinstein (1998), and the discussionof sources in the printed text is limited. However, Feinstein (1995, pp. 35-6) gives completesources for an earlier version of the index. I rely on that. Comparison of the two paperssuggests that the sources of much of the index remained the same. It should be noted that Icould not reconstruct one of Feinstein’s series, namely, sugar. Feinstein (1995, p. 36) givesthe source for 1780-1805 as GRS, series 42. However, series 42 in Gayer, Rostow, andSchwartz is not the price of sugar, and the sugar price series they give only starts in 1790. Ihave, instead, used the price of powder or Lisbon sugar purchased by the Lord Steward’sDepartment (Beveridge 1965, pp. 430-1) for the period 1780-1850 extended by the series thatFeinstein cities for the remainder of the period. This price series moves very closely toClark’s.
3Greg Clark has provided me with a spreadsheet with anual prices series for manycommodities, for which I am grateful.
then see why they reached different conclusions.Feinstein’s data base had to be assembled from his data descriptions.2 Feinstein’s
descriptions are detailed, but it is not always clear how he combined information frommultiple sources. Fesinstein’s data derive largely from so-called ‘institutional’ sources–thepurchase accounts of hospitals, colleges, and government departments. There has alwaysbeen some concern that these prices differ from the retail prices paid by ordinary consumers(Ashton 1949). Nevertheless, the series that I have put together based on Feinstein’sdescriptions provide a very accurate reconstruction of his price index.
Clark’s work is based on a vast number of data points: “90,000 quotes of the prices of49 commodities, and 20,000 quotes of housing rents” (Clark 2005, p. 1321). The housingrents are new information derived from returns made by English charities to the CharityCommission detailing their property and its value (Clark 2002b). Some of the 90,000 pricesrepresent new information compiled from sources like church wardens’ accounts, but most ofthese data are recycled from standard institutional sources. Clark’s treatment of thisinformation is novel, however. Instead of choosing representative series and splicing themtogether to form a grand series running from 1209 to 2004, Clark regressed the price of eachkind of commodity onto dummy variables representing time periods, location, units ofmeasurement, and various product types. The coefficients of the time dummies became hisprice series for the good.3 Clark published ten year averages of the subindices of his cpi. Hehas not yet provided me with annual series of the subindices. However, the average valueover ten year intervals of his cpi is very closely approximated by substituting the ten yearaverages of the component indices, and that information provides a platform for the analysis.
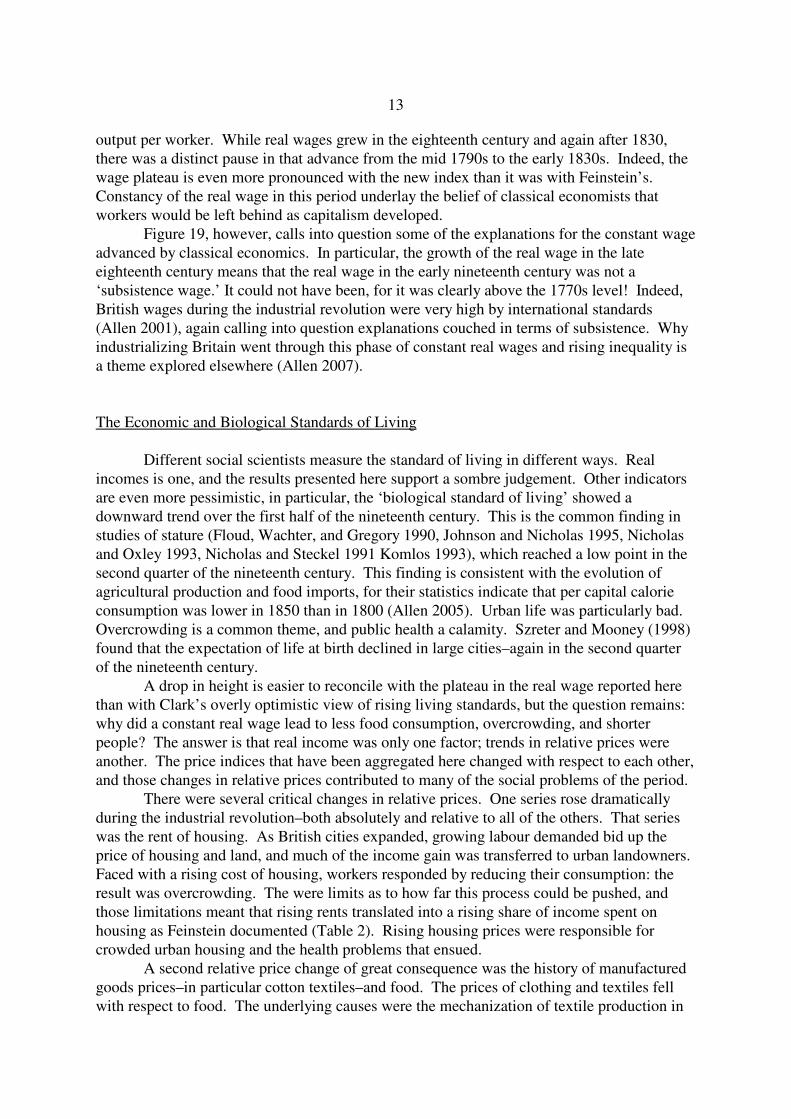
The first question to ask is: Why do Feinstein and Clark differ? There are threepossibilities. The first is the formula used. In the present case, the alternatives include aLaspeyres index with spending shares specified (Feinstein), a Laspeyres index with quantitiesof goods specified (Allen), and a geometric index with shares specified (Clark). Theseformula differences were not important; i.e. a geometric index using Feinstein’s shares differsonly a little from his Laspeyres index. The second possible difference is in the weights, andthe third is in the price series that are being aggregated. Figure 1 throws some light on theirimportance, for it includes Clark’s and Feinstein’s price indices plus a geometric index usingClark’s prices and Feinstein’s weights. Clark’s price index is the highest in the 1770s and

3
Feinstein’s is the lowest. The newly computed index is roughly midway between the two. This shows that differences in weights and in prices played roughly equal roles in explainingthe difference between the two price indices.
It is tempting to push this procedure further and identify exactly which prices accountfor the difference between Clark and Feinstein. The most important issue is the change in theprice level between the 1770s and the 1860s, for that determines the long run rise in themeasured real wage. Table 1 gives an overview of the differences between Feinstein’s andClark’s price indices for this period. The table shows average values for the 1770s of indexnumbers computed with various price series. In all cases, the corresponding averages for the1860s are 1.00. At the bottom of the table is Feinstein’s index (recalculated from thesubindices he reports). This stood at 0.685; in other words, Feinstein’s figures indicate thatthe price level in the 1770s was 68.5% of its value in the 1860s. Next above this is thegeometric version of the Feinstein index using my reconstructions of his price series. Thisstood at .697 in the 1770s. The increase reflects the shift from a linear to a geometric formulaand any differences in the price series aggregated. The top two lines of the table show twoversions of Clark’s index. .779 is my recalculation of his index from the subindices hepublished. .787 is the corresponding value when his category of ‘drink’ is disaggregated into‘beer’ and ‘tea’ and the index recalculated using his price series for these commodities. It isnot evident why this recalculation changes the index as much as it does. The most importantpoint is that Clark’s indices show less inflation between the 1770s and the 1860s that doFeinstein’s. With Clark’s calculations, it was easier to ‘stay ahead of inflation,’ which is whyhe concluded that real wages rose faster than Feinstein found.
The entries in the middle of Table 1 show the effect of shifting from Feinstein’s priceseries to Clark’s. Begin with the geometric version of Feinstein’s index recalculated with myreconstructions of his price series (.697). If the index is recalculated using Clark’s index forgrain and potatoes instead of Feinstein’s series for bread and potatoes, the value of the indexin the 1770s rises to .727 and is marked in Table 1 as ‘grain & potatoes’. This change issubstantial compared to the difference between the Feinstein and the Clark cpi’s. IfFeinstein’s cheese, milk, and butter series are replaced with Clark’s ‘dairy’ series, the cpirises to .739 and is labelled ‘dairy.’ The effects are cumulated in Table 1, so the value .739includes the effect of changing both the ‘grain and potatoes’ and the ‘diary’ series. Continuing up the arrow on the left shows the effect of replacing more and more ofFeinstein’s series with Clark’s. Evidently, the fuel series has a large impact on the result,while the light, meat, sugar, and rent have negligible or only small effects.
All of these substitutions discussed so far have the effect of raising the value of the cpiin the 1770s, and, indeed, their effect, by itself, is enough to turn Feinstein’s index intoClark’s. However, the arithmetic is more complicated because some of Clark’s series inflatemore rapidly than Feinstein’s and, therefore, lower the measured rate of inflation. Thedownward arrow tracks these substitutions. Clearly, the use of Clark’s beer or clothing seriespushes the average value of the consumer price index back to about .73 in the 1770s. Thisvalue is about midway between Clark’s and Feinstein’s indices for the period and shows thatthe total effect of all of the substitutions of price series accounts for about half of thedifference between Clark and Feinstein. Most of the rest is account for by differences inweights as indicated in Figure 1.
Table 1 adds two things to Figure 1. First, it shows which prices played an importantrole in generating differences in measured inflation rates and which ones were unimportant. Clearly, the most important series were grain & potatoes, dairy, fuel, beer, and clothing.

4
Lighting and meat played minor roles, while differences between Feinstein and Clark in themeasurement of tea and sugar prices were of negligible consequence. Second, the properquestion is not whether Feinstein’s index or Clark’s index is best. Something can be learnedfrom each. The important question is which individual price series should be combined to getthe most reliable measure of inflation during the industrial revolution. Answering thisquestion requires close attention to the commodities involved and the use of as muchcollateral evidence as possible. Most of this paper is concerned with that inquiry. However,Table 1 summarizes the results by putting a (C) or an (F) after each commodity to indicatewhose series is preferred. The designations ‘Allen’, ‘porter,’ and ‘Tucker’ point to otherseries that are substantially similar to the Clark or Feinstein series indicated and which aremore explicitly founded on experience.
The remainder of the paper will consider the evidence relating to weights and then toprices. Finally, a new consumer price index will be presented that incorporates the bestweights and series currently available.
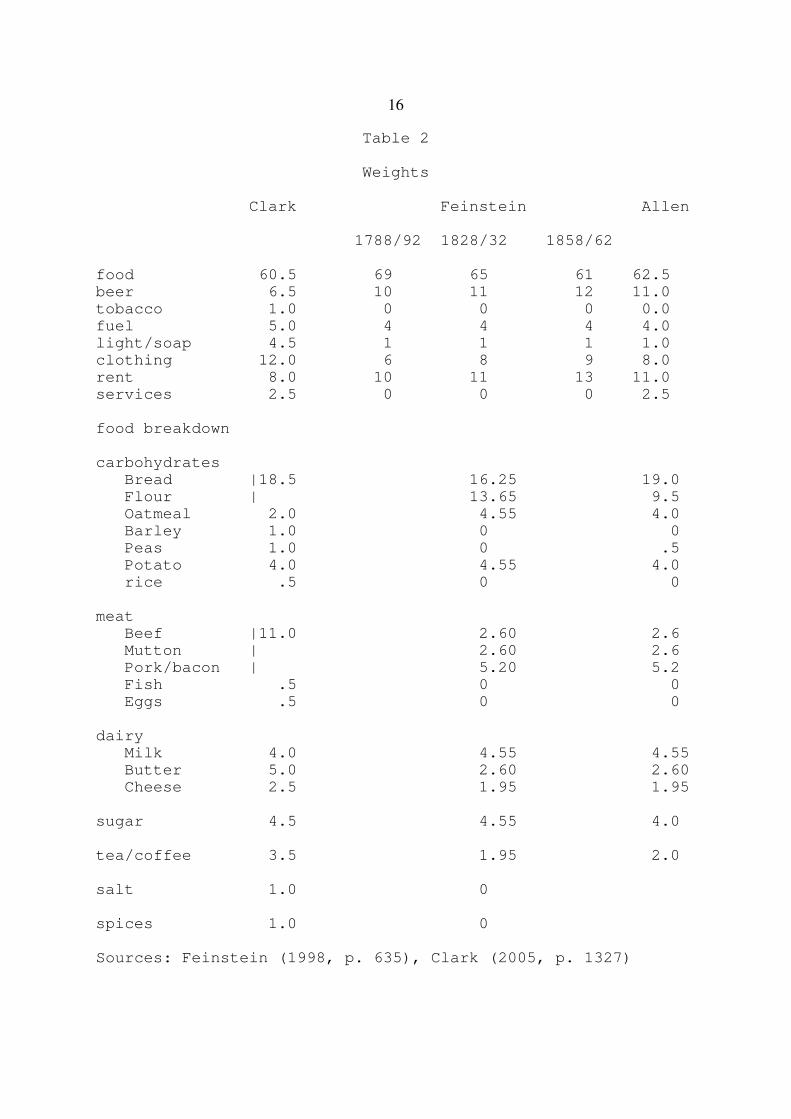
WeightsBefore considering price series, I will consider weights (Table 2). Clark uses one set
of weights for his index, while Feinstein shifts between three sets as the industrial revolutionprogresses. These shifts on Feinstein’s part do not look very consequential, however, sincehis cpi can be replicated very closely simply using the weights for the midperiod. I willconcentrate on the differences between those weights and Clark’s.
The most striking difference between Clark’s and Feinstein’s weights is the share ofspending on carbohydrates (bread, flour, oatmeal, potatoes), which Clark puts at 27% andFeinstein at 39%. Most of this difference of 12 percentage points comes down to bread andflour: Clark gives them a share of 18.5%, while Feinstein puts them at 29.9%. The remainderof the carbohydrate category consists of oatmeal, potatoes, peas, and rice, and the differencesin the way Clark and Feinstein treat these items is of no great consequence. So the firstquestion about weights concerns the share of bread and flour–Should it be closer to 19%(Clark) or 30% (Feinstein)?
The second issue about weights concerns the non-carbohydrates. Since Feinstein putsmore weight on carbohydrates, he must put less on other categories of spending. Thedifference in the share of carbohydrates is largely accounted for by Clark’s putting muchgreater weight (10%) than Feinstein (1%) on salt, spices, lighting, soap, services, and tobacco. Which is preferable?
I begin with the first question: the share of spending on carbohydrates. Clark deriveshis weight of 27% through an unsatisfactory combination of sources. In his Table A3, Clarkpresents three sets of weights implied by contemporary sources, and 27% is the average of12.5% (taken from Vanderlint 1734, pp. 76-7), and 37.8% (for 1787-96) and 29.7% (1840-54). The later two figures are worthy of consideration since they are derived from Horrell’s(1996, pp. 568-9, 577) analysis of family budget surveys from the period (although how Clarkgot these figures from Horrell’s tables is not explained). Vanderlint’s figure, however, ispatently too low and is not evidence at all: It is a figure constructed by Vanderlint in afanciful calculation deployed in a polemic about the importance of Britain’s domestic market. Vanderlint concocted an annual budget that he claimed characterized 7/8ths of the Britishpopulation. This is not remotely accurate since the annual income that Vanderlint gives his‘typical’ labouring family (£54 -10 s - 4 d) exceeded the household income of 86% of theEnglish population according to Gregory King’s social table of 1688. Indeed, the poorest half
5
4For consistency with the rest of the study, I have replaced Deane and Cole’s estimatesof average annual earnings with values obtained by extrapolating Deane & Cole’s 1851 valuefor average annual earnings back to 1801 using Feinstein’s index of nominal earnings.
5The trend lines are calculated from production estimates and imports for 1750, 1800,and 1850 developed in Allen (2005). These calculations are refinements of Holderness(1989).
of the population lived on an average annual household income of only £10 - 10 s (Deane1979, pp. 6-7). Overstating income this drastically implied that Vanderlint’s ‘average’ familyspent a great deal of money on British manufactures (the point of his pamphlet) but, by thesame token, led to an understatement of the true proportion spent on bread. The frivolouscharacter of the budget can also be seen from his comments that the annual cost of ‘Repairs ofHousehold-Goods’ was “guess’d, to make the Pence even”. The cost of women’s clothingwas “guess’d at” as was the cost of men’s. Vanderlint’s budget is not a serious source ofinformation regarding consumer spending and averaging its figures with some potentiallyreliable data simply biases down the answer.
Unfortunately, it is not enough simply to leave out Vanderlint’s figure and useaverages from late eighteenth and nineteenth century surveys of working class spending. While these surveys provide valuable information, none of them “can be accepted exactly asthey stand. Some items, notably expenditure on drink and clothing, are omitted or greatlyunderstated, and Horrell’s sample is not sufficiently representative of the main urban centresto provide a reliable figure for the share of rent.” (Feinstein 1998, p 635 n 33) Extraneousinformation must be used for these estimates. In general, it is important to work out themacro implications of spending shares and examine whether they are consistent with theoverall supply of the goods in question. This is not an exact exercise, but it does haveimportant implications for the weights.
We can perform this exercise for bread and flour by multiplying their spending sharesby an up-dated version of Deane and Cole’s (1969, pp. 143, 152) economy-wide wage bill. This ‘wage bill’ equals Deane and Cole’s estimate of the occupied population multiplied bythe average earnings of manual workers4. Multiplying the wage bill by the spending sharesgives total spending on bread and flour. Implicit in this calculation is the assumption that theincome elasticity of demand for bread and flour was zero at incomes above the earnings of theaverage manual worker. That assumption was true for these items according to MacKenzie(1921), who reconciled economy-wide food availability with the spending patterns of thevarious quartiles of the income distribution. For many items, however, middle and upperclass consumption per head exceeded that of the working class, in which case, this procedurewould understate demand.
Following Feinstein (1998, p. 635), I divide the spending on bread and flour betweenthe two in a 2:1 ratio. I assume that the flour was used for home-baked bread. Dividingspending on bread by its price gives total bread consumption from which one can calculatethe required volume of wheat, and similarly for flour. Figure 2 plots implied wheatconsumption using Clark’s spending share on bread and flour (18.5%) and the trend line ofavailable wheat supply (production plus net imports)5. These estimates are lower than thoseof other writers (eg Brunt nd). Clark’s estimates of wheat demand are very much lower thanthe trend line. Feinstein’s shares, on the other hand, imply excessive levels of demand, at
6
6The main use of salt was for homemade bread. Batchelor (1808 , p.74) gives arecipe, which implies that spending on salt for this purpose often amounted to less than 0.1%of the Deane & Cole style wage bill.
least for the eighteenth century. Taking a wheat bread and flour share of 28.5%, slightly lessthan Feinstein’s, implies fairly plausible results for most of the period as shown in Figure 2. This is the value used in the new index proposed here.
We can do analogous calculations with other food expenditures. These calculationsprovide only a weak test of the assumptions since the income elasticities of noncarbohydrateswere greater than one according to Mackenzie (1921). In the event, implied food demandfalls short of food availability.
The calculations of food demand highlight an important time trend in food shares. AsFigure 2 indicates, implied demand rose above food availability at the end of the period. Theonly way to reconcile the demand calculation with the agricultural production and trade datais to reduce the share spent on bread starting in the 1840s. A similar discrepancy occurs withall of the foods. It is noteworthy that Feinstein did reduce his food share in this period (Table2), and the change is warranted by the aggregate calculations.
The upshot of these considerations is to accept a modified version of Feinstein’sspending shares. Average shares are used throughout, a procedure that can be rationalized onthe assumption that spending shares changed in response to price changes in a pattern that canbe summarized by a translog expenditure function. I use a share of spending on wheat breadand flour (28.5%) that is somewhat less than Feinstein’s and ten percentage points aboveClark’s. He gave salt, spices, and tobacco each a one percent share in spending, but there islittle evidence to support these assignments6, and I have set them to zero. I also followFeinstein in setting the expenditure share on lighting at a smaller value than Clark. He iscorrect, however, that workers spent some money on services (midwives, funerals, and soforth), and I have followed him in giving it a weight of 2.5%.
Price Series
Half of the difference between Feinstein and Clark comes down to the prices that areaggregated rather than to the weights used to average them. Since Clark has expanded theprice sources and processed them in an innovative way, there is reason to expect that his priceseries are more reliable. Sometimes that is true. In some cases (for instance, potatoes, meat,sugar, tea) Clark’s procedures make no difference, and I will not review them here. In thecases where they make a difference, the result is sometimes an improvement in the consumerprice index. At other times, Clark’s new methods degrade the index. I begin with non-foodswhere Clark’s innovations are more often improvements, and then consider foods, where hismethods often less successful.
RentThe rent of housing has been difficult to measure and consequently a subject of debate
(Figure 3). Feinstein inferred it by dividing an estimate of the total rental value of Britishdwellings by the number of inhabited houses. The former was the result of a long series ofapportioning calculations based on poor law tax assessments and income tax returns foroccasional years. Clark has approached the subject with his Charity Commission data base.

7
This shows rents actually received for many houses owned by English charities. The twosources are in close agreement that rent rose by a factor of two and a half between the 1770sand the1860s. There is disagreement about the timing of the increase, however. Clark’sindex concentrates the increase during the French Wars, while Feinstein’s makes it a moregradual. This difference has implications for the timing of real wage change but not for thegrowth in real wages over the industrial revolution as a whole.
Clark’s index looks the more reliable regarding the timing of the increase since it isbased on rents actually received for houses rather than tax assessments, which may not havebeen adjusted as rapidly as the property market changed. The French Wars saw rapid priceand wage inflation, so it would be a great surprise if house rents were not also rising briskly. Farm land rents certainly jumped up in the same period (Allen 1992, p. 172, Clark 1998a,1998b, 2002a, Norton, Trist, and Gilbert 1891, Solar 2004, Turner, Beckett and Afton 1997). Clark’s index is consistent with these expectations–and so looks the more reliable–whileFeinstein’s gives every indiction of an administrative process and calculation algorithm thatlagged behind the rental market.
ClothingOne area where Clark’s methods make a significant improvement is in the
measurement of clothing prices. This has long been a stumbling block. An important earlybenchmark was Tucker’s (1936) work, which was based on McCulloch’s (1880, pp. 1138-1140) summary of the accounts of Greenwich hospital. These included the prices paid for ‘asuit of clothes,’ ‘a pair of shoes,’ ‘a hat,’ and ‘pair of stockings’ from 1729 to 1868. Tuckercombined these prices in an unexplained way and took some account of similar prices fromother hospitals to form an index of the price of clothing. This index has been used by someinvestigators and criticized by others. A big unknown is whether the quality and character ofthe items changed over time and whether and to what extent they incorporated new materialslike cotton. The belief that the suits and stockings were of unchanging quality has ledinvestigators to create an index of the price of clothing from time series of the prices of wooland cotton cloth (Lindert and Williamson 1983, Crafts 1985). Feinstein’s index seems to beof this character, although he also compared the price of trousers from various sources. Thereis no uniformity in the results of these investigations.
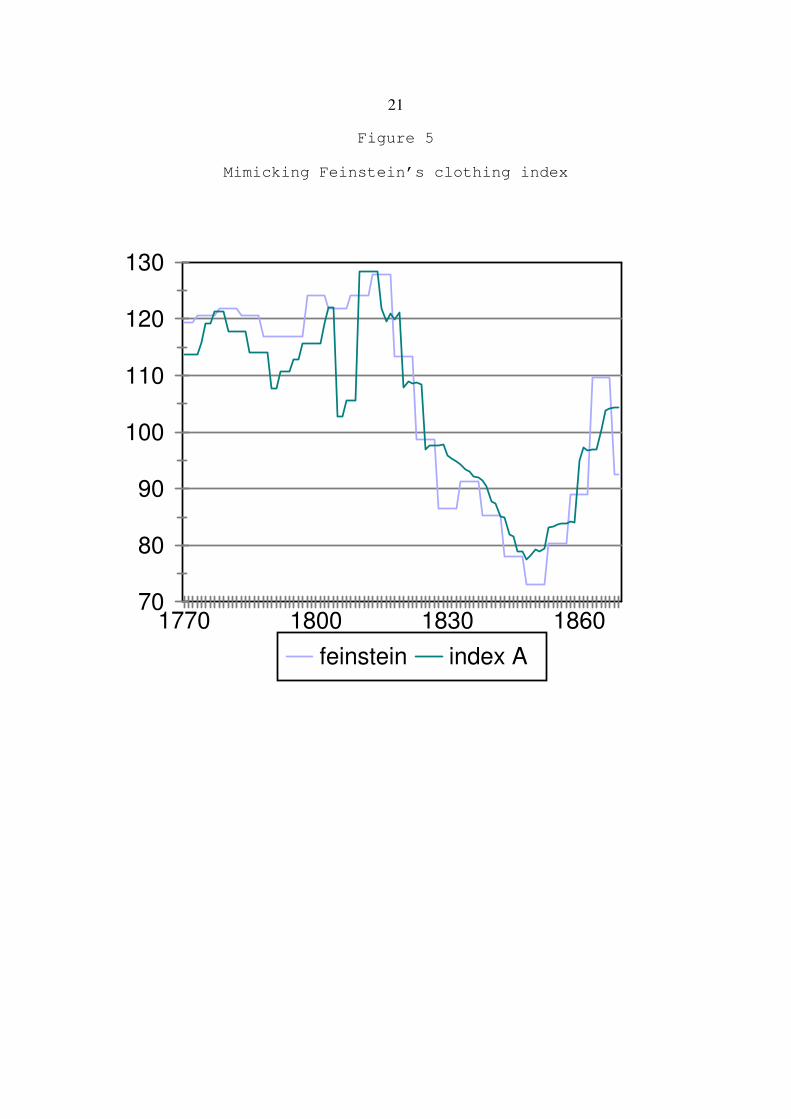
Figure 4 compares Clark’s index to Tucker’s and Feinstein’s. What is remarkable isthe close agreement between Clark and Tucker and the difference between them andFeinstein. But who should we go with?
To investigate the question, I have explored the other approach and tried to constructan index of clothing prices from the prices of cloth and labour. Thus turns out to beunsatisfactory since almost any price trend can be created with minor changes in weights. InFigures 5 and 6, index A closely follows Feinstein’s, while index B is not a badapproximation to Tucker’s. In both indices, labour accounts for half of the costs. The onlydifference between the two is in the weights given to cotton and woollen cloth. In Index Acotton was weight at .12 from 1770 to 1784 and .15 thereafter with the corresponding weightsfor wool being .38 and .35. In contrast, Index B was constructed by weighting cotton at .075from 1770 to 1799 and .15 thereafter. These minor differences in weighting lead to majordifferences in the trends of the indices since cotton cloth was falling so rapidly relative toother prices. We do not have adequate information about working class spending todiscriminate between these possibilities. For this reason, the attempt to construct a clothing

8
7Feinstein’s series is based on Flinn’s (1984, pp.303-4) and Church’s (1986, p. 54)index numbers of the price of coal. The former includes London prices and pithead prices,while the latter includes only pithead prices. Neither series includes wood, which was stillburnt for domestic fuel in the north in the eighteenth century.
price series from cloth prices is doomed to fail. A clothing price index must be based onclothing prices. That leaves Tucker and Clark as the only options. Fortunately, they concur,and the index presented here will be based on Tucker.
Fuel
The market for fuel was unusual in Britain during the industrial revolution. Unlikemany products where prices were uniform across the country (Crafts 1982), fuel prices variedsignificantly. Coal was far cheaper near the coal fields than it was in London and the southgenerally. Wood and turf were also burnt for heat, but their importance was declining. Thesevariations complicate the measurement of fuel prices.
Figure 7 shows Clark’s and Feinstein’s series, which differ greatly. Feinstein’s showsthe price of fuel rising over the industrial revolution,7 while Clarks shows it falling. In aneffort to decide between these two series, I constructed the third from commercial andindustrial sources. It is a roughly weighted average of the prices per BTU of coal andcharcoal in both London and northern England. This series moves in sympathy with Clark’sseries and in stark contrast to Feinstein’s. I use the weighted average of energy prices in thereal wage index presented in this paper.
lighting
While Clark improved on Feinstein in measuring the prices of housing, clothing, andfuel, the same cannot be said of light. Both Clark and Feinstein show the price of lightingfalling between the 1770s and the 1860s, but Clark’s series falls the fastest (Figure 8). In thiscase, he explains why:
Light prices are proxied by a mixture of prices for gaslight, oil, and candles forthe years after 1815 and for oil and tallow candles alone before then. Gaslightprices are measured by the average cost of a cubic foot of gas. The inclusionof gaslight, which fell rapidly in price from the 1810s to the 1860s, makeslight prices relatively much higher in earlier years than in the Phelps Brown-Hopkins or Feinstein cost-of-living series (Clark 2005, p. 1328)
The problem here is that gas was used primarily for street lighting in the first half of thenineteenth century (Gledhill 1981). Gas was not an expenditure in working class budgets. Itis worth remembering that Horrell’s spending category that corresponds to ‘lighting’ wasactually ‘soap and candles’. Figure 8 also shows the price index of ‘soap and candles’ thatClark (2001) reports in his study of farm workers’ earnings. It has the same trajectory asFeinstein’s series, as does Allen’s (1992, p. 324) series, which is also shown. These seriesare based on prices of candles reported by Beveridge (1965, pp. 146-7) and McCulloch (1880,
9
8Available at http://www.iga.ucdavis.edu/clarkdata.html
pp. 1138-40) for Eton College and Greenwich Hospital. The price of gas should not be usedto deflate working class income, and Feinstein was right to leave it out.
FoodsWhile Clark improved the measurement of the prices of most non-food groups, the
same cannot be said of his treatment of foods. For most foods categories, Feinstein’smethods are superior.
dairy products
The prices of milk, cheese, and butter are combined to form the price of dairyproducts. Figure 9 shows that Clark’s series exceeds Feinstein’s in the 1770s and 1780swhile they have identical values in the 1860s. Which is more plausible? In this case, we cancheck them against agricultural prices. An index of the prices of milk, cheese, and butter wasconstructed using the prices Clark reports in his agricultural data base8. As Figure 9indicates, that series is very similar to Feinstein’s. The farm prices confirm the institutionalprices, and, therefore, the Feinstein index is preferred.
In the case of dairy products, Clark’s regression approach may have let him down. Run enough regressions, and you’re bound to find some spurious coefficients. Samplingvariation may be behind Clark’s overestimate of dairy prices in the 1770s and 1780s.
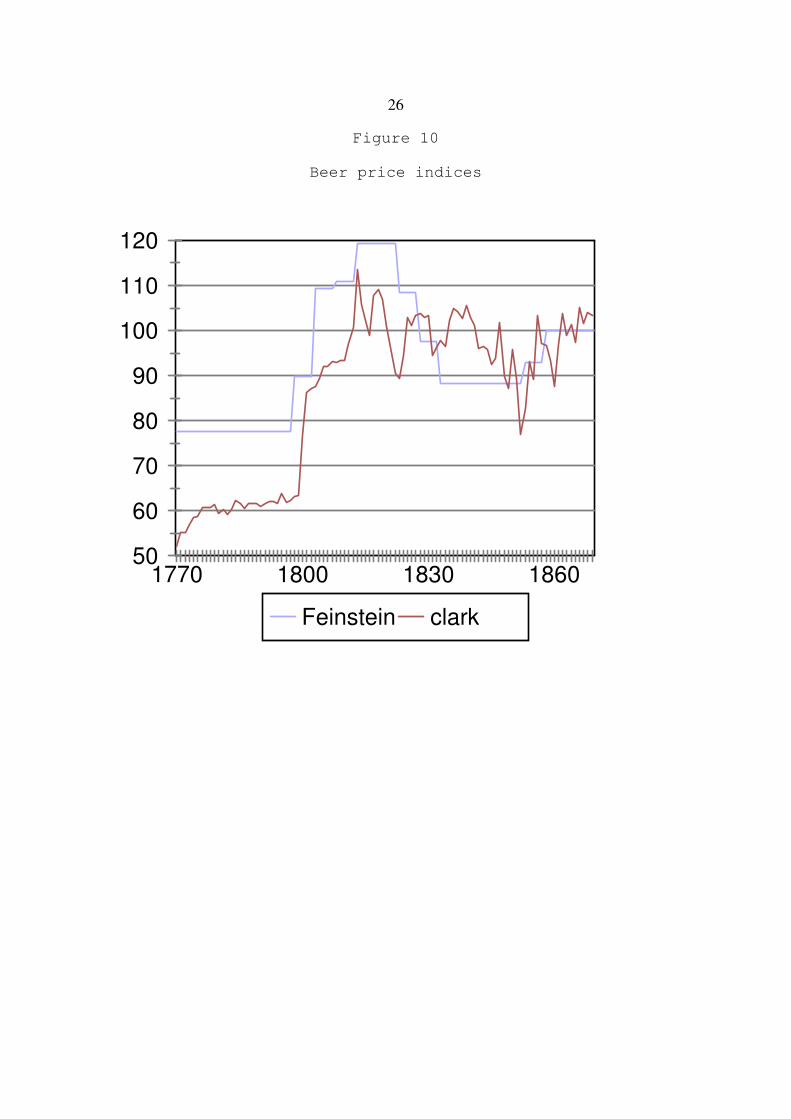
Beer
Beer is heavily weighted in the consumer price index, so its price has a significantimpact on inflation and real wages. Beer is also a commodity for which Feinstein and Clarkpresent very different indices (Figure10): Feinstein’s shows only a mild upward trend, whileClark’s rises dramatically. The matter deserves particular attention since Clark (2005, p.1328) claims “that a major improvement of this index over previous indices is that I havebeen able to compile from churchwarden and other accounts a series of beer prices by thegallon.” Does Clark’s new information lead to a better index than Feinstein’s?
We are in a good position to assess Clark’s contribution since we have verysubstantial histories of the brewing industry that summarize wholesale and retail beer pricesin London, which was a major production centre and market (Mathias 1959, pp. 110-1, 369,546, Gourvish and Wilson 1994, pp. 602-3). I begin with Feinstein’s. Figure 11 shows thathis series has a similar pattern to both the retail price of porter (the price per quart charged inpubs) and the wholesale price per barrel paid by the publicans. Feinstein’s series, in otherwords, is consistent with the history of the London beer market.
Why is Clark’s series so discrepant? The answer appears to be that Clark’s data forthis period exclude the excise tax on beer. Before October, 1830, an excise of 8 to 10shillings per barrel was assessed, and this amounted to about one quarter of the value. After1830, there was no excise. As Figure 12 indicates, Clark’s beer price series tracks the price net of tax. This is a producer price, not a consumer price. Clark’s series would beappropriate for measuring total factor productivity change in brewing but is not the right priceconcept for a consumer price index. In the index presented here, I measure beer prices with

10
9This paragraph is based on conjecture. Feinstein (1998) did not report his source foroatmeal prices, nor did he include oatmeal in the early version of his index that does reportfull sources (Feinstein 1995). I have recomputed the food subindex in Feinstein (1998), andthe recomputation is closest if I use the Greenwich Hospital price of oatmeal rather thanalternatives. Feinstein frequently used Greenwich Hospital data.
the retail price of porter, inclusive of any excise duty.
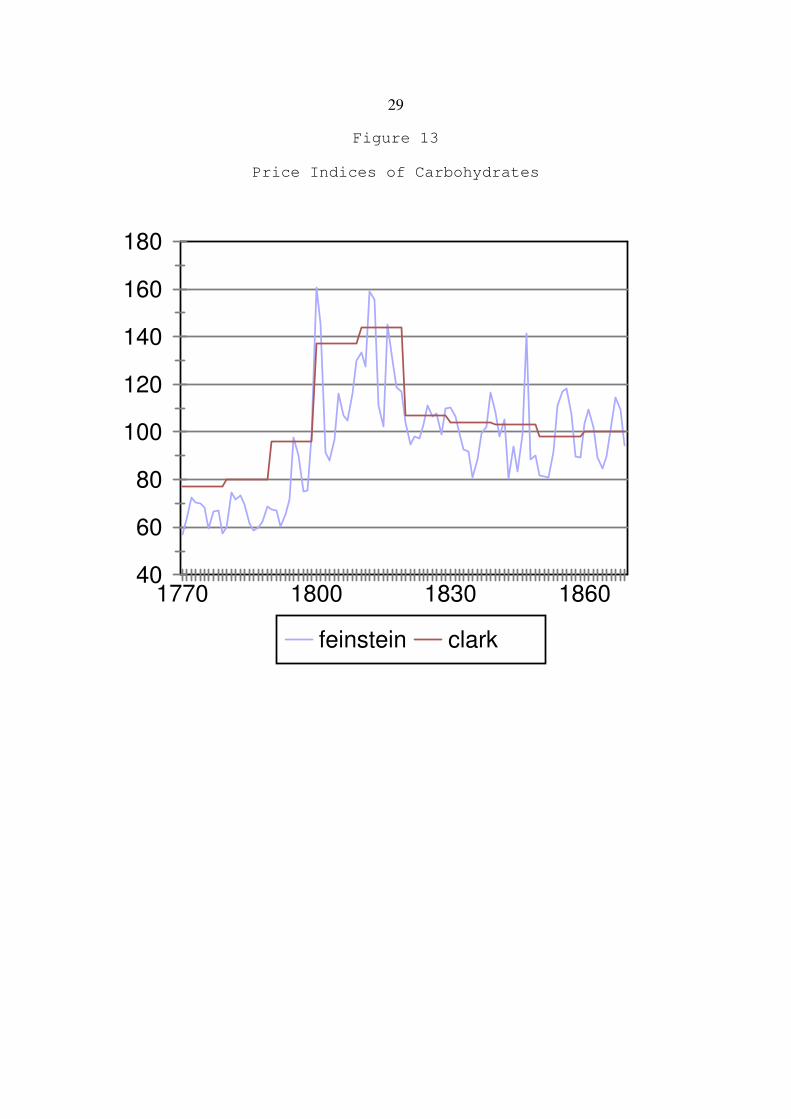
Price series: carbohydrates
An important reason that Clark computed a lower rate of inflation than Feinstein isbecause his price series of carbohydrates inflated less rapidly. Figure 12 contrasts Clark’s‘farinaceous’ index with a comparable index constructed from Feinstein’s sources. Clark’s issignificantly higher in the 1770s and 1780s and that is an important reason why his rate ofreal wage growth is higher. There are two reasons why Clark measures a lower rate ofinflation for carbohydrates, one of which is an improvement and one of which is not.
The improvement that Clark makes is in the measurement of oatmeal prices.9 Figure13 shows Clark’s oatmeal price index and an index of the price of oats based on the LondonGazette price reports (Mitchell and Deane 1971, pp. 488-9). Clearly, there is little to chosebetween these series. The figure also shows the price of oatmeal purchased by GreenwichHospital–apparently Feinstein’s principal source. The peaks and troughs of these seriescoincide as do their levels after the late 1820s. Before that, the Greenwich series is muchlower than the others. Why the Greenwich series jumps up to a higher level in the late 1820sis unknown, but such an unexplained jump invalidates it as a measure of the oatmeal price.
Clark’s other innovation is in the measurement of the price of bread before 1816. While we have abundant evidence about the retail price of bread in this period (Petersen1995, pp. 276-306), Clark rejected the bread price data in the belief that quality of breadbetween roughly 1760 and 1816 was lower than it was before or after. Instead of using breadprices to measure the price of bread, he used a regression equation to interpolate the price ofbread from the price of wheat. This was supposed to provide an indicator of the price of‘constant quality’ bread.
Clark’s claim raises a number of issues that can be investigated, but, at the outset, it isimportant to emphasize that Clark’s position suffers from a fatal flaw: The London breadprice series that is commonly used in consumer price indices is the Assize Price of WheatenBread. This was a standard specified by the 1757 Bread Act and made from flour with a 70%extraction rate (Petersen 1995, p. 276). The price series for bread used by Feinstein and Allenin their consumer price indices is a price series for a product of constant quality. Clark’sobjection cannot apply. The remaining discussion is concerned with contextualizing Clark’sclaim and showing that the evidence he adduces for it has other explanations.
To begin with, Clark provides no direct evidence that bread quality was substandardin this period–the argument is an indirect inference from price trends. There is, however,much contemporary comment regarding bread quality. The main factor determining breadquality was the fineness of the flour that was baked. When flour was made, the ground wheatwas sifted to remove bran and course material. The more that was removed, the whiter theflour and the bread. The coarsest brown bread was made with flour with an 85% extraction

11
rate, i.e. only 15% of the coarsest material was removed after grinding. The finest flour hadan extraction rate of less than 70%. The grade known as Wheaten Bread was made with flourwith a 70% extraction rate, while Standard Wheat Bread was made with flour of 75%extraction rate. Consumers could easily identify the extraction rate of the flour used in breadby its colour and texture.
Bread was sold according to grade, and grades were defined by the Assize of Bread interms of flour extraction rates. In the late eighteenth century, there was an effort to forceconsumers to eat bread made with coarser flour. The impetus came not from bakers but fromParliament concerned about the grain supply. The 1757 Act that redefined the Assize createda new category called ‘household bread’ to be made with flour with an 80% extraction rate,and the act tried to force half of the bread to be made at this grade. The act was a failure. Consumers refused to buy the coarse bread at the prices prescribed, and bakers found it moreprofitable to make purer white bread. The result was a general rise in the quality of bread–notthe decline postulated by Clark (Petersen 1995, pp. 102-3).
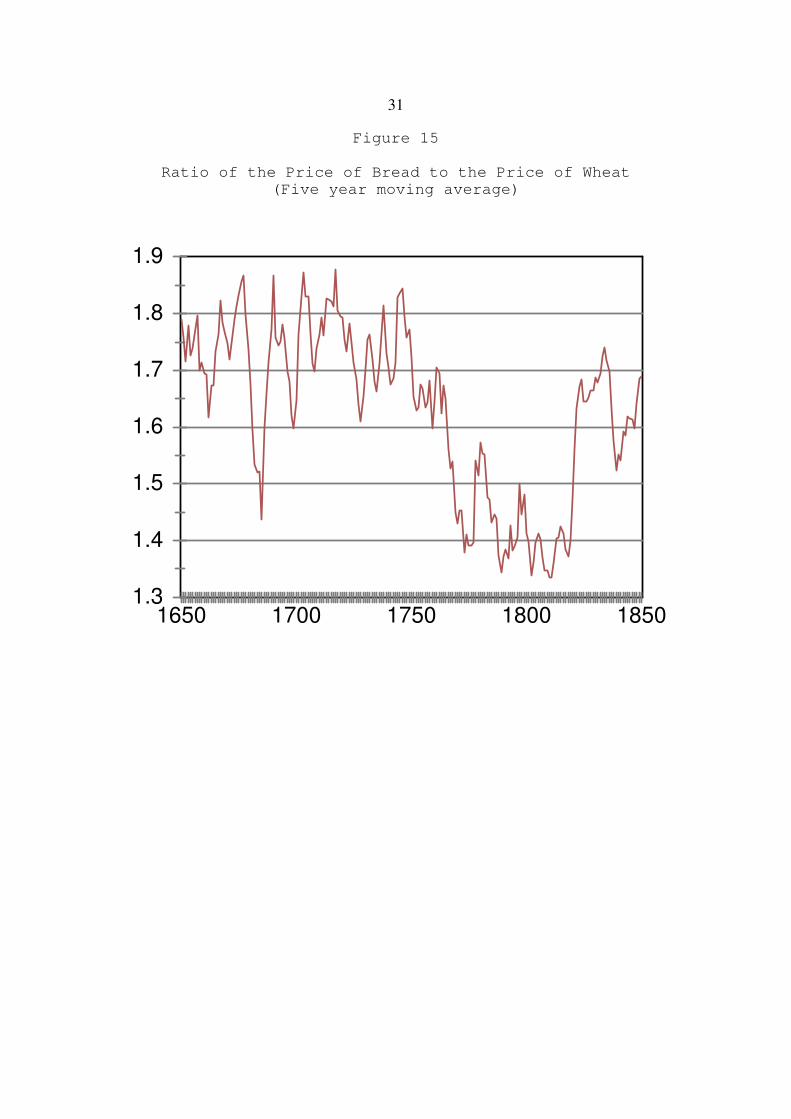
In view of this history, we must be sceptical about Clark’s indirect argument thatbread quality declined, and, indeed, there are many difficulties with it. Clark (2005, p. 1326-7) began by pointing to a breakdown of the navy’s cost of turning wheat into bread whichindicated that “wheat constituted 92 percent of the costs of bread.” The Naval costs excludedcapital costs, and, in any event, were far less than costs in the commercial sector where wheatrepresented only half to two-thirds of the cost of bread making. There were economies ofscale in bread production, but their realizeation depended on consumers’ accepting coldbread. That was not a problem for the Navy, but it was for English consumers who preferredwarm bread and patronized small, high cost bakeries (Petersen 1995, pp. 74-7). The Navalcosts are not relevant to the commercial sector, but from them Clark concluded that the pricesof bread and wheat should have moved in a fixed proportion. They did not. From 1770through the French Wars, the ratio of the price of bread to the price of wheat was much lessthan it was before or after as Figure 15 indicates. From this, Clark concluded: “This wouldnot be possible if the bread were of constant quality.”
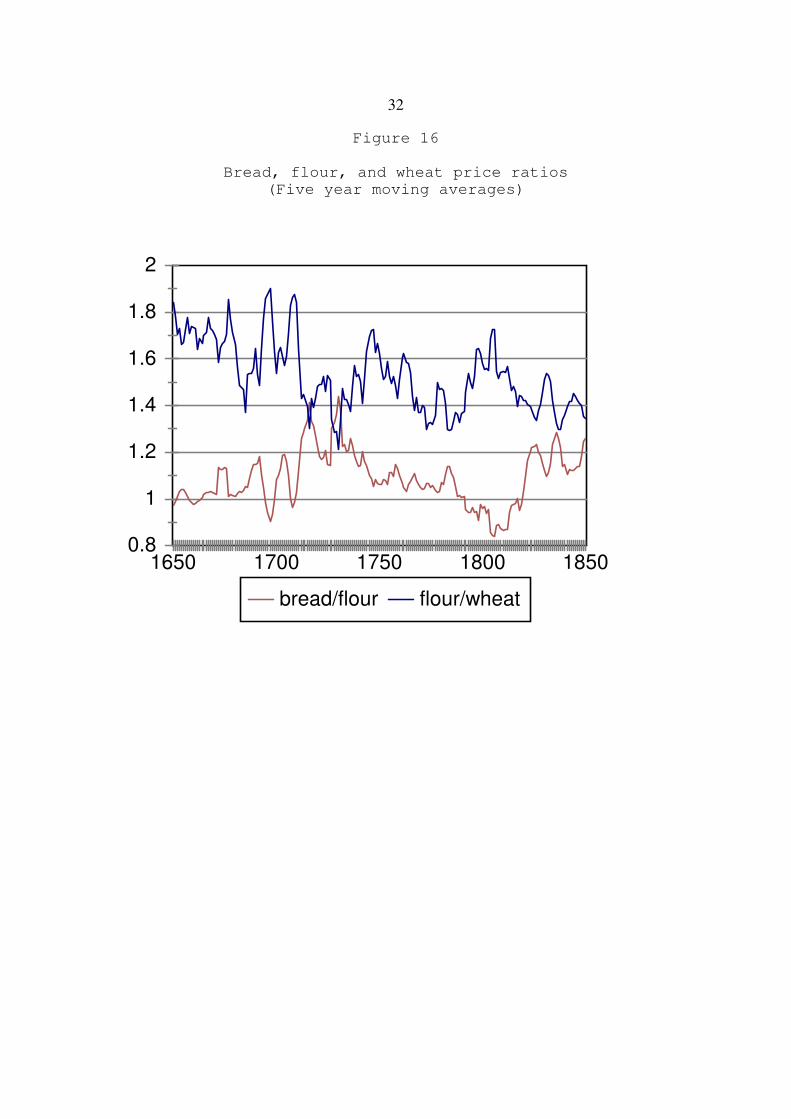
There are, however, other explanations for the price trends. There were two stages inthe conversion of wheat to bread–milling the grain into flour and then baking the flour intobread. By the eighteenth century, these operations were undertaken by different firms. Thebread-wheat price ratio was the result of developments in both industries. Figure 16 showsthe ratios of the price of bread to the price of flour and the price of flour to the price of wheat. Their product equals the bread/wheat ratio shown in Figure 15.
Figure 16 shows the ratio of the price of flour to the price of wheat. The flour price isthat paid by the Navy for bread making. This series is virtually identical to the price paid byGreenwich Hospital for flour for the same purpose. Beveridge (1965, p. 543) regard thisflour of unchanging quality with an extraction rate of less than 75%.
The price of flour fell with respect to the price of wheat from the middle of theseventeenth century to the end of the eighteenth. This decline was the result of technicalimprovements in milling (the boulter, double grinding, improved gearing) and increases in thegeographical extent of the market that increased competition (Petersen 1995, pp. 52-7). Theresult was a low ratio of flour to wheat prices in the late eighteenth century. This was aproximate cause of the low ratio of the price of bread to the price of wheat.
The second factor affecting the bread-wheat ratio was the ratio of the bread price tothe flour price. This ratio went through a cycle shown in Figure 16. It was about 1.1 in thesecond half of the seventeenth century and again in the second half of the eighteenth. The

12
1710s through the 1750s were the golden age for bakers when the ratio of bread to flourprices lept up to 1.3. This period of high mark-ups immediately followed the 1709 Act thatredefined the Assize of Bread. The medieval act had specified a uniform baker’s allowancethat was added to the price of wheat to set the price of bread. The 1709 Act allowed localmagistrates to determine the mark-up in light of local costs (Petersen 1995, p. 100). Theresult was unprecedented rent-seeking and a high ratio of bread to wheat prices. These abusesended after1757 when a new act reformed the Assize again. At that point, the ratio of theprice of bread to the price of wheat returned to its pre-1709 value. From 1794 through 1816,the ratio was very low. After 1816, it returned to a value of about 1.2.
The income of bakers fluctuated in line with the ratio of bread to flour prices. Figure17 shows the real annual income of a baker processing seven sacks of flour per week–typicalthroughput for a commercial baker. The income is the value of the bread produced less thecosts of flour, yeast, salt, wood, hired labour, and the rental value of the commercialpremises–the ‘profit,’ in other words, on which the baker lived. Deflation expresses theincome in the purchasing power of 1688. Between 1684 and 1688, a baker’s incomeaveraged £44 a year–not far off the £45 per year that Gregory King assigned to ‘Shopkeepers& Tradesmen’ in 1688 (Deane 1979, p. 6). Income rose to £103 in the first half of theeighteenth century. Bakers made very high incomes exploiting the procedures of the 1709Assize of Bread. From 1757, when the new Assize was enacted, until the 1790s, real incomedropped back to the seventeenth century level of £62. The important point is that there is noevidence that baker’s incomes in the late eighteenth century were being squeezed byregulation and, hence, no reason to suppose that bread quality was being cut.
The position of bakers deteriorated dramatically between the French Revolution andWaterloo. Wheat prices shot up and so did wages and other costs. The Assize of Breadallowed the bread price to rise with the wheat price, but not in response to other costincreases. The result was a collapse in profitability in the baking industry. This was theproximate cause of the repeal of the Assize of Bread. After it was repealed, profitability wasrestored as bread prices were maintained after Waterloo even as costs fell. Bread marketswere localized, so collusion was easy, and that was probably a factor in raising profits. Certainly the real profits earned in the 1820s and 1830s were greater than those earned in thelate eighteenth century.
The upshot of this discussion is that there is no reason to assume that bread prices inthe 1770s and 1780s were low because the quality of bread was low. Low prices thenreflected the high efficiency of milling wheat into flour and the elimination of the extremelyhigh incomes earned earlier in the eighteenth century. Consumers could buy good qualitybread at prices we can ascertain, so those prices should be used in the consumer price index.
New Cost of Living and Real Wage Indices
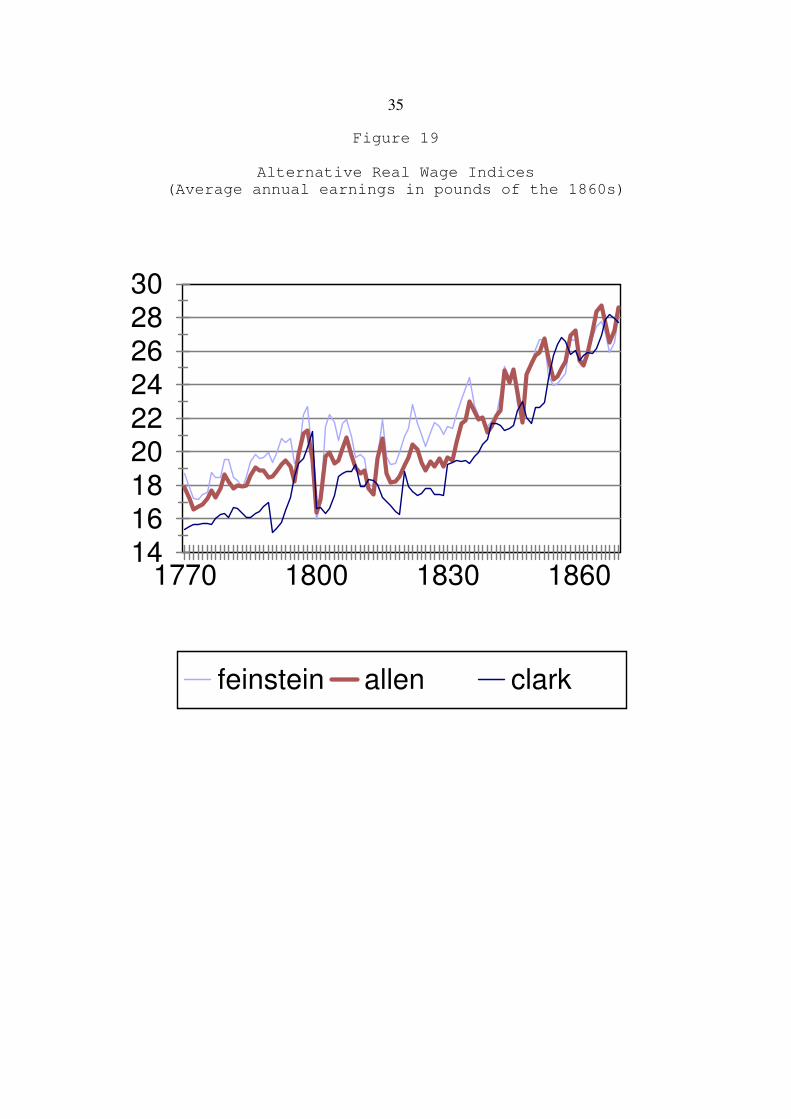
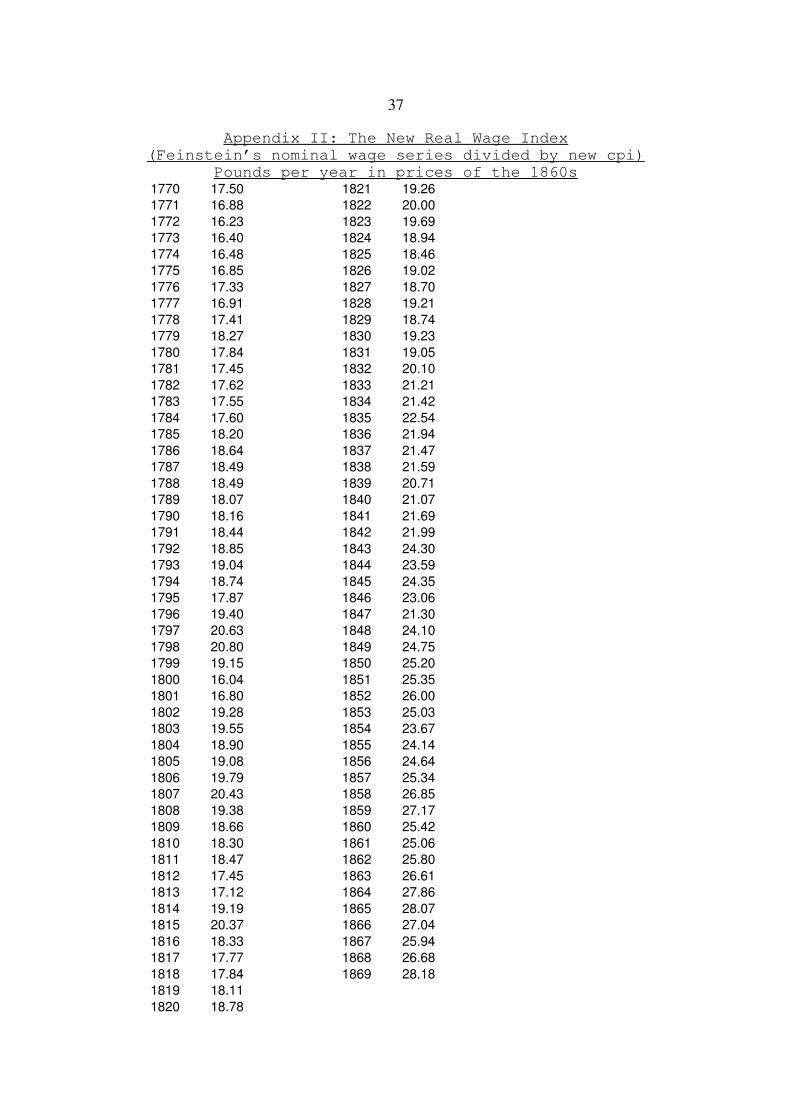
This review of Feinstein’s and Clark’s work points the way towards more reliable costof living and real wage indices by combining the best elements from both. The choice ofcomponent prices has already been indicated. A geometric index was calculated with theweights shown in Table 2. The result are the price and real wage indices shown in Figures 18and 19 and tabulated in Appendices I and II. Despite including many components of Clark’sindex, the results are far closer to Feinstein’s than to Clark’s.
The real wage history shown in Figure 19 preserves Feinstein’s pessimism. Theoverall growth in real wages from the 1770s to the 1850s was much lower than growth in
13
output per worker. While real wages grew in the eighteenth century and again after 1830,there was a distinct pause in that advance from the mid 1790s to the early 1830s. Indeed, thewage plateau is even more pronounced with the new index than it was with Feinstein’s. Constancy of the real wage in this period underlay the belief of classical economists thatworkers would be left behind as capitalism developed.
Figure 19, however, calls into question some of the explanations for the constant wageadvanced by classical economics. In particular, the growth of the real wage in the lateeighteenth century means that the real wage in the early nineteenth century was not a‘subsistence wage.’ It could not have been, for it was clearly above the 1770s level! Indeed,British wages during the industrial revolution were very high by international standards(Allen 2001), again calling into question explanations couched in terms of subsistence. Whyindustrializing Britain went through this phase of constant real wages and rising inequality isa theme explored elsewhere (Allen 2007).
The Economic and Biological Standards of Living
Different social scientists measure the standard of living in different ways. Realincomes is one, and the results presented here support a sombre judgement. Other indicatorsare even more pessimistic, in particular, the ‘biological standard of living’ showed adownward trend over the first half of the nineteenth century. This is the common finding instudies of stature (Floud, Wachter, and Gregory 1990, Johnson and Nicholas 1995, Nicholasand Oxley 1993, Nicholas and Steckel 1991 Komlos 1993), which reached a low point in thesecond quarter of the nineteenth century. This finding is consistent with the evolution ofagricultural production and food imports, for their statistics indicate that per capital calorieconsumption was lower in 1850 than in 1800 (Allen 2005). Urban life was particularly bad. Overcrowding is a common theme, and public health a calamity. Szreter and Mooney (1998)found that the expectation of life at birth declined in large cities–again in the second quarterof the nineteenth century.
A drop in height is easier to reconcile with the plateau in the real wage reported herethan with Clark’s overly optimistic view of rising living standards, but the question remains: why did a constant real wage lead to less food consumption, overcrowding, and shorterpeople? The answer is that real income was only one factor; trends in relative prices wereanother. The price indices that have been aggregated here changed with respect to each other,and those changes in relative prices contributed to many of the social problems of the period.
There were several critical changes in relative prices. One series rose dramaticallyduring the industrial revolution–both absolutely and relative to all of the others. That serieswas the rent of housing. As British cities expanded, growing labour demanded bid up theprice of housing and land, and much of the income gain was transferred to urban landowners. Faced with a rising cost of housing, workers responded by reducing their consumption: theresult was overcrowding. The were limits as to how far this process could be pushed, andthose limitations meant that rising rents translated into a rising share of income spent onhousing as Feinstein documented (Table 2). Rising housing prices were responsible forcrowded urban housing and the health problems that ensued.
A second relative price change of great consequence was the history of manufacturedgoods prices–in particular cotton textiles–and food. The prices of clothing and textiles fell with respect to food. The underlying causes were the mechanization of textile production in

14
conjunction with slower productivity growth in agriculture and the Corn Laws that keptagricultural prices high. Consumers responded to this price change by shifting theirexpenditures from food to clothing. A drop in per capita calorie consumption and a decline instature were the result.

15
Table 1
Comparison of Feinstein and Clark CPIs, 1770s
.787 Clark, separating tea and beer
.785
.783
.781
.779 Clark, average
.777
.775 Rent (C)
.773
.771
.769 Fuel (Allen => C)
.767
.765
.763
.761
.759
.757
.755
.753
.751 Beer (porter => F)
.749 sugar (F)
.747 meat (F)
.745
.743 light (F)
.741
.739 dairy (F)
.737
.735
.733 Clothing (Tucker => C)
.731 Tea (F)
.729
.727 grain & potatoes (C, F)
.725
.723
.721
.719
.717
.715
.713
.711
.709
.707
.705
.703
.701
.699
.697 Feinstein: geometric, my indices
.695
.693
.691
.689
.687
.685 Feinstein: recalculated from his indices
16
Table 2
Weights
Clark Feinstein Allen
1788/92 1828/32 1858/62
food 60.5 69 65 61 62.5beer 6.5 10 11 12 11.0tobacco 1.0 0 0 0 0.0fuel 5.0 4 4 4 4.0light/soap 4.5 1 1 1 1.0clothing 12.0 6 8 9 8.0rent 8.0 10 11 13 11.0services 2.5 0 0 0 2.5
food breakdown
carbohydrates Bread |18.5 16.25 19.0 Flour | 13.65 9.5 Oatmeal 2.0 4.55 4.0 Barley 1.0 0 0 Peas 1.0 0 .5 Potato 4.0 4.55 4.0 rice .5 0 0
meat Beef |11.0 2.60 2.6 Mutton | 2.60 2.6 Pork/bacon | 5.20 5.2 Fish .5 0 0 Eggs .5 0 0
dairy Milk 4.0 4.55 4.55 Butter 5.0 2.60 2.60 Cheese 2.5 1.95 1.95
sugar 4.5 4.55 4.0
tea/coffee 3.5 1.95 2.0
salt 1.0 0
spices 1.0 0
Sources: Feinstein (1998, p. 635), Clark (2005, p. 1327)
17
0.6
0.8
1
1.2
1.4
1.6
1770 1800 1830 1860
feinsteinclarkfeinstein weights & clark prices
Figure 1
Comparing Feinstein’s and Clark’s CPIs

18
20
40
60
80
100
120
140
160
180
mill
ions
of b
ushe
ls
1770 1790 1810 1830 1850
wheat supply Allen Clark
Figure 2
The Demand and Supply of Wheat

19
40
50
60
70
80
90
100
110
1770 1800 1830 1860
feinstein clark
Figure 3
House Rent

20
70
80
90
100
110
120
130
140
1770 1800 1830 1860
feinstein clark tucker
Figure 4
Clothing Price Series
21
70
80
90
100
110
120
130
1770 1800 1830 1860feinstein index A
Figure 5
Mimicking Feinstein’s clothing index

22
70
80
90
100
110
120
130
140
1770 1800 1830 1860clark tucker index B
Figure 6
Mimicking Clark’s and Tucker’s clothing indices

23
50
100
150
200
250
300
350
1770 1800 1830 1860
feinstein clark allen
Figure 7
Fuel Price Series

24
50
100
150
200
250
1770 1800 1830 1860feinstein clark JPEclark EcHR Allen (1992)
Figure 8
Lighting Price Series

25
40
60
80
100
120
140
1770 1800 1830 1860
feinstein clarkclark ag prices
Figure 9
Dairy Price Indices
26
50
60
70
80
90
100
110
120
1770 1800 1830 1860
Feinstein clark
Figure 10
Beer price indices

27
40
60
80
100
120
140
160
180
1770 1800 1830 1860
Feinsteinporter (retail)beer, wholesale including excise
Figure 11
Comparison of Feinstein beer series to market prices

28
40
60
80
100
120
140
160
180
1770 1800 1830 1860
Clarkbeer, wholesale excluding tax
Figure 12
Comparison of Clark beer price series to market price
29
40
60
80
100
120
140
160
180
1770 1800 1830 1860
feinstein clark
Figure 13
Price Indices of Carbohydrates

30
0
50
100
150
200
1770 1800 1830 1860
feinstein clarkcpi clarkag
Figure 14
Price Indices of Oatmeal
31
1.3
1.4
1.5
1.6
1.7
1.8
1.9
1650 1700 1750 1800 1850
Figure 15
Ratio of the Price of Bread to the Price of Wheat(Five year moving average)
32
0.8
1
1.2
1.4
1.6
1.8
2
1650 1700 1750 1800 1850
bread/flour flour/wheat
Figure 16
Bread, flour, and wheat price ratios(Five year moving averages)

33
-100
-50
0
50
100
150
200
250
poun
ds o
f 168
8
1600 1650 1700 1750 1800 1850
Figure 17
The Real Annual Income of a Baker

34
0.6
0.8
1
1.2
1.4
1.6
1770 1800 1830 1860
feinstein allen clark
Figure 18
Alternative Consumer Price Indices(1860-69 = 100)
35
14 16 18 20 22 24 26 28 30
1770 1800 1830 1860
feinstein allen clark
Figure 19
Alternative Real Wage Indices(Average annual earnings in pounds of the 1860s)

36
Appendix I: The New Consumer Price Index
1770 67.7 1821 107.2 1771 70.9 1822 101.6 1772 74.4 1823 101.5 1773 73.7 1824 106.6 1774 73.6 1825 111.0 1775 71.9 1826 107.6 1776 69.9 1827 107.3 1777 73.5 1828 104.3 1778 72.4 1829 106.7 1779 69.3 1830 103.1 1780 71.8 1831 104.7 1781 76.1 1832 99.5 1782 75.1 1833 94.1 1783 74.1 1834 93.4 1784 72.8 1835 88.0 1785 70.5 1836 92.4 1786 69.7 1837 95.5 1787 70.7 1838 97.3 1788 72.0 1839 103.0 1789 74.7 1840 101.8 1790 76.7 1841 98.9 1791 76.9 1842 96.9 1792 76.8 1843 86.5 1793 79.6 1844 89.5 1794 84.5 1845 87.6 1795 94.9 1846 96.3 1796 91.4 1847 106.9 1797 87.4 1848 90.5 1798 89.6 1849 86.5 1799 102.1 1850 84.6 1800 128.9 1851 84.1 1801 123.3 1852 83.1 1802 105.2 1853 91.7 1803 105.7 1854 102.4 1804 114.5 1855 102.9 1805 120.9 1856 102.4 1806 117.7 1857 98.7 1807 114.6 1858 90.4 1808 121.2 1859 90.2 1809 128.8 1860 99.1 1810 134.3 1861 101.8 1811 133.4 1862 99.6 1812 144.4 1863 96.4 1813 147.0 1864 93.2 1814 129.2 1865 95.2 1815 116.4 1866 102.3 1816 127.5 1867 107.7 1817 129.6 1868 103.9 1818 126.3 1869 97.5 1819 123.4 1820 115.6
37
Appendix II: The New Real Wage Index(Feinstein’s nominal wage series divided by new cpi)
Pounds per year in prices of the 1860s1770 17.50 1821 19.26 1771 16.88 1822 20.00 1772 16.23 1823 19.69 1773 16.40 1824 18.94 1774 16.48 1825 18.46 1775 16.85 1826 19.02 1776 17.33 1827 18.70 1777 16.91 1828 19.21 1778 17.41 1829 18.74 1779 18.27 1830 19.23 1780 17.84 1831 19.05 1781 17.45 1832 20.10 1782 17.62 1833 21.21 1783 17.55 1834 21.42 1784 17.60 1835 22.54 1785 18.20 1836 21.94 1786 18.64 1837 21.47 1787 18.49 1838 21.59 1788 18.49 1839 20.71 1789 18.07 1840 21.07 1790 18.16 1841 21.69 1791 18.44 1842 21.99 1792 18.85 1843 24.30 1793 19.04 1844 23.59 1794 18.74 1845 24.35 1795 17.87 1846 23.06 1796 19.40 1847 21.30 1797 20.63 1848 24.10 1798 20.80 1849 24.75 1799 19.15 1850 25.20 1800 16.04 1851 25.35 1801 16.80 1852 26.00 1802 19.28 1853 25.03 1803 19.55 1854 23.67 1804 18.90 1855 24.14 1805 19.08 1856 24.64 1806 19.79 1857 25.34 1807 20.43 1858 26.85 1808 19.38 1859 27.17 1809 18.66 1860 25.42 1810 18.30 1861 25.06 1811 18.47 1862 25.80 1812 17.45 1863 26.61 1813 17.12 1864 27.86 1814 19.19 1865 28.07 1815 20.37 1866 27.04 1816 18.33 1867 25.94 1817 17.77 1868 26.68 1818 17.84 1869 28.18 1819 18.11 1820 18.78

38
References
Allen, Robert C. (1992). Enclosure and the Yeoman, Oxford,Oxford University Press.
Allen, Robert C. (1999). "Tracking the AgriculturalRevolution," Economic History Review, 2nd series, Vol. 52, pp. 209-235.
Allen, Robert C. (2000). "Economic Structure and AgriculturalProductivity in Europe, 1300-1800," European Review ofEconomic History, Vol. 3, pp. 1-25.
Allen, Robert C. (2001). The Great Divergence in EuropeanWages and Prices from the Middle Ages to the First World War,”Explorations in Economic History, Vol. 38, pp. 411-47.
Allen, Robert C. (2005). “English and Welsh Agriculture, 1300-1850: Output, Inputs, and Income.”
Allen, Robert C. (2007). “Engel’s Pause: A Pessimist’s Guideto the British Industrial Revolution,” Oxford University,Department of Economics, Working Paper 315.
Ashton, T.S. (1949). “The Standard of Life of Workers inEngland, 1790-1830,” Journal of Economic History, supp. 9, pp.19-38.
Batchelor, T. (1808). General View of the Agriculture of theCounty of Bedford, R. Phillips.
Beveridge, Lord (1965). Prices and Wages in England from thetwelfth to the nineteenth century, London, Frank Cass & CoLtd.
Brunt, Liam (nd). “Estimating English Wheat Production in theIndustrial Revolution, 1700-1850.”
Church, R. (1986). The History of the British Coal Industry,3, 1830-1913, Victorian Pre-Emininence, Oxford, OxfordUniversity Press.
Clark, Gregory (1998a). ‘Commons Sense: Common PropertyRights, Efficiency, and Institutional Change,’ Journal ofEconomic History, Vol. 58, Number 1, pp. 73-102.
Clark, Gregory (1998b). ‘Renting the Revolution,’ Journal ofEconomic History, Vol. 58, No. 1, pp. 206-210.
Clark, Gregory (2001). “Farm Wages and Living Standards inthe Industrial Revolution: England, 1670-1869,” Economic
39
History Review, Vol. 54, pp. 477-505.
Clark, Gregory (2002a). “Farmland Rental Values and AgrarianHistory: England and Wales, 1500-1912,” European Review ofEconomic History, Vol. 6, pp. 281-308.
Clark, Gregory (2002b). “Shelter from the Storm: Housing andthe Industrial Revolution, 1550-1909,” Journal of EconomicHistory, Vol. 62, pp. 489-511.
Clark, Gregory (2005). “The Condition of the Working Class inEngland, 1209-2004,” Journal of Political Economy, Vol. 113,pp. 1307-1340.
Crafts, N.F.R. (1982). “Regional price variations in Englandin 1843: an aspect of the standard of living debate,”Explorations in Economic History, Vol. 19, pp. 51-70.
Crafts, N.F.R. (1985). “English workers’ real wages duringthe industrial revolution: some remaining problems,” Journalof Economic History Vol. 45, pp. 139-44.
Deane, Phyllis (1979). The First Industrial Revolution,Cambridge, Cambridge University Press, 2nd edition.
Deane, Phyllis, and Cole, W.A. (1979). British EconomicGrowth, 1688-1959, Cambridge, Cambridge University Press, 2nd
edition.
Feinstein, Charles H. (1995). “Changes in nominal wages, thecost of living and real wages in the United Kingdom over twocenturies, 1780-1990,” in P. Scholliers and V. Zamagni, eds.,Labour’s Reward: Real Wages and Economic Change in 19th- and20th-century Europe,, Aldershot, Edward Elgar PublishingLimited, pp. 3-36.
Feinstein, Charles H. (1998). “Pesimism perpetuated: realwages and the standard of living in Britain during and afterthe Industrial Revolution,” Journal of Economic History, Vol.58, pp. 625-58.
Flinn, M.W. (1984). The History of the British CoalIndustry, 2, 1700-1830, The Industrial Revolution, Oxford,Oxford University Press.
Floud, R., Wachter, K.W., and Gregory, A. (1990). Height,health and history: nutritional status in the United Kingdom,1750-1980, Cambridge, Cambridge University Press.
Gledhill, David (1981). Gas Lighting, Princes Risborough,Shire Publications.

40
Gourvish, T.R., and Wilson, R.G. (1994). The British BrewingIndustry, 1830-1980, Cambridge, Cambridge University Press.
Holderness, B.A. (1989). “Prices, Productivity, and Output,” The Agrarian History of England and Wales, Vol. VI, 1750-1850,ed. By G.E. Mingay, Cambridge, Cambridge University Press, pp.1-118.
Horrell, Sara (1996). “Home Demand and BritishIndustrialization,” Journal of Economic History, Vol. 56, pp.561-604.
Jackson, R.V. (1985). "Growth and Deceleration in EnglishAgriculture, 1660-1790," Economic History Review, 2nd series,Vol. 36, pp. 333-351.
Johnson, Paul , and Nicholas, Stephen (1995). “Male andFemale Living Standards in England and Wales, 1812-1857:Evidence from Criminal Height Records,” Economic HistoryReview, Vol. 48, pp. 470-81.
Komlos, J. (1993). “The secular trend in the biologicalstandard of living in the United Kingdom, 1730-1860,” EconomicHistory Review, Vol. 46, pp. 115-144.
Lindert, Peter H., and Williamson, Jeffrey G. (1983). “English Workers’ Living Standard during the IndustrialRevolution: A New Look,” Economic History Review, Vol. 36, pp.1-25.
Mathias, Peter (1959). The Brewing Industry in England, 1700-1830, Cambridge, Cambridge University Press.
MacKenzie, W.A. (1921). “Changes in the Standard of Living inthe United Kingdom, 1860-1914,” Economica, 3, pp. 211-30.
McCulloch, J.R. (1880). Dictionary Commerce and CommercialNavigation, London, Longman.
Mitchell, B.R. and Deane, Phyllis (1971). Abstract of BritishHistorical Statistics, Cambridge, Cambridge University Press.
Nicholas, Stephen, and Steckel, Richard (1991). “Heights andHealth of English workers during the early years ofindustrialization, 1770-1815,” Journal of Economic History,Vol. 51, pp. 937-57.
Norton, Trist, and Gilbert (1891). “A Century of Land Values:England and Wales,” Journal of the Royal Statistical Society,Vol. 54, pp. 128-31.
Nicholas, Stephen, and Oxley, Deborah (1993). “The living
41
standards of women during the industrial revolution, 1795-1820,” Economic History Review, Vol. 46, pp. 723-49.
Petersen, Christian (1995). Bread and the British Economy,c1770-1870, ed. By Andrew Jenkins, Aldershot, Scolar Press.
Solar, Peter M. (2004). “Land Values, Rents, Tenures and theDistribution of Income in English Agriculture during theEighteenth and Nineteenth Centuries.”
Szreter, Simon, and Mooney, Graham (1998). “Urbanization,Mortality, and the Standard of Living Debate: New Estimates ofthe Expectation of Life at Birth in Nineteenth-century BritishCities,” Economic History Review, Vol. 51, pp. 84-112.
Turner, M.E., Beckett, J.V., and Afton, B. (1997). Agricultural Rent in England, 1690-1914, Cambridge, CambridgeUniverity Press.
Vanderlint, Jacob (1734). Money Answers All Things. London,T. Cox.


![6]«8 olgog cfGbf]ngsf - bishnurimal.com.np … · /fi6« a}+s sd{rf/L ;+3sf] nflu k]h 2 df3 @), @)^# Patterson's Pyramid of wage: Global Wage model 300 workers Poverty wage 100 workers](https://img.pdfslide.tips/doc/110x75/6030f253b385127d7b2282ca/68-olgog-cfgbfngsf-fi6-as-sdrfl-3sf-nflu-kh-2-df3-pattersons.jpg)