Embed Size (px)
Citation preview
Case study North Karelia 1
Energy Wood Transportation by Rail
5EURES - EIE/04/086/S07.38582
Perttu Anttila, Timo Tahvanainen, Heikki Parikka,
Juha Laitila & Antti Ala-Fossi
© Timo Saloranta
2
Anttila, P.,Tahvanainen, T., Parikka, H., Laitila, J. & Ala-Fossi, A. Energy Wood Transportation by Rail, 5 EURES Project Report X/2007, Project 5EURES - EIE/04/086/S07.38582. Joensuu, Finland, 17 pages
Keywords wood fuel, forest chips, railway, truck, transportation
Abstract
In the future, the production of forest chips probably exceeds the consumption in North Karelia region. The surplus can be exported to other regions in Southern and Central Finland. The aims of this case study were to assess the cost-competitiveness and other prerequisites for using railways for transporting energy wood and fuel chips within North Karelia and for exporting the energy wood outside the region. The results showed that the railway transportation within the region can be competitive only from the most remote areas of the region, if the distance from roadside storage to closest railway terminal is short. In transportation from North Karelia to Central Finland, however, railway transportation of fuel chips seems to provide the lowest supply costs. Consequently, railway transportation is a promising, cost-efficient and environmentally sound option. It still has a lot of development potential for example by means of purpose-built, optimized equipment for different fuels, in terminal operations and in optimization of the logistics of the supply-chain.
3
Preface This report is a WP3 case study report of 5EURES – Five European RES-Heat Pilots – project (EIE/04/086/S07.38582) carried out during 2004 – 2007. Objective of this 5 EURES project is to introduce and foster implementation of best practices in RES-heat markets in five European regions. Co-objective supporting successful implementation of market structures is know-how transfer between the participating regions. The example given by these five RES-heat pilots can be benefited and adapted widely among other European regions. In WP3, Right Technical solutions, of 5EURES will be made feasibility studies of the most potential RES-heat technologies and operation models, limited number of individual case studies for the most promising sites and demonstrate RES-heat production chains by temporary and solid arrangements.
4
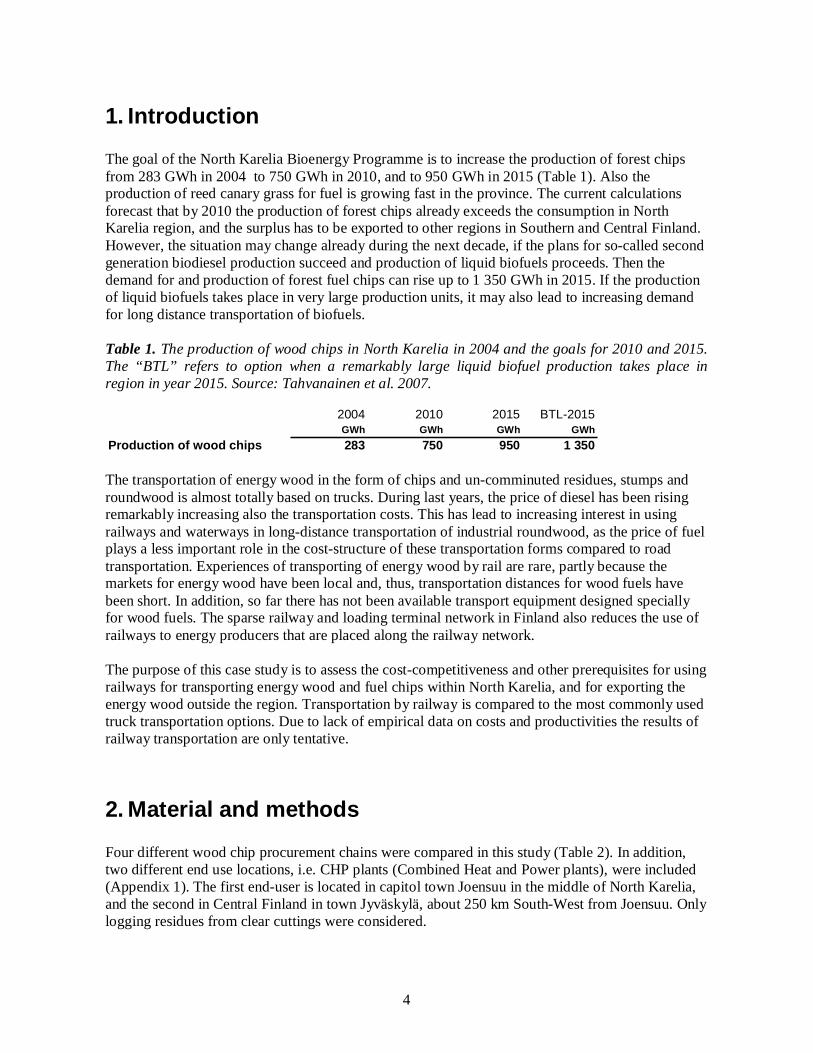
1. Introduction The goal of the North Karelia Bioenergy Programme is to increase the production of forest chips from 283 GWh in 2004 to 750 GWh in 2010, and to 950 GWh in 2015 (Table 1). Also the production of reed canary grass for fuel is growing fast in the province. The current calculations forecast that by 2010 the production of forest chips already exceeds the consumption in North Karelia region, and the surplus has to be exported to other regions in Southern and Central Finland. However, the situation may change already during the next decade, if the plans for so-called second generation biodiesel production succeed and production of liquid biofuels proceeds. Then the demand for and production of forest fuel chips can rise up to 1 350 GWh in 2015. If the production of liquid biofuels takes place in very large production units, it may also lead to increasing demand for long distance transportation of biofuels. Table 1. The production of wood chips in North Karelia in 2004 and the goals for 2010 and 2015. The “BTL” refers to option when a remarkably large liquid biofuel production takes place in region in year 2015. Source: Tahvanainen et al. 2007.
2004 2010 2015 BTL-2015GWh GWh GWh GWh
Production of wood chips 283 750 950 1 350 The transportation of energy wood in the form of chips and un-comminuted residues, stumps and roundwood is almost totally based on trucks. During last years, the price of diesel has been rising remarkably increasing also the transportation costs. This has lead to increasing interest in using railways and waterways in long-distance transportation of industrial roundwood, as the price of fuel plays a less important role in the cost-structure of these transportation forms compared to road transportation. Experiences of transporting of energy wood by rail are rare, partly because the markets for energy wood have been local and, thus, transportation distances for wood fuels have been short. In addition, so far there has not been available transport equipment designed specially for wood fuels. The sparse railway and loading terminal network in Finland also reduces the use of railways to energy producers that are placed along the railway network. The purpose of this case study is to assess the cost-competitiveness and other prerequisites for using railways for transporting energy wood and fuel chips within North Karelia, and for exporting the energy wood outside the region. Transportation by railway is compared to the most commonly used truck transportation options. Due to lack of empirical data on costs and productivities the results of railway transportation are only tentative.
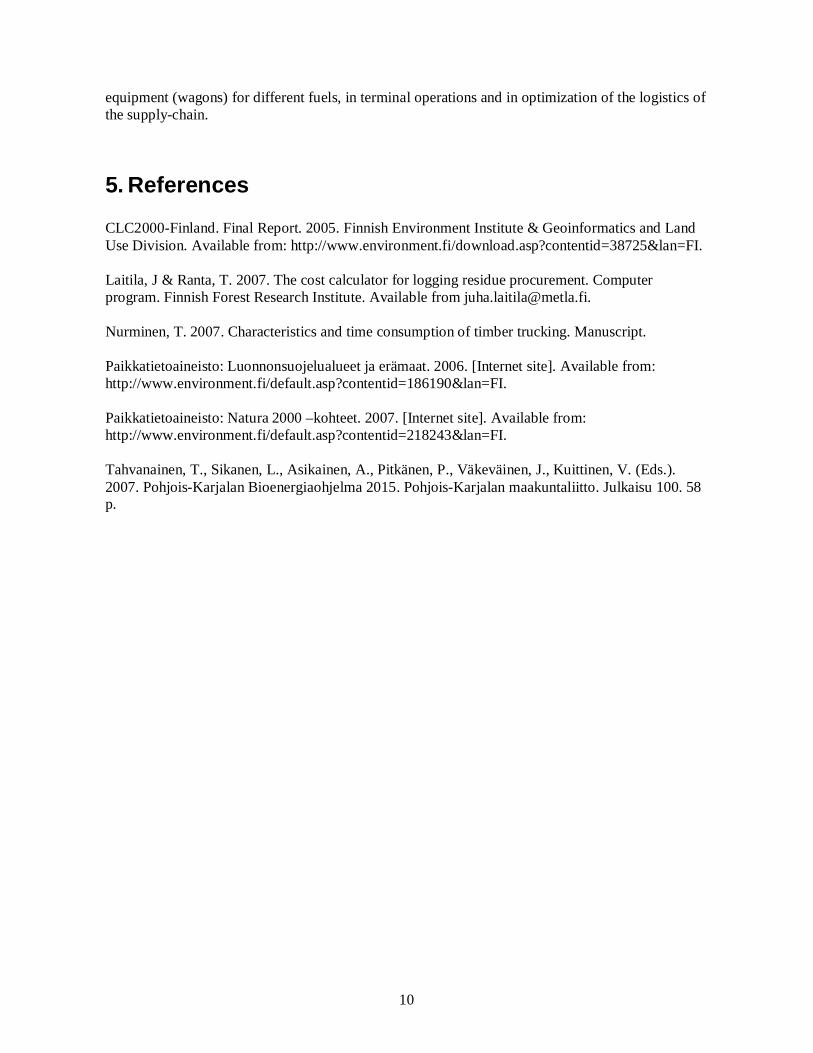
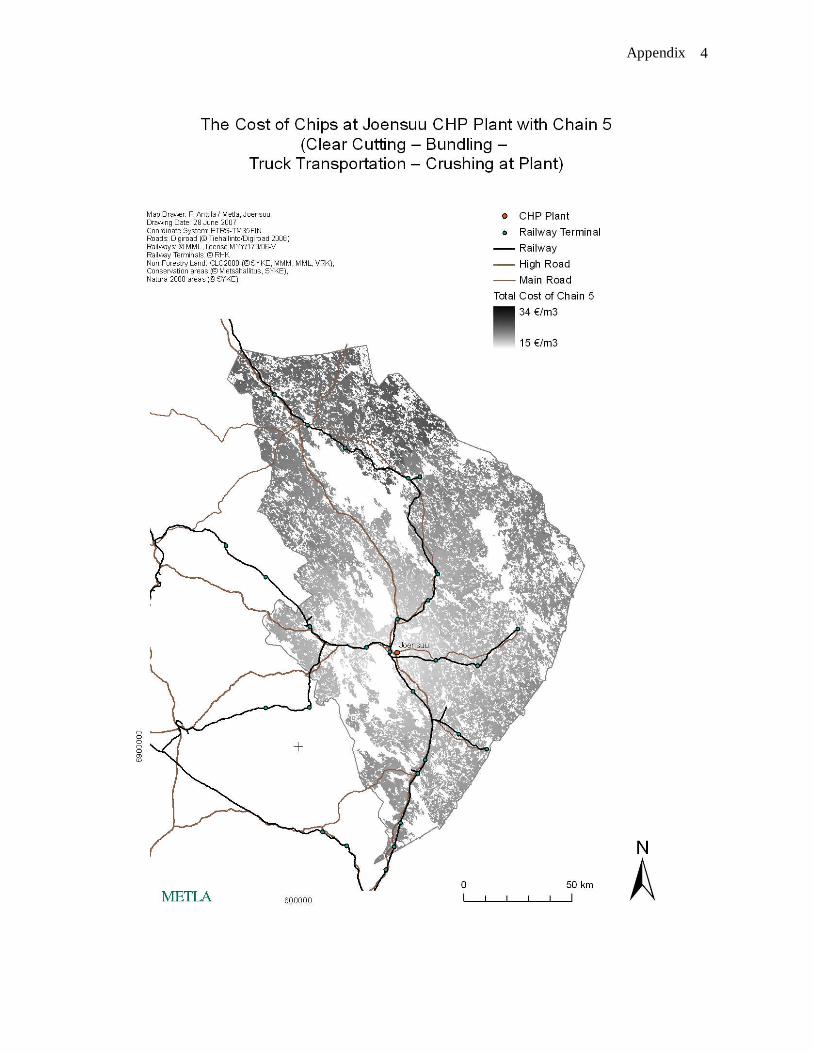
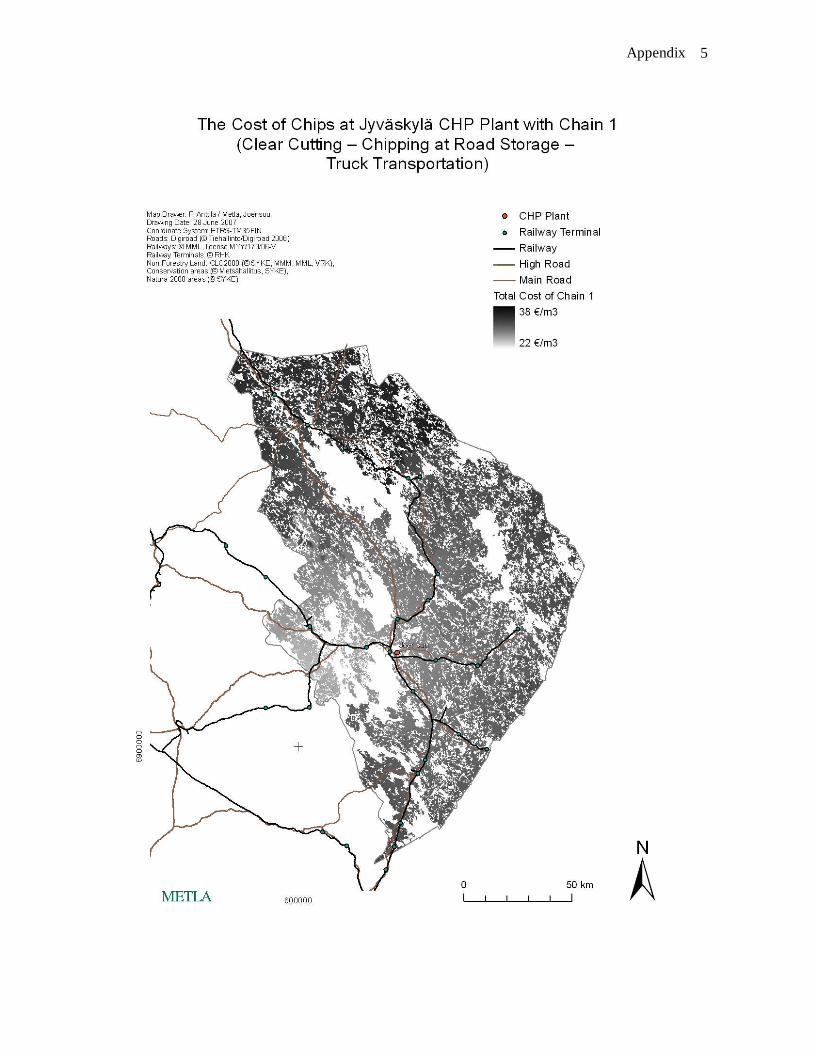
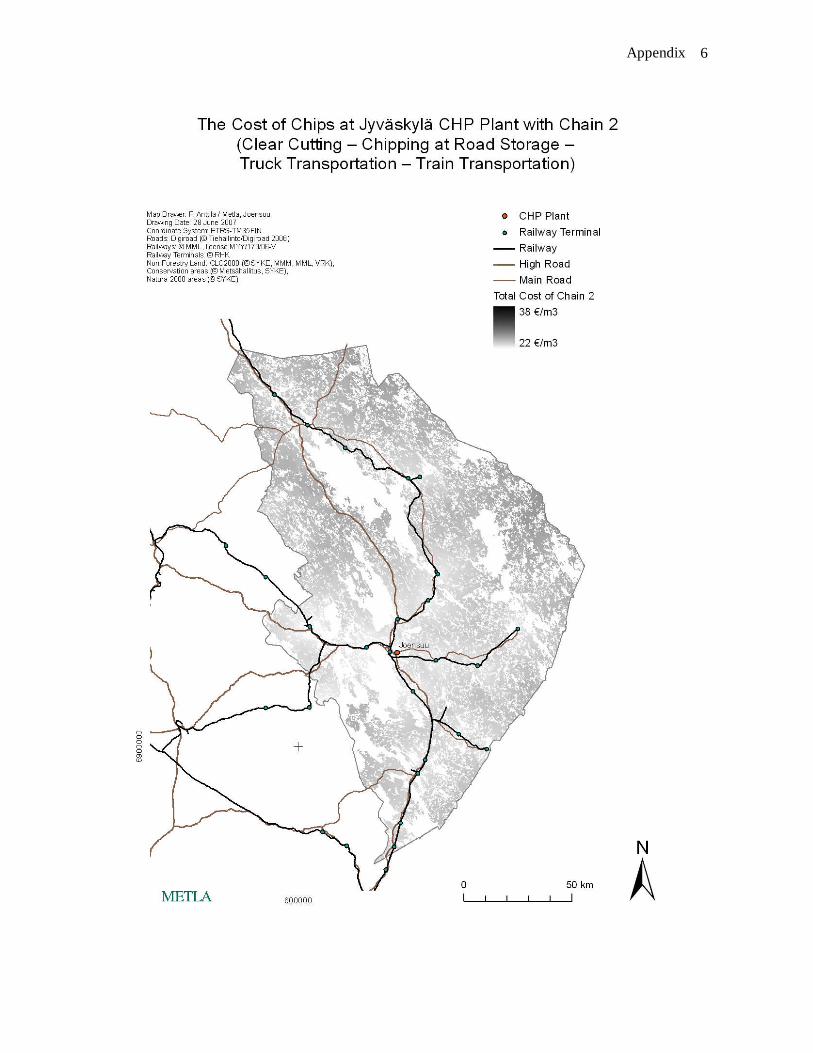
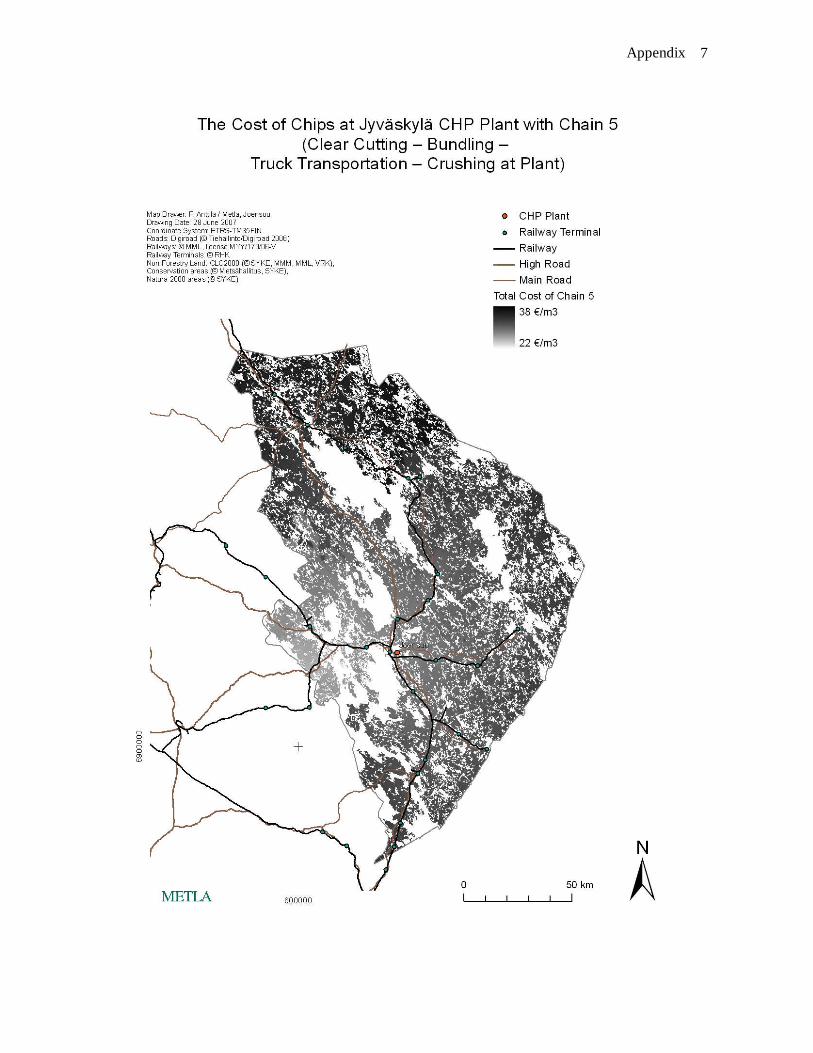
2. Material and methods Four different wood chip procurement chains were compared in this study (Table 2). In addition, two different end use locations, i.e. CHP plants (Combined Heat and Power plants), were included (Appendix 1). The first end-user is located in capitol town Joensuu in the middle of North Karelia, and the second in Central Finland in town Jyväskylä, about 250 km South-West from Joensuu. Only logging residues from clear cuttings were considered.
5
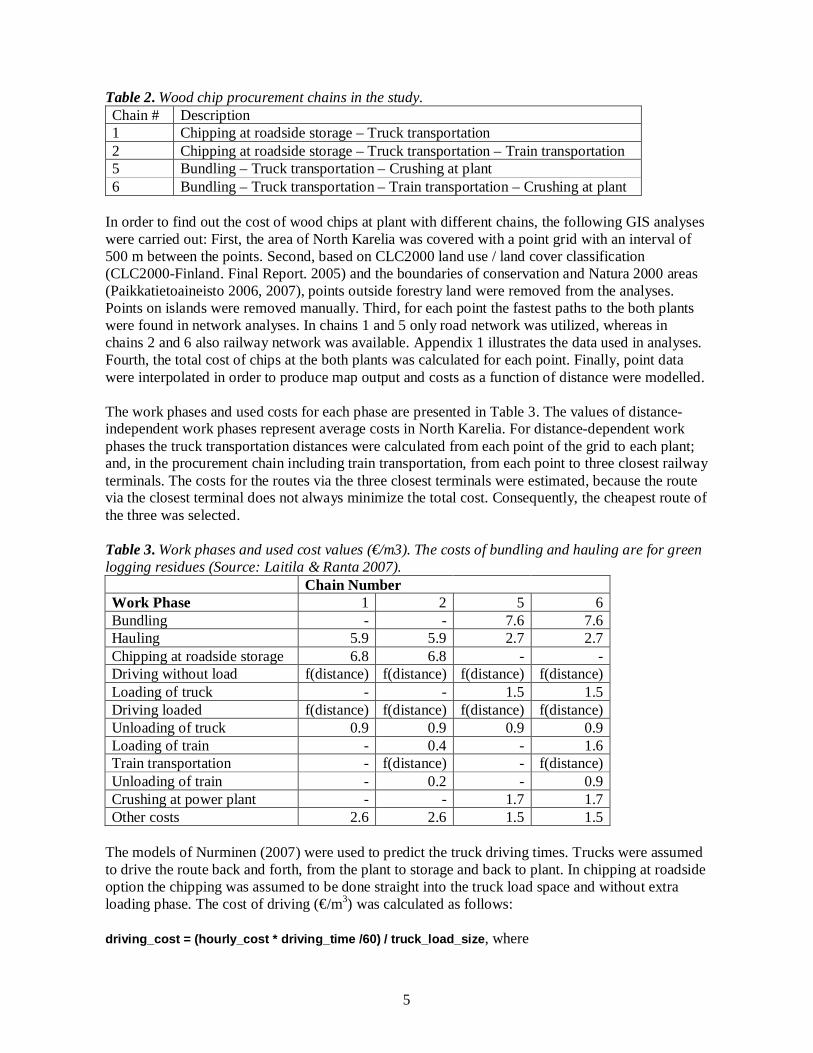
Table 2. Wood chip procurement chains in the study. Chain # Description 1 Chipping at roadside storage – Truck transportation 2 Chipping at roadside storage – Truck transportation – Train transportation 5 Bundling – Truck transportation – Crushing at plant 6 Bundling – Truck transportation – Train transportation – Crushing at plant
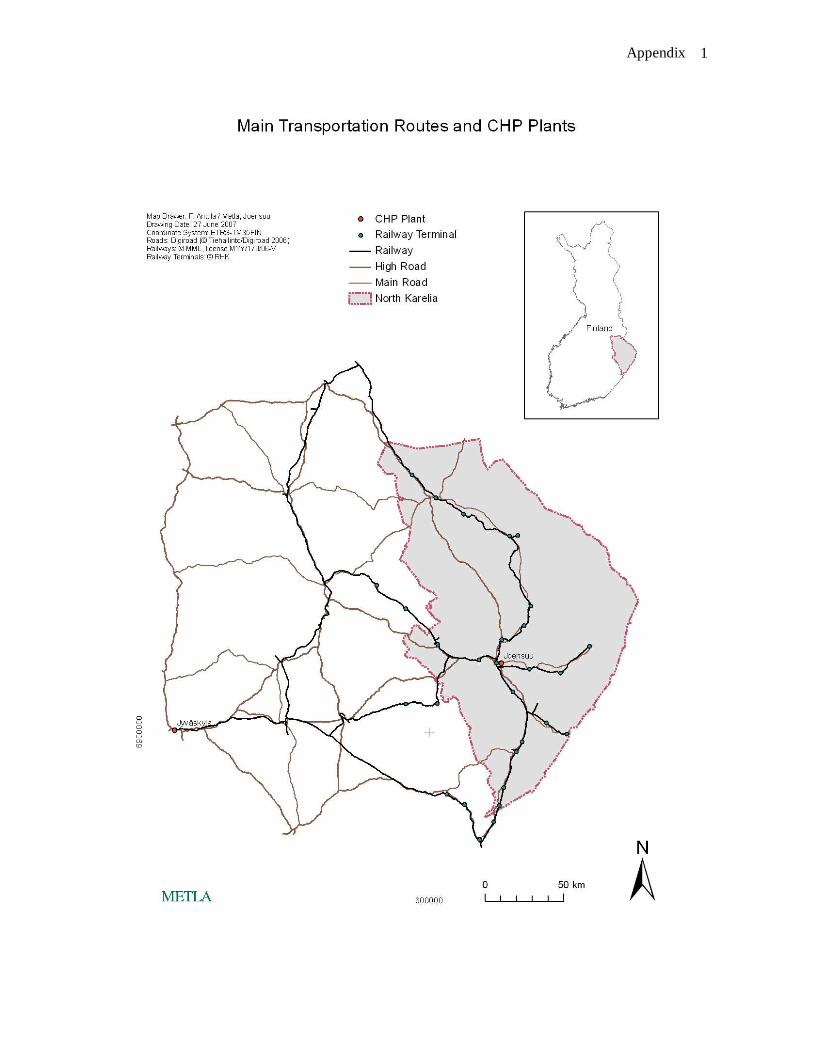
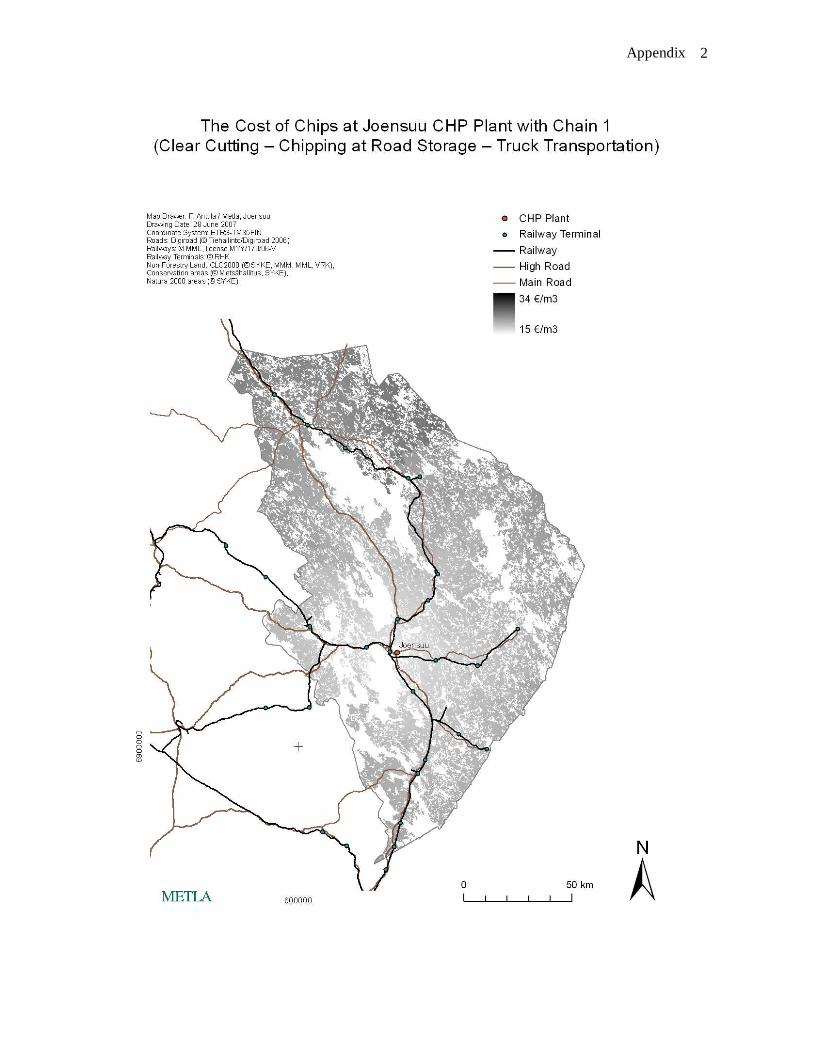
In order to find out the cost of wood chips at plant with different chains, the following GIS analyses were carried out: First, the area of North Karelia was covered with a point grid with an interval of 500 m between the points. Second, based on CLC2000 land use / land cover classification (CLC2000-Finland. Final Report. 2005) and the boundaries of conservation and Natura 2000 areas (Paikkatietoaineisto 2006, 2007), points outside forestry land were removed from the analyses. Points on islands were removed manually. Third, for each point the fastest paths to the both plants were found in network analyses. In chains 1 and 5 only road network was utilized, whereas in chains 2 and 6 also railway network was available. Appendix 1 illustrates the data used in analyses. Fourth, the total cost of chips at the both plants was calculated for each point. Finally, point data were interpolated in order to produce map output and costs as a function of distance were modelled. The work phases and used costs for each phase are presented in Table 3. The values of distance-independent work phases represent average costs in North Karelia. For distance-dependent work phases the truck transportation distances were calculated from each point of the grid to each plant; and, in the procurement chain including train transportation, from each point to three closest railway terminals. The costs for the routes via the three closest terminals were estimated, because the route via the closest terminal does not always minimize the total cost. Consequently, the cheapest route of the three was selected. Table 3. Work phases and used cost values (€/m3). The costs of bundling and hauling are for green logging residues (Source: Laitila & Ranta 2007). Chain Number Work Phase 1 2 5 6 Bundling - - 7.6 7.6 Hauling 5.9 5.9 2.7 2.7 Chipping at roadside storage 6.8 6.8 - - Driving without load f(distance) f(distance) f(distance) f(distance) Loading of truck - - 1.5 1.5 Driving loaded f(distance) f(distance) f(distance) f(distance) Unloading of truck 0.9 0.9 0.9 0.9 Loading of train - 0.4 - 1.6 Train transportation - f(distance) - f(distance) Unloading of train - 0.2 - 0.9 Crushing at power plant - - 1.7 1.7 Other costs 2.6 2.6 1.5 1.5
The models of Nurminen (2007) were used to predict the truck driving times. Trucks were assumed to drive the route back and forth, from the plant to storage and back to plant. In chipping at roadside option the chipping was assumed to be done straight into the truck load space and without extra loading phase. The cost of driving (€/m3) was calculated as follows: driving_cost = (hourly_cost * driving_time /60) / truck_load_siz e, where
6
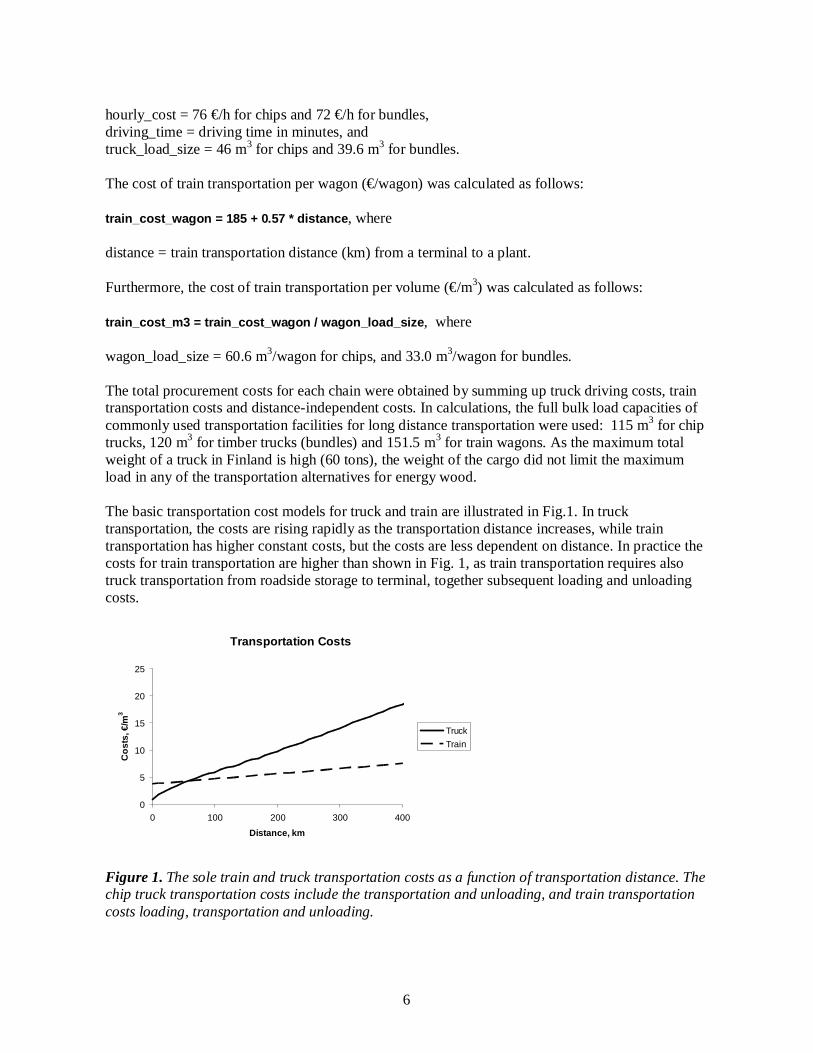
hourly_cost = 76 €/h for chips and 72 €/h for bundles, driving_time = driving time in minutes, and truck_load_size = 46 m3 for chips and 39.6 m3 for bundles. The cost of train transportation per wagon (€/wagon) was calculated as follows: train_cost_wagon = 185 + 0.57 * distance , where distance = train transportation distance (km) from a terminal to a plant. Furthermore, the cost of train transportation per volume (€/m3) was calculated as follows: train_cost_m3 = train_cost_wagon / wagon_load_size , where wagon_load_size = 60.6 m3/wagon for chips, and 33.0 m3/wagon for bundles. The total procurement costs for each chain were obtained by summing up truck driving costs, train transportation costs and distance-independent costs. In calculations, the full bulk load capacities of commonly used transportation facilities for long distance transportation were used: 115 m3 for chip trucks, 120 m3 for timber trucks (bundles) and 151.5 m3 for train wagons. As the maximum total weight of a truck in Finland is high (60 tons), the weight of the cargo did not limit the maximum load in any of the transportation alternatives for energy wood. The basic transportation cost models for truck and train are illustrated in Fig.1. In truck transportation, the costs are rising rapidly as the transportation distance increases, while train transportation has higher constant costs, but the costs are less dependent on distance. In practice the costs for train transportation are higher than shown in Fig. 1, as train transportation requires also truck transportation from roadside storage to terminal, together subsequent loading and unloading costs.
Transportation Costs
0
5
10
15
20
25
0 100 200 300 400
Distance, km
Cos
ts, €
/m3
Truck
Train
Figure 1. The sole train and truck transportation costs as a function of transportation distance. The chip truck transportation costs include the transportation and unloading, and train transportation costs loading, transportation and unloading.
7
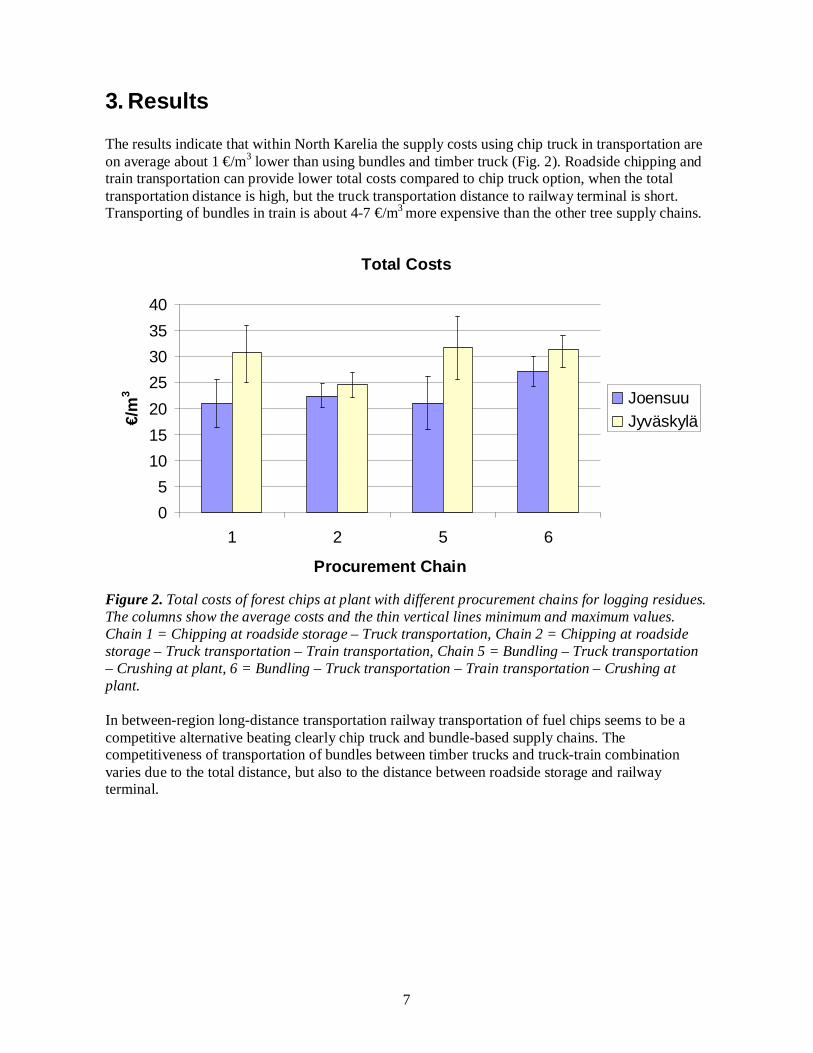
3. Results The results indicate that within North Karelia the supply costs using chip truck in transportation are on average about 1 €/m3 lower than using bundles and timber truck (Fig. 2). Roadside chipping and train transportation can provide lower total costs compared to chip truck option, when the total transportation distance is high, but the truck transportation distance to railway terminal is short. Transporting of bundles in train is about 4-7 €/m3 more expensive than the other tree supply chains.
Total Costs
0
5
10
15
20
25
30
35
40
1 2 5 6
Procurement Chain
€/m
3 JoensuuJyväskylä
Figure 2. Total costs of forest chips at plant with different procurement chains for logging residues. The columns show the average costs and the thin vertical lines minimum and maximum values. Chain 1 = Chipping at roadside storage – Truck transportation, Chain 2 = Chipping at roadside storage – Truck transportation – Train transportation, Chain 5 = Bundling – Truck transportation – Crushing at plant, 6 = Bundling – Truck transportation – Train transportation – Crushing at plant. In between-region long-distance transportation railway transportation of fuel chips seems to be a competitive alternative beating clearly chip truck and bundle-based supply chains. The competitiveness of transportation of bundles between timber trucks and truck-train combination varies due to the total distance, but also to the distance between roadside storage and railway terminal.
8
Joensuu
15
17
19
21
23
25
27
0 10 20 30 40 50 60 70 80 90 100 110 120 130 140 150 160 170 180 190 200 210
Distance to plant, km
Tot
al c
ost,
€/m
3
Chain 1
Chain 2
Chain 5
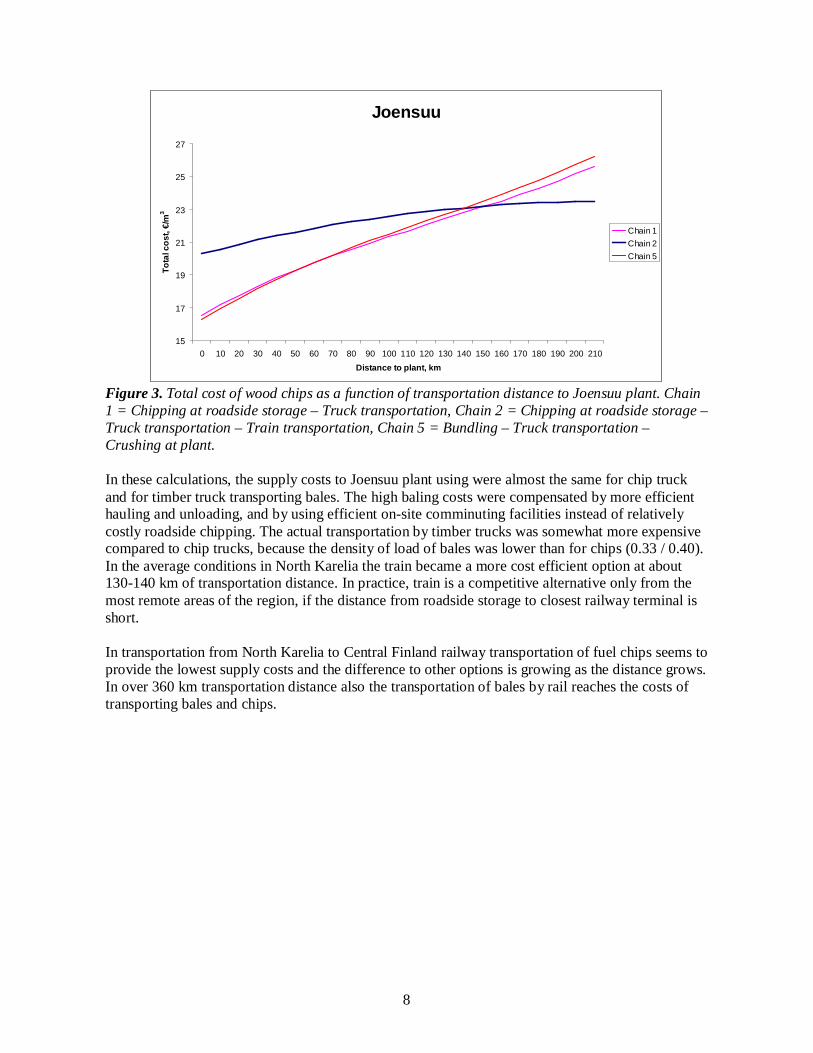
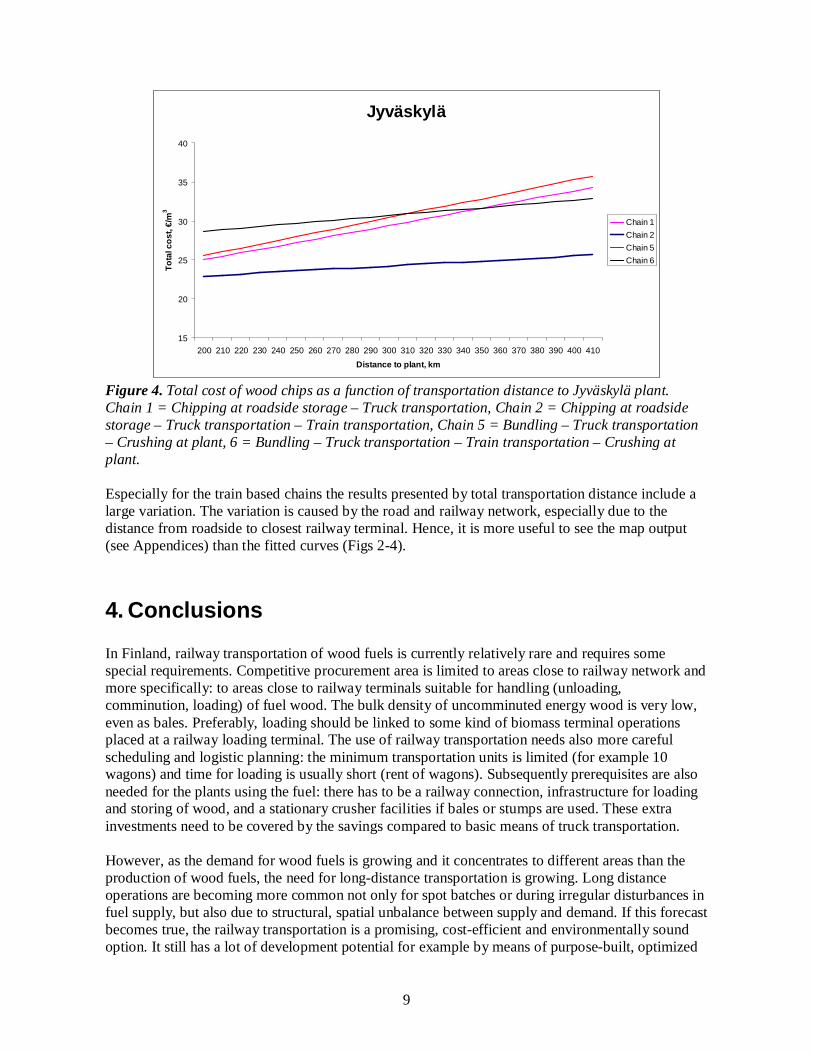
Figure 3. Total cost of wood chips as a function of transportation distance to Joensuu plant. Chain 1 = Chipping at roadside storage – Truck transportation, Chain 2 = Chipping at roadside storage – Truck transportation – Train transportation, Chain 5 = Bundling – Truck transportation – Crushing at plant. In these calculations, the supply costs to Joensuu plant using were almost the same for chip truck and for timber truck transporting bales. The high baling costs were compensated by more efficient hauling and unloading, and by using efficient on-site comminuting facilities instead of relatively costly roadside chipping. The actual transportation by timber trucks was somewhat more expensive compared to chip trucks, because the density of load of bales was lower than for chips (0.33 / 0.40). In the average conditions in North Karelia the train became a more cost efficient option at about 130-140 km of transportation distance. In practice, train is a competitive alternative only from the most remote areas of the region, if the distance from roadside storage to closest railway terminal is short. In transportation from North Karelia to Central Finland railway transportation of fuel chips seems to provide the lowest supply costs and the difference to other options is growing as the distance grows. In over 360 km transportation distance also the transportation of bales by rail reaches the costs of transporting bales and chips.
9
Jyväskylä
15
20
25
30
35
40
200 210 220 230 240 250 260 270 280 290 300 310 320 330 340 350 360 370 380 390 400 410
Distance to plant, km
Tot
al c
ost,
€/m
3
Chain 1
Chain 2
Chain 5
Chain 6
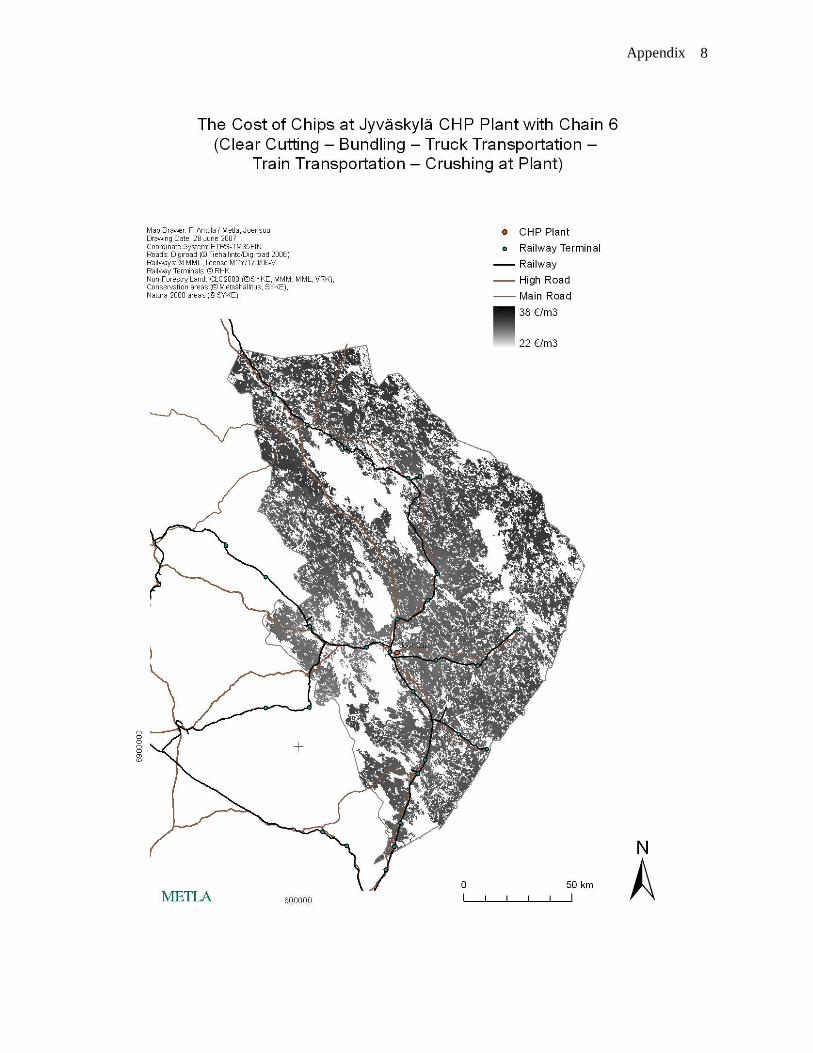
Figure 4. Total cost of wood chips as a function of transportation distance to Jyväskylä plant. Chain 1 = Chipping at roadside storage – Truck transportation, Chain 2 = Chipping at roadside storage – Truck transportation – Train transportation, Chain 5 = Bundling – Truck transportation – Crushing at plant, 6 = Bundling – Truck transportation – Train transportation – Crushing at plant. Especially for the train based chains the results presented by total transportation distance include a large variation. The variation is caused by the road and railway network, especially due to the distance from roadside to closest railway terminal. Hence, it is more useful to see the map output (see Appendices) than the fitted curves (Figs 2-4).
4. Conclusions In Finland, railway transportation of wood fuels is currently relatively rare and requires some special requirements. Competitive procurement area is limited to areas close to railway network and more specifically: to areas close to railway terminals suitable for handling (unloading, comminution, loading) of fuel wood. The bulk density of uncomminuted energy wood is very low, even as bales. Preferably, loading should be linked to some kind of biomass terminal operations placed at a railway loading terminal. The use of railway transportation needs also more careful scheduling and logistic planning: the minimum transportation units is limited (for example 10 wagons) and time for loading is usually short (rent of wagons). Subsequently prerequisites are also needed for the plants using the fuel: there has to be a railway connection, infrastructure for loading and storing of wood, and a stationary crusher facilities if bales or stumps are used. These extra investments need to be covered by the savings compared to basic means of truck transportation. However, as the demand for wood fuels is growing and it concentrates to different areas than the production of wood fuels, the need for long-distance transportation is growing. Long distance operations are becoming more common not only for spot batches or during irregular disturbances in fuel supply, but also due to structural, spatial unbalance between supply and demand. If this forecast becomes true, the railway transportation is a promising, cost-efficient and environmentally sound option. It still has a lot of development potential for example by means of purpose-built, optimized
10
equipment (wagons) for different fuels, in terminal operations and in optimization of the logistics of the supply-chain.
5. References CLC2000-Finland. Final Report. 2005. Finnish Environment Institute & Geoinformatics and Land Use Division. Available from: http://www.environment.fi/download.asp?contentid=38725&lan=FI. Laitila, J & Ranta, T. 2007. The cost calculator for logging residue procurement. Computer program. Finnish Forest Research Institute. Available from [email protected]. Nurminen, T. 2007. Characteristics and time consumption of timber trucking. Manuscript. Paikkatietoaineisto: Luonnonsuojelualueet ja erämaat. 2006. [Internet site]. Available from: http://www.environment.fi/default.asp?contentid=186190&lan=FI. Paikkatietoaineisto: Natura 2000 –kohteet. 2007. [Internet site]. Available from: http://www.environment.fi/default.asp?contentid=218243&lan=FI. Tahvanainen, T., Sikanen, L., Asikainen, A., Pitkänen, P., Väkeväinen, J., Kuittinen, V. (Eds.). 2007. Pohjois-Karjalan Bioenergiaohjelma 2015. Pohjois-Karjalan maakuntaliitto. Julkaisu 100. 58 p.
Appendix
1
Appendix
2
Appendix
3
Appendix
4
Appendix
5
Appendix
6
Appendix
7
Appendix
8