Embed Size (px)
Citation preview
Harris: Quantitative Chemical Analysis, Eight Edition
CHAPTER 21: MASS SPECTROMETRY
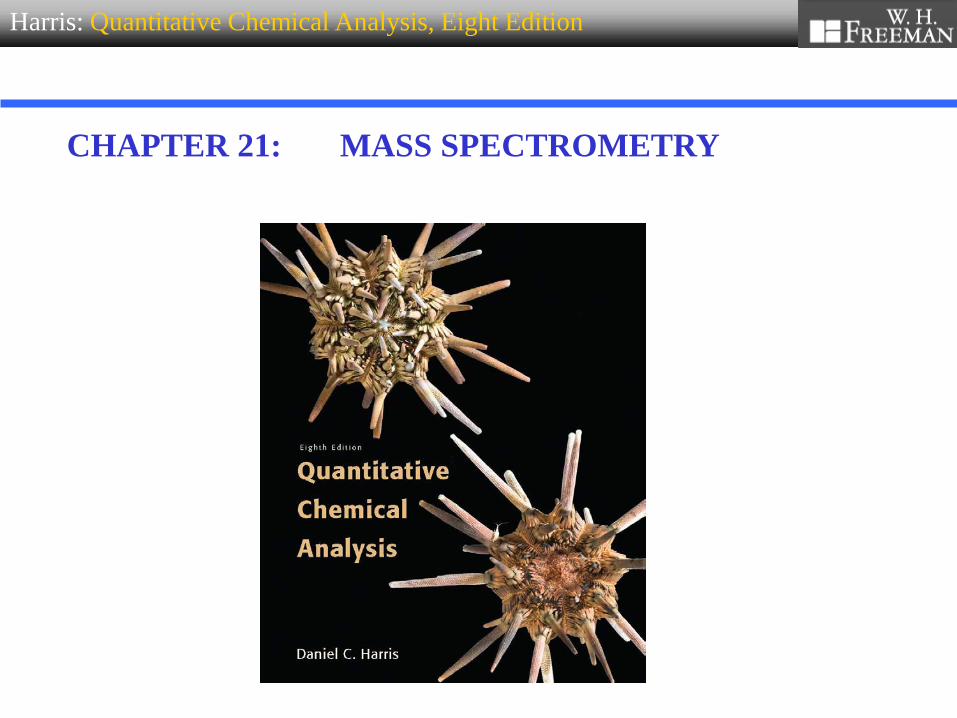
CHAPTER 21: Opener
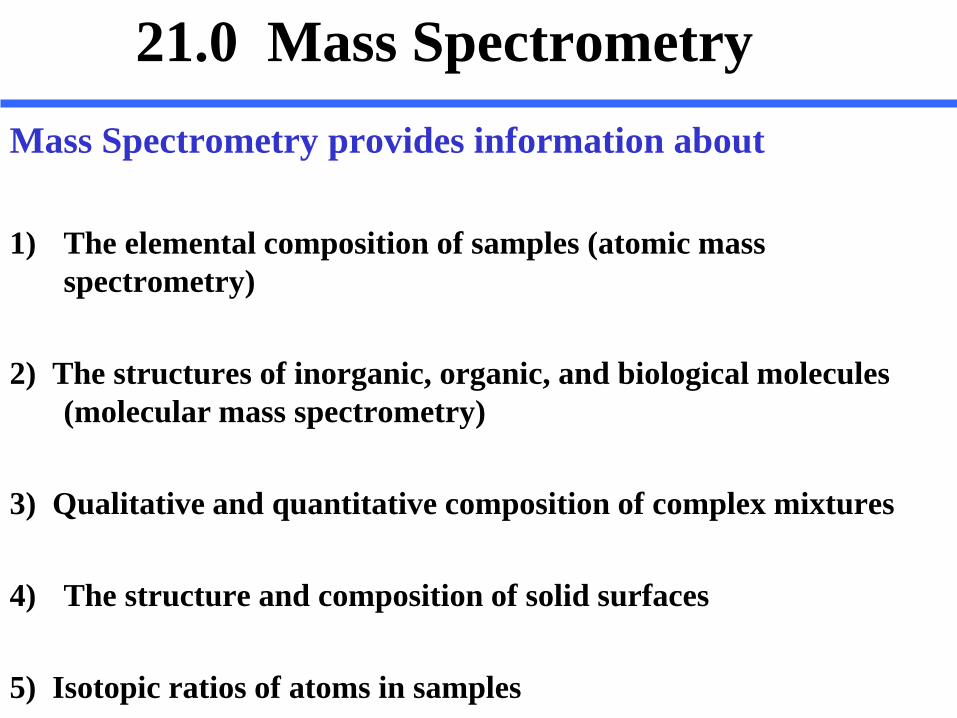
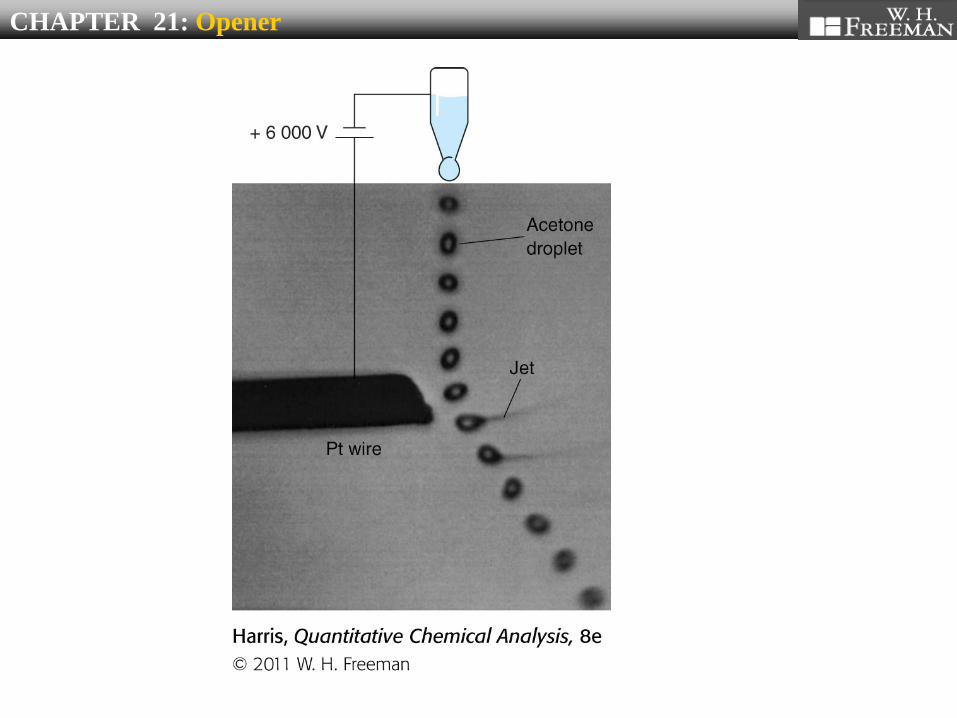
21.0 Mass Spectrometry Mass Spectrometry provides information about
1) The elemental composition of samples (atomic mass
spectrometry) 2) The structures of inorganic, organic, and biological molecules
(molecular mass spectrometry) 3) Qualitative and quantitative composition of complex mixtures 4) The structure and composition of solid surfaces 5) Isotopic ratios of atoms in samples

21-1 What is Mass Spectrometry ?
The mass spectrum shows detector current as a function of m/z selected by the magnetic field
Atomic Mass Spectrum
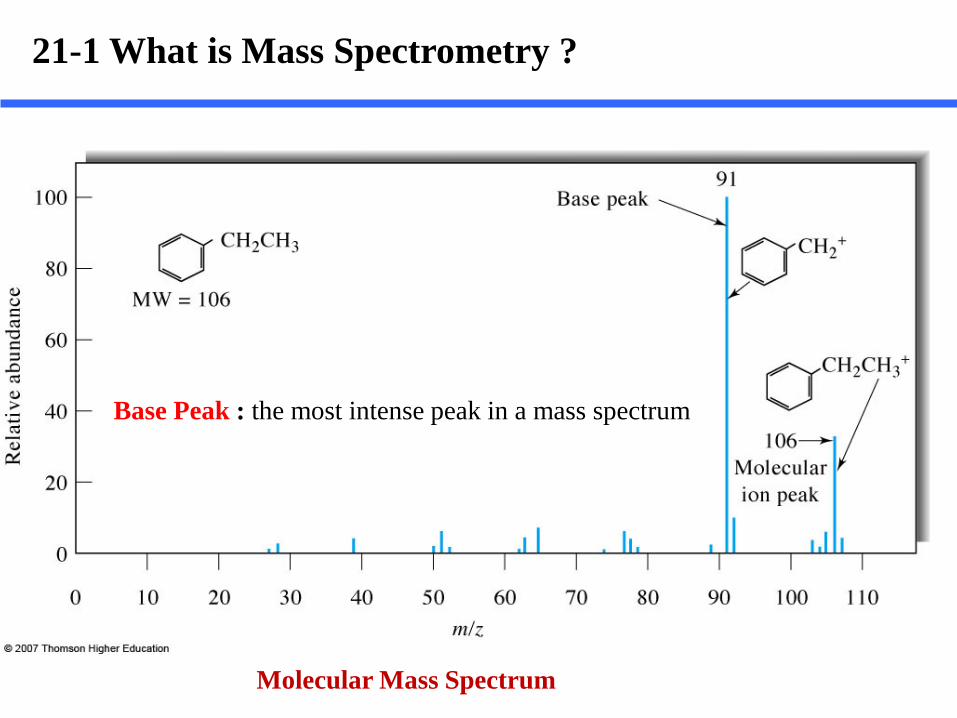
21-1 What is Mass Spectrometry ?
Molecular Mass Spectrum
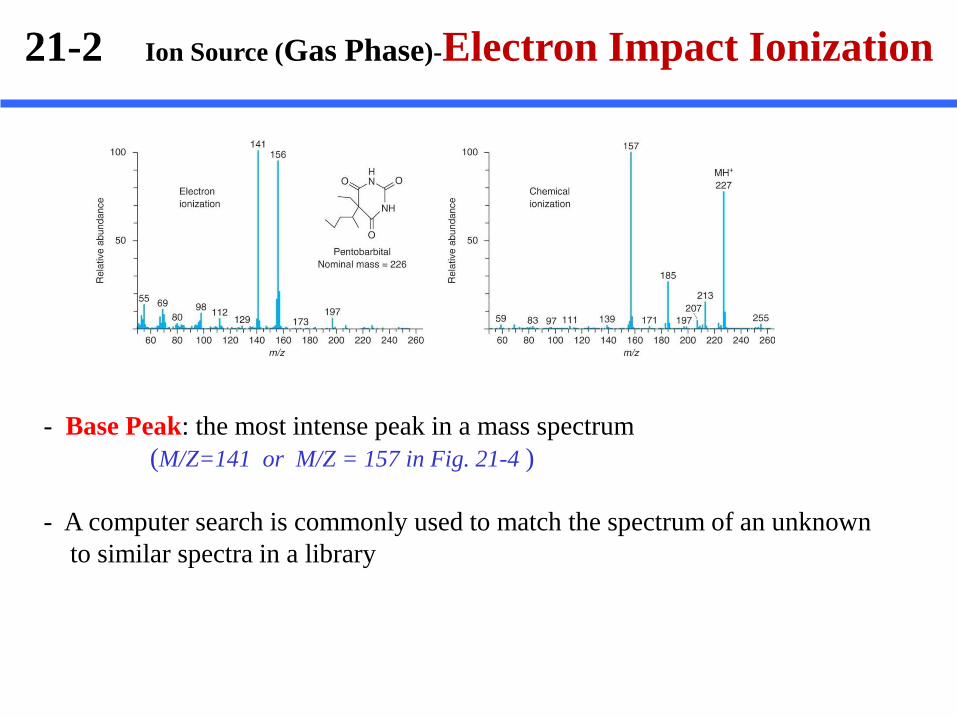
Base Peak : the most intense peak in a mass spectrum
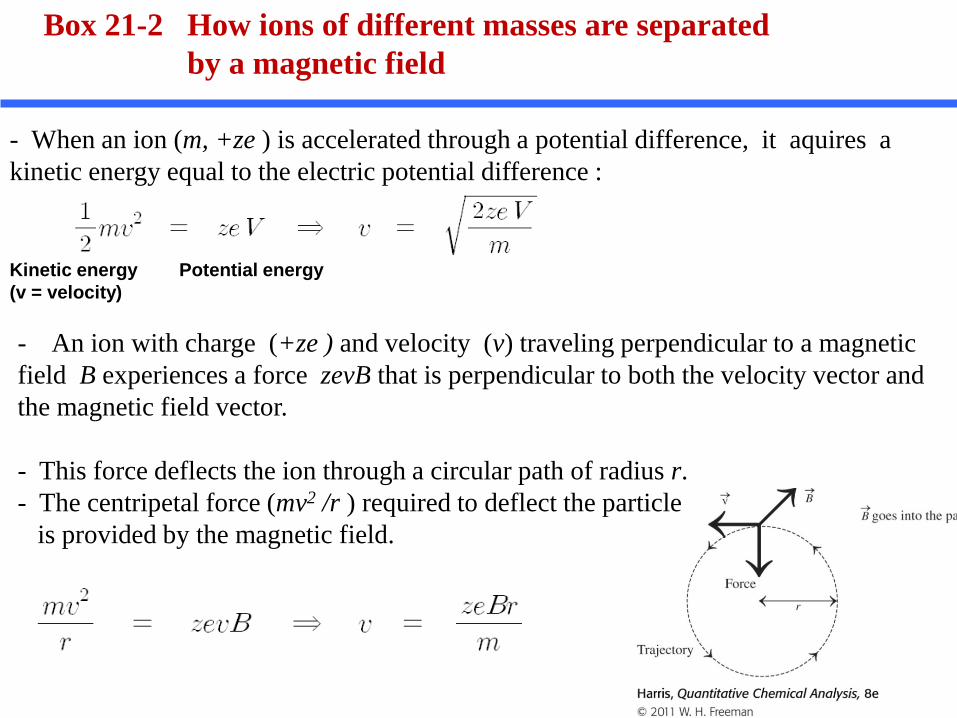
Box 21-2 How ions of different masses are separated by a magnetic field
- When an ion (m, +ze ) is accelerated through a potential difference, it aquires a kinetic energy equal to the electric potential difference :
- An ion with charge (+ze ) and velocity (v) traveling perpendicular to a magnetic field B experiences a force zevB that is perpendicular to both the velocity vector and the magnetic field vector. - This force deflects the ion through a circular path of radius r. - The centripetal force (mv2 /r ) required to deflect the particle is provided by the magnetic field.
Kinetic energy (v = velocity)
Potential energy
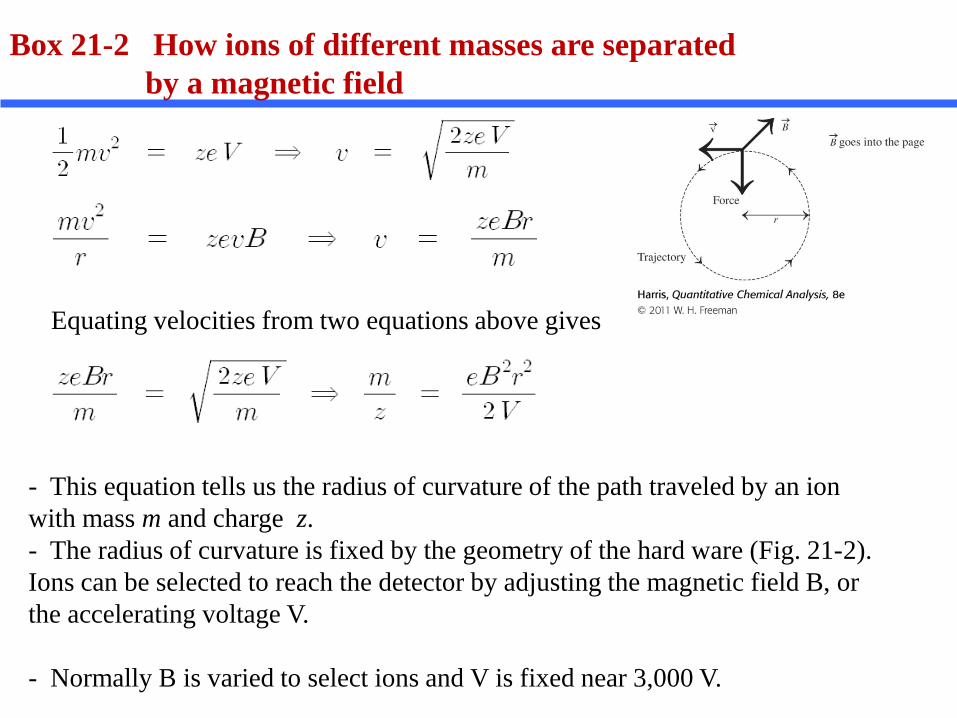
Box 21-2 How ions of different masses are separated by a magnetic field
Equating velocities from two equations above gives
- This equation tells us the radius of curvature of the path traveled by an ion with mass m and charge z. - The radius of curvature is fixed by the geometry of the hard ware (Fig. 21-2). Ions can be selected to reach the detector by adjusting the magnetic field B, or the accelerating voltage V.
- Normally B is varied to select ions and V is fixed near 3,000 V.
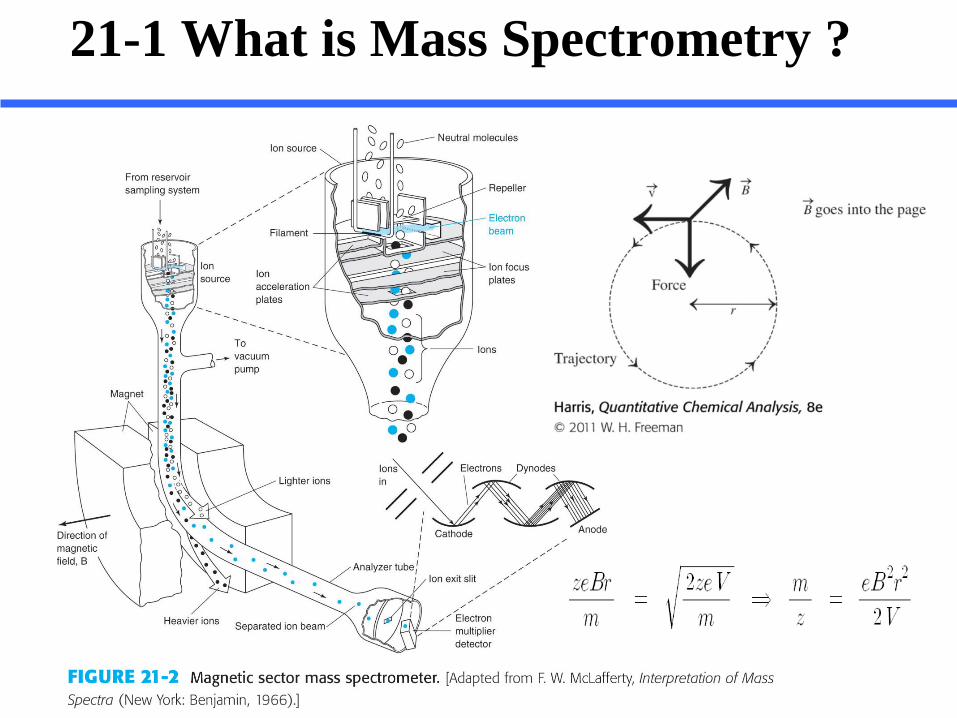
21-1 What is Mass Spectrometry ?
21-1 components of a mass spectrometer
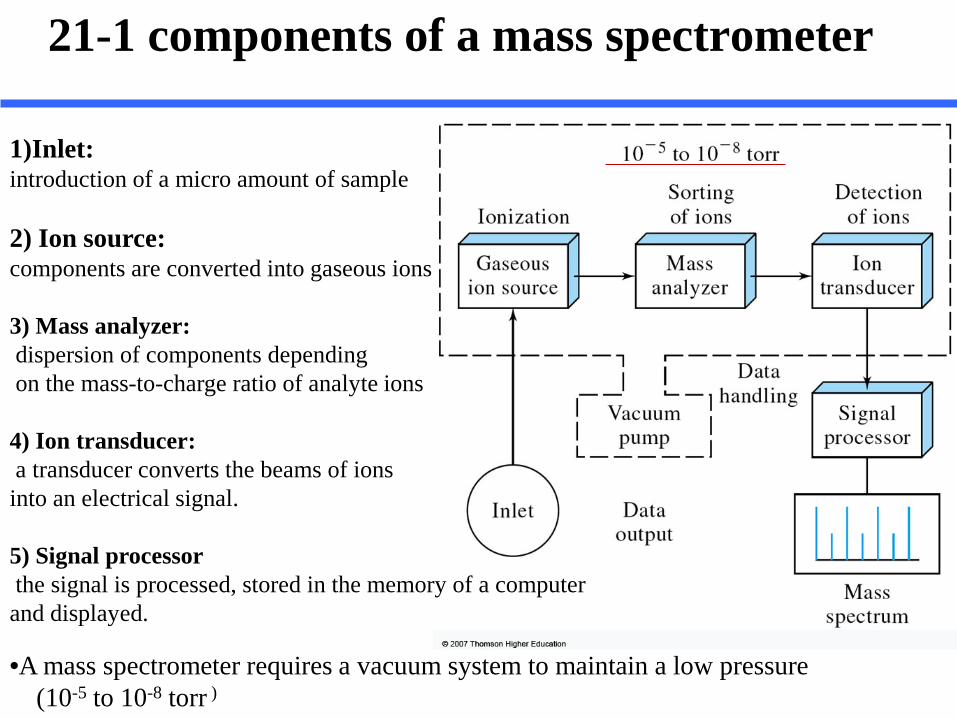
1)Inlet: introduction of a micro amount of sample 2) Ion source: components are converted into gaseous ions 3) Mass analyzer: dispersion of components depending on the mass-to-charge ratio of analyte ions 4) Ion transducer: a transducer converts the beams of ions into an electrical signal. 5) Signal processor the signal is processed, stored in the memory of a computer and displayed.
•A mass spectrometer requires a vacuum system to maintain a low pressure (10-5 to 10-8 torr )
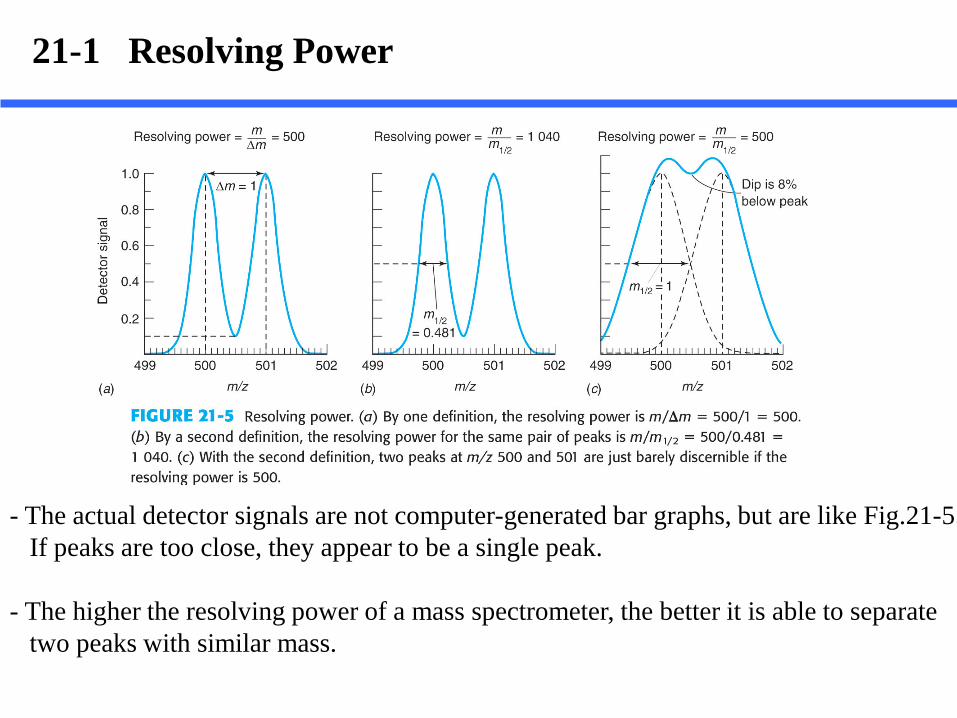
21-1 Resolving Power
- The actual detector signals are not computer-generated bar graphs, but are like Fig.21-5. If peaks are too close, they appear to be a single peak. - The higher the resolving power of a mass spectrometer, the better it is able to separate two peaks with similar mass.
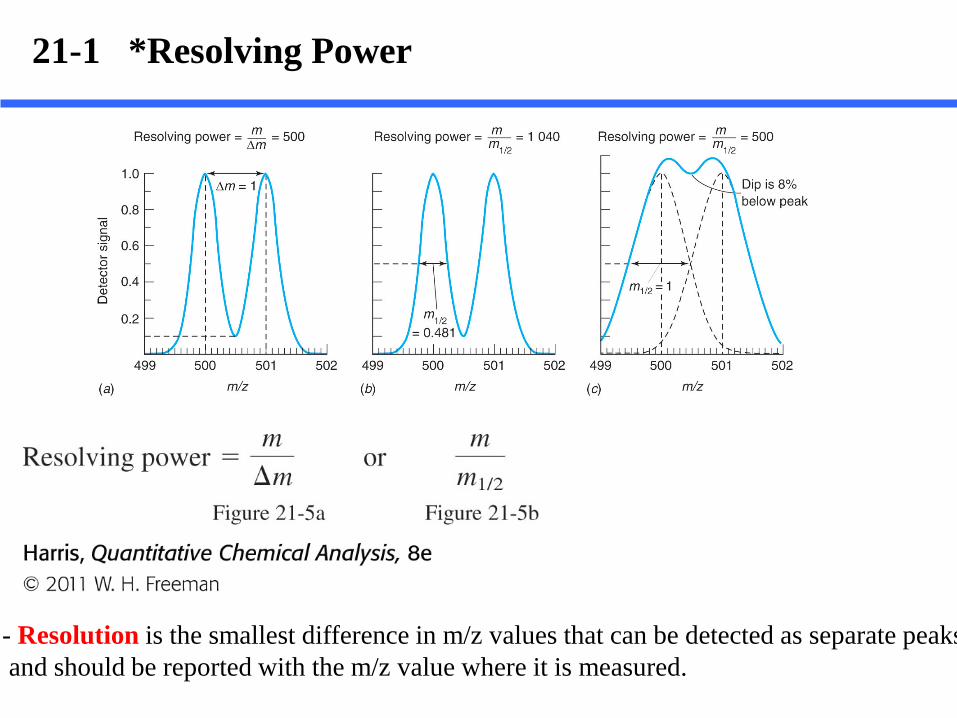
21-1 *Resolving Power
- Resolution is the smallest difference in m/z values that can be detected as separate peaks and should be reported with the m/z value where it is measured.

21-1 components of a mass spectrometer
1)Inlet: introduction of a micro amount of sample 2) Ion source: components are converted into gaseous ions 3) Mass analyzer: dispersion of components depending on the mass-to-charge ratio of analyte ions 4) Ion transducer: a transducer converts the beams of ions into an electrical signal. 5) Signal processor the signal is processed, stored in the memory of a computer and displayed.
•A mass spectrometer requires a vacuum system to maintain a low pressure (10-5 to 10-8 torr )
21-1 Ion Sources
- The starting point for a mass spectrometeric analysis is the formation of gaseous analyte ions. - The scope and the utility of a mass spectrometric method is dictated by the ionization process. - The appearance of mass spectra for a given molecular species strongly depends on the method used for ion formation. - Compare the differences between ion sources for atomic mass and molecular mass spectrometers.
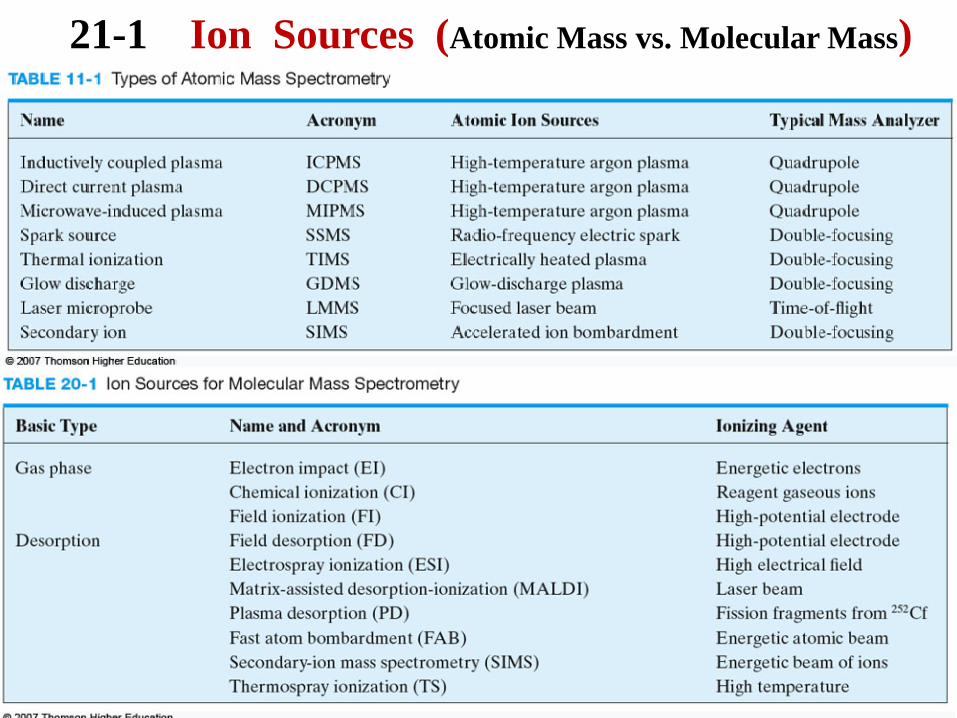
21-1 Ion Sources (Atomic Mass vs. Molecular Mass)
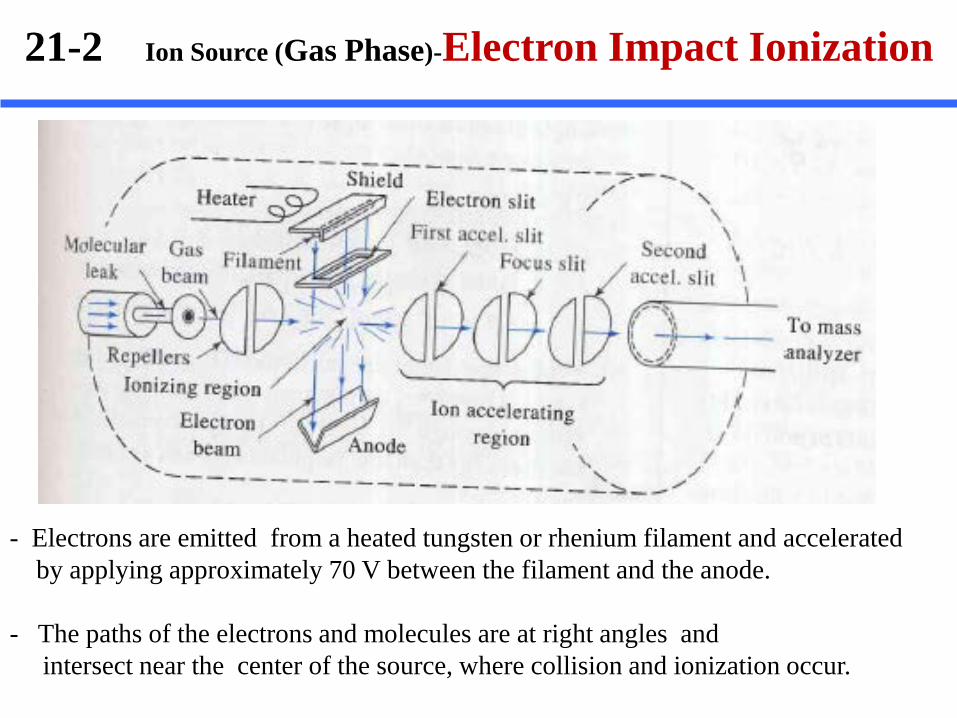
- Electrons are emitted from a heated tungsten or rhenium filament and accelerated by applying approximately 70 V between the filament and the anode. - The paths of the electrons and molecules are at right angles and intersect near the center of the source, where collision and ionization occur.
21-2 Ion Source (Gas Phase)-Electron Impact Ionization
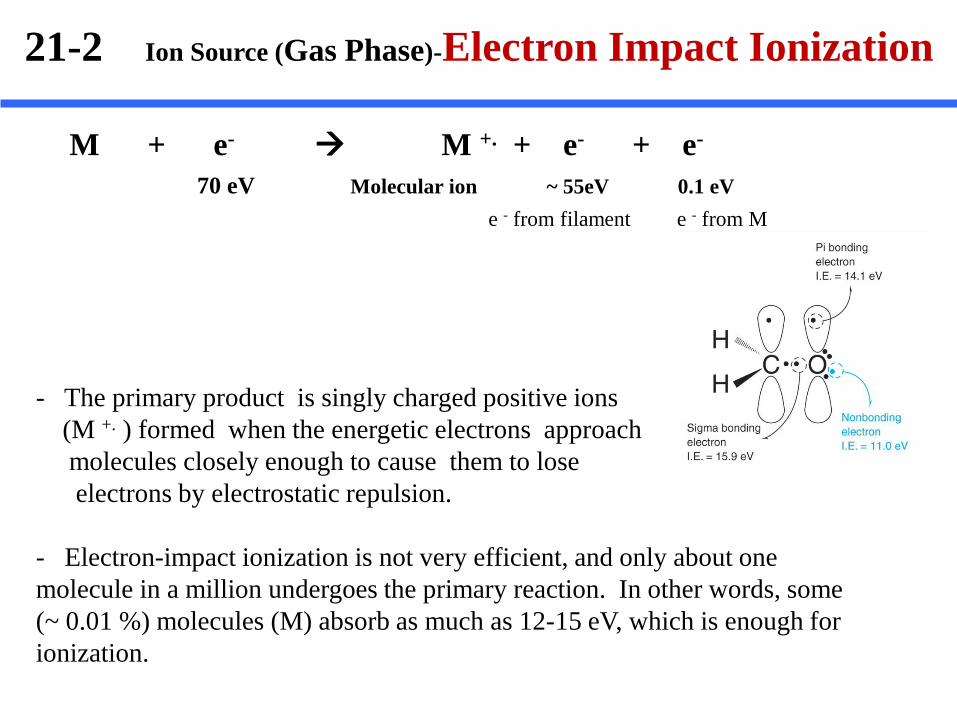
M + e- M +. + e- + e- 70 eV Molecular ion ~ 55eV 0.1 eV
- The primary product is singly charged positive ions (M +. ) formed when the energetic electrons approach molecules closely enough to cause them to lose electrons by electrostatic repulsion. - Electron-impact ionization is not very efficient, and only about one molecule in a million undergoes the primary reaction. In other words, some (~ 0.01 %) molecules (M) absorb as much as 12-15 eV, which is enough for ionization.
21-2 Ion Source (Gas Phase)-Electron Impact Ionization
e - from M e - from filament
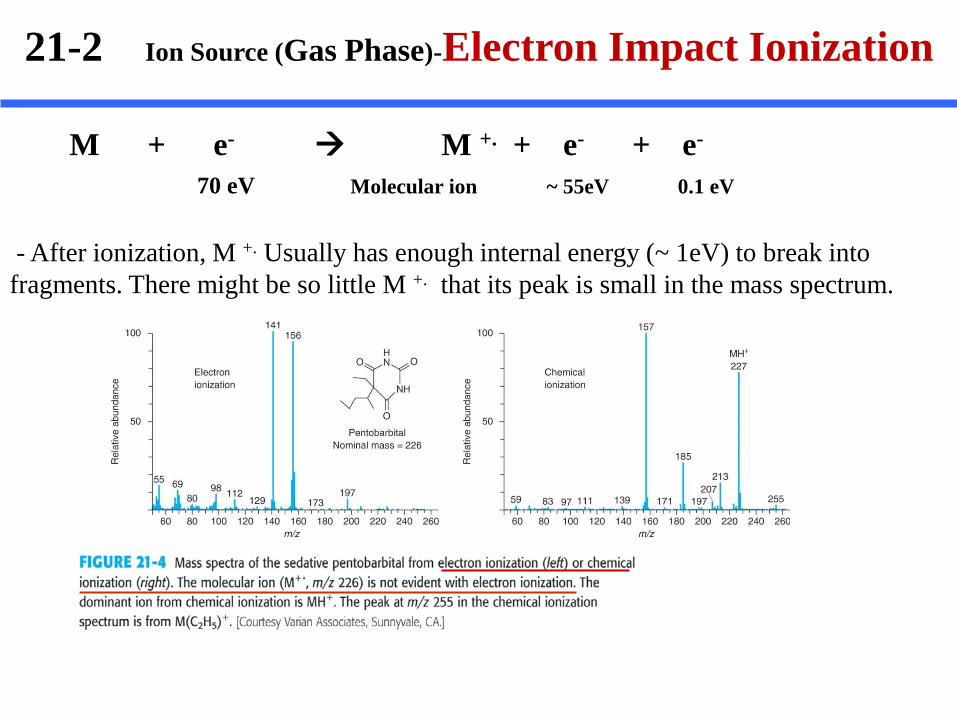
M + e- M +. + e- + e- 70 eV Molecular ion ~ 55eV 0.1 eV
- After ionization, M +. Usually has enough internal energy (~ 1eV) to break into fragments. There might be so little M +. that its peak is small in the mass spectrum.
21-2 Ion Source (Gas Phase)-Electron Impact Ionization
21-2 Ion Source (Gas Phase)-Electron Impact Ionization
- Base Peak: the most intense peak in a mass spectrum (M/Z=141 or M/Z = 157 in Fig. 21-4 ) - A computer search is commonly used to match the spectrum of an unknown to similar spectra in a library
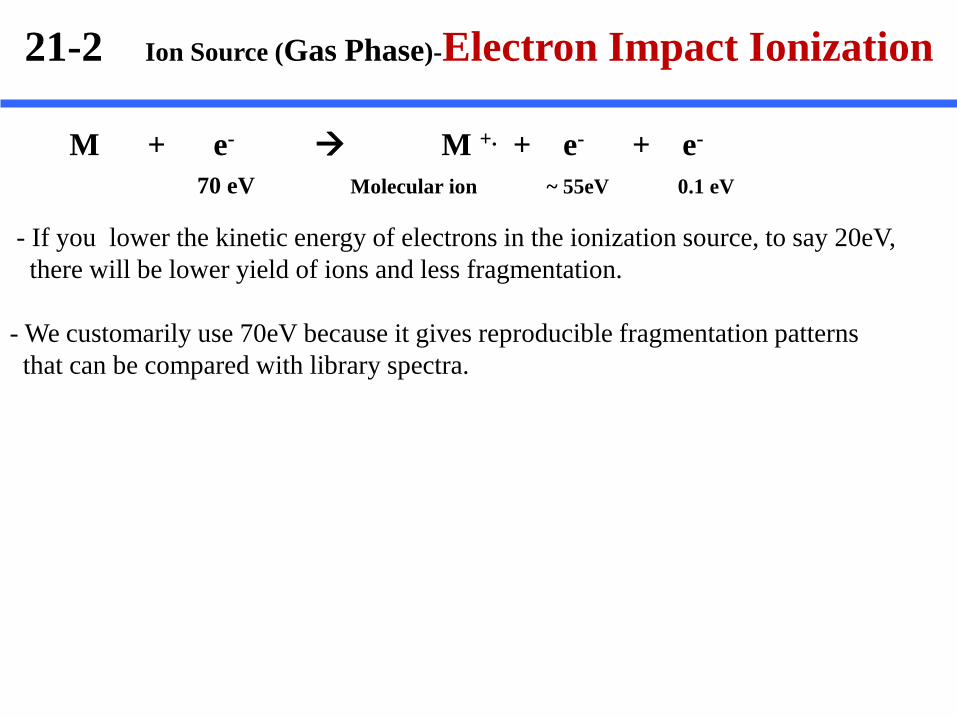
M + e- M +. + e- + e- 70 eV Molecular ion ~ 55eV 0.1 eV
- If you lower the kinetic energy of electrons in the ionization source, to say 20eV, there will be lower yield of ions and less fragmentation. - We customarily use 70eV because it gives reproducible fragmentation patterns that can be compared with library spectra.
21-2 Ion Source (Gas Phase)-Electron Impact Ionization
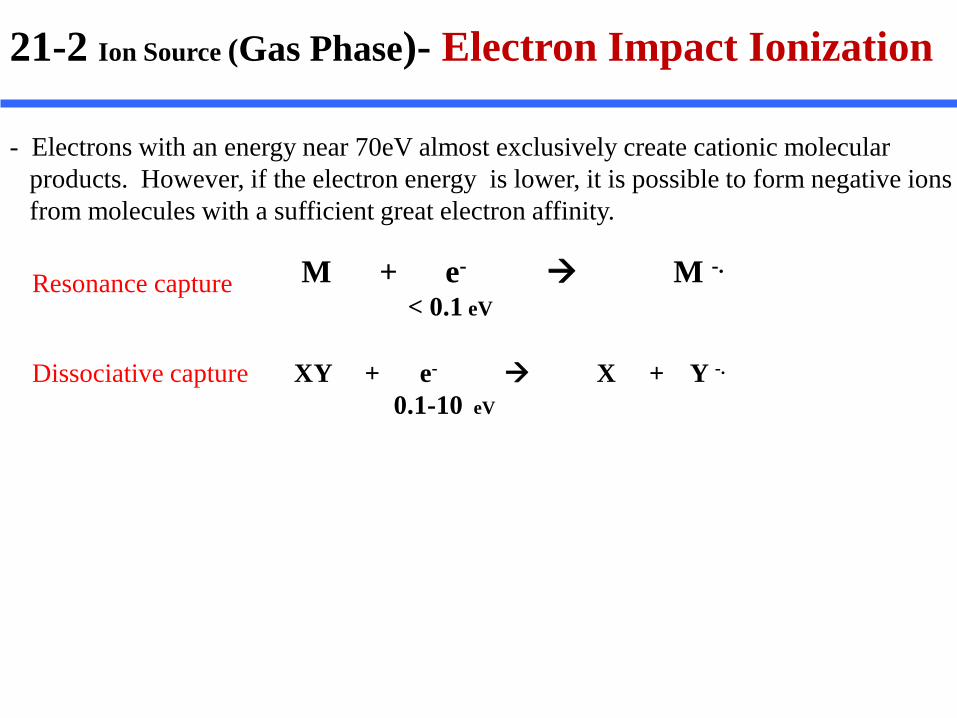
M + e- M -. < 0.1 eV
XY + e- X + Y -. 0.1-10 eV
Resonance capture
Dissociative capture
- Electrons with an energy near 70eV almost exclusively create cationic molecular products. However, if the electron energy is lower, it is possible to form negative ions from molecules with a sufficient great electron affinity.
21-2 Ion Source (Gas Phase)- Electron Impact Ionization
21-2 Ion Source (Gas Phase)-Chemical Ionization
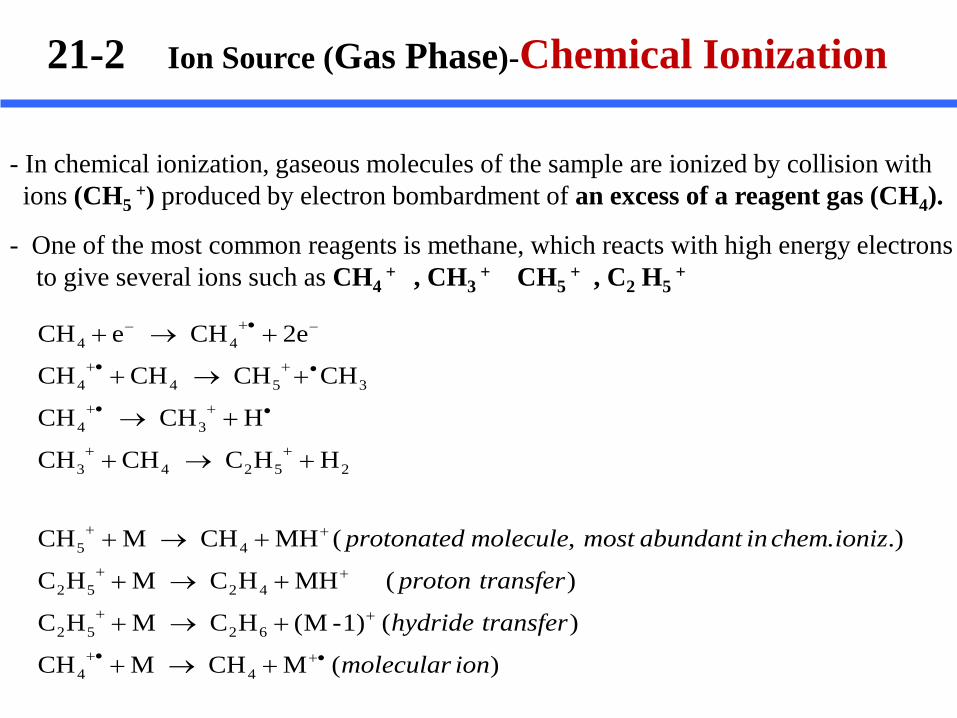
- In chemical ionization, gaseous molecules of the sample are ionized by collision with ions (CH5
+) produced by electron bombardment of an excess of a reagent gas (CH4).
)(MCHMCH
)(1)-M(HCMHC
)(MHHCMHC
.).,(MHCHMCH
HHCCHCH
HCHCH
CHCHCHCH
2eCHeCH
44
6252
4252
45
25243
34
3544
44
ionmolecular
transferhydride
transferproton
ionizcheminabundantmostmoleculeprotonated
•+•+
++
++
++
++
•+•+
•+•+
−•+−
+→+
+→+
+→+
+→+
+→+
+→
+→+
+→+
- One of the most common reagents is methane, which reacts with high energy electrons to give several ions such as CH4
+ , CH3 + CH5
+ , C2 H5 +
21-2 Ion Source (Gas Phase)-Chemical Ionization
- It is necessary to modify the electron beam ionization area used for electron ionization : a reagent gas pressure of about 1 Torr (1 mbar) while maintaining the pressure of the analyzer below 10-5 Torr. - Because of this large concentration difference, the high energy electron beam (100-200eV) reacts nearly exclusively with reagent molecules.
-Ammonia or isobutane are used in place of CH4 to reduce the fragmentation of MH+. These reagents bind H+ more strongly than CH4 does and impart less energy to MH+
when the proton is transferred to M.
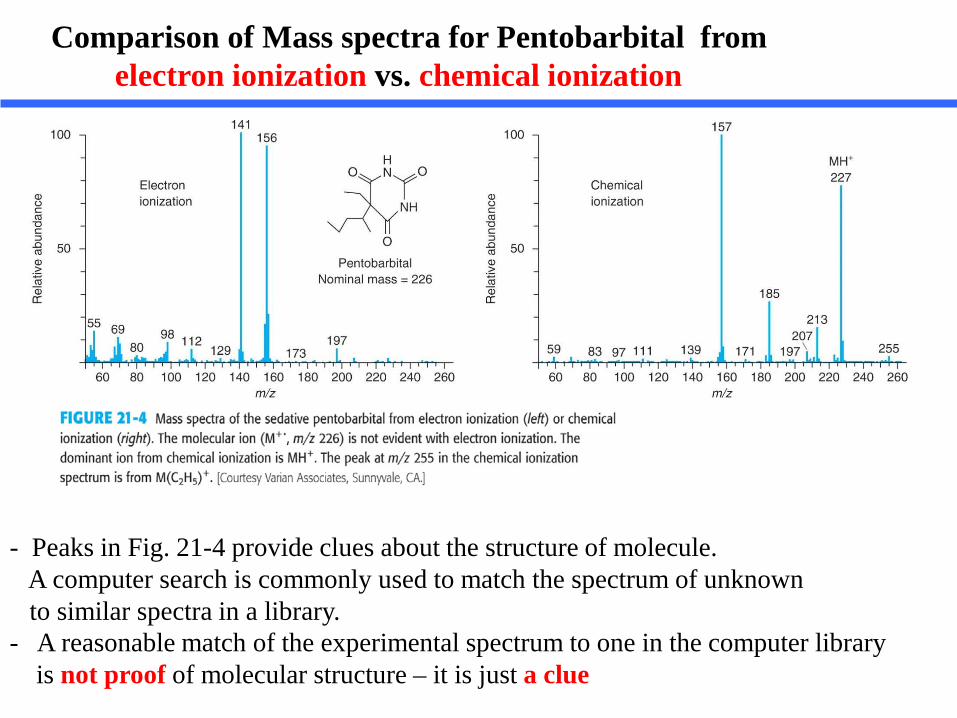
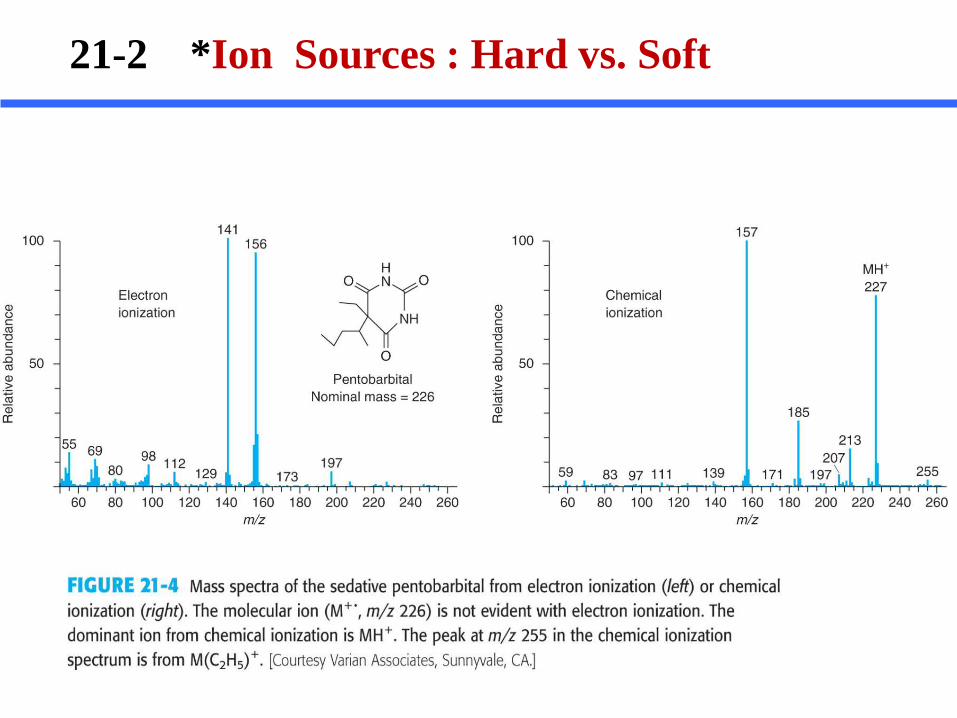
Comparison of Mass spectra for Pentobarbital from electron ionization vs. chemical ionization
- Peaks in Fig. 21-4 provide clues about the structure of molecule. A computer search is commonly used to match the spectrum of unknown to similar spectra in a library. - A reasonable match of the experimental spectrum to one in the computer library is not proof of molecular structure – it is just a clue
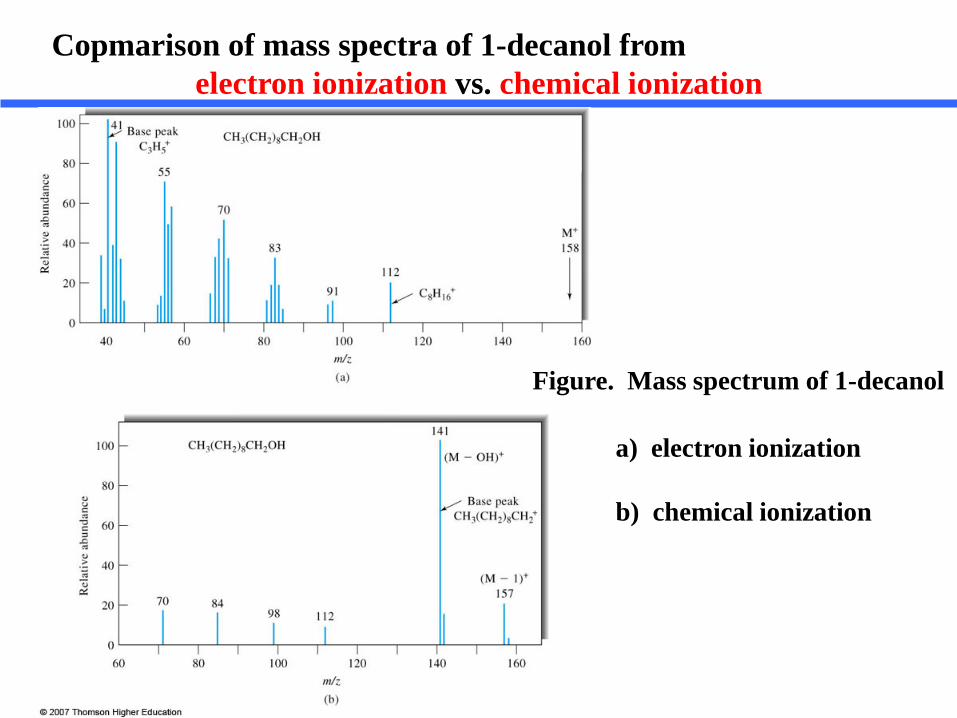
a) electron ionization
b) chemical ionization
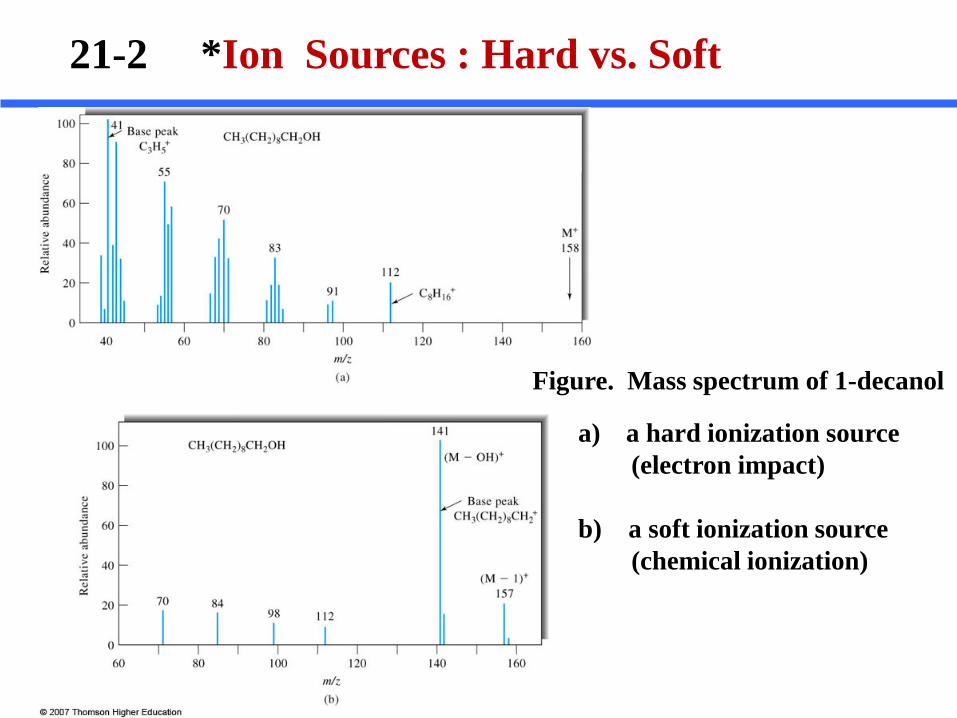
Figure. Mass spectrum of 1-decanol
Copmarison of mass spectra of 1-decanol from electron ionization vs. chemical ionization
21-2 Ion Source (Desorption Sources)
- The gas phase ionizations are not applicable to nonvolatile or thermally unstable samples - A number of desorption ionization methods have been developed for dealing with this type of sample. - These methods have enabled mass spectra to be obtained for thermally delicate biochemical species and species having molecular masses of greater than 100,000 Da. - In desorption methods, energy in various forms is introduced into the solid or liquid sample in such a way to cause direct formation of gaseous ions. - Consequently, spectra are greatly simplified and often consist of only the molecular ion or the protonated molecular ion. - In most cases the exact mechanism of how ions are formed without fragmentation is not well understood.
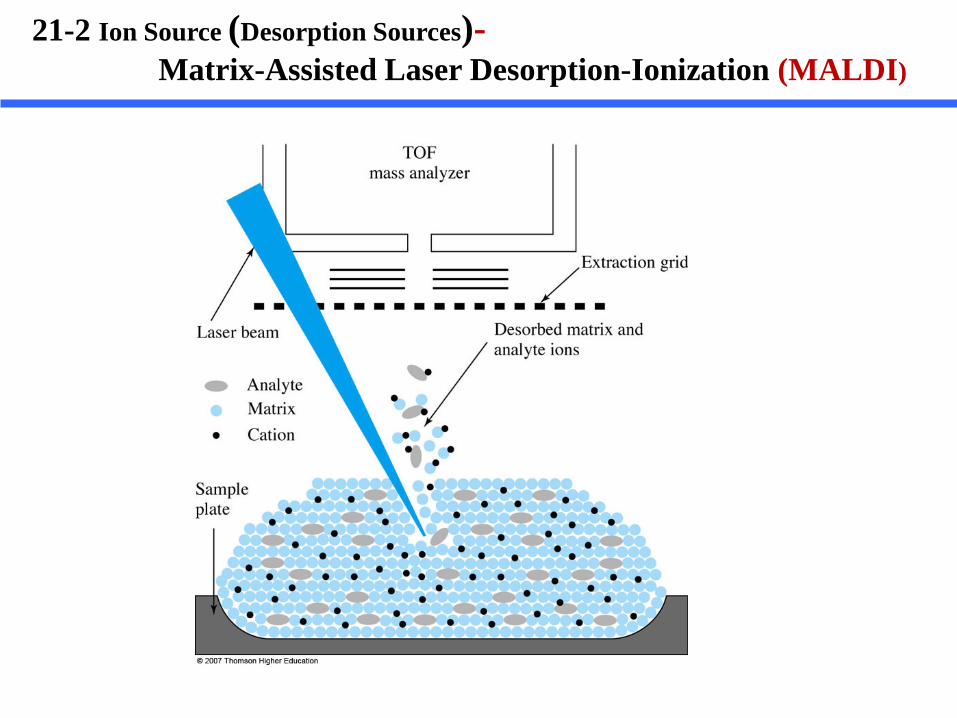
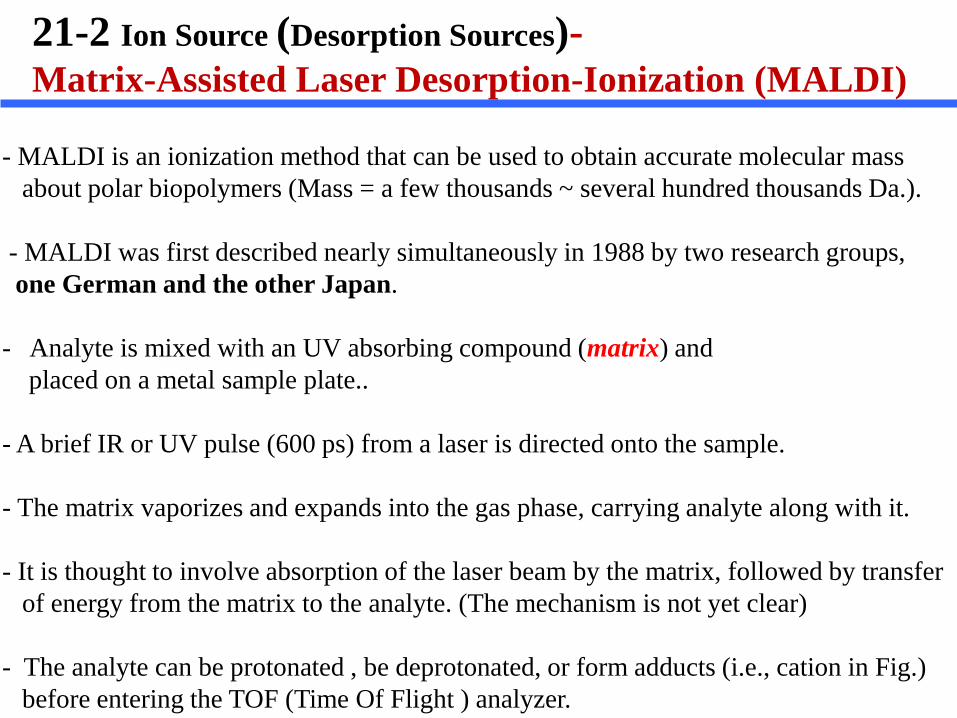
21-2 Ion Source (Desorption Sources)- Matrix-Assisted Laser Desorption-Ionization (MALDI)
21-2 Ion Source (Desorption Sources)- Matrix-Assisted Laser Desorption-Ionization (MALDI)
- MALDI is an ionization method that can be used to obtain accurate molecular mass about polar biopolymers (Mass = a few thousands ~ several hundred thousands Da.). - MALDI was first described nearly simultaneously in 1988 by two research groups, one German and the other Japan. - Analyte is mixed with an UV absorbing compound (matrix) and placed on a metal sample plate.. - A brief IR or UV pulse (600 ps) from a laser is directed onto the sample.
- The matrix vaporizes and expands into the gas phase, carrying analyte along with it.
- It is thought to involve absorption of the laser beam by the matrix, followed by transfer of energy from the matrix to the analyte. (The mechanism is not yet clear) - The analyte can be protonated , be deprotonated, or form adducts (i.e., cation in Fig.) before entering the TOF (Time Of Flight ) analyzer.
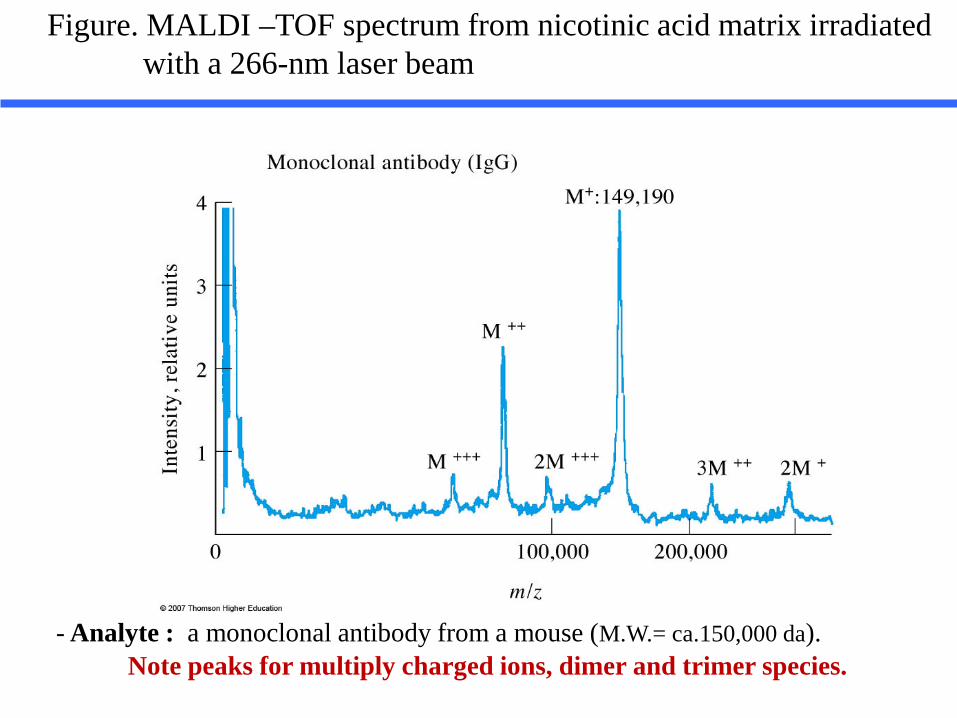
- Analyte : a monoclonal antibody from a mouse (M.W.= ca.150,000 da). Note peaks for multiply charged ions, dimer and trimer species.
Figure. MALDI –TOF spectrum from nicotinic acid matrix irradiated with a 266-nm laser beam
21-2 *Ion Sources : Hard vs. Soft
- Ion sources are also classified as being hard sources or soft sources.
1) Hard ionization sources - They impart enough energy to analyte molecules to leave them in a highly excited energy state. - Relaxation then involves rupture of bonds, producing fragment ions that have m/z ratios less than that of molecular ion (M +. ). 2) Soft ionization sources - They cause little fragmentation and thus the mass spectrum often consists of the molecular ion (M +. ) peak and a only a few, if any, other peaks.
21-2 *Ion Sources : Hard vs. Soft
a) a hard ionization source (electron impact)
b) a soft ionization source (chemical ionization)
Figure. Mass spectrum of 1-decanol
21-2 *Ion Sources : Hard vs. Soft
21-3 Reactions in an electron source
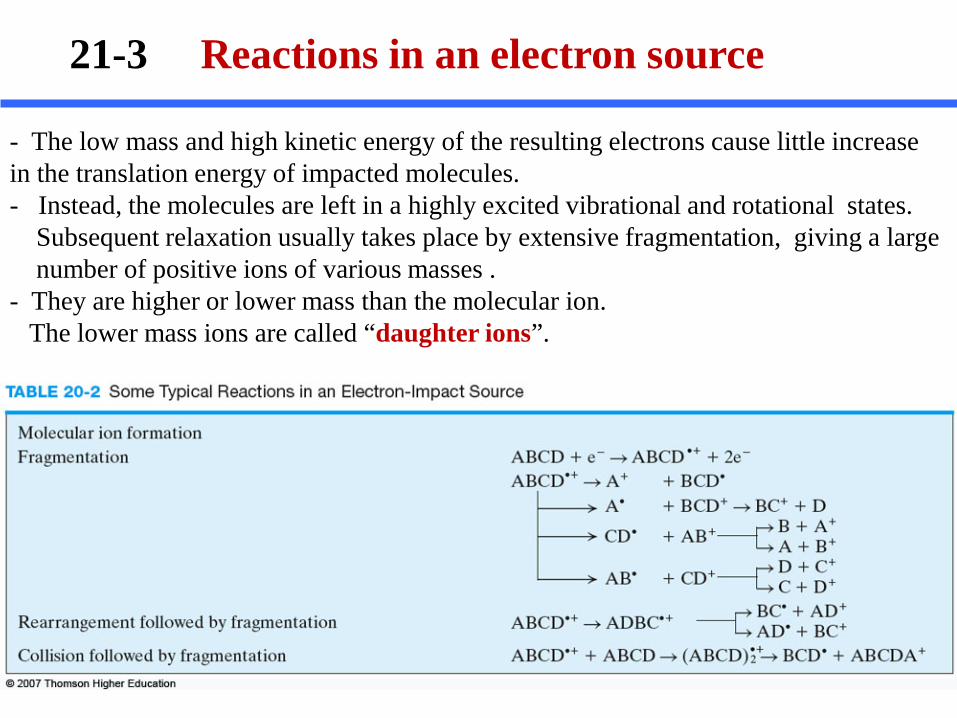
- The low mass and high kinetic energy of the resulting electrons cause little increase in the translation energy of impacted molecules. - Instead, the molecules are left in a highly excited vibrational and rotational states. Subsequent relaxation usually takes place by extensive fragmentation, giving a large number of positive ions of various masses . - They are higher or lower mass than the molecular ion. The lower mass ions are called “daughter ions”.
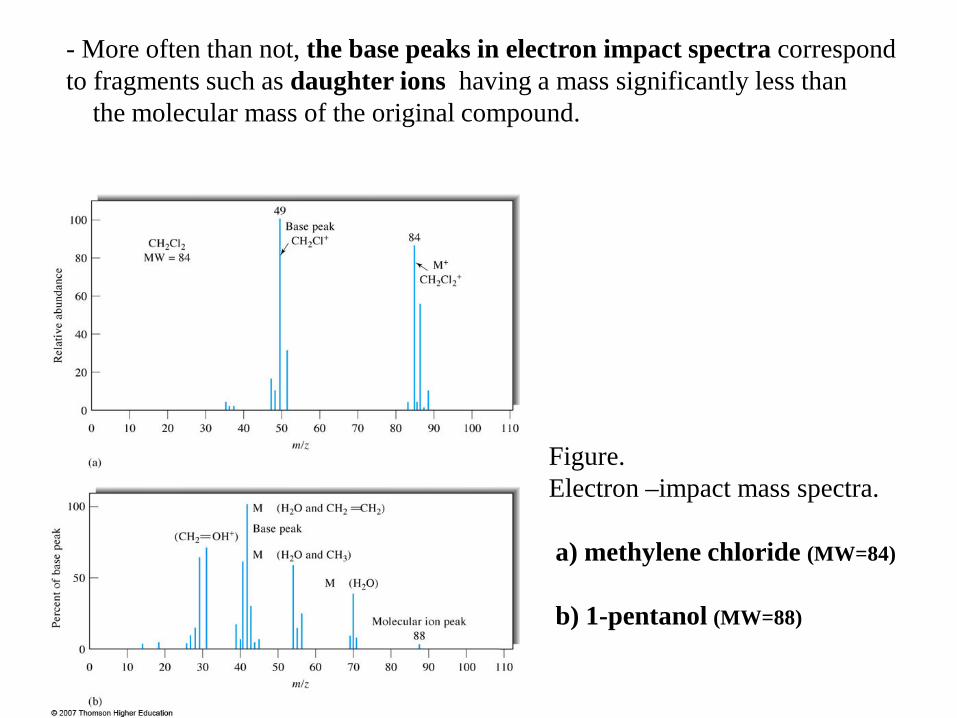
Figure. Electron –impact mass spectra. a) methylene chloride (MW=84) b) 1-pentanol (MW=88)
- More often than not, the base peaks in electron impact spectra correspond to fragments such as daughter ions having a mass significantly less than the molecular mass of the original compound.
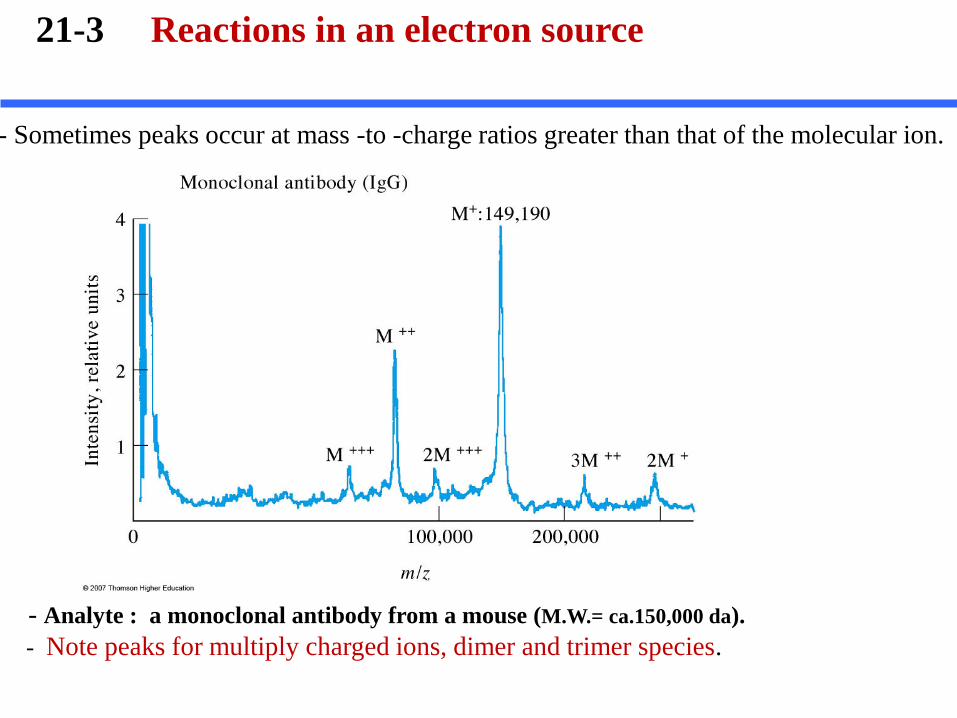
- Analyte : a monoclonal antibody from a mouse (M.W.= ca.150,000 da). - Note peaks for multiply charged ions, dimer and trimer species.
- Sometimes peaks occur at mass -to -charge ratios greater than that of the molecular ion.
21-3 Reactions in an electron source
21-4. Types of Mass Spectrometers (Analyzers)
• 1) Magnetic Sector Analyzer (or Spectrometer)
• 2) Double-Focusing Spectrometer
• 3) Time-of-Fleight (TOF) Mass Spectrometer
• 4) Quadrupole Mass Spectrometer
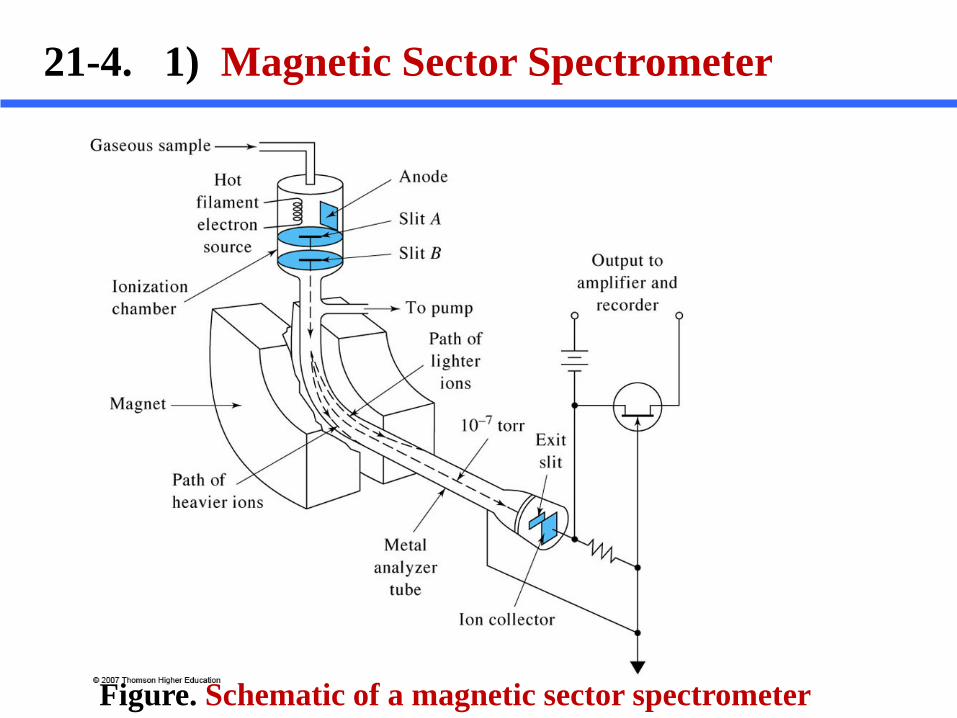
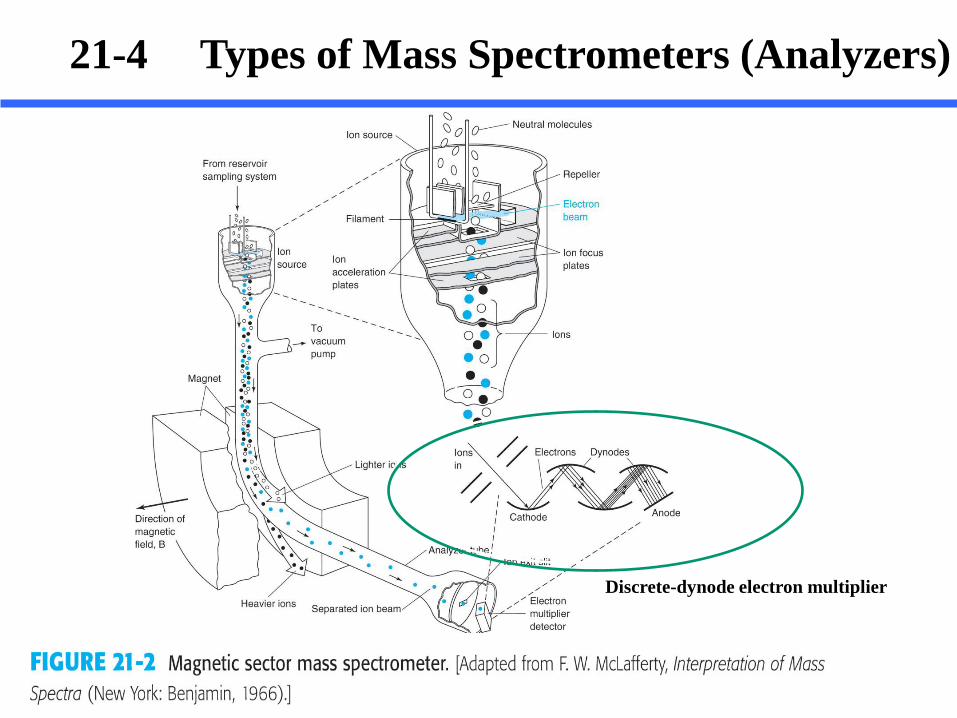
Figure. Schematic of a magnetic sector spectrometer
21-4. 1) Magnetic Sector Spectrometer
M + e- M +. + e- + e- 70 eV Molecular ion ~ 55eV 0.1 eV
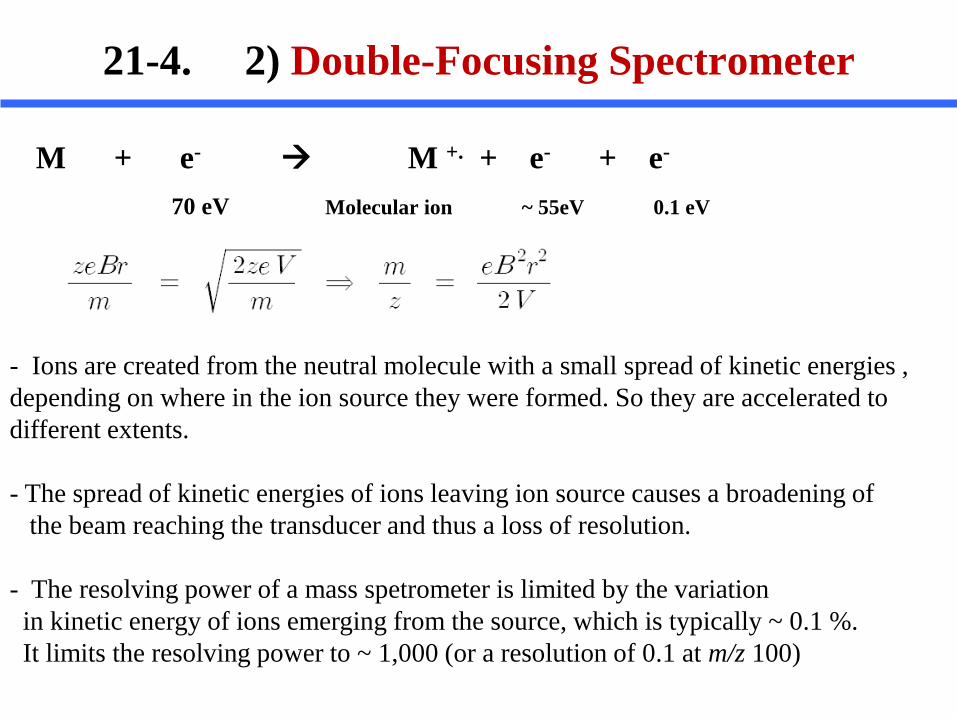
21-4. 2) Double-Focusing Spectrometer
- Ions are created from the neutral molecule with a small spread of kinetic energies , depending on where in the ion source they were formed. So they are accelerated to different extents. - The spread of kinetic energies of ions leaving ion source causes a broadening of the beam reaching the transducer and thus a loss of resolution. - The resolving power of a mass spetrometer is limited by the variation in kinetic energy of ions emerging from the source, which is typically ~ 0.1 %. It limits the resolving power to ~ 1,000 (or a resolution of 0.1 at m/z 100)
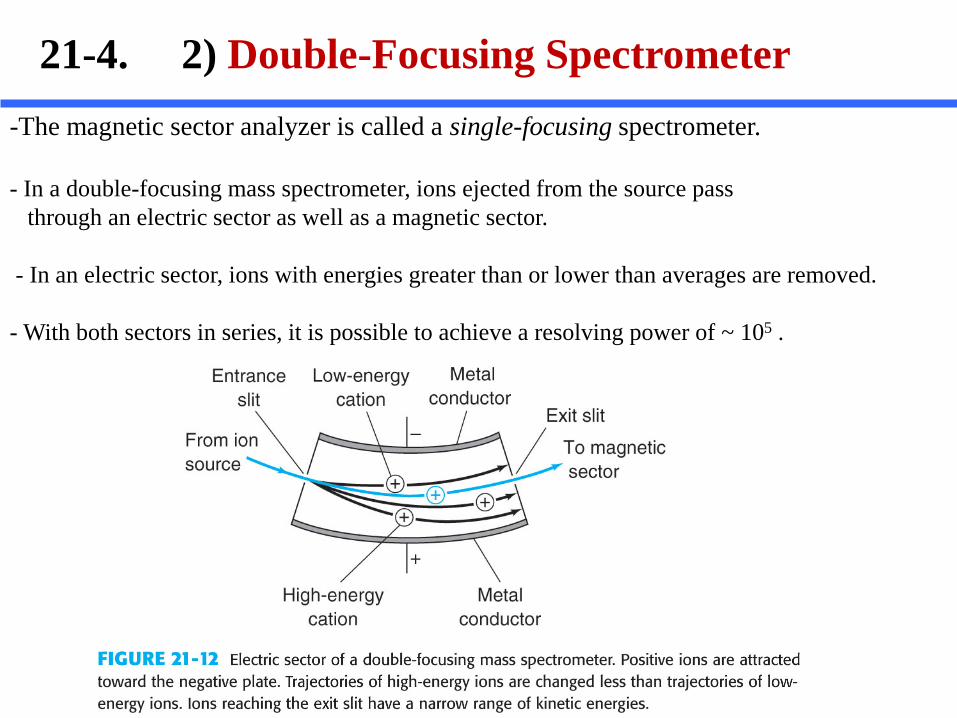
21-4. 2) Double-Focusing Spectrometer -The magnetic sector analyzer is called a single-focusing spectrometer.
- In a double-focusing mass spectrometer, ions ejected from the source pass through an electric sector as well as a magnetic sector. - In an electric sector, ions with energies greater than or lower than averages are removed. - With both sectors in series, it is possible to achieve a resolving power of ~ 105 .
21-4. 3) Time-of-Fleight (TOF) Mass Spectrometer.
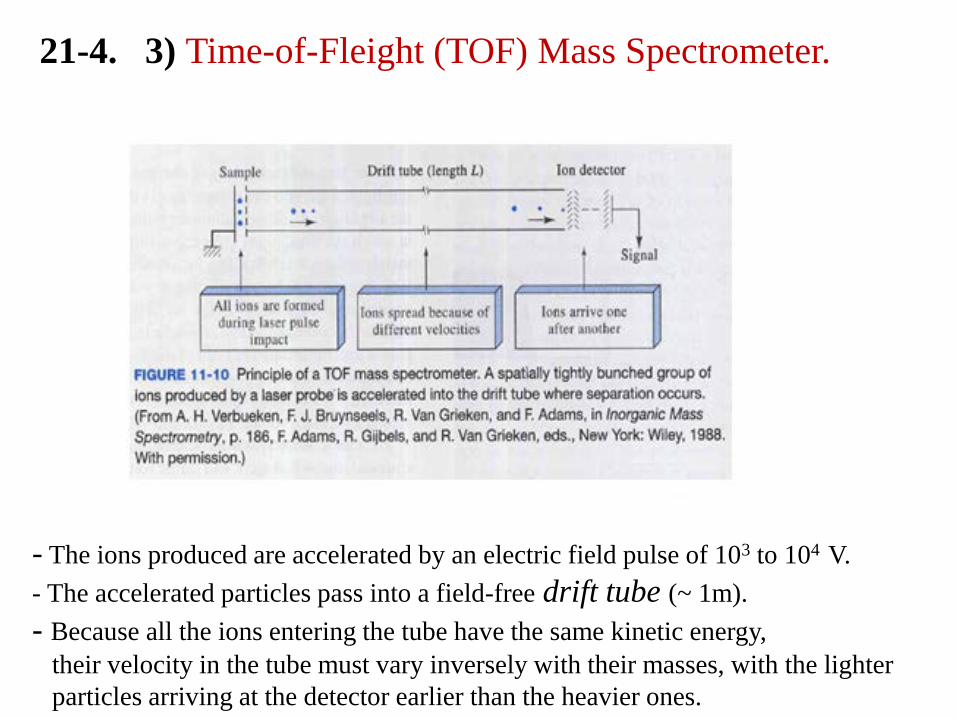
- The ions produced are accelerated by an electric field pulse of 103 to 104 V. - The accelerated particles pass into a field-free drift tube (~ 1m). - Because all the ions entering the tube have the same kinetic energy, their velocity in the tube must vary inversely with their masses, with the lighter particles arriving at the detector earlier than the heavier ones.
21-4. 3) Time-of-Fleight (TOF) Mass Spectrometer.
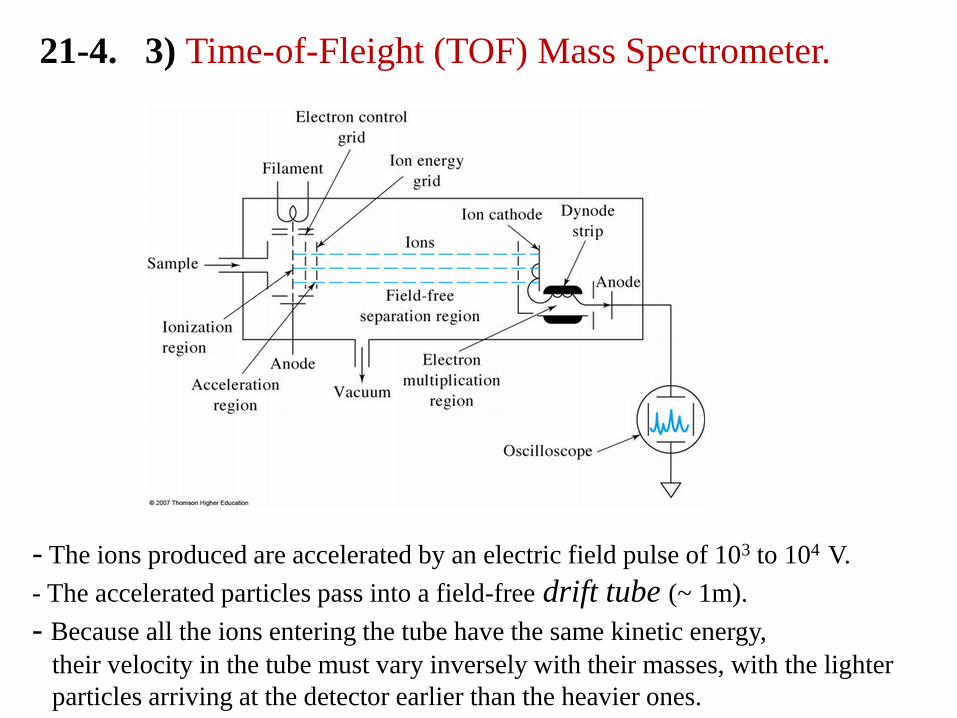
- The ions produced are accelerated by an electric field pulse of 103 to 104 V. - The accelerated particles pass into a field-free drift tube (~ 1m). - Because all the ions entering the tube have the same kinetic energy, their velocity in the tube must vary inversely with their masses, with the lighter particles arriving at the detector earlier than the heavier ones.
21-4. 4) Quadrupole Mass Spectrometer
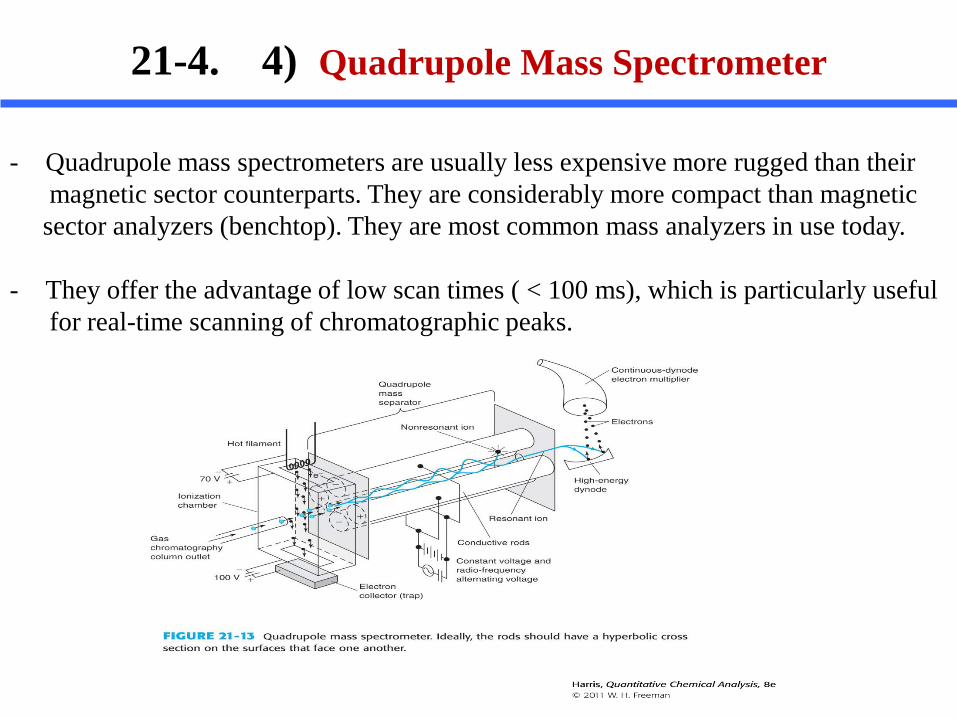
- Quadrupole mass spectrometers are usually less expensive more rugged than their magnetic sector counterparts. They are considerably more compact than magnetic sector analyzers (benchtop). They are most common mass analyzers in use today. - They offer the advantage of low scan times ( < 100 ms), which is particularly useful for real-time scanning of chromatographic peaks.
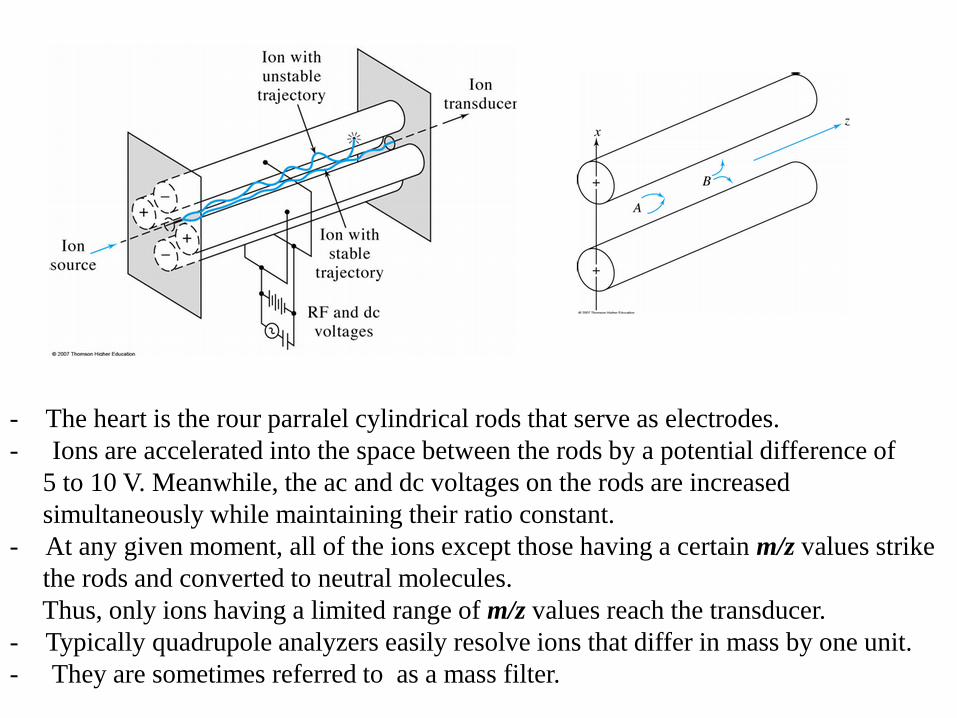
- The heart is the rour parralel cylindrical rods that serve as electrodes. - Ions are accelerated into the space between the rods by a potential difference of 5 to 10 V. Meanwhile, the ac and dc voltages on the rods are increased simultaneously while maintaining their ratio constant. - At any given moment, all of the ions except those having a certain m/z values strike the rods and converted to neutral molecules. Thus, only ions having a limited range of m/z values reach the transducer. - Typically quadrupole analyzers easily resolve ions that differ in mass by one unit. - They are sometimes referred to as a mass filter.
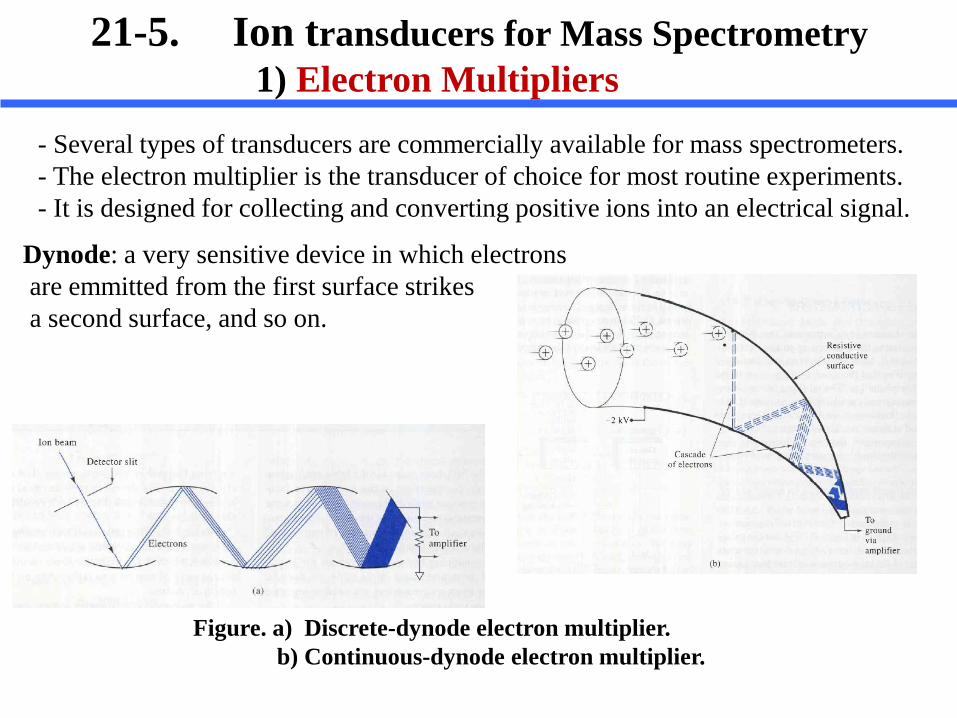
21-5. Ion transducers for Mass Spectrometry 1) Electron Multipliers
- Several types of transducers are commercially available for mass spectrometers. - The electron multiplier is the transducer of choice for most routine experiments. - It is designed for collecting and converting positive ions into an electrical signal.
Figure. a) Discrete-dynode electron multiplier. b) Continuous-dynode electron multiplier.
Dynode: a very sensitive device in which electrons are emmitted from the first surface strikes a second surface, and so on.
21-5. Transducers for Mass Spectrometry 1) Electron Multipliers
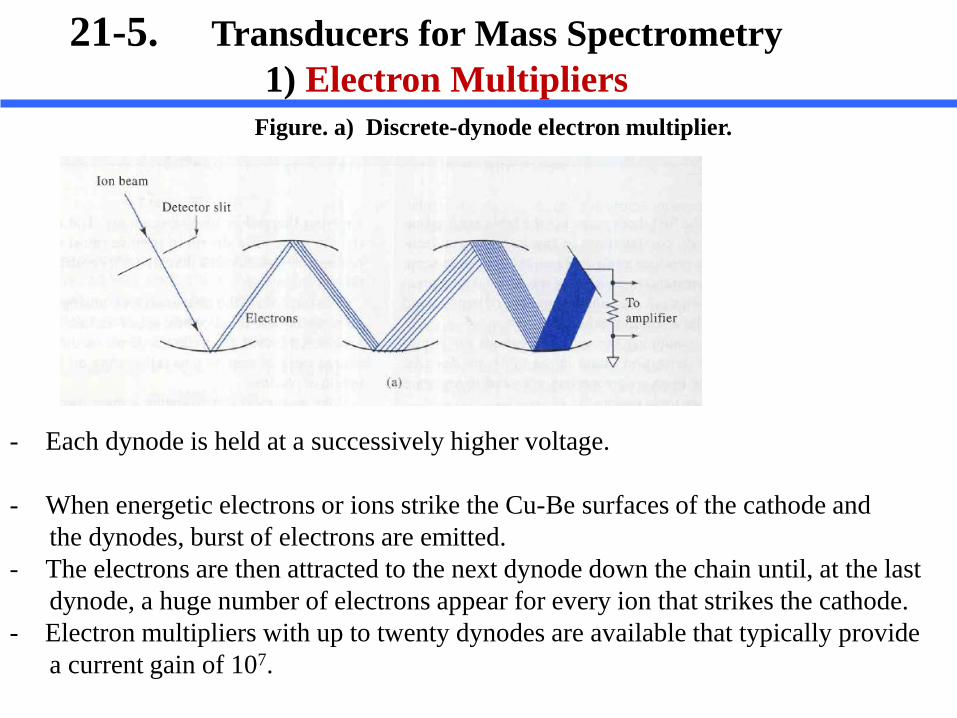
Figure. a) Discrete-dynode electron multiplier.
- Each dynode is held at a successively higher voltage.
- When energetic electrons or ions strike the Cu-Be surfaces of the cathode and the dynodes, burst of electrons are emitted. - The electrons are then attracted to the next dynode down the chain until, at the last dynode, a huge number of electrons appear for every ion that strikes the cathode. - Electron multipliers with up to twenty dynodes are available that typically provide a current gain of 107.
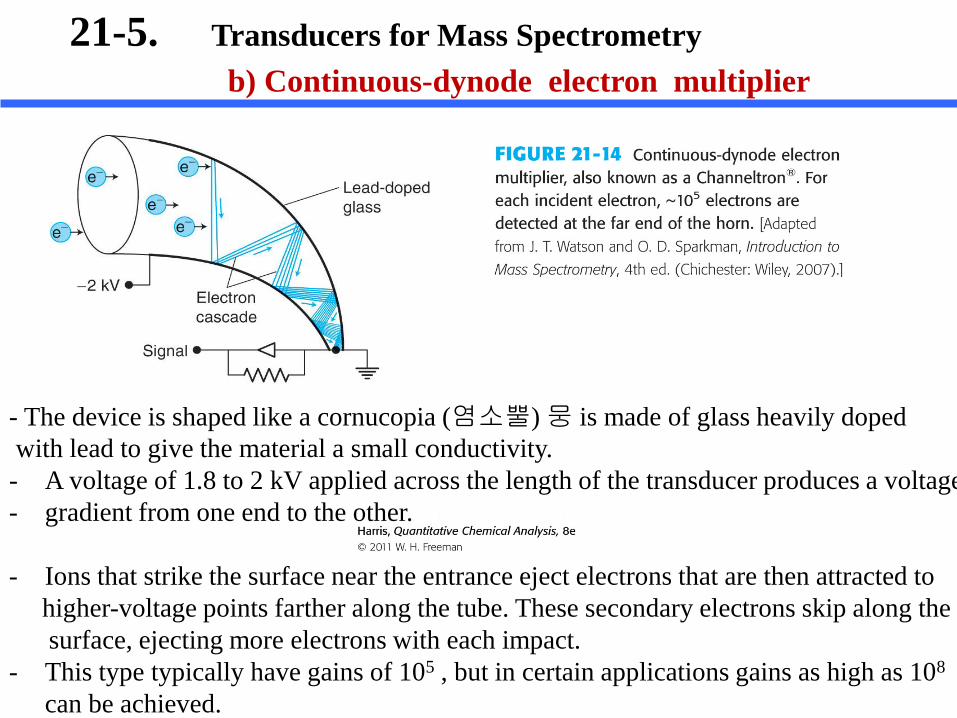
21-5. Transducers for Mass Spectrometry b) Continuous-dynode electron multiplier
- The device is shaped like a cornucopia (염소뿔) 뭉 is made of glass heavily doped with lead to give the material a small conductivity. - A voltage of 1.8 to 2 kV applied across the length of the transducer produces a voltage - gradient from one end to the other. - Ions that strike the surface near the entrance eject electrons that are then attracted to higher-voltage points farther along the tube. These secondary electrons skip along the surface, ejecting more electrons with each impact. - This type typically have gains of 105 , but in certain applications gains as high as 108
can be achieved.
21-5. Ion transducers for Mass Spectrometry 1) Electron Multipliers
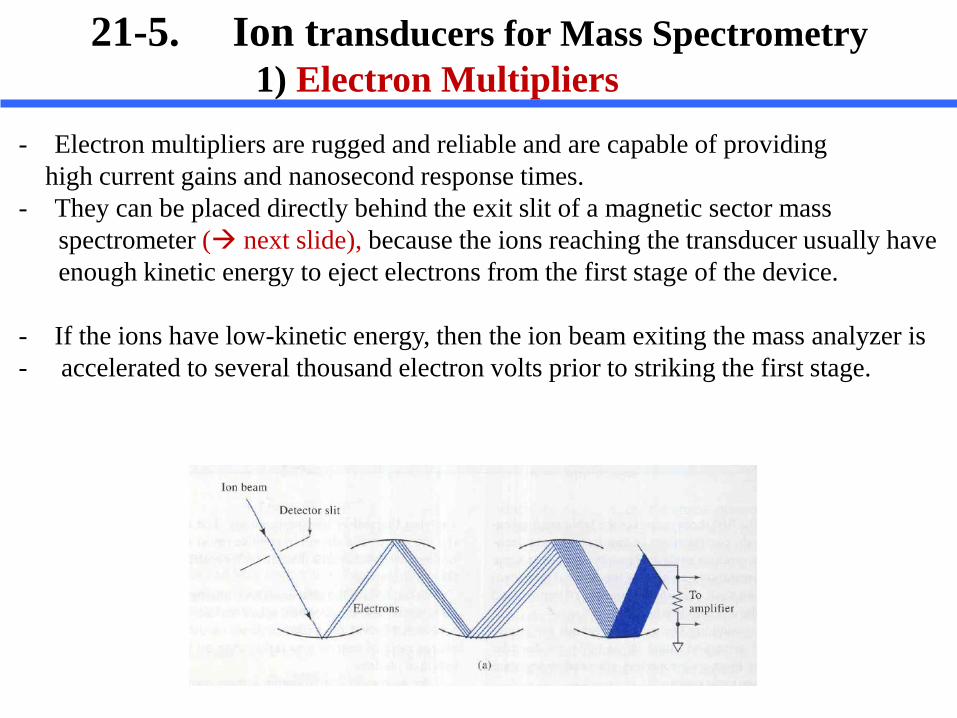
- Electron multipliers are rugged and reliable and are capable of providing high current gains and nanosecond response times. - They can be placed directly behind the exit slit of a magnetic sector mass spectrometer ( next slide), because the ions reaching the transducer usually have enough kinetic energy to eject electrons from the first stage of the device. - If the ions have low-kinetic energy, then the ion beam exiting the mass analyzer is - accelerated to several thousand electron volts prior to striking the first stage.
21-4 Types of Mass Spectrometers (Analyzers)
Discrete-dynode electron multiplier