Embed Size (px)
Citation preview
Chapter 30
Transportation Project‐Based Scoring Model
2018 Technical Guide
Guide 2
Table of Contents
1.0 Introduction ........................................................................................................................... 4
1.1. Legislative Requirements ...................................................................................................... 4
1.2. Roles and Responsibilities ..................................................................................................... 5
1.3. Stakeholder Input ................................................................................................................. 6
1.4. Annual Chapter 30 Scoring Cycle .......................................................................................... 6
2.0 Project Eligibility and Application Process .............................................................................. 8
2.1. Eligibility Requirements ........................................................................................................ 8
2.2. Application and Screening Process ..................................................................................... 11
3.0 Evaluation Goals and Measures ............................................................................................ 14
3.1. Goal 1: Safety and Security ................................................................................................. 16
3.2. Goal 2: System Preservation ............................................................................................... 16
3.3. Goal 3: Reducing Congestion and Improving Commute Times .......................................... 16
3.4. Goal 4: Environmental Stewardship ................................................................................... 17
3.5. Goal 5: Community Vitality ................................................................................................. 17
3.6. Goal 6: Economic Prosperity ............................................................................................... 18
3.7. Goal 7: Equitable Access to Transportation ........................................................................ 18
3.8. Goal 8: Cost Effectiveness and Return on Investment ....................................................... 18
3.9. Goal 9: Local Priorities ........................................................................................................ 19
4.0 Project Evaluation and Ranking ............................................................................................ 20
4.1. Calculation of Measure Scores ........................................................................................... 20
4.2. Measure and Goal Weights ................................................................................................ 20
4.3 Calculating the Final Project Score and Rank ...................................................................... 21
4.4 Internal/External Review .................................................................................................... 21
5 Prioritization and Programming ........................................................................................... 22
5.4 Public Input Process ............................................................................................................ 22
5.5 Annual Process Issues ......................................................................................................... 23
5.6 Improvements to Process and Measures ........................................................................... 24
Appendix A ‐ Goal 1: Safety and Security Calculation .................................................................... 25
Measures Approach ......................................................................................................................... 25
Appendix B ‐ Goal 2: System Preservation Calculation ................................................................... 28
Measures Approach ......................................................................................................................... 28
Appendix C ‐ Goal 3: Reducing Congestion and Improving Commute Times Calculation ................. 31
Guide 3
Measures Approach ......................................................................................................................... 31
Appendix D ‐ Goal 4: Environmental Stewardship Calculation ....................................................... 35
Measures Approach ......................................................................................................................... 35
Appendix E ‐ Goal 5: Community Vitality Calculation ..................................................................... 38
Measures Approach ......................................................................................................................... 38
Appendix F ‐ Goal 6: Economic Prosperity Calculation ................................................................... 42
Measures Approach ......................................................................................................................... 42
Appendix G ‐ Goal 7: Equitable Access to Transportation Calculation ............................................ 44
Measures Approach ......................................................................................................................... 44
Appendix H ‐ Goal 8: Cost Effectiveness and Return on Investment Calculation ............................. 46
Measures Approach ......................................................................................................................... 46
Appendix I ‐ Goal 9: Local Priorities Calculation ............................................................................. 48
Measure Approach ........................................................................................................................... 48
Guide 4
1.0 Introduction Pursuant to Chapter 30, Acts of 2017 (Senate Bill 307), the Maryland Department of Transportation (MDOT) “shall, in accordance with federal transportation requirements, develop a project–based scoring system for major transportation projects using the goals and measures established under [Transportation Article 2‐103.7(c)] for projects” being considered for inclusion in the Consolidated Transportation Program (CTP). The transportation scoring law, as amended in 2017, defines a “major transportation project” as a highway or transit capacity project that exceeds $5,000,000, and excludes any “projects that are solely for system preservation.”
A cross‐functional team of State transportation staff and local partners at the Maryland Municipal League (MML) and the Maryland Association of Counties (MACo) developed the Chapter 30 scoring model to meet the statutory requirements of Chapter 30. The Chapter 30 scoring model evaluates projects across nine goals and twenty‐three measures using a combination of project data, modeling analysis, and qualitative questionnaires. Each major transportation capacity project being considered for funding and inclusion in the CTP is evaluated through the Chapter 30 scoring model and ranked based on the score. The project rank is then one of many factors that contribute to the decision of what projects to select for funding and inclusion in the CTP.
This document presents details on the Chapter 30 scoring model including information on roles and responsibilities, project eligibility requirements, the project application process, and the goals and measures used for scoring projects
1.1. Legislative Requirements
The Maryland Open Transportation Investment Decision Act – Application and Evaluation (Senate Bill 307) was enacted on April 11, 2017. The law requires MDOT to develop a project‐based scoring system to rank major capital transportation projects being considered for inclusion in the CTP. Major transportation projects are those transit and highway projects whose total cost for all phases is over $5 million and meet certain criteria based on project activities. A more detailed description of projects requiring evaluation and scoring can be found in Chapter 2 of this document. MDOT must use the goals and measures defined in the legislation in developing the model and assign weights for each goal and measure.
The specific goal areas for evaluating projects are defined in law as follows:
Goal 1: Safety and Security
Goal 2: System Preservation
Goal 3: Reducing Congestion and Improving Commute Times
Goal 4: Environmental Stewardship
Goal 5: Community Vitality
Goal 6: Economic Prosperity
Goal 7: Equitable Access to Transportation
Goal 8: Cost Effectiveness and Return on Investment
Goal 9: Local Priorities
Each goal has one to three associated measures which define how to evaluate a project’s characteristics and merits. These goals and measures are discussed in more detail in Chapter 3 and the Appendices of this document.
Guide 5
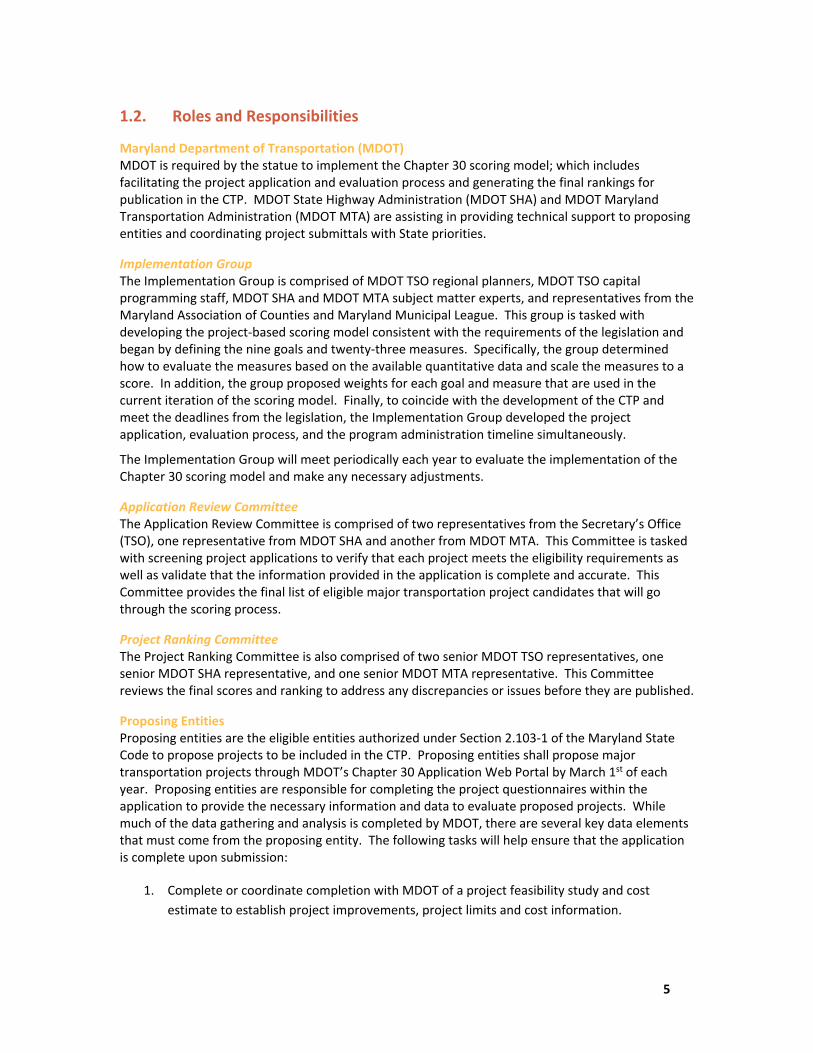
1.2. Roles and Responsibilities
Maryland Department of Transportation (MDOT) MDOT is required by the statue to implement the Chapter 30 scoring model; which includes facilitating the project application and evaluation process and generating the final rankings for publication in the CTP. MDOT State Highway Administration (MDOT SHA) and MDOT Maryland Transportation Administration (MDOT MTA) are assisting in providing technical support to proposing entities and coordinating project submittals with State priorities.
Implementation Group The Implementation Group is comprised of MDOT TSO regional planners, MDOT TSO capital programming staff, MDOT SHA and MDOT MTA subject matter experts, and representatives from the Maryland Association of Counties and Maryland Municipal League. This group is tasked with developing the project‐based scoring model consistent with the requirements of the legislation and began by defining the nine goals and twenty‐three measures. Specifically, the group determined how to evaluate the measures based on the available quantitative data and scale the measures to a score. In addition, the group proposed weights for each goal and measure that are used in the current iteration of the scoring model. Finally, to coincide with the development of the CTP and meet the deadlines from the legislation, the Implementation Group developed the project application, evaluation process, and the program administration timeline simultaneously.
The Implementation Group will meet periodically each year to evaluate the implementation of the Chapter 30 scoring model and make any necessary adjustments.
Application Review Committee The Application Review Committee is comprised of two representatives from the Secretary’s Office (TSO), one representative from MDOT SHA and another from MDOT MTA. This Committee is tasked with screening project applications to verify that each project meets the eligibility requirements as well as validate that the information provided in the application is complete and accurate. This Committee provides the final list of eligible major transportation project candidates that will go through the scoring process.
Project Ranking Committee The Project Ranking Committee is also comprised of two senior MDOT TSO representatives, one senior MDOT SHA representative, and one senior MDOT MTA representative. This Committee reviews the final scores and ranking to address any discrepancies or issues before they are published.
Proposing Entities Proposing entities are the eligible entities authorized under Section 2.103‐1 of the Maryland State Code to propose projects to be included in the CTP. Proposing entities shall propose major transportation projects through MDOT’s Chapter 30 Application Web Portal by March 1st of each year. Proposing entities are responsible for completing the project questionnaires within the application to provide the necessary information and data to evaluate proposed projects. While much of the data gathering and analysis is completed by MDOT, there are several key data elements that must come from the proposing entity. The following tasks will help ensure that the application is complete upon submission:
1. Complete or coordinate completion with MDOT of a project feasibility study and cost
estimate to establish project improvements, project limits and cost information.

Guide 6
2. Coordinate with MDOT SHA or MDOT MTA on the list of proposed projects that are
anticipated to be submitted.
3. Review of the local Comprehensive Land Use Plan to determine a proposed project’s
consistency with the plan.
4. Review of any local Bicycle and Pedestrian Plan to determine a proposed project’s
consistency with the plan.
5. Review of community assets the project provides access to, as defined in Table E.3.
6. Identify any proposed development site(s) that are facilitated by the proposed project to
determine development status and anticipated employment density.
7. Determine any proposed funding sources outside the Transportation Trust Fund to leverage
towards the project.
8. Assign Local Priority Points across proposed projects and coordination with municipalities
for jointly supported projects.
1.3. Stakeholder Input
All the documentation for Chapter 30 scoring model can be found on the MDOT’s Chapter 30 website. MDOT is committed to ensuring that a transparent and objective evaluation process is completed through the Chapter 30 scoring methodology. Throughout the development process MDOT engaged local stakeholders and transportation partners as well as solicited feedback through industry forums and meetings.
In addition, MDOT is committed to continually soliciting feedback and comments on how to improve the scoring process. Stakeholders can submit feedback and comments on the application process, evaluation methodology, project ranking, or any other part of the Chapter 30 scoring model via the MDOT website. MDOT considers all feedback as they work to revise the Chapter 30 scoring process for each iteration.
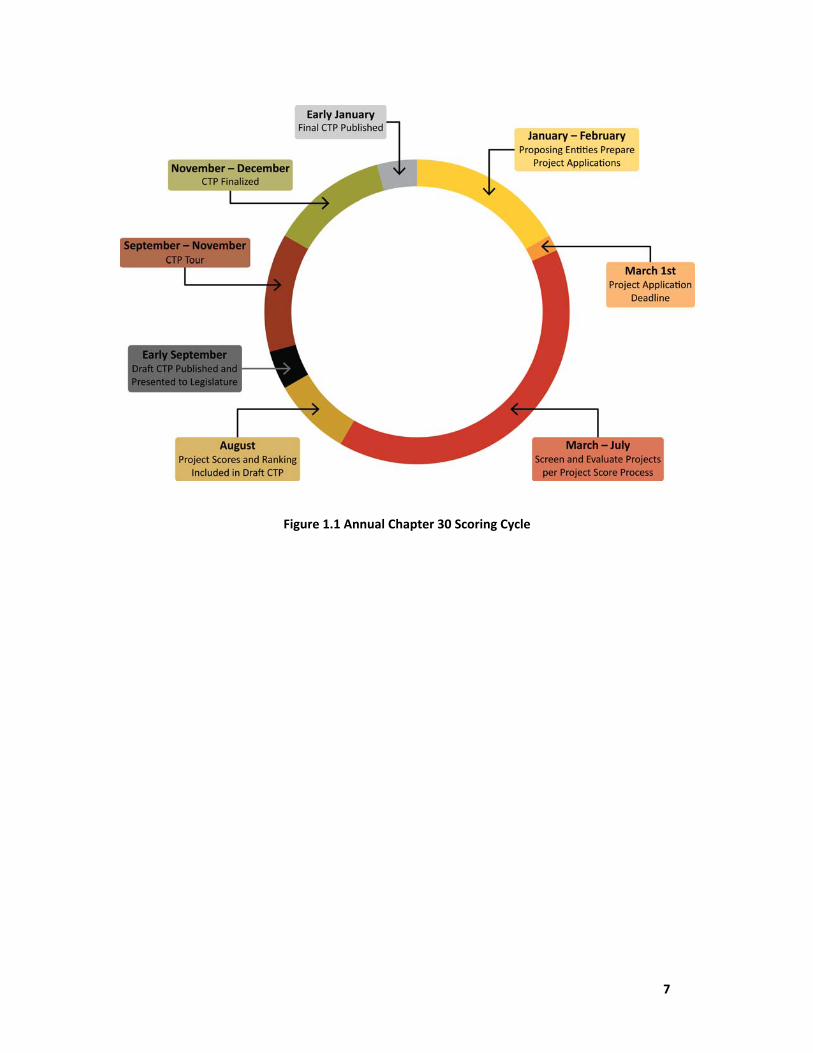
1.4. Annual Chapter 30 Scoring Cycle
The annual Chapter 30 scoring cycle begins in January. At this time, proposing entities should be coordinating with MDOT SHA and MDOT MTA to gather project information and data for applications. Chapter 30 applications must be completed and submitted by proposing entities by March 1st to be included in the evaluation process. In the four months following application submission, MDOT will processes applications, validate project information and eligibility, collect necessary technical data, and complete all modeling and forecasting. Beginning in July, MDOT will utilize the modeling results and technical data to evaluate each project, calculate the scores, and determine the final ranking of projects.
The final ranking then helps inform the development of the Draft CTP in August. The Draft CTP is made public in early September. The final project scores and ranking are included in an appendix in the CTP and are posted on the MDOT website as well.
Between September 15th and November 15th, MDOT conducts CTP tours meetings in all 23 counties and Baltimore City to solicit feedback from local partners on the Draft CTP and to discuss the project scores and ranking. Following the CTP Tours, MDOT will evaluate and score any projects sponsored by the Secretary of Transportation for consideration in the Final CTP that popped up as a result of the CTP Tour discussions. The Final CTP is the published in early January. Details on the final scores and project rank are provided in an appendix to the Final CTP and are made available on the MDOT website as well.
Guide 7
Figure 1.1 Annual Chapter 30 Scoring Cycle
Guide 8
2.0 Project Eligibility and Application Process As defined in the Maryland Open Transportation Investment Decision Act, the Chapter 30 scoring methodology applies to “major transportation projects” only. These are highway and transit capacity projects whose total cost exceeds $5 million for all funding phases. However, in addition to the project cost requirement, there are other eligibility requirements projects must meet in order to be included in the Chapter 30 evaluation process. This section provides specific details on the entities eligible to submit projects and the types of projects eligible for consideration. This section also provides information on the application process for submitting eligible projects.
2.1. Eligibility Requirements
It is important for all applicants to understand the requirements for eligibility before submitting projects. This section contains information on who may submit projects and the types of projects that are eligible for submission.
Entities Eligible to Submit Projects
The following entities are eligible to propose projects to be scored and considered for inclusion in the CTP as defined under Section 2.103‐1 of the Maryland State Code.
County Government
Municipal Government
State Government Agency
All County and Municipal Governments submitting project applications must have a resolution or letter signed by their elected or governing body sponsoring the project. This may be a copy of a Priority Letter. This is required to show consensus among the governing body on proposing the project.
Project Proposal Limit
Each proposing entity may submit up to ten major transportation projects for consideration of funding in the CTP during the annual cycle. MDOT MTA and MDOT SHA are exempt from this limitation. This limit is determined based on the financial resources and capacity of MDOT to conduct the forecasting and project evaluation process as well as evaluate only the highest priority needs of a proposing entity.
Project Eligibility Requirements
Project candidates evaluated through Chapter 30 scoring model are limited to major transportation projects whose cost exceeds $5 million for all phases of the project. These phases include Project Planning, Preliminary Engineering, Right‐of‐Way, and Construction. In addition to the total cost requirement, the law defines major transportation projects as capacity in nature as detailed below. Projects not meeting these criteria do not require a Chapter 30 evaluation to be considered for funding. Proposing entities should use pre‐existing procedures to propose projects excluded from the Chapter 30 scoring model (i.e. Priority Letters, MDOT SHA & MDOT MTA Coordination Meetings, etc.)
Guide 9
1.) Highway Capacity Project
a. The construction of a new interchange.
b. Any new construction or reconstruction of an existing roadway that provides an
additional through travel lane between two intersection roadways that is equal to
or greater than one lane mile of roadway.
c. The new construction or reconstruction of an existing bridge to add additional
through lanes.
Note: If a bridge replacement project constructs additional through lanes on a bridge classified as Structurally Deficient it is not subject to the Chapter 30 evaluation, as the primary goal of the project is system preservation not capacity.
2) Transit Capacity Project
a. The construction or expansion of a rail line or dedicated service‐lane transit line.
b. The addition of a new transit station on a rail line or dedicated service‐lane transit
line.
Note: While bus and rail car procurement projects that exceed $5M may be transit capacity projects, MDOT has determined they are not subject to the Chapter 30 evaluation due to their inability to be scored through the legal requirements.
3) Transit Station or Station Area Improvement Project
a. A project that increases the movement of passengers through stations by expanding
passenger boarding facilities (i.e. station platforms, bus stations, etc.).
b. A project that improves the efficiency of operations through stations by
constructing additional track or bus lanes.
c. A project that improves access to transit station by expanding parking lots, vehicle
access, and bicycle facilities.
Note: Transit Station improvement projects required to meet Federal requirements, such
as Americans with Disabilities Act (ADA), are not subject to the Chapter 30 evaluation as
they are required to be completed regardless of score and rank.
4) Intelligent Transportation Systems or Congestion Management System Project
a. Projects that encompass a broad range of wireless and wireline communications‐
based information and electronic technologies that are combined with the
construction of new physical infrastructure to improve highway capacity.
5) Projects that reduce areas of heavy traffic congestion or improve commute times in areas of
heavy traffic congestion. Heavy traffic congestion areas are defined as MDOT SHA’s Top 30
AM or PM peak period bottlenecks identified in the MDOT SHA Mobility Report.
Guide 10
Project Scope and Cost
To conduct an evaluation of projects through the Chapter 30 scoring methodology, projects need to have a clearly defined scope that identifies project alignment/area and the type of improvements that are included in the proposed project. This information is obtained through the completion of preliminary planning or a feasibility study. Projects that do not yet have a defined scope by the March 1st Application deadline are not eligible to be considered for funding as a major transportation project that fiscal year. Proposing entities must either coordinate with MDOT SHA or MDOT MTA to fund preliminary planning of the project in the Development & Evaluation Program of the CTP or conduct their own feasiability study.
In addition, projects must have a reasonable and updated cost estimate. This is necessary for calculating many of the measures defined in the statute. Without a reasonable and recent cost estimate, the project cannot be considered for funding as a major transportation project in the CTP. Proposing entities must either coordinate with MDOT SHA or MDOT MTA to identify the cost estimate through the preliminary planning of the project or as part of the proposing entities’ own feasibility study effort establish a cost estimate as well.
It is up to the proposing entity to ensure that these eligibility requirements are met before submitting an application for consideration.
Project Exceptions
It is important to note that there are exemptions to the major transportation projects that do not need to be scored. These projects can be considered for funding in the CTP without a Chapter 30 evaluation. The following projects are defined in the statute as exempt from the project scoring process:
Projects being submitted to the Maryland Aviation Administration, the Maryland Port
Administration, or the Maryland Transportation Authority portion of the CTP;
Maintenance and storage facilities projects;
Water quality improvement projects;
Projects related to Maryland’s priorities for total maximum daily load development;
Safety‐related projects that do not increase highway or transit capacity;
Roads within the Appalachian Development Highway System; or
System preservation projects.
In addition, due to how the measures are defined in the statute the projects listed below cannot be meaningfully scored and do not need a Chapter 30 evaluation to be considered for funding in the CTP:
Structurally Deficient Bridges – While replacement of a structurally deficient bridge may
include adding additional capacity, the main purpose is system preservation.
Transit Station Improvements Required to Meet Federal Requirements – These projects are
required to be completed regardless of score and rank.
Bus and Rail Car Procurement Projects – The measure developed in the statute cannot be
meaningfully applied to these projects.
Guide 11
Project Eligibility Per Annual Cycle
Projects are only eligible to be scored once per annual CTP development cycle. Once major transportation projects are scored and selected for funding in the CTP, they do not need to be re‐scored each CTP development cycle, unless there have been major changes that result in the project cost estimate increasing or decreasing by 30 percent. Projects that are scored and only partially funded or funded through phases do not need to be rescored when additional CTP funding is allocated in subsequent annual CTP development cycles, unless the original project cost estimate used to score the project changed by more than 30 percent. Once projects are advertised or out to construction they do not need to be rescored regardless of any cost changes.
If a project is not selected for funding, it is eligible to be re‐submitted and scored during the next annual CTP development cycle. Proposing entities that wish to re‐submit projects will have to submit a new application each year with the most updated project information.
Projects Grandfathered into CTP Without Chapter 30 Score
Major Transportation Projects currently funded in the Construction Program of the Final FY 2018‐2023 CTP are grandfathered into the CTP without a Chapter 30 score. As stated above, if these projects have major changes that result in the project cost estimate increasing or decreasing by 30 percent they will have to go through the scoring process.
2.2. Application and Screening Process
All eligible projects must be submitted through the Chapter 30 Application Web Portal by March 1st. Proposing entities are responsible for submitting the application and completing the required data forms. A Chapter 30 Application Guide is located on MDOT’s Chapter 30 webpage to assist proposing entities in completing applications. Proposing entities are encouraged to coordinate with MDOT SHA and MDOT MTA prior to submitting applications to ensure all the necessary data and eligibility requirements are met.
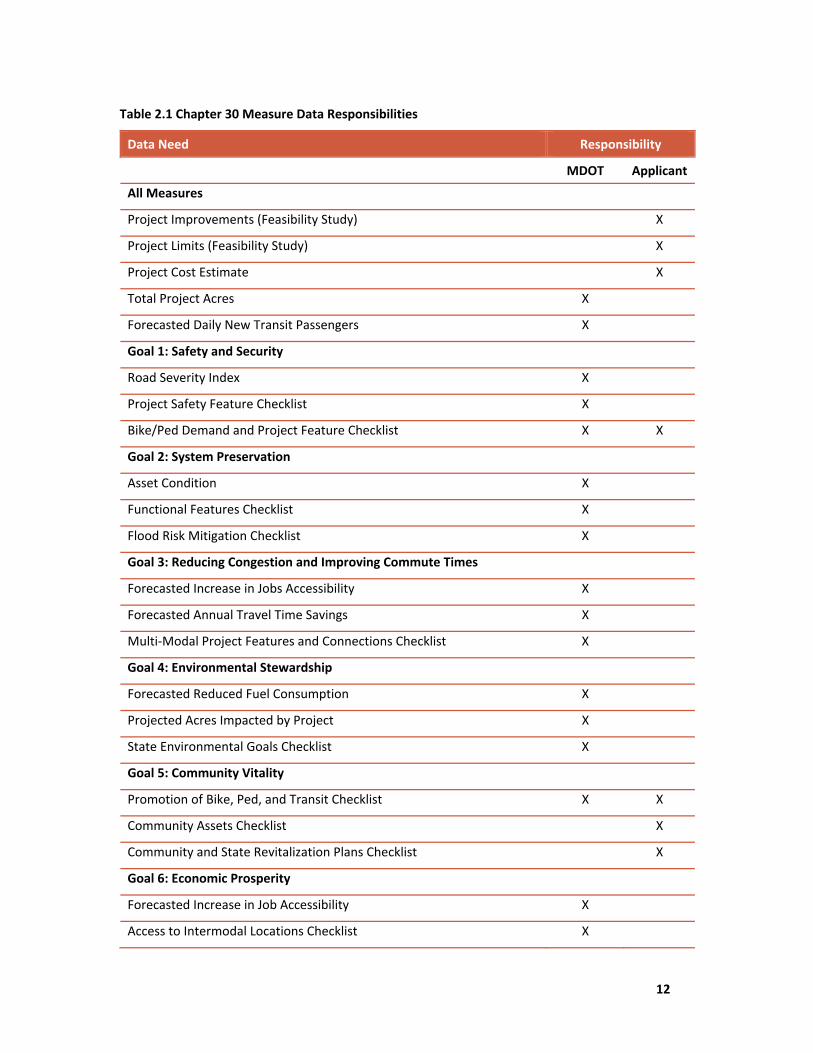
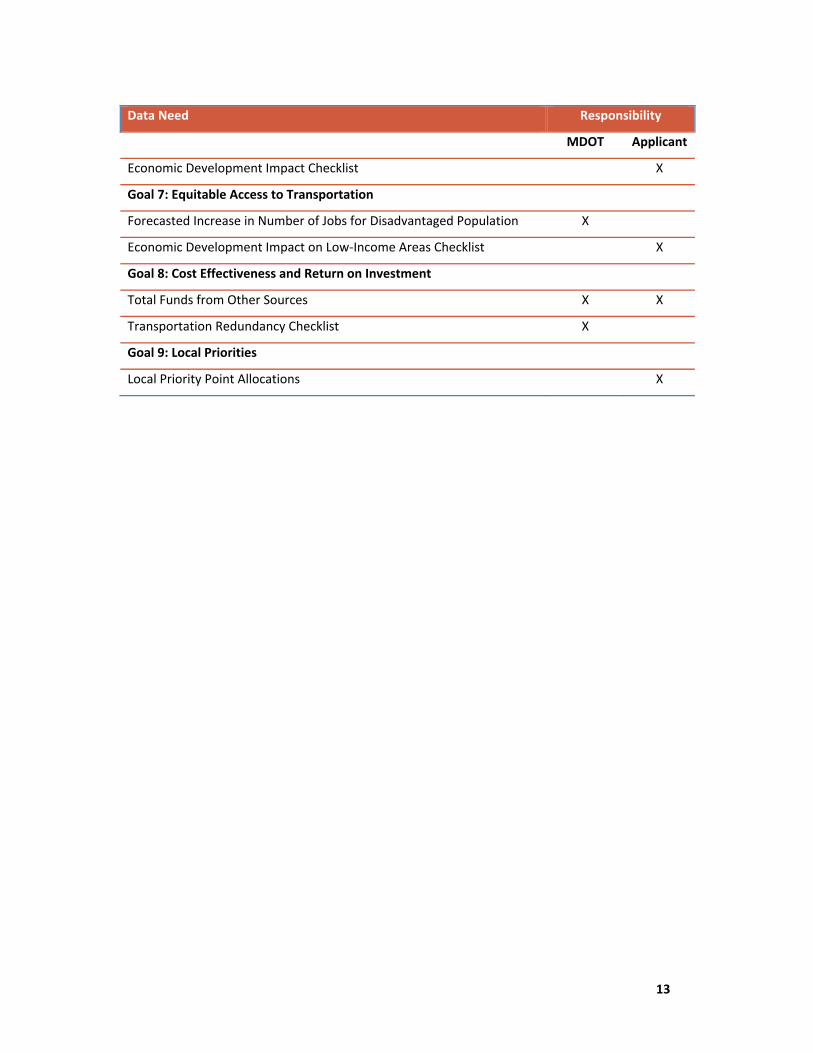
Various data elements are required to score each project through the evaluation criteria. In addition to general project information, proposing entities are responsible for completing some of the evaluation checklists used for several measures. MDOT is responsible for providing the technical and modeling data following the submittal of applications. Table 2.1 below indicates the data requirements for each measure and the entity responsible for providing the data in the scoring process.
Once submitted, the Application Review Committee checks that the projects meet the eligibility requirements. The committee also validates the information provided on the application before assembling a final list of eligible candidates ready for the scoring process.
Guide 12
Table 2.1 Chapter 30 Measure Data Responsibilities
Data Need Responsibility
MDOT Applicant
All Measures
Project Improvements (Feasibility Study) X
Project Limits (Feasibility Study) X
Project Cost Estimate X
Total Project Acres X
Forecasted Daily New Transit Passengers X
Goal 1: Safety and Security
Road Severity Index X
Project Safety Feature Checklist X
Bike/Ped Demand and Project Feature Checklist X X
Goal 2: System Preservation
Asset Condition X
Functional Features Checklist X
Flood Risk Mitigation Checklist X
Goal 3: Reducing Congestion and Improving Commute Times
Forecasted Increase in Jobs Accessibility X
Forecasted Annual Travel Time Savings X
Multi‐Modal Project Features and Connections Checklist X
Goal 4: Environmental Stewardship
Forecasted Reduced Fuel Consumption X
Projected Acres Impacted by Project X
State Environmental Goals Checklist X
Goal 5: Community Vitality
Promotion of Bike, Ped, and Transit Checklist X X
Community Assets Checklist X
Community and State Revitalization Plans Checklist X
Goal 6: Economic Prosperity
Forecasted Increase in Job Accessibility X
Access to Intermodal Locations Checklist X
Guide 13
Data Need Responsibility
MDOT Applicant
Economic Development Impact Checklist X
Goal 7: Equitable Access to Transportation
Forecasted Increase in Number of Jobs for Disadvantaged Population X
Economic Development Impact on Low‐Income Areas Checklist X
Goal 8: Cost Effectiveness and Return on Investment
Total Funds from Other Sources X X
Transportation Redundancy Checklist X
Goal 9: Local Priorities
Local Priority Point Allocations X
Guide 14
3.0 Evaluation Goals and Measures This section provides details on the goals and measures that are used to evaluate projects in the Chapter 30 process. These nine goals and twenty‐three measures were established in law through the passage of the Maryland Open Transportation Investment Decision Act and cannot be changed without legislative action.
The nine goal areas required are listed below:
Goal 1: Safety and Security ‐ Enhance the safety of transportation system users by providing for the safe movement of people and goods and reducing injuries and fatalities.
Goal 2: System Preservation ‐ Preserve the State’s existing transportation infrastructure and assets to maintain facilities in a state‐of‐good repair.
Goal 3: Reducing Congestion and Improving Commute Times ‐ Enhance the quality of service experienced by users through improving travel time reliability and accessibility.
Goal 4: Environmental Stewardship ‐ Ensure that the delivery of the State’s transportation infrastructure program conserves and enhances Maryland’s natural, historic, and cultural resources.
Goal 5: Community Vitality ‐ Provide options for the movement of people and goods that support communities and enhance quality of life.
Goal 6: Economic Prosperity ‐ Support a healthy and competitive economy in Maryland by facilitating opportunities for growth in jobs and business across the State.
Goal 7: Equitable Access to Transportation ‐ Ensure that all people have access to safe, healthy, convenient, and affordable transportation choices.
Goal 8: Cost Effectiveness and Return on Investment ‐ Utilize State resources to invest in transportation solutions that maximize the benefits to system users.
Goal 9: Local Priorities ‐ Coordinate with local stakeholders to identify transportation needs and develop transportation solutions.
The Maryland Open Transportation Investment Decision Act directs MDOT to establish the weighting metrics for each goal and measure established in the law. MDOT utilized a cross‐functional group of transit, highway, and county and local representatives to establish the weighting criteria. Below are the weighting criteria that have been enacted as part of the Chapter 30 scoring methodology. All eligible major transportation projects regardless of location or type, are evaluated with the same evaluation and weighting criteria.
Guide 15
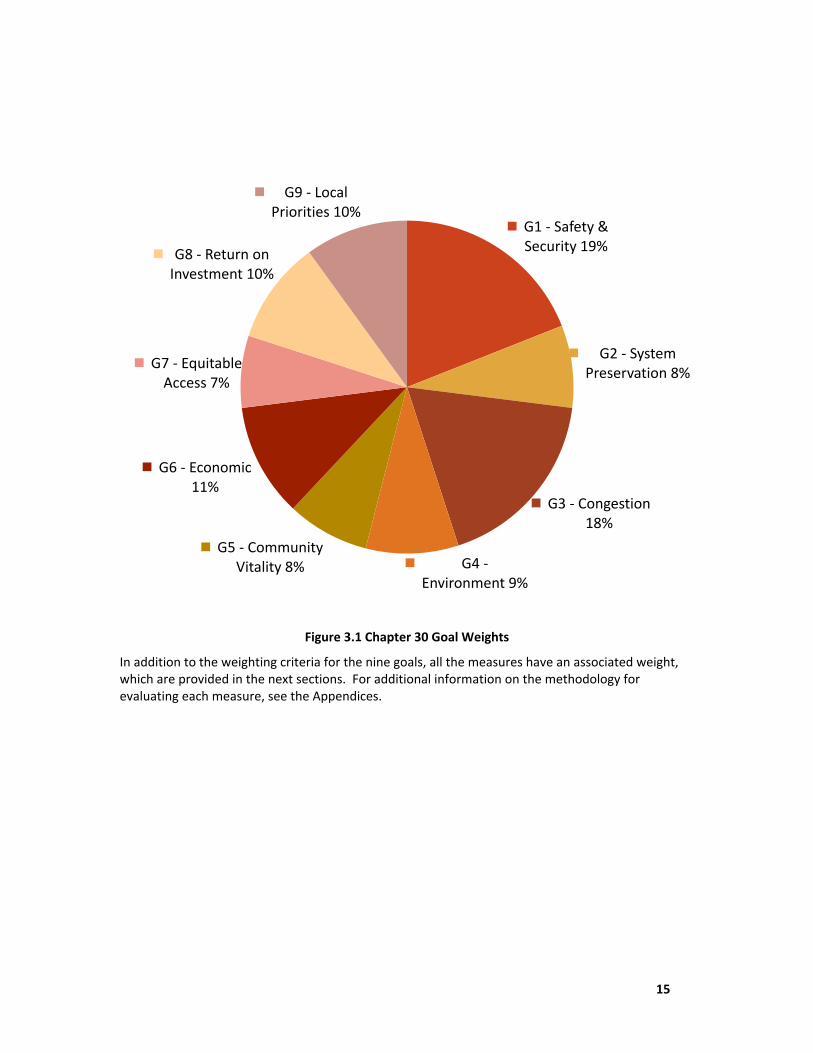
Figure 3.1 Chapter 30 Goal Weights
In addition to the weighting criteria for the nine goals, all the measures have an associated weight, which are provided in the next sections. For additional information on the methodology for evaluating each measure, see the Appendices.
G1 ‐ Safety & Security 19%
G2 ‐ System Preservation 8%
G3 ‐ Congestion18%
G4 ‐Environment 9%
G5 ‐ Community Vitality 8%
G6 ‐ Economic11%
G7 ‐ Equitable Access 7%
G8 ‐ Return on Investment 10%
G9 ‐ Local Priorities 10%
Guide 16
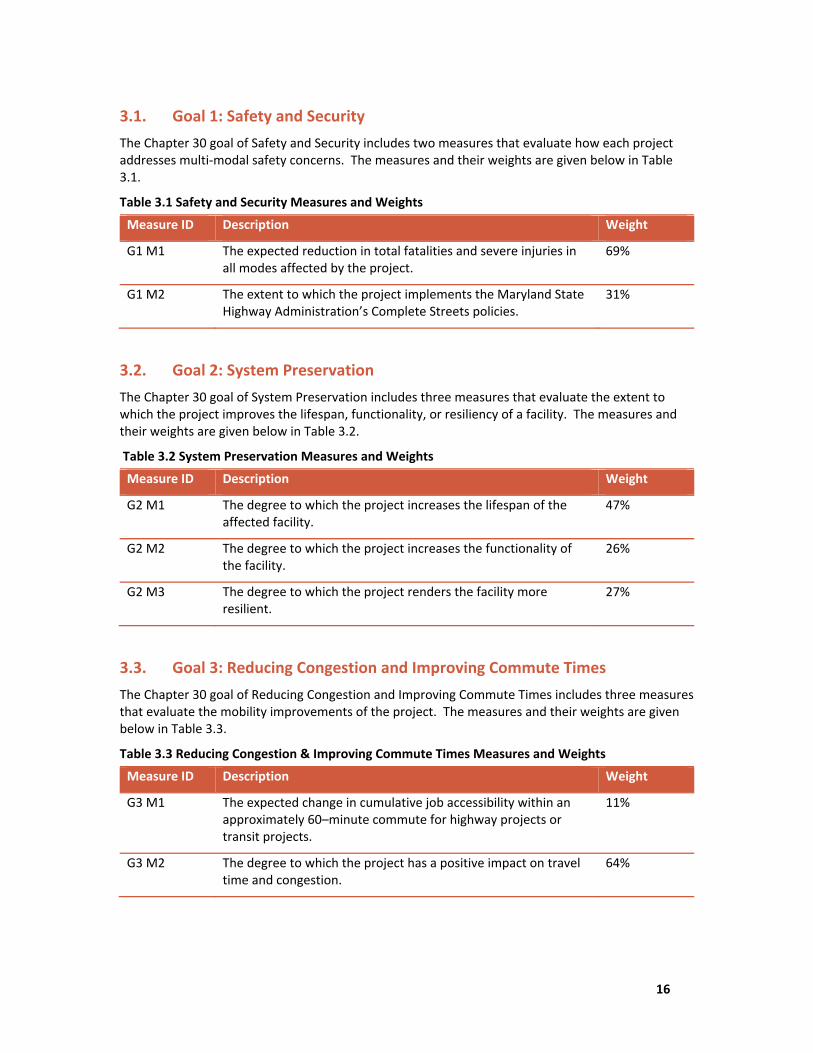
3.1. Goal 1: Safety and Security
The Chapter 30 goal of Safety and Security includes two measures that evaluate how each project addresses multi‐modal safety concerns. The measures and their weights are given below in Table 3.1.
Table 3.1 Safety and Security Measures and Weights
Measure ID Description Weight
G1 M1 The expected reduction in total fatalities and severe injuries in all modes affected by the project.
69%
G1 M2 The extent to which the project implements the Maryland State Highway Administration’s Complete Streets policies.
31%
3.2. Goal 2: System Preservation
The Chapter 30 goal of System Preservation includes three measures that evaluate the extent to which the project improves the lifespan, functionality, or resiliency of a facility. The measures and their weights are given below in Table 3.2.
Table 3.2 System Preservation Measures and Weights
Measure ID Description Weight
G2 M1 The degree to which the project increases the lifespan of the affected facility.
47%
G2 M2 The degree to which the project increases the functionality of the facility.
26%
G2 M3 The degree to which the project renders the facility more resilient.
27%
3.3. Goal 3: Reducing Congestion and Improving Commute Times
The Chapter 30 goal of Reducing Congestion and Improving Commute Times includes three measures that evaluate the mobility improvements of the project. The measures and their weights are given below in Table 3.3.
Table 3.3 Reducing Congestion & Improving Commute Times Measures and Weights
Measure ID Description Weight
G3 M1 The expected change in cumulative job accessibility within an approximately 60–minute commute for highway projects or transit projects.
11%
G3 M2 The degree to which the project has a positive impact on travel time and congestion.
64%
Guide 17
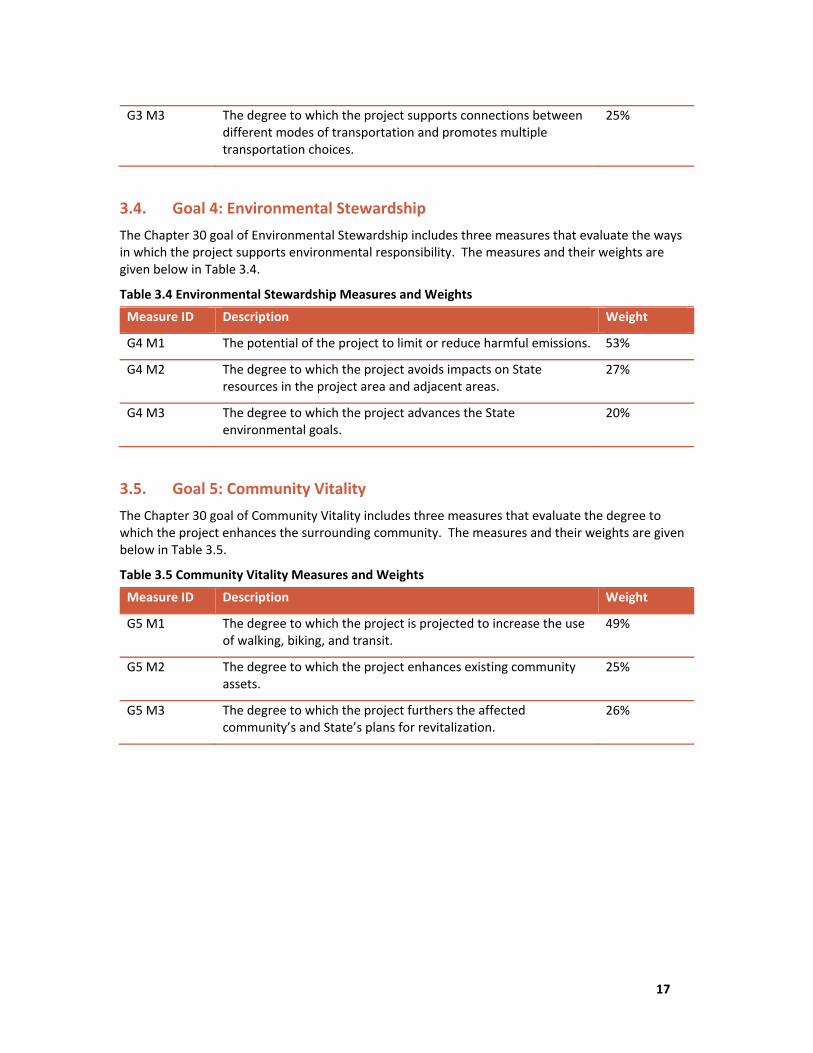
G3 M3 The degree to which the project supports connections between different modes of transportation and promotes multiple transportation choices.
25%
3.4. Goal 4: Environmental Stewardship
The Chapter 30 goal of Environmental Stewardship includes three measures that evaluate the ways in which the project supports environmental responsibility. The measures and their weights are given below in Table 3.4.
Table 3.4 Environmental Stewardship Measures and Weights
Measure ID Description Weight
G4 M1 The potential of the project to limit or reduce harmful emissions. 53%
G4 M2 The degree to which the project avoids impacts on State resources in the project area and adjacent areas.
27%
G4 M3 The degree to which the project advances the State environmental goals.
20%
3.5. Goal 5: Community Vitality
The Chapter 30 goal of Community Vitality includes three measures that evaluate the degree to which the project enhances the surrounding community. The measures and their weights are given below in Table 3.5.
Table 3.5 Community Vitality Measures and Weights
Measure ID Description Weight
G5 M1 The degree to which the project is projected to increase the use of walking, biking, and transit.
49%
G5 M2 The degree to which the project enhances existing community assets.
25%
G5 M3 The degree to which the project furthers the affected community’s and State’s plans for revitalization.
26%
Guide 18
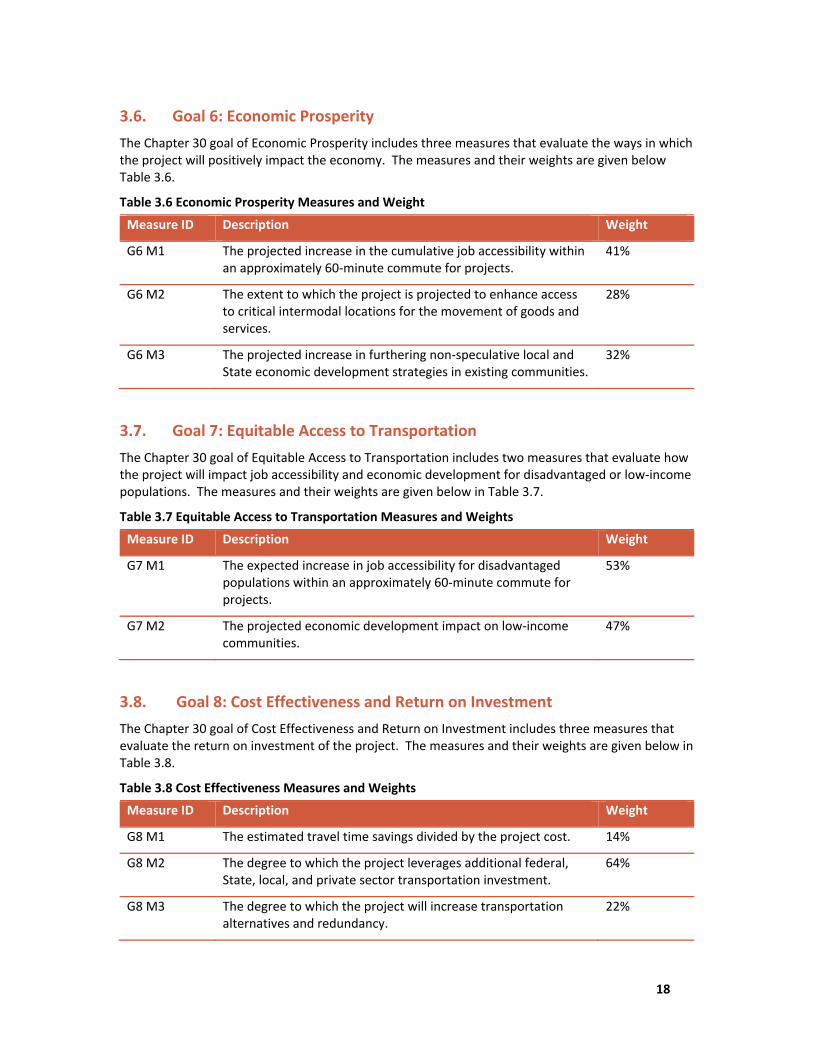
3.6. Goal 6: Economic Prosperity
The Chapter 30 goal of Economic Prosperity includes three measures that evaluate the ways in which the project will positively impact the economy. The measures and their weights are given below Table 3.6.
Table 3.6 Economic Prosperity Measures and Weight
Measure ID Description Weight
G6 M1 The projected increase in the cumulative job accessibility within an approximately 60‐minute commute for projects.
41%
G6 M2 The extent to which the project is projected to enhance access to critical intermodal locations for the movement of goods and services.
28%
G6 M3 The projected increase in furthering non‐speculative local and State economic development strategies in existing communities.
32%
3.7. Goal 7: Equitable Access to Transportation
The Chapter 30 goal of Equitable Access to Transportation includes two measures that evaluate how the project will impact job accessibility and economic development for disadvantaged or low‐income populations. The measures and their weights are given below in Table 3.7.
Table 3.7 Equitable Access to Transportation Measures and Weights
Measure ID Description Weight
G7 M1 The expected increase in job accessibility for disadvantaged populations within an approximately 60‐minute commute for projects.
53%
G7 M2 The projected economic development impact on low‐income communities.
47%
3.8. Goal 8: Cost Effectiveness and Return on Investment
The Chapter 30 goal of Cost Effectiveness and Return on Investment includes three measures that evaluate the return on investment of the project. The measures and their weights are given below in Table 3.8.
Table 3.8 Cost Effectiveness Measures and Weights
Measure ID Description Weight
G8 M1 The estimated travel time savings divided by the project cost. 14%
G8 M2 The degree to which the project leverages additional federal, State, local, and private sector transportation investment.
64%
G8 M3 The degree to which the project will increase transportation alternatives and redundancy.
22%
Guide 19
3.9. Goal 9: Local Priorities
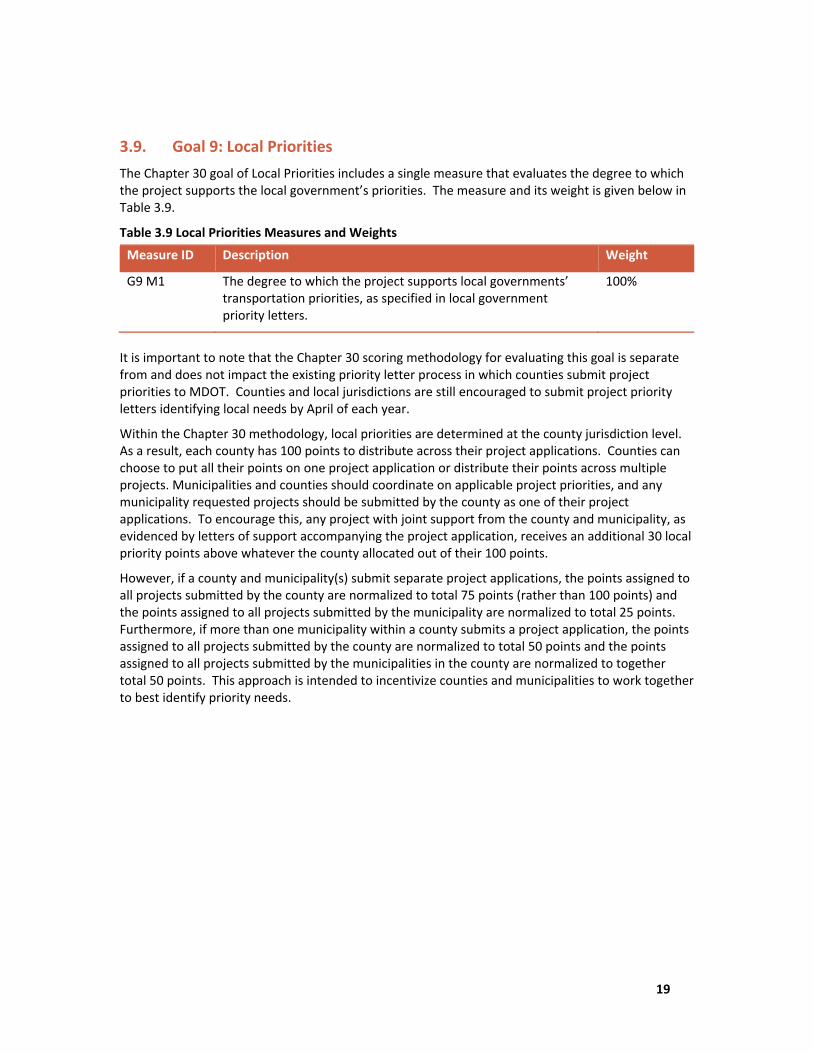
The Chapter 30 goal of Local Priorities includes a single measure that evaluates the degree to which the project supports the local government’s priorities. The measure and its weight is given below in Table 3.9.
Table 3.9 Local Priorities Measures and Weights
Measure ID Description Weight
G9 M1 The degree to which the project supports local governments’ transportation priorities, as specified in local government priority letters.
100%
It is important to note that the Chapter 30 scoring methodology for evaluating this goal is separate from and does not impact the existing priority letter process in which counties submit project priorities to MDOT. Counties and local jurisdictions are still encouraged to submit project priority letters identifying local needs by April of each year.
Within the Chapter 30 methodology, local priorities are determined at the county jurisdiction level. As a result, each county has 100 points to distribute across their project applications. Counties can choose to put all their points on one project application or distribute their points across multiple projects. Municipalities and counties should coordinate on applicable project priorities, and any municipality requested projects should be submitted by the county as one of their project applications. To encourage this, any project with joint support from the county and municipality, as evidenced by letters of support accompanying the project application, receives an additional 30 local priority points above whatever the county allocated out of their 100 points.
However, if a county and municipality(s) submit separate project applications, the points assigned to all projects submitted by the county are normalized to total 75 points (rather than 100 points) and the points assigned to all projects submitted by the municipality are normalized to total 25 points. Furthermore, if more than one municipality within a county submits a project application, the points assigned to all projects submitted by the county are normalized to total 50 points and the points assigned to all projects submitted by the municipalities in the county are normalized to together total 50 points. This approach is intended to incentivize counties and municipalities to work together to best identify priority needs.
Guide 20
4.0 Project Evaluation and Ranking This section discusses how projects are scored and ranked once submitted for consideration in the Chapter 30 scoring process. MDOT utilizes the project application data, qualitative checklist responses, and forecasted data to evaluate project against each measure. Weights are applied to the measures and then the total project score is calculated by summing the weighted values for each measure. The total project score is divided by the total project cost to get the final project score. Projects are then ranked based on this final project score.
For more details on each measure evaluation methodology, see Appendices.
4.1. Calculation of Measure Scores
The measure score for each project is determined by the project application data, qualitative checklist responses, and the forecasted data. MDOT calculates a score for each of the twenty‐three measures for each project. Depending on the measure, the score is determined through a combination of using quantitative data associated with the project (i.e. Crash Severity Index, asset quantity, travel time savings, etc.) or points assigned based on the evaluation checklist responses in the project application. Please refer to Appendices, which documents how each measure score is determined.
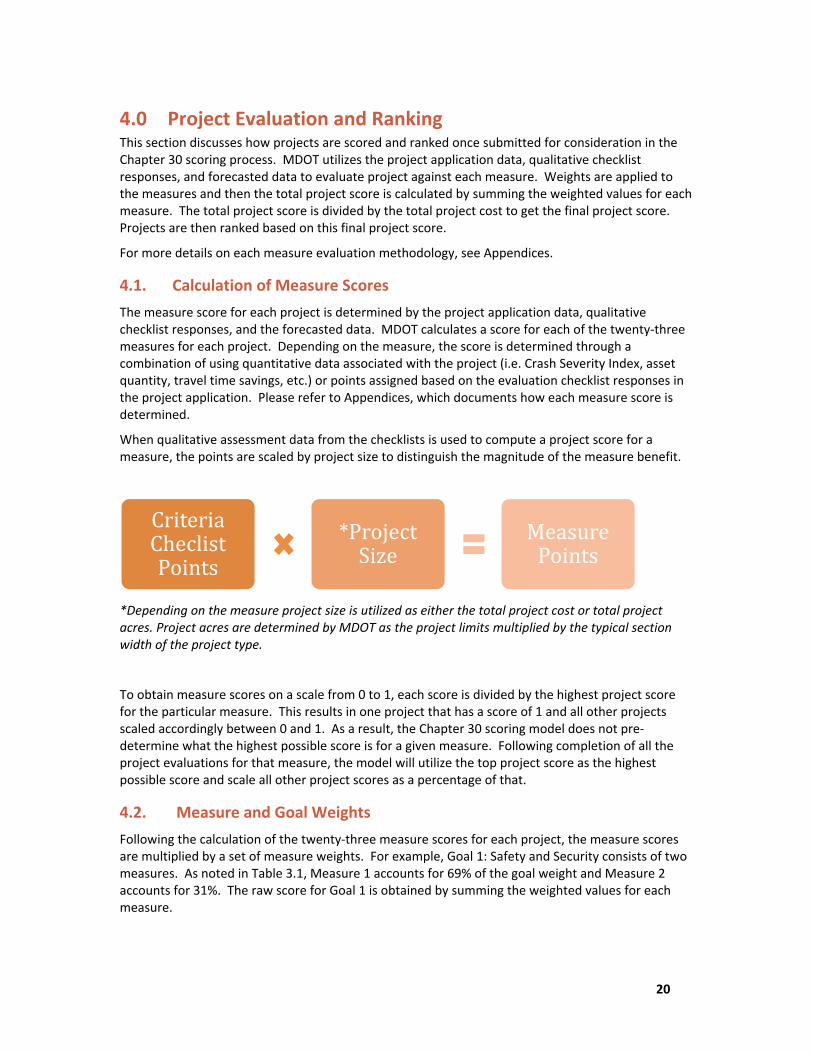
When qualitative assessment data from the checklists is used to compute a project score for a measure, the points are scaled by project size to distinguish the magnitude of the measure benefit.
*Depending on the measure project size is utilized as either the total project cost or total project acres. Project acres are determined by MDOT as the project limits multiplied by the typical section width of the project type.
To obtain measure scores on a scale from 0 to 1, each score is divided by the highest project score for the particular measure. This results in one project that has a score of 1 and all other projects scaled accordingly between 0 and 1. As a result, the Chapter 30 scoring model does not pre‐determine what the highest possible score is for a given measure. Following completion of all the project evaluations for that measure, the model will utilize the top project score as the highest possible score and scale all other project scores as a percentage of that.
4.2. Measure and Goal Weights
Following the calculation of the twenty‐three measure scores for each project, the measure scores are multiplied by a set of measure weights. For example, Goal 1: Safety and Security consists of two measures. As noted in Table 3.1, Measure 1 accounts for 69% of the goal weight and Measure 2 accounts for 31%. The raw score for Goal 1 is obtained by summing the weighted values for each measure.
CriteriaCheclistPoints
*ProjectSize
MeasurePoints
Guide 21
Once the individual goal scores are determined these are multiplied by the goal weights shown in Figure 3‐1, and the weighted goal scores are summed to obtain the project raw score. For instance, as shown in the figure, Goal 1: Safety and Security has a weight of 19%. Thus, the score for this goal is multiplied by 0.19 and added together with the values for other goals to obtain the project raw score. The project raw score represents the final evaluation of the project across all the goals and measures.
4.3 Calculating the Final Project Score and Rank
After determining the project raw score, the raw score is divided by the total project cost to obtain the final project score. Dividing the project raw score by the project cost ensures that the financial feasibility of the project is considered in the prioritization process. Given this approach, if two projects yield the same project raw score (then the least costly of the two projects will have greater priority). Projects are ranked based on the final project score, with the highest scoring project ranked first on the list. Projects with higher scores are determined or expected to deliver the most benefit for the lowest cost.
4.4 Internal/External Review
Following the completion of the project evaluations, scoring, and ranking the information is presented to the Project Ranking Committee. The Project Ranking Committee is made up of two senior TSO representatives, one senior MDOT SHA representative, and one senior MDOT MTA representative. This Committee meets to review the final scores and ranking and discusses any discrepancies, concerns, and issues with the scoring process and outcome. The Committee is responsible for ensuring an objective and transparent process is followed and the outcome represents a fair and valuable assessment of the project proposals. Following approval by the Project Ranking Committee, the project scores and rank are made available to the public through the publication of the Draft CTP and is posted on the MDOT website.
Guide 22
5 Prioritization and Programming
The project funding selection and programming process takes nearly a full year to complete through the collaboration and work of MDOT staff with the state, regional, and local stakeholders. There are several factors that help determine the selection of projects for funding. The ranking of projects that results from the Chapter 30 process is one of many factors that MDOT staff utilize to evaluate projects, and is not the final determinant of which projects are funded.
MDOT uses the following criteria to identify projects and programs that respond to the State’s transportation priorities:
Meets all federal and other legal mandates (e.g. Total Maximum Daily Load (TMDL)
compliance, Positive Train Control (PTC), Federal Aviation Administration (FAA) regulations
to maintain airport permits);
Supports MDOT’s program priorities and MTP goals (safety, system preservation, economic
development, etc.);
Meets all federal match requirements to maximize federal revenue sources;
Supports State plans and objectives;
Supports existing project commitments and upholds intergovernmental agreements;
Is a priority in a local priority letter;
Is consistent with local plans; and
Is included in the regional Metropolitan Planning Organization (MPO) long‐range plan (if
the project is located within an MPO boundary).
5.4 Public Input Process
Each year, local jurisdictions are encouraged to submit priority projects to the State by April. This priority letter can include major projects, system preservation needs, and/or planning studies. It is important to note that this process is separate from the Chapter 30 scoring process, as the Chapter 30 scoring process is only directed at major transportation projects over $5 million that are transit or highway capacity in nature.
Following the identification of all the local, regional and State transportation needs, MDOT develops a Draft CTP in September that is released to the public for comment. MDOT than conducts a CTP Tour in the fall where the Secretary of Transportation presents the Draft CTP to each county and Baltimore city, discusses the local needs, and identifies the projects selected for funding. Upon completion of the CTP Tour, MDOT incorporates the local stakeholder feedback and revises the program before finalizing and publishing the Final CTP in January.
Guide 23
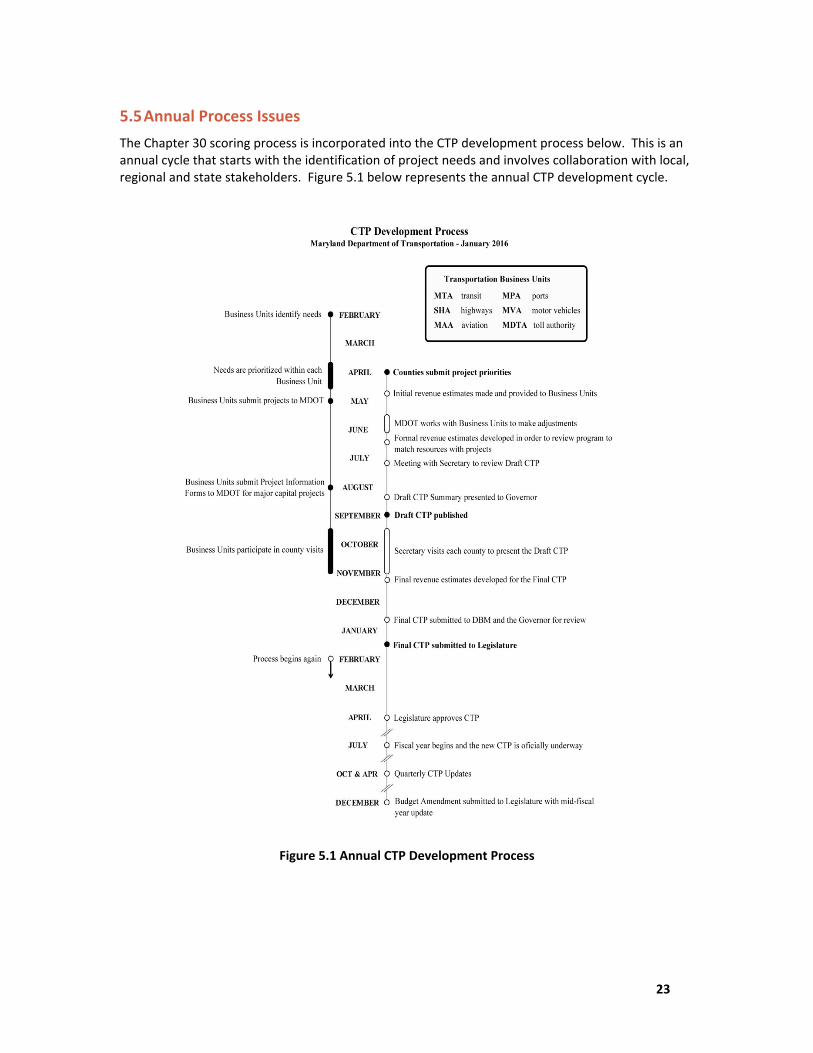
5.5 Annual Process Issues
The Chapter 30 scoring process is incorporated into the CTP development process below. This is an annual cycle that starts with the identification of project needs and involves collaboration with local, regional and state stakeholders. Figure 5.1 below represents the annual CTP development cycle.
Figure 5.1 Annual CTP Development Process

Guide 24
5.6 Improvements to Process and Measures
MDOT is committed to continually evaluating the Chapter 30 scoring model to ensure it is the most effective, transparent, and fair methodology for evaluating projects. MDOT will annually convene the Implementation Group to reevaluate the process, the evaluation criteria, and the weighting criteria to identify areas for improvement or refinement. MDOT will also engage various stakeholders as well as maintain a website for public comments and feedback about the program.
Guide 25
Appendix A ‐ Goal 1: Safety and Security Calculation
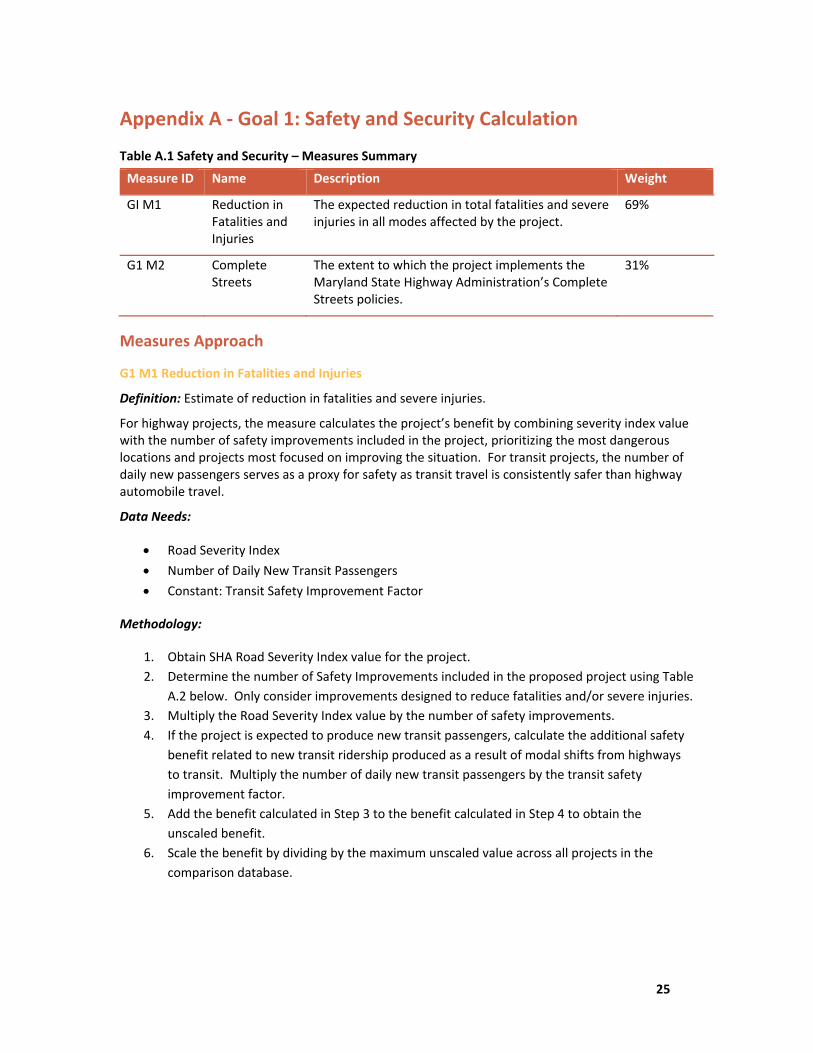
Table A.1 Safety and Security – Measures Summary
Measure ID Name Description Weight
GI M1 Reduction in Fatalities and Injuries
The expected reduction in total fatalities and severe injuries in all modes affected by the project.
69%
G1 M2 Complete Streets
The extent to which the project implements the Maryland State Highway Administration’s Complete Streets policies.
31%
Measures Approach
G1 M1 Reduction in Fatalities and Injuries
Definition: Estimate of reduction in fatalities and severe injuries.
For highway projects, the measure calculates the project’s benefit by combining severity index value with the number of safety improvements included in the project, prioritizing the most dangerous locations and projects most focused on improving the situation. For transit projects, the number of daily new passengers serves as a proxy for safety as transit travel is consistently safer than highway automobile travel.
Data Needs:
Road Severity Index
Number of Daily New Transit Passengers
Constant: Transit Safety Improvement Factor
Methodology:
1. Obtain SHA Road Severity Index value for the project.
2. Determine the number of Safety Improvements included in the proposed project using Table
A.2 below. Only consider improvements designed to reduce fatalities and/or severe injuries.
3. Multiply the Road Severity Index value by the number of safety improvements.
4. If the project is expected to produce new transit passengers, calculate the additional safety
benefit related to new transit ridership produced as a result of modal shifts from highways
to transit. Multiply the number of daily new transit passengers by the transit safety
improvement factor.
5. Add the benefit calculated in Step 3 to the benefit calculated in Step 4 to obtain the
unscaled benefit.
6. Scale the benefit by dividing by the maximum unscaled value across all projects in the
comparison database.
Guide 26
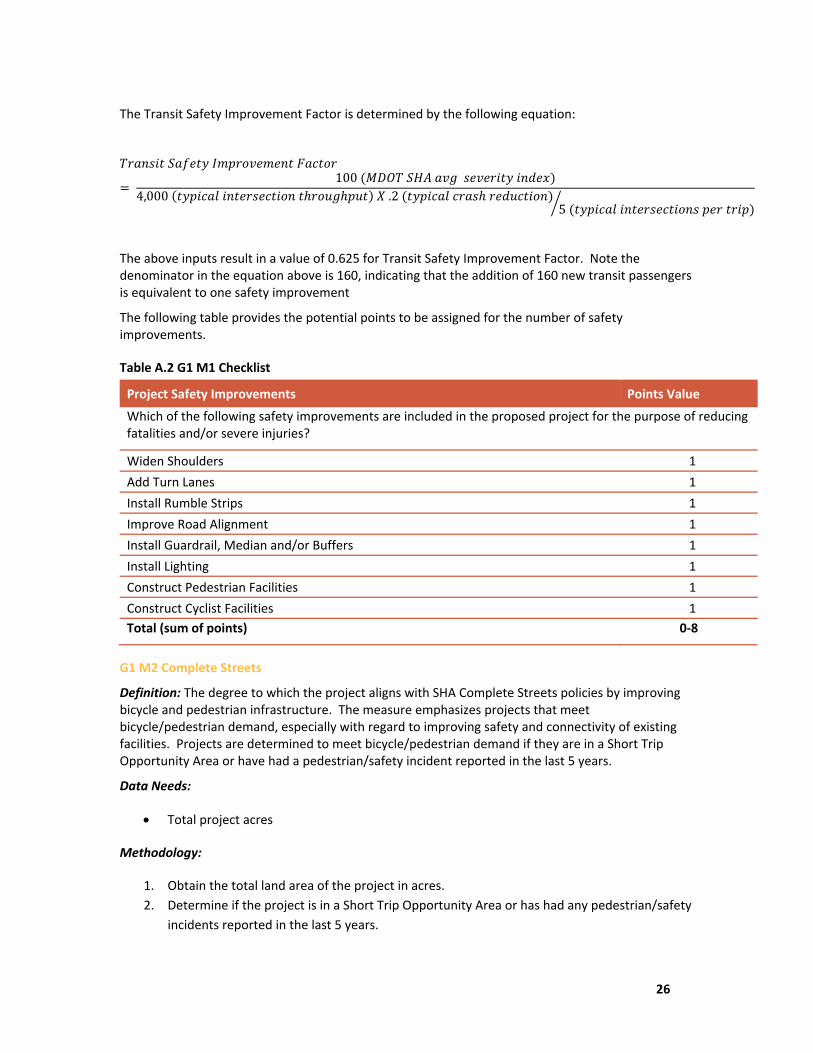
The Transit Safety Improvement Factor is determined by the following equation:
100
4,000 .2 5
The above inputs result in a value of 0.625 for Transit Safety Improvement Factor. Note the denominator in the equation above is 160, indicating that the addition of 160 new transit passengers is equivalent to one safety improvement
The following table provides the potential points to be assigned for the number of safety improvements.
Table A.2 G1 M1 Checklist
Project Safety Improvements Points Value
Which of the following safety improvements are included in the proposed project for the purpose of reducing fatalities and/or severe injuries?
Widen Shoulders 1
Add Turn Lanes 1
Install Rumble Strips 1
Improve Road Alignment 1
Install Guardrail, Median and/or Buffers 1
Install Lighting 1
Construct Pedestrian Facilities 1
Construct Cyclist Facilities 1
Total (sum of points) 0‐8
G1 M2 Complete Streets
Definition: The degree to which the project aligns with SHA Complete Streets policies by improving bicycle and pedestrian infrastructure. The measure emphasizes projects that meet bicycle/pedestrian demand, especially with regard to improving safety and connectivity of existing facilities. Projects are determined to meet bicycle/pedestrian demand if they are in a Short Trip Opportunity Area or have had a pedestrian/safety incident reported in the last 5 years.
Data Needs:
Total project acres
Methodology:
1. Obtain the total land area of the project in acres.
2. Determine if the project is in a Short Trip Opportunity Area or has had any pedestrian/safety
incidents reported in the last 5 years.
Guide 27
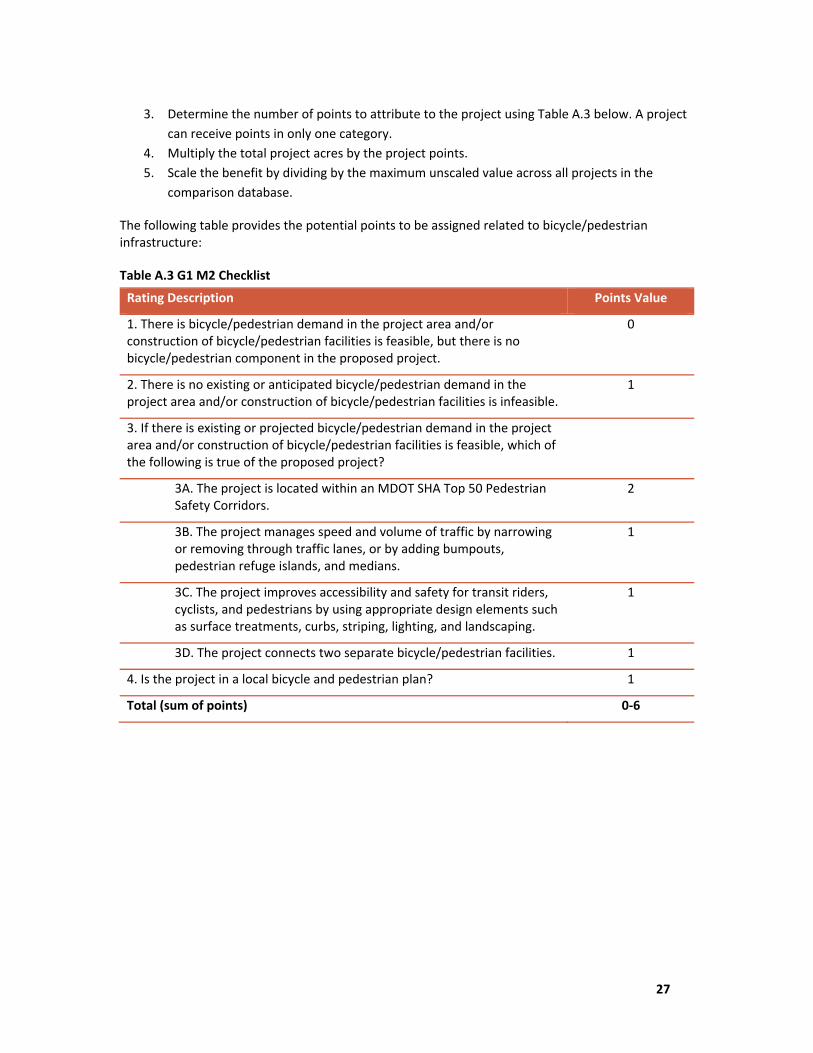
3. Determine the number of points to attribute to the project using Table A.3 below. A project
can receive points in only one category.
4. Multiply the total project acres by the project points.
5. Scale the benefit by dividing by the maximum unscaled value across all projects in the
comparison database.
The following table provides the potential points to be assigned related to bicycle/pedestrian infrastructure:
Table A.3 G1 M2 Checklist
Rating Description Points Value
1. There is bicycle/pedestrian demand in the project area and/or construction of bicycle/pedestrian facilities is feasible, but there is no bicycle/pedestrian component in the proposed project.
0
2. There is no existing or anticipated bicycle/pedestrian demand in the project area and/or construction of bicycle/pedestrian facilities is infeasible.
1
3. If there is existing or projected bicycle/pedestrian demand in the project area and/or construction of bicycle/pedestrian facilities is feasible, which of the following is true of the proposed project?
3A. The project is located within an MDOT SHA Top 50 Pedestrian Safety Corridors.
2
3B. The project manages speed and volume of traffic by narrowing or removing through traffic lanes, or by adding bumpouts, pedestrian refuge islands, and medians.
1
3C. The project improves accessibility and safety for transit riders, cyclists, and pedestrians by using appropriate design elements such as surface treatments, curbs, striping, lighting, and landscaping.
1
3D. The project connects two separate bicycle/pedestrian facilities. 1
4. Is the project in a local bicycle and pedestrian plan? 1
Total (sum of points) 0‐6
Guide 28
Appendix B ‐ Goal 2: System Preservation Calculation
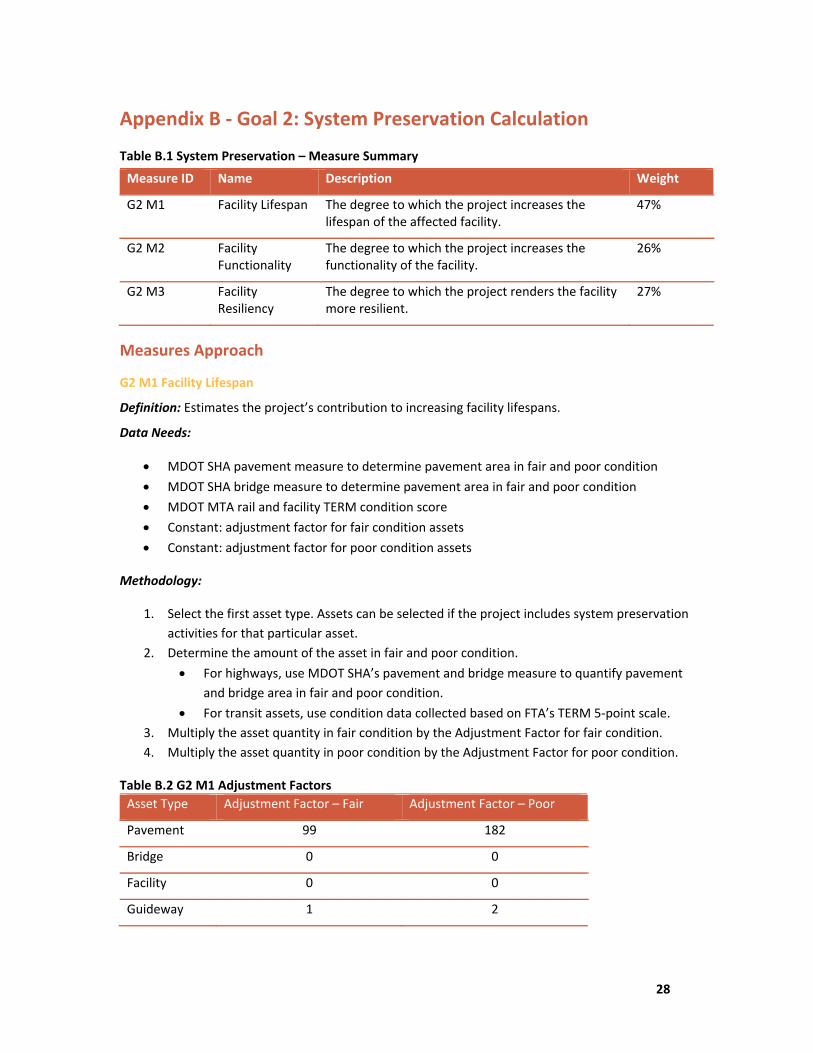
Table B.1 System Preservation – Measure Summary
Measure ID Name Description Weight
G2 M1 Facility Lifespan The degree to which the project increases the lifespan of the affected facility.
47%
G2 M2 Facility Functionality
The degree to which the project increases the functionality of the facility.
26%
G2 M3 Facility Resiliency
The degree to which the project renders the facility more resilient.
27%
Measures Approach
G2 M1 Facility Lifespan
Definition: Estimates the project’s contribution to increasing facility lifespans.
Data Needs:
MDOT SHA pavement measure to determine pavement area in fair and poor condition
MDOT SHA bridge measure to determine pavement area in fair and poor condition
MDOT MTA rail and facility TERM condition score
Constant: adjustment factor for fair condition assets
Constant: adjustment factor for poor condition assets
Methodology:
1. Select the first asset type. Assets can be selected if the project includes system preservation
activities for that particular asset.
2. Determine the amount of the asset in fair and poor condition.
For highways, use MDOT SHA’s pavement and bridge measure to quantify pavement
and bridge area in fair and poor condition.
For transit assets, use condition data collected based on FTA’s TERM 5‐point scale.
3. Multiply the asset quantity in fair condition by the Adjustment Factor for fair condition.
4. Multiply the asset quantity in poor condition by the Adjustment Factor for poor condition.
Table B.2 G2 M1 Adjustment Factors
Asset Type Adjustment Factor – Fair Adjustment Factor – Poor
Pavement 99 182
Bridge 0 0
Facility 0 0
Guideway 1 2
Guide 29
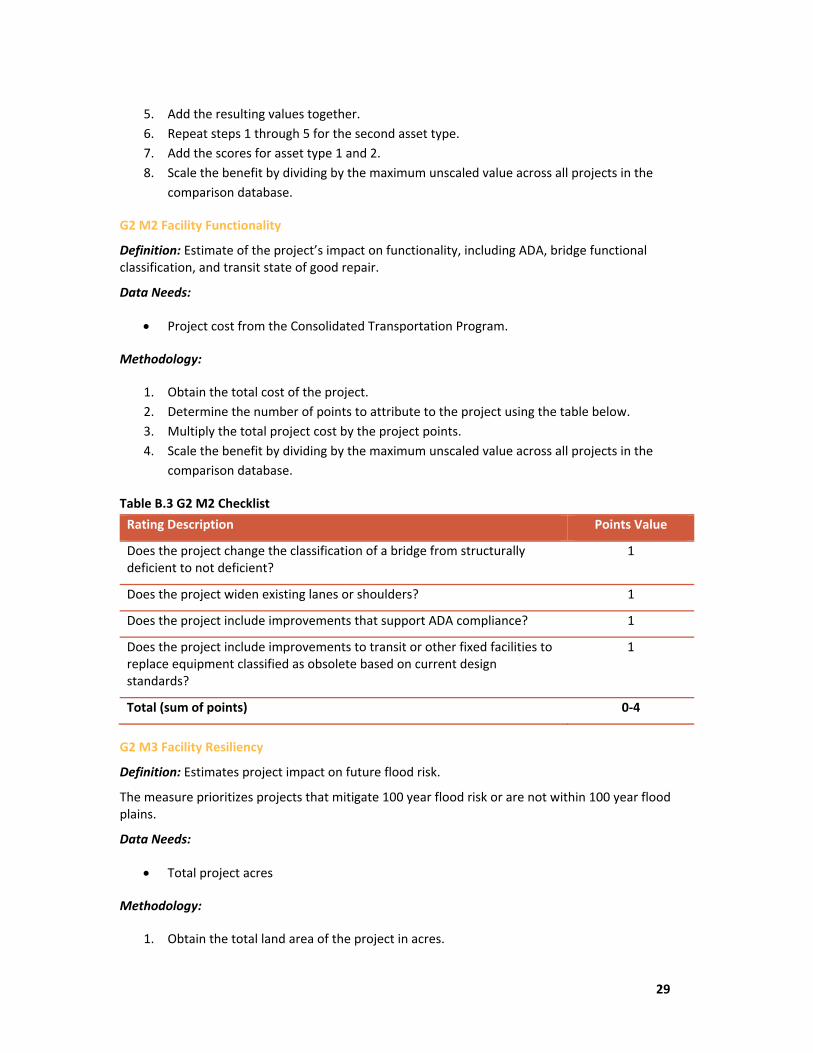
5. Add the resulting values together.
6. Repeat steps 1 through 5 for the second asset type.
7. Add the scores for asset type 1 and 2.
8. Scale the benefit by dividing by the maximum unscaled value across all projects in the
comparison database.
G2 M2 Facility Functionality
Definition: Estimate of the project’s impact on functionality, including ADA, bridge functional classification, and transit state of good repair.
Data Needs:
Project cost from the Consolidated Transportation Program.
Methodology:
1. Obtain the total cost of the project.
2. Determine the number of points to attribute to the project using the table below.
3. Multiply the total project cost by the project points.
4. Scale the benefit by dividing by the maximum unscaled value across all projects in the
comparison database.
Table B.3 G2 M2 Checklist
Rating Description Points Value
Does the project change the classification of a bridge from structurally deficient to not deficient?
1
Does the project widen existing lanes or shoulders? 1
Does the project include improvements that support ADA compliance? 1
Does the project include improvements to transit or other fixed facilities to replace equipment classified as obsolete based on current design standards?
1
Total (sum of points) 0‐4
G2 M3 Facility Resiliency
Definition: Estimates project impact on future flood risk.
The measure prioritizes projects that mitigate 100 year flood risk or are not within 100 year flood plains.
Data Needs:
Total project acres
Methodology:
1. Obtain the total land area of the project in acres.
Guide 30
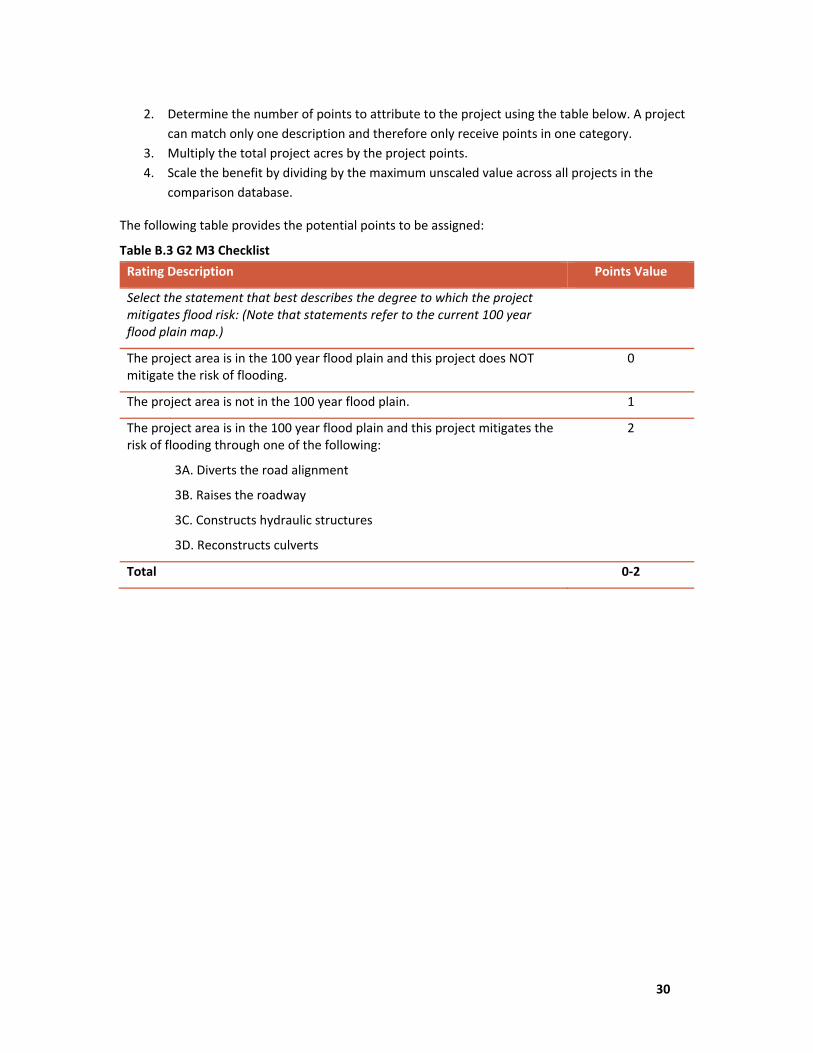
2. Determine the number of points to attribute to the project using the table below. A project
can match only one description and therefore only receive points in one category.
3. Multiply the total project acres by the project points.
4. Scale the benefit by dividing by the maximum unscaled value across all projects in the
comparison database.
The following table provides the potential points to be assigned:
Table B.3 G2 M3 Checklist
Rating Description Points Value
Select the statement that best describes the degree to which the project mitigates flood risk: (Note that statements refer to the current 100 year flood plain map.)
The project area is in the 100 year flood plain and this project does NOT mitigate the risk of flooding.
0
The project area is not in the 100 year flood plain. 1
The project area is in the 100 year flood plain and this project mitigates the risk of flooding through one of the following:
3A. Diverts the road alignment
3B. Raises the roadway
3C. Constructs hydraulic structures
3D. Reconstructs culverts
2
Total 0‐2
Guide 31
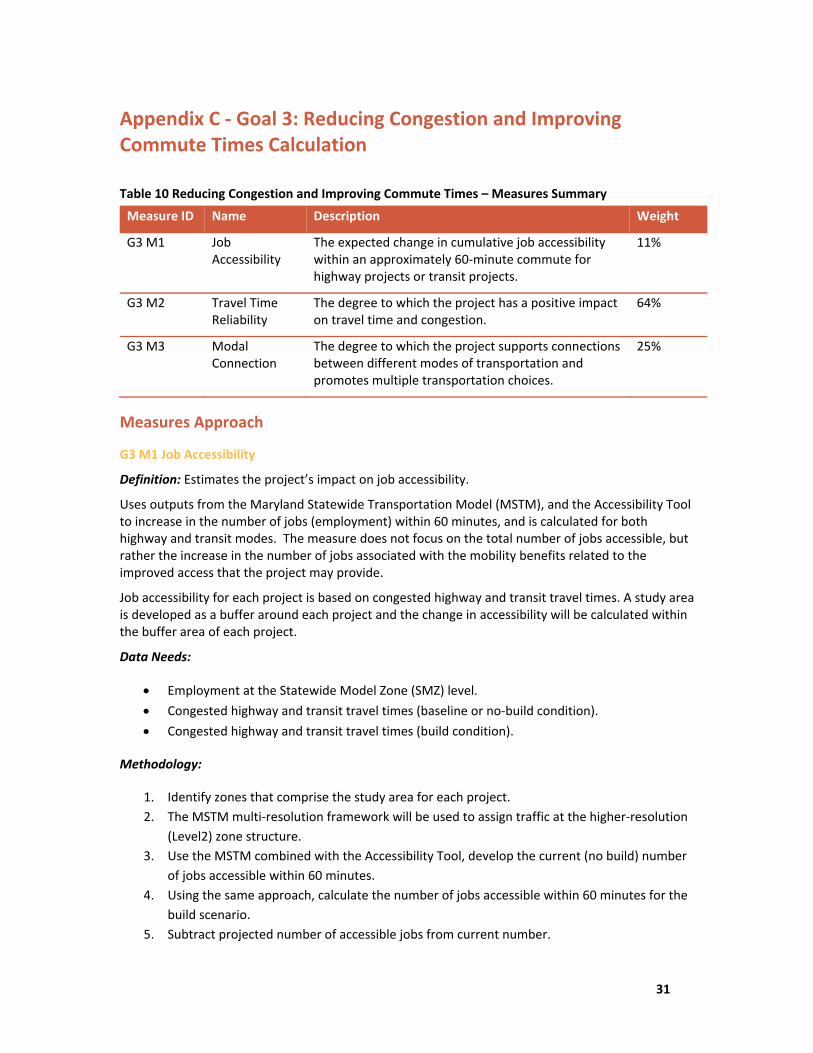
Appendix C ‐ Goal 3: Reducing Congestion and Improving Commute Times Calculation
Table 10 Reducing Congestion and Improving Commute Times – Measures Summary
Measure ID Name Description Weight
G3 M1 Job Accessibility
The expected change in cumulative job accessibility within an approximately 60‐minute commute for highway projects or transit projects.
11%
G3 M2 Travel Time Reliability
The degree to which the project has a positive impact on travel time and congestion.
64%
G3 M3 Modal Connection
The degree to which the project supports connections between different modes of transportation and promotes multiple transportation choices.
25%
Measures Approach
G3 M1 Job Accessibility
Definition: Estimates the project’s impact on job accessibility.
Uses outputs from the Maryland Statewide Transportation Model (MSTM), and the Accessibility Tool to increase in the number of jobs (employment) within 60 minutes, and is calculated for both highway and transit modes. The measure does not focus on the total number of jobs accessible, but rather the increase in the number of jobs associated with the mobility benefits related to the improved access that the project may provide.
Job accessibility for each project is based on congested highway and transit travel times. A study area is developed as a buffer around each project and the change in accessibility will be calculated within the buffer area of each project.
Data Needs:
Employment at the Statewide Model Zone (SMZ) level.
Congested highway and transit travel times (baseline or no‐build condition).
Congested highway and transit travel times (build condition).
Methodology:
1. Identify zones that comprise the study area for each project.
2. The MSTM multi‐resolution framework will be used to assign traffic at the higher‐resolution
(Level2) zone structure.
3. Use the MSTM combined with the Accessibility Tool, develop the current (no build) number
of jobs accessible within 60 minutes.
4. Using the same approach, calculate the number of jobs accessible within 60 minutes for the
build scenario.
5. Subtract projected number of accessible jobs from current number.
Guide 32
6. Calculate the percent change in job accessibility for jobs within 60 minutes of the project
study area.
G3 M2 Travel Time Reliability
Definition: Estimates the project’s impact on travel time.
The measure seeks to quantify the annual hours of travel time savings produced by the project across highway and transit modes within the project study area.
Data Needs:
Daily uncongested highway travel times
Daily congested highway travel times
Daily new transit passengers
Constant: travel time savings per new transit passenger
Methodology:
Highway Projects
1. Identify zones that comprise the study area for each project.
2. The MSTM multi‐resolution framework will be used to assign traffic at the higher‐resolution
(Level2) zone structure.
3. Combine the vehicle hours travelled (VHT) for each time‐of‐day to develop daily VHT under
free‐flow conditions
4. Combine the vehicle hours travelled for each time‐of‐day to develop daily VHT under
congested conditions
5. Subtract the congested VHT from the free‐flow VHT to calculate the vehicle hours of delay
(VHD)
6. Annualize the daily VHT, and divide by 1000 to report in thousands.
Transit/Multi‐Modal Projects
1. Obtain the number of daily new transit passengers.
2. Compute travel time savings for transit riders:
Multiply daily new transit passengers by the travel time savings for new transit
passenger (constant value expressed in minutes/trip).
Convert from daily to annual travel time savings. This value represents the annual
minutes of travel time saved by new transit passengers produced by the project.
Divide by 60 to convert minutes of travel time savings to hours of travel time savings.
Then divide by 1000 to convert value to align with the 1000s of hours scale.
3. Add the values for annual travel time savings for highway and transit.
4. Scale the benefit by dividing by the maximum unscaled value across all projects in the
comparison database.
Note the following assumptions used to obtain the travel time savings for a new transit passenger (in minutes/trip):
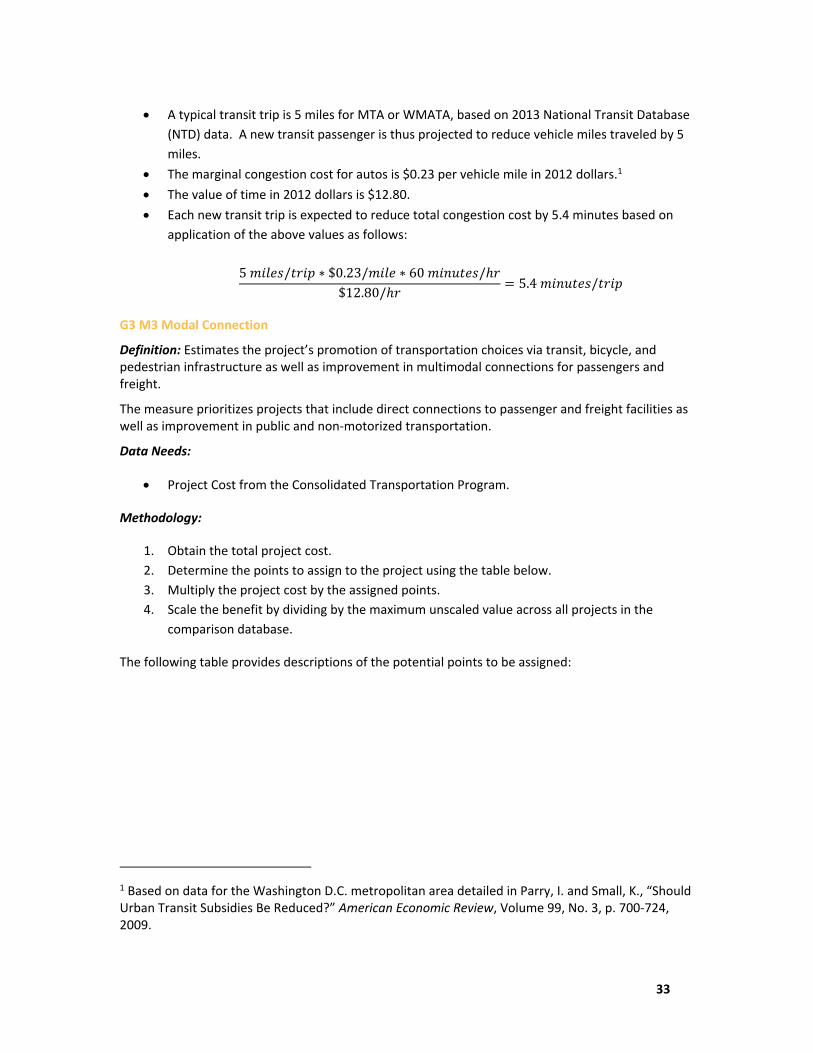
Guide 33
A typical transit trip is 5 miles for MTA or WMATA, based on 2013 National Transit Database
(NTD) data. A new transit passenger is thus projected to reduce vehicle miles traveled by 5
miles.
The marginal congestion cost for autos is $0.23 per vehicle mile in 2012 dollars.1
The value of time in 2012 dollars is $12.80.
Each new transit trip is expected to reduce total congestion cost by 5.4 minutes based on
application of the above values as follows:
5 / ∗ $0.23/ ∗ 60 /$12.80/
5.4 /
G3 M3 Modal Connection
Definition: Estimates the project’s promotion of transportation choices via transit, bicycle, and pedestrian infrastructure as well as improvement in multimodal connections for passengers and freight.
The measure prioritizes projects that include direct connections to passenger and freight facilities as well as improvement in public and non‐motorized transportation.
Data Needs:
Project Cost from the Consolidated Transportation Program.
Methodology:
1. Obtain the total project cost.
2. Determine the points to assign to the project using the table below.
3. Multiply the project cost by the assigned points.
4. Scale the benefit by dividing by the maximum unscaled value across all projects in the
comparison database.
The following table provides descriptions of the potential points to be assigned:
1 Based on data for the Washington D.C. metropolitan area detailed in Parry, I. and Small, K., “Should Urban Transit Subsidies Be Reduced?” American Economic Review, Volume 99, No. 3, p. 700‐724, 2009.
Guide 34
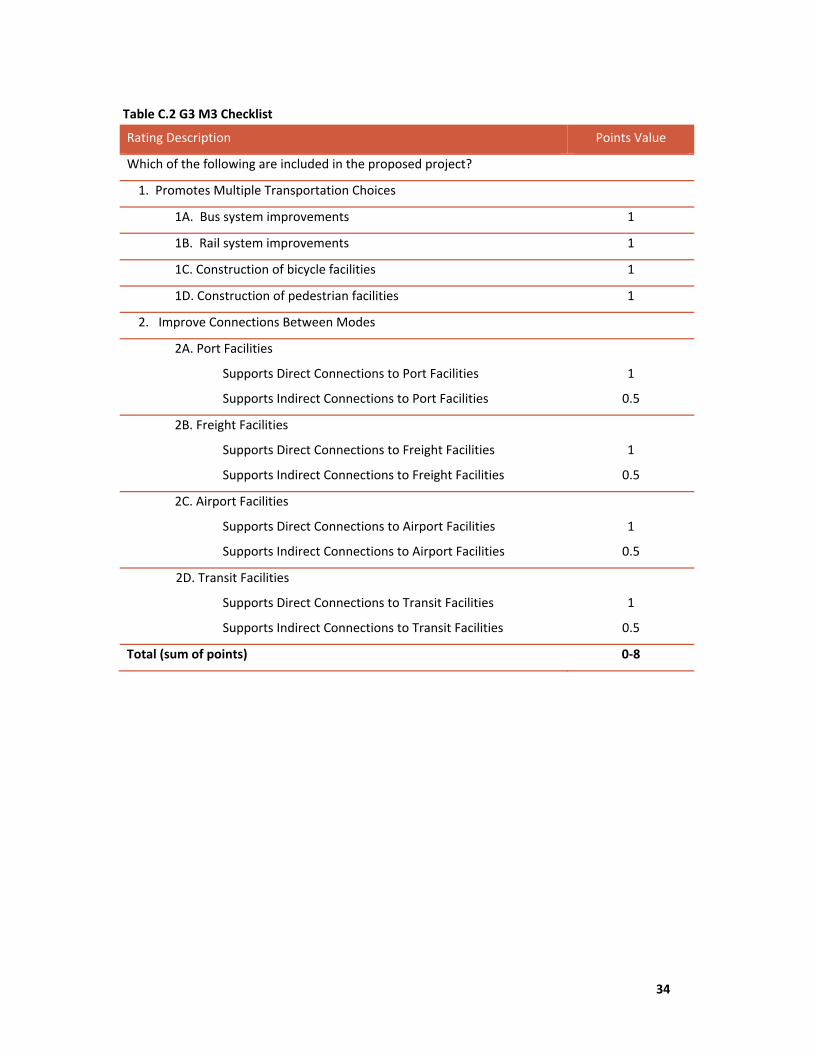
Table C.2 G3 M3 Checklist
Rating Description Points Value
Which of the following are included in the proposed project?
1. Promotes Multiple Transportation Choices
1A. Bus system improvements 1
1B. Rail system improvements 1
1C. Construction of bicycle facilities 1
1D. Construction of pedestrian facilities 1
2. Improve Connections Between Modes
2A. Port Facilities
Supports Direct Connections to Port Facilities
Supports Indirect Connections to Port Facilities
1
0.5
2B. Freight Facilities
Supports Direct Connections to Freight Facilities
Supports Indirect Connections to Freight Facilities
1
0.5
2C. Airport Facilities
Supports Direct Connections to Airport Facilities
Supports Indirect Connections to Airport Facilities
1
0.5
2D. Transit Facilities
Supports Direct Connections to Transit Facilities
Supports Indirect Connections to Transit Facilities
1
0.5
Total (sum of points) 0‐8
Guide 35
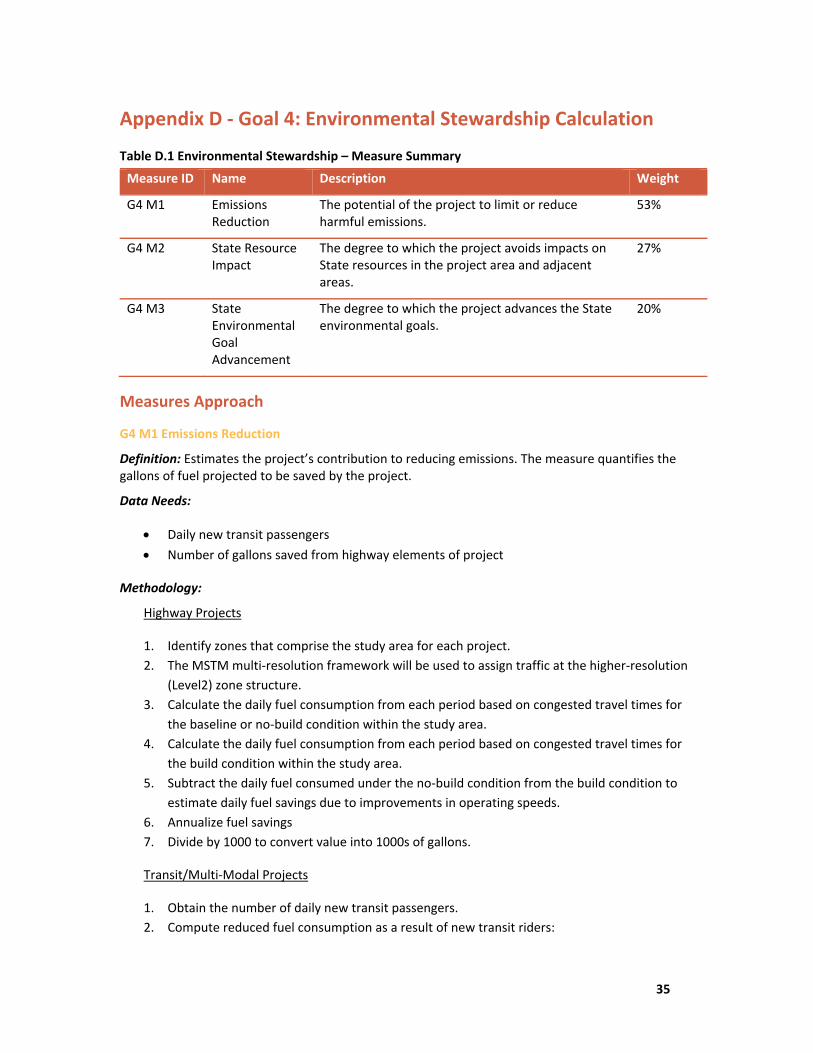
Appendix D ‐ Goal 4: Environmental Stewardship Calculation
Table D.1 Environmental Stewardship – Measure Summary
Measure ID Name Description Weight
G4 M1 Emissions Reduction
The potential of the project to limit or reduce harmful emissions.
53%
G4 M2 State Resource Impact
The degree to which the project avoids impacts on State resources in the project area and adjacent areas.
27%
G4 M3 State Environmental Goal Advancement
The degree to which the project advances the State environmental goals.
20%
Measures Approach
G4 M1 Emissions Reduction
Definition: Estimates the project’s contribution to reducing emissions. The measure quantifies the gallons of fuel projected to be saved by the project.
Data Needs:
Daily new transit passengers
Number of gallons saved from highway elements of project
Methodology:
Highway Projects
1. Identify zones that comprise the study area for each project.
2. The MSTM multi‐resolution framework will be used to assign traffic at the higher‐resolution
(Level2) zone structure.
3. Calculate the daily fuel consumption from each period based on congested travel times for
the baseline or no‐build condition within the study area.
4. Calculate the daily fuel consumption from each period based on congested travel times for
the build condition within the study area.
5. Subtract the daily fuel consumed under the no‐build condition from the build condition to
estimate daily fuel savings due to improvements in operating speeds.
6. Annualize fuel savings
7. Divide by 1000 to convert value into 1000s of gallons.
Transit/Multi‐Modal Projects
1. Obtain the number of daily new transit passengers.
2. Compute reduced fuel consumption as a result of new transit riders:
Guide 36
Convert new daily transit passengers to annual pasengers.
Multiply by average transit trip length in miles (constant value). This value represents
annual miles of new transit trips.
Divide by Fuel Economy Average in miles per gallon (constant value). This value
represents the gallons of fuel saved by shifting passengers from highway to transit
travel.
Divide by 1000 to convert value into 1000s of gallons.
3. Add the values for fuel savings for highway and transit.
4. Scale the benefit by dividing by the maximum unscaled value across all projects in the
comparison database.
G4 M2 State Resource Impact
Definition: Estimates the proportion of the total project acres that negatively impact State resources. Using geospatial data, the proportion of project area that impacts State resources can be calculated.
Data Needs:
Acres of State impacted land.
Total acres of project
Methodology:
1. Determine the number of state resource acres impacted by the project. Resources that are
under the control of the State are limited to historic properties and state parks. Utilizing
geospatial data, the project acres will be layered over historic and state park land to
determine the acres of state resources impacted.
2. Divide by the total project acres.
3. Scale the benefit by dividing by the maximum unscaled value across all projects in the
comparison database.
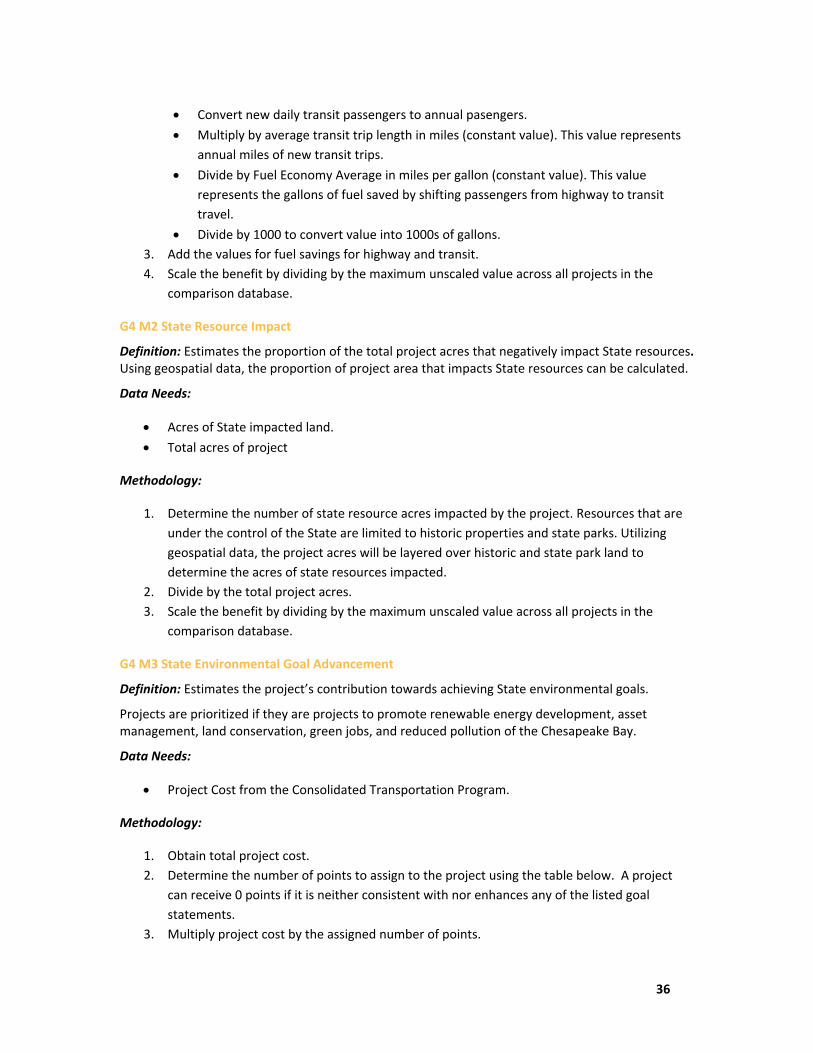
G4 M3 State Environmental Goal Advancement
Definition: Estimates the project’s contribution towards achieving State environmental goals.
Projects are prioritized if they are projects to promote renewable energy development, asset management, land conservation, green jobs, and reduced pollution of the Chesapeake Bay.
Data Needs:
Project Cost from the Consolidated Transportation Program.
Methodology:
1. Obtain total project cost.
2. Determine the number of points to assign to the project using the table below. A project
can receive 0 points if it is neither consistent with nor enhances any of the listed goal
statements.
3. Multiply project cost by the assigned number of points.
Guide 37
4. Scale the benefit by dividing by the maximum unscaled value across all projects in the
comparison database.
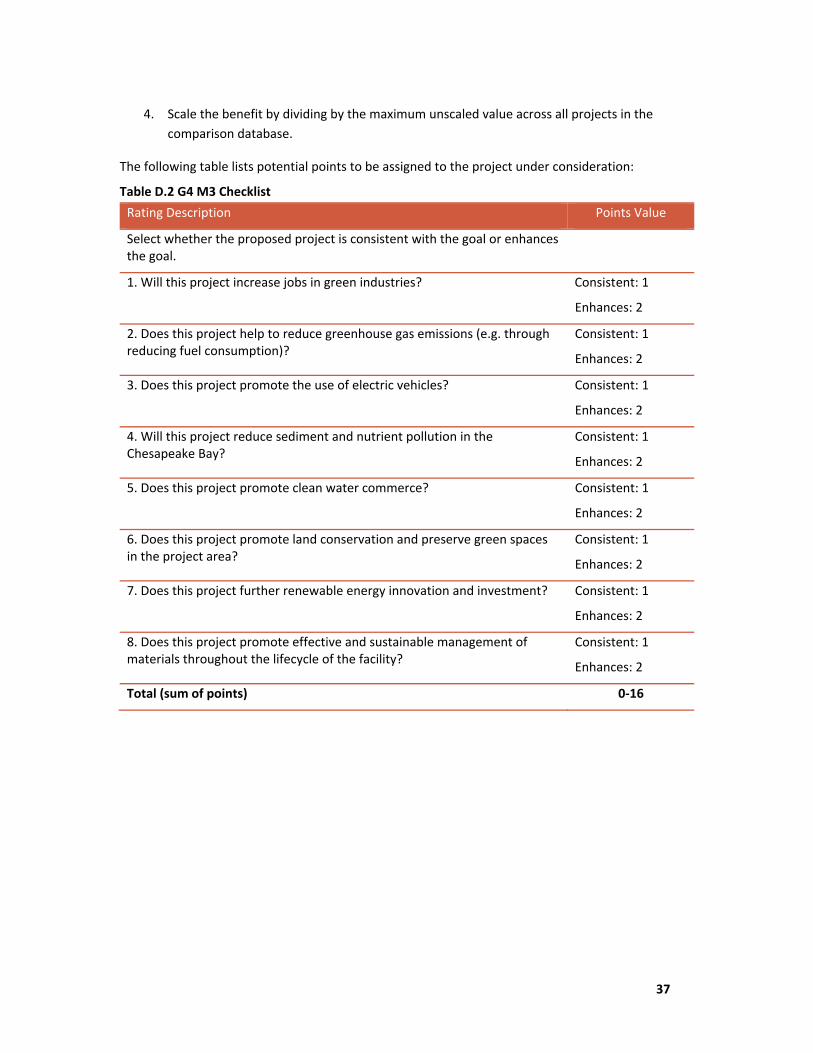
The following table lists potential points to be assigned to the project under consideration:
Table D.2 G4 M3 Checklist
Rating Description Points Value
Select whether the proposed project is consistent with the goal or enhances the goal.
1. Will this project increase jobs in green industries? Consistent: 1
Enhances: 2
2. Does this project help to reduce greenhouse gas emissions (e.g. through reducing fuel consumption)?
Consistent: 1
Enhances: 2
3. Does this project promote the use of electric vehicles? Consistent: 1
Enhances: 2
4. Will this project reduce sediment and nutrient pollution in the Chesapeake Bay?
Consistent: 1
Enhances: 2
5. Does this project promote clean water commerce? Consistent: 1
Enhances: 2
6. Does this project promote land conservation and preserve green spaces in the project area?
Consistent: 1
Enhances: 2
7. Does this project further renewable energy innovation and investment? Consistent: 1
Enhances: 2
8. Does this project promote effective and sustainable management of materials throughout the lifecycle of the facility?
Consistent: 1
Enhances: 2
Total (sum of points) 0‐16
Guide 38
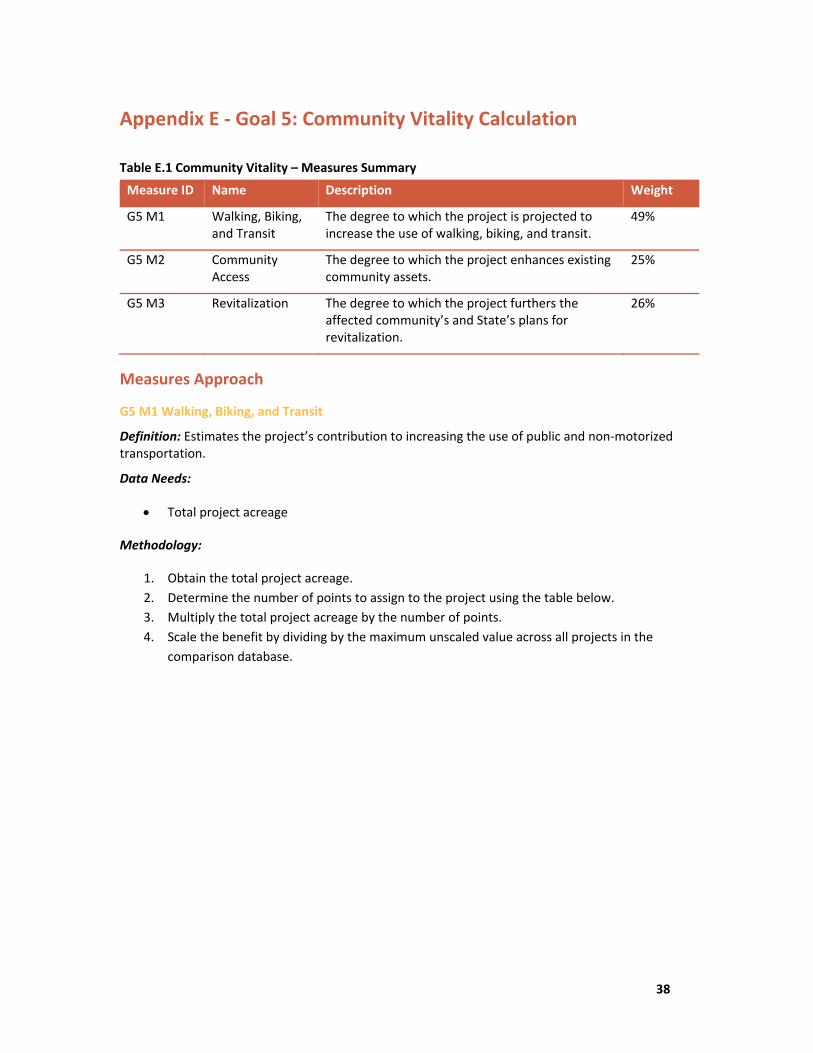
Appendix E ‐ Goal 5: Community Vitality Calculation
Table E.1 Community Vitality – Measures Summary
Measure ID Name Description Weight
G5 M1 Walking, Biking, and Transit
The degree to which the project is projected to increase the use of walking, biking, and transit.
49%
G5 M2 Community Access
The degree to which the project enhances existing community assets.
25%
G5 M3 Revitalization The degree to which the project furthers the affected community’s and State’s plans for revitalization.
26%
Measures Approach
G5 M1 Walking, Biking, and Transit
Definition: Estimates the project’s contribution to increasing the use of public and non‐motorized transportation.
Data Needs:
Total project acreage
Methodology:
1. Obtain the total project acreage.
2. Determine the number of points to assign to the project using the table below.
3. Multiply the total project acreage by the number of points.
4. Scale the benefit by dividing by the maximum unscaled value across all projects in the
comparison database.
Guide 39
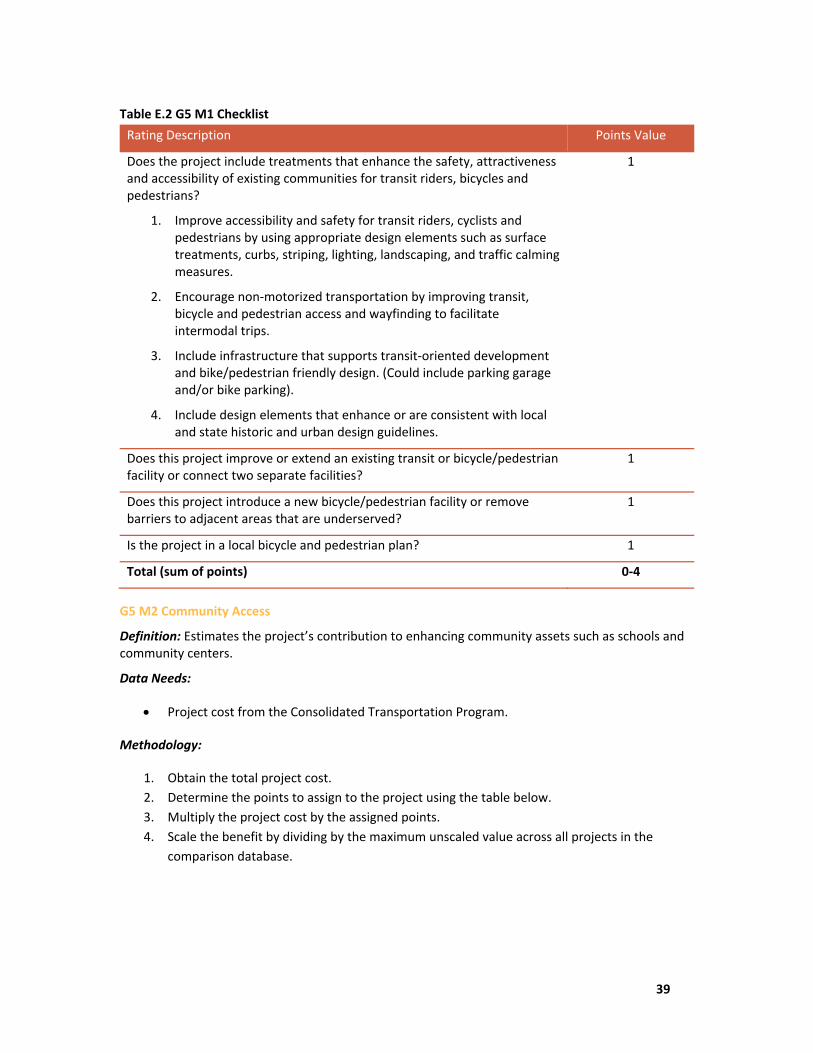
Table E.2 G5 M1 Checklist
Rating Description Points Value
Does the project include treatments that enhance the safety, attractiveness and accessibility of existing communities for transit riders, bicycles and pedestrians?
1. Improve accessibility and safety for transit riders, cyclists and pedestrians by using appropriate design elements such as surface treatments, curbs, striping, lighting, landscaping, and traffic calming measures.
2. Encourage non‐motorized transportation by improving transit, bicycle and pedestrian access and wayfinding to facilitate intermodal trips.
3. Include infrastructure that supports transit‐oriented development and bike/pedestrian friendly design. (Could include parking garage and/or bike parking).
4. Include design elements that enhance or are consistent with local and state historic and urban design guidelines.
1
Does this project improve or extend an existing transit or bicycle/pedestrian facility or connect two separate facilities?
1
Does this project introduce a new bicycle/pedestrian facility or remove barriers to adjacent areas that are underserved?
1
Is the project in a local bicycle and pedestrian plan? 1
Total (sum of points) 0‐4
G5 M2 Community Access
Definition: Estimates the project’s contribution to enhancing community assets such as schools and community centers.
Data Needs:
Project cost from the Consolidated Transportation Program.
Methodology:
1. Obtain the total project cost.
2. Determine the points to assign to the project using the table below.
3. Multiply the project cost by the assigned points.
4. Scale the benefit by dividing by the maximum unscaled value across all projects in the
comparison database.
Guide 40
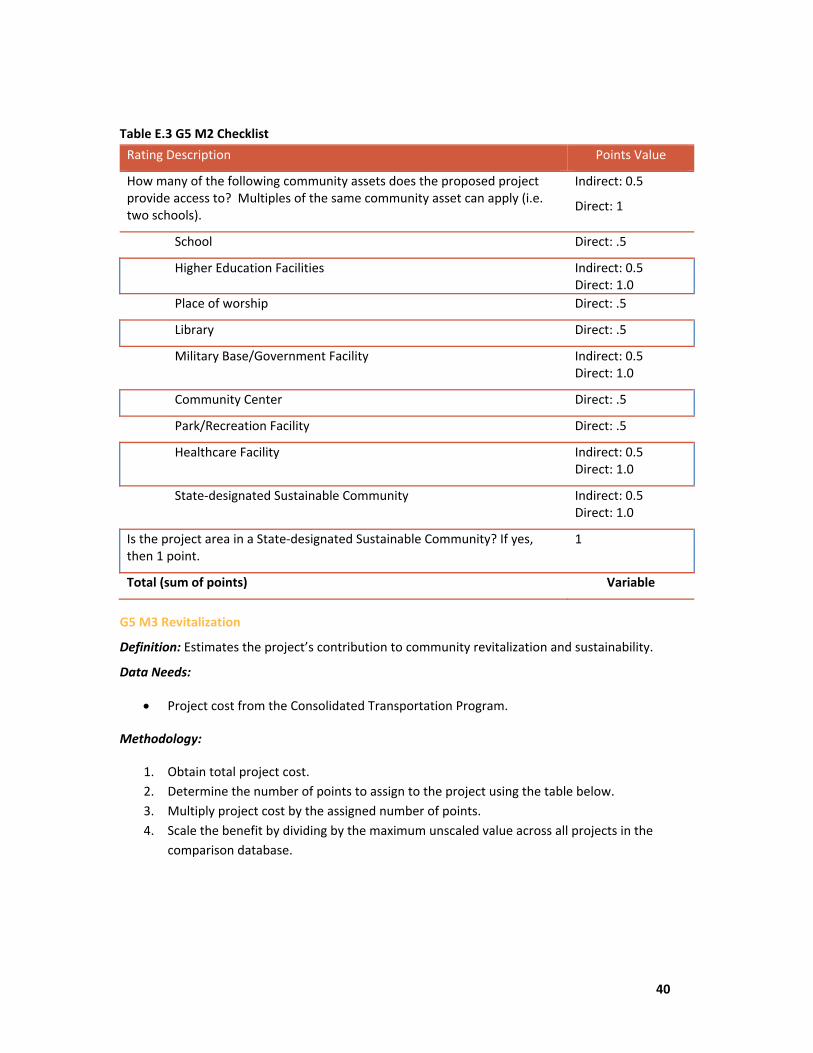
Table E.3 G5 M2 Checklist
Rating Description Points Value
How many of the following community assets does the proposed project provide access to? Multiples of the same community asset can apply (i.e. two schools).
Indirect: 0.5
Direct: 1
School Direct: .5
Higher Education Facilities Indirect: 0.5 Direct: 1.0
Place of worship Direct: .5
Library Direct: .5
Military Base/Government Facility Indirect: 0.5 Direct: 1.0
Community Center Direct: .5
Park/Recreation Facility Direct: .5
Healthcare Facility Indirect: 0.5 Direct: 1.0
State‐designated Sustainable Community Indirect: 0.5 Direct: 1.0
Is the project area in a State‐designated Sustainable Community? If yes, then 1 point.
1
Total (sum of points) Variable
G5 M3 Revitalization
Definition: Estimates the project’s contribution to community revitalization and sustainability.
Data Needs:
Project cost from the Consolidated Transportation Program.
Methodology:
1. Obtain total project cost.
2. Determine the number of points to assign to the project using the table below.
3. Multiply project cost by the assigned number of points.
4. Scale the benefit by dividing by the maximum unscaled value across all projects in the
comparison database.
Guide 41
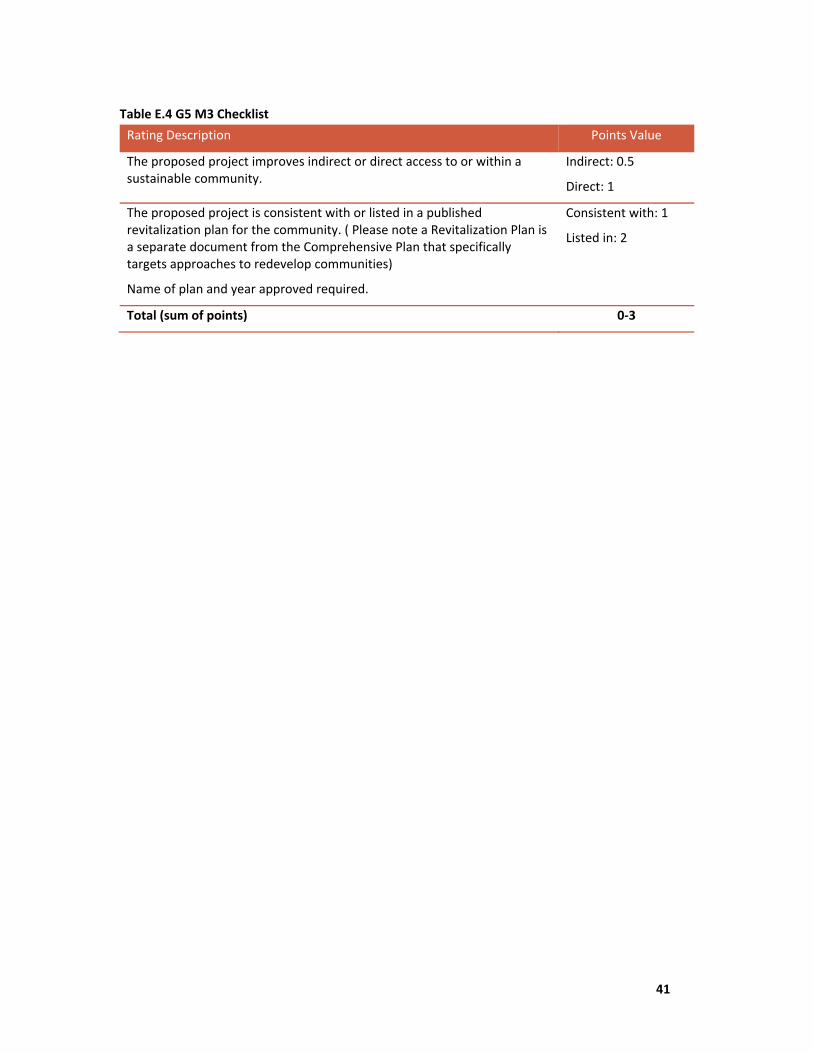
Table E.4 G5 M3 Checklist
Rating Description Points Value
The proposed project improves indirect or direct access to or within a sustainable community.
Indirect: 0.5
Direct: 1
The proposed project is consistent with or listed in a published revitalization plan for the community. ( Please note a Revitalization Plan is a separate document from the Comprehensive Plan that specifically targets approaches to redevelop communities)
Name of plan and year approved required.
Consistent with: 1
Listed in: 2
Total (sum of points) 0‐3
Guide 42
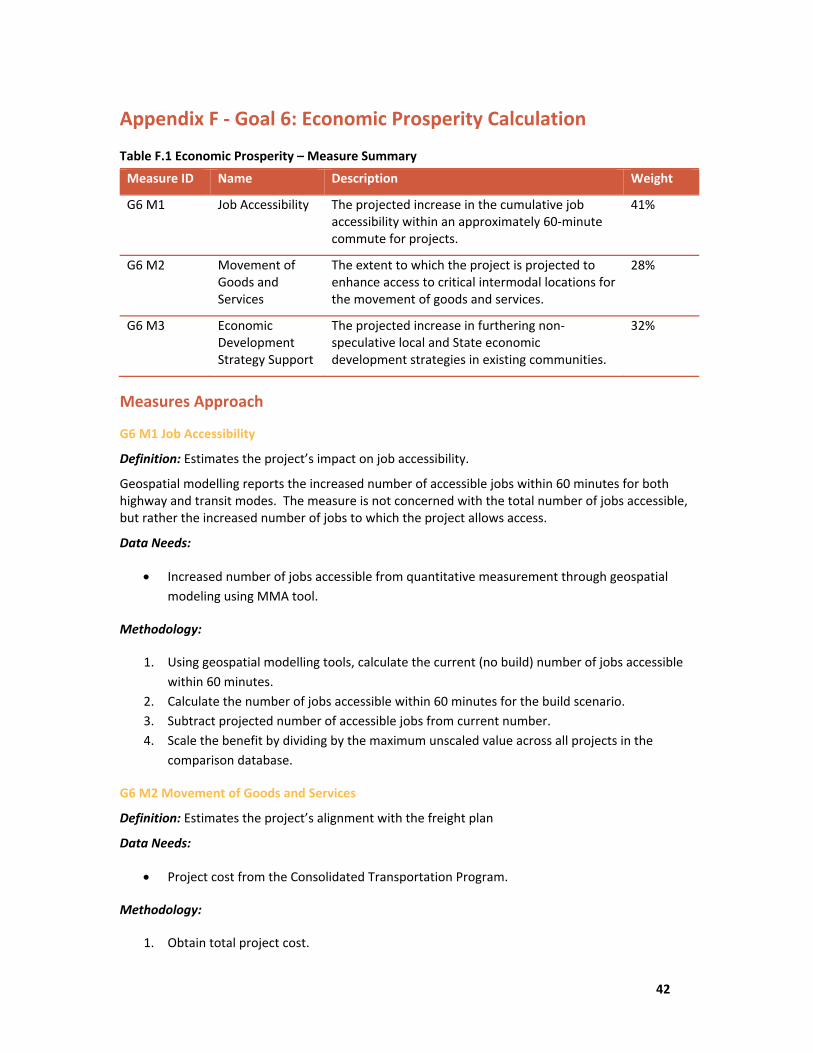
Appendix F ‐ Goal 6: Economic Prosperity Calculation
Table F.1 Economic Prosperity – Measure Summary
Measure ID Name Description Weight
G6 M1 Job Accessibility The projected increase in the cumulative job accessibility within an approximately 60‐minute commute for projects.
41%
G6 M2 Movement of Goods and Services
The extent to which the project is projected to enhance access to critical intermodal locations for the movement of goods and services.
28%
G6 M3 Economic Development Strategy Support
The projected increase in furthering non‐speculative local and State economic development strategies in existing communities.
32%
Measures Approach
G6 M1 Job Accessibility
Definition: Estimates the project’s impact on job accessibility.
Geospatial modelling reports the increased number of accessible jobs within 60 minutes for both highway and transit modes. The measure is not concerned with the total number of jobs accessible, but rather the increased number of jobs to which the project allows access.
Data Needs:
Increased number of jobs accessible from quantitative measurement through geospatial
modeling using MMA tool.
Methodology:
1. Using geospatial modelling tools, calculate the current (no build) number of jobs accessible
within 60 minutes.
2. Calculate the number of jobs accessible within 60 minutes for the build scenario.
3. Subtract projected number of accessible jobs from current number.
4. Scale the benefit by dividing by the maximum unscaled value across all projects in the
comparison database.
G6 M2 Movement of Goods and Services
Definition: Estimates the project’s alignment with the freight plan
Data Needs:
Project cost from the Consolidated Transportation Program.
Methodology:
1. Obtain total project cost.
Guide 43
2. Determine the number of points to assign to the project using the table below.
3. Multiply project cost by the assigned number of points.
4. Scale the benefit by dividing by the maximum unscaled value across all projects in the
comparison database.
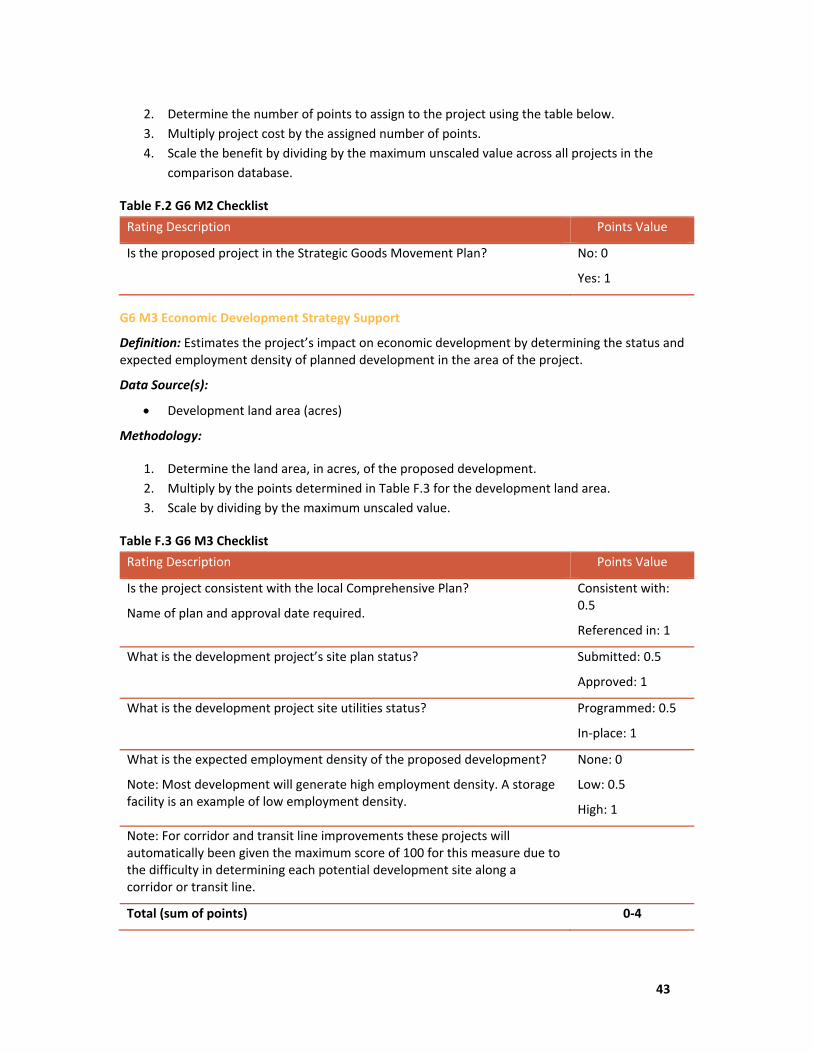
Table F.2 G6 M2 Checklist
Rating Description Points Value
Is the proposed project in the Strategic Goods Movement Plan? No: 0
Yes: 1
G6 M3 Economic Development Strategy Support
Definition: Estimates the project’s impact on economic development by determining the status and expected employment density of planned development in the area of the project.
Data Source(s):
Development land area (acres)
Methodology:
1. Determine the land area, in acres, of the proposed development.
2. Multiply by the points determined in Table F.3 for the development land area.
3. Scale by dividing by the maximum unscaled value.
Table F.3 G6 M3 Checklist
Rating Description Points Value
Is the project consistent with the local Comprehensive Plan?
Name of plan and approval date required.
Consistent with: 0.5
Referenced in: 1
What is the development project’s site plan status? Submitted: 0.5
Approved: 1
What is the development project site utilities status? Programmed: 0.5
In‐place: 1
What is the expected employment density of the proposed development?
Note: Most development will generate high employment density. A storage facility is an example of low employment density.
None: 0
Low: 0.5
High: 1
Note: For corridor and transit line improvements these projects will automatically been given the maximum score of 100 for this measure due to the difficulty in determining each potential development site along a corridor or transit line.
Total (sum of points) 0‐4
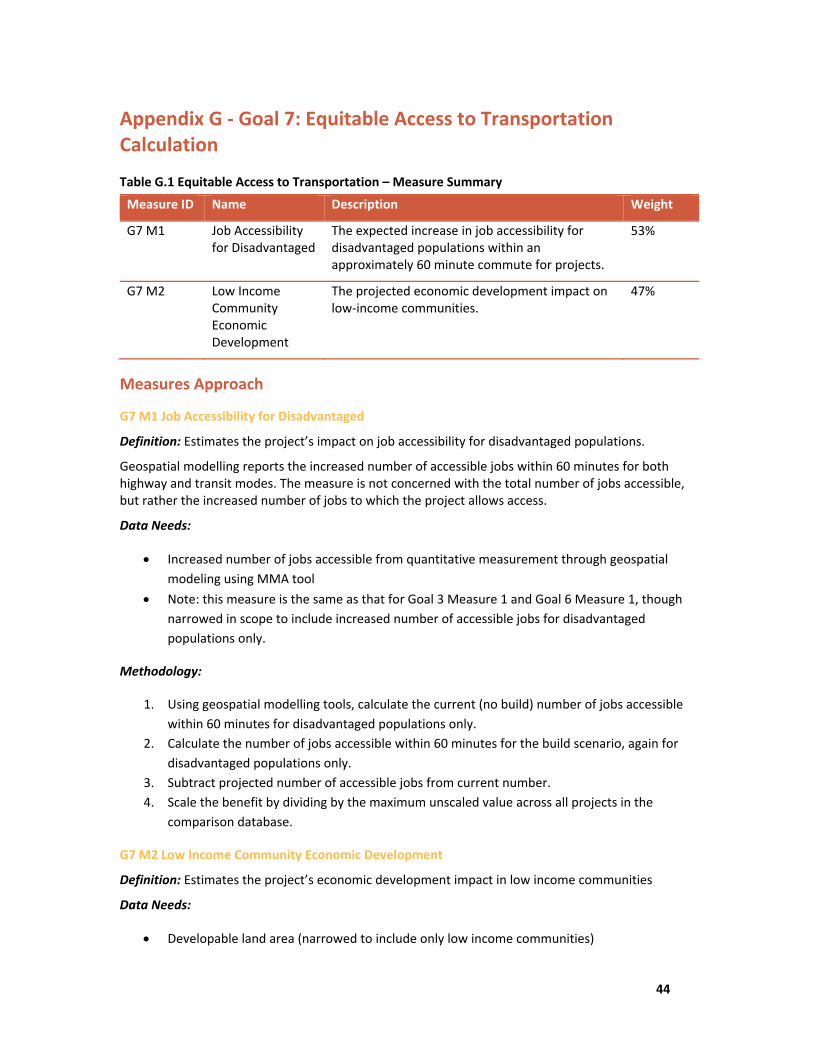
Guide 44
Appendix G ‐ Goal 7: Equitable Access to Transportation Calculation
Table G.1 Equitable Access to Transportation – Measure Summary
Measure ID Name Description Weight
G7 M1 Job Accessibility for Disadvantaged
The expected increase in job accessibility for disadvantaged populations within an approximately 60 minute commute for projects.
53%
G7 M2 Low Income Community Economic Development
The projected economic development impact on low‐income communities.
47%
Measures Approach
G7 M1 Job Accessibility for Disadvantaged
Definition: Estimates the project’s impact on job accessibility for disadvantaged populations.
Geospatial modelling reports the increased number of accessible jobs within 60 minutes for both highway and transit modes. The measure is not concerned with the total number of jobs accessible, but rather the increased number of jobs to which the project allows access.
Data Needs:
Increased number of jobs accessible from quantitative measurement through geospatial
modeling using MMA tool
Note: this measure is the same as that for Goal 3 Measure 1 and Goal 6 Measure 1, though
narrowed in scope to include increased number of accessible jobs for disadvantaged
populations only.
Methodology:
1. Using geospatial modelling tools, calculate the current (no build) number of jobs accessible
within 60 minutes for disadvantaged populations only.
2. Calculate the number of jobs accessible within 60 minutes for the build scenario, again for
disadvantaged populations only.
3. Subtract projected number of accessible jobs from current number.
4. Scale the benefit by dividing by the maximum unscaled value across all projects in the
comparison database.
G7 M2 Low Income Community Economic Development
Definition: Estimates the project’s economic development impact in low income communities
Data Needs:
Developable land area (narrowed to include only low income communities)
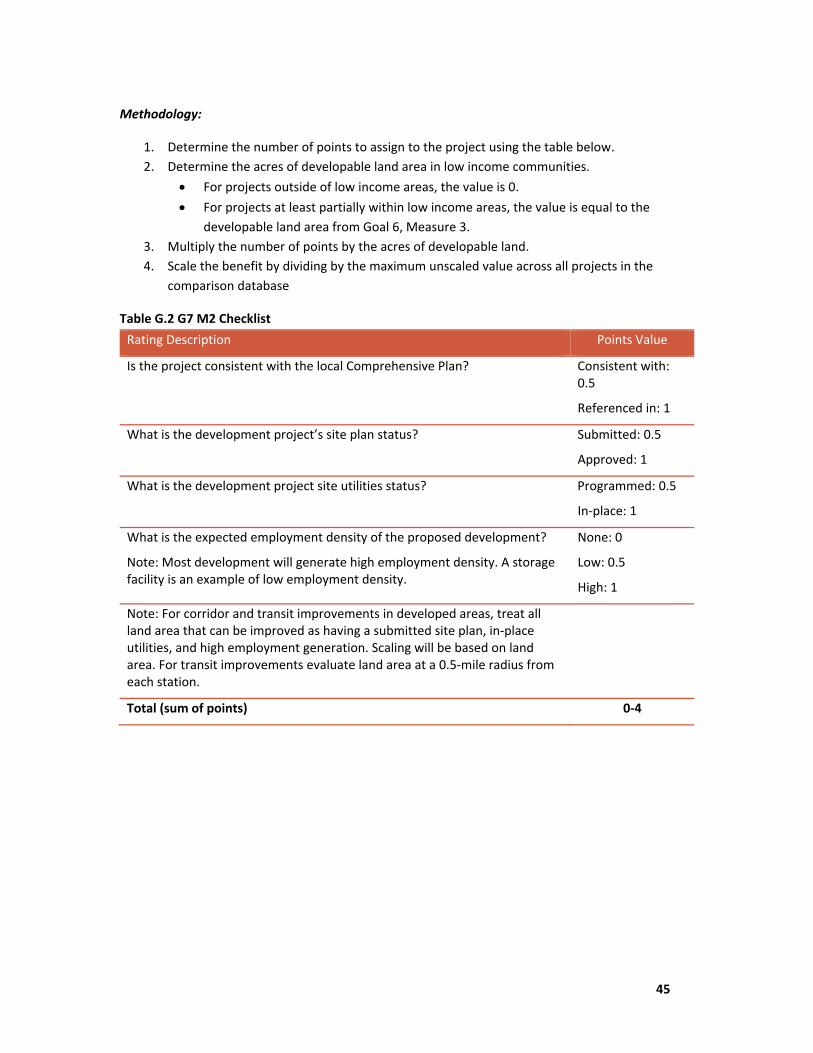
Guide 45
Methodology:
1. Determine the number of points to assign to the project using the table below.
2. Determine the acres of developable land area in low income communities.
For projects outside of low income areas, the value is 0.
For projects at least partially within low income areas, the value is equal to the
developable land area from Goal 6, Measure 3.
3. Multiply the number of points by the acres of developable land.
4. Scale the benefit by dividing by the maximum unscaled value across all projects in the
comparison database
Table G.2 G7 M2 Checklist
Rating Description Points Value
Is the project consistent with the local Comprehensive Plan? Consistent with: 0.5
Referenced in: 1
What is the development project’s site plan status? Submitted: 0.5
Approved: 1
What is the development project site utilities status? Programmed: 0.5
In‐place: 1
What is the expected employment density of the proposed development?
Note: Most development will generate high employment density. A storage facility is an example of low employment density.
None: 0
Low: 0.5
High: 1
Note: For corridor and transit improvements in developed areas, treat all land area that can be improved as having a submitted site plan, in‐place utilities, and high employment generation. Scaling will be based on land area. For transit improvements evaluate land area at a 0.5‐mile radius from each station.
Total (sum of points) 0‐4
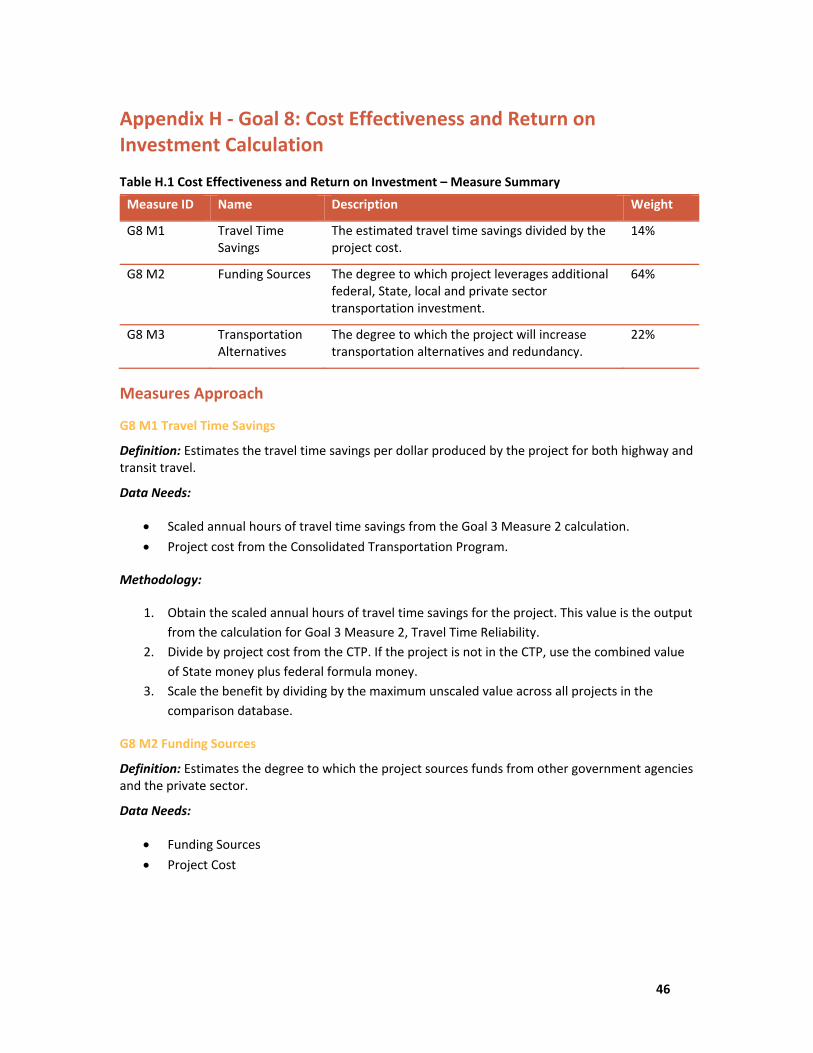
Guide 46
Appendix H ‐ Goal 8: Cost Effectiveness and Return on Investment Calculation
Table H.1 Cost Effectiveness and Return on Investment – Measure Summary
Measure ID Name Description Weight
G8 M1 Travel Time Savings
The estimated travel time savings divided by the project cost.
14%
G8 M2 Funding Sources The degree to which project leverages additional federal, State, local and private sector transportation investment.
64%
G8 M3 Transportation Alternatives
The degree to which the project will increase transportation alternatives and redundancy.
22%
Measures Approach
G8 M1 Travel Time Savings
Definition: Estimates the travel time savings per dollar produced by the project for both highway and transit travel.
Data Needs:
Scaled annual hours of travel time savings from the Goal 3 Measure 2 calculation.
Project cost from the Consolidated Transportation Program.
Methodology:
1. Obtain the scaled annual hours of travel time savings for the project. This value is the output
from the calculation for Goal 3 Measure 2, Travel Time Reliability.
2. Divide by project cost from the CTP. If the project is not in the CTP, use the combined value
of State money plus federal formula money.
3. Scale the benefit by dividing by the maximum unscaled value across all projects in the
comparison database.
G8 M2 Funding Sources
Definition: Estimates the degree to which the project sources funds from other government agencies and the private sector.
Data Needs:
Funding Sources
Project Cost
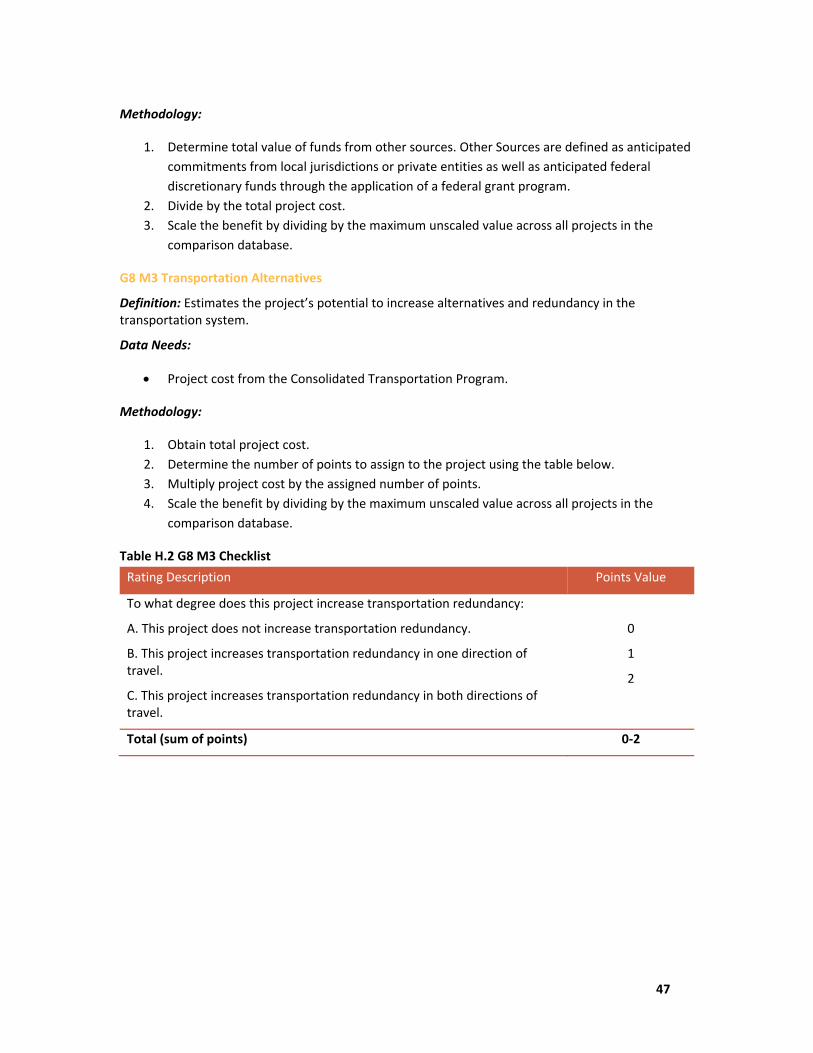
Guide 47
Methodology:
1. Determine total value of funds from other sources. Other Sources are defined as anticipated
commitments from local jurisdictions or private entities as well as anticipated federal
discretionary funds through the application of a federal grant program.
2. Divide by the total project cost.
3. Scale the benefit by dividing by the maximum unscaled value across all projects in the
comparison database.
G8 M3 Transportation Alternatives
Definition: Estimates the project’s potential to increase alternatives and redundancy in the transportation system.
Data Needs:
Project cost from the Consolidated Transportation Program.
Methodology:
1. Obtain total project cost.
2. Determine the number of points to assign to the project using the table below.
3. Multiply project cost by the assigned number of points.
4. Scale the benefit by dividing by the maximum unscaled value across all projects in the
comparison database.
Table H.2 G8 M3 Checklist
Rating Description Points Value
To what degree does this project increase transportation redundancy:
A. This project does not increase transportation redundancy.
B. This project increases transportation redundancy in one direction of travel.
C. This project increases transportation redundancy in both directions of travel.
0
1
2
Total (sum of points) 0‐2
Guide 48
Appendix I ‐ Goal 9: Local Priorities Calculation
Table I.1 Local Priorities – Measure Summary
Measure ID Name Description Weight
G9 M1 Local Priorities The degree to which the project supports local government transportation priorities, as specified in local government priority letters.
100%
Measure Approach
G9 M1 Local Priorities
Definition: Estimates the project’s alignment with local transportation priorities
Data Needs:
Project cost from the Consolidated Transportation Program.
Methodology:
1. Assign points to counties/municipalities to distribute and identify local priorities in their
jurisdictions.
2. Determine the number of points assigned to the project as detailed on the Project
Application.
3. Double the points assigned if the county and municipalities jointly support the project
through a joint letter of support.
4. Multiply the points assigned by a county by 0.75 if one municipality in the county has
submitted a separate set of priorities.
5. Multiply the points assigned by a county by 0.50 if more than one municipality in the county
has submitted a separate set of priorities.
6. Multiply the points assigned by a municipality by 0.25 if one or two municipalities in the
county have submitted a separate set of priorities.
7. Multiply the points assigned by a municipality by 0.50 divided by the number of
municipalities submitting priorities if more than two municipalities in the county have
submitted separate sets of priorities.
8. Sum points assigned to the project by all counties and municipalities
9. Multiply the project’s assigned point value by the total project cost.
10. Scale the benefit by dividing by the maximum unscaled value across all projects in the
comparison database.


![Malaysian Allied Health Profession Act 2016[2] Allied Health... · MALAYSIAN Eligibility: Basic Qualification Example: Diploma/Degree NON-MALAYSIAN Eligibility: Advanced Qualification](https://img.pdfslide.tips/doc/110x75/5f03a43a7e708231d40a0db5/malaysian-allied-health-profession-act-20162-allied-health-malaysian-eligibility.jpg)