Embed Size (px)
Citation preview

research methodology series
Characterizing Changing Classifications: Practical Illustrations of Latent Transition Analysis (LTA)
Ji Hoon Ryoo, Ph.D.
Chaorong Wu, M.A.
Carina McCormick, M.A.
Nebraska Center of Research on Children, Youth, Families
and Schools (CYFS)

Overview
• Introduction to Latent Transition Analysis (LTA)
– Classification of latent variable models
– LTA model
– Markov model as a special case of LTA model
• Model selection and parameter estimates in LTA
– Model selection
– Parameter estimates
– Statistical packages available
• Demonstration of LTA
– Exploration of change in psychological status
– Exploration of change in reading proficiency designation
• Discussion
– Summary
– Issues

Introduction to LTA - Classification of latent variable models
• In factor analysis, a covariance matrix is analyzed statistically in order
to shed light on the underlying latent structure
– For example, latent variable with three observed variables as
indicators
• When the type of latent variable is categorical, the latent variable
model is called latent class or latent profile model
• Their longitudinal version is called latent transition analysis (LTA)
model
Latent
Variable
x2 x1 x3
e1
Observed
variables
e2 e3

Introduction to LTA - Classification of latent variable models
• Both latent and observed variables can be either categorical or
continuous, which differentiates between latent variable models
(Collins & Lanza, 2011)
– It is often more difficult to determine whether the latent variable is
categorical or continuous, compared to indicators
– In practice, the applied researcher should consider whether a
continuous or categorical operationalization of the construct is
more relevant to the research questions at hand
Latent Variables
Indicators
Continuous Categorical
continuous Factor analysis
(FA)
Latent profile analysis
(LPA)
categorical Item response theory
(IRT)
Latent class analysis
(LCA)

Introduction to LTA - Classification of latent variable models
• Both latent and observed variables can be either categorical or
continuous, which differentiates between latent variable models
(Collins & Lanza, 2011)
• Latent class analysis (LCA) and its longitudinal version, latent
transition analysis (LTA), are today’s foci.
Latent Variables
Indicators
Continuous Categorical
continuous Factor analysis
(FA)
Latent profile analysis
(LPA)
categorical Item response theory
(IRT)
Latent class analysis
(LCA)

Introduction to LTA - Latent Transition Analysis (LTA)
• Latent class analysis (LCA)
– Classifying individuals into latent classes based on observed
categorical indicators
– Latent classes are mutually exclusive and exhaustive
– True class membership is unknown
• Outcomes of LCA
– Latent class membership probabilities – latent prevalence
– Item-response probabilities
Ind2
Ind1
Ind3
⁞
Indp
Latent class
variable with
m categories

• One of primary goal in longitudinal data analysis is to understand the change over time
• Modeling change over time
– For continuous latent variable
Change: Slope Latent growth model
– For categorical latent variable
Change: Movement between time points Latent transition
analysis
Note: Ps are transition probabilities, i.e., p12 is the probability of changing latent class 1 at Time t
to latent class 2 at Time (t+1)
Time (t+1)
LC1 LC2
Time t LC1 p11 p12
LC2 p21 p22
Introduction to LTA - Latent Transition Analysis (LTA)

Introduction to LTA - Latent transition analysis (LTA)
• Latent transition analysis (LTA)
– LTA is a longitudinal extension of latent class models and enables
the investigator to model a dynamic, or changing, latent variables
– Some development can be represented as movement among latent
class membership
– Different people may take different paths

• Outcomes of LTA
– Latent class membership probabilities – latent prevalence
– Item-response probabilities
– Transition matrix – Change of latent class membership over time
where the latent class variable has 𝑚 categories
Introduction to LTA - Latent transition analysis (LTA)
LCV1
Ind1 … Indp
LCV2
Ind1 … Indp
LCV3
Ind1 … Indp
…
Transition matrix
Item-response probability
Latent prevalence

Introduction to LTA - Markov model as a special case of LTA model
• A special case of Latent Transition Model
– One item at each time point only
– The item is categorical
• Data
– Many individuals are measured repeatedly at a limited number of
occasions (one measure at each occasion)
(Time Series Analysis: A few individuals are measured repeatedly at
many occasions)

Introduction to LTA - Markov model as a special case of LTA model
• Manifest (Simple) Markov model
– Measurement is assumed to be perfect
– Example, “Do you have a job right now (Y/N)?”
– May be realistic for some types of variables (e.g. disease, employment
status) but unlikely to describe educational assessment results
Prevalence
Transition
Matrix

Introduction to LTA - Markov model as a special case of LTA model
• Latent Markov Model
– Measurement is not perfect
– For example, “Do the students meet the reading proficiency standard?”
– Parameters consist of three components
Transition
Matrix
Item-Response
Probability
Latent
prevalence

Model selection and parameter estimates in LTA - Model selection
• Estimation methods
– Expectation-maximization (EM) algorithm
• Full-Information Maximum Likelihood (FIML)
– Bayesian method
• Estimation of LTA is based on response patterns in the
contingency table based on the number of items
– Example: The case of 8 dichotomized items over 3 time points
provides a contingency table consisting of 16,777,216 cells
𝑊 = 28 3 = 16,777,216

Model selection and parameter estimates in LTA - Model selection
• Contingency table at Time 1
Response
pattern
Item 1 Item 2 Item3 Item 4 Item 5 Item 6 Item 7 Item 8
Pattern 1 No No No No No No No No
Pattern 2 No No No No No No No Yes
Pattern 3 No No No No No No Yes No
Pattern 4 No No No No No No Yes Yes
Pattern 5 No No No No No Yes No No
Pattern 6 No No No No No Yes No Yes
Pattern 7 No No No No No Yes Yes No
Pattern 8 No No No No No Yes Yes Yes
⁞
Pattern 253 Yes Yes Yes Yes Yes Yes No No
Pattern 254 Yes Yes Yes Yes Yes Yes No Yes
Pattern 255 Yes Yes Yes Yes Yes Yes Yes No
Pattern 256 Yes Yes Yes Yes Yes Yes Yes Yes

Model selection and parameter estimates in LTA - Model selection
• Contingency table at Time 1 and Time 2
Response
pattern
Item 1 Item 2 Item3 Item 4 Item 5 Item 6 Item 7 Item 8
Pattern 1 No No No No No No No No
Pattern 2 No No No No No No No Yes
Pattern 3 No No No No No No Yes No
Pattern 4 No No No No No No Yes Yes
Pattern 5 No No No No No Yes No No
Pattern 6 No No No No No Yes No Yes
Pattern 7 No No No No No Yes Yes No
Pattern 8 No No No No No Yes Yes Yes
⁞
Pattern 253 Yes Yes Yes Yes Yes Yes No No
Pattern 254 Yes Yes Yes Yes Yes Yes No Yes
Pattern 255 Yes Yes Yes Yes Yes Yes Yes No
Pattern 256 Yes Yes Yes Yes Yes Yes Yes Yes

Model selection and parameter estimates in LTA - Model selection
• Contingency table at Time 1, Time 2, and Time 3
Response
pattern
Item 1 Item 2 Item3 Item 4 Item 5 Item 6 Item 7 Item 8
Pattern 1 No No No No No No No No
Pattern 2 No No No No No No No Yes
Pattern 3 No No No No No No Yes No
Pattern 4 No No No No No No Yes Yes
Pattern 5 No No No No No Yes No No
Pattern 6 No No No No No Yes No Yes
Pattern 7 No No No No No Yes Yes No
Pattern 8 No No No No No Yes Yes Yes
⁞
Pattern 253 Yes Yes Yes Yes Yes Yes No No
Pattern 254 Yes Yes Yes Yes Yes Yes No Yes
Pattern 255 Yes Yes Yes Yes Yes Yes Yes No
Pattern 256 Yes Yes Yes Yes Yes Yes Yes Yes

Model selection and parameter estimates in LTA - Model selection
• Model fit to select the number of latent classes
– Likelihood ratio statistics (𝐺2; Agresti, 1990)
• Reflects how well a latent class/transition model fits observed
data
– The null hypothesis is that the model test is adequate
– A p-value for the 𝐺2 can be obtained by comparing the 𝐺2
test statistics to the reference chi-square distribution
– 𝑑𝑓=𝑊−𝑃−1
– Information criteria: smaller is better
• 𝐴𝐼𝐶 = 𝐺2 + 2𝑃
• 𝐵𝐼𝐶 = 𝐺2 + log 𝑁 𝑃
• Where P is a number of parameters and N is a sample size
Model selection and parameter estimates in LTA - Parameters in LTA
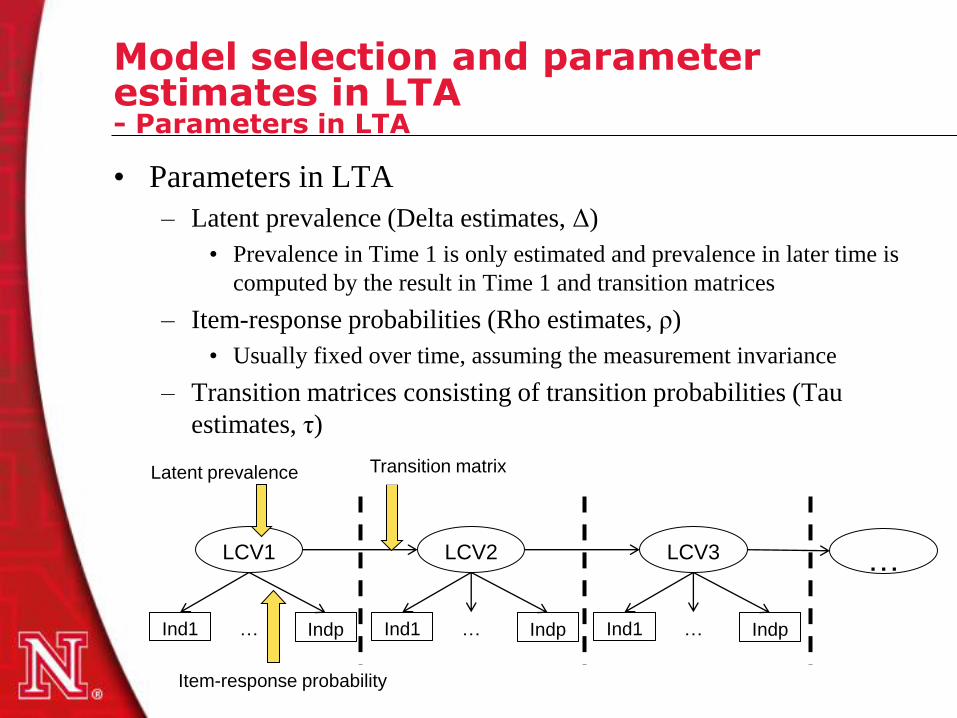
• Parameters in LTA
– Latent prevalence (Delta estimates, Δ)
• Prevalence in Time 1 is only estimated and prevalence in later time is
computed by the result in Time 1 and transition matrices
– Item-response probabilities (Rho estimates, ρ)
• Usually fixed over time, assuming the measurement invariance
– Transition matrices consisting of transition probabilities (Tau
estimates, τ)
LCV1
Ind1 … Indp
LCV2
Ind1 … Indp
LCV3
Ind1 … Indp
…
Transition matrix
Item-response probability
Latent prevalence

Model selection and parameter estimates in LTA - Statistical packages available
• SAS Proc LTA* (http://methodology.psu.edu/)
• Free software
– lEM (http://spitswww.uvt.nl/~vermunt/)
– WinLTA (http://methodology.psu.edu/)
– R packages (https://www.msu.edu/~chunghw/downloads.html)
• CAT_LVM
• CAT_LVM_BAYESIAN
• Commercial software packages
– Mplus* (http://www.statmodel.com/)
– Latent Gold (http://www.statisticalinnovations.com/)
Note: (*) indicates statistical packages used in this study
Demonstration of LTA
• Example 1: Exploration of change in psychological status
(Self-esteem) using Latent Transition Analysis
This photo was captured from Google image at 3/28/2012

Demonstration of LTA - Exploration of change in psychological status
• Data
– Pacific-Rim Bullying measure (PRBm; Konishi et al., 2009)
• Administered in School Experiences across Cultures: An International
Study
– General self-esteem from Self-description Questionnaire-I (SDQ-I;
Marsh, 1988)
• Eight items with 4 Likert type response
• Original Likert type items were transformed by dichotomizing the
responses (yes or no) because of distribution problem and missing
data
– Participants were 1180 students
• From 5th to 9th grade at the fall of 2005 attending nine schools
• Due to students’ transitions, the number of schools increased to 22
over three semesters
• 1173 at fall of 2005; 1114 at spring of 2006; 999 at fall of 2006
Demonstration of LTA - Exploration of change in psychological status
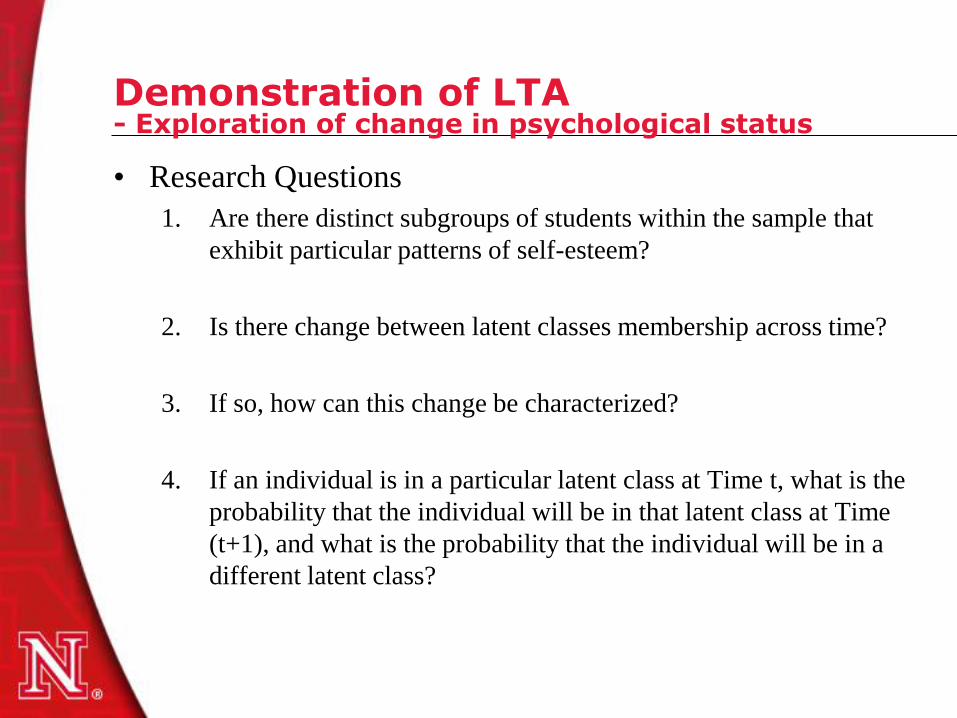
• Research Questions
1. Are there distinct subgroups of students within the sample that
exhibit particular patterns of self-esteem?
2. Is there change between latent classes membership across time?
3. If so, how can this change be characterized?
4. If an individual is in a particular latent class at Time t, what is the
probability that the individual will be in that latent class at Time
(t+1), and what is the probability that the individual will be in a
different latent class?

Demonstration of LTA - Exploration of change in psychological status
• Marginal Response Proportions
Item Time 1 (Fall, 2005) Time 2 (Spring, 2006) Time 3 (Fall, 2006)
Obs. Yes Obs. N Yes Obs. N Yes
I do lots of important
things 1172 0.869 1112 0.881 996 0.875
In general, I l ike being the
way I am 1172 0.923 1112 0.929 995 0.935
Overall, I have a lot to be
proud of 1169 0.915 1110 0.825 994 0.927
I can do things as well as
most other people 1171 0.917 1112 0.915 994 0.931
Other people think I am a
good person 1169 0.944 1109 0.949 995 0.956
A lot of things about me
are good 1171 0.942 1109 0.944 995 0.946
I am as good as most
other people 1170 0.927 1109 0.913 993 0.929
When I do something, I do
it well 1171 0.924 1113 0.936 996 0.945

Demonstration of LTA - Exploration of change in psychological status
• LTA was conducted by SAS Proc LTA and its syntax is given below:
PROC LTA data=gss10;
Title ‘General Self esteem in PRBm with 3 times, 3 statues';
NSTATUS 3;
NTIMES 3;
ITEMS pr4t1 pr5t1 pr6t1 pr7t1 pr8t1 pr9t1 pr10t1 pr11t1
pr4t2 pr5t2 pr6t2 pr7t2 pr8t2 pr9t2 pr10t2 pr11t2
pr4t3 pr5t3 pr6t3 pr7t3 pr8t3 pr9t3 pr10t3 pr11t3;
CATEGORIES 2 2 2 2 2 2 2 2;
measurement times;
seed 741620;
Run;
Need to specify the number of latent
classes and time points

Demonstration of LTA - Exploration of change in psychological status
• LTA was conducted by SAS Proc LTA and its syntax is given below:
PROC LTA data=gss10;
Title ‘General Self esteem in PRBm with 3 times, 3 statues';
NSTATUS 3;
NTIMES 3;
ITEMS pr4t1 pr5t1 pr6t1 pr7t1 pr8t1 pr9t1 pr10t1 pr11t1
pr4t2 pr5t2 pr6t2 pr7t2 pr8t2 pr9t2 pr10t2 pr11t2
pr4t3 pr5t3 pr6t3 pr7t3 pr8t3 pr9t3 pr10t3 pr11t3;
CATEGORIES 2 2 2 2 2 2 2 2;
measurement times;
seed 741620;
Run;
Data format as
subject by variables

Demonstration of LTA - Exploration of change in psychological status
• LTA was conducted by SAS Proc LTA and its syntax is given below:
PROC LTA data=gss10;
Title ‘General Self esteem in PRBm with 3 times, 3 statues';
NSTATUS 3;
NTIMES 3;
ITEMS pr4t1 pr5t1 pr6t1 pr7t1 pr8t1 pr9t1 pr10t1 pr11t1
pr4t2 pr5t2 pr6t2 pr7t2 pr8t2 pr9t2 pr10t2 pr11t2
pr4t3 pr5t3 pr6t3 pr7t3 pr8t3 pr9t3 pr10t3 pr11t3;
CATEGORIES 2 2 2 2 2 2 2 2;
measurement times;
seed 741620;
Run;
Number of response
categories

Demonstration of LTA - Exploration of change in psychological status
• LTA was conducted by SAS Proc LTA and its syntax is given below:
PROC LTA data=gss10;
Title ‘General Self esteem in PRBm with 3 times, 3 statues';
NSTATUS 3;
NTIMES 3;
ITEMS pr4t1 pr5t1 pr6t1 pr7t1 pr8t1 pr9t1 pr10t1 pr11t1
pr4t2 pr5t2 pr6t2 pr7t2 pr8t2 pr9t2 pr10t2 pr11t2
pr4t3 pr5t3 pr6t3 pr7t3 pr8t3 pr9t3 pr10t3 pr11t3;
CATEGORIES 2 2 2 2 2 2 2 2;
measurement times;
seed 741620;
Run;
Fixing item-response
probabilities across
time points

Demonstration of LTA - Exploration of change in psychological status
• Result of LTA on General Self-esteem with # = 2 to 6
– Since df is too big, it is not suggested to use 𝐺2statistics
– AIC result indicates that five latent class model is adequate while
BIC result indicates that three latent class model is adequate
G^2* df AIC BIC Log-likelighood
2 3677.89 16777194 3719.89 3826.43 -5420.31
3 3366.72 16777177 3442.72 3635.51 -5264.73
4 3285.81 16777156 3403.81 3703.13 -5224.27
5 3213.79 16777131 3381.79 3807.94 5188.26
6 3162.63 16777102 3388.63 3961.9 -5162.68
Model fitNumber of
Latent Statues

Demonstration of LTA - Exploration of change in psychological status
• Result of LTA on General Self-esteem over different latent
statues from 2 to 6
• Latent transition model with three latent statues was
selected.

Demonstration of LTA - Exploration of change in psychological status
• Latent class prevalence over three time points
Latent class prevalence
Time Latent class 1 Latent class 2 Latent class3
Fall, 2005 3.7% 19.5% 76.9%
Spring, 2006 3.5% 19.5% 77.0%
Fall, 2006 3.9% 14.8% 81.4%
LC 1
(3.7%)
LC 2
(19.5%)
LC 3
(76.9%) LC 3
(77.0%)
LC 1
(3.5%)
LC 2
(19.5%)
Time 2 Time 1 Time 3
LC 1
(3.9%)
LC 2
(14.8%)
LC 3
(81.4%)

Demonstration of LTA - Exploration of change in psychological status
• Item-response probabilities for yes
– Latent class 3 – High Self-esteem (HSE)
– Latent class 2 – Positive Self-esteem (PSE)
– Latent class 1 – Low Self-esteem (LSE)
Item Latent
class 1
Latent
class 2
Latent
class3
I do lots of important things 29.6% 66.2% 94.9%
In general, I like being the way I am 30.0% 78.9% 98.9%
Overall, I have a lot to be proud of 16.3% 76.4% 99.0%
I can do things as well as most other people 38.6% 70.7% 99.3%
Other people think I am a good person 43.7% 83.9% 99.7%
A lot of things about me are good 13.1% 85.9% 100%
I am as good as most other people 23.4% 74.7% 99.4%
When I do something, I do it well 33.1% 79.0% 99.4%

Demonstration of LTA - Exploration of change in psychological status
• Latent transition matrix from fall of 2005 to spring of 2006
Transition probabilities
Time 1\Time 2 LSE PSE HSE
LSE 43.87% 43.86% 12.3%
PSE 6.3% 68.9% 24.8%
HSE 0.8% 5.8% 93.4%
LSE
(3.7%)
PSE
(19.5%)
HSE
(76.9%) HSE
(77.0%)
LSE
(3.5%)
PSE
(19.5%)
Time 2 Time 1 Time 3
LSE
(3.9%)
PSE
(14.8%)
HSE
(81.4%)
< 20%
20% < 40%
40% < *

Demonstration of LTA - Exploration of change in psychological status
• Latent transition matrix from spring of 2006 to fall of 2006
Transition probabilities
Time 2\Time 3 LSE PSE HSE
LSE 43.6% 44.0% 12.4%
PSE 8.3% 50.4% 41.3%
HSE 0.9% 4.5% 94.6%
LSE
(3.7%)
PSE
(19.5%)
HSE
(76.9%) HSE
(77.0%)
LSE
(3.5%)
PSE
(19.5%)
Time 2 Time 1 Time 3
LSE
(3.9%)
PSE
(14.8%)
HSE
(81.4%)
< 20%
20% < 40%
40% < *

Demonstration of LTA - Exploration of change in psychological status
• Discussion 1: Based on the numbers of students changing latent
class membership over time
• Many students fluctuate between PSE and HSE.
– For example, 52 and 57 student move from HSE to PSE and from PSE to
HSE, respectively, at 1st transition. 38 and 90 students move from HSE to
PSE and from PSE to HSE, respectively, at 2nd transition.
• LSE group has high mobility rate to PSE and HSE
LSE
(3.7%)
PSE
(19.5%)
HSE
(76.9%) HSE
(77.0%)
LSE
(3.5%)
PSE
(19.5%)
Time 2 Time 1 Time 3
LSE
(3.9%)
PSE
(14.8%)
HSE
(81.4%)

Demonstration of LTA - Exploration of change in psychological status
• Discussion 2: In some situations, transitions to LSE from higher
SE level might be interested
– 14 and 8 students from PSE and HSE, respectively at 1st transition
– 18 and 8 students from PSE and HSE, respectively at 2nd transition
• It might be helpful to understand these movements if we further
investigate students’ characteristics
LSE
(3.7%)
PSE
(19.5%)
HSE
(76.9%) HSE
(77.0%)
LSE
(3.5%)
PSE
(19.5%)
Time 2 Time 1 Time 3
LSE
(3.9%)
PSE
(14.8%)
HSE
(81.4%)

Demonstration of LTA
• Example 2: Exploration of change in reading proficiency
designation (DIBELS) using Markov Model
This photo was captured from Google image at 3/28/2012

Demonstration of LTA - Exploration of change in reading proficiency designation
• Measures of DIBELS Oral Reading Fluency
• Four time points
• 2 categories at each occasion:
– High Risk (Category 1), Low Risk (Category 2)
• Research Question:
– How do students progress in oral reading fluency over time?
– Or how do they change at Risk status?

Demonstration of LTA - Exploration of change in reading proficiency designation
• Inspection of the data
– Change from time 1 to time 2
– We could check from time 2 to time 3, and from time 3 to time
4, too.
Time 2
High Low
Time 1
High 155 35
Low 11 148

Demonstration of LTA - Exploration of change in reading proficiency designation
• All the patterns
time 1 time 2 time 3 time 4 Frequency
High High High High 141
High High High Low 5
High High Low High 6
High High Low Low 3
High Low High High 7
High Low High Low 5
High Low Low High 14
High Low Low Low 9
Low High High High 6
Low High Low High 1
Low High Low Low 4
Low Low High High 6
Low Low High Low 5
Low Low Low High 13
Low Low Low Low 124

Demonstration of LTA - Exploration of change in reading proficiency designation
• Two models are fitted for illustration purpose
– Model 1: Manifest Markov Model
– Model 2: Latent Markov Model
– We could fit more models…

• Model 1: Manifest Markov Model
– There is no measurement error, or the measure is perfect
– Stationary, this is not necessary
Demonstration of LTA - Exploration of change in reading proficiency designation

• Results
• Model 1: Manifest Markov Model-Transition matrix
C2
High Low
C1 High 86.8% 13.2%
Low 12.1% 87.9%
Transition Matrix
Demonstration of LTA - Exploration of change in reading proficiency designation

• Results
• Model 1: Manifest Markov Model--prevalence
u1
High 45.6%
Low 54.4%
prevalence
Demonstration of LTA - Exploration of change in reading proficiency designation

Demonstration of LTA - Exploration of change in reading proficiency designation
• Model 2: Latent Markov model
– Measure is not perfect
– The transition matrixes are fixed to be equal across time points;
– The item-response probabilities are fixed to be equal at different time
points, too.
– It is not necessary to do so though.

• Results
– Model 2: Latent Markov Model
Demonstration of LTA - Exploration of change in reading proficiency designation
Item-Response probabilities
U1
High Low
C1 1 96.4% 3.6%
2 8.7% 91.3%

• Results
– Model 2: Latent Markov Model
C2
High Low
C1 High 97% 3%
Low 2% 98%
Transition Matrix
Demonstration of LTA - Exploration of change in reading proficiency designation

• Results
– Model 2: Latent Markov Model
c1
High 51.2%
Low 48.8% Latent prevalence
Demonstration of LTA - Exploration of change in reading proficiency designation
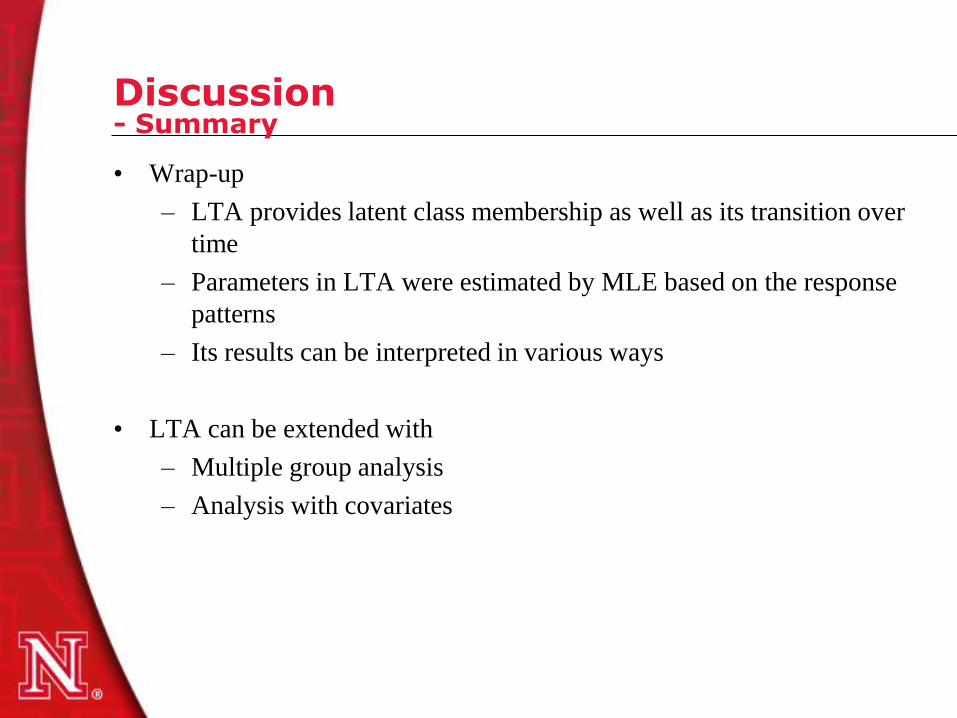
Discussion - Summary
• Wrap-up
– LTA provides latent class membership as well as its transition over
time
– Parameters in LTA were estimated by MLE based on the response
patterns
– Its results can be interpreted in various ways
• LTA can be extended with
– Multiple group analysis
– Analysis with covariates

Discussion - Issues
• Issues in LTA
– Weak in or lack of model comparison tools
– Sample size (the larger, the better)
• N=349 for LTA Oral reading proficiency data
• N=469 for LCA
• N=1,180 for LTA Self-esteem data
• N=1,265 for LTA
• N=2,061 for LTA
• N=2,065 for LCA
• N=2,087 for LCA
• N=2,937 for LTA
• N=13,840 for LCA

References 1. Agresti, A. (1990). Categorical data analysis. Wiley, NY.
2. Collins, L. M. & Lanza, S. T. (2010). Latent class and latent transition analysis with applications in the social,
behavioral, and health sciences. John Wiley & Sons, Inc., Hoboken, NJ.
3. Kaplan, D. (2008). An overview of Markov chain methods for the study of stage-sequential developmental
processes. Developmental Psychology, 44 (2), 457-467.
4. Konishi, C., Hymel, S., Zumbo, B.D., Li, Z., Taki, M., Slee, P., Pepler, D., Sim, H., Craig, W., Swearer, S., and
Kwak, K. (2009). Investigating the comparability of a self-report measure of childhood bullying across countries.
Canadian Journal of School Psychology, 24, 82-93.
5. Langeheine, R., & Van de Pol, F. (2002). Latent markov chains. In J. A. Hagenaars & A. L. McCutcheon (Eds.),
Applied latent class analysis (pp. 304{341). New York: Cambridge University Press.
6. Marsh, H. W. (1988). Self Description Questionnaire: A threoretical and empirical basis for the measurement of
multiple dimensions of preadolescent self-concept: A test manual and a research monograph. Psychological
Corporation, San Antonia, Texas.
7. Mooijaart, A. (1998). Log-linear and Markov modeling of categorical longitudinal data. In C. C. J. H. Bijleveld &
L. J. T. Van der Kamp (Eds.), Longitudinal data analysis: Designs, models, and methods (pp. 318{370). Newbury
Park, CA: Sage.
8. Mooijaart, A., & van Montfort, K. (2007). Latent markov models for categorical variables and time-dependent
covariates. In K. van Montfort, J. Oud, & A. Satorra (Eds.), Longitudinal models in the behavioral and related
sciences (pp. 1{17). Mahwah, NJ: Lawrence Erlbaum.
9. PROC LCA & PROC LTA (Version 1.2.7) [Software]. (2011). University Park: The Methodology Center, Penn
State. Retrieved from http://methodology.psu.edu
10. Van de Pol, F., & de Leeuw, J. (1986). A latent markov model to correct for measurement error. Sociological
Methods and Research, 15, 118-141.

research methodology series Thank you! For more information, please contact:
Ji Hoon Ryoo ([email protected])
Chaorong Wu ([email protected])
Carina McCormick ([email protected])
Syntaxes are available at
http://quantitativemethods.wordpress.com