Embed Size (px)
Citation preview
KTH Tal, musik och hörsel
Articulatory Analysis of Swedish Visemes
Charlotta Engström
Handledare: Björn Granström
Godkänt den ........................ Examinator: ............................................ (underskrift)
Examensarbete i Talkommunikation Institutionen för tal, musik och hörsel Kungliga Tekniska Högskolan 100 44 Stockholm
TTCentrum för talteknologi
Stockholm September
2003

2
KTH Tal, musik
och hörsel
Examensarbete i Talkommunikation Artikulatorisk analys av svenska visem Charlotta Engström
Godkänt År, mån, dag
Examinator Handledare Björn Granström Björn Granström
Sammanfattning Denna rapport beskriver en artikulatorisk analys av svenska visem, utförd inom ramen för Synface-projektet. Syftet med undersökningen var att kartlägga eventuella synliga skillnader i artikulation mellan fonem tillhörande samma visemgrupp. I samband med detta gjordes även en koartikulationsstudie av fonemen samt en jämförelse av de svenska och engelska fonem som transkriberas med samma fonetiska symbol. Merparten av Synface-visemen stöddes av materialet, men några synliga artikulatoriska och koartikulatoriska skillnader hittades inom visemen. Även några synliga olikheter mellan de undersökta svenska och engelska fonemen upptäcktes.
3
KTH Speech, music and hearing
Master Degree Project in Speech Communication Articulatory Analysis of Swedish Visemes Charlotta Engström
Approved Year, month, day
Examiner Supervisor Björn Granström Björn Granström
Abstract This paper describes an articulatory analysis of Swedish visemes, which has been carried out within the Synface project. The purpose of the study was to map out possible visible articulatory differences between phonemes belonging to the same viseme group. In connection with this, a coarticulation study of the phonemes was carried out and a comparison of Swedish and English phonemes sharing the same phonetic transcription was made. Most of the Synface visemes were supported by the data, but some visible articulatory and coarticulatory dissimilarities within viseme groups were found. A few articulatory differences between the Swedish and English phonemes which are transcribed with the same phonetic symbol were also discovered.
4
CONTENTS
CONTENTS.............................................................................................................................4
1. INTRODUCTION..................................................................................................................5
1.1 PURPOSE..............................................................................................................................................5 1.2 OUTLINE OF THE THESIS..................................................................................................................6
2. BACKGROUND ....................................................................................................................7
2.1 SYNFACE .............................................................................................................................................7 2.2 SPEECHREADING ...............................................................................................................................8 2.3 VISEMES ..............................................................................................................................................9 2.4 COARTICULATION............................................................................................................................14
3. DATA................................................................................................................................ 16
3.1 DATA COLLECTION.........................................................................................................................16 3.2 SPEAKER AND TEXT MATERIAL ....................................................................................................18 3.3 DATA PROCESSING..........................................................................................................................18 3.4 LIMITATIONS ON DATA ..................................................................................................................19
4. METHODOLOGY............................................................................................................... 21
4.1 THE ANALYSIS TOOLS ....................................................................................................................21 4.2 THE ANALYSIS..................................................................................................................................23 4.3 TESTING DATA ACCURACY............................................................................................................25
5. RESULTS...........................................................................................................................26
5.1 VISEME RESULTS..............................................................................................................................27 5.2 ARTICULATION AND COARTICULATION RESULTS ......................................................................38 5.3 NEW VISEMES ..................................................................................................................................43 5.4 COMPARING THE DATABASES .......................................................................................................44 5.5 COMPARING ENGLISH AND SWEDISH PHONEMES .....................................................................45
6. DISCUSSION......................................................................................................................49
7. CONCLUSIONS..................................................................................................................52
7.1 FUTURE WORK AND RECOMMENDATIONS FOR SYNFACE ........................................................52
8. ACKNOWLEDGEMENTS.....................................................................................................53
9. REFERENCES....................................................................................................................54
APPENDIX A.........................................................................................................................57
5
1. INTRODUCTION
It is widely known that people suffering from a severe hearing loss depend on their speechreading ability in verbal communication. Speechreading is however a difficult task, since many speech-sounds either look alike or are only partly visible. Still, these cues are essential to the understanding of speech for many people. Even normal hearing persons depend on them in noisy situations. Phonemes which look similar when seeing the face during articulation can be grouped together into so called visemes. Speechreaders frequently confuse phonemes within a viseme group, but this rarely happens to phonemes belonging to different visemes. For a hearing-impaired person, seeing the face of the speaker considerably enhances the intelligibility. Not only real faces, but also synthetic ones, are a great help in increasing the intelligibility of natural speech when the signal-to-noise ratio is low (Beskow et al., 1997). This has been exploited in the Synface project, which aims to facilitate telephone communication for the hearing-impaired by providing a synthetic talking face which the user can speechread. The face is controlled by the incoming speech signal. The articulation of the face is based on 21 visemes for which parameter settings have been decided.
1.1 PURPOSE The aim of this study was to empirically analyse the visual aspect of the Swedish phonemes and their associated speech movements. The main purpose was to answer the following question:
- Are there any significant differences between the visible articulations of the phonemes in the viseme groups used in Synface?
In addition to this, a few other issues were considered:
- How are the different visemes affected by context? - Are phonemes belonging to the same viseme group affected in the
same way by different contexts? - Are there any differences in the articulation of the Swedish and
English phonemes which share the same phonetic transcription? The study was based on three articulation databases; the first two consisted of VCV- and CVC-utterances and sentences pronounced by a female Swedish speaker and the third consisted of Swedish and English VCV- and CVC-utterances produced by a bilingual male speaker.
6
This study makes use of databases which are recorded with different sets of equipment, but on the same test subject. This enables an investigation on how the equipment affects articulation.
1.2 OUTLINE OF THE THESIS The following chapter contains a description of the databases used and the way in which they were collected. Chapter 4 gives a description of the methodology used in the analysis. The results are presented in chapter 5 with a subsequent discussion of the findings in chapter 6. In the last chapter the main conclusions are highlighted and there are some suggestions for further research.
7
2. BACKGROUND
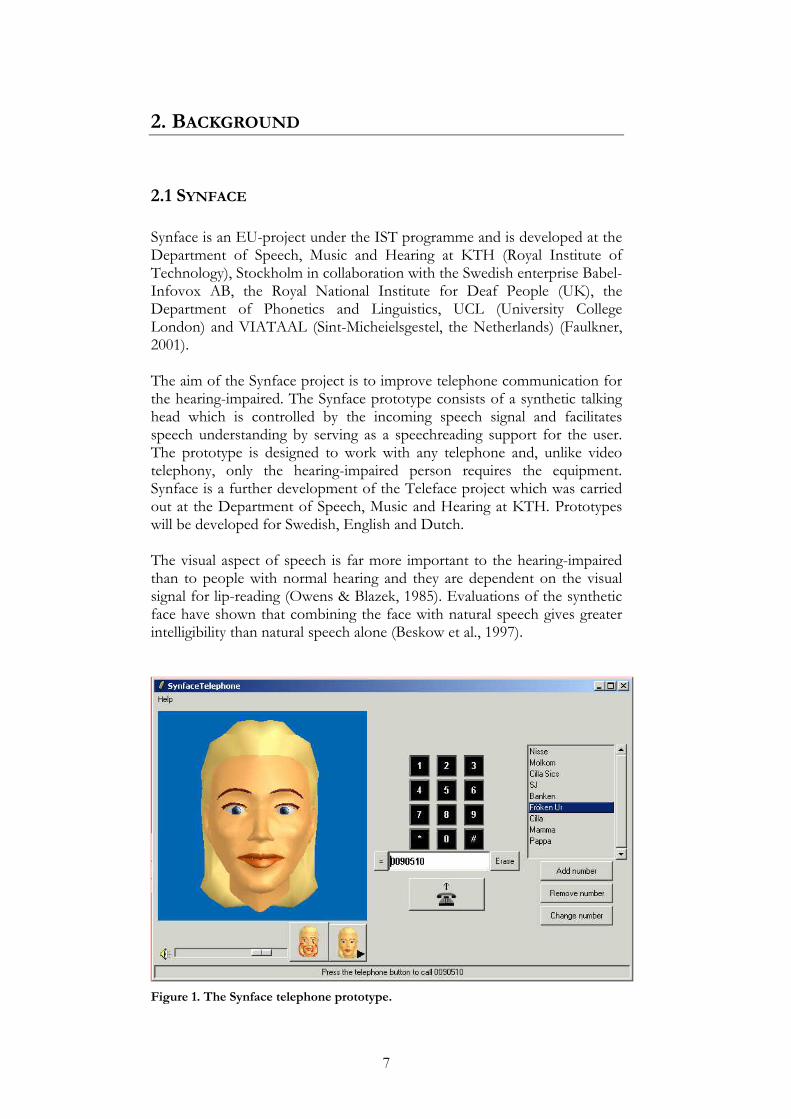
2.1 SYNFACE Synface is an EU-project under the IST programme and is developed at the Department of Speech, Music and Hearing at KTH (Royal Institute of Technology), Stockholm in collaboration with the Swedish enterprise Babel-Infovox AB, the Royal National Institute for Deaf People (UK), the Department of Phonetics and Linguistics, UCL (University College London) and VIATAAL (Sint-Micheielsgestel, the Netherlands) (Faulkner, 2001). The aim of the Synface project is to improve telephone communication for the hearing-impaired. The Synface prototype consists of a synthetic talking head which is controlled by the incoming speech signal and facilitates speech understanding by serving as a speechreading support for the user. The prototype is designed to work with any telephone and, unlike video telephony, only the hearing-impaired person requires the equipment. Synface is a further development of the Teleface project which was carried out at the Department of Speech, Music and Hearing at KTH. Prototypes will be developed for Swedish, English and Dutch. The visual aspect of speech is far more important to the hearing-impaired than to people with normal hearing and they are dependent on the visual signal for lip-reading (Owens & Blazek, 1985). Evaluations of the synthetic face have shown that combining the face with natural speech gives greater intelligibility than natural speech alone (Beskow et al., 1997).
Figure 1. The Synface telephone prototype.
8
2.2 SPEECHREADING
The term speechreading refers to speech perception by using a technique which is a combination of looking and listening (Jeffers and Barley, 1971). The speechreader listens to the message and simultaneously observes the speaker. The visual information supplements the distorted or insufficient acoustic signal. Previously the designation lipreading was used, but the term speechreading is considered more accurate since not only the lips, but movements in the whole face, as well as facial expressions, are used in perception (Risberg and Agelfors, 1978). As mentioned earlier, not only the hearing-impaired, but all people use speechreading. This is especially true when the acoustic conditions are inadequate. The more degraded the signal is (due to noise or a hearing impairment), the more people rely on the visual signal. Studies (Sumby-Pollack, 1954 and Binnie, Montgomery and Jackson, 1974) have demonstrated that adding visual information to an acoustic signal masked by e.g. noise, greatly improves speech perception for normal-hearing people. One study (O´Neill, 1954) showed that adding the visual information increases the intelligibility with 57% for consonants, 30% for vowels, 39% for monosyllabic words, and 17% for short phrases. Short stimuli are easier to speechread. The longer the stimulus is, the larger load it puts on the short term memory (Risberg and Agelfors, 1978). A study of hearing-impaired children (Erber, 1972) showed that only the place of articulation, and not the manner of articulation, could be obtained from the visual signal. It has also been shown (Greenberg and Bode, 1968) that speechreading performance is better when the whole face is seen, as opposed to only the lips. This means that other parts of the face give additional clues. Initial consonants are easier to speechread than final. Greenberg and Bode speculate that this could be due to that some people put extra effort in pronouncing the initial consonant, while others give the last equally much energy. It could also be that the listener is more focused and attentive in the beginning of an utterance. Mártony (Mártony, 1974) investigated the variation among speakers and speechreaders and found that there are in fact quite large differences in people’s ability to speechread and in how easy different speakers are to speechread. According to Mártony severely hard of hearing persons (80-90 dBm) tend to be better speechreaders than people with more or less hearing loss. In a consonant speechreading test (Mártony, 1974) three symmetric vowel contexts were used; /ɑ/, /i/ and /u/. The highest recognition score was received for /ɑ/-context and the lowest for /i/-context with the results for /u/-context in between. For the “good” speechreaders the vowel context difference was significant and while the other category exhibited the same tendency, their results were not as significant. It seems like the good speechreaders can make more use of the additional visual information given by the larger lip opening in /ɑ/.
9
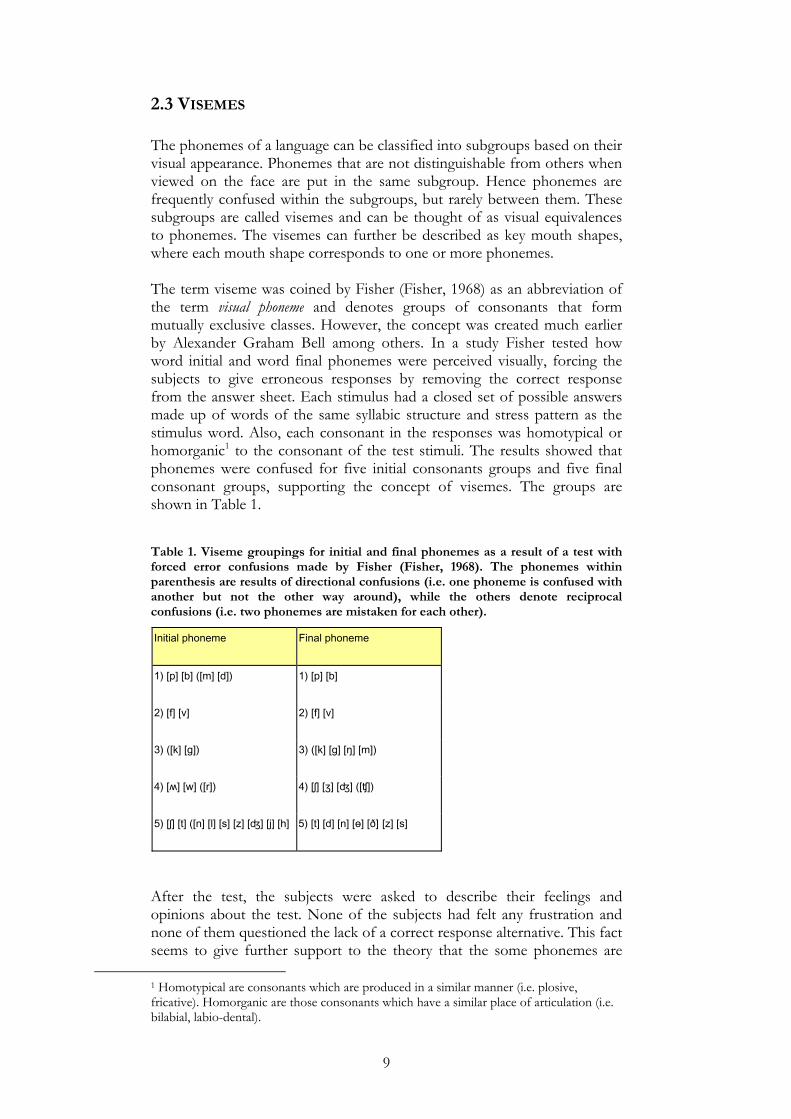
2.3 VISEMES The phonemes of a language can be classified into subgroups based on their visual appearance. Phonemes that are not distinguishable from others when viewed on the face are put in the same subgroup. Hence phonemes are frequently confused within the subgroups, but rarely between them. These subgroups are called visemes and can be thought of as visual equivalences to phonemes. The visemes can further be described as key mouth shapes, where each mouth shape corresponds to one or more phonemes. The term viseme was coined by Fisher (Fisher, 1968) as an abbreviation of the term visual phoneme and denotes groups of consonants that form mutually exclusive classes. However, the concept was created much earlier by Alexander Graham Bell among others. In a study Fisher tested how word initial and word final phonemes were perceived visually, forcing the subjects to give erroneous responses by removing the correct response from the answer sheet. Each stimulus had a closed set of possible answers made up of words of the same syllabic structure and stress pattern as the stimulus word. Also, each consonant in the responses was homotypical or homorganic1 to the consonant of the test stimuli. The results showed that phonemes were confused for five initial consonants groups and five final consonant groups, supporting the concept of visemes. The groups are shown in Table 1.
Table 1. Viseme groupings for initial and final phonemes as a result of a test with forced error confusions made by Fisher (Fisher, 1968). The phonemes within parenthesis are results of directional confusions (i.e. one phoneme is confused with another but not the other way around), while the others denote reciprocal confusions (i.e. two phonemes are mistaken for each other).
Initial phoneme Final phoneme
1) [p] [b] ([m] [d]) 1) [p] [b]
2) [f] [v] 2) [f] [v]
3) ([k] [g]) 3) ([k] [g] [ŋ] [m])
4) [ʍ] [w] ([r]) 4) [ʃ] [ʒ] [ʤ] ([ʧ])
5) [ʃ] [t] ([n] [l] [s] [z] [ʤ] [j] [h] 5) [t] [d] [n] [ɵ] [ð] [z] [s]
After the test, the subjects were asked to describe their feelings and opinions about the test. None of the subjects had felt any frustration and none of them questioned the lack of a correct response alternative. This fact seems to give further support to the theory that the some phonemes are
1 Homotypical are consonants which are produced in a similar manner (i.e. plosive, fricative). Homorganic are those consonants which have a similar place of articulation (i.e. bilabial, labio-dental).
10
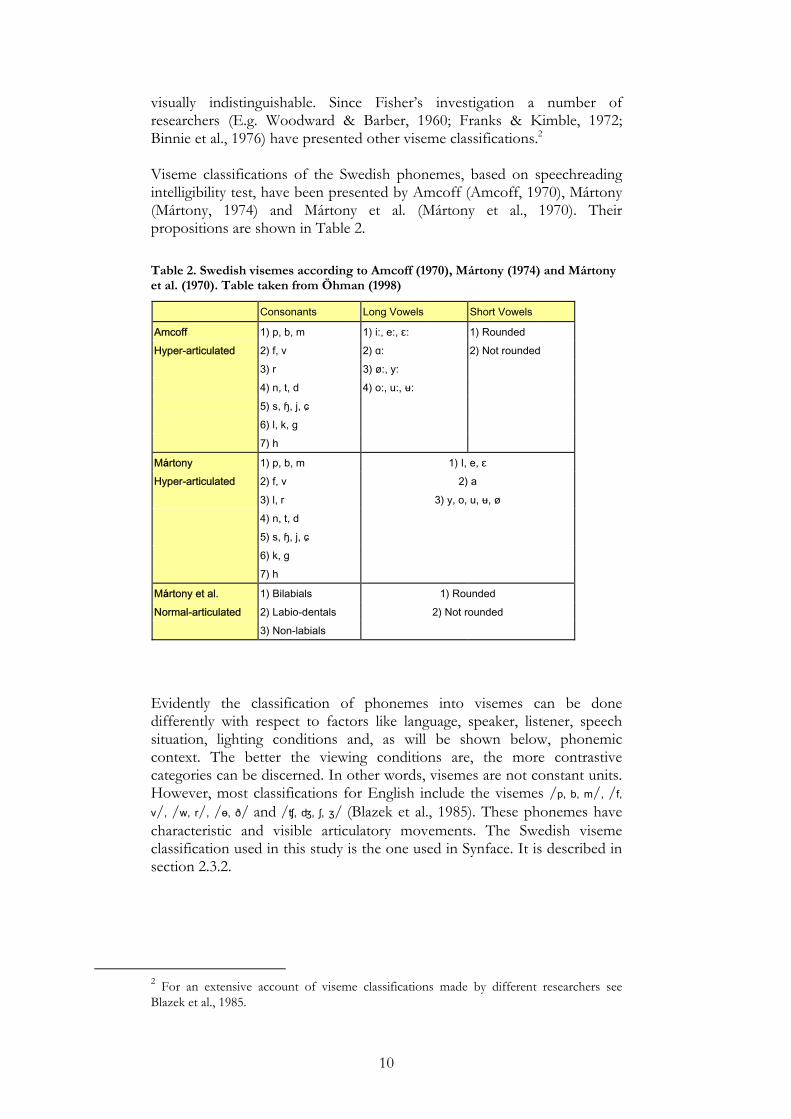
visually indistinguishable. Since Fisher’s investigation a number of researchers (E.g. Woodward & Barber, 1960; Franks & Kimble, 1972; Binnie et al., 1976) have presented other viseme classifications.2 Viseme classifications of the Swedish phonemes, based on speechreading intelligibility test, have been presented by Amcoff (Amcoff, 1970), Mártony (Mártony, 1974) and Mártony et al. (Mártony et al., 1970). Their propositions are shown in Table 2. Table 2. Swedish visemes according to Amcoff (1970), Mártony (1974) and Mártony et al. (1970). Table taken from Öhman (1998)
Consonants Long Vowels Short Vowels
Amcoff 1) p, b, m 1) i:, e:, ɛ: 1) Rounded
Hyper-articulated 2) f, v 2) ɑ: 2) Not rounded
3) r 3) ø:, y:
4) n, t, d 4) o:, u:, ʉ:
5) s, ɧ, j, ɕ
6) l, k, g
7) h
Mártony 1) p, b, m 1) I, e, ɛ
Hyper-articulated 2) f, v 2) a
3) l, r 3) y, o, u, ʉ, ø
4) n, t, d
5) s, ɧ, j, ɕ
6) k, g
7) h
Mártony et al. 1) Bilabials 1) Rounded
Normal-articulated 2) Labio-dentals 2) Not rounded
3) Non-labials
Evidently the classification of phonemes into visemes can be done differently with respect to factors like language, speaker, listener, speech situation, lighting conditions and, as will be shown below, phonemic context. The better the viewing conditions are, the more contrastive categories can be discerned. In other words, visemes are not constant units. However, most classifications for English include the visemes /p, b, m/, /f,
v/, /w, r/, /ɵ, ð/ and /ʧ, ʤ, ʃ, ʒ/ (Blazek et al., 1985). These phonemes have characteristic and visible articulatory movements. The Swedish viseme classification used in this study is the one used in Synface. It is described in section 2.3.2.
2 For an extensive account of viseme classifications made by different researchers see Blazek et al., 1985.
11
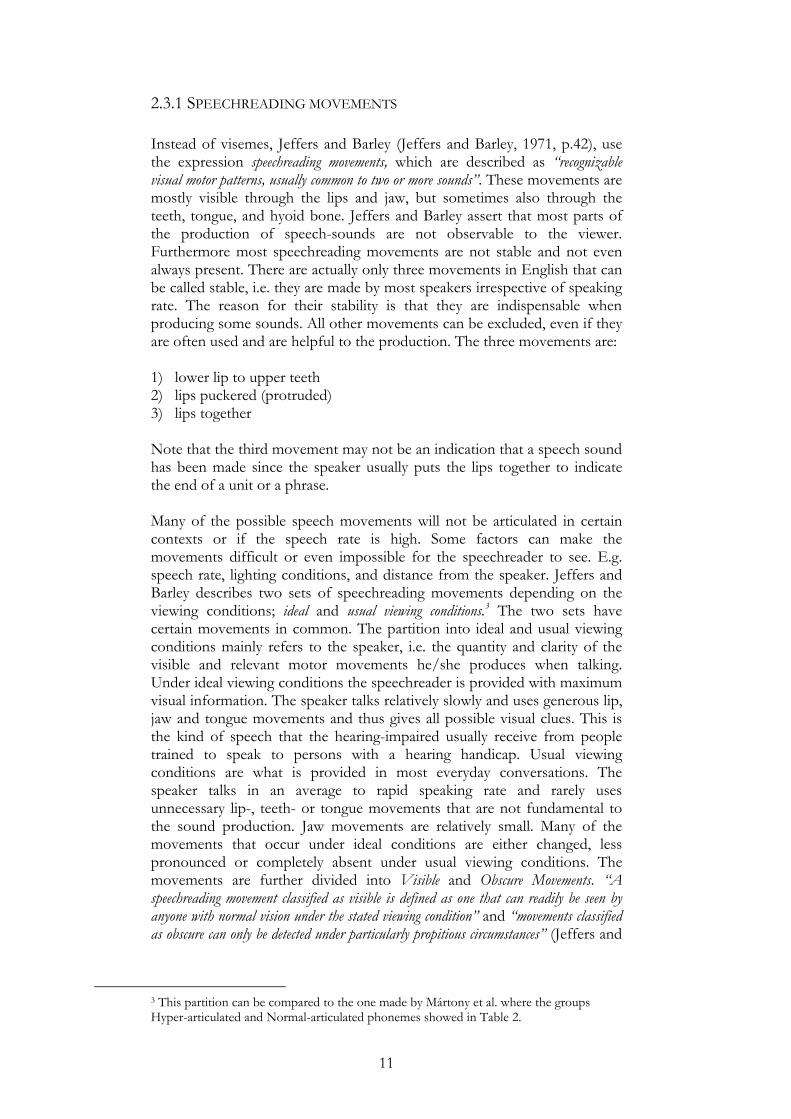
2.3.1 SPEECHREADING MOVEMENTS Instead of visemes, Jeffers and Barley (Jeffers and Barley, 1971, p.42), use the expression speechreading movements, which are described as “recognizable visual motor patterns, usually common to two or more sounds”. These movements are mostly visible through the lips and jaw, but sometimes also through the teeth, tongue, and hyoid bone. Jeffers and Barley assert that most parts of the production of speech-sounds are not observable to the viewer. Furthermore most speechreading movements are not stable and not even always present. There are actually only three movements in English that can be called stable, i.e. they are made by most speakers irrespective of speaking rate. The reason for their stability is that they are indispensable when producing some sounds. All other movements can be excluded, even if they are often used and are helpful to the production. The three movements are: 1) lower lip to upper teeth 2) lips puckered (protruded) 3) lips together Note that the third movement may not be an indication that a speech sound has been made since the speaker usually puts the lips together to indicate the end of a unit or a phrase. Many of the possible speech movements will not be articulated in certain contexts or if the speech rate is high. Some factors can make the movements difficult or even impossible for the speechreader to see. E.g. speech rate, lighting conditions, and distance from the speaker. Jeffers and Barley describes two sets of speechreading movements depending on the viewing conditions; ideal and usual viewing conditions.3 The two sets have certain movements in common. The partition into ideal and usual viewing conditions mainly refers to the speaker, i.e. the quantity and clarity of the visible and relevant motor movements he/she produces when talking. Under ideal viewing conditions the speechreader is provided with maximum visual information. The speaker talks relatively slowly and uses generous lip, jaw and tongue movements and thus gives all possible visual clues. This is the kind of speech that the hearing-impaired usually receive from people trained to speak to persons with a hearing handicap. Usual viewing conditions are what is provided in most everyday conversations. The speaker talks in an average to rapid speaking rate and rarely uses unnecessary lip-, teeth- or tongue movements that are not fundamental to the sound production. Jaw movements are relatively small. Many of the movements that occur under ideal conditions are either changed, less pronounced or completely absent under usual viewing conditions. The movements are further divided into Visible and Obscure Movements. “A speechreading movement classified as visible is defined as one that can readily be seen by anyone with normal vision under the stated viewing condition” and “movements classified as obscure can only be detected under particularly propitious circumstances” (Jeffers and
3 This partition can be compared to the one made by Mártony et al. where the groups Hyper-articulated and Normal-articulated phonemes showed in Table 2.
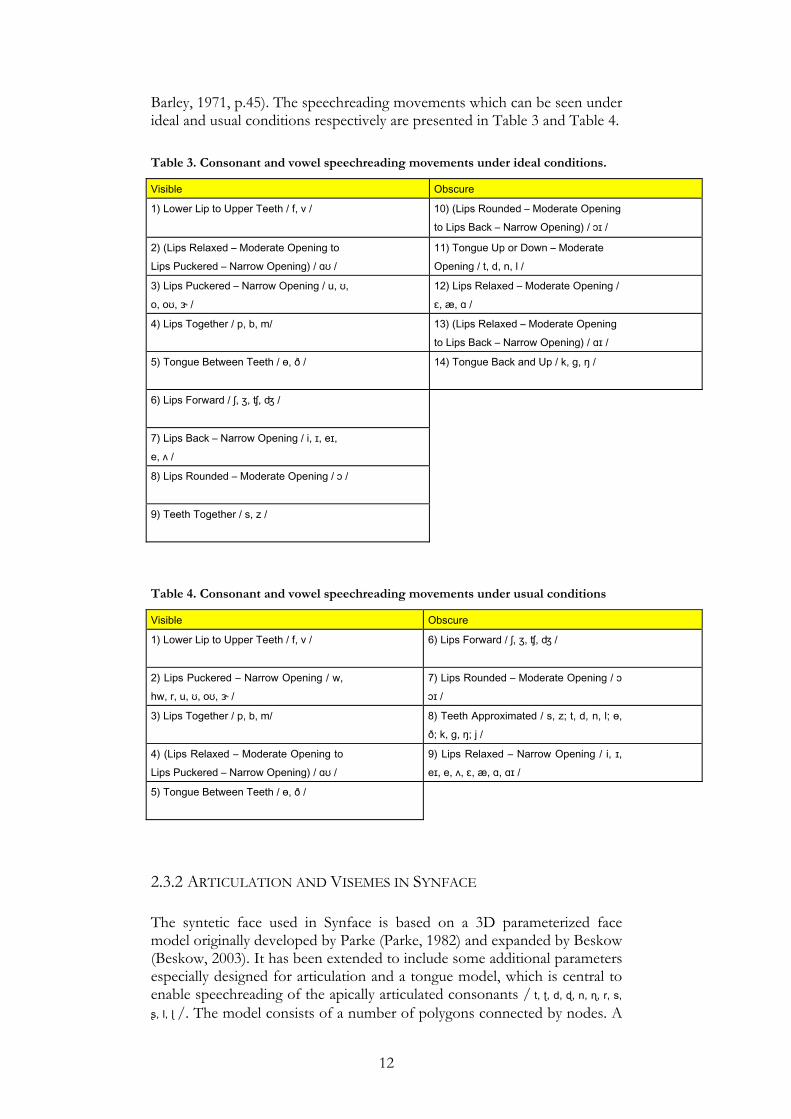
12
Barley, 1971, p.45). The speechreading movements which can be seen under ideal and usual conditions respectively are presented in Table 3 and Table 4. Table 3. Consonant and vowel speechreading movements under ideal conditions.
Visible Obscure
1) Lower Lip to Upper Teeth / f, v / 10) (Lips Rounded – Moderate Opening
to Lips Back – Narrow Opening) / ɔɪ /
2) (Lips Relaxed – Moderate Opening to
Lips Puckered – Narrow Opening) / ɑʊ /
11) Tongue Up or Down – Moderate
Opening / t, d, n, l /
3) Lips Puckered – Narrow Opening / u, ʊ,
o, oʊ, ɝ /
12) Lips Relaxed – Moderate Opening /
ɛ, æ, ɑ /
4) Lips Together / p, b, m/ 13) (Lips Relaxed – Moderate Opening
to Lips Back – Narrow Opening) / ɑɪ /
5) Tongue Between Teeth / ɵ, ð /
14) Tongue Back and Up / k, g, ŋ /
6) Lips Forward / ʃ, ʒ, ʧ, ʤ /
7) Lips Back – Narrow Opening / i, ɪ, eɪ,
e, ʌ /
8) Lips Rounded – Moderate Opening / ɔ /
9) Teeth Together / s, z /
Table 4. Consonant and vowel speechreading movements under usual conditions
Visible Obscure
1) Lower Lip to Upper Teeth / f, v /
6) Lips Forward / ʃ, ʒ, ʧ, ʤ /
2) Lips Puckered – Narrow Opening / w,
hw, r, u, ʊ, oʊ, ɝ /
7) Lips Rounded – Moderate Opening / ɔ
ɔɪ /
3) Lips Together / p, b, m/ 8) Teeth Approximated / s, z; t, d, n, l; ɵ,
ð; k, g, ŋ; j /
4) (Lips Relaxed – Moderate Opening to
Lips Puckered – Narrow Opening) / ɑʊ /
9) Lips Relaxed – Narrow Opening / i, ɪ,
eɪ, e, ʌ, ɛ, æ, ɑ, ɑɪ /
5) Tongue Between Teeth / ɵ, ð /
2.3.2 ARTICULATION AND VISEMES IN SYNFACE The syntetic face used in Synface is based on a 3D parameterized face model originally developed by Parke (Parke, 1982) and expanded by Beskow (Beskow, 2003). It has been extended to include some additional parameters especially designed for articulation and a tongue model, which is central to enable speechreading of the apically articulated consonants / t, ʈ, d, ɖ, n, ɳ, r, s,
ʂ, l, ɭ /. The model consists of a number of polygons connected by nodes. A
13
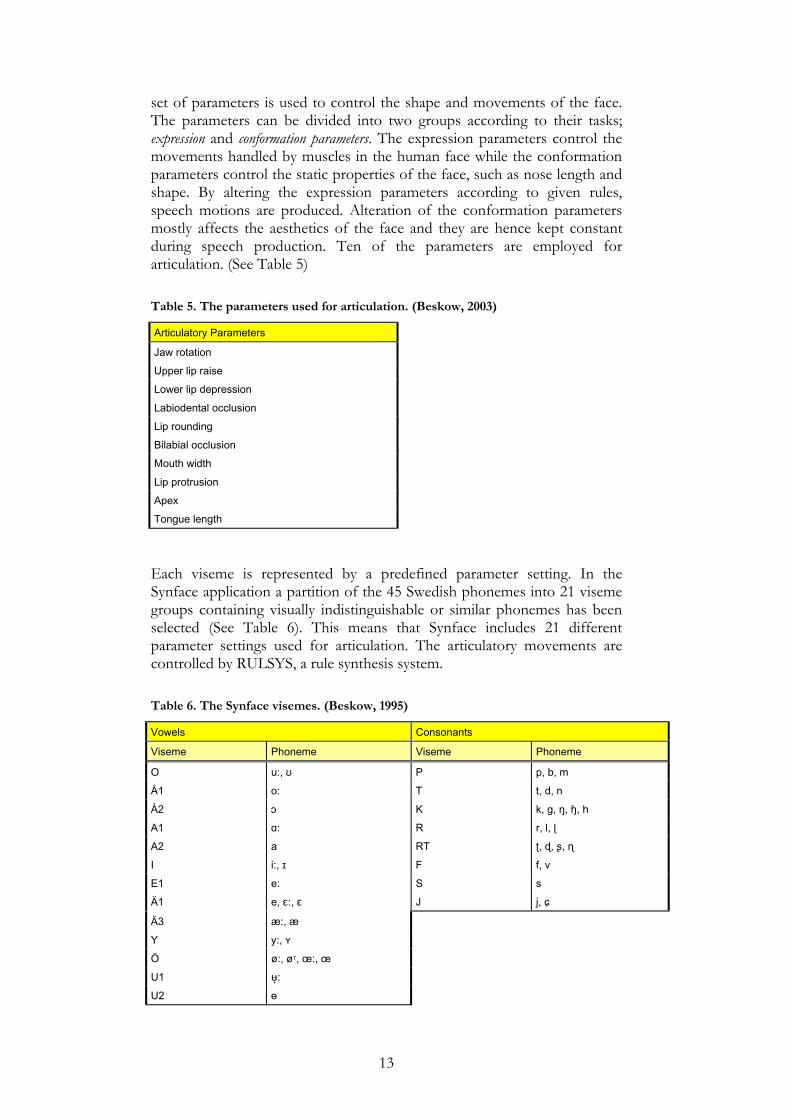
set of parameters is used to control the shape and movements of the face. The parameters can be divided into two groups according to their tasks; expression and conformation parameters. The expression parameters control the movements handled by muscles in the human face while the conformation parameters control the static properties of the face, such as nose length and shape. By altering the expression parameters according to given rules, speech motions are produced. Alteration of the conformation parameters mostly affects the aesthetics of the face and they are hence kept constant during speech production. Ten of the parameters are employed for articulation. (See Table 5) Table 5. The parameters used for articulation. (Beskow, 2003)
Articulatory Parameters
Jaw rotation
Upper lip raise
Lower lip depression
Labiodental occlusion
Lip rounding
Bilabial occlusion
Mouth width
Lip protrusion
Apex
Tongue length
Each viseme is represented by a predefined parameter setting. In the Synface application a partition of the 45 Swedish phonemes into 21 viseme groups containing visually indistinguishable or similar phonemes has been selected (See Table 6). This means that Synface includes 21 different parameter settings used for articulation. The articulatory movements are controlled by RULSYS, a rule synthesis system. Table 6. The Synface visemes. (Beskow, 1995)
Vowels Consonants
Viseme Phoneme Viseme Phoneme
O u:, ʊ P p, b, m
Å1 o: T t, d, n
Å2 ɔ K k, g, ŋ, ɧ, h
A1 ɑ: R r, l, ɭ
A2 a RT ʈ, ɖ, ʂ, ɳ
I i:, ɪ F f, v
E1 e: S s
Ä1 e, ɛ:, ɛ J j, ɕ
Ä3 æ:, æ
Y y:, ʏ
Ö ø:, øT, œ:, œ
U1 ʉ̟:
U2 ɵ
14
Apart from producing speech movements, the face has been programmed to occasionally blink and move the eyes and head in order to appear more natural and lively.
2.4 COARTICULATION Speech is not just a number of separate ordered segments in sequence, but a continuous process. The term coarticulation refers to the fact that during speech, phonetic segments overlap in time. The reason for this overlap is articulatory planning, the incapability of the vocal organs to immediately change positions and also the fact that people tend to economize the speech production. The speech organs continuously move from the position of one speech sound to the next, which results in that the vocal tract is influenced by more than one segment at all times (Elert, 1997). This implies that the realization of a phoneme depends on the surrounding segments. There are two forms of coarticulation; carry over (also referred to as backward) and anticipatory (also referred to as forward). In carry over coarticulation the articulation is affected by some previous segment and in anticipatory coarticulation a segment not yet pronounced is responsible for the influence. The results of coarticulation can for example be seen on the vowel formants which tend to bend towards a position characteristic of the preceding or following phoneme. Hence, the sounds not only have their own characteristics, but also bear traces from adjacent or close sounds. The phenomenon has been widely studied, mostly from an acoustical point of view, however there is of course a visual and articulatory side to it. Coarticulation has been observed in all phonetically analysed languages, thus it is considered a universal phenomenon (Farnetani, 1997). Each speech sound has an articulatory target, however because of coarticulation, the target is not always reached (Ladefoged, 1993). Like the differences between phonemes, the larger part of coarticulation is not visible since it takes place inside the mouth. Still there is important information that can be seen. It appears that different visemes are more or less likely to be changed in the presence of other visemes (Beskow, 1995). This is true for the acoustical as well as the visual aspect of speech. The movements which are essential to produce a sound are not likely to be changed while the less important movements are more inclined to be affected by surrounding sounds (Jeffers and Barley, 1971). Coarticulation makes the process of speaking more economic, since only the most significant targets are reached in normal speech. Apart from speaking style, the amount of coarticulation also depends on the distances between sounds (Ladefoged, 1993). The further apart two sounds are, the less they affect each other and if the sounds are separated by a word boundary, the amount of coarticulation is even smaller. Owens and Blazek (Owens & Blazek, 1985) have studied how four different vowel contexts affect the perception of consonants and viseme groupings. The vowel contexts were /ɑ/, /i/, /u/ and /ʌ/. They discovered that /u/-context had a great impact on the consonants and made them more difficult to speechread than consonants in other contexts. They propose different
15
viseme sets for different contexts. In their partition there are seven visemes for /ɑ/-context, six for /i/ and /ʌ/ respectively and only two groups for /u/-context. In /u/-context only the visemes including /p, b, m/ and /f, v/ were distinguishable.
2.4.1 COARTICULATION IN SYNFACE In Synface the concept of coarticulation has been solved by implementing a rule-based method (Beskow, 1995) in which each viseme is assigned a parameter setting. For every setting each parameter is either given a value or left undefined. In other words, only the key parameters for a viseme are specified while the remaining parameters are left unspecified. The unspecified parameters are free to be manipulated by adjacent segments, for which the parameters in question are specified. When each segment in a string has been given its parameter settings, undefined parameters are assigned values by interpolation between the nearest segments for which the parameter values are defined. This approach is a straightforward way to deal with forward4 as well as backward coarticulation. Beskow has also developed models for trainable articulatory control (Beskow, 1997), but this has not yet been implemented in Synface. The tested models are based either on coarticulation theory or on artificial neural networks.
4 Forward articulation is however a difficulty when this approach is used in the Synface application, since the face articulates in real time.
16
3. DATA
Three different databases were used in this study. All of them contain facial motion recorded with the Qualisys5 system for optical motion tracking. The data from the first was originally recorded for the purpose of improving the articulation of a talking head by means of resynthesis of facial and intraoral articulation measurements (Beskow et al., 2003). During the recording simultaneous measurements of vocal tract movements were made using electromagnetic articulography (EMA). The second database was recorded on the same occasion and with the same speaker as the first, but no EMA-measurements were made. The same speech material was used in the first two databases. The third database was recorded on a later occasion with a bilingual speaker. The speech material was in Swedish and English.
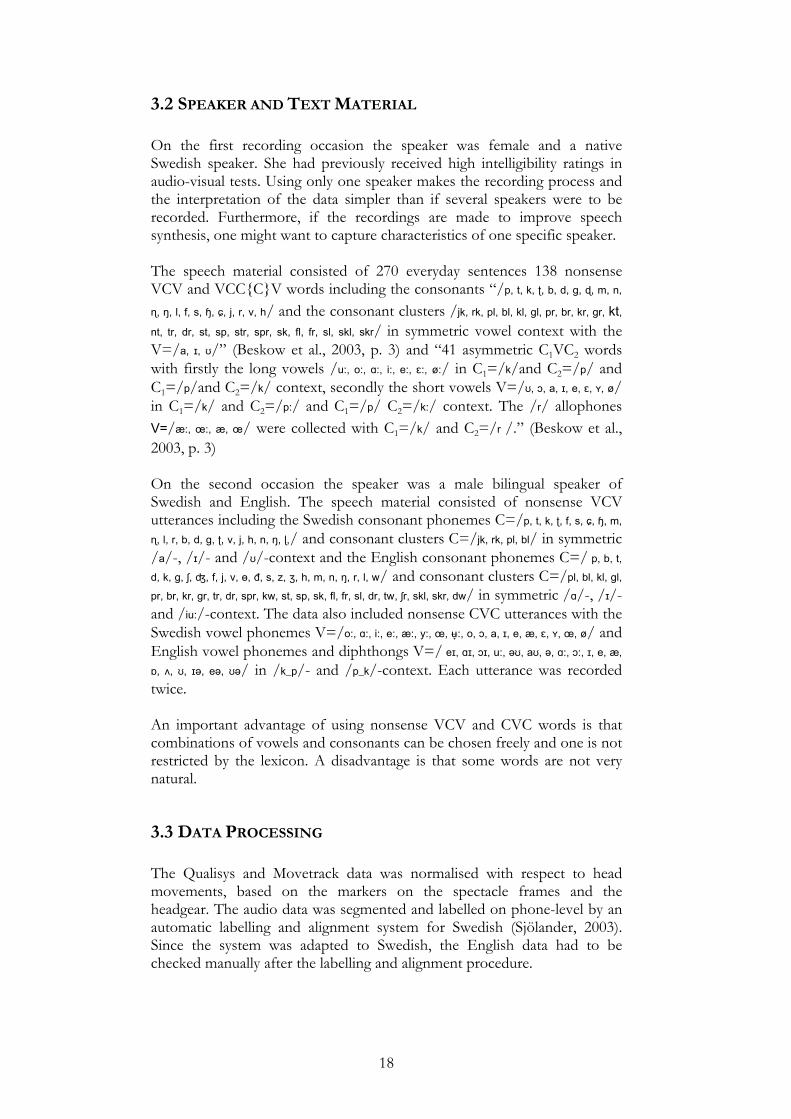
3.1 DATA COLLECTION There are two types of markers that can be used when recording facial movements; area markers and point markers (Öhman, 1998). The area markers are applied by painting areas on the subjects face and the point markers are applied by painting points or gluing small reflecting objects on the subject’s skin. The databases used in this study were recorded using reflecting point markers which were glued onto the face of the subject. This method enables retrieval of exact 3D-coordinates for the markers; however nothing else in the face can be measured. From an articulatory aspect it is preferable to get information on how points in the face are actually moving, rather than seeing the movements of larger areas where the coordinates of one particular point of the face cannot be obtained. The drawback of this method is that markers may temporally disappear, e. g. the markers on the lips may not be visible during a bilabial closure and the markers on the lower lip may be covered when the lips are protruded. For all databases, facial motion was recorded with the Qualisys system with four IR-cameras. The data consists of three separate recordings made on two different occasions. On the first occasion two recordings were made, but most markers were used in both recordings. In the first recording (which will be referred to as Movetrack, MT) 28 small reflectors were glued to different positions in the subjects face (jaw, cheeks, lips and nose). A headmount with reflectors was used to keep track of head movements and serve as reference for the other facial markers. The system then calculated the 3D-coordinates (Figure 2) for the 28 markers at a rate of 60 frames per second. The procedure was the same for the second recording (which will be referred to as spectacle frame, SF), except this time 4 more markers, placed on the eyebrows, were used and instead of the headgear, the subject was wearing a spectacle frame to which 5 markers were glued as reference markers. The marker positions for the MT and SF recordings are shown in Figure 3. The third recording (which will be referred to as SV_BR) was
5 http://qualisys.se
17
obtained in the same way, but this time a spectacle frame with 5 markers was used as reference and the subject had 30 markers glued to the face.
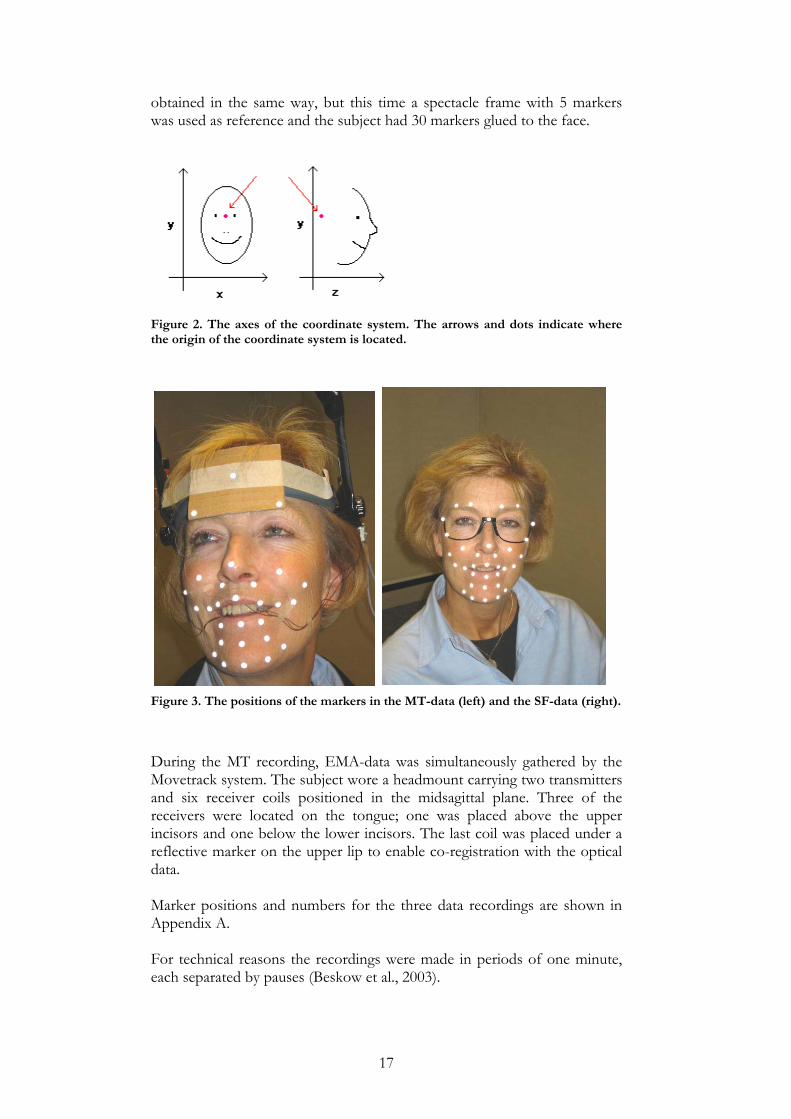
Figure 2. The axes of the coordinate system. The arrows and dots indicate where the origin of the coordinate system is located.
Figure 3. The positions of the markers in the MT-data (left) and the SF-data (right).
During the MT recording, EMA-data was simultaneously gathered by the Movetrack system. The subject wore a headmount carrying two transmitters and six receiver coils positioned in the midsagittal plane. Three of the receivers were located on the tongue; one was placed above the upper incisors and one below the lower incisors. The last coil was placed under a reflective marker on the upper lip to enable co-registration with the optical data. Marker positions and numbers for the three data recordings are shown in Appendix A. For technical reasons the recordings were made in periods of one minute, each separated by pauses (Beskow et al., 2003).
18
3.2 SPEAKER AND TEXT MATERIAL On the first recording occasion the speaker was female and a native Swedish speaker. She had previously received high intelligibility ratings in audio-visual tests. Using only one speaker makes the recording process and the interpretation of the data simpler than if several speakers were to be recorded. Furthermore, if the recordings are made to improve speech synthesis, one might want to capture characteristics of one specific speaker. The speech material consisted of 270 everyday sentences 138 nonsense VCV and VCC{C}V words including the consonants “/p, t, k, ʈ, b, d, g, ɖ, m, n,
ɳ, ŋ, l, f, s, ɧ, ɕ, j, r, v, h/ and the consonant clusters /jk, rk, pl, bl, kl, gl, pr, br, kr, gr, kt, nt, tr, dr, st, sp, str, spr, sk, fl, fr, sl, skl, skr/ in symmetric vowel context with the V=/a, ɪ, ʊ/” (Beskow et al., 2003, p. 3) and “41 asymmetric C1VC2 words with firstly the long vowels /u:, o:, ɑ:, i:, e:, ɛ:, ø:/ in C1=/k/and C2=/p/ and C1=/p/and C2=/k/ context, secondly the short vowels V=/ʊ, ɔ, a, ɪ, e, ɛ, ʏ, ø/ in C1=/k/ and C2=/p:/ and C1=/p/ C2=/k:/ context. The /r/ allophones V=/æ:, œ:, æ, œ/ were collected with C1=/k/ and C2=/r /.” (Beskow et al., 2003, p. 3) On the second occasion the speaker was a male bilingual speaker of Swedish and English. The speech material consisted of nonsense VCV utterances including the Swedish consonant phonemes C=/p, t, k, ʈ, f, s, ɕ, ɧ, m,
ɳ, l, r, b, d, g, ʈ, v, j, h, n, ŋ, ɭ,/ and consonant clusters C=/jk, rk, pl, bl/ in symmetric /a/-, /ɪ/- and /ʊ/-context and the English consonant phonemes C=/ p, b, t,
d, k, g, ʃ, ʤ, f, j, v, ɵ, đ, s, z, ʒ, h, m, n, ŋ, r, l, w/ and consonant clusters C=/pl, bl, kl, gl,
pr, br, kr, gr, tr, dr, spr, kw, st, sp, sk, fl, fr, sl, dr, tw, ʃr, skl, skr, dw/ in symmetric /ɑ/-, /ɪ/- and /iu:/-context. The data also included nonsense CVC utterances with the Swedish vowel phonemes V=/o:, ɑ:, i:, e:, æ:, y:, œ, ʉ̟:, o, ɔ, a, ɪ, e, æ, ɛ, ʏ, œ, ø/ and English vowel phonemes and diphthongs V=/ eɪ, ɑɪ, ɔɪ, u:, əʊ, aʊ, ə, ɑ:, ɔ:, ɪ, e, æ,
ɒ, ʌ, ʊ, ɪə, eə, ʊə/ in /k_p/- and /p_k/-context. Each utterance was recorded twice. An important advantage of using nonsense VCV and CVC words is that combinations of vowels and consonants can be chosen freely and one is not restricted by the lexicon. A disadvantage is that some words are not very natural.
3.3 DATA PROCESSING The Qualisys and Movetrack data was normalised with respect to head movements, based on the markers on the spectacle frames and the headgear. The audio data was segmented and labelled on phone-level by an automatic labelling and alignment system for Swedish (Sjölander, 2003). Since the system was adapted to Swedish, the English data had to be checked manually after the labelling and alignment procedure.
19
Due to time limitation, the sentence material and the nonsense words containing consonant clusters were not used in this study. In other words, from the MT and SF data only the VCV and CVC words containing one consonant phoneme in vowel context or one vowel phoneme in consonant context, were included in the study. In the bilingual articulation study, only the phonemes which share the same phonetic transcription in Swedish and English were used, i.e. /ɪ, e, æ, ʊ, i:, ɑ:, u:/ and /p, b, m, t, d, n, k, g, ŋ, h, f, v, r, l, s/ (Elert, 1997; Ladefoged, 1993).
Data files containing marker coordinates for the words and phonemes to be included in the study were produced. For example, for the utterance aga two files were created; one file containing the whole utterance ([aga]) and another only containing the medial [g]. The files were named according to their contents. This resulted in 97 files from the MT database (of which 36 were vowels and 61 were consonants), 105 files from the SF database (of which 42 were vowels and 63 were consonants) and 234 files from the SV_BR data (of which 44 were vowels and 190 were consonants).
3.4 LIMITATIONS ON DATA For some reason, a few of the words that should have been part of the database were missing. The absence of words including the retroflex lateral /ɭ/ is due to the fact that they were not pronounced as one retroflex segment, but more like two separate segments (/rl/ instead of /ɭ/). Since there is a lot of variation in the pronunciation of this sound in Swedish and the occurrences in this data were not considered to be very reliable, it was decided that the /ɭ/-phoneme would not be included in the study.
During the analysis step it turned out that some other utterances were not pronounced as intended. For example, the word isji was intended to be pronounced as [ɪɧɪ] but instead it was pronounced [ɪsjɪ] one time and [ɪskɪ] another. Mistakes like these were removed from the analysis. All utterances were listened to and when an utterance turned out to be mislabelled it was either removed or used as the utterance it was pronounced like.
In Swedish the sj-sound (e.g. in the word asja) can be pronounced in two ways; in the back (/ɧ/) or the front (/ʂ/) of the mouth. Different variants are used depending on dialect but also speaking style. The latter is often used in solemn speech and recitals (Elert, 1997). In the data, both variants were found, but it was decided that only /ɧ/ would be used as sj. When plotting the medial positions of the markers for all phonemes, it was discovered that in 9 of the CVC-data, the coordinates for markers 12 and 14 were switched. This defect was due to an error in the Qualisys tracking and was temporally solved by running the files in question through a MATLAB function that switched the two points.
20
In a few utterances, some markers were hidden by other markers or a protruded lower lip, which caused the Qualisys tracking to return false coordinates. These utterances were excluded from the analysis.
The distance between markers on the headgear and the marker on the upper incisor should be constant during articulation. This distance was measured for all utterances and the following was found. The standard deviation for the distance between MT-marker number 1 (on the headgear) and MT-marker number 29 (on the upper tooth) for all phonemes was about 0.7 mm and the difference between the shortest and longest distance was 2.5 mm6. Since both these markers should be fixed, it seemed possible that either the headgear or the tooth marker had moved during the recording. To see if that was the case, a time series of the distances was created by sorting all distances according to when they were recorded. No sudden or gradual change was observed in the series. The distances were sorted according to size to see if any tendency could be detected. It was found that the distances measured in /a_a/-context were generally the shortest, followed by /ɪ_ɪ/- and finally /ʊ_ʊ/-context. The distances measured in /k_p/- and /p_k/-contexts were spread across the whole continuum. The difference in distance was hence probably due to coarticulatory changes, and not to one of the markers changing places, since the recording order was the following; /k_p/, /p_k/, /a_a/, /ʊ_ʊ/ and finally /ɪ_ɪ/. Exactly what has caused these articulatory changes is hard to say, but it is likely that some kind of facial gestures has caused the headgear to move.
6 The average distance was 109.2 mm.
21
4. METHODOLOGY
The analysis and presentation tools were developed in MATLAB7.
4.1 THE ANALYSIS TOOLS When measuring distances between two markers from the same phoneme or between two markers from different phonemes, the Euclidian distance was used.
222, )()()( babababa zzyyxxD −+−+−=
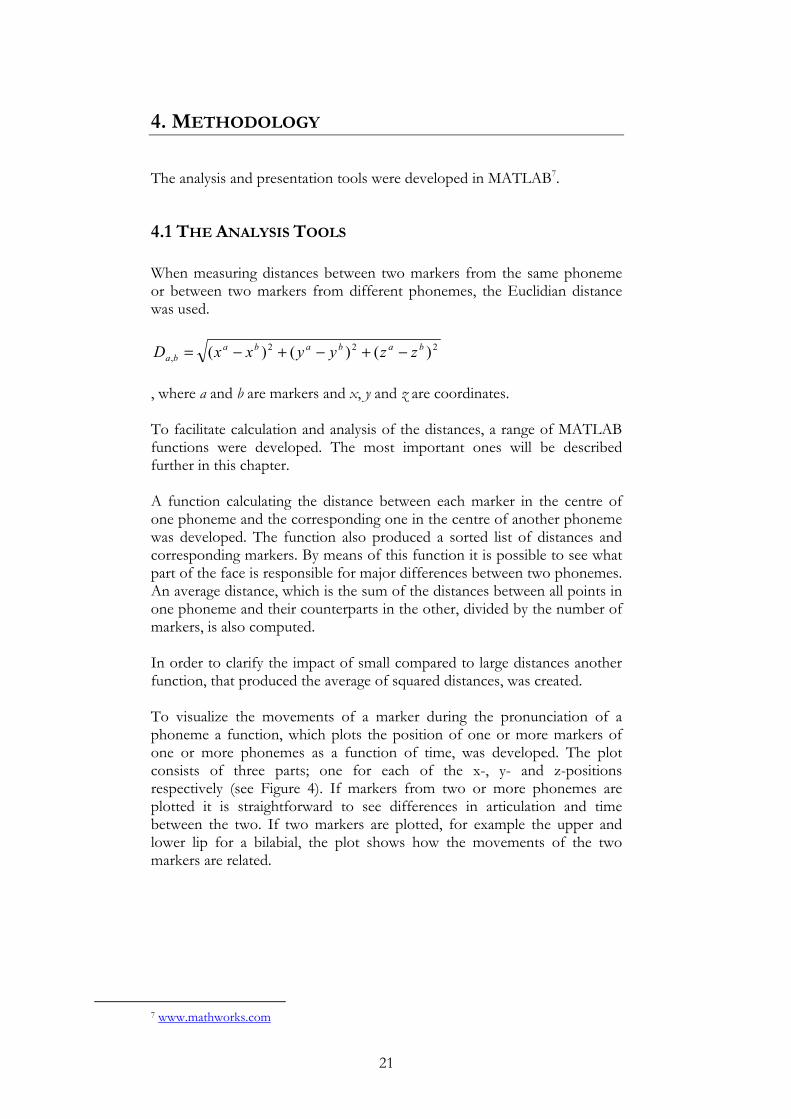
, where a and b are markers and x, y and z are coordinates. To facilitate calculation and analysis of the distances, a range of MATLAB functions were developed. The most important ones will be described further in this chapter. A function calculating the distance between each marker in the centre of one phoneme and the corresponding one in the centre of another phoneme was developed. The function also produced a sorted list of distances and corresponding markers. By means of this function it is possible to see what part of the face is responsible for major differences between two phonemes. An average distance, which is the sum of the distances between all points in one phoneme and their counterparts in the other, divided by the number of markers, is also computed. In order to clarify the impact of small compared to large distances another function, that produced the average of squared distances, was created. To visualize the movements of a marker during the pronunciation of a phoneme a function, which plots the position of one or more markers of one or more phonemes as a function of time, was developed. The plot consists of three parts; one for each of the x-, y- and z-positions respectively (see Figure 4). If markers from two or more phonemes are plotted it is straightforward to see differences in articulation and time between the two. If two markers are plotted, for example the upper and lower lip for a bilabial, the plot shows how the movements of the two markers are related.
7 www.mathworks.com
22
Figure 4. Time plot of markers 14 and 19 (upper and lower lip) for the utterance [aba]. (MT-data) Mind the different scales.
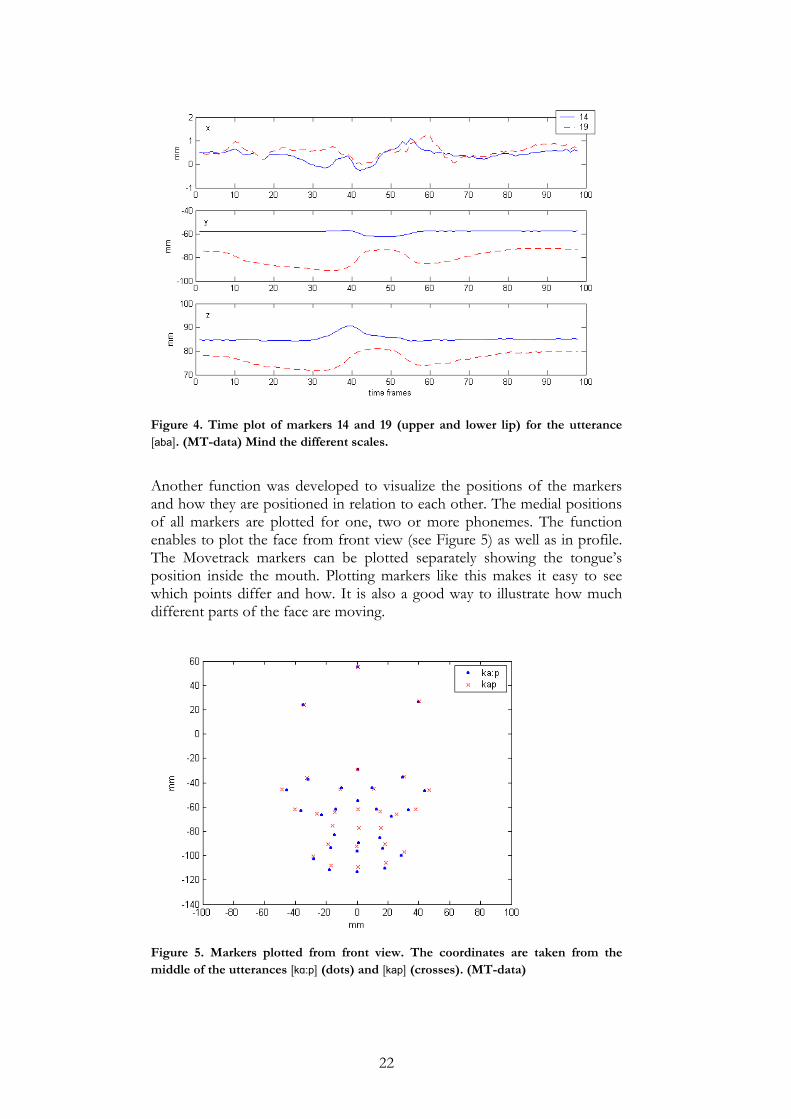
Another function was developed to visualize the positions of the markers and how they are positioned in relation to each other. The medial positions of all markers are plotted for one, two or more phonemes. The function enables to plot the face from front view (see Figure 5) as well as in profile. The Movetrack markers can be plotted separately showing the tongue’s position inside the mouth. Plotting markers like this makes it easy to see which points differ and how. It is also a good way to illustrate how much different parts of the face are moving.
Figure 5. Markers plotted from front view. The coordinates are taken from the middle of the utterances [kɑ:p] (dots) and [kap] (crosses). (MT-data)
23
By using the whole utterance and not just one phoneme, an animation of the markers and how they move over time can be produced. The animation clearly shows how the markers move during speech. This is especially interesting when analysing the tongue movements which are normally impossible to see. The animation consists of a number of plots each representing 1/60 sec of an entire utterance recording.
4.2 THE ANALYSIS The viseme analysis was made on the SF- and MT-data in parallel. To locate possible differences within the viseme groups the following analysis was made on all visemes containing more than one phoneme. The segments were compared to other segments in the same context.
- Duration of the segments was noted. - A face plot was made, which showed the middle observation from
front and side view, for the relevant phonemes. - Some key features like jaw opening and lip rounding were studied
by measuring the distance between certain predefined markers. For example, the distance between the corners of the mouth was used as a measurement of lip rounding and the distance between the upper and lower front incisors was used as an indication of jaw opening. The distances for the relevant phonemes were then compared to each other.
- The distances between each marker in the middle of the phonemes were measured for two phonemes at a time and ranking lists showing the marker with the largest distance first, were produced.
- The differences were further examined by plotting relevant markers over time. This was done for the complete utterance as well as for the individual segments.
Where there was a need for it, additional analysis steps were made. For example, when analysing phonemes for which apical movements are visible and an essential part of the production, the tongue tip movements were studied. The other parts of the tongue were not studied since the tongue tip is the only part that could possibly be seen from outside during speech. Matrices consisting of average distances between all phonemes in a viseme group and all other phonemes in that group, and the four markers with the largest differences for all the viseme groups, were created for each viseme. An example matrix for the viseme i is shown in Table 7.
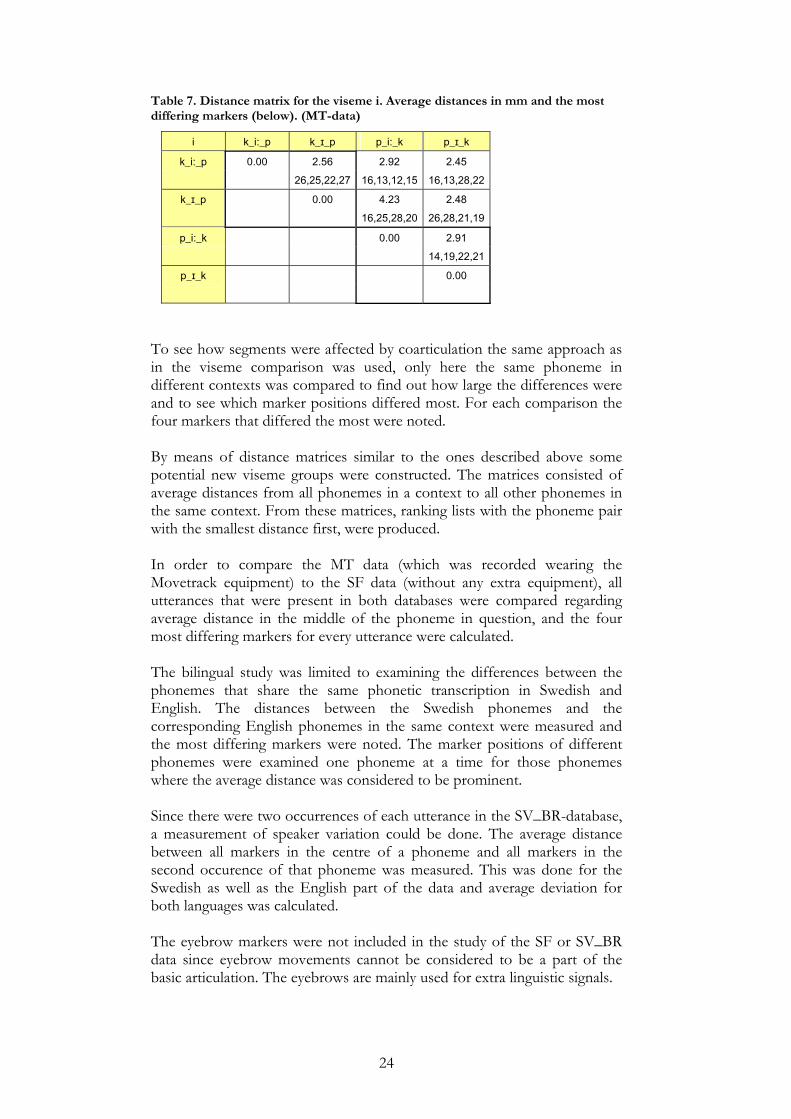
24
Table 7. Distance matrix for the viseme i. Average distances in mm and the most differing markers (below). (MT-data)
i k_i:_p k_ɪ_p p_i:_k p_ɪ_k
k_i:_p 0.00 2.56 2.92 2.45
26,25,22,27 16,13,12,15 16,13,28,22
k_ɪ_p 0.00 4.23 2.48
16,25,28,20 26,28,21,19
p_i:_k 0.00 2.91
14,19,22,21
p_ɪ_k 0.00
To see how segments were affected by coarticulation the same approach as in the viseme comparison was used, only here the same phoneme in different contexts was compared to find out how large the differences were and to see which marker positions differed most. For each comparison the four markers that differed the most were noted. By means of distance matrices similar to the ones described above some potential new viseme groups were constructed. The matrices consisted of average distances from all phonemes in a context to all other phonemes in the same context. From these matrices, ranking lists with the phoneme pair with the smallest distance first, were produced. In order to compare the MT data (which was recorded wearing the Movetrack equipment) to the SF data (without any extra equipment), all utterances that were present in both databases were compared regarding average distance in the middle of the phoneme in question, and the four most differing markers for every utterance were calculated. The bilingual study was limited to examining the differences between the phonemes that share the same phonetic transcription in Swedish and English. The distances between the Swedish phonemes and the corresponding English phonemes in the same context were measured and the most differing markers were noted. The marker positions of different phonemes were examined one phoneme at a time for those phonemes where the average distance was considered to be prominent. Since there were two occurrences of each utterance in the SV_BR-database, a measurement of speaker variation could be done. The average distance between all markers in the centre of a phoneme and all markers in the second occurence of that phoneme was measured. This was done for the Swedish as well as the English part of the data and average deviation for both languages was calculated.
The eyebrow markers were not included in the study of the SF or SV_BR data since eyebrow movements cannot be considered to be a part of the basic articulation. The eyebrows are mainly used for extra linguistic signals.
25
4.3 TESTING DATA ACCURACY
Most of the facial markers have the same positions in the MT and SF database. The only difference is the order of marker coordinates in the data files. Therefore the two databases could be compared to each other if only the order of one of them was changed to match the other. The MT data was taken as reference and the SF data was changed accordingly.
To see if the databases really were comparable the following test was made. The distance between the marker position in the SF data and the corresponding marker position in the MT data for markers which should stay relatively fixed, were measured in the middle of one phoneme in the MT-data and the same one in the SF-data. These markers were 4 (nose), 7 and 8 (just below the nose). The results showed that the two databases were not comparable. The distances between the positions in SF and MT for the chosen markers were constantly about 2-4 mm (the average distances were 3.29 for marker 4, 3.35 for marker 7 and 2.58 for marker 8). The distance was considered to be too large to use the two databases jointly. The standard deviation for the distances was 0.48 for the nose marker and 0.68 and 0.64 for the markers below the nose. This indicates that there is no extensive variation between the distances. The explanation for this deviation is that when the data was normalised to eliminate head movements, the normalisation of the MT-data was based on the markers on the headgear while the normalisation of the SF-data was based on the markers on the spectacle frame. Since the normalisation was done separately on the two databases there is a small constant disparity between the coordinates in them. However, if the data in SF and MT respectively were accurate they could still be used separately. To see how precise the measurements in SF, MT and SV_BR were, another test was made. If the measurements were precise, the distance between the fixed markers on the headgear in MT and on the glasses in SF and SV_BR would be constant. Hence, the distance between marker 1 and 2 and marker 2 and 3 in MT headgear was measured as well as the distance between marker 1 and 2, marker 2 and 5 and marker 3 and 4 in the SF spectacles and marker 5 and 11, marker 9 and 12 and finally marker 10 and 11 in the SV_BR spectacles. The standard deviation for these distances was 0.04 mm for the MT-markers and 0.05 mm for the SF-markers and 0.04-0.06 for the SV_BR-markers, which must be considered accurate enough for the study. The differences between the maximum and minimum distances were 0.2 mm for the MT and SF data and 0.3 for the SV_BR data. The results also correspond well to the figures given by Qualisys8.
8 Qualisys claims that the system has a precision of 0.1 mm. (www.qualisys.com)
26
5. RESULTS
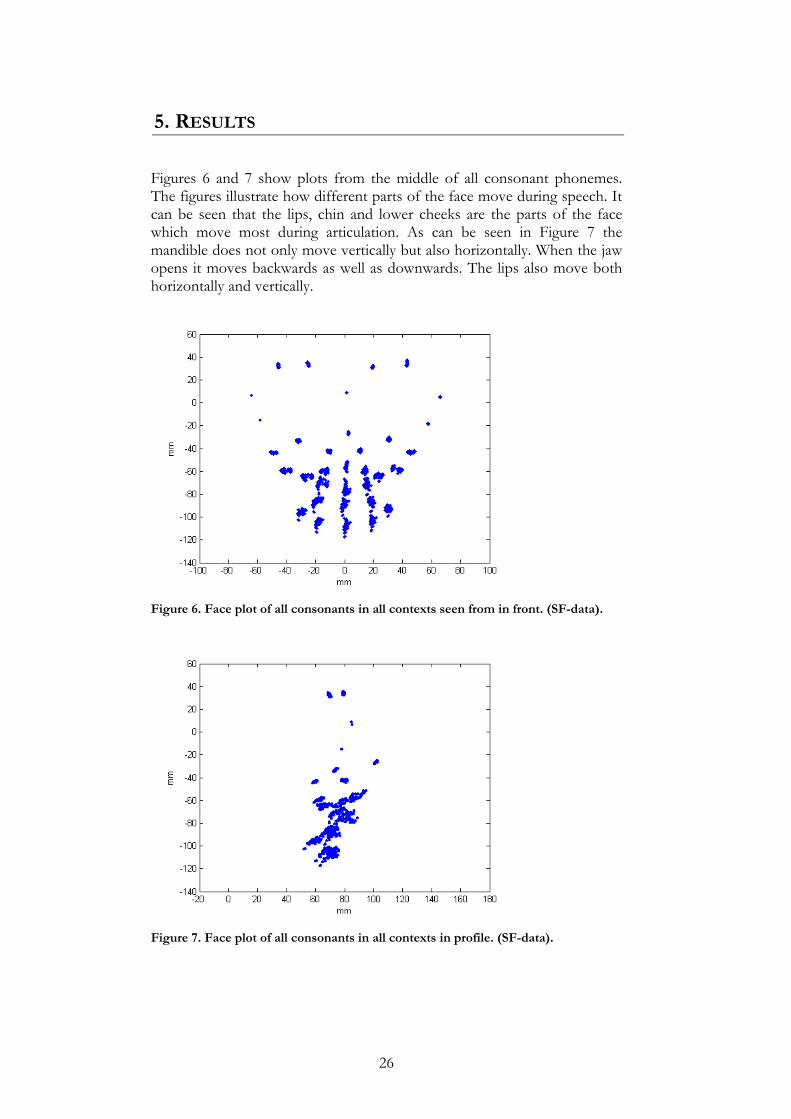
Figures 6 and 7 show plots from the middle of all consonant phonemes. The figures illustrate how different parts of the face move during speech. It can be seen that the lips, chin and lower cheeks are the parts of the face which move most during articulation. As can be seen in Figure 7 the mandible does not only move vertically but also horizontally. When the jaw opens it moves backwards as well as downwards. The lips also move both horizontally and vertically.
Figure 6. Face plot of all consonants in all contexts seen from in front. (SF-data).
Figure 7. Face plot of all consonants in all contexts in profile. (SF-data).
27
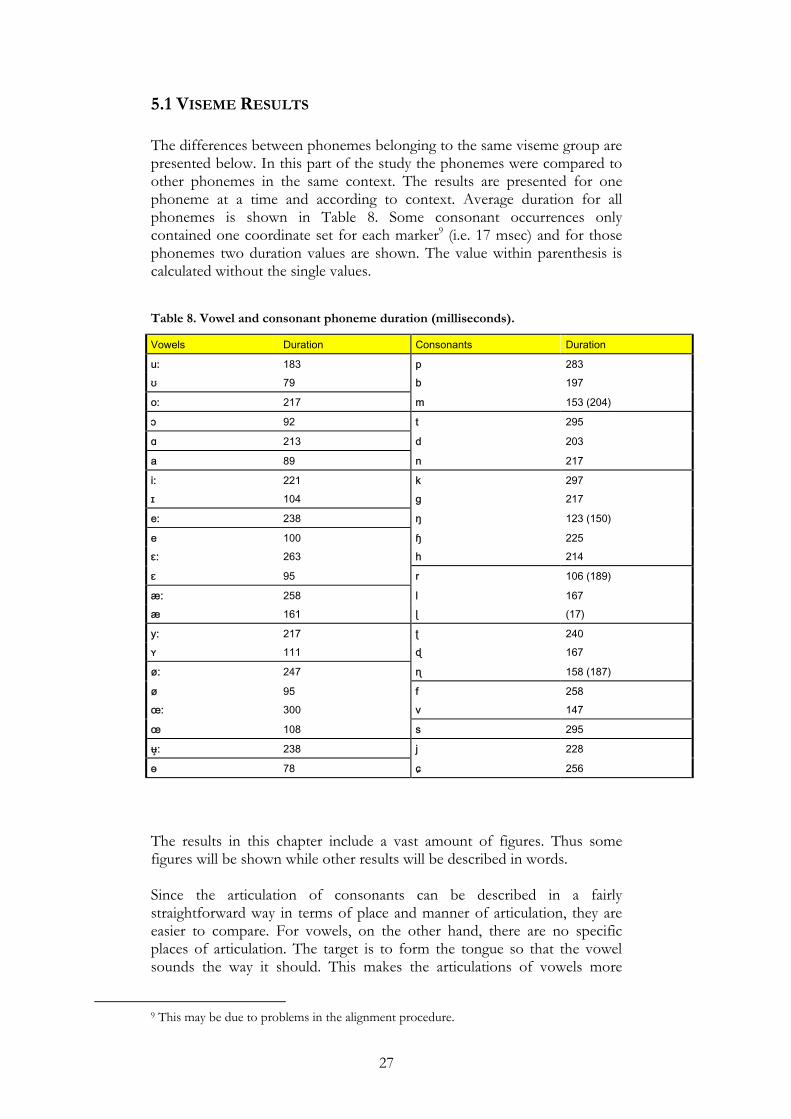
5.1 VISEME RESULTS The differences between phonemes belonging to the same viseme group are presented below. In this part of the study the phonemes were compared to other phonemes in the same context. The results are presented for one phoneme at a time and according to context. Average duration for all phonemes is shown in Table 8. Some consonant occurrences only contained one coordinate set for each marker9 (i.e. 17 msec) and for those phonemes two duration values are shown. The value within parenthesis is calculated without the single values.
Table 8. Vowel and consonant phoneme duration (milliseconds).
Vowels Duration Consonants Duration
u: 183 p 283
ʊ 79 b 197
o: 217 m 153 (204)
ɔ 92 t 295
ɑ 213 d 203
a 89 n 217
i: 221 k 297
ɪ 104 g 217
e: 238 ŋ 123 (150)
e 100 ɧ 225
ɛ: 263 h 214
ɛ 95 r 106 (189)
æ: 258 l 167
æ 161 ɭ (17)
y: 217 ʈ 240
ʏ 111 ɖ 167
ø: 247 ɳ 158 (187)
ø 95 f 258
œ: 300 v 147
œ 108 s 295
ʉ̟: 238 j 228
ɵ 78 ɕ 256
The results in this chapter include a vast amount of figures. Thus some figures will be shown while other results will be described in words. Since the articulation of consonants can be described in a fairly straightforward way in terms of place and manner of articulation, they are easier to compare. For vowels, on the other hand, there are no specific places of articulation. The target is to form the tongue so that the vowel sounds the way it should. This makes the articulations of vowels more
9 This may be due to problems in the alignment procedure.
28
difficult to compare than the articulations of consonants. It has actually been shown that consonants contribute with more visual information through the articulatory movements than vowels. (O’Neill, 1954)
5.1.1 VOWELS Viseme O (ʊ:, ʊ) /ʊ:/ is was slightly more than twice as long as /ʊ/. Apart from that the differences between these two phonemes were small. /k_p/ - /ʊ/ was pronounced with a more open mouth and slightly more protruded lips, but when measuring the distance between the upper and lower incisors it was actually found that the jaw was somewhat more open for /ʊ:/. The chin, lower lip and corners of the mouth were lower when producing an /ʊ/ than when producing /ʊ:/. In addition, all these markers were situated higher on the z-axis (i.e. closer to the nose). /ʊ/ was more rounded than /ʊ:/, which here means that the corners of the mouth are closer together the more rounded a segment is. These differences occurred in both datasets, but were more prominent in the MT-data. /p_k/ - In the MT-data the same tendencies as in the /k_p/-context could be seen, but the differences were smaller and only seen on the lower lip and chin, which were slightly lower for /ʊ/. In the SF-data no differences were found. Viseme I (i:, ɪ) /ɪ/ was about half as long as /i:/. /k_p/ - Regarding articulatory distinctions, different results were obtained from the two databases. In the MT data the chin, upper and lower lip, and cheek points are higher for /i:/ and the chin also had higher z-coordinates. In the SF data the chin and lower lip were somewhat higher on the z-axis for /i:/. /p_k/ - A few of the differences were found in the MT data but not in the SF data. In the MT-data /i:/ was more open and the lips were further apart. The upper lip was higher and the lower lip was lower as was the chin. The /ɪ/-markers on the lips, chin and corners of the mouth had lower z-values than the corresponding markers for /i:/. In the SF-data these two phonemes were pronounced very similarly.
29
Viseme Ä1 (e, ɛ:, ɛ) /ɛ:/ was more than twice as long as /ɛ/ and /e/. /k_p/ - /ɛ:/ was the most open of the three, followed by /ɛ/ and finally /e/. This was mainly seen on the chin and lower lip. In the SF-data /e/ and /ɛ:/ looked very similar, while the markers on the chin, lips and corners of the mouth were slightly further back (had a lower z-coordinate) for /ɛ/. /p_k/ - /ɛ:/ was, as stated above, the most open of these three and this could be seen on chin and lower lip. These differences were less obvious in the SF data than in MT. Viseme Ä3 (æ:, æ) /æ:/ was almost double the length of /æ/. /k_p/ - The utterance /kær/ was not included in the SF-data and therefore only the MT-data could be examined. The markers on the chin, the corners of the mouth and lower lip in the MT-data indicated that/æ:/ was somewhat more open than /æ/. These markers were also a little bit further back for /æ:/. The differences were however extremely small. /p_k/ - In this context no measurements could be done for the MT-data, since /kær/ was not included, but when looking at the SF-data it was seen that, according to the markers on the chin and lower lip, /æ:/ was more open than /æ/. Viseme Y (y:, ʏ) /y:/ was approximately twice as long as /ʏ/. /k_p/ - Since there was no instance of /kyp/ in the MT-data, only the SF-data could be examined. The phonemes looked almost identical when seeing the markers from front view, but when seeing the face in profile it could be noticed that the coordinates for the lip and chin markers have higher z-values for /y:/. This can be seen as a sign of protrusion. /p_k/ - In the SF data the lower lip was lower and the upper lip was higher and the mouth looked more protruded and rounded for /y:/. The rounding could be seen on the corners of the mouth as well as on the markers on the cheeks. In the MT-data the differences were not as prominent.
30
Viseme Ö (ø:, ø, œ:, œ2) /œ:/ was the longest of these phonemes followed by /ø:/ which was about 50 msec shorter. /ø/ and /œ/ were about half the length of /ø:/. /k_p/ - In the MT-data the utterance /kø:p/ was removed since the markers on the lower lip were covering markers on the chin and /køp/ was not in the database. In the SF-data /kœr/ was not present. /ø/ and /œ/ in the MT-data were pronounced very similarly. When comparing /ø:/, /ø/ and /œ/ it was noted that /ø:/ was the most open and protruded as regards the chin and lower lip. In /kø:p/ in the MT data the lower lip has, as mentioned, even covered the upper part of the chin and caused the Qualisys tracking system to return erroneous information for three of the points (22, 20 and 19). These mistakes were easily seen when the data for the utterance was animated. /œ1/ was very similar to /ø:/, but somewhat less protruded. /œ/ was slightly more closed and less protruded than the others and it also had the least rounding. /p_k/ - The /pœk/-utterance was mislabelled in the SF-data and not present in the MT-data and therefore not included in the analysis. No occurrence of /œ:/ was present in any of the databases. Consequently, only /ø:/ and /ø/ were examined. Different results are obtained from the two databases. However, in both databases the markers on the chin, lower lip and the corners of the mouth showed that /ø:/ was more open and protruded than /ø/, and that the lower lip was lower for /ø:/. In addition to this, in the SF data, the upper lip was higher and more protruded for /ø:/ than for /ø/.
5.1.2 CONSONANTS
Viseme P (p, b, m) /p/ was approximately 80 milliseconds longer than /b/ and /m/. /a_a/ - These three phonemes looked very much alike. The visible articulation movements were the same but for /p/ the lips were clearly together for a longer period of time than for /b/ and /m/. Only very small differences were found. In the SF-data the markers on the chin for /p/ were all further back followed by /b/ and /m/, when looking at the side view plot. This is probably caused by the higher pressure that is needed to produce a /p/ and /b/. In both datasets the jaw was most open for /m/ but the markers on the middle upper and lower lips were closer together. This is due to that the upper lip moves further down for /m/. (See the y-plot in Figure 8)
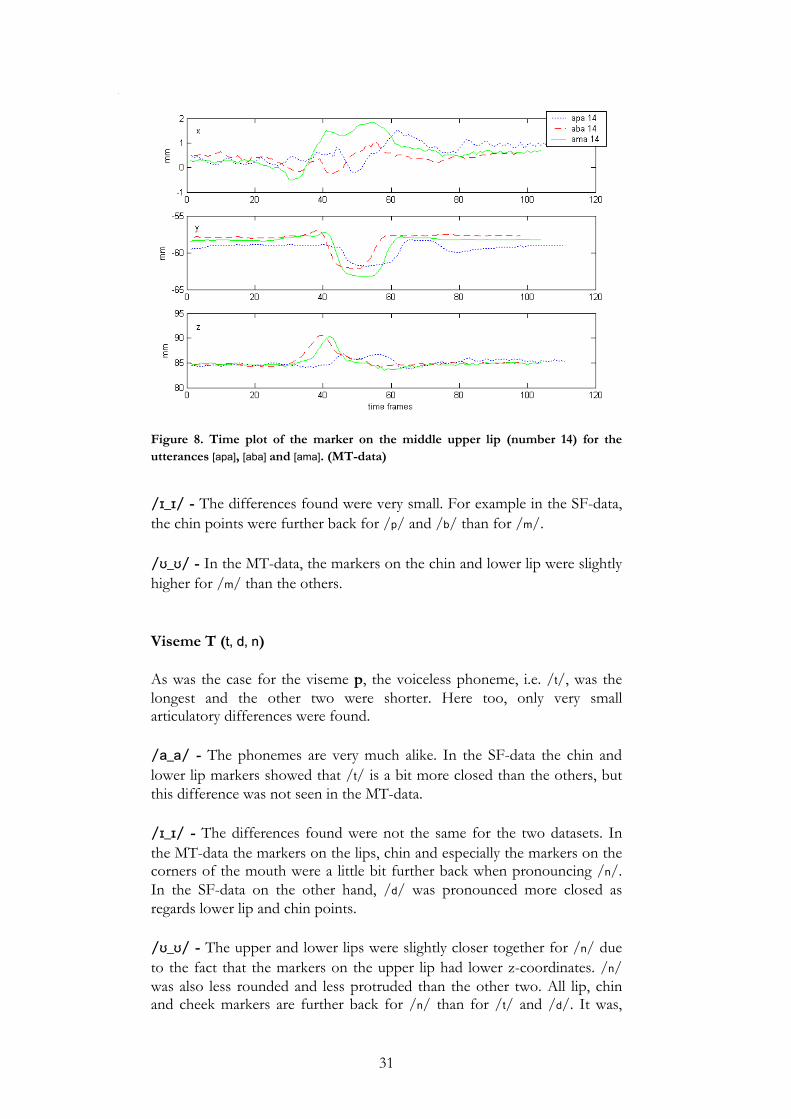
31
Figure 8. Time plot of the marker on the middle upper lip (number 14) for the utterances [apa], [aba] and [ama]. (MT-data)
/ɪ_ɪ/ - The differences found were very small. For example in the SF-data, the chin points were further back for /p/ and /b/ than for /m/. /ʊ_ʊ/ - In the MT-data, the markers on the chin and lower lip were slightly higher for /m/ than the others. Viseme T (t, d, n) As was the case for the viseme p, the voiceless phoneme, i.e. /t/, was the longest and the other two were shorter. Here too, only very small articulatory differences were found. /a_a/ - The phonemes are very much alike. In the SF-data the chin and lower lip markers showed that /t/ is a bit more closed than the others, but this difference was not seen in the MT-data. /ɪ_ɪ/ - The differences found were not the same for the two datasets. In the MT-data the markers on the lips, chin and especially the markers on the corners of the mouth were a little bit further back when pronouncing /n/. In the SF-data on the other hand, /d/ was pronounced more closed as regards lower lip and chin points. /ʊ_ʊ/ - The upper and lower lips were slightly closer together for /n/ due to the fact that the markers on the upper lip had lower z-coordinates. /n/ was also less rounded and less protruded than the other two. All lip, chin and cheek markers are further back for /n/ than for /t/ and /d/. It was,
32
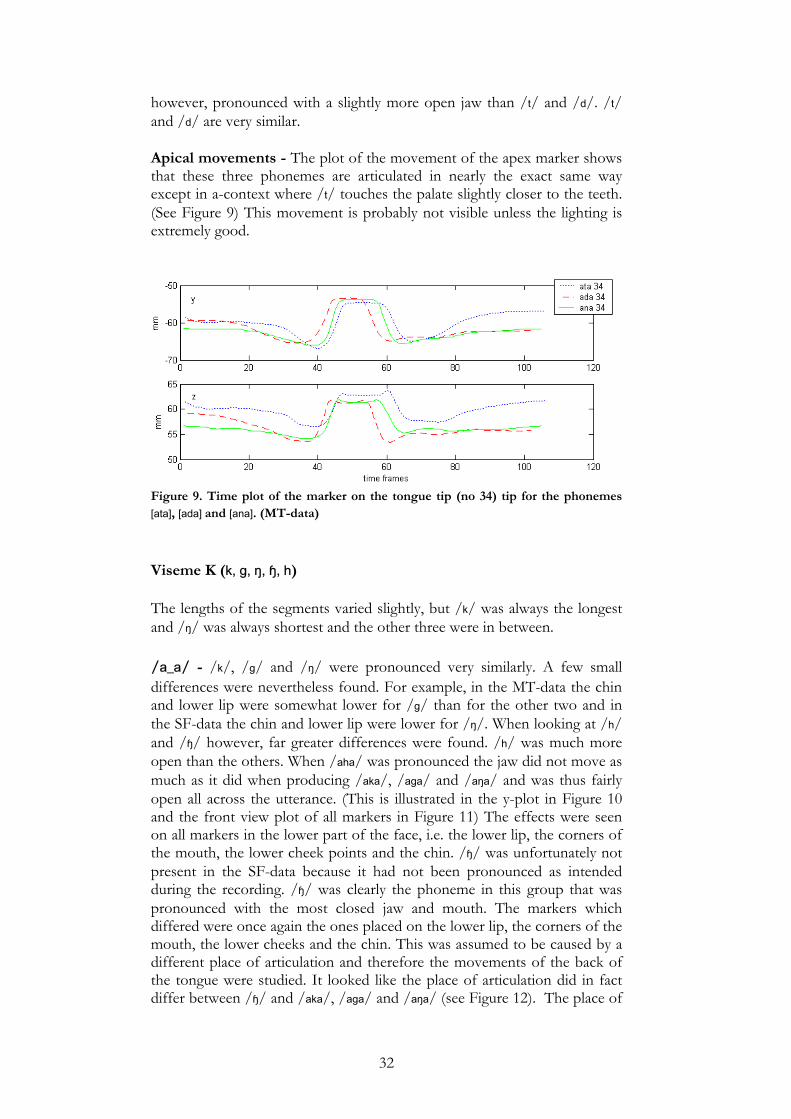
however, pronounced with a slightly more open jaw than /t/ and /d/. /t/ and /d/ are very similar. Apical movements - The plot of the movement of the apex marker shows that these three phonemes are articulated in nearly the exact same way except in a-context where /t/ touches the palate slightly closer to the teeth. (See Figure 9) This movement is probably not visible unless the lighting is extremely good.
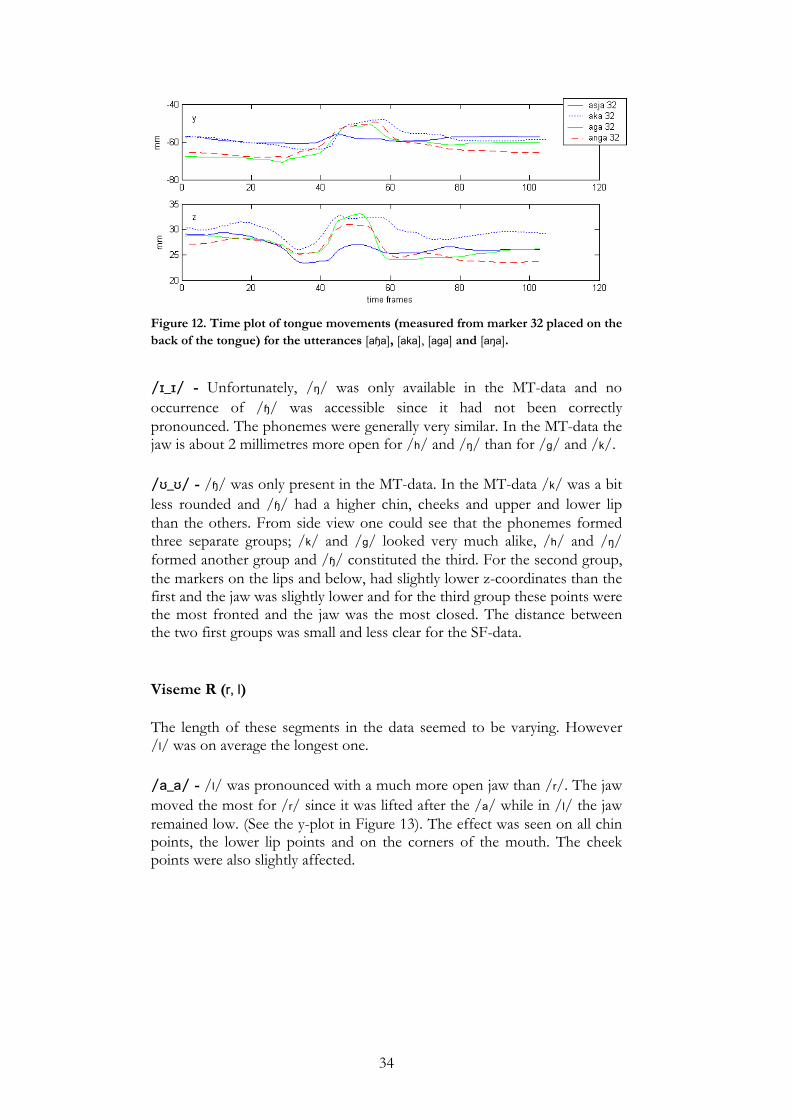
Figure 9. Time plot of the marker on the tongue tip (no 34) tip for the phonemes [ata], [ada] and [ana]. (MT-data) Viseme K (k, g, ŋ, ɧ, h) The lengths of the segments varied slightly, but /k/ was always the longest and /ŋ/ was always shortest and the other three were in between. /a_a/ - /k/, /g/ and /ŋ/ were pronounced very similarly. A few small differences were nevertheless found. For example, in the MT-data the chin and lower lip were somewhat lower for /g/ than for the other two and in the SF-data the chin and lower lip were lower for /ŋ/. When looking at /h/ and /ɧ/ however, far greater differences were found. /h/ was much more open than the others. When /aha/ was pronounced the jaw did not move as much as it did when producing /aka/, /aga/ and /aŋa/ and was thus fairly open all across the utterance. (This is illustrated in the y-plot in Figure 10 and the front view plot of all markers in Figure 11) The effects were seen on all markers in the lower part of the face, i.e. the lower lip, the corners of the mouth, the lower cheek points and the chin. /ɧ/ was unfortunately not present in the SF-data because it had not been pronounced as intended during the recording. /ɧ/ was clearly the phoneme in this group that was pronounced with the most closed jaw and mouth. The markers which differed were once again the ones placed on the lower lip, the corners of the mouth, the lower cheeks and the chin. This was assumed to be caused by a different place of articulation and therefore the movements of the back of the tongue were studied. It looked like the place of articulation did in fact differ between /ɧ/ and /aka/, /aga/ and /aŋa/ (see Figure 12). The place of
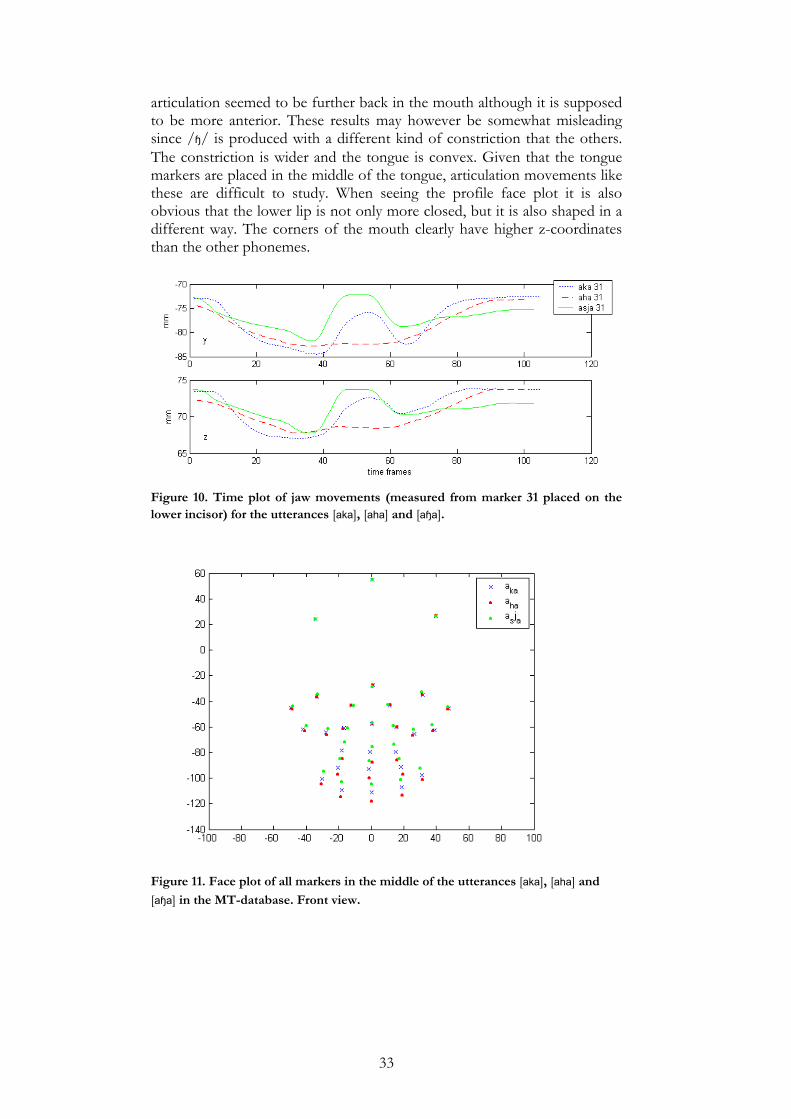
33
articulation seemed to be further back in the mouth although it is supposed to be more anterior. These results may however be somewhat misleading since /ɧ/ is produced with a different kind of constriction that the others. The constriction is wider and the tongue is convex. Given that the tongue markers are placed in the middle of the tongue, articulation movements like these are difficult to study. When seeing the profile face plot it is also obvious that the lower lip is not only more closed, but it is also shaped in a different way. The corners of the mouth clearly have higher z-coordinates than the other phonemes.
Figure 10. Time plot of jaw movements (measured from marker 31 placed on the lower incisor) for the utterances [aka], [aha] and [aɧa].
Figure 11. Face plot of all markers in the middle of the utterances [aka], [aha] and [aɧa] in the MT-database. Front view.
34
Figure 12. Time plot of tongue movements (measured from marker 32 placed on the back of the tongue) for the utterances [aɧa], [aka], [aga] and [aŋa].
/ɪ_ɪ/ - Unfortunately, /ŋ/ was only available in the MT-data and no occurrence of /ɧ/ was accessible since it had not been correctly pronounced. The phonemes were generally very similar. In the MT-data the jaw is about 2 millimetres more open for /h/ and /ŋ/ than for /g/ and /k/. /ʊ_ʊ/ - /ɧ/ was only present in the MT-data. In the MT-data /k/ was a bit less rounded and /ɧ/ had a higher chin, cheeks and upper and lower lip than the others. From side view one could see that the phonemes formed three separate groups; /k/ and /g/ looked very much alike, /h/ and /ŋ/ formed another group and /ɧ/ constituted the third. For the second group, the markers on the lips and below, had slightly lower z-coordinates than the first and the jaw was slightly lower and for the third group these points were the most fronted and the jaw was the most closed. The distance between the two first groups was small and less clear for the SF-data. Viseme R (r, l) The length of these segments in the data seemed to be varying. However /l/ was on average the longest one. /a_a/ - /l/ was pronounced with a much more open jaw than /r/. The jaw moved the most for /r/ since it was lifted after the /a/ while in /l/ the jaw remained low. (See the y-plot in Figure 13). The effect was seen on all chin points, the lower lip points and on the corners of the mouth. The cheek points were also slightly affected.
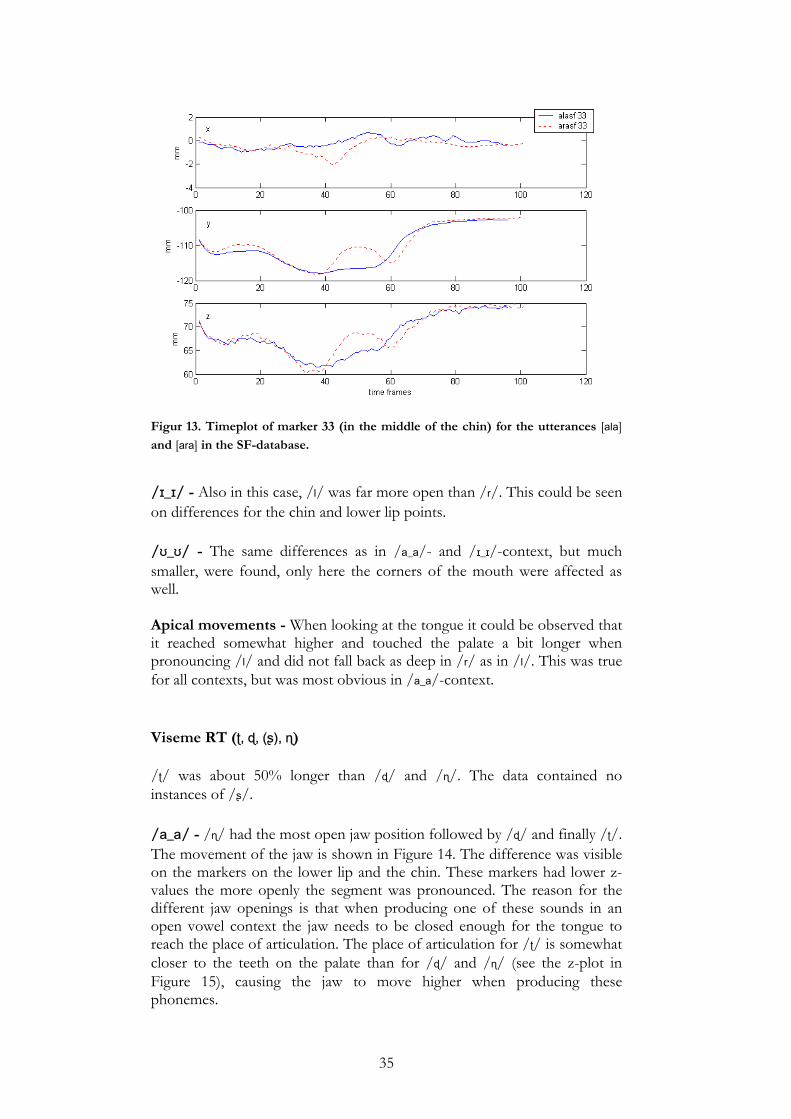
35
Figur 13. Timeplot of marker 33 (in the middle of the chin) for the utterances [ala] and [ara] in the SF-database.
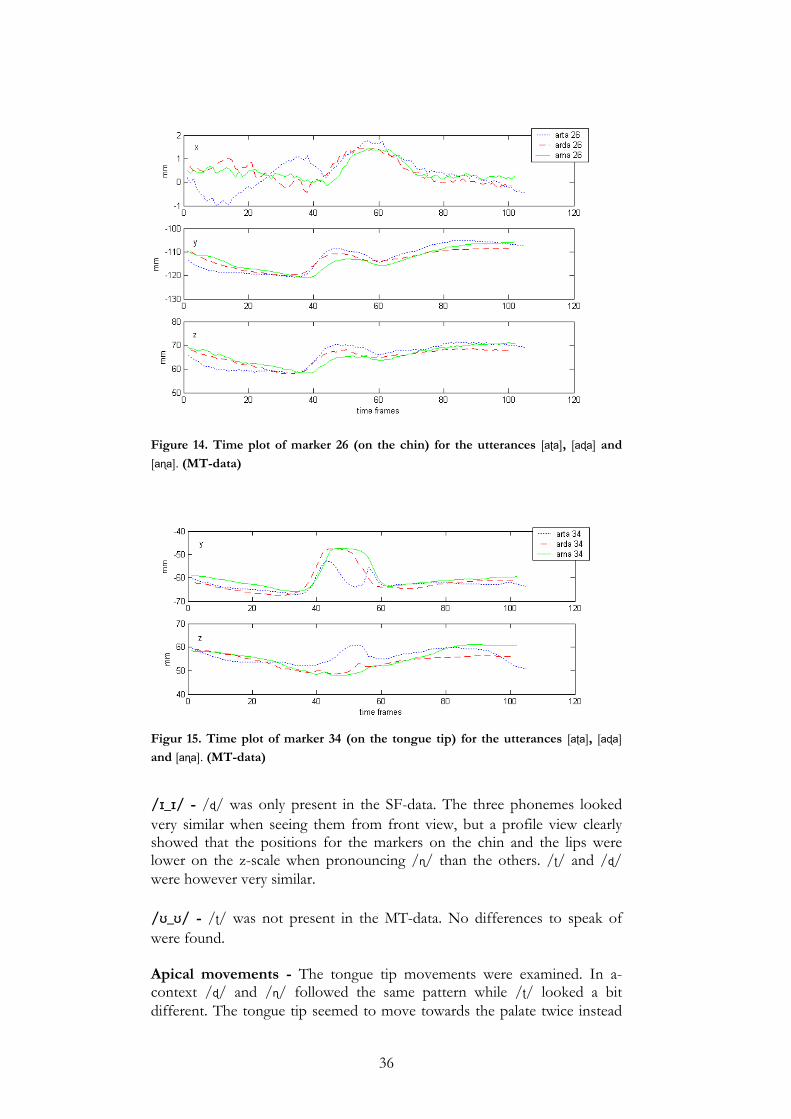
/ɪ_ɪ/ - Also in this case, /l/ was far more open than /r/. This could be seen on differences for the chin and lower lip points. /ʊ_ʊ/ - The same differences as in /a_a/- and /ɪ_ɪ/-context, but much smaller, were found, only here the corners of the mouth were affected as well. Apical movements - When looking at the tongue it could be observed that it reached somewhat higher and touched the palate a bit longer when pronouncing /l/ and did not fall back as deep in /r/ as in /l/. This was true for all contexts, but was most obvious in /a_a/-context. Viseme RT (ʈ, ɖ, (ʂ), ɳ) /ʈ/ was about 50% longer than /ɖ/ and /ɳ/. The data contained no instances of /ʂ/. /a_a/ - /ɳ/ had the most open jaw position followed by /ɖ/ and finally /ʈ/. The movement of the jaw is shown in Figure 14. The difference was visible on the markers on the lower lip and the chin. These markers had lower z-values the more openly the segment was pronounced. The reason for the different jaw openings is that when producing one of these sounds in an open vowel context the jaw needs to be closed enough for the tongue to reach the place of articulation. The place of articulation for /ʈ/ is somewhat closer to the teeth on the palate than for /ɖ/ and /ɳ/ (see the z-plot in Figure 15), causing the jaw to move higher when producing these phonemes.
36
Figure 14. Time plot of marker 26 (on the chin) for the utterances [aʈa], [aɖa] and [aɳa]. (MT-data)
Figur 15. Time plot of marker 34 (on the tongue tip) for the utterances [aʈa], [aɖa] and [aɳa]. (MT-data)
/ɪ_ɪ/ - /ɖ/ was only present in the SF-data. The three phonemes looked very similar when seeing them from front view, but a profile view clearly showed that the positions for the markers on the chin and the lips were lower on the z-scale when pronouncing /ɳ/ than the others. /ʈ/ and /ɖ/ were however very similar. /ʊ_ʊ/ - /ʈ/ was not present in the MT-data. No differences to speak of were found. Apical movements - The tongue tip movements were examined. In a-context /ɖ/ and /ɳ/ followed the same pattern while /ʈ/ looked a bit different. The tongue tip seemed to move towards the palate twice instead
37
of touching it once. For /ɪ_ɪ/-context only /ʈ/ and /ɳ/ could be studied. They were very similar. In /ʊ_ʊ/-context the tongue tip movements differentiated greatly. For the /ɳ/ the tongue tip moves up to the palate, but for /ɖ/ the tongue tip is moved downwards. When listening to this utterance one can hear that there actually is something odd about the articulation. It sounds somewhat slurred, which explains the unexpected tongue movements.
Viseme F (f, v) The voiceless /f/ was almost twice as long as its voiced counterpart /v/. /a_a/ - The SF-data had to be discarded since the utterance /afa/ contained some inaccuracies. The left (19, 24) and right (21, 26) upper and lower lip points seemed to have unreasonable coordinates. This was due to that the upper lip had crossed the lower causing the Qualisys system to make a mistake. No large differences were however found between these phonemes in the MT-data. /ɪ_ɪ/ - From front view the two phonemes looked very similar, but from profile view a few small differences could be seen in the SF-data. The corners of the mouth and the outer lower lip points were further back for /v/. This difference was not found in the MT-data. /ʊ_ʊ/ - There were no large discrepancies here either, only in the MT-data the lower lip was slightly more raised for /v/. Viseme J (j, ɕ) The differences in length between /j/ and /ɕ/ were very small. /a_a/ - No visible differences were seen from front view, but from side view it could be seen that the corners of the mouth and all lip points was somewhat further back for /ɕ/.
/ɪ_ɪ/ - No large differences were found in this context. In the SF-data the chin and lower lip were slightly more raised for /ɕ/. /ʊ_ʊ/ - In both datasets /ɕ/ was pronounced with a somewhat more protruded lower lip and open jaw than /j/. No other differences were found.
38
5.2 ARTICULATION AND COARTICULATION RESULTS As was showed in the previous section, articulation does vary according to context. In this section the results of the coarticulation measurements will be presented. Table 9 and 10 show average distances measured from a consonant phoneme in one context to the same phoneme in another context for both MT and SF data. The figures show that /ʊ_ʊ/ is the context which has the greatest impact on the consonant phonemes. The difference between the /a_a/-context and the /ɪ_ɪ/-context is fairly small. The influence of the consonant contexts on the vowels is very limited as well. Another observation that can be made from this data is that the differences are larger in the MT-data. This is probably caused by the unusual speaking situation that the Movetrack equipment gives rise to. Table 9. MT: Average distances (for all markers) between consonant phonemes in different vowel contexts and vowel phonemes in different consonant contexts. (mm)
Table 10. SF: Average distances (for all markers) between consonant phonemes in different vowel contexts and vowel phonemes in different consonant contexts. (mm)
The markers for which the coordinates changed the most were generally the same in the MT data as in the SF data. The /k_p/- and /p_k/-contexts do not seem to have a great impact on the pronunciation of the vowels. A peculiar fact is that in both databases, the position of the marker in the left corner of the mouth is among the top four most differing markers in 50% of the comparisons, while the right marker receives much lower figures. This is probably an example of the asymmetry in speech. No human face is completely symmetric and this naturally influences the speech. Apart from that there were no maker positions that showed great differences in both databases.
MT [a_a] [ɪ_ɪ] [ʊ_ʊ] [k_p] [p_k] [a_a] 0 2.24 6.37 - -
[ɪ_ɪ] 2.24 0 6.67 - -
[ʊ_ʊ] 6.37 6.67 0 - -
[k_p] - - - 0 2.72
[p_k] - - - 2.72 0
SF [a_a] [ɪ_ɪ] [ʊ_ʊ] [k_p] [p_k] [a_a] 0 1.94 5.92 - -
[ɪ_ɪ] 1.94 0 5.46 - -
[ʊ_ʊ] 5.92 5.46 0 - -
[k_p] - - - 0 1.47
[p_k] - - - 1.47 0
39
The comparison between the phonemes in /a_a/-context to the same phonemes in /ɪ_ɪ/-context showed that the affected markers mainly were the ones situated vertically in the middle of the chin and the markers on the lower lip. Many of the markers were found among the top four when comparing one phoneme at a time, but the only one to be among the top four in the majority of the comparisons was the one on the centre and on the lower middle part of the chin. However, when comparing /a_a/-context to /ʊ_ʊ/-context, the results were a bit different. Here only a few markers’ positions differed, but the distances were larger. Actually the markers in the corners of the mouth were among the top four in about 80-100% of all comparisons. For these two markers and the adjacent markers around the mouth, the disparity was obvious. For this context there was a difference between the results obtained from the MT and the SF data. In the MT-data the markers on the right side of the mouth were more affected than the ones on the left side. Finally, the different effects of the /ɪ_ɪ/-context and the /ʊ_ʊ/-context were examined. Here too, a few markers were among the top four for almost all comparisons. The markers in the corners of the mouth and the adjacent markers on the lower lip differ significantly in the majority of comparisons. However, in about 20% of the comparisons made on the SF-data the two middle chin points are among the four most differing marker coordinates, while for the MT-data this is the case for the points on the upper lip. These differences between the two datasets are probably due to the affect the Movetrack equipment has on the articulation. In conclusion, the context which affects consonants the most is /ʊ_ʊ/ and the change is mainly seen on the corners of the mouth since /ʊ/ has a rounding effect on adjacent phonemes. The /a_a/- and the /ɪ_ɪ/-contexts seem to have a minor impact on the articulation of consonants as well as do the consonant contexts on the vowels. To see how phonemes within different viseme groups are affected and if they are changed in the same way, the results for each viseme group, and the phonemes they contain, will be presented separately below. The coarticulation on vowels caused by the consonant contexts will not be discussed further since the small differences observed and the great variety of differing markers show that the consonant contexts used in this study does not have a great affect on the articulation of vowels.
5.2.1 VISEME GROUPS Viseme P (p, b, m) These three visemes seemed to be affected in the same way by the different contexts. In /a_a/- and /ɪ_ɪ/-context the phonemes looked very similar, but the differences were larger in /ʊ_ʊ/-context. All lip markers, but especially the ones situated in the corners of the mouth, had higher z-coordinates for
40
the phoneme occurrence in /ʊ_ʊ/-context. In addition, the lips were more protruded which made the distance between the middle lip markers larger. One important effect of the rounding was that the distance between the corners of the mouth was smaller. The jaw was the most open in /a_a/-context and the most closed in /ɪ_ɪ/-context. In the SF-data the differences seemed to be rather symmetric. If there was a difference on one side of the face, the difference was usually about the same size on the opposite side, while in the MT-data the differences were larger on the right side of the face where the Movetrack equipment was placed. Viseme T (t, d, n) For the phonemes in this viseme group the differences caused by the contexts were the same. In /a_a/- and /ɪ_ɪ/-context they looked almost identical and the most extensive changes occured in /ʊ_ʊ/-context. The corners of the mouth were closest to each other in /ʊ_ʊ/-context and furthest apart in /ɪ_ɪ/-context. In /ʊ_ʊ/-context the middle of the upper and lower lip were further apart because of the protrusion and rounding. The chin markers were somewhat higher and the cheek markers were affected as well. The markers on the cheek, and especially the lower ones, were closer to the origin on the x-axis because the cheeks were sucked into the gap between the teeth. Apical movements – The tongue tip movements were examined to see if context had an effect on place of articulation. In this case it did not. All three phonemes were articulated on the same place regardless of context. Viseme K (k, g, ŋ, ɧ, h) This is the viseme group where the greatest distinctions were observed. The phonemes /k/, /g/ and /ŋ/ were, however, influenced the same way by the different contexts. The /a_a/- and /ɪ_ɪ/-contexts did not change the phonemes much except that the jaw in most cases was somewhat more open in /a_a/-context and that the phonemes were slightly less rounded in /ɪ_ɪ/-context. In /ʊ_ʊ/-context the corners of the mouth and the adjacent mouth markers were closer together (i.e. closer to the origin on the x-axis) and so were the lower cheek markers. In addition, all lip markers had higher z-coordinates. In some cases the distance between the middle lip markers was somewhat longer due to the protrusion. All chin markers had higher y-coordinates (i.e. they were situated higher) than in /a_a/- and /ɪ_ɪ/-context. /ɧ/ could only be studied in /a_a/- and /ʊ_ʊ/-context. The same lip and cheek affects as in the three previously described were found but vaguer and the chin markers had approximately the same positions in the two contexts. /h/ was the phoneme for which the greatest differences were found and even if it had some similarities with the other phonemes in the group it was influenced rather differently. The chin and mouth had the lowest y-
41
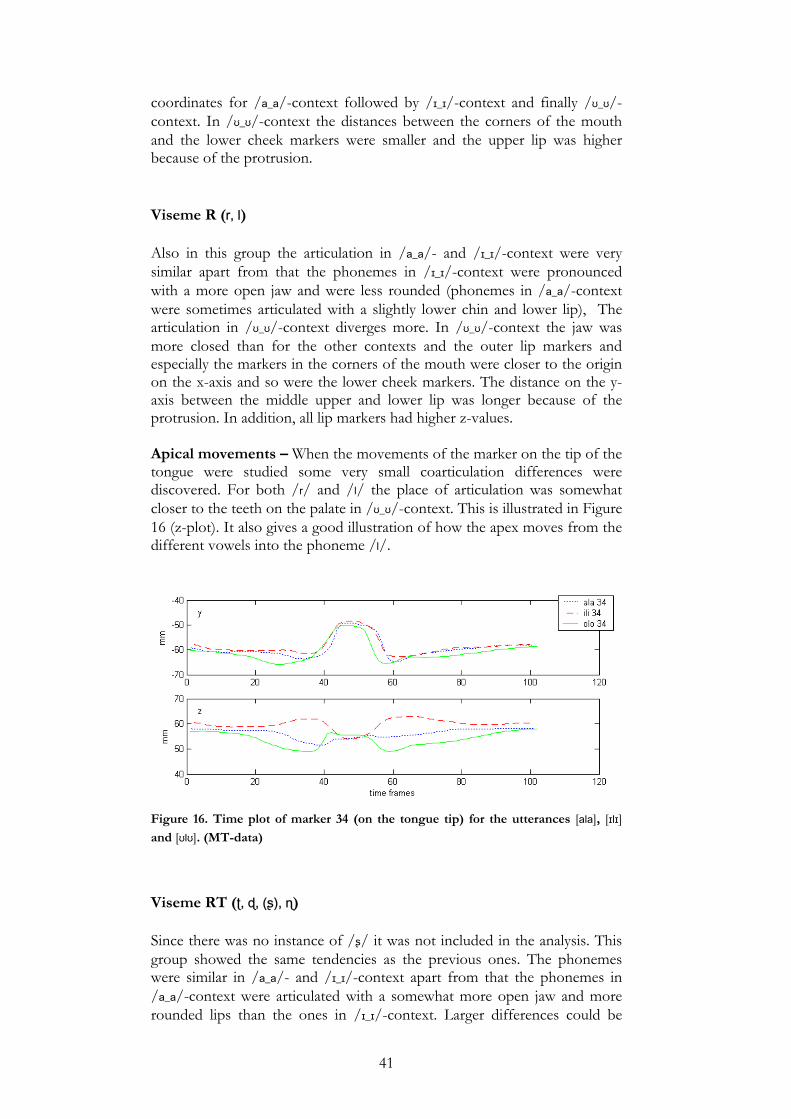
coordinates for /a_a/-context followed by /ɪ_ɪ/-context and finally /ʊ_ʊ/-context. In /ʊ_ʊ/-context the distances between the corners of the mouth and the lower cheek markers were smaller and the upper lip was higher because of the protrusion. Viseme R (r, l) Also in this group the articulation in /a_a/- and /ɪ_ɪ/-context were very similar apart from that the phonemes in /ɪ_ɪ/-context were pronounced with a more open jaw and were less rounded (phonemes in /a_a/-context were sometimes articulated with a slightly lower chin and lower lip), The articulation in /ʊ_ʊ/-context diverges more. In /ʊ_ʊ/-context the jaw was more closed than for the other contexts and the outer lip markers and especially the markers in the corners of the mouth were closer to the origin on the x-axis and so were the lower cheek markers. The distance on the y-axis between the middle upper and lower lip was longer because of the protrusion. In addition, all lip markers had higher z-values. Apical movements – When the movements of the marker on the tip of the tongue were studied some very small coarticulation differences were discovered. For both /r/ and /l/ the place of articulation was somewhat closer to the teeth on the palate in /ʊ_ʊ/-context. This is illustrated in Figure 16 (z-plot). It also gives a good illustration of how the apex moves from the different vowels into the phoneme /l/.
Figure 16. Time plot of marker 34 (on the tongue tip) for the utterances [ala], [ɪlɪ] and [ʊlʊ]. (MT-data)
Viseme RT (ʈ, ɖ, (ʂ), ɳ) Since there was no instance of /ʂ/ it was not included in the analysis. This group showed the same tendencies as the previous ones. The phonemes were similar in /a_a/- and /ɪ_ɪ/-context apart from that the phonemes in /a_a/-context were articulated with a somewhat more open jaw and more rounded lips than the ones in /ɪ_ɪ/-context. Larger differences could be
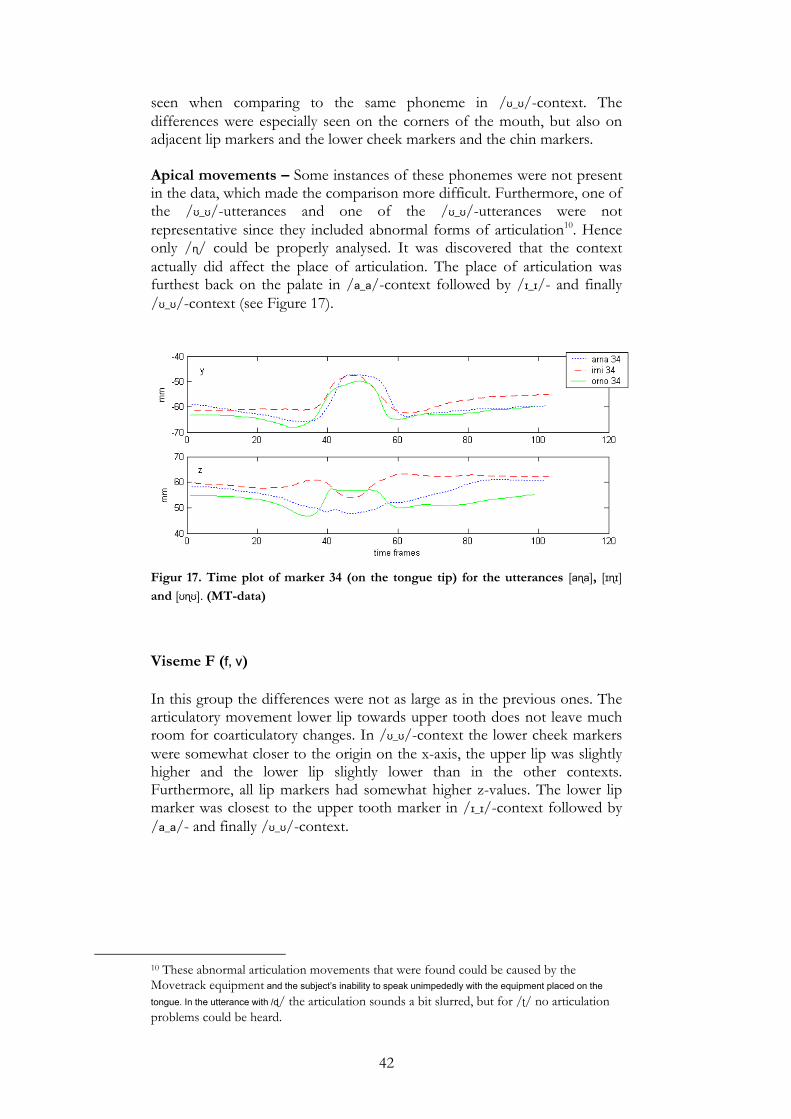
42
seen when comparing to the same phoneme in /ʊ_ʊ/-context. The differences were especially seen on the corners of the mouth, but also on adjacent lip markers and the lower cheek markers and the chin markers. Apical movements – Some instances of these phonemes were not present in the data, which made the comparison more difficult. Furthermore, one of the /ʊ_ʊ/-utterances and one of the /ʊ_ʊ/-utterances were not representative since they included abnormal forms of articulation10. Hence only /ɳ/ could be properly analysed. It was discovered that the context actually did affect the place of articulation. The place of articulation was furthest back on the palate in /a_a/-context followed by /ɪ_ɪ/- and finally /ʊ_ʊ/-context (see Figure 17).
Figur 17. Time plot of marker 34 (on the tongue tip) for the utterances [aɳa], [ɪɳɪ] and [ʊɳʊ]. (MT-data)
Viseme F (f, v) In this group the differences were not as large as in the previous ones. The articulatory movement lower lip towards upper tooth does not leave much room for coarticulatory changes. In /ʊ_ʊ/-context the lower cheek markers were somewhat closer to the origin on the x-axis, the upper lip was slightly higher and the lower lip slightly lower than in the other contexts. Furthermore, all lip markers had somewhat higher z-values. The lower lip marker was closest to the upper tooth marker in /ɪ_ɪ/-context followed by /a_a/- and finally /ʊ_ʊ/-context.
10 These abnormal articulation movements that were found could be caused by the Movetrack equipment and the subject’s inability to speak unimpededly with the equipment placed on the
tongue. In the utterance with /ɖ/ the articulation sounds a bit slurred, but for /ʈ/ no articulation problems could be heard.
43
Viseme S (s) There were no great distances between /a_a/- and /ɪ_ɪ/-context, but /s/ was somewhat less rounded in /ɪ_ɪ/-context. In /ʊ_ʊ/-context the lower cheek markers were closer to the middle of the face and the distance between the middle upper and lower lips were longer and the chin was higher. All markers mentioned had higher z-coordinates. Apical movements – This phoneme did not show any changes in place of articulation according to context. Viseme J (j, ɕ) The phonemes are pronounced with a more open jaw in /a_a/-context followed by /ɪ_ɪ/-context and lastly /ʊ_ʊ/-context. In /ʊ_ʊ/-context the lower cheek markers were closer to the centre of the face, the lips were more protruded and the chin markers had higher y-coordinates.
5.3 NEW VISEMES The results in this section were based on lists of the 25 most similar phoneme pairs in the MT- and SF-data, produced by measuring the average distance from all phonemes to all other phonemes in a certain context. Only the phoneme pairs which occurred in both lists are included here. The results are be presented for one context at a time. /k_p/ - Three vowel pairs agreeing with the Synface division were found in both datasets; /ɛ: e/, /ʊ u:/ and /ɪ i:/. The similar phonemes that are not considered to belong to the same viseme in Synface are /æ: a/, /ɛ: a/, /ɛ:
æ:/, /a e/, /ɪ e:/, /ʉ̟: u:/ and /ʉ̟: ʊ/. /p_k/ - In this context /ʊ u:/ was the only pair which occurred in both sets and in the Synface partition. The following pairs were similar, but do not agree with the Synface visemes; /ɵ ʉ̟:/, /ɵ ʏ/, /o: ʊ/, /ʉ̟: ʏ/, /ʉ̟: u:/, /e ɪ/, /ɑ:
ɔ/ and /ɛ: e:/. /a_a/ - The Synface visemes that were very similar and thus made the top 25 in the MT- as well as the SF-data, were /p b/, /n t/, /n d/, /m b/, /ɕ j/, /ŋ
k/ and /g k/. Some phoneme pairs, that are not considered to belong to the same viseme in the Synface application also occured in both lists. These were /r ɖ/, /ɳ ŋ/, /l h/, /ɕ s/, /r k/ and /ɕ ʈ/. /ɪ_ɪ/- The phoneme pairs that followed the Synface partition were /p b/, /g
k/, /m p/, /n t/, /ɕ j/, /m b/, /f v/, /n d/, /h k/, /h g/ and /d t/. Only three phoneme groups that did not belong to the same viseme were present in both lists; /ɕ s/, /r d/ and /r n/.
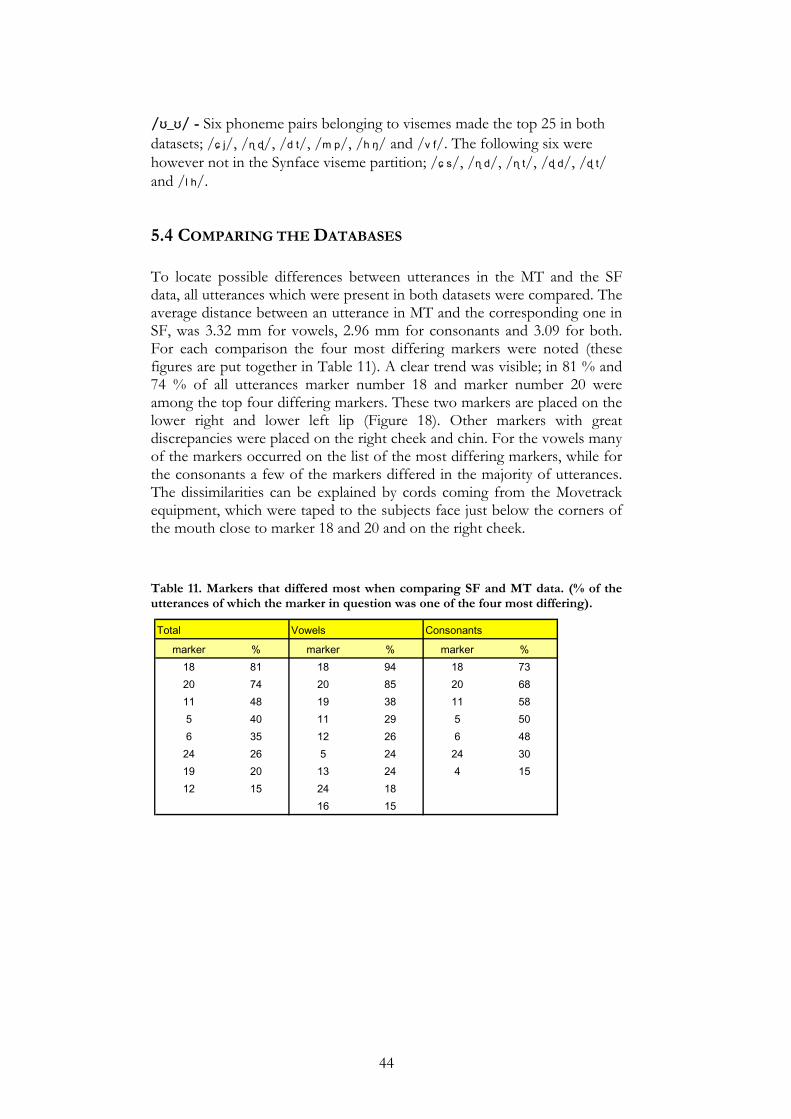
44
/ʊ_ʊ/ - Six phoneme pairs belonging to visemes made the top 25 in both datasets; /ɕ j/, /ɳ ɖ/, /d t/, /m p/, /h ŋ/ and /v f/. The following six were however not in the Synface viseme partition; /ɕ s/, /ɳ d/, /ɳ t/, /ɖ d/, /ɖ t/ and /l h/.
5.4 COMPARING THE DATABASES To locate possible differences between utterances in the MT and the SF data, all utterances which were present in both datasets were compared. The average distance between an utterance in MT and the corresponding one in SF, was 3.32 mm for vowels, 2.96 mm for consonants and 3.09 for both. For each comparison the four most differing markers were noted (these figures are put together in Table 11). A clear trend was visible; in 81 % and 74 % of all utterances marker number 18 and marker number 20 were among the top four differing markers. These two markers are placed on the lower right and lower left lip (Figure 18). Other markers with great discrepancies were placed on the right cheek and chin. For the vowels many of the markers occurred on the list of the most differing markers, while for the consonants a few of the markers differed in the majority of utterances. The dissimilarities can be explained by cords coming from the Movetrack equipment, which were taped to the subjects face just below the corners of the mouth close to marker 18 and 20 and on the right cheek. Table 11. Markers that differed most when comparing SF and MT data. (% of the utterances of which the marker in question was one of the four most differing).
Total Vowels Consonants
marker % marker % marker %18 81 18 94 18 7320 74 20 85 20 6811 48 19 38 11 585 40 11 29 5 506 35 12 26 6 48
24 26 5 24 24 3019 20 13 24 4 1512 15 24 18
16 15
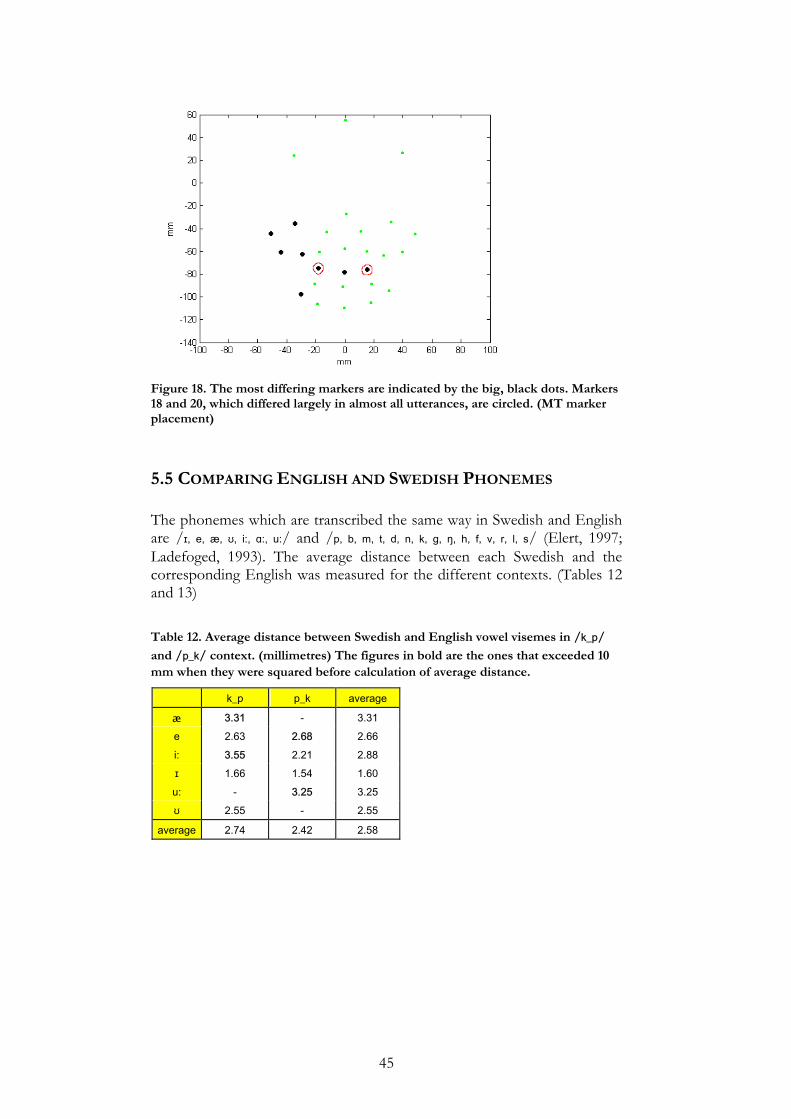
45
Figure 18. The most differing markers are indicated by the big, black dots. Markers 18 and 20, which differed largely in almost all utterances, are circled. (MT marker placement)
5.5 COMPARING ENGLISH AND SWEDISH PHONEMES The phonemes which are transcribed the same way in Swedish and English are /ɪ, e, æ, ʊ, i:, ɑ:, u:/ and /p, b, m, t, d, n, k, g, ŋ, h, f, v, r, l, s/ (Elert, 1997; Ladefoged, 1993). The average distance between each Swedish and the corresponding English was measured for the different contexts. (Tables 12 and 13) Table 12. Average distance between Swedish and English vowel visemes in /k_p/ and /p_k/ context. (millimetres) The figures in bold are the ones that exceeded 10 mm when they were squared before calculation of average distance.
k_p p_k average
æ 3.31 - 3.31
e 2.63 2.68 2.66
i: 3.55 2.21 2.88
ɪ 1.66 1.54 1.60
u: - 3.25 3.25
ʊ 2.55 - 2.55
average 2.74 2.42 2.58
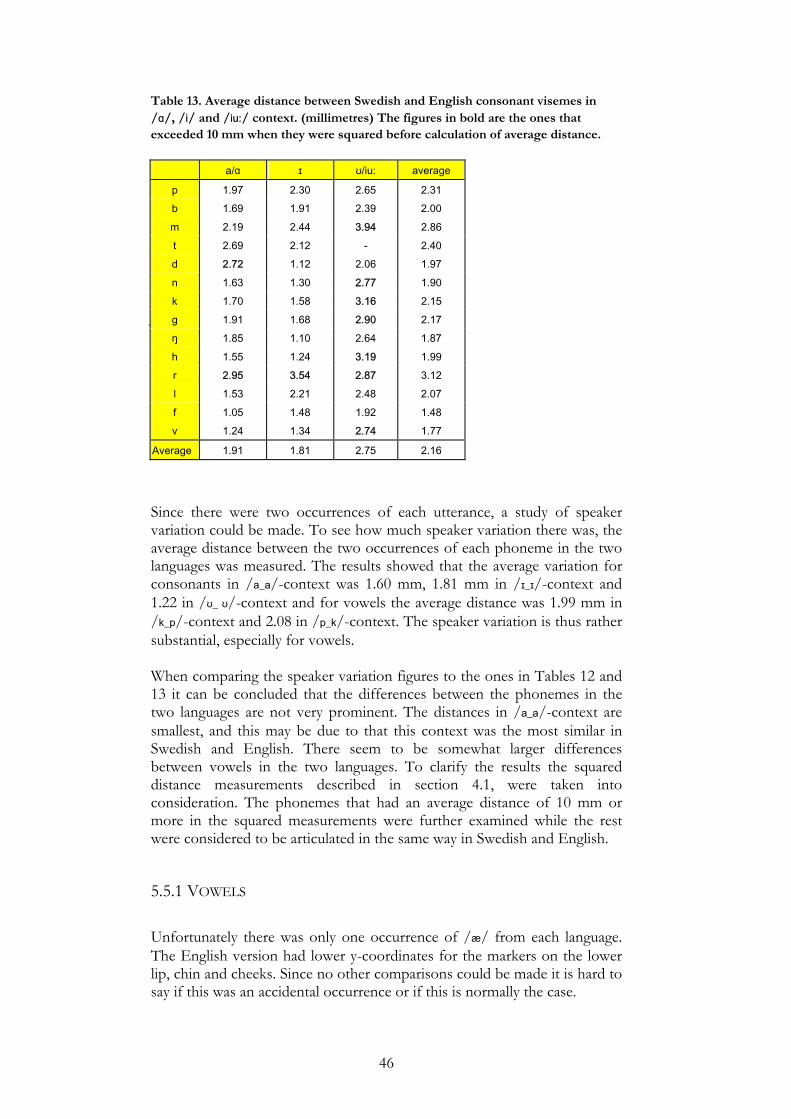
46
Table 13. Average distance between Swedish and English consonant visemes in /ɑ/, /i/ and /iu:/ context. (millimetres) The figures in bold are the ones that exceeded 10 mm when they were squared before calculation of average distance.
Since there were two occurrences of each utterance, a study of speaker variation could be made. To see how much speaker variation there was, the average distance between the two occurrences of each phoneme in the two languages was measured. The results showed that the average variation for consonants in /a_a/-context was 1.60 mm, 1.81 mm in /ɪ_ɪ/-context and 1.22 in /ʊ_ ʊ/-context and for vowels the average distance was 1.99 mm in /k_p/-context and 2.08 in /p_k/-context. The speaker variation is thus rather substantial, especially for vowels. When comparing the speaker variation figures to the ones in Tables 12 and 13 it can be concluded that the differences between the phonemes in the two languages are not very prominent. The distances in /a_a/-context are smallest, and this may be due to that this context was the most similar in Swedish and English. There seem to be somewhat larger differences between vowels in the two languages. To clarify the results the squared distance measurements described in section 4.1, were taken into consideration. The phonemes that had an average distance of 10 mm or more in the squared measurements were further examined while the rest were considered to be articulated in the same way in Swedish and English.
5.5.1 VOWELS
Unfortunately there was only one occurrence of /æ/ from each language. The English version had lower y-coordinates for the markers on the lower lip, chin and cheeks. Since no other comparisons could be made it is hard to say if this was an accidental occurrence or if this is normally the case.
a/ɑ ɪ ʊ/iu: average
p 1.97 2.30 2.65 2.31
b 1.69 1.91 2.39 2.00
m 2.19 2.44 3.94 2.86
t 2.69 2.12 - 2.40
d 2.72 1.12 2.06 1.97
n 1.63 1.30 2.77 1.90
k 1.70 1.58 3.16 2.15
g 1.91 1.68 2.90 2.17
ŋ 1.85 1.10 2.64 1.87
h 1.55 1.24 3.19 1.99
r 2.95 3.54 2.87 3.12
l 1.53 2.21 2.48 2.07
f 1.05 1.48 1.92 1.48
v 1.24 1.34 2.74 1.77
Average 1.91 1.81 2.75 2.16
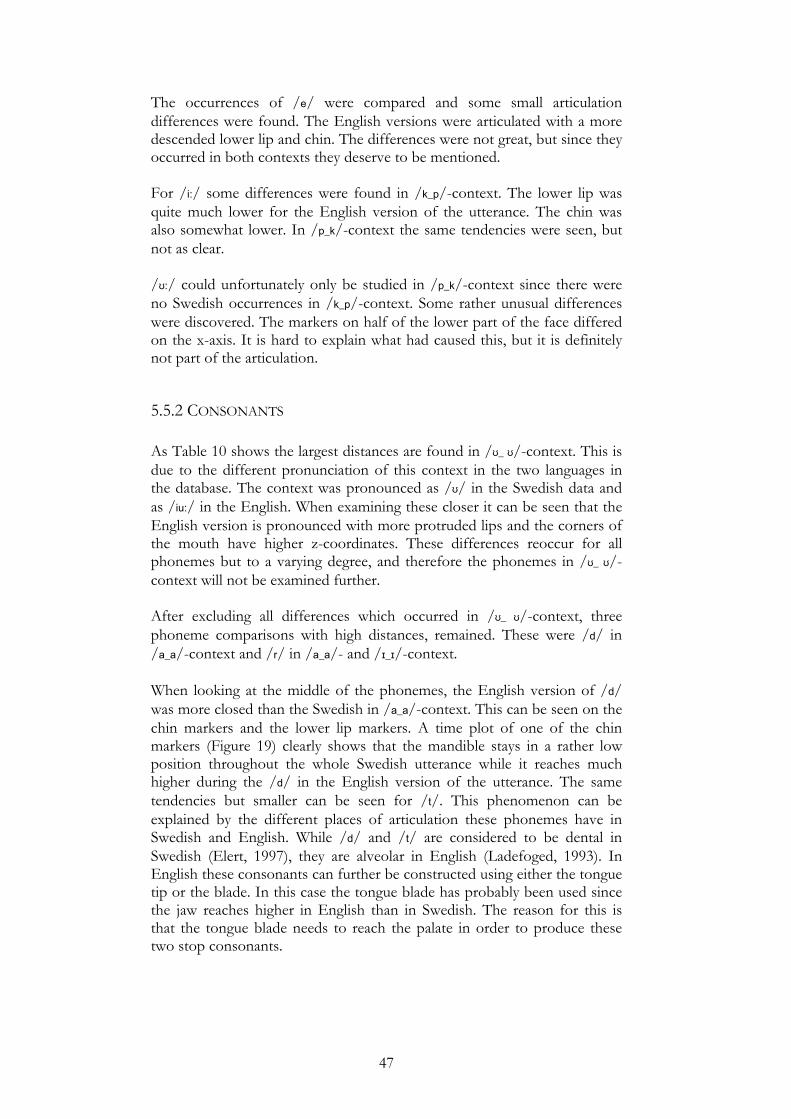
47
The occurrences of /e/ were compared and some small articulation differences were found. The English versions were articulated with a more descended lower lip and chin. The differences were not great, but since they occurred in both contexts they deserve to be mentioned. For /i:/ some differences were found in /k_p/-context. The lower lip was quite much lower for the English version of the utterance. The chin was also somewhat lower. In /p_k/-context the same tendencies were seen, but not as clear. /ʊ:/ could unfortunately only be studied in /p_k/-context since there were no Swedish occurrences in /k_p/-context. Some rather unusual differences were discovered. The markers on half of the lower part of the face differed on the x-axis. It is hard to explain what had caused this, but it is definitely not part of the articulation.
5.5.2 CONSONANTS As Table 10 shows the largest distances are found in /ʊ_ ʊ/-context. This is due to the different pronunciation of this context in the two languages in the database. The context was pronounced as /ʊ/ in the Swedish data and as /iu:/ in the English. When examining these closer it can be seen that the English version is pronounced with more protruded lips and the corners of the mouth have higher z-coordinates. These differences reoccur for all phonemes but to a varying degree, and therefore the phonemes in /ʊ_ ʊ/-context will not be examined further. After excluding all differences which occurred in /ʊ_ ʊ/-context, three phoneme comparisons with high distances, remained. These were /d/ in /a_a/-context and /r/ in /a_a/- and /ɪ_ɪ/-context. When looking at the middle of the phonemes, the English version of /d/ was more closed than the Swedish in /a_a/-context. This can be seen on the chin markers and the lower lip markers. A time plot of one of the chin markers (Figure 19) clearly shows that the mandible stays in a rather low position throughout the whole Swedish utterance while it reaches much higher during the /d/ in the English version of the utterance. The same tendencies but smaller can be seen for /t/. This phenomenon can be explained by the different places of articulation these phonemes have in Swedish and English. While /d/ and /t/ are considered to be dental in Swedish (Elert, 1997), they are alveolar in English (Ladefoged, 1993). In English these consonants can further be constructed using either the tongue tip or the blade. In this case the tongue blade has probably been used since the jaw reaches higher in English than in Swedish. The reason for this is that the tongue blade needs to reach the palate in order to produce these two stop consonants.
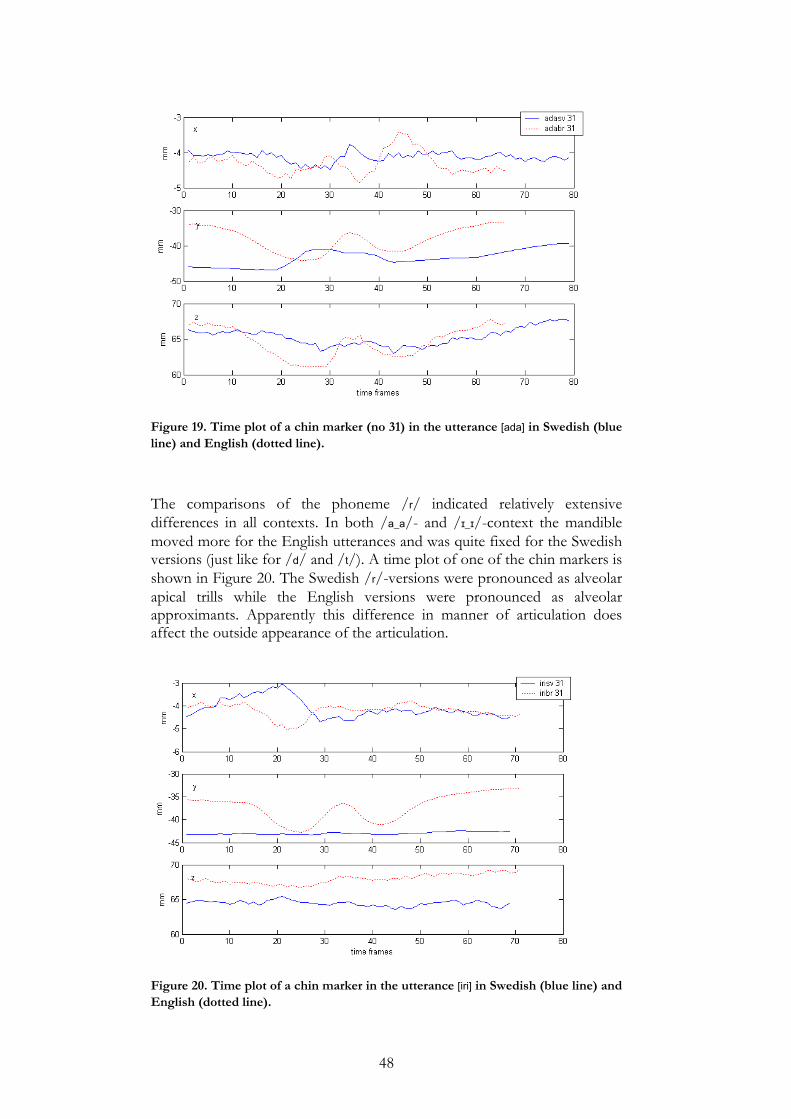
48
Figure 19. Time plot of a chin marker (no 31) in the utterance [ada] in Swedish (blue line) and English (dotted line).
The comparisons of the phoneme /r/ indicated relatively extensive differences in all contexts. In both /a_a/- and /ɪ_ɪ/-context the mandible moved more for the English utterances and was quite fixed for the Swedish versions (just like for /d/ and /t/). A time plot of one of the chin markers is shown in Figure 20. The Swedish /r/-versions were pronounced as alveolar apical trills while the English versions were pronounced as alveolar approximants. Apparently this difference in manner of articulation does affect the outside appearance of the articulation.
Figure 20. Time plot of a chin marker in the utterance [iri] in Swedish (blue line) and English (dotted line).
49
6. DISCUSSION
It has to be kept in mind that all results in this report are based on data from one person. That means that some of the observed tendencies might not be present in everybody’s speech. When using the results to improve the articulation of the Synface prototype or to improve recording techniques, this however is not a disadvantage. It is also important to remember that there were only one or two occurrences of each utterance. This makes it hard to draw any certain conclusions. The differences discovered in this study were often small and sometimes only occurred in one of the databases. Some of these small differences may very well be caused by speaker variation or small differences in the alignment procedure of the different phonemes. As was shown in section 5.5 the amount of speaker variation is rather high. Some of the differences that only occurred in one of the databases may also be due to the effect that the Movetrack equipment has on the articulation. Still most of the visemes used in Synface seem to be supported by the data. There were however, some larger differences worth mentioning. When studying phoneme duration it was noted that the long vowels were approximately twice as long as their short counterparts and regarding the consonants the voiceless ones were longer than their voiced counterparts. The study of the vowel viseme group called Ä1 showed that /ɛ:/ was more open than the other members of the group, /ɛ/ and /e/. The difference was manifested by a lower position of the chin and the lower lip. Since this was a feature that occurred in both databases it must be considered to be a stable dissimilarity, although it was not very prominent. When examining the Ä3 group it was discovered that /æ:/ was somewhat more open than /æ/. The effects were seen on the chin and on the lower lip. A similar difference to the one found for the Ä1 and Ä3 group also occurred in the Ö group. Compared to the other phonemes in the viseme group, /ø:/ is pronounced with a lower position of the lower lip and chin, i.e. it is more open. The comparison of the phonemes in the Y group showed that /y:/ was pronounced with more rounded and protruded lips than /ʏ/. From these four vowel differences it can be concluded that the features of long vowels seem to be more distinct than for short. One explanation could be that the longer pronunciation time enables the speaker to fully perform the articulatory movements. The most obvious discrepancies are found in the consonant viseme group K. When pronounced in /a_a/-context, three subgroups can be constructed; /k, g, ŋ/, /h/ and /ɧ/. /h/ is considerably more open than the others and
50
/ɧ/ is clearly the phoneme which is produced with the most closed jaw. It is not surprising that /k/, /g/ and /ŋ/ are so similar since they share place of articulation and are thus affected by the context in the same way. Since /h/ is produced as far back as in the glottis there is no reason for the jaw to close when producing the consonant between two very open vowels. The fact that /ɧ/ is pronounced with the most closed jaw was explained by the different place of articulation and type of constriction from /k/, /g/ and /ŋ/ and the difference in lip shape. When producing a /ɧ/ the lips play a more active role than for the rest of phonemes in this group. In the other contexts other differences were found, but they were considerably smaller than in /a_a/-context. Another viseme group for which some divergences were found in /a_a/-context, was R. While the jaw is raised for the consonant in the utterance /ara/ it remains low all across the utterance /ala/. When producing the lateral /l/ the tongue only needs to touch the palate one time, while to produce /r/, which is a tremulant, a larger effort is demanded and thus the jaw has to be raised. In the other contexts the jaw is higher for the vowels and the difference is less prominent. It can also be discussed if /l/ and /r/ have the same place of articulation. When studying visemes, coarticulation is an important factor. Some phonemes look very similar in one context but not in another. The phonemes seem to follow the Synface viseme partition best in /ɪ_ɪ/-context and it can be assumed that this is the context that has the least affect on articulation. The coarticulation study showed that the vowels were not particularly affected by the consonant contexts. In most cases the consonants were not considerably altered by the /a_a/- and /ɪ_ɪ/-context either, except that the /a_a/-contexts in some cases made the phoneme somewhat more rounded and open. The /ʊ_ʊ/-context had however a rather large impact on the consonants. Most differences were seen in almost all consonant groups. The lower cheek markers were sucked in between the upper and lower jaw and consequently these markers were closer to the centre of the face on the x-axis. The effects of the /ʊ_ʊ/-context were also manifested on the corners of the mouth and the adjacent lip markers which were closer to the origin on the x-axis as well. For some phonemes the chin markers were higher on the y-axis. These results are in line with the ones that Owens & Blazek obtained (described in section 2.4) which led them to construct different viseme groups for different contexts. In their division there were only two viseme groups for phonemes in /ʊ_ʊ/-context. It can also be concluded that consonants articulated in the anterior part of the mouth are less affected by coarticulation than consonants articulated in the back. In some cases phonemes belonging to the same viseme were affected in different ways or to different extents by the contexts. Regarding the comparison between the SF and MT databases, it was found that a few marker positions differed significantly and in almost all utterances. Since these markers were placed on the lower lip just where the cords from the Movetrack coils exit and on the right side of the face where the cord from the coil on the upper lip is fixed to the face with tape, it can
51
be concluded that the Movetrack equipment actually did affect articulation of the subject. The articulation in the SF recording is thus probably closer to the subject’s normal articulation.
When the phonemes were coupled based on their average distance the following was discovered. Not many of the vowel visemes from the Synface partition were found. The vowels were overall not very similar to each other. Only one vowel pair with phonemes belonging to the same viseme group was found among the similar pairs in both consonant contexts; /u: ʊ/. Another pair of vowel phonemes, which are not considered to belong to the same viseme, were found in both contexts; /ʉ̟: u:/. The consonant coupling was more in line with the Synface visemes. /ɕ j/ was the most stable, occurring in all contexts. Other stable groups were /k g/, /f v/, /p b m/ and /n d t/. One pair was among the most similar in all three contexts although the contained phonemes do not normally belong to the same viseme; /ɕ s/. It needs to be emphasised that the tongue position was not included in this study. Some of the visemes are based on tongue movements and there may also be other clues that a person observes in speechreading that are not captured here. In this case all distances have the same importance no matter in what part of the face they are. The results from the comparison between Swedish and English phonemes which are phonetically transcribed with the same symbols showed that there were generally larger differences in the articulation of vowels than in the articulation of consonants. However, the vowel differences seemed hard to pinpoint while the explanations for the consonant differences were more straightforward. The vowels for which stable differences were found were /e/ and /i:/. One drawback of the consonant material was that the rounded context was pronounced very differently in the two languages (/u/ in Swedish and /iu/ in English). This had such great coarticulatory effects that other differences were hard to observe. The consonant phonemes which were differently articulated in the two languages were mainly /d/ and /r/. The cause was different places or manners of articulation. The results showed that even differences caused by dissimilarities inside the mouth are visible on the face.
52
7. CONCLUSIONS
Most of the viseme groups used in Synface were supported by the results obtained in this study. Some dissimilarities between phonemes belonging to the same viseme were however found. The phonemes for which stable within viseme variation was found, and possibly new visemes could be constructed were /ɛ:/, /æ:/, /ø:/, /y:/ or /ʏ/, /h/, /ɧ/ and /r/ or /l/. It was further concluded that the consonant contexts used here (/k_p/ and /p_k/) did not have a prominent influence on the vowel phonemes. Regarding the vowel contexts, /ɪ_ɪ/- and /a_a/-context had minor effects on the consonants while /ʊ_ʊ/-context gave rise to greater coarticulatory influences. In some cases the phonemes in a viseme group were changed differently by a context. It was also found that the equipment used to record tongue movements did influence the articulation of the subject. Some differences between the Swedish and English phonemes, which are phonetically transcribed in the same way, were further discovered.
7.1 FUTURE WORK AND RECOMMENDATIONS FOR SYNFACE Although the results from this thesis contribute to the knowledge of Swedish visemes and their articulation, they still leave much to be done. These studies need to be made using a more extensive speech material to be able to pinpoint the stable differences and disregard dissimilarities caused by speaker variation. It would also be interesting to study if the tendencies found here apply to all speakers. Therefore data with a number of subjects should be used. In this project only very short utterances were investigated. A suggestion for future work would be to study longer words as well as phrases and sentences. One drawback of the comparison between Swedish and English phonemes was that there were no recordings of tongue movements. Since the most important differences are caused by dissimilarities inside the mouth, it is suggested that this is studied in the future to confirm or reject the assumptions made in this thesis. A recommendation for future work within the Synface project is to take the results from this study in consideration and test them on the Synface prototype by manipulating the parameters accordingly. Recognition tests could be performed with new parameter settings. The articulation can even be exaggerated to see if there is an increase in intelligibility. Some of the visemes groups could perhaps be changed and new groups could be constructed.

53
8. ACKNOWLEDGEMENTS
I would like to thank my supervisor, Björn Granström, for feedback and support throughout this project. Thanks also to Jonas Beskow for answering all my questions regarding the data and to Magnus Nordstrand and Gunilla Svanfeldt for all your help with the recording and processing of the bilingual database.
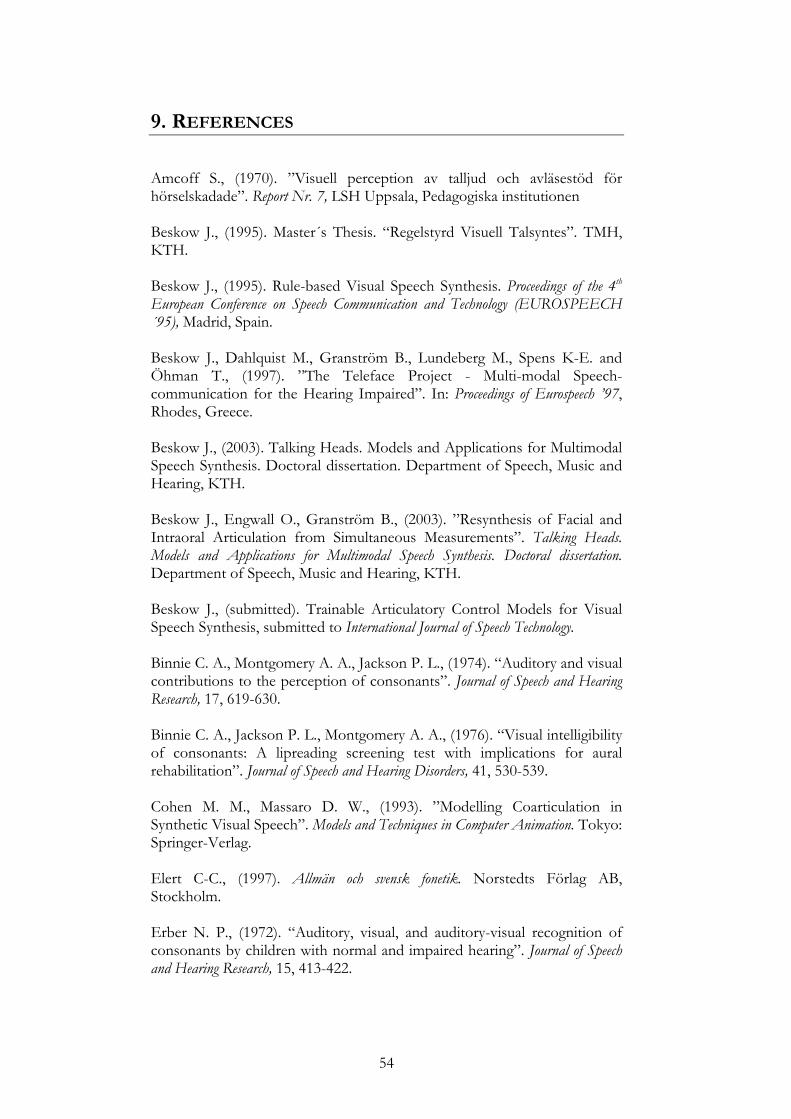
54
9. REFERENCES
Amcoff S., (1970). ”Visuell perception av talljud och avläsestöd för hörselskadade”. Report Nr. 7, LSH Uppsala, Pedagogiska institutionen Beskow J., (1995). Master´s Thesis. “Regelstyrd Visuell Talsyntes”. TMH, KTH. Beskow J., (1995). Rule-based Visual Speech Synthesis. Proceedings of the 4th European Conference on Speech Communication and Technology (EUROSPEECH ´95), Madrid, Spain. Beskow J., Dahlquist M., Granström B., Lundeberg M., Spens K-E. and Öhman T., (1997). ”The Teleface Project - Multi-modal Speech-communication for the Hearing Impaired”. In: Proceedings of Eurospeech ’97, Rhodes, Greece. Beskow J., (2003). Talking Heads. Models and Applications for Multimodal Speech Synthesis. Doctoral dissertation. Department of Speech, Music and Hearing, KTH. Beskow J., Engwall O., Granström B., (2003). ”Resynthesis of Facial and Intraoral Articulation from Simultaneous Measurements”. Talking Heads. Models and Applications for Multimodal Speech Synthesis. Doctoral dissertation. Department of Speech, Music and Hearing, KTH. Beskow J., (submitted). Trainable Articulatory Control Models for Visual Speech Synthesis, submitted to International Journal of Speech Technology. Binnie C. A., Montgomery A. A., Jackson P. L., (1974). “Auditory and visual contributions to the perception of consonants”. Journal of Speech and Hearing Research, 17, 619-630. Binnie C. A., Jackson P. L., Montgomery A. A., (1976). “Visual intelligibility of consonants: A lipreading screening test with implications for aural rehabilitation”. Journal of Speech and Hearing Disorders, 41, 530-539. Cohen M. M., Massaro D. W., (1993). ”Modelling Coarticulation in Synthetic Visual Speech”. Models and Techniques in Computer Animation. Tokyo: Springer-Verlag. Elert C-C., (1997). Allmän och svensk fonetik. Norstedts Förlag AB, Stockholm. Erber N. P., (1972). “Auditory, visual, and auditory-visual recognition of consonants by children with normal and impaired hearing”. Journal of Speech and Hearing Research, 15, 413-422.
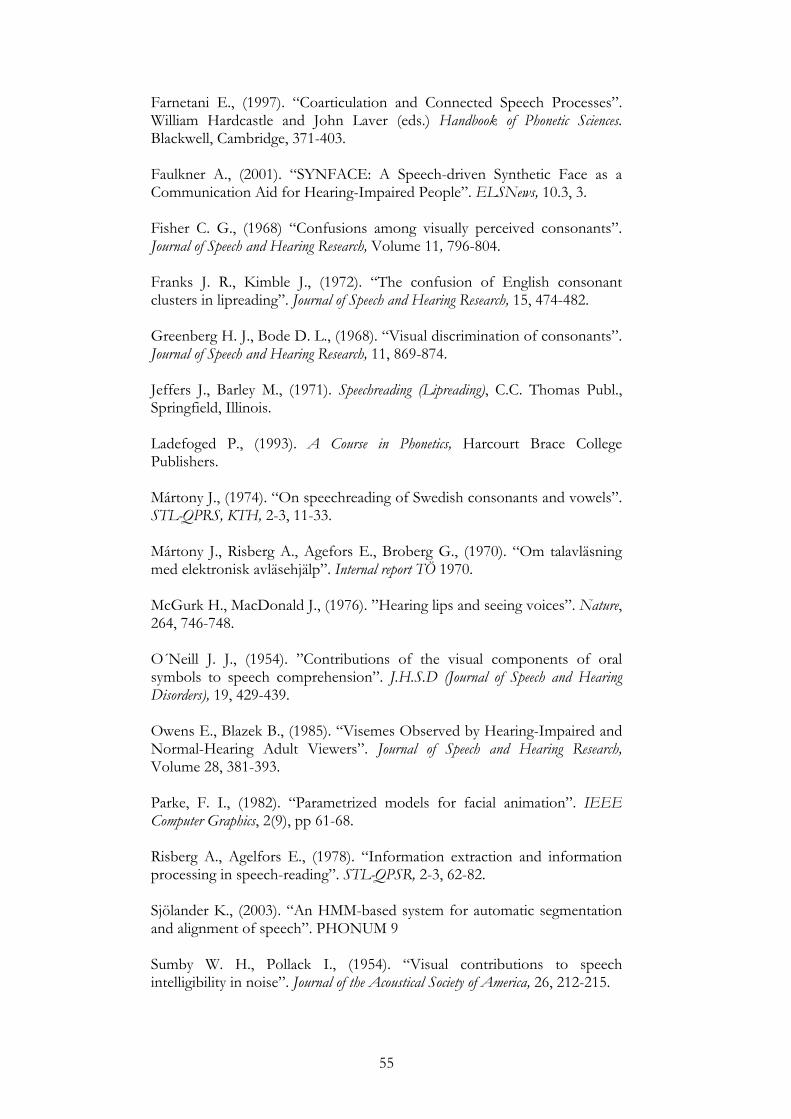
55
Farnetani E., (1997). “Coarticulation and Connected Speech Processes”. William Hardcastle and John Laver (eds.) Handbook of Phonetic Sciences. Blackwell, Cambridge, 371-403. Faulkner A., (2001). “SYNFACE: A Speech-driven Synthetic Face as a Communication Aid for Hearing-Impaired People”. ELSNews, 10.3, 3. Fisher C. G., (1968) “Confusions among visually perceived consonants”. Journal of Speech and Hearing Research, Volume 11, 796-804. Franks J. R., Kimble J., (1972). “The confusion of English consonant clusters in lipreading”. Journal of Speech and Hearing Research, 15, 474-482. Greenberg H. J., Bode D. L., (1968). “Visual discrimination of consonants”. Journal of Speech and Hearing Research, 11, 869-874. Jeffers J., Barley M., (1971). Speechreading (Lipreading), C.C. Thomas Publ., Springfield, Illinois. Ladefoged P., (1993). A Course in Phonetics, Harcourt Brace College Publishers. Mártony J., (1974). “On speechreading of Swedish consonants and vowels”. STL-QPRS, KTH, 2-3, 11-33. Mártony J., Risberg A., Agefors E., Broberg G., (1970). “Om talavläsning med elektronisk avläsehjälp”. Internal report TÖ 1970.
McGurk H., MacDonald J., (1976). ”Hearing lips and seeing voices”. Nature, 264, 746-748. O´Neill J. J., (1954). ”Contributions of the visual components of oral symbols to speech comprehension”. J.H.S.D (Journal of Speech and Hearing Disorders), 19, 429-439. Owens E., Blazek B., (1985). “Visemes Observed by Hearing-Impaired and Normal-Hearing Adult Viewers”. Journal of Speech and Hearing Research, Volume 28, 381-393. Parke, F. I., (1982). “Parametrized models for facial animation”. IEEE Computer Graphics, 2(9), pp 61-68.
Risberg A., Agelfors E., (1978). “Information extraction and information processing in speech-reading”. STL-QPSR, 2-3, 62-82. Sjölander K., (2003). “An HMM-based system for automatic segmentation and alignment of speech”. PHONUM 9 Sumby W. H., Pollack I., (1954). “Visual contributions to speech intelligibility in noise”. Journal of the Acoustical Society of America, 26, 212-215.

56
Woodward M. F., Barber C. G., (1960). “Phoneme perception in lipreading”. Journal of Speech and Hearing Research, 3, 212-222. Öhman T., (1998). “An audio-visual speech database and automatic measurements of visual speech”. TMH-QPSR, Vol 1-2. MATLAB: www.mathworks.com The Qualisys system: www.qualisys.se
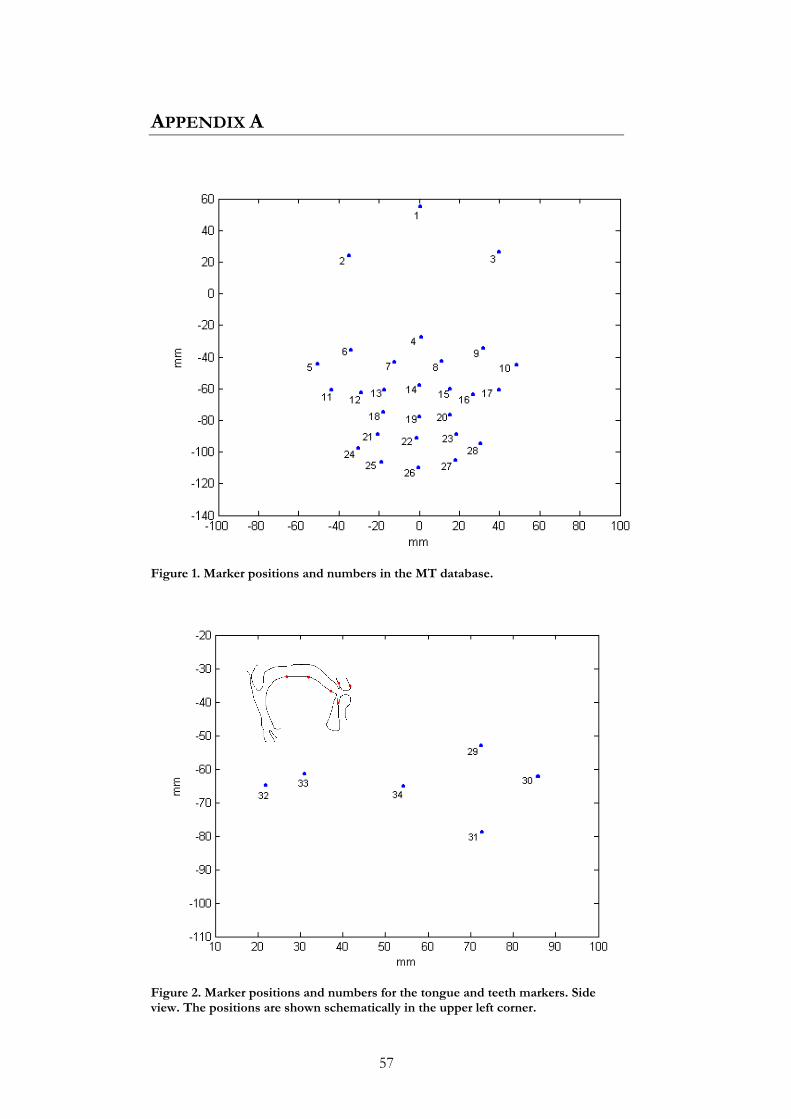
57
APPENDIX A
Figure 1. Marker positions and numbers in the MT database.
Figure 2. Marker positions and numbers for the tongue and teeth markers. Side view. The positions are shown schematically in the upper left corner.
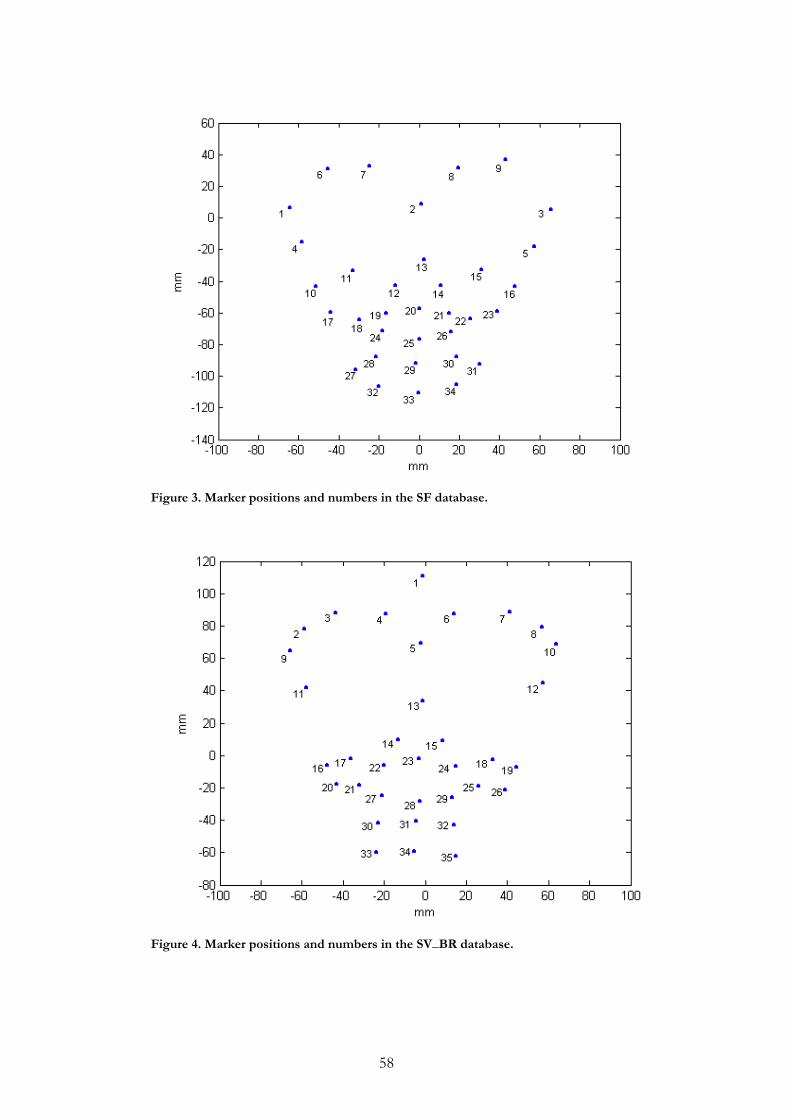
58
Figure 3. Marker positions and numbers in the SF database.
Figure 4. Marker positions and numbers in the SV_BR database.