Embed Size (px)
Citation preview

CHILLED WATER SYSTEMSFOR THE 21ST CENTURY
Ed Tinsley, PEAnnual ASHE Conference
Nashville, Tennessee

CHILLED WATER SYSTEMSFOR THE REAL WORLD
21st CENTURY
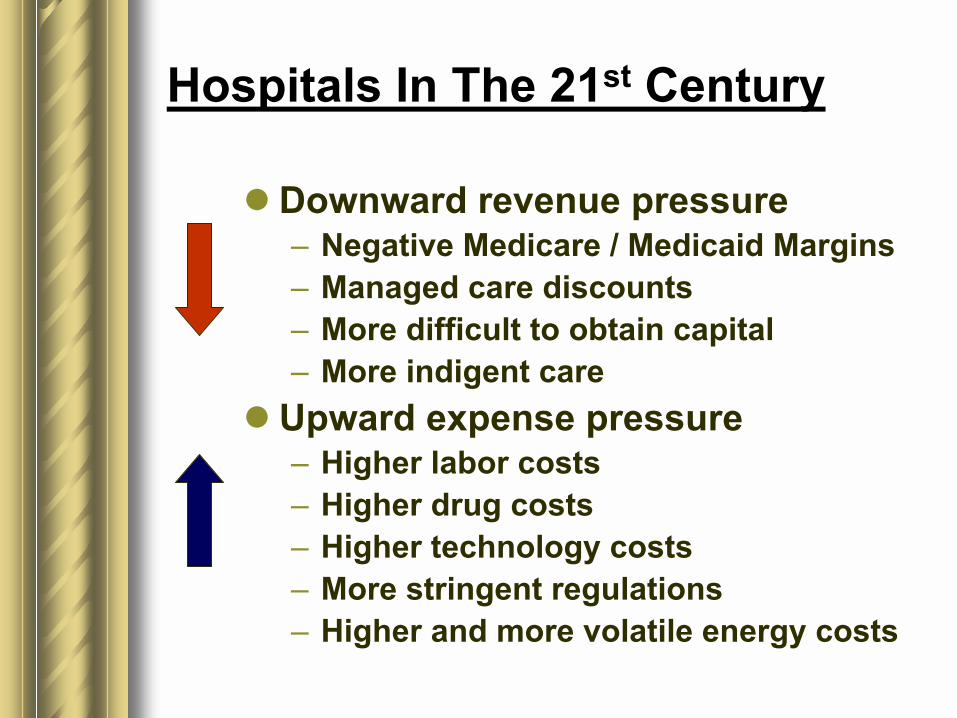
Hospitals In The 21st Century
! Downward revenue pressure� Negative Medicare / Medicaid Margins� Managed care discounts� More difficult to obtain capital� More indigent care
! Upward expense pressure� Higher labor costs� Higher drug costs� Higher technology costs� More stringent regulations� Higher and more volatile energy costs
Where Does This Leave You?

Hospital Engineer�s Challenge
! Stretch the capacity of existing equipment and distribution systems to serve new loads
! Increase infrastructure and utility system reliability
! Reduce maintenance costs, utility costs, and construction costs
�Do More With Less�
Session Goals
! Increase chilled water system reliability
! Increase chilled water system distribution capacity
! Increase equipment capacity! Increase chilled water system
efficiency

Hospital Energy Use
Other 60%
CHW System 40%

Chilled Water System Energy Use
1970�s Today
Pumps 18%
Water Chiller 73%
Pumps 26%
Tower 16%
Water Chiller 58%
Tower 9%

Centrifugal Chiller Performance History
0.40
0.50
0.60
0.70
0.80
0.90
1970 1975 1980 1985 1990 1995 2000
Year
kW/T
on
Chiller Efficiency
! Theoretical efficiency� Refrigerant (HCFC-123, HFC-134a, etc.)� Heat transfer surface area (approach
temperatures)! Compressor efficiency
� Refrigerant lift� Compressor speed
! Drive efficiency� Motor� Gear box
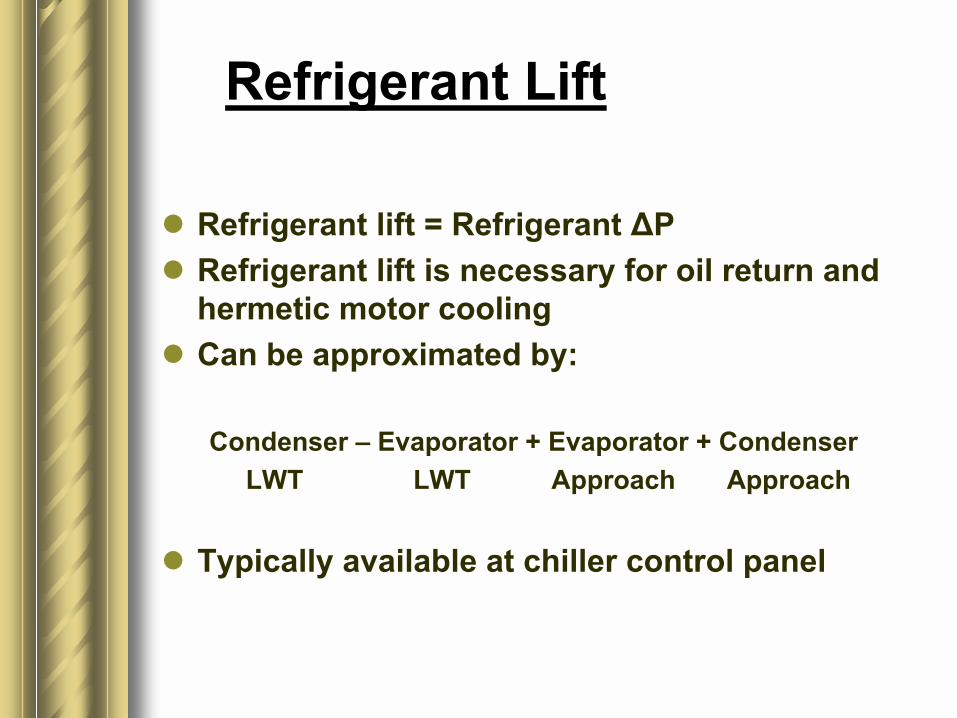
Refrigerant Lift
! Refrigerant lift = Refrigerant ∆P! Refrigerant lift is necessary for oil return and
hermetic motor cooling! Can be approximated by:
Condenser � Evaporator + Evaporator + CondenserLWT LWT Approach Approach
! Typically available at chiller control panel
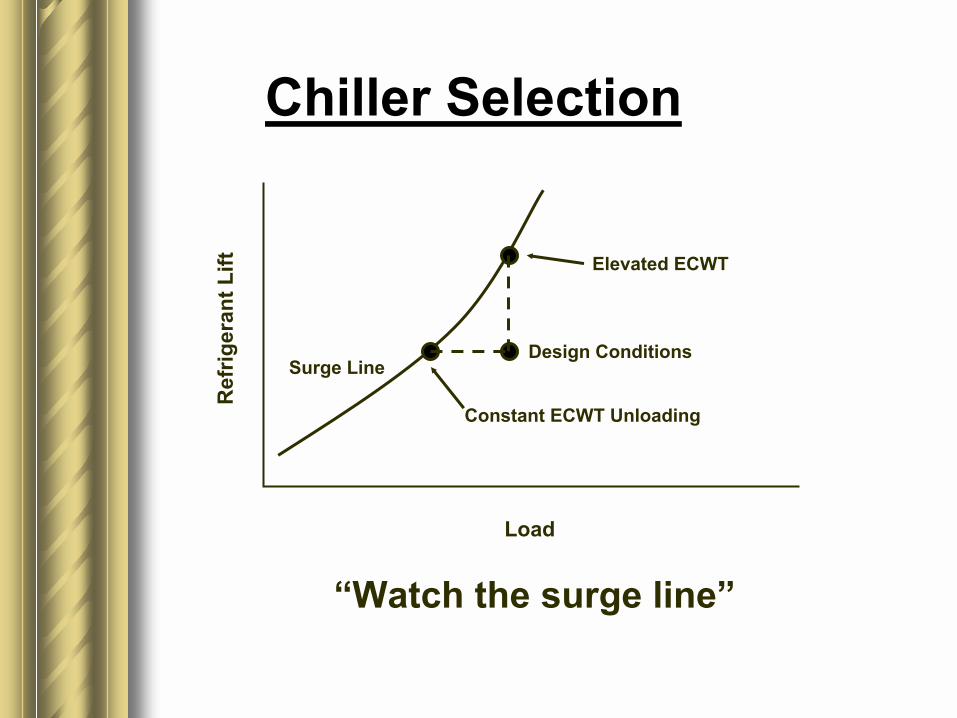
Chiller Selection
Ref
riger
ant L
ift
Load
Elevated ECWT
Design Conditions
Constant ECWT Unloading
Surge Line
�Watch the surge line�
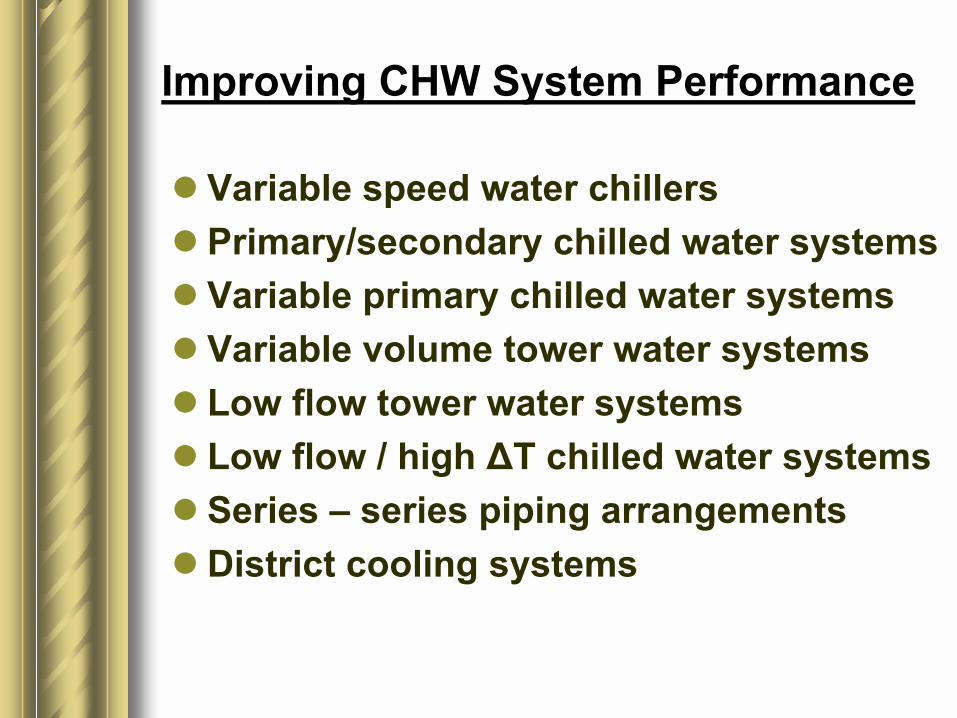
Improving CHW System Performance
! Variable speed water chillers! Primary/secondary chilled water systems! Variable primary chilled water systems! Variable volume tower water systems! Low flow tower water systems! Low flow / high ∆T chilled water systems! Series � series piping arrangements! District cooling systems
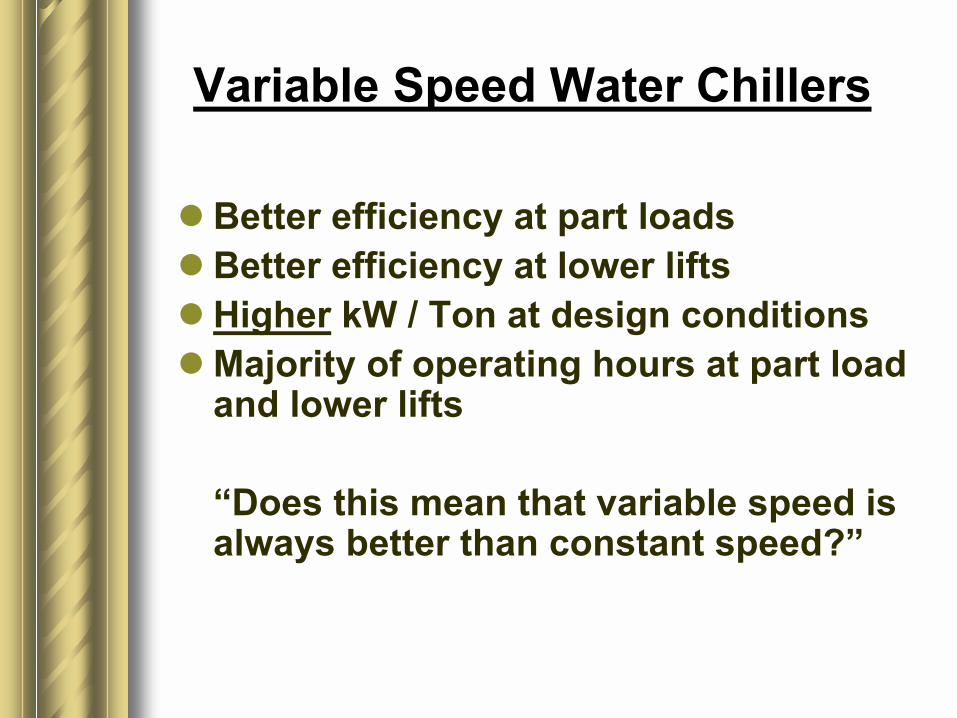
Variable Speed Water Chillers
! Better efficiency at part loads! Better efficiency at lower lifts! Higher kW / Ton at design conditions! Majority of operating hours at part load
and lower lifts
�Does this mean that variable speed is always better than constant speed?�

Variable Speed Case Study
! Average load is 1,000 tons! Average variable speed chiller efficiency is 0.5
kW / Ton! Average constant speed chiller efficiency is 0.6
kW / Ton! Average electricity unit cost is $ 0.10 / kWh! Variable speed savings:
1,000 x 8,760 x (0.6 � 0.5) x 0.10 = $87,600! What is wrong with this picture?
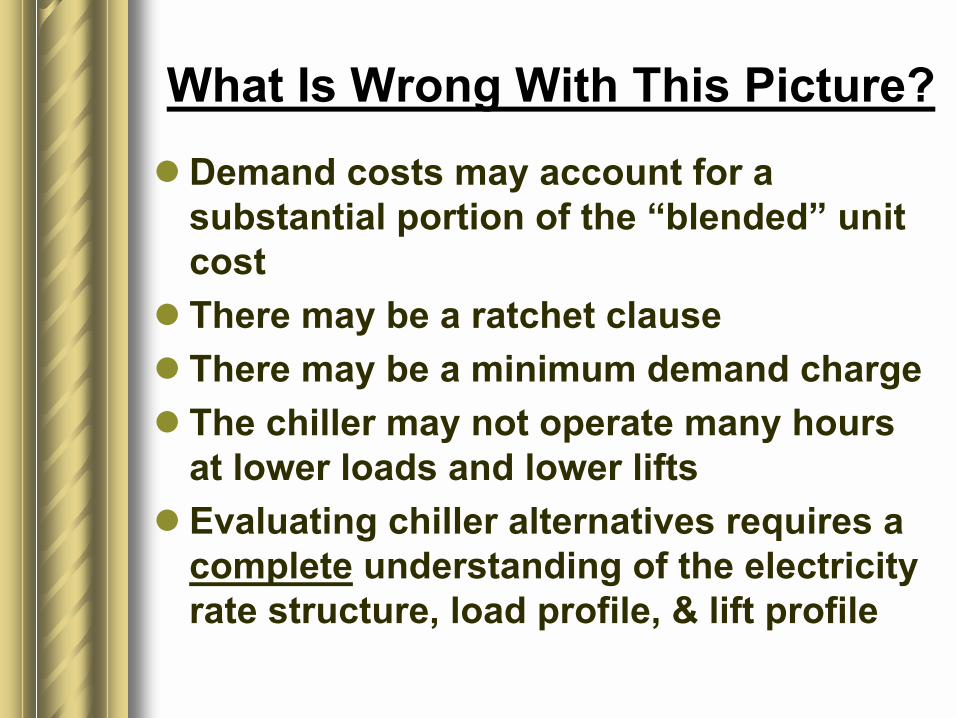
What Is Wrong With This Picture?! Demand costs may account for a
substantial portion of the �blended� unit cost
! There may be a ratchet clause! There may be a minimum demand charge! The chiller may not operate many hours
at lower loads and lower lifts! Evaluating chiller alternatives requires a
complete understanding of the electricity rate structure, load profile, & lift profile
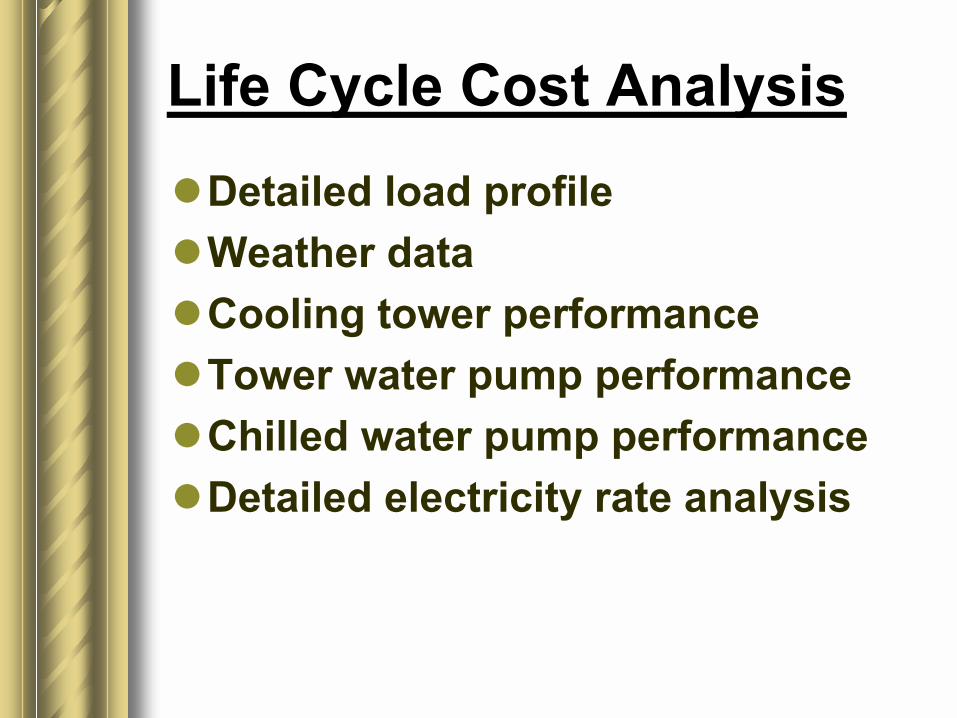
Life Cycle Cost Analysis!Detailed load profile!Weather data!Cooling tower performance!Tower water pump performance!Chilled water pump performance!Detailed electricity rate analysis

The Big Picture
Energy Costs
Chiller Costs
Installation Costs
Maintenance Costs
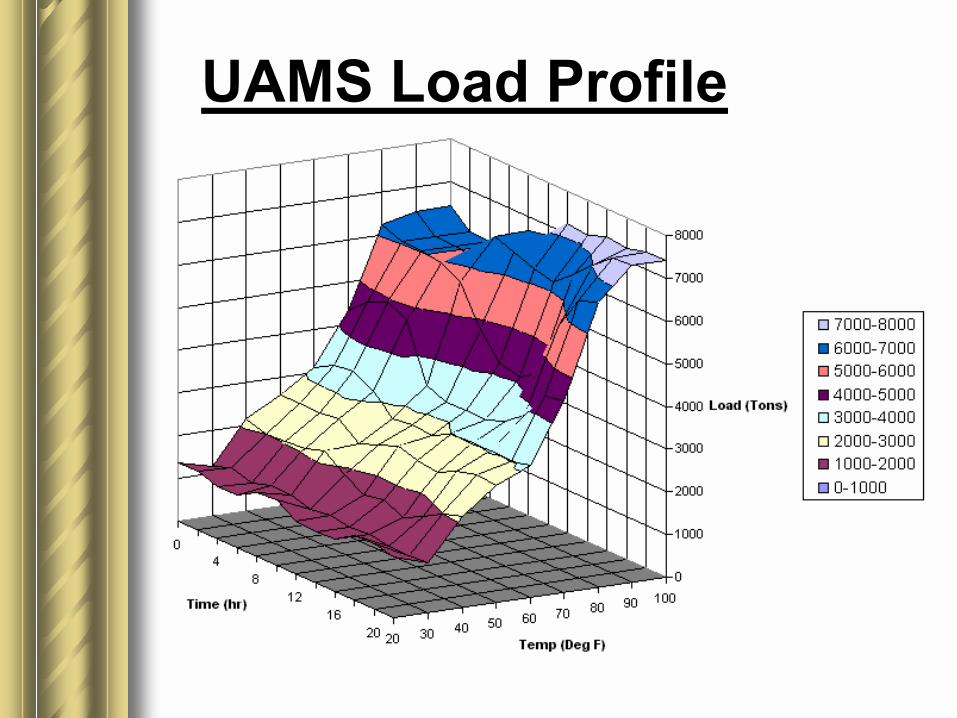
UAMS Load Profile

UAF Southwest Plant
0
500
1,000
1,500
2,000
2,500
35 45 55 65 75 85 95 105
Outside Air Temperature
Chill
er P
lant
Dem
and
(kW
)
Variable Speed Chillers
Constant Speed Chillers
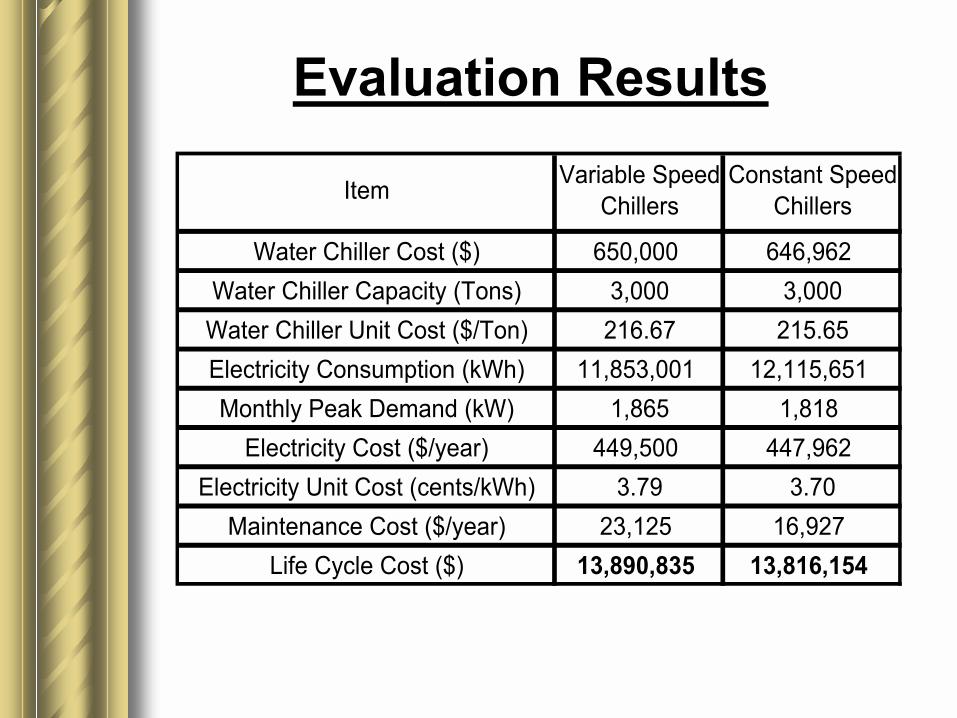
Evaluation Results
Water Chiller Cost ($) 650,000 646,962Water Chiller Capacity (Tons) 3,000 3,000
Water Chiller Unit Cost ($/Ton) 216.67 215.65Electricity Consumption (kWh) 11,853,001 12,115,651Monthly Peak Demand (kW) 1,865 1,818
Electricity Cost ($/year) 449,500 447,962Electricity Unit Cost (cents/kWh) 3.79 3.70
Maintenance Cost ($/year) 23,125 16,927Life Cycle Cost ($) 13,890,835 13,816,154
Item Variable Speed Chillers
Constant Speed Chillers

Types of Chilled Water Systems
! Constant volume! Primary/secondary! Variable primary! Parallel arrangements! Series arrangements
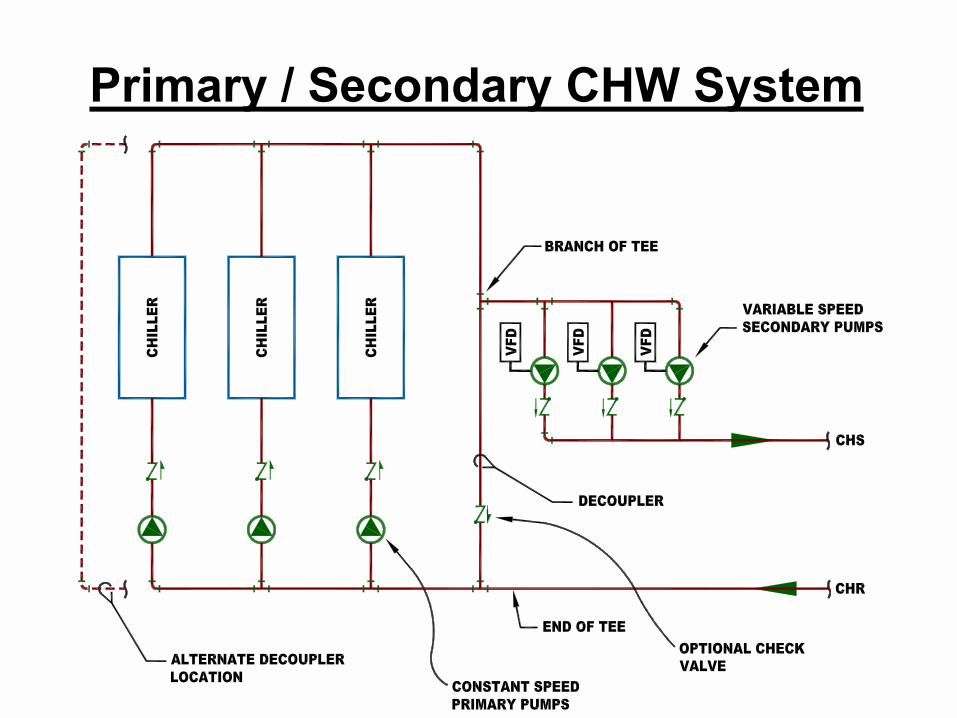
Primary / Secondary CHW System

Primary / Secondary Advantages
! Primary and secondary circuits are �decoupled�� Relatively constant evaporator flow rates� Variable volume secondary
! Improved energy efficiency� Reduces direct pumping costs� Reduces indirect pumping costs
! Avoids mixing problems associated with parallel connected chillers in constant volume systems

Primary / Secondary Disadvantages
! Chiller operation depends on single CHW pump
! Increased CHW supply temps due to negative decoupler (from return to supply) mixing
! Decreased CHW chiller return temps due to positive decoupler (from supply to return) mixing
! Wasted energy caused by decoupler flow ! Maintenance for 2 sets of CHW pumps! Floor space for 2 sets of CHW pumps! Capital cost for 2 sets of CHW pumps

Decoupler Flows Waste Energy
! Direct Effect� BHP = GPM x Head = 1,000 x 60 = 20.2
3,960 x PE 3,960 x 75%� KW = BHP x 0.746 = 20.2 x 0.746 = 16.8
ME 90%
! Indirect Effect� Tons = BHP x 0.212 = 20.2 x 0.212 = 4.3� KW = Tons x CE = 4.3 x 0.75 = 3.2
! Total� KW = 16.8 + 3.2 = 20� Energy Cost = 20 KW x 8,760 Hrs x 0.06 = $10,512 / year

Variable Primary CHW System

Variable Primary Sequence of Operation
! Isolation valve opens when chiller is started

Variable Primary Sequence of Operation
!Pumps sequenced based on flow and head
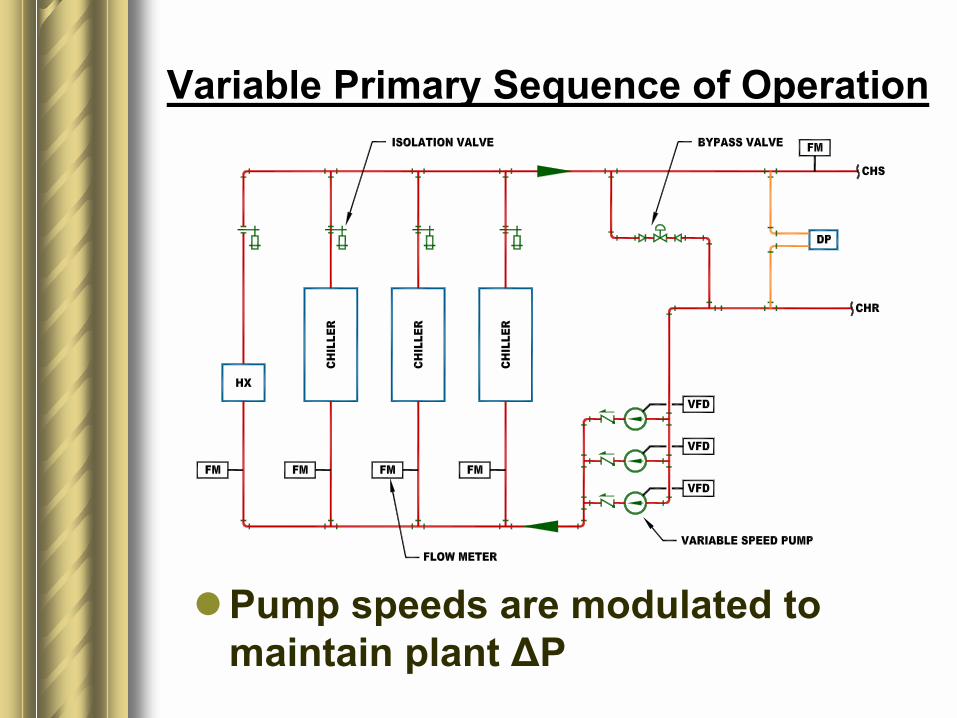
Variable Primary Sequence of Operation
!Pump speeds are modulated to maintain plant ∆P

Variable Primary Sequence of Operation
!Bypass valve prevents low evaporator flow

Typical Building
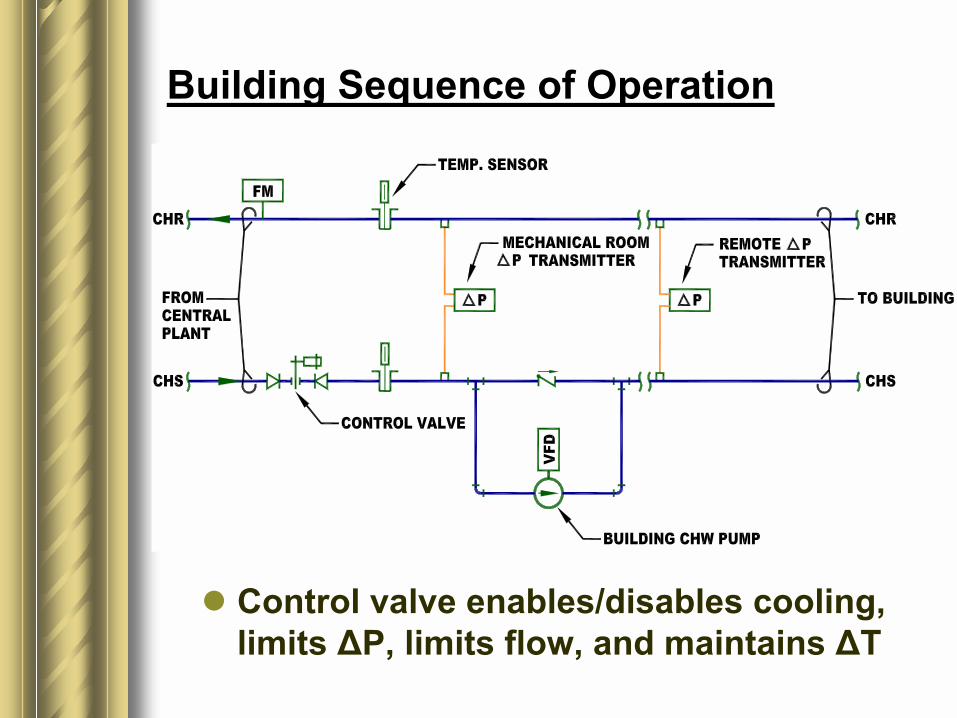
Building Sequence of Operation
! Control valve enables/disables cooling, limits ∆P, limits flow, and maintains ∆T
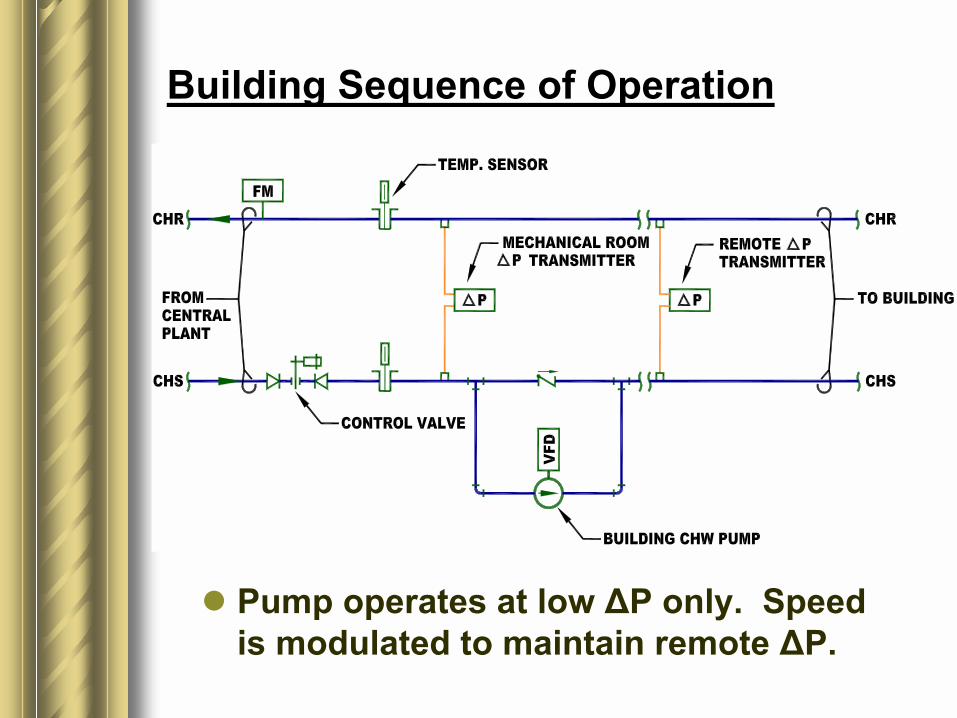
Building Sequence of Operation
! Pump operates at low ∆P only. Speed is modulated to maintain remote ∆P.
Variable Primary Advantages
! Automatic redundant CHW pump! No decoupler and no mixing! No wasted pumping energy! Maintenance for only 1 set of pumps! Floor space for only 1 set of pumps! Capital cost for only 1 set of pumps! Lower installation costs

Variable Primary Disadvantages
! Control sequence depends on flow meters
! More complicated with different size chillers
! Foreign to chiller service personnel! Bypass valve selection is critical

Typical Tower Water System!Most tower water systems are
constant volume!Each chiller is connected to a
pump and a tower!Bypass piping and manual valves!Some method of low temperature
control� Tower bypass valve� Tower fan control� Head pressure valve

Variable Volume Tower Water System
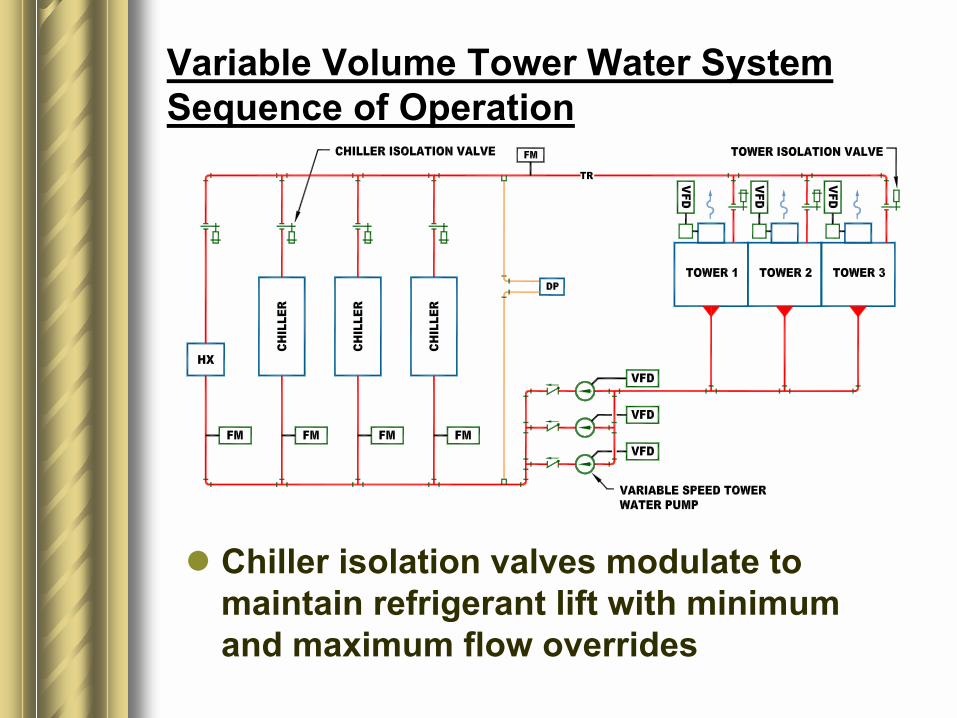
Variable Volume Tower Water System Sequence of Operation
! Chiller isolation valves modulate to maintain refrigerant lift with minimum and maximum flow overrides
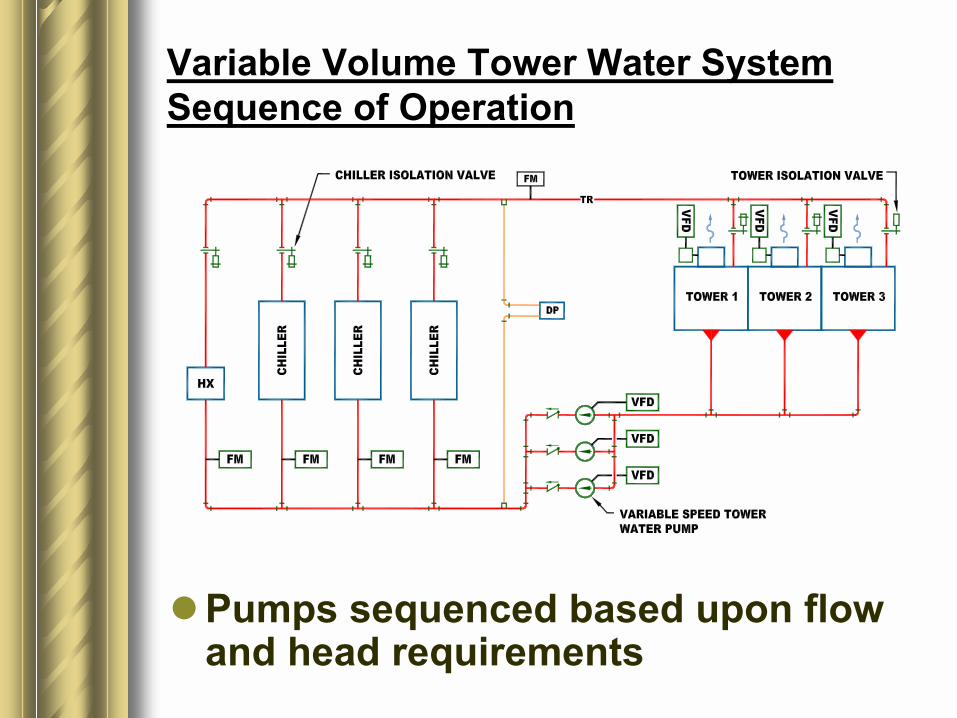
Variable Volume Tower Water System Sequence of Operation
!Pumps sequenced based upon flow and head requirements

Variable Volume Tower Water System Sequence of Operation
! Pump speeds modulated to maintain ∆P. Setpoint is reset based on valve positions.
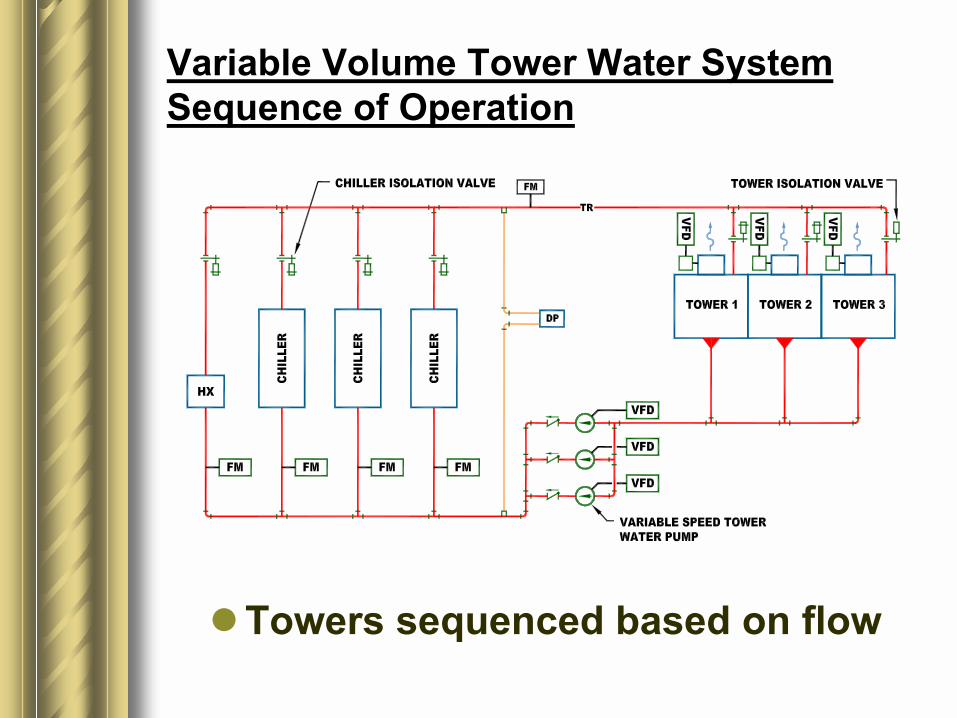
Variable Volume Tower Water System Sequence of Operation
!Towers sequenced based on flow
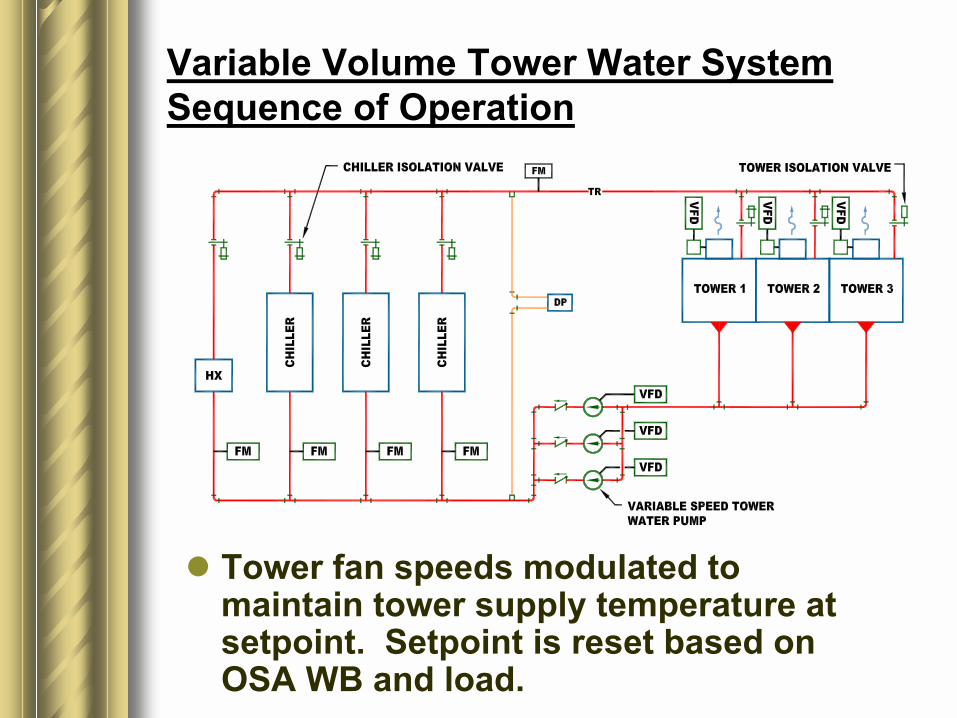
Variable Volume Tower Water System Sequence of Operation
! Tower fan speeds modulated to maintain tower supply temperature at setpoint. Setpoint is reset based on OSA WB and load.
Variable Volume TW System Advantages
! Automatic redundant pump! Flexibility (any chiller with any pump
with any tower)! Lower cost (less piping)! No tower bypass valve! Simultaneous chiller and HX operation! Lower energy costs

Low Flow Tower Water System
Tower Fan
Condenser Pump
Chiller
1.5 2.0 2.5 3.0
100,000
0
200,000
300,000
400,000
500,000
600,000
Condenser Flow Rate, GPM/Ton
Ener
gy C
onsu
mpt
ion,
kW
h
Low Flow / High ∆T CHW Systems
!Effect of ∆T on CHW capacity!CHW coil performance!Causes of low ∆T!Real system performance!Correcting low ∆T

Distribution System Capacity
02,0004,0006,0008,000
10,00012,000
6 8 10 12 14 16 18 20Nom inal Pipe Size (in)
Flow
Cap
acity
(gpm
)
Flow Rate @10 FPS
Flow Rate @12 FPS
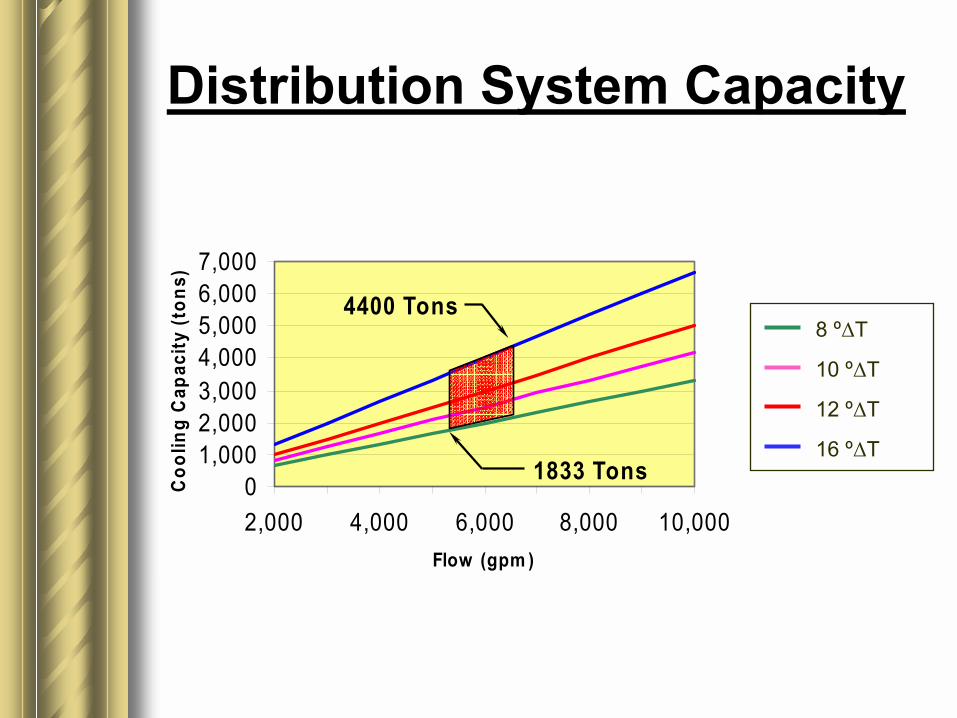
Distribution System Capacity
01,0002,0003,0004,0005,0006,0007,000
2,000 4,000 6,000 8,000 10,000Flow (gpm )
Coo
ling
Cap
acity
(ton
s)
1833 Tons
4400 Tons8 º∆T
10 º∆T
12 º∆T
16 º∆T

CHW Coil Performance
!Converting to low flow / high ∆T by reducing the CHW supply temperature
!Reduced face velocity (VAV)!Higher leaving air temperature
(single zone)

Standard Coil Performance
35
40
45
50
55
60
65
70
75
80
85
1 2
Location
Tem
pera
ture
(ºF) EAT
Air Side
Water Side
dq
LWT1
EWT1
LATQ

High ∆T Coil Performance
35
40
45
50
55
60
65
70
75
80
85
1 2
Location
Tem
pera
ture
(ºF)
EAT
Air Side
Water Side
LWT2
EWT1
LAT
EWT2
LWT1

Reduced CHW Supply Temperature
53
54
55
56
57
45 44 43 42 41 40Entering Water Temperature (F)
Leav
ing
Wat
er T
emp
(F)
Trane LWTCarrier LWTYork LWT
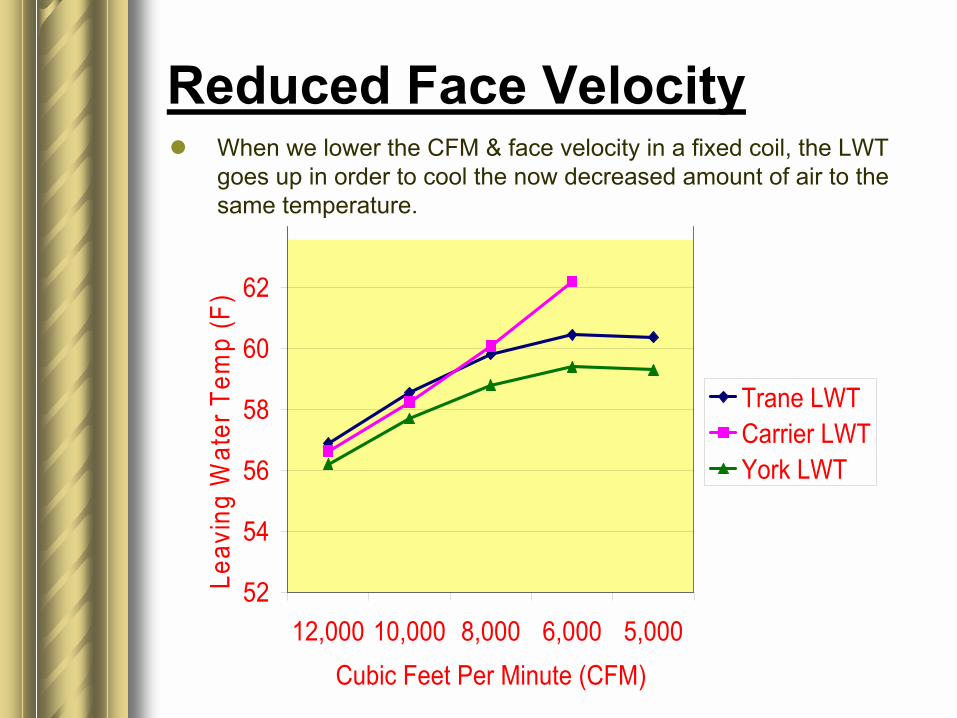
Reduced Face Velocity! When we lower the CFM & face velocity in a fixed coil, the LWT
goes up in order to cool the now decreased amount of air to the same temperature.
52
54
56
58
60
62
12,000 10,000 8,000 6,000 5,000Cubic Feet Per Minute (CFM)
Leav
ing
Wat
er T
emp
(F)
Trane LWTCarrier LWTYork LWT

Higher Leaving Air Temperature! When we increase the leaving air dry bulb temperature in a
fixed coil, the LWT goes up in order to cool the same volume of air to a higher temperature.
53545556575859606162
54 55 56 57 58Leaving Air Dry Bulb (F)
Leav
ing
Wat
er T
emp
(F)
Trane LWTCarrier LWTYork LWT
Coil Theory vs. Real Life
!Coil theory tells us reducing the load on a CHW coil should increase the CHW return temperature and the ∆T
!What happens in real life?

Real Life (UAMS) ∆T Profile
Load (Tons)
∆T (º
F)14
12
10
8
6
4
2
0
0 1000 2000 3000 4000 5000 6000 7000 8000

Wild Coils!�Wild coils� are the reason why flow
and ∆T do not react to lower supply water temperatures and reduced loads as expected
!A �wild coil� is a coil where flow is not controlled
!Flow in a �wild coil� depends on the available ∆P only and is not a function of load
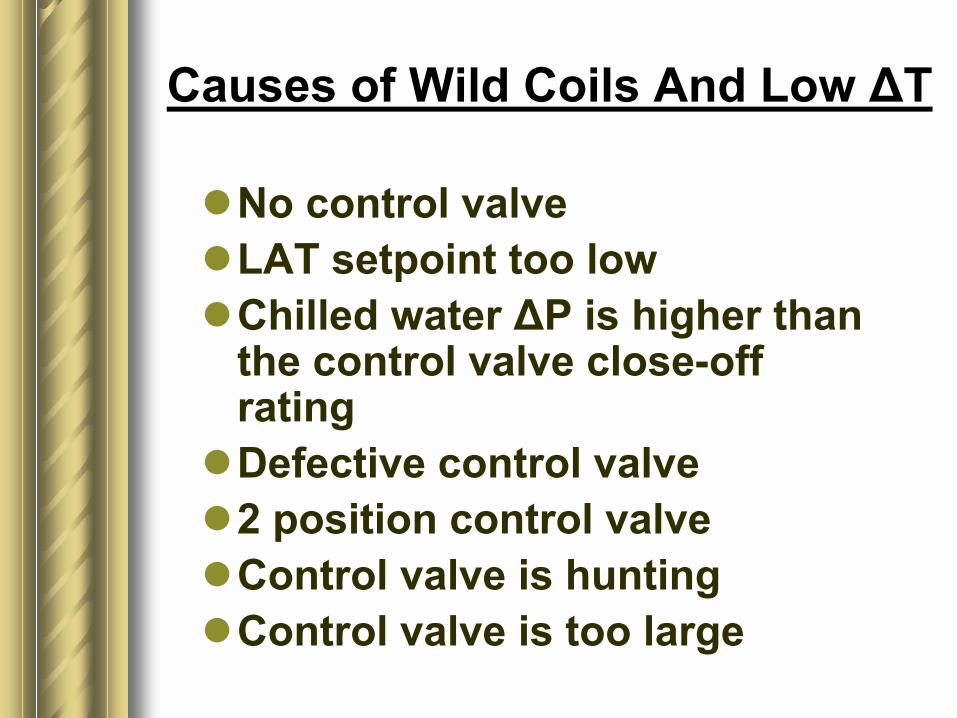
Causes of Wild Coils And Low ∆T
!No control valve!LAT setpoint too low!Chilled water ∆P is higher than
the control valve close-off rating
!Defective control valve!2 position control valve!Control valve is hunting!Control valve is too large

Causes of Wild Coils And Low ∆T
!Chilled water supply temperature is too high
!Coil is too small!Coil is piped backwards!2-pipe system!Process cooling!Air-side economizer cycles

Coil Performance at Low LAT Setpoints
Based on a six-row 100 fpf coil, 78ºF entering dry-bulb 63ºF entering wet-bulb
Cannot be attained49
409%4.332750
260%6.520851
179%8.514352
130%1110453
100%138054
% of Design GPM
CHW ∆T (ºF)
Flow Rate (GPM)
Leaving Air Temperature Setpoint (ºF)
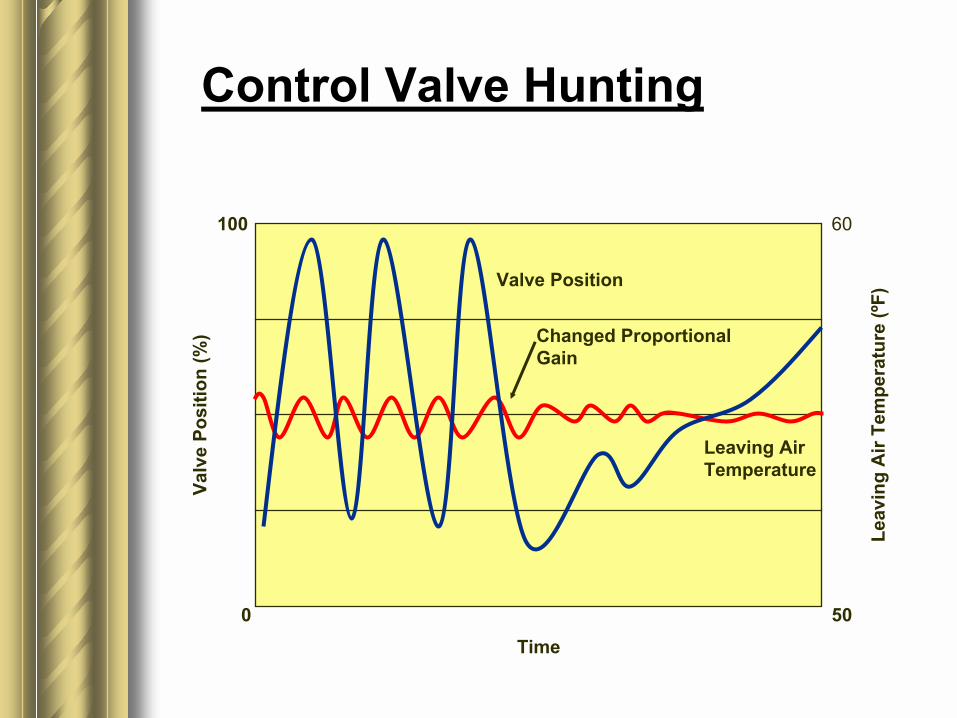
Control Valve Hunting
0
100
50
60
Time
Valv
e Po
sitio
n (%
)
Leav
ing
Air
Tem
pera
ture
(ºF)
Changed Proportional Gain
Valve Position
Leaving Air Temperature
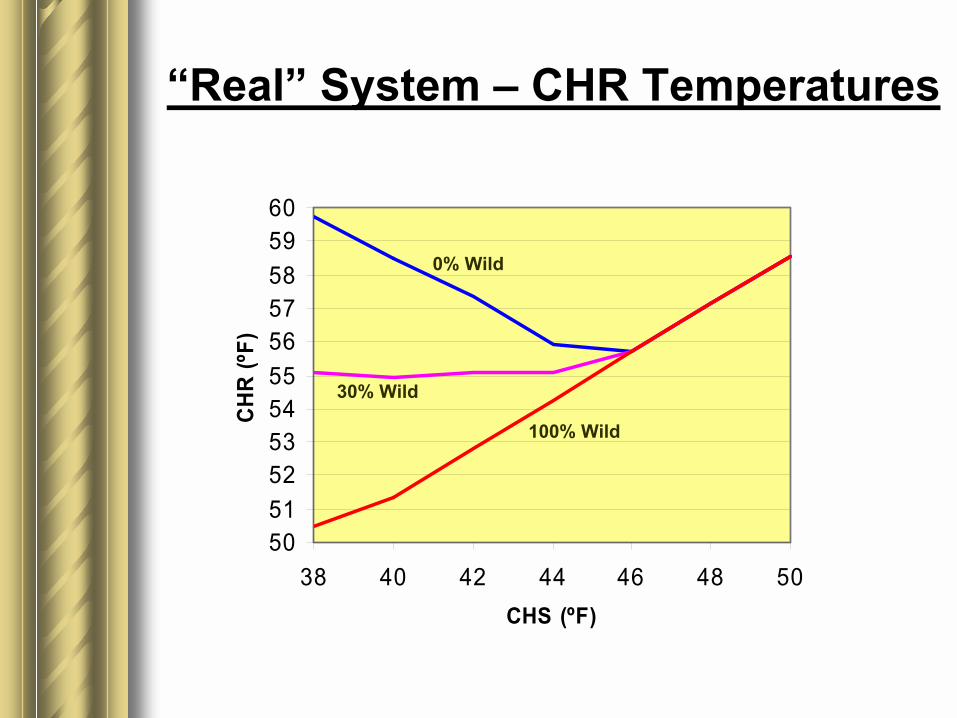
�Real� System � CHR Temperatures
5051525354555657585960
38 40 42 44 46 48 50CHS (ºF)
CHR
(ºF)
0% Wild
30% Wild
100% Wild

38 40 42 44 46 48 50
�Real� System - Load
30% Wild
0% Wild
100% Wild
130%
100%
115%
Chilled Water Supply Temperature (ºF)
Coo
ling
Load
(% o
f des
ign)

Theoretical Equipment Performance
Chilled Water Temperature (ºF)
Pow
er (%
)
CHW Pumps
Chiller
Total
38 39 40 41 42 43 44 45
100
40
60
20
80

Real Equipment Performance
30% Wild
0% Wild
100% Wild
Chilled Water Supply Temperature (ºF)
Pow
er (%
)
38 39 40 41 42 43 44 45
115%
85%
0%
100%
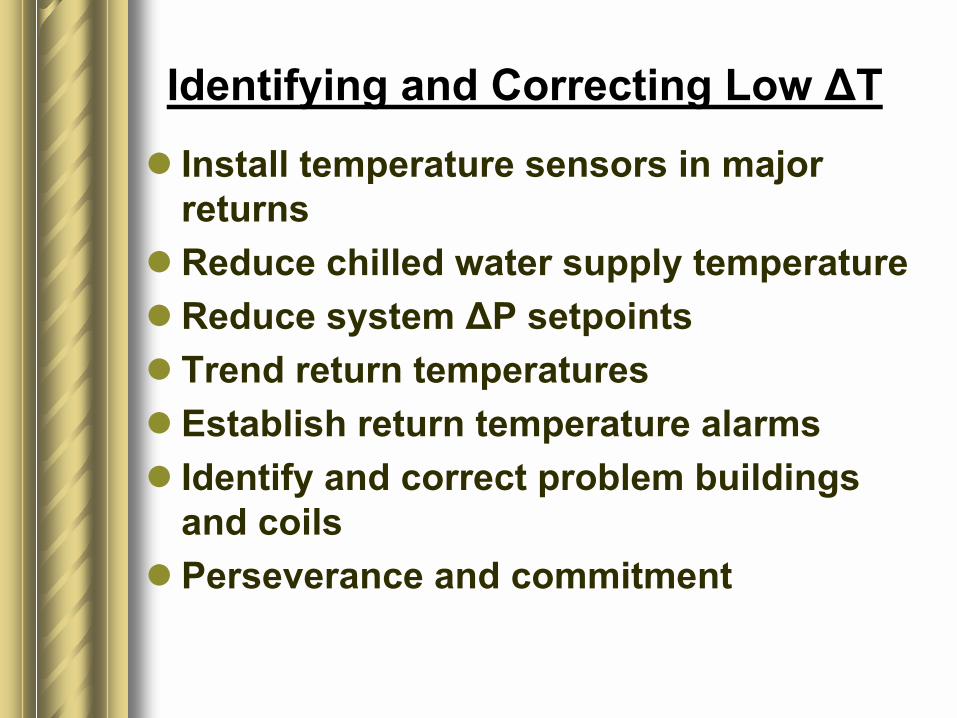
Identifying and Correcting Low ∆T! Install temperature sensors in major
returns! Reduce chilled water supply temperature! Reduce system ∆P setpoints! Trend return temperatures! Establish return temperature alarms! Identify and correct problem buildings
and coils! Perseverance and commitment
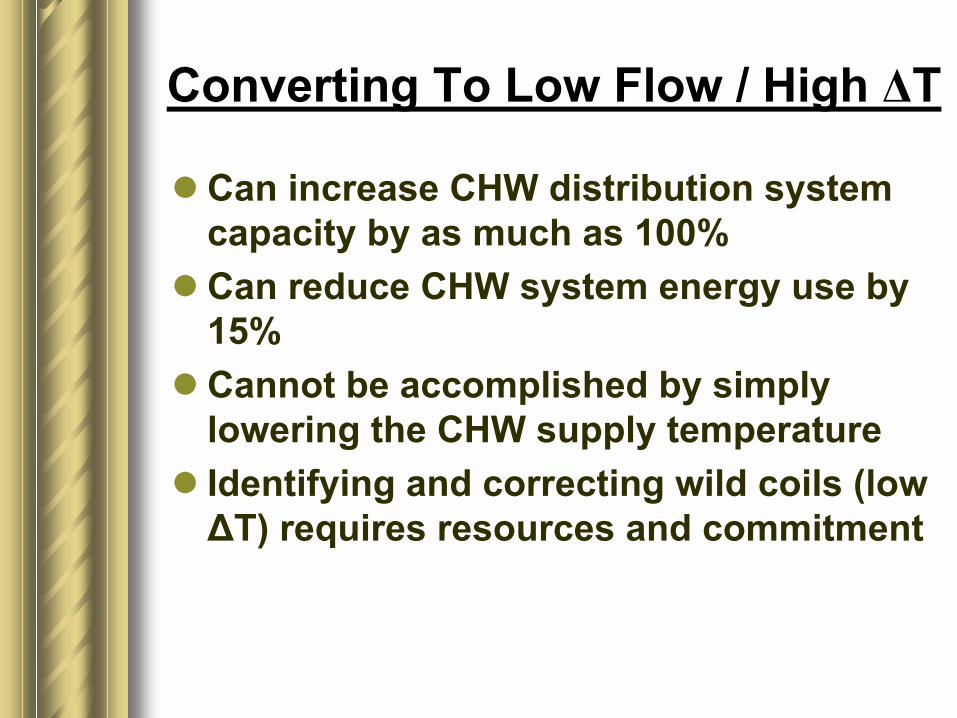
Converting To Low Flow / High ∆T
! Can increase CHW distribution system capacity by as much as 100%
! Can reduce CHW system energy use by 15%
! Cannot be accomplished by simply lowering the CHW supply temperature
! Identifying and correcting wild coils (low ∆T) requires resources and commitment
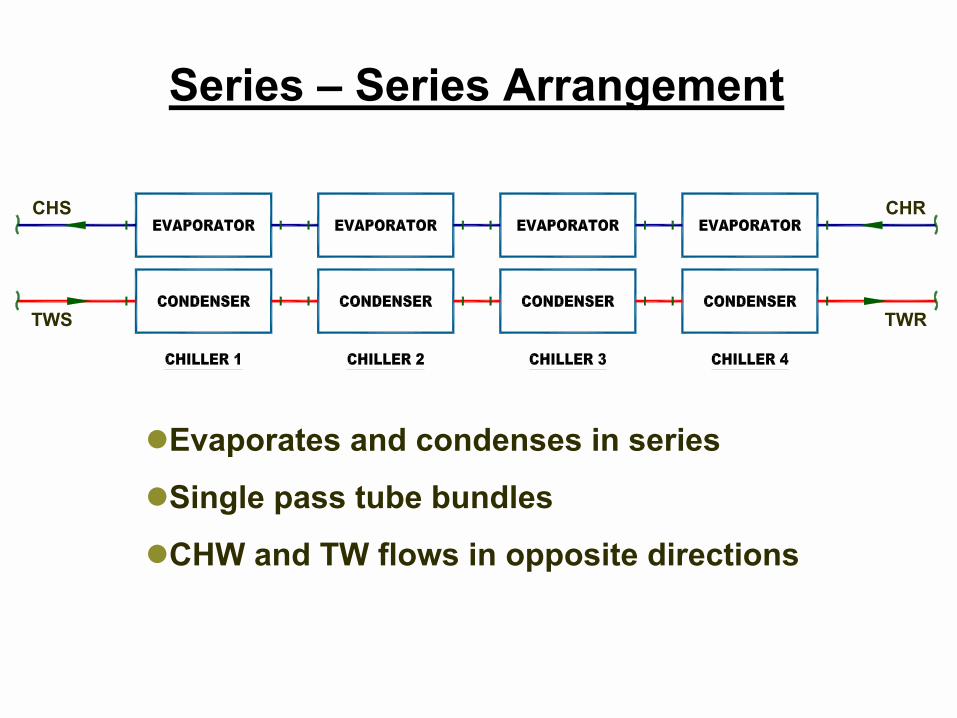
Series � Series Arrangement
CHR
TWRTWS
CHS
!Evaporates and condenses in series
!Single pass tube bundles
!CHW and TW flows in opposite directions

Low ∆T Parallel � Parallel Water Chiller
85
54 °F
96.5 °F
42.5 °F
44
5295 Condenser
Tem
pera
ture
Evaporator
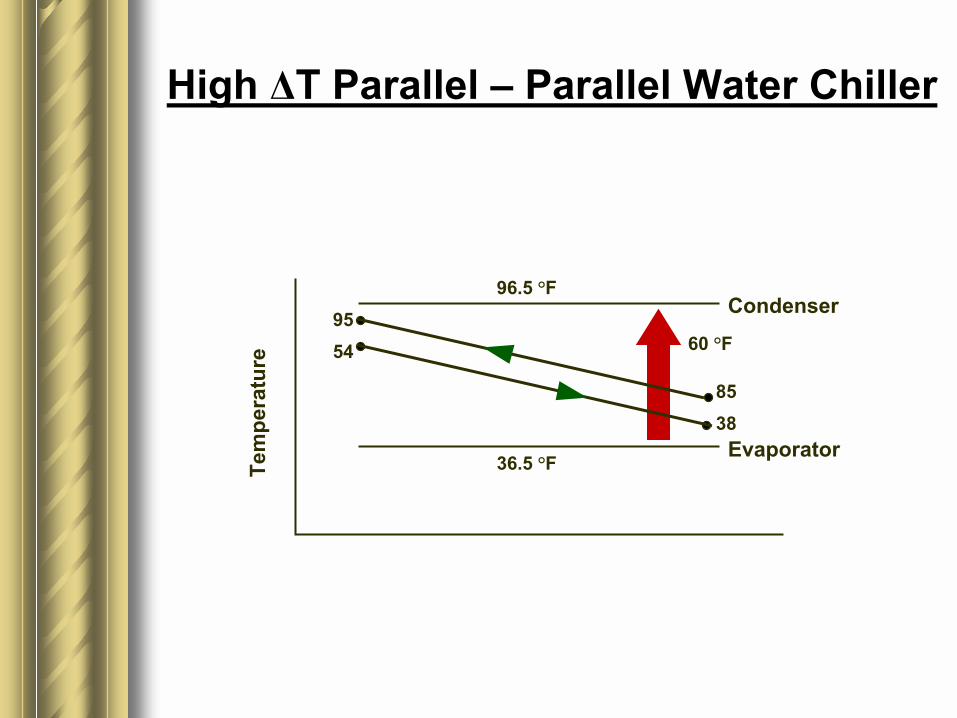
High ∆T Parallel � Parallel Water Chiller
85
60 °F
96.5 °F
36.5 °F
38
5495 Condenser
Evaporator
Tem
pera
ture

High ∆T Series � Series Water Chillers
Tem
pera
ture
102.5ºF
48.5ºF
54ºF
98.5ºF
44.5ºF
54ºF
94.5ºF
40.5ºF
54ºF
90.5ºF
36.5ºF
54ºF
101
5485
38
97
50
89
42
Condenser
Evaporator46
93
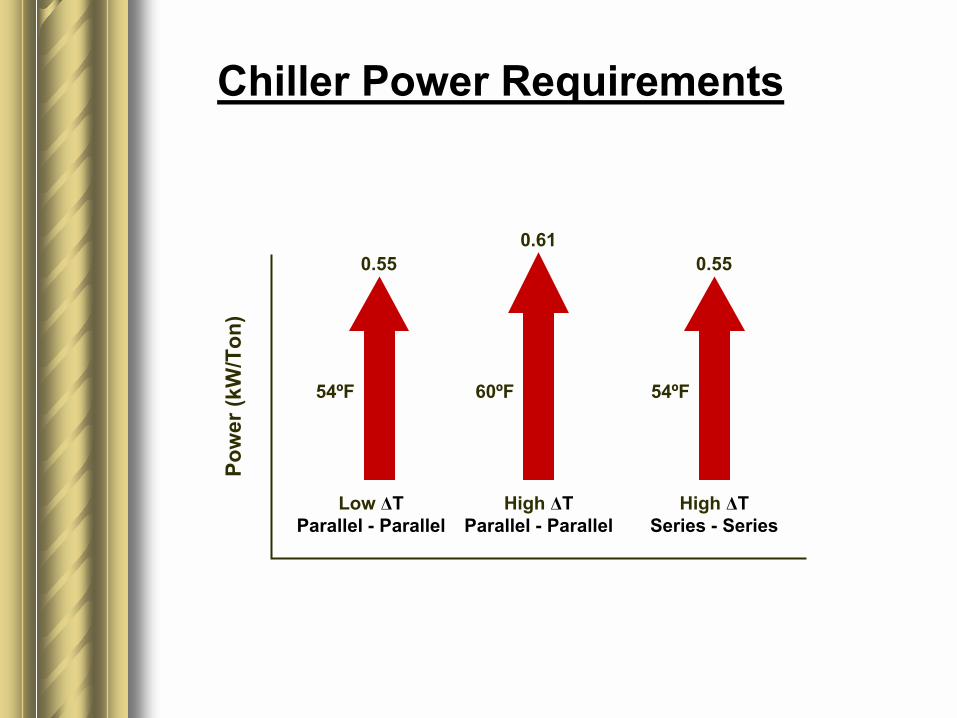
Chiller Power Requirements
Pow
er (k
W/T
on)
0.55
54ºF
Low ∆T Parallel - Parallel
0.61
60ºF
High ∆T Parallel - Parallel
0.55
54ºF
High ∆T Series - Series

Comparison of Parallel � Parallel & Series � Series
0.625
0.650
0.675
0.700
0.725
0.750
0.775
0.800
0.825
8 10 12 14 16 18 20
CHW Temperature Difference (º F)
Syst
em E
ffica
cy (k
W/T
on)
Parallel - Parallel
Series - Series
District Cooling Systems
! Multiple plants serving a campus grid! Primary connected! Secondary connected! Combination of primary/secondary and
variable primary plants! Loop vs. radial distribution! Piping and insulation alternatives

Southern Arkansas University (Phase 1)
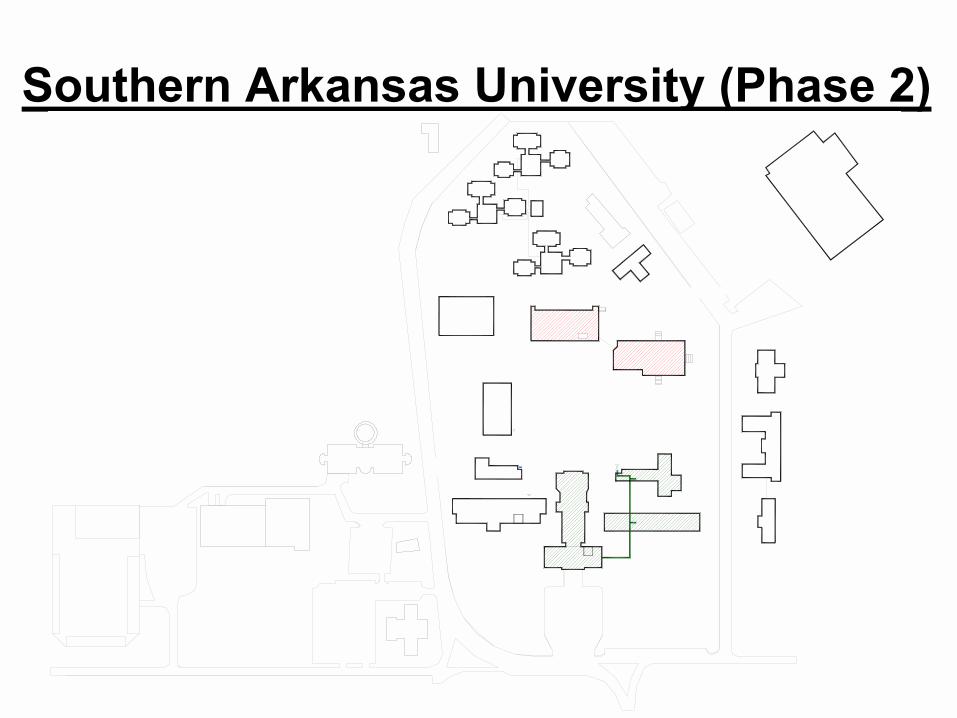
Southern Arkansas University (Phase 2)

Southern Arkansas University (Phase 3)
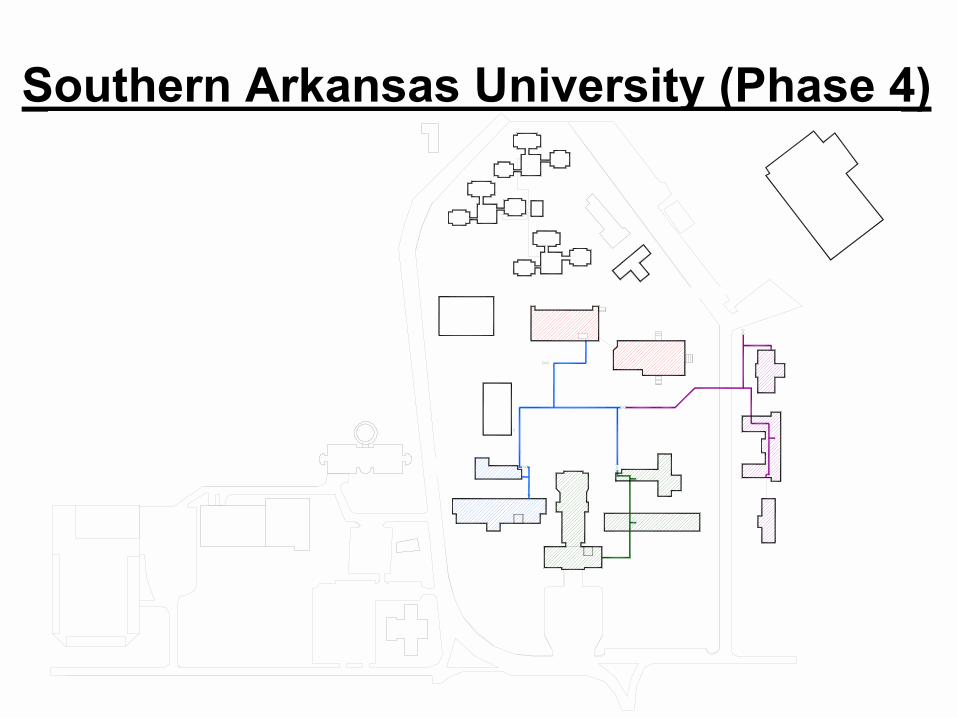
Southern Arkansas University (Phase 4)

Southern Arkansas University (Phase 5)

Southern Arkansas University (Phase 6)

Southern Arkansas University (Phase 7)

Southern Arkansas University (Phase 8)
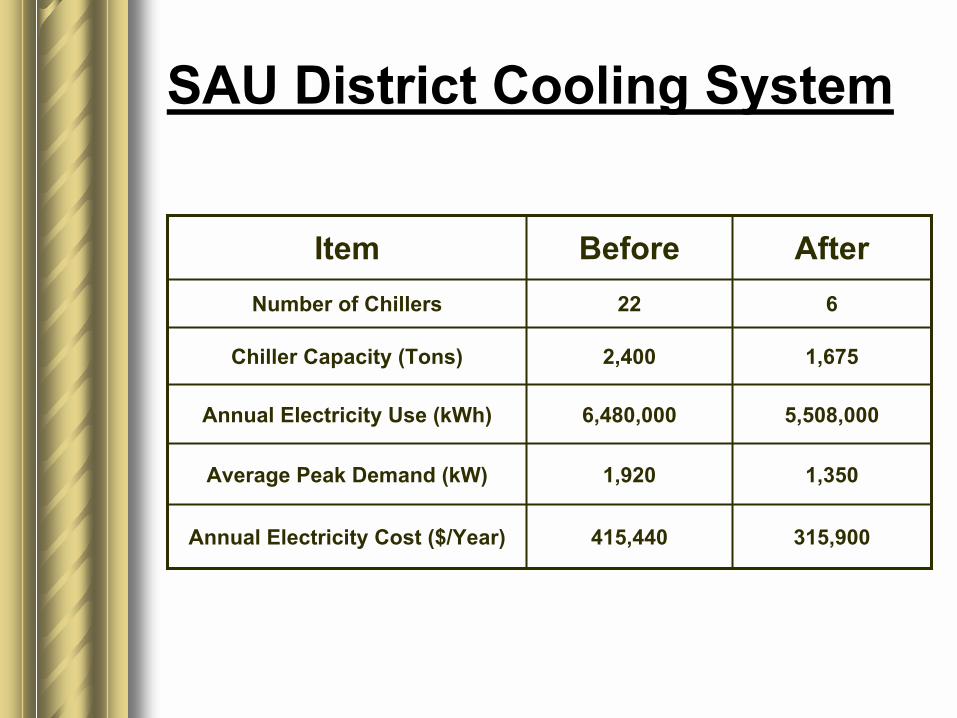
SAU District Cooling System
315,900415,440Annual Electricity Cost ($/Year)
1,3501,920Average Peak Demand (kW)
5,508,0006,480,000Annual Electricity Use (kWh)
1,6752,400Chiller Capacity (Tons)
622Number of Chillers
AfterBeforeItem

District Cooling Systems
! Flexible! Infinite distribution capacity ! Shared redundancy! Lower cost than a new central plant! Can be implemented in phases! Reduced peak demands due to diversity! Existing excess chiller capacity can be
used to serve new buildings
Suggested Reading! �The Search for Chiller Efficiency� by William
Landman! �All Variable Speed Centrifugal Chiller Plants� by
Thomas Hartman! �Primary Only vs. Primary-Secondary Variable Flow
Systems� by Steven Taylor! �Achieving High Chilled Water ∆T�s� by Don Fiorino! �Improving the Efficiency of Chilled Water Plants� by
Gil Avery! �Chilled Water System Forensics� by Kenneth Luther! �Degrading Chilled Water Plant ∆T: Causes and
Mitigation� by Steven Taylor! �Series � Series Counterflow for Central Chilled Water
Plants� by Steve Groenke

Other Related Topics
! Interoperable Control Systems! Hybrid (gas and electric) plants! Thermal storage! Cooling tower selection! Refrigerant selection! ARI standard 550 / 590! ASHRAE standard 15! Cooling tower water treatment

Review! The continued search for improved CHW system
performance must look beyond the chiller! Watch the surge line when selecting chillers! Consider demand costs when evaluating
variable speed chillers! Converting to low flow / high ∆T cannot be
achieved by simply lowering the CHS temperature
! 3.0 gpm per ton condenser flow is an outdated paradigm
! Remember the big picture when making decisions

21st Century CHW System
! Variable primary! Variable volume tower water system! Low flow / high ∆T (54 to 38)! Series � Series piping arrangement! Variable speed compressors! 2.0 � 2.5 gpm per ton condenser flow! District cooling system! Hybrid plants and / or thermal storage! Interoperable control systems! 0.625 kW per Ton

For Additional Information or Questions Please Contact:
Ed Tinsley, PE5800 Evergreen Drive, Suite �A�
Little Rock, AR 72205Toll Free: 866.863.2337Phone: 501.666.6776
Fax: 501.663.8888