Embed Size (px)
Citation preview
MarkhamMarkhamMarkhamMarkham
Year ended December 31, 2015Markham, Ontario, Canada2015 Annual Report
MarkhamMarkhamMarkham
Year ended December 31, 2015Markham, Ontario, Canada2015 Annual Report
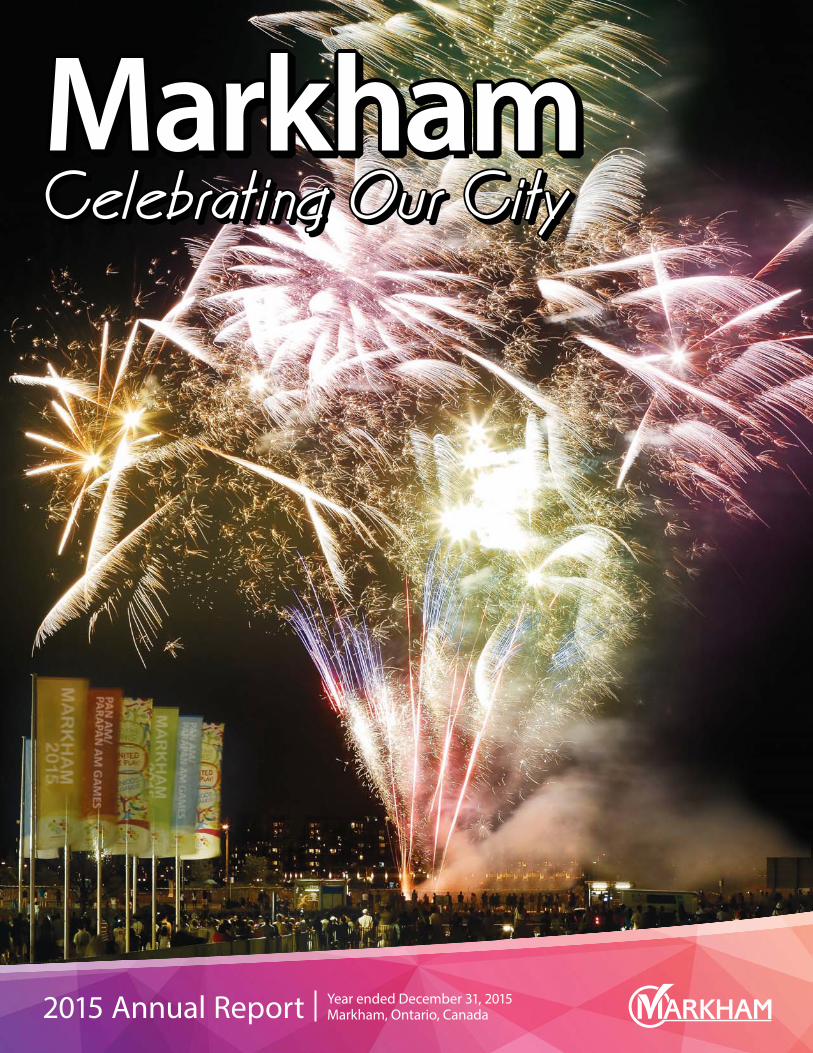
Celebrating Our CityPictured here is the fi reworks fi nale for GlobalFest, Markham’s nine-day festival, celebrating the Pan Am and Parapan Am Games. The cultural extravaganza drew over 40,000 visitors during the Games in July 2015. Situated just outside the new Markham Pan Am Centre, which hosted four Pan Am and Parapan Am Game sports, the free festival highlighted Markham’s cultural diversity while off ering a street market, international foods and music concerts. GlobalFest was the largest street festival ever hosted by Markham.
ContentsIntroduction . . . . . . . . . . . . . . . . . . . . . . . . . . . . . . . 2
Governance . . . . . . . . . . . . . . . . . . . . . . . . . . . . . . . 3
Mayor’s Message . . . . . . . . . . . . . . . . . . . . . . . . . . . . . 4
CAO’s Message . . . . . . . . . . . . . . . . . . . . . . . . . . . . . 6
Building Markham's Future Together: 2015-2019
Exceptional Services by Exceptional People . . . . . . . . . . . . . . . . 9
Engaged, Diverse & Thriving City . . . . . . . . . . . . . . . . . . . . 11
Safe & Sustainable Community . . . . . . . . . . . . . . . . . . . . . 13
Stewardship of Money & Resources . . . . . . . . . . . . . . . . . . . 15
Markham Sustainability Report . . . . . . . . . . . . . . . . . . . . . 16
Commissioner’s Message . . . . . . . . . . . . . . . . . . . . . . . . 20
Awards and Recognition . . . . . . . . . . . . . . . . . . . . . . . . 21
Financial Statements
Financial Statements Review . . . . . . . . . . . . . . . . . . . . . . 22
Financial Policies . . . . . . . . . . . . . . . . . . . . . . . . . . . . 26
Independent Auditors’ Report . . . . . . . . . . . . . . . . . . . . . 27
Consolidated Statement of Financial Position . . . . . . . . . . . . . . 28
Consolidated Statement of Operations and Accumulated Surplus . . . . 29
Consolidated Statement of Change in Net Financial Assets . . . . . . . 30
Consolidated Statement of Cash Flows . . . . . . . . . . . . . . . . . 31
Notes to the Consolidated Financial Statements . . . . . . . . . . . . 32
Trust Funds
Independent Auditors’ Report . . . . . . . . . . . . . . . . . . . . . 40
Trust Funds . . . . . . . . . . . . . . . . . . . . . . . . . . . . . . 41
Notes to the Financial Statements. . . . . . . . . . . . . . . . . . . . 42
Statistical Information
Five-Year Review (Unaudited) . . . . . . . . . . . . . . . . . . . . . 43
GRI G4 Content Index Table . . . . . . . . . . . . . . . . . . . . . . . 46
Organizational Structure . . . . . . . . . . . . . . . . . . . . . . . . 48
*Markham integrates Sustainability Reporting into its Annual Report, using the Global Reporting Initiative (GRI) Framework. Throughout this Report you will see notations identifying information that is aligned with one of the GRI disclosures, as documented in the Content Index Table on pages 46 and 47.
The Global Reporting Initiative (GRI) Content Index is a tool which acts as a point of reference for readers. The City of Markham submitted the 2014 Annual Report for the GRI Content Index Service to understand how to improve accuracy, usability and alignment with GRI’s G4, Sustainability Reporting guidelines. In February of 2016, the City of Markham was a proud recipient of the GRI Content Index, demonstrating that the GRI Content Index was precise and that all included disclosures were labeled properly in the 2014 Annual Report. We have applied the lessons learned in this Report.
A Winner for 14 Consecutive YearsOur Annual Report has won the Government Finance Offi cers Association’s Canadian Award for Financial Reporting for the past 14 years.
This program was established to encourage municipal governments to publish high quality fi nancial reports and to provide peer recognition and technical guidance for offi cials preparing these reports. This award represents a signifi cant accomplishment by a government and its management staff .
In Markham, we use Excellence Canada’s Excellence Framework for Municipalities to guide how we manage the whole organization, focusing on:
• Customer Satisfaction;
• Operational Excellence;
• Staff Engagement; and
• Financial Performance.
The Excellence journey is a long-term process that requires the commitment of all Markham staff to reach our destination and sustain our eff orts (G4-15, G4-16).
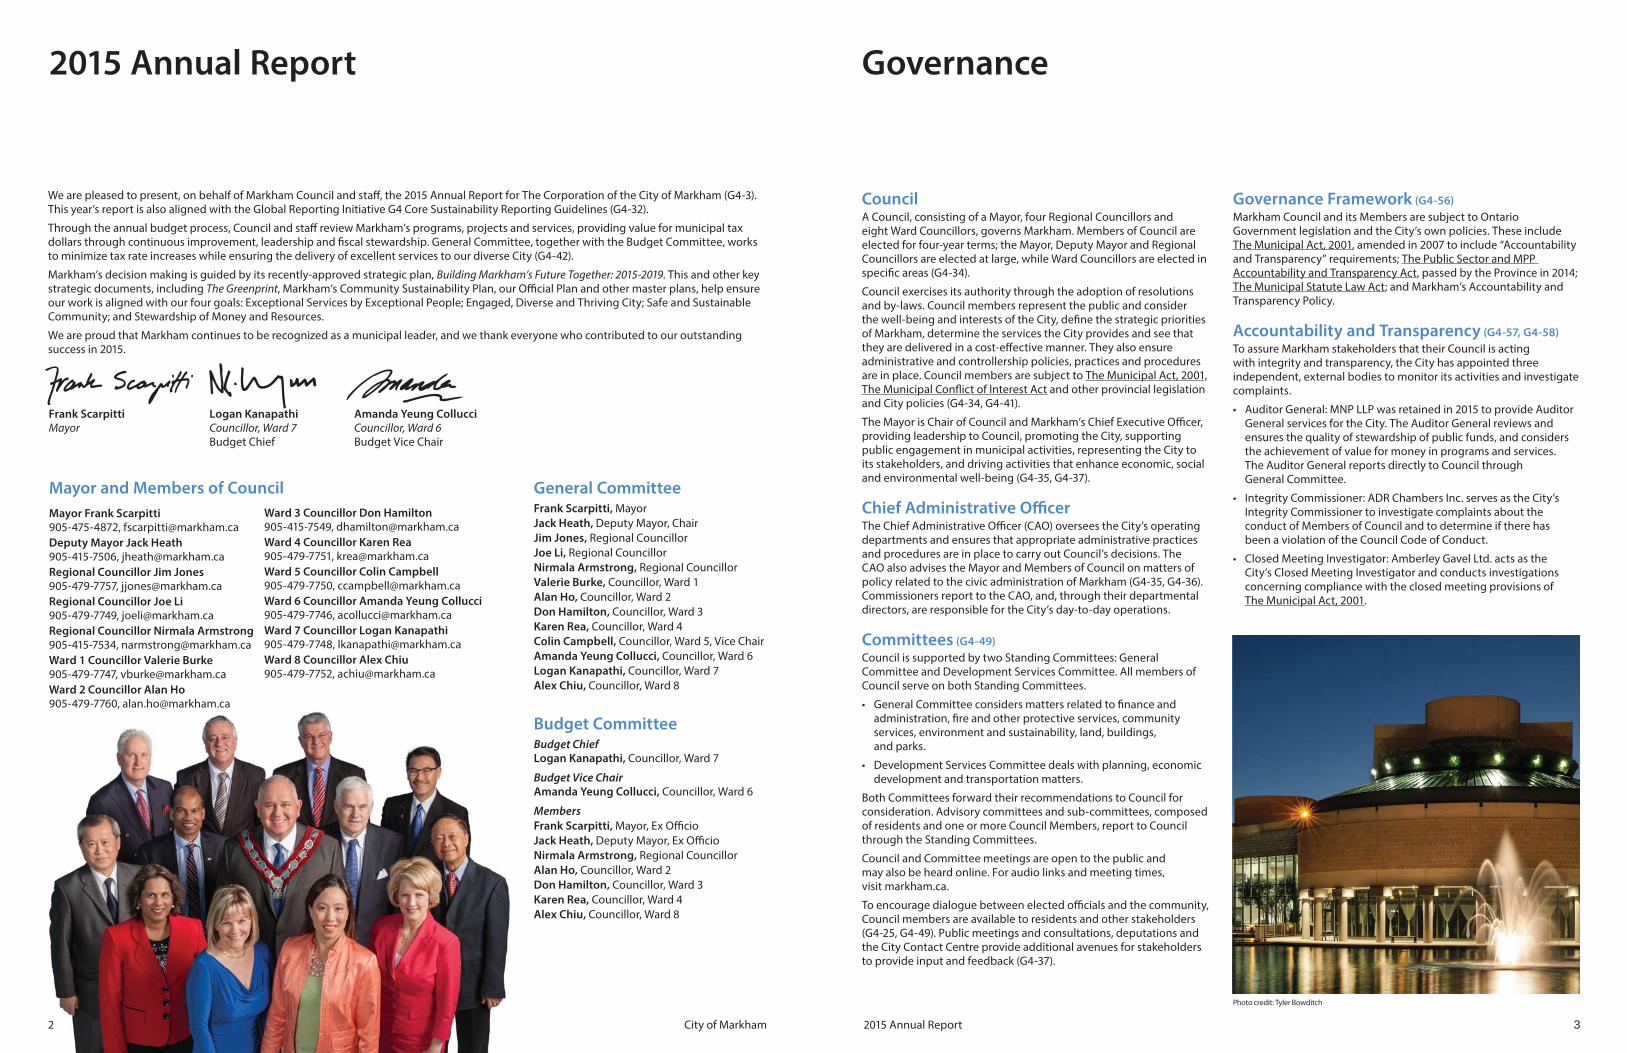
Mayor and Members of CouncilMayor Frank Scarpitti905-475-4872, [email protected]
Deputy Mayor Jack Heath905-415-7506, [email protected]
Regional Councillor Jim Jones905-479-7757, [email protected]
Regional Councillor Joe Li905-479-7749, [email protected]
Regional Councillor Nirmala Armstrong905-415-7534, [email protected]
Ward 1 Councillor Valerie Burke905-479-7747, [email protected]
Ward 2 Councillor Alan Ho905-479-7760, [email protected]
Governance
CouncilA Council, consisting of a Mayor, four Regional Councillors and eight Ward Councillors, governs Markham. Members of Council are elected for four-year terms; the Mayor, Deputy Mayor and Regional Councillors are elected at large, while Ward Councillors are elected in specifi c areas (G4-34).
Council exercises its authority through the adoption of resolutions and by-laws. Council members represent the public and consider the well-being and interests of the City, defi ne the strategic priorities of Markham, determine the services the City provides and see that they are delivered in a cost-eff ective manner. They also ensure administrative and controllership policies, practices and procedures are in place. Council members are subject to The Municipal Act, 2001, The Municipal Confl ict of Interest Act and other provincial legislation and City policies (G4-34, G4-41).
The Mayor is Chair of Council and Markham’s Chief Executive Offi cer, providing leadership to Council, promoting the City, supporting public engagement in municipal activities, representing the City to its stakeholders, and driving activities that enhance economic, social and environmental well-being (G4-35, G4-37).
Chief Administrative Offi cerThe Chief Administrative Offi cer (CAO) oversees the City’s operating departments and ensures that appropriate administrative practices and procedures are in place to carry out Council’s decisions. The CAO also advises the Mayor and Members of Council on matters of policy related to the civic administration of Markham (G4-35, G4-36). Commissioners report to the CAO, and, through their departmental directors, are responsible for the City’s day-to-day operations.
Committees (G4-49)Council is supported by two Standing Committees: General Committee and Development Services Committee. All members of Council serve on both Standing Committees.
• General Committee considers matters related to fi nance and administration, fi re and other protective services, community services, environment and sustainability, land, buildings, and parks.
• Development Services Committee deals with planning, economic development and transportation matters.
Both Committees forward their recommendations to Council for consideration. Advisory committees and sub-committees, composed of residents and one or more Council Members, report to Council through the Standing Committees.
Council and Committee meetings are open to the public and may also be heard online. For audio links and meeting times, visit markham.ca.
To encourage dialogue between elected offi cials and the community, Council members are available to residents and other stakeholders (G4-25, G4-49). Public meetings and consultations, deputations and the City Contact Centre provide additional avenues for stakeholders to provide input and feedback (G4-37).
Governance Framework (G4-56)Markham Council and its Members are subject to Ontario Government legislation and the City’s own policies. These include The Municipal Act, 2001, amended in 2007 to include “Accountability and Transparency” requirements; The Public Sector and MPP Accountability and Transparency Act, passed by the Province in 2014; The Municipal Statute Law Act; and Markham’s Accountability and Transparency Policy.
Accountability and Transparency (G4-57, G4-58)To assure Markham stakeholders that their Council is acting with integrity and transparency, the City has appointed three independent, external bodies to monitor its activities and investigate complaints.
• Auditor General: MNP LLP was retained in 2015 to provide Auditor General services for the City. The Auditor General reviews and ensures the quality of stewardship of public funds, and considers the achievement of value for money in programs and services. The Auditor General reports directly to Council through General Committee.
• Integrity Commissioner: ADR Chambers Inc. serves as the City’s Integrity Commissioner to investigate complaints about the conduct of Members of Council and to determine if there has been a violation of the Council Code of Conduct.
• Closed Meeting Investigator: Amberley Gavel Ltd. acts as the City’s Closed Meeting Investigator and conducts investigations concerning compliance with the closed meeting provisions of The Municipal Act, 2001.
2015 Annual Report
We are pleased to present, on behalf of Markham Council and staff , the 2015 Annual Report for The Corporation of the City of Markham (G4-3). This year’s report is also aligned with the Global Reporting Initiative G4 Core Sustainability Reporting Guidelines (G4-32).
Through the annual budget process, Council and staff review Markham’s programs, projects and services, providing value for municipal tax dollars through continuous improvement, leadership and fi scal stewardship. General Committee, together with the Budget Committee, works to minimize tax rate increases while ensuring the delivery of excellent services to our diverse City (G4-42).
Markham’s decision making is guided by its recently-approved strategic plan, Building Markham’s Future Together: 2015-2019. This and other key strategic documents, including The Greenprint, Markham’s Community Sustainability Plan, our Offi cial Plan and other master plans, help ensure our work is aligned with our four goals: Exceptional Services by Exceptional People; Engaged, Diverse and Thriving City; Safe and Sustainable Community; and Stewardship of Money and Resources.
We are proud that Markham continues to be recognized as a municipal leader, and we thank everyone who contributed to our outstanding success in 2015.
Frank ScarpittiMayor
Amanda Yeung CollucciCouncillor, Ward 6Budget Vice Chair
Logan KanapathiCouncillor, Ward 7Budget Chief
General Committee Frank Scarpitti, Mayor
Jack Heath, Deputy Mayor, Chair
Jim Jones, Regional Councillor
Joe Li, Regional Councillor
Nirmala Armstrong, Regional Councillor
Valerie Burke, Councillor, Ward 1
Alan Ho, Councillor, Ward 2
Don Hamilton, Councillor, Ward 3
Karen Rea, Councillor, Ward 4
Colin Campbell, Councillor, Ward 5, Vice Chair
Amanda Yeung Collucci, Councillor, Ward 6
Logan Kanapathi, Councillor, Ward 7
Alex Chiu, Councillor, Ward 8
Budget Committee Budget ChiefLogan Kanapathi, Councillor, Ward 7
Budget Vice ChairAmanda Yeung Collucci, Councillor, Ward 6
Members
Frank Scarpitti, Mayor, Ex Offi cio
Jack Heath, Deputy Mayor, Ex Offi cio
Nirmala Armstrong, Regional Councillor
Alan Ho, Councillor, Ward 2
Don Hamilton, Councillor, Ward 3
Karen Rea, Councillor, Ward 4
Alex Chiu, Councillor, Ward 8
Ward 3 Councillor Don Hamilton905-415-7549, [email protected]
Ward 4 Councillor Karen Rea905-479-7751, [email protected]
Ward 5 Councillor Colin Campbell905-479-7750, [email protected]
Ward 6 Councillor Amanda Yeung Collucci905-479-7746, [email protected]
Ward 7 Councillor Logan Kanapathi905-479-7748, [email protected]
Ward 8 Councillor Alex Chiu905-479-7752, [email protected]
Photo credit: Tyler Bowditch
2015 Annual ReportCity of Markham 32
A Message from Mayor Frank Scarpitti
A Year of Celebration and Achievement
2015 Pan Am and Parapan Am Games It was an amazing year of celebration for Markham hosting the 2015 Pan Am and Parapan Am Games. Canada achieved a record number of 217 medals. Markham hosted fi ve spectacular events: badminton, table tennis, para table tennis and water polo at our beautiful new Markham Pan Am Centre, and golf was introduced for fi rst time in the history of the Games at the Angus Glen Golf Club. Markham athletes
did exceptionally well at the Games, winning three Gold medals, two Silver and three Bronze: Michelle Li won Gold and Bronze, while Rachel Honderich won Silver and Bronze, all in Badminton. Andre De Grasse became an international track sensation winning two Gold medals, while Sarah Wells also fi nished strong in track with Silver and Bronze medals – Well done everyone!
Pan Am Proud: An Engaged and Diverse CommunityWhile the Games themselves were the highlight of the summer, Markham celebrated this historic occasion with a number of community activities before, during and after the games ranging from the Pan Am Torch Relay, two-year and one-year Games Countdown celebrations, public art displays and our nine-day cultural entertainment festival - GlobalFest, which thrilled over 40,000 Markham residents and visitors with daily music and entertainment. The Pan
Am theme was also evident in all the City’s key events and activities throughout the year including Canada Day, the RBC Markham Milliken Children’s Festival, the Santa Claus Parade, and our own Employee United Way Campaign. We honoured our Markham athletes with two Pan Am Proud celebrations at the Markham Civic Centre, and with the help of supporters city-wide, created a group selfi e, #MarkhamGrelfi e.
All of this was made possible through the support of our Pan Am Host Advisory Committee, the generous sponsors, the participation of Markham staff over the past four years, and hundreds of residents who volunteered their time and energy to the Games and related events (G4-24). While some were visible at the various venues, many more worked behind the scenes to ensure everything ran smoothly. And it did! We owe our whole community a large thank you for their extraordinary eff orts.
The Markham Pan Am Centre will be a continuing legacy of the Games and an important training resource for elite athletes. It was exciting news that the Centre was chosen as the new home for the Table Tennis Canada headquarters, the location for the recent table tennis qualifi ers for the 2016 Olympic Summer Games in Rio, and the venue for the 2017 Pan Am Jr. Badminton competitions.
A New University Campus in Markham CentreWhen I refl ect on Markham’s achievements for 2015, realizing our long-held vision for a university in our city was among our most important. Markham actively participated in the successful bid by York University to obtain approval from the Ontario Government to build a new campus in York Region, located in Markham Centre. This is a historic achievement, and one which will be a catalyst for local economic development, new and exciting partnership opportunities, and the development of a skilled and educated workforce to meet the demands of local industries and strategic business sectors. The new campus will be home to 4,000 students within fi ve years, growing to more than 10,000 in the following 20 years.
Economic Development and OpportunitiesThe plan to merge three leading electricity distribution utilities, and jointly purchase a fourth, was approved by the shareholders, which include the City of Markham.
Enersource Corporation, Horizon Utilities Corporation and PowerStream Inc. signed agreements to merge and jointly purchase Hydro One Brampton Networks Inc. from the Ontario Government. This agreement will create the second largest electricity distribution company in Ontario and serve almost one million customers within a service territory of approximately 1,800 km.
After the approval by the Ontario Energy Board, the merger will enable the new, larger company to use its collective resources to reduce upward pressure on distribution rates. It will also deliver more effi cient services and innovative technologies for customers, while providing signifi cant benefi ts for communities and shareholders.
International Connections (G4-EC8)City of Markham business and trade missions are an integral part of our ten-year Economic Strategy, Markham 2020. I had the pleasure of leading an international business mission in 2015, attracting new investment and international partnerships.
In December 2015, a 34-member business delegation, including some members of Council, achieved a successful mission to China and Hong Kong, visiting seven major industrial and economic development zones. The missions’ delegates participated in multiple business meetings and events in the cities visited, as well as sector information sharing between countries. The City of Markham received a lot of investor attention, and these partnerships will continue to be explored. Our community has a bright economic future.
Financial Performance Markham continued its leadership on fi scal management and keeping taxes low, while delivering value for local taxpayers. In 2015, our tax rate increase was 2.5 per cent and in 2016, it was 2.44 per cent. Based on public reports on 2016 municipal tax rate increases, Markham’s eight-year average tax rate increase of 1.3 per cent per year, is the lowest among 27 GTA municipalities. We continue to keep tax rate increases low through our innovative E3 program which has achieved over $22 million in operational savings and revenue enhancements since 2009.
The 2016 Budget focuses on quality, service delivery, ensuring value for money, investing in infrastructure, retaining jobs and investment, and minimizing the impacts on individual and family household budgets. Markham has an enviable track record of delivering excellent municipal services, at a reasonable cost to support a high quality of life for our community.
Building Markham’s Future Together All of our plans are based on what is important to our local residents and businesses. The City embarked on an extensive public consultation in 2008, and continued this process again in 2014, to fi nd out what the community wanted to see in the City’s renewed strategic plan - Building Markham’s Future Together: 2015-2019 (G4-1).
The plan includes four major goals:
• Exceptional Services by Exceptional People;
• An Engaged, Diverse & Thriving City;
• A Safe and Sustainable City; and
• Stewardship of Money and Resources.
We are excited by our new plan and look forward to providing regular public updates on our progress. We invite you to visit our website www. Markham.ca to learn more about these plans.
I want to thank our Council, our local residents, the business community, and City Staff for their commitment to making Markham a destination of choice and a city to celebrate.
Frank Scarpitti, MayorApril, 2016
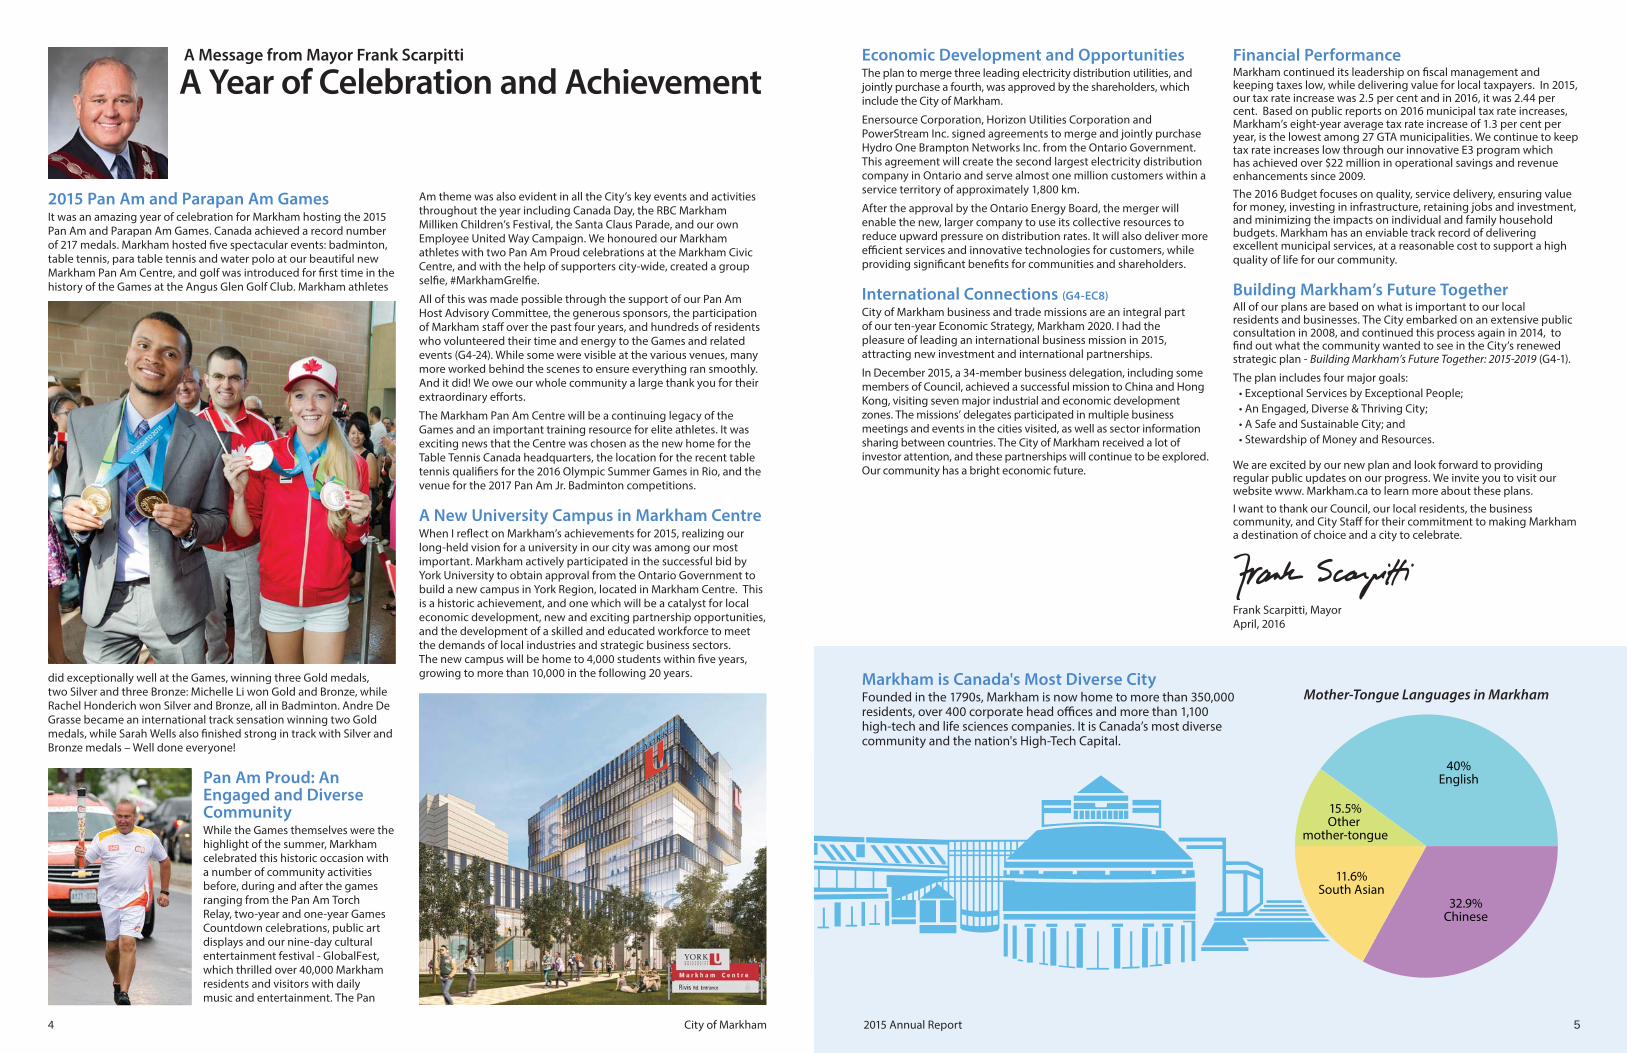
Markham is Canada's Most Diverse CityFounded in the 1790s, Markham is now home to more than 350,000 residents, over 400 corporate head offi ces and more than 1,100 high-tech and life sciences companies. It is Canada’s most diverse community and the nation's High-Tech Capital.
32.9%Chinese
40%English
15.5%Other
mother-tongue
11.6%South Asian
Mother-Tongue Languages in Markham
2015 Annual ReportCity of Markham 54

Markham continues to be one of the fastest growing communities in the Greater Toronto Area. High quality municipal services, innovative growth management and strong fi nancial stewardship have positioned Markham as a top destination for businesses, families and tourists.
As the City of Markham grows, so does the need for new infrastructure, enhanced services and expanded utilities. Through our carefully developed strategy, Building Markham’s Future Together: 2015-2019 (BMFT), we continue to build a safe and sustainable city with world-class amenities.
Pan Am Success Provides Lasting Legacy for MarkhamOur Executive Leadership Team is very proud of Markham staff for contributing their time, eff ort and volunteer support. The 2015 Pan Am and Parapan Am Games in Markham were a huge success! The new Markham Pan Am Centre is a sport training facility built to international competition standards. The legacy of this facility and the overwhelming success of the Games helped put Markham on the international map as a destination for sport, tourism, arts, culture, and more.
Building Markham’s Future TogetherIn 2015, Markham Council and staff developed Building Markham’s Future Together: 2015-2019, supported by our award-winning online survey of residents, businesses and individuals employed in the city (G4-24). This initiative builds on our 2010-2014 strategic plan and will guide us through the successful implementation of numerous priority projects.
A Message from the Chief Administrative Offi cer, Andy Taylor
Excellence MarkhamIn 2015, Markham became the fi rst lower-tier municipality to be certifi ed by Excellence Canada at the Gold level (Level IV) for Organizational Quality & Healthy Workplace®. We were very proud to be recognized for these eff orts at the 2015 Performance Excellence Summit and Canada Awards for
Excellence Gala, in front of more than 500 leaders and decision makers from across Canada.
The City’s continuous improvement program, Excellence Markham, is based on Excellence Canada’s Framework for Municipalities, which emphasizes:
• Satisfi ed customers,
• Effi cient systems and processes,
• An engaged staff , and
• Reasonable costs.
We know quality service delivery comes from a fully engaged staff . We are committed to providing a work environment that is focused on employee health and wellness as well as cross-organizational communication and collaboration. This leads to a corporate culture of commitment and dedication to delivering excellent service and quality programs to Markham residents.
Development Activity From premium corporate, commercial and industrial developments to outstanding mixed-use communities, Markham is creating the infrastructure needed to sustain a vibrant and livable city. This, combined with working to maintain low tax rate increases, makes Markham a great place to live, work and play.
Value of Construction (G4-EC7)
(All dollar amounts are in $000)
20102009 2011 2012 2013 2014 2015
$300
$0
$600
$900
$1,200
$1,500
$1,200
Commercial/Industrial/Institutional
Residential Other
Major City Projects (G4-13) Markham continues to invest in infrastructure to ensure our city moves well, businesses continue to thrive and residents enjoy a high quality of life. Key projects in 2015 included:
• Construction of the Markham Main Street Bridge and road improvements south of Highway 7;
• Finalization of negotiations and Council approval of the merger of PowerStream with Enersource and Horizon and the purchase of Hydro One Brampton;
• Partnership with York University on the successful proposal to obtain Provincial approval to locate a new campus for York in Markham Centre;
• Completion of the roadway improvements along Highway 7 from Bayview Avenue to Town Centre Boulevard;
• Implementation of a new residential Stormwater Fee to fund the city-wide fl ood management program;
• Continued construction of our newest facility, the Southeast Community Centre & Library, slated to open in 2017; and
• Substantial progress on the Emerald Ash Borer tree removal and tree replanting program.
Sustainability ReportingIn 2011, Markham became one of the fi rst municipalities to develop an Annual Report using the Global Reporting Initiative (GRI), an international standard used by many Fortune 500 companies. Since then, we have continually refi ned our approach to identifying and reporting on important sustainability issues. The sustainability disclosures integrated into this Annual Report present a complete picture of the City’s economic, social and environmental status (G4-48).
For 2015, we report on over 60 GRI indicators. Some of our successes include:
• 4.0 hectares (9.8 acres) of future woodland habitat created as a result of restoration tree planting projects; and
• A 4.3 per cent reduction in greenhouse gas emission intensity achieved through effi ciencies in our facilities and fl eet operations (G4-EN19).
With fi ve years of corporate sustainability performance data, we are making better informed business decisions.
The City of Markham’s Annual Report continues to evolve in an eff ort to maintain transparency and accountability to stakeholders and to better measure the progress made in meeting the goals of The Greenprint, Markham's Greenprint Community Sustainability Plan (G4-1).
Our CommitmentCity staff continue to work hard to provide leadership on key issues and drive the agenda to achieve the goals and priorities set by our Council. Our focus is to ensure that the City of Markham continues to be a great place to raise a family, operate a business and enjoy the many cultural and leisure activities off ered.
I want to thank City of Markham Council for their leadership and support, and our dedicated staff for their continued eff orts to ensure Markham residents and businesses receive excellent services each and every day.
Andy Taylor, Chief Administrative Offi cerApril, 2016
Markham Profi le Population Age Characteristics* Markham is a vibrant community, with over 30 per cent of our population under the age of 40. Our city continues to attract businesses, and provides opportunities for all ages.
Educational AttainmentHome to 400 corporate head offi ces and 1,100 high tech and life science companies, Markham businesses attract a highly educated workforce. Residents are well-educated, with 59 per cent having completed post-secondary education.
0 10,000
Ag
e
20,000Number of People
30,000 40,000
0-9
10-19
20-29
30-39
40-49
50-59
60-69
70-79
80-89
25%High schoolcertificate
16%Less than
high school19%
Trade, college or non-university
diploma/certificate
40%University
degree
*Data from 2011 Canada Census. 2011 Total Population in Markham was 301,709.
2015 Annual ReportCity of Markham 76

92015 Annual Report
Exceptional Services by Exceptional People is the fi rst goal of the City of Markham’s renewed strategic plan, Building Markham’s Future Together: 2015-2019 (G4-27). In 2015, as a result of the City’s long-standing continuous improvement programs, we received Excellence Canada’s Organizational Quality and Healthy Workplace Gold Award.
Markham residents benefi t every day from the practical application of the Excellence Canada framework as Markham staff work to deliver exceptional services and fi nd new ways of improving the quality of community life (G4-DMA).
For example, for the Pan Am and Parapan Am Games, Markham’s staff helped deliver many initiatives led by our Host Advisory Committee, in support of our role as a Host City. Highlights included:
• “Pan Am-izing” our city, and City events with colourful Pan Am-themed theatre shows, banners, signage, communications and promotional materials;
• Welcoming the Pan Am Torch Relay at the Markham Civic Centre with celebratory activities, including an Aboriginal Powwow;
• Hosting badminton, table tennis, water polo and para table tennis at the Markham Pan Am Centre, and golf at the Angus Glen Golf Club;
• Staging the hugely successful GlobalFest, a nine-day multicultural celebration of music, entertainment, food and fi reworks that attracted thousands of participants; and
• Honouring Pan Am athletes Michele Li, Andre De Grasse, Sarah Wells, Rachel Honderich and Maxime Brinck-Croteau at two special Pan Am Proud ceremonies.
Markham’s exceptional staff is always searching for ways to help residents enjoy better health. One such 2015 initiative was the Breathe Better partnership with Markham Stouff ville Hospital, which supports individuals at risk of chronic obstructive pulmonary disease or congestive heart failure. The OHIP-covered program provides free exercise classes and individual programming to
help seniors stay healthy, active and independent (G4-24, G4-25). The Cornell Community Centre and Library is located next to the Markham Stouff ville Hospital and linked with an elevated walkway, encouraging staff at both facilities to collaborate on fi nding ways of improving community health services.
Other examples of Exceptional Services by Exceptional People in 2015 include:
• Completion of the Cat Adoption and Education Centre at the Thornhill Community Centre and Library, a unique partnership between the City and the Ontario Society for the Prevention of Cruelty to Animals. The Centre opened early in 2016 with the goal of 200 cat adoptions annually;
• Our new online Winter Maintenance Information Service which allows residents to track the progress of snow clearing on all Markham roads and sidewalks during snow storms, obtain information on service level standards and fi nd current weather conditions. This new feature is also accessible as part of our mobile app available for download from the App Store, Google Play and Blackberry World;
• Continued enhancement of our suite of online services through Access Markham, which gives our customers 24/7 access to our services; and
• To meet the challenge of fi nding qualifi ed swimming instructors and lifeguards in the GTA, Markham’s innovative staff partnered with the York Region District School Board and launched the Lifesaving Leadership Training Program. Participants who complete this continuing education program are certifi ed in lifesaving, lifeguarding and swimming instruction, and receive two high school physical education credits.
Residents can look forward to even better service in the future, as the City recently approved its Customer Experience Strategy, which will be implemented in the coming months.
EXCEPTIONAL SERVICES BY EXCEPTIONAL PEOPLE
• New live chat function on website
• 70+ online services available 24/7
• 43,500 online service requests processedin 2015
1,023 km of roads maintained
Telephone services off ered in 150+ languages
Customer Satisfaction Surveys:
80.8% overall approval rating (GR-PR5)
• 4,836,593 library materials borrowed in 2015
• 133,912 theatre guests in 2015
• 79,179 municipal art gallery and museum collection items
• 62,494 recreation program registrations processed
2015 Annual ReportCity of Markham 98
112015 Annual Report
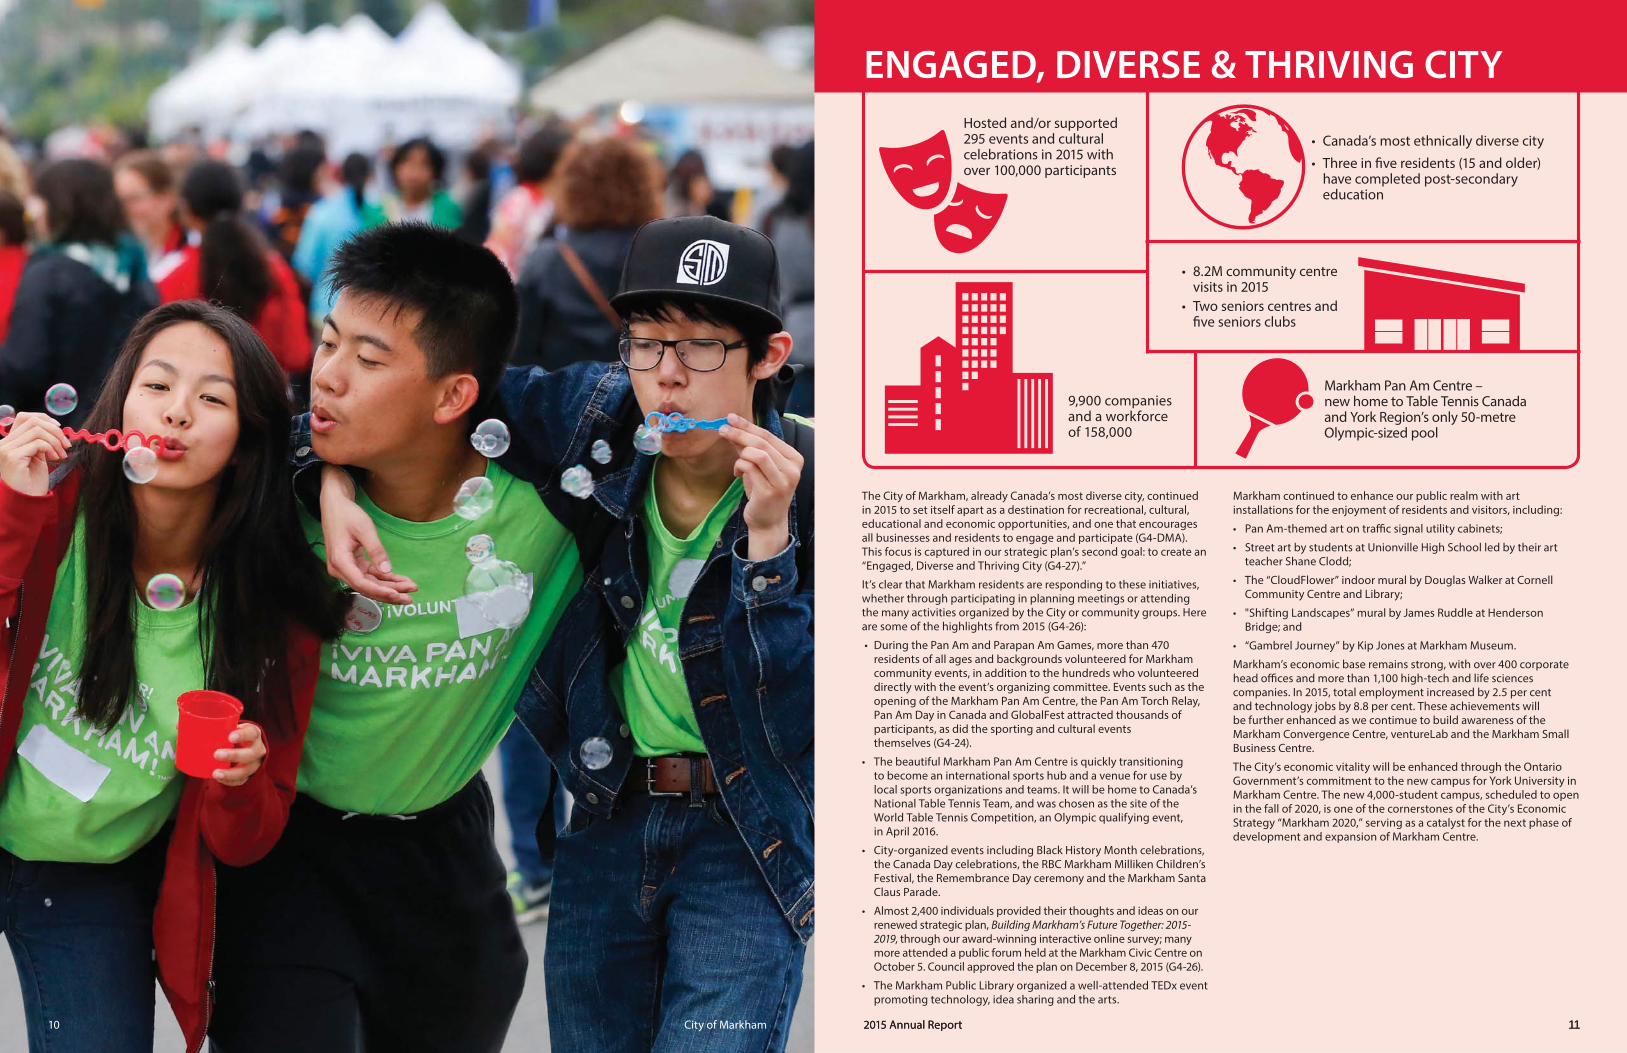
ENGAGED, DIVERSE & THRIVING CITY
• Canada’s most ethnically diverse city
• Three in fi ve residents (15 and older) have completed post-secondary education
• 8.2M community centre visits in 2015
• Two seniors centres and fi ve seniors clubs
9,900 companies and a workforce of 158,000
Hosted and/or supported 295 events and cultural celebrations in 2015 with over 100,000 participants
Markham Pan Am Centre – new home to Table Tennis Canada and York Region’s only 50-metre Olympic-sized pool
The City of Markham, already Canada’s most diverse city, continued in 2015 to set itself apart as a destination for recreational, cultural, educational and economic opportunities, and one that encourages all businesses and residents to engage and participate (G4-DMA). This focus is captured in our strategic plan’s second goal: to create an “Engaged, Diverse and Thriving City (G4-27).”
It’s clear that Markham residents are responding to these initiatives, whether through participating in planning meetings or attending the many activities organized by the City or community groups. Here are some of the highlights from 2015 (G4-26):
• During the Pan Am and Parapan Am Games, more than 470 residents of all ages and backgrounds volunteered for Markham community events, in addition to the hundreds who volunteered directly with the event’s organizing committee. Events such as the opening of the Markham Pan Am Centre, the Pan Am Torch Relay, Pan Am Day in Canada and GlobalFest attracted thousands of participants, as did the sporting and cultural events themselves (G4-24).
• The beautiful Markham Pan Am Centre is quickly transitioning to become an international sports hub and a venue for use by local sports organizations and teams. It will be home to Canada’s National Table Tennis Team, and was chosen as the site of the World Table Tennis Competition, an Olympic qualifying event, in April 2016.
• City-organized events including Black History Month celebrations, the Canada Day celebrations, the RBC Markham Milliken Children’s Festival, the Remembrance Day ceremony and the Markham Santa Claus Parade.
• Almost 2,400 individuals provided their thoughts and ideas on our renewed strategic plan, Building Markham’s Future Together: 2015-2019, through our award-winning interactive online survey; many more attended a public forum held at the Markham Civic Centre on October 5. Council approved the plan on December 8, 2015 (G4-26).
• The Markham Public Library organized a well-attended TEDx event promoting technology, idea sharing and the arts.
Markham continued to enhance our public realm with art installations for the enjoyment of residents and visitors, including:
• Pan Am-themed art on traffi c signal utility cabinets;
• Street art by students at Unionville High School led by their art teacher Shane Clodd;
• The “CloudFlower” indoor mural by Douglas Walker at Cornell Community Centre and Library;
• "Shifting Landscapes” mural by James Ruddle at Henderson Bridge; and
• “Gambrel Journey” by Kip Jones at Markham Museum.
Markham’s economic base remains strong, with over 400 corporate head offi ces and more than 1,100 high-tech and life sciences companies. In 2015, total employment increased by 2.5 per cent and technology jobs by 8.8 per cent. These achievements will be further enhanced as we contimue to build awareness of the Markham Convergence Centre, ventureLab and the Markham Small Business Centre.
The City’s economic vitality will be enhanced through the Ontario Government’s commitment to the new campus for York University in Markham Centre. The new 4,000-student campus, scheduled to open in the fall of 2020, is one of the cornerstones of the City’s Economic Strategy “Markham 2020,” serving as a catalyst for the next phase of development and expansion of Markham Centre.
2015 Annual Report 1110 City of Markham

132015 Annual Report
SAFE & SUSTAINABLE COMMUNITY
• Approximately 300,000 trees planted since 2007(G4-EN12)
• 298 parks and parkettes (345.4 hectares)
25% of total housing is medium / high density – providing a range of housing options that are supported by public transit
81% municipal waste diversion rate
Nine fi re stations 1,003 km of
sidewalks
200 km bike network (including 30 km of multi-use pathways)
Two items high on the list of priorities that emerged from consultations leading up to Council’s adoption of the renewed strategic plan, Building Markham’s Future Together: 2015-2019, were protecting and respecting our built and natural environments, and managing growth in Markham. The third goal of our plan – Safe and Sustainable Community – addresses these priorities (G4-DMA, G4-27).
An important requirement for both protecting the environment and managing growth is the provision of good infrastructure, and in 2015 we completed $31.4 million in municipal infrastructure projects (G4-EC7). In addition, we coordinated Metrolinx and regional transportation projects, assisted Metrolinx in locating a regional transportation hub in the Cornell Community, and completed Phase 2 of the Multi-Use Pathway from 16th Avenue to the Milne Dam Conservation Area.
Municipal projects to preserve the natural environment are key to creating an environmentally sustainable community (G4-14). In 2015, we:
• Completed phase one of the Flood Control Program in West Thornhill, comprising $7.1 million in storm sewer upgrades in the Bayview Glen neighbourhood;
• Finished installing, in partnership with PowerStream Solar, a 450kW roof top solar array on the Markham Pan Am Centre. Markham now has 1.9MW solar capacity on nine city facilities, equal to the annual usage of 215 typical Markham households (G4-EU1);
• Met our goal of planting 6,000 trees, as part of Year 3 of the fi ve-year Emerald Ash Borer Management Plan, and removed 5,000 infected ash trees (G4-EN12);
• Installed Ontario’s fi rst municipally-owned electric vehicle Level 3 Fast Charger at the Markham Civic Centre; and
• Opened nine new parks.
Among our many activities to encourage Markham residents to become more involved in creating a safe and sustainable community, we (G4-DMA):
• Held another successful Earth Hour at Cornell Community Centre and Library, encouraging people to turn off all non-essential electricity and thereby reducing energy consumption in that hour in Markham by the amount as would be used by 660 homes in a 24-hour period (G4-EN6);
• Organized an e-waste day at the Thornhill Community Centre and Library, during which we collected more than 12,000 pounds of electronic waste that might otherwise have ended up contaminating a landfi ll site;
• Achieved an 81 per cent diversion of curbside waste from landfi ll, exceeding our “zero waste” target for a third consecutive year;
• Conducted 15 Markham Homegrown workshops for those interested in environmentally-friendly home gardening; and
• Markham arborists educated over 2,000 residents on the City’s Emerald Ash Borer Management Plan through 20 Markham Tree Talk events, engaging them in discussions about the importance of trees and how they can help increase the community’s tree canopy.
We also enhanced the Markham Main Street streetscape to promote local shopping and tourism and completed the Markham Main Street Bridge over the Rouge River, improving an important gateway to the city.
Our ability to manage growth in Markham was confi rmed in October when the Ontario Municipal Board granted partial approval for the 2014 Offi cial Plan. The Offi cial Plan provides a road map to 2031 for developing complete communities through intensifi cation and limited urban expansion.
2015 Annual Report 1312 City of Markham
152015 Annual Report
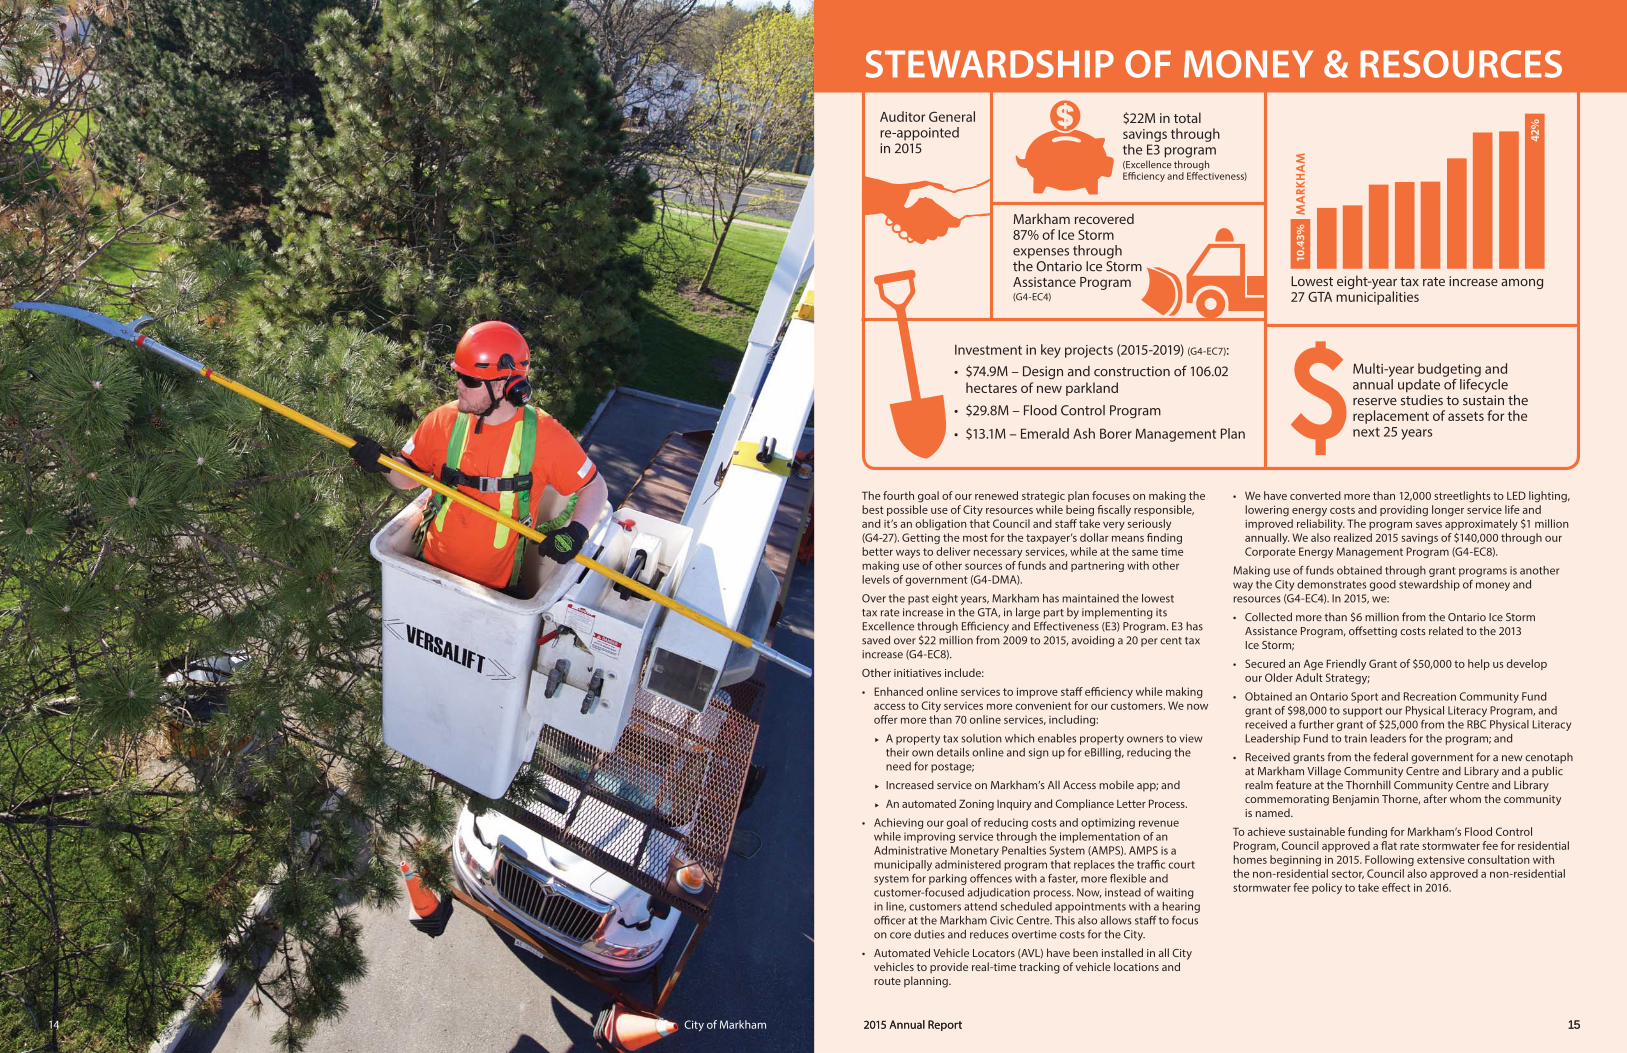
The fourth goal of our renewed strategic plan focuses on making the best possible use of City resources while being fi scally responsible, and it’s an obligation that Council and staff take very seriously (G4-27). Getting the most for the taxpayer’s dollar means fi nding better ways to deliver necessary services, while at the same time making use of other sources of funds and partnering with other levels of government (G4-DMA).
Over the past eight years, Markham has maintained the lowesttax rate increase in the GTA, in large part by implementing its Excellence through Effi ciency and Eff ectiveness (E3) Program. E3 has saved over $22 million from 2009 to 2015, avoiding a 20 per cent tax increase (G4-EC8).
Other initiatives include:
• Enhanced online services to improve staff effi ciency while making access to City services more convenient for our customers. We now off er more than 70 online services, including:
A property tax solution which enables property owners to view their own details online and sign up for eBilling, reducing the need for postage;
Increased service on Markham’s All Access mobile app; and
An automated Zoning Inquiry and Compliance Letter Process.
• Achieving our goal of reducing costs and optimizing revenue while improving service through the implementation of an Administrative Monetary Penalties System (AMPS). AMPS is a municipally administered program that replaces the traffi c court system for parking off ences with a faster, more fl exible and customer-focused adjudication process. Now, instead of waiting in line, customers attend scheduled appointments with a hearing offi cer at the Markham Civic Centre. This also allows staff to focus on core duties and reduces overtime costs for the City.
• Automated Vehicle Locators (AVL) have been installed in all City vehicles to provide real-time tracking of vehicle locations and route planning.
• We have converted more than 12,000 streetlights to LED lighting, lowering energy costs and providing longer service life and improved reliability. The program saves approximately $1 million annually. We also realized 2015 savings of $140,000 through our Corporate Energy Management Program (G4-EC8).
Making use of funds obtained through grant programs is another way the City demonstrates good stewardship of money and resources (G4-EC4). In 2015, we:
• Collected more than $6 million from the Ontario Ice Storm Assistance Program, off setting costs related to the 2013 Ice Storm;
• Secured an Age Friendly Grant of $50,000 to help us develop our Older Adult Strategy;
• Obtained an Ontario Sport and Recreation Community Fund grant of $98,000 to support our Physical Literacy Program, and received a further grant of $25,000 from the RBC Physical Literacy Leadership Fund to train leaders for the program; and
• Received grants from the federal government for a new cenotaph at Markham Village Community Centre and Library and a public realm feature at the Thornhill Community Centre and Library commemorating Benjamin Thorne, after whom the community is named.
To achieve sustainable funding for Markham’s Flood Control Program, Council approved a fl at rate stormwater fee for residential homes beginning in 2015. Following extensive consultation with the non-residential sector, Council also approved a non-residential stormwater fee policy to take eff ect in 2016.
STEWARDSHIP OF MONEY & RESOURCES$22M in total savings through the E3 program (Excellence through Effi ciency and Eff ectiveness)
Investment in key projects (2015-2019) (G4-EC7):
• $74.9M – Design and construction of 106.02 hectares of new parkland
• $29.8M – Flood Control Program
• $13.1M – Emerald Ash Borer Management Plan
Auditor General re-appointed in 2015
Markham recovered 87% of Ice Storm expenses through the Ontario Ice Storm Assistance Program(G4-EC4)
Multi-year budgeting and annual update of lifecycle reserve studies to sustain the replacement of assets for the next 25 years
Lowest eight-year tax rate increase among 27 GTA municipalities
10
.43
%
42
%
2015 Annual Report 1514 City of Markham
New Hires, Rehires and Turnover (G4-LA1)
From 2014 to 2015, regular full-time and part-time new hires decreased by 24.1 per cent. A drop of 16 employees within Non-Union and CUPE work group (from 43 to 27) accounts for this decrease. The departments with a signifi cant decrease are Recreation and Engineering.
There was a 7.3 per cent increase in temporary new hires from 2014 to 2015. 31.5 per cent of this increase is attributed to the employment of the Generation-Y workforce. City Recreation seasonal programs, and Operations seasonal support programs during the Pan Am Games have contributed to the temporary staff increases in 2015.
Temporary rehires decreased by 11.3 per cent from 2014 to 2015. This group mainly includes seasonal staff returning to roles in Parks maintenance, summer camps and other areas. The Human Resource recruitment process has changed, impacting the reduction compared to the previous year.
In 2015, overall City labour force turnover decreased 12.4 per cent as compared to 2014. This decrease mainly occurred among Generation-X and Generation-Y workforces. As the City continues to implement its People Plan Strategy, the organization’s ability to eff ectively deliver on the City’s strategic goals and operational plans will improve. By increasing rehires and reducing turnovers, we minimize training costs and improve eff ectiveness while retaining organizational knowledge.
Regular FT & Regular PT Temporary Total
New Hires and Turnover at December 31, 2015New Hires1 66 739 805
Rehires2 9 501 510
Turnover3 102 1,002 1,104
New Hires and Turnover at December 31, 2014New Hires1 87 689 776
Rehires2 7 565 572
Turnover3 96 1,164 1,260
New Hires at December 31, 2015Baby Boomers and Traditionalists (>50)
10 39 49
Generation X (30 - 50) 35 79 114
Generation Y (<30)4 21 621 642
New Hires at December 31, 2014Baby Boomers and Traditionalists (>50)
17 29 46
Generation X (30 - 50) 44 79 123
Generation Y (<30)4 26 581 607
Turnover at December 31, 2015Baby Boomers and Traditionalists (>50)
56 77 133
Generation X (30 - 50) 28 122 150
Generation Y (<30)4 18 803 821
Turnover at December 31, 2014Baby Boomers and Traditionalists (>50)
45 84 129
Generation X (30 - 50) 29 167 196
Generation Y (<30)4 22 913 935
Workforce (G4-10)
The City of Markham consists of 18 departments across four Commissions. As of December 31, 2015, Markham employed 992 full-time permanent staff members, 272 permanent part-time staff members and 1,376 temporary staff members. From 2014 to 2015, the City’s total workforce increased 7.4 per cent, mainly attributable to the 18.4 per cent increase in temporary, seasonal and contract staff . Despite the increase in workforce for 2015, gender representation remains the same as 2014: 53.2 per cent male, 46.8 per cent female (G4-LA12). (See chart in next column.)
Celebrating Markham SustainabilityIn 2011, Markham became one of the fi rst municipalities in Canada to use the Global Reporting Initiative (GRI) process, a framework used by many Canadian and international corporations. By integrating sustainability indicators into Markham’s Annual Report, the City presents a complete picture of its fi nancial/economic, social and environmental status in a single document, giving residents and other stakeholders one convenient source for important information about their city. Our stakeholders celebrate Markham's leadership on environmental protection, enhancement and sustainability, while balancing economic prosperity, growth, and the social and cultural health and vibrancy of our neighbourhoods.
Guided by The Greenprint, Markham’s Community Sustainability Plan and the specifi c initiatives that fl ow from its priorities, we are well positioned to meet our goals. The reporting process continues to evolve in an eff ort to maintain transparency and accountability to stakeholders and to better measure the progress made in meeting our sustainability metrics.
How Markham Uses GRIThe GRI framework guides an organization in choosing what to measure, and how to gather and present information. GRI indicators cover both qualitative and quantitative measures. For example, G4-1 specifi es that a report must include a statement on sustainability from the Mayor and the Chief Administrative Offi cer, and G4-5 requires identifying the organization’s location. G4-24 through G4-27 deal with indicators that demonstrate an organization’s eff orts to engage stakeholders. G4-EN3 calls for measuring energy used within the organization, and G4-EN6 for measuring energy reduction. You can identify when a GRI reporting requirement has been met in two ways: note the indicator’s identifi er (for example, G4-1) in brackets after the relevant statement, or refer to the chart on (pages 46 & 47), which provides a table of contents for all of the GRI indicators used in this report.
Materiality Analysis (G4-18)Reporting on what is material – that is, what is important to an organization – is the foundation for building a GRI report. As such, the contents of this Report have been shaped by our analysis, which satisfi es the GRI principles for defi ning report content, sustainability context, materiality, completeness and stakeholder inclusiveness. We assess economic, social and environmental issues that are of most concern to our stakeholders against those that pose risks or present opportunities to the City of Markham. Conducting a thorough materiality analysis not only helps us to identify issues that stakeholders want to see us cover in our reporting, but also helps us to decide where to focus our internal resources.
Stakeholder Engagement (G4-DMA, G4-SO1)In determining the sustainability issues to address in this report, we started with the goals identifi ed in Building Markham’s Future Together: 2015-2019 (G4-26), and The Greenprint, which sets out the City’s vision and priorities for a sustainable future (G4-19).
Markham Sustainability Report
Stakeholder Engagement (Continued)
We engaged with internal and external stakeholders through a survey where respondents were asked to rank their top four strategic objectives out of seven presented. The chart below shows that “Managing our Transportation and Road Network” was ranked #1 by the majority of respondents (81.9 per cent). “Improving Customer Services and Transforming Services Through Technology and Innovation” was only seen as a top strategic objectives by 31.8 per cent of respondents (ranking it #7):
Materiality from BMFT (G4-20)
Overall Rank Percentage
Total Resident Response Strategic Objective
1 81.9% 1,609 Managing our Transportation and Road Network
2 68.4% 1,344 Promoting Markham as the Best Place in Canada to Invest and Locate Knowledge-based Industries
3 67.9% 1,334 Protecting and Respecting Our Built and Natural Environment
4 65.3% 1,283 Managing Growth in Markham
5 47.9% 942 Ensuring a Fiscally Prudent and Effi cient Municipality and Increase Transparency and Accountability
6 35.4% 696 Increasing Community Engagement & Ensuring Markham is Welcoming and Inclusive
7 31.8% 624 Improving Customer Services and Transforming Services Through Technology and Innovation
There is a clear distinction between the respondents’ selection of the top four strategic objectives. More than 65.3 per cent of all survey respondents ranked objectives 1 - 4 as the most important, while less than half (47.9 per cent or lower) viewed the strategic objectives 5 - 7 as being important.
Based in part on the survey results, we decided to focus on two of the 12 sustainability priorities contained in The Greenprint. These two are Energy and Climate, and Food Security (G4-27), and we measure them and our overall sustainability using over 60 GRI indicators.
The City of Markham continually refi nes its approach in identifying and reporting on its material sustainability issues. To help ensure that our reporting continuously improves and meets our stakeholders’ expectations, we regularly assess which issues are most important to our organization (G4-18).
Human Resources (G4-DMA)The most important resource of our organization is our people. Having knowledgeable and highly-skilled individuals dedicated to public service allows the diverse needs of the community to be met in an eff ective way. The City is developing a People Plan to strengthen the organization’s capacity and eff ectiveness in meeting and delivering on the strategic goals and operations plans over the long term. Part of this is to ensure that the right people with the right skills are in place at the right time.
Workforce (Continued)
Gender Representation in the City Labour Force (G4-10, G4-LA1)
Regular FT & Regular PT Temporary
Total Workforce
Number of employees at December 31, 20155Total6 1,264 1,376 2,640
Male 751 653 1,404
Female 513 723 1,236
Management (with direct reports)
205
Non-Management 2,435
Number of employees at December 31, 2014Total 1,297 1,162 2,459
Male 761 537 1,298
Female 536 625 1,161
Management (with direct reports)
207
Non-Management 2,252
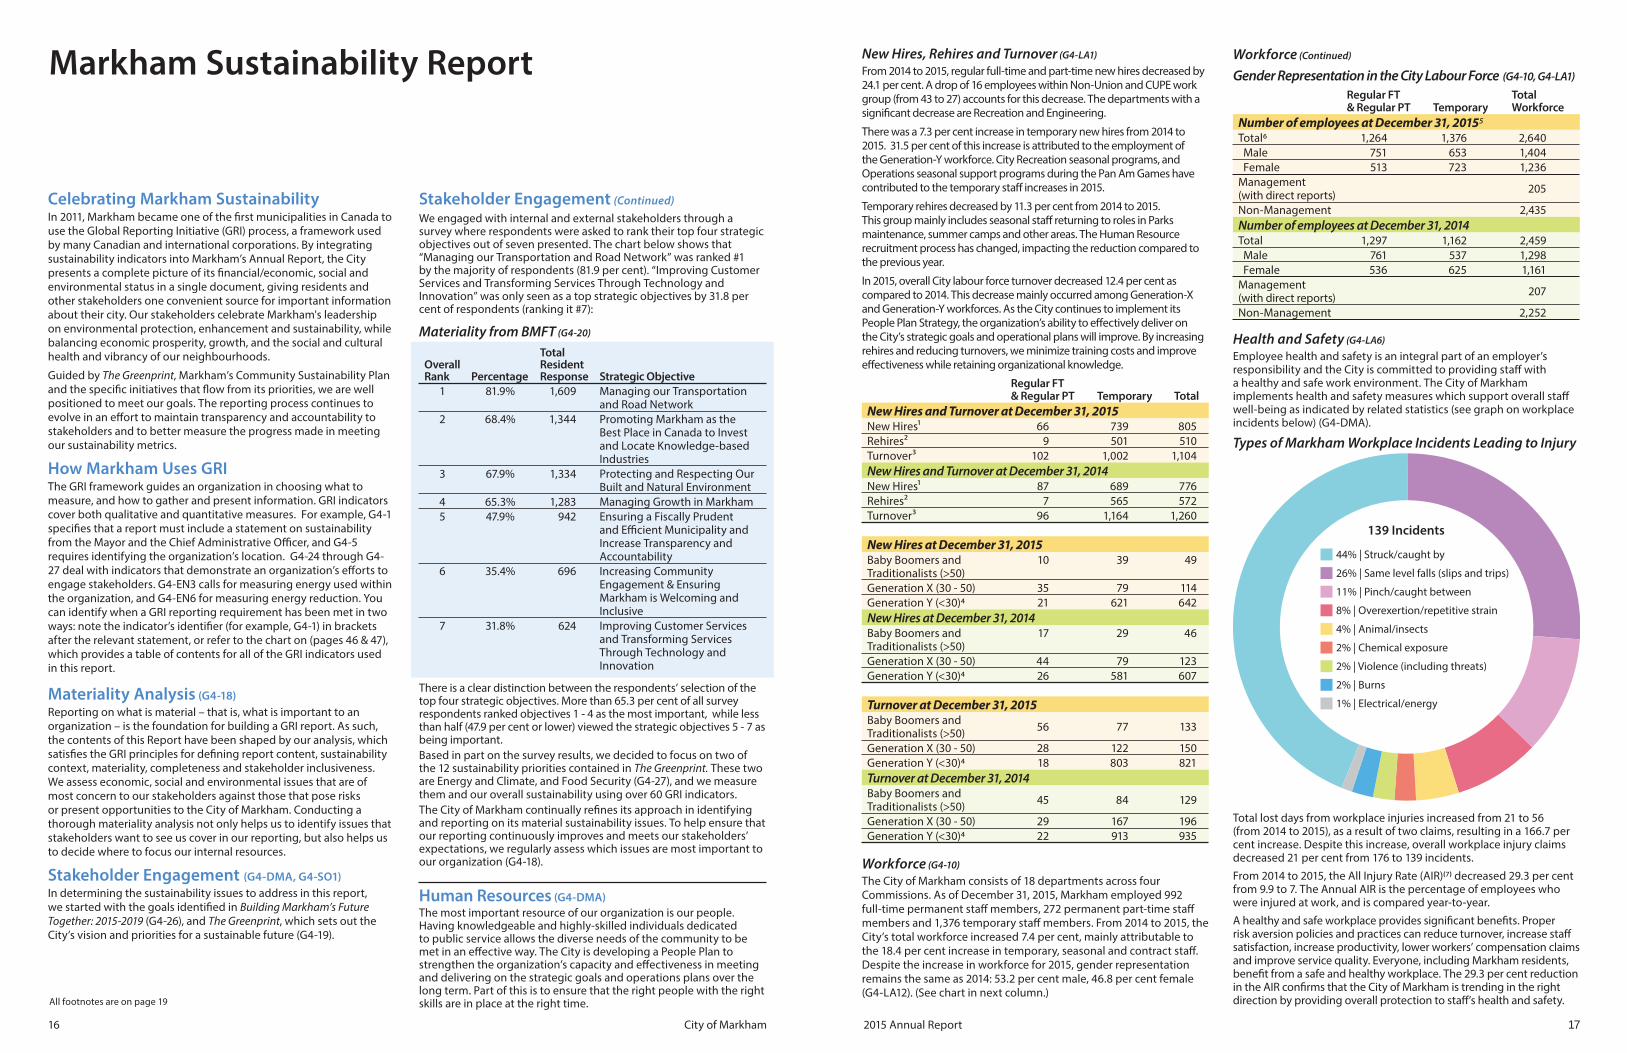
Health and Safety (G4-LA6)
Employee health and safety is an integral part of an employer’s responsibility and the City is committed to providing staff with a healthy and safe work environment. The City of Markham implements health and safety measures which support overall staff well-being as indicated by related statistics (see graph on workplace incidents below) (G4-DMA).
Types of Markham Workplace Incidents Leading to Injury
44% | Struck/caught by
26% | Same level falls (slips and trips)
11% | Pinch/caught between
8% | Overexertion/repetitive strain
4% | Animal/insects
2% | Chemical exposure
2% | Violence (including threats)
2% | Burns
1% | Electrical/energy
139 Incidents
Total lost days from workplace injuries increased from 21 to 56 (from 2014 to 2015), as a result of two claims, resulting in a 166.7 per cent increase. Despite this increase, overall workplace injury claims decreased 21 per cent from 176 to 139 incidents.
From 2014 to 2015, the All Injury Rate (AIR)(7) decreased 29.3 per cent from 9.9 to 7. The Annual AIR is the percentage of employees who were injured at work, and is compared year-to-year.
A healthy and safe workplace provides signifi cant benefi ts. Proper risk aversion policies and practices can reduce turnover, increase staff satisfaction, increase productivity, lower workers’ compensation claims and improve service quality. Everyone, including Markham residents, benefi t from a safe and healthy workplace. The 29.3 per cent reduction in the AIR confi rms that the City of Markham is trending in the right direction by providing overall protection to staff ’s health and safety.All footnotes are on page 19
2015 Annual ReportCity of Markham 1716
Woodland Habitat Restoration (G4-EN13)In the City of Markham, almost 4 hectares (ha) of future woodland habitat were created as the result of restoration tree planting projects in 2015 (G4-DMA). The restored areas will be woodland habitat that, once mature, will satisfy York Region’s defi nition of woodland.
2015 Areas Restored
PartnershipsPartnerships such as the Markham/TRCA 50/50 Community Project Program, along with multi-party restoration projects made possible through the City’s Trees for Tomorrow Program, have contributed signifi cantly to the total area of habitat restored and/or protected. This is over and above the habitat restored or protected as the result of new park development or habitat restoration in compensation for the impacts of development in any given year.
Water Consumption (G4- EN8) In 2015, 31.1 million m3 was consumed by Markham’s residential, industrial, commercial and institutional customers as compared to 30.7 million m3 in 2014.
The City of Markham’s total water consumption data is collected from 76 facilities and 37 parks. The Region of York supplies Markham’s local water distribution system with water sourced from Lake Ontario and treated through water treatment plants in the City of Toronto and the Region of Peel (G4-DMA).
Water Consumption Breakdown
0 50 100 150 200 250 300 350 400Consumption in 1,000m3
2015
2014
City-owned Facilities City-owned Parks
Overall, 2015 facility consumption has remained relatively fl at despite having the Olympic-sized pool in the Markham Pan Am facility come online. There was a 7.1 per cent increase in City facility water consumption and the Markham Pan Am Centre represents 83 per cent of this overall increase. There was a 13.6 per cent reduction in parks water consumption from 2014 to 2015.
Environmental Performance (G4-DMA)As a growing municipality, reducing total greenhouse gas (GHG)emissions is challenging. Committed to environmental protection, the City has adopted new practices for enhanced sustainability reporting to increase accuracy and reliability.
To ensure consistency, 2014 energy consumption and GHG data has been restated due to a delay in billing-cycle system synchronization and improvements in conversion factor accuracy, through the Partners in Climate Protection (PCP) Tool and Markham District Energy. Now that the Markham Pan Am Centre has come online, we have retroactively factored in its facility energy consumption and GHG emission data (G4-22). With the updated energy and GHG calculations, overall GHG emissions have decreased in 2015 over 2014. This reduction is a result of the City’s proactive energy savings programs and greening of the provincial electricity grid.
Environmental Performance (Continued)
Total 2015 Energy Consumption and GHG Emissions (G4-EN3, G4-EN4, G4-EN15, G4-EN16, G4-EN17)
Direct Energy Source
2015 Consumption
(000's)
2014 Consumption
(000's)2015 GHG
2014 GHG
Natural gas (M3) 3,060 3,144* 5,787 5,946*
Electricity (kWh) 32,892 31,619 1,645 1,581*
Streetlighting (kWh) 13,700 15,394 685 770*
District heating (kWh) 11,253 8,785* 1,580 1,347*
District cooling (kWh) 7,593 5,277* 129 98*
Unleaded Fuel (L) 414 448 952 1,029
Biodiesel B5 (L) 207 280* 539 727
Biodiesel B20 (L) 176 176 387 386
Propane (L) 41 53 64 82
Total 11,768 11,966*
Note: 2015 Corporate GHG emissions are calculated using the Federation of Canadian Municipalities (FCM) PCP tool 2014 conversion factors. *Restated
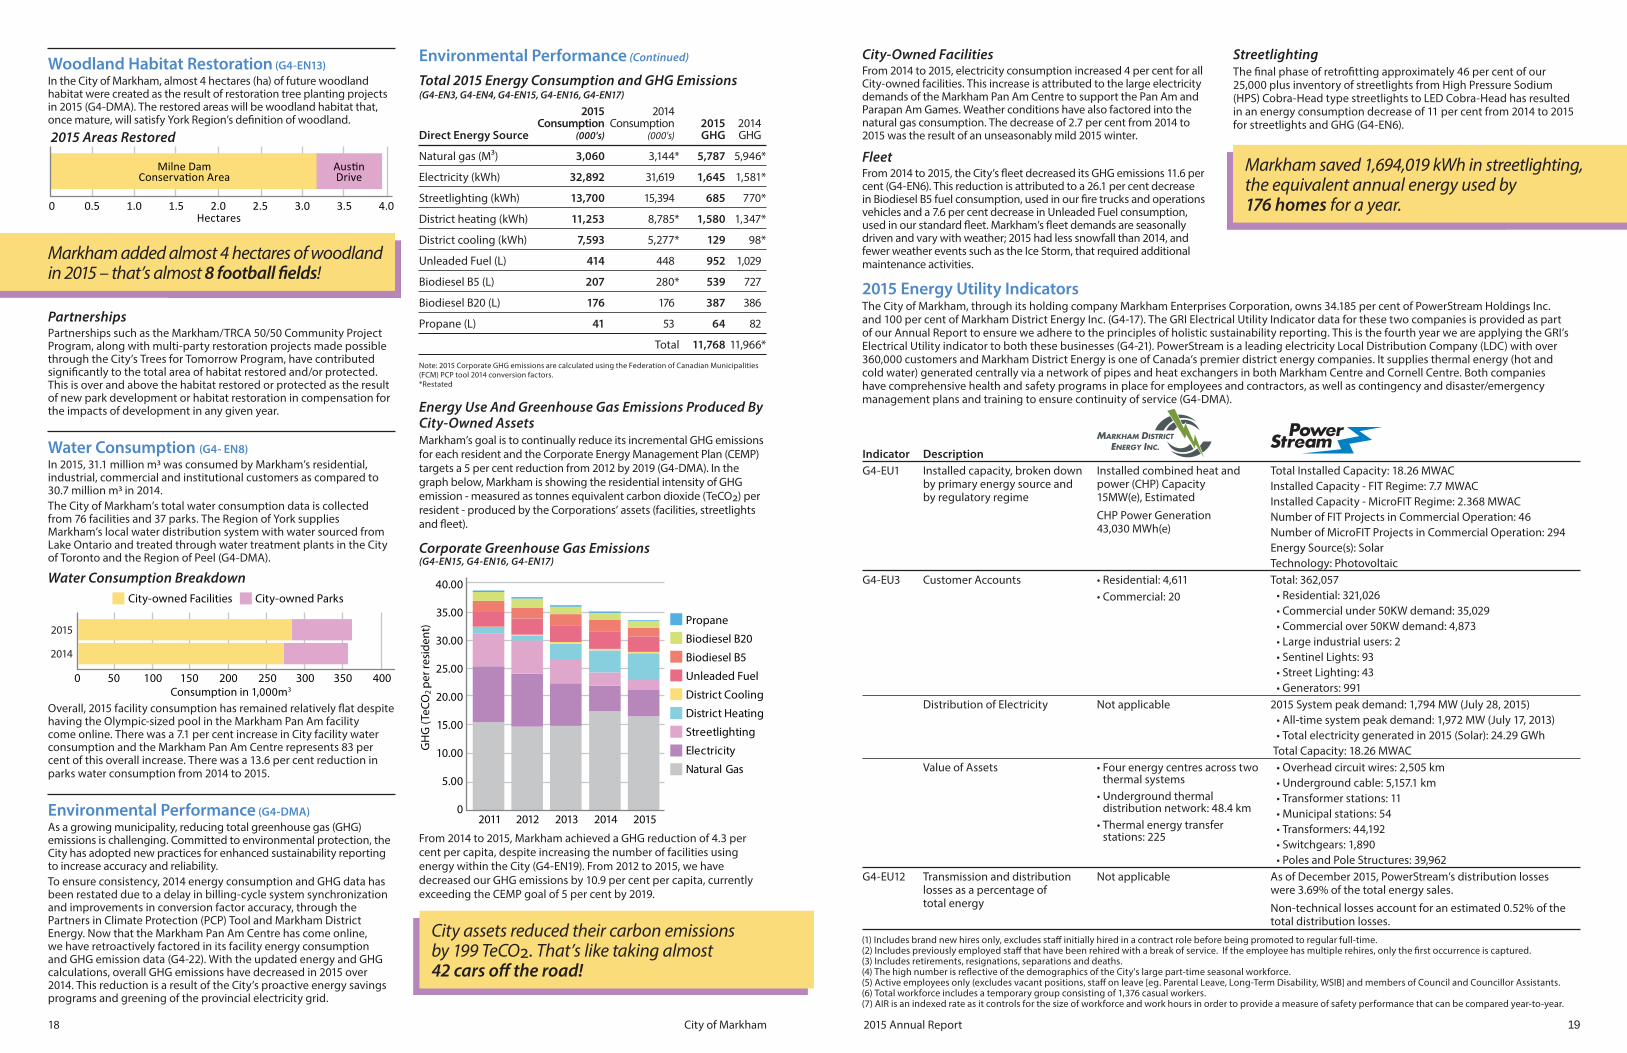
Energy Use And Greenhouse Gas Emissions Produced By City-Owned AssetsMarkham’s goal is to continually reduce its incremental GHG emissions for each resident and the Corporate Energy Management Plan (CEMP) targets a 5 per cent reduction from 2012 by 2019 (G4-DMA). In the graph below, Markham is showing the residential intensity of GHG emission - measured as tonnes equivalent carbon dioxide (TeCO2) per resident - produced by the Corporations’ assets (facilities, streetlights and fl eet).
Corporate Greenhouse Gas Emissions (G4-EN15, G4-EN16, G4-EN17)
2011 2012 2013 2014 2015
GH
G (
TeC
O2
pe
r re
sid
en
t)
0
5.00
10.00
15.00
20.00
25.00
30.00
35.00
40.00
Propane
Biodiesel B20
Biodiesel B5
Unleaded Fuel
District Cooling
District Heating
Streetlighting
Electricity
Natural Gas
From 2014 to 2015, Markham achieved a GHG reduction of 4.3 per cent per capita, despite increasing the number of facilities using energy within the City (G4-EN19). From 2012 to 2015, we have decreased our GHG emissions by 10.9 per cent per capita, currently exceeding the CEMP goal of 5 per cent by 2019.
Indicator DescriptionG4-EU1 Installed capacity, broken down
by primary energy source and by regulatory regime
Installed combined heat and power (CHP) Capacity 15MW(e), Estimated
CHP Power Generation 43,030 MWh(e)
Total Installed Capacity: 18.26 MWAC
Installed Capacity - FIT Regime: 7.7 MWAC
Installed Capacity - MicroFIT Regime: 2.368 MWAC
Number of FIT Projects in Commercial Operation: 46
Number of MicroFIT Projects in Commercial Operation: 294
Energy Source(s): Solar
Technology: Photovoltaic
G4-EU3 Customer Accounts • Residential: 4,611
• Commercial: 20
Total: 362,057
• Residential: 321,026
• Commercial under 50KW demand: 35,029
• Commercial over 50KW demand: 4,873
• Large industrial users: 2
• Sentinel Lights: 93
• Street Lighting: 43
• Generators: 991
Distribution of Electricity Not applicable 2015 System peak demand: 1,794 MW (July 28, 2015)
• All-time system peak demand: 1,972 MW (July 17, 2013)
• Total electricity generated in 2015 (Solar): 24.29 GWh
Total Capacity: 18.26 MWAC
Value of Assets • Four energy centres across two thermal systems
• Underground thermal distribution network: 48.4 km
• Thermal energy transfer stations: 225
• Overhead circuit wires: 2,505 km
• Underground cable: 5,157.1 km
• Transformer stations: 11
• Municipal stations: 54
• Transformers: 44,192
• Switchgears: 1,890
• Poles and Pole Structures: 39,962
G4-EU12 Transmission and distribution losses as a percentage of total energy
Not applicable As of December 2015, PowerStream’s distribution losses were 3.69% of the total energy sales.
Non-technical losses account for an estimated 0.52% of the total distribution losses.
City assets reduced their carbon emissions by 199 TeCO2. That’s like taking almost 42 cars off the road!
Markham saved 1,694,019 kWh in streetlighting, the equivalent annual energy used by 176 homes for a year.
City-Owned FacilitiesFrom 2014 to 2015, electricity consumption increased 4 per cent for all City-owned facilities. This increase is attributed to the large electricity demands of the Markham Pan Am Centre to support the Pan Am and Parapan Am Games. Weather conditions have also factored into the natural gas consumption. The decrease of 2.7 per cent from 2014 to 2015 was the result of an unseasonably mild 2015 winter.
FleetFrom 2014 to 2015, the City’s fl eet decreased its GHG emissions 11.6 per cent (G4-EN6). This reduction is attributed to a 26.1 per cent decrease in Biodiesel B5 fuel consumption, used in our fi re trucks and operations vehicles and a 7.6 per cent decrease in Unleaded Fuel consumption, used in our standard fl eet. Markham’s fl eet demands are seasonally driven and vary with weather; 2015 had less snowfall than 2014, and fewer weather events such as the Ice Storm, that required additional maintenance activities.
StreetlightingThe fi nal phase of retrofi tting approximately 46 per cent of our 25,000 plus inventory of streetlights from High Pressure Sodium (HPS) Cobra-Head type streetlights to LED Cobra-Head has resulted in an energy consumption decrease of 11 per cent from 2014 to 2015 for streetlights and GHG (G4-EN6).
(1) Includes brand new hires only, excludes staff initially hired in a contract role before being promoted to regular full-time.(2) Includes previously employed staff that have been rehired with a break of service. If the employee has multiple rehires, only the fi rst occurrence is captured.(3) Includes retirements, resignations, separations and deaths.(4) The high number is refl ective of the demographics of the City's large part-time seasonal workforce.(5) Active employees only (excludes vacant positions, staff on leave [eg. Parental Leave, Long-Term Disability, WSIB] and members of Council and Councillor Assistants.(6) Total workforce includes a temporary group consisting of 1,376 casual workers.(7) AIR is an indexed rate as it controls for the size of workforce and work hours in order to provide a measure of safety performance that can be compared year-to-year.
0 0.5 1.0 1.5 2.0 2.5 3.0 3.5 4.0
Markham added almost 4 hectares of woodland in 2015 – that’s almost 8 football fi elds!
2015 Energy Utility IndicatorsThe City of Markham, through its holding company Markham Enterprises Corporation, owns 34.185 per cent of PowerStream Holdings Inc. and 100 per cent of Markham District Energy Inc. (G4-17). The GRI Electrical Utility Indicator data for these two companies is provided as part of our Annual Report to ensure we adhere to the principles of holistic sustainability reporting. This is the fourth year we are applying the GRI’s Electrical Utility indicator to both these businesses (G4-21). PowerStream is a leading electricity Local Distribution Company (LDC) with over 360,000 customers and Markham District Energy is one of Canada’s premier district energy companies. It supplies thermal energy (hot and cold water) generated centrally via a network of pipes and heat exchangers in both Markham Centre and Cornell Centre. Both companies have comprehensive health and safety programs in place for employees and contractors, as well as contingency and disaster/emergency management plans and training to ensure continuity of service (G4-DMA).
2015 Annual ReportCity of Markham 1918
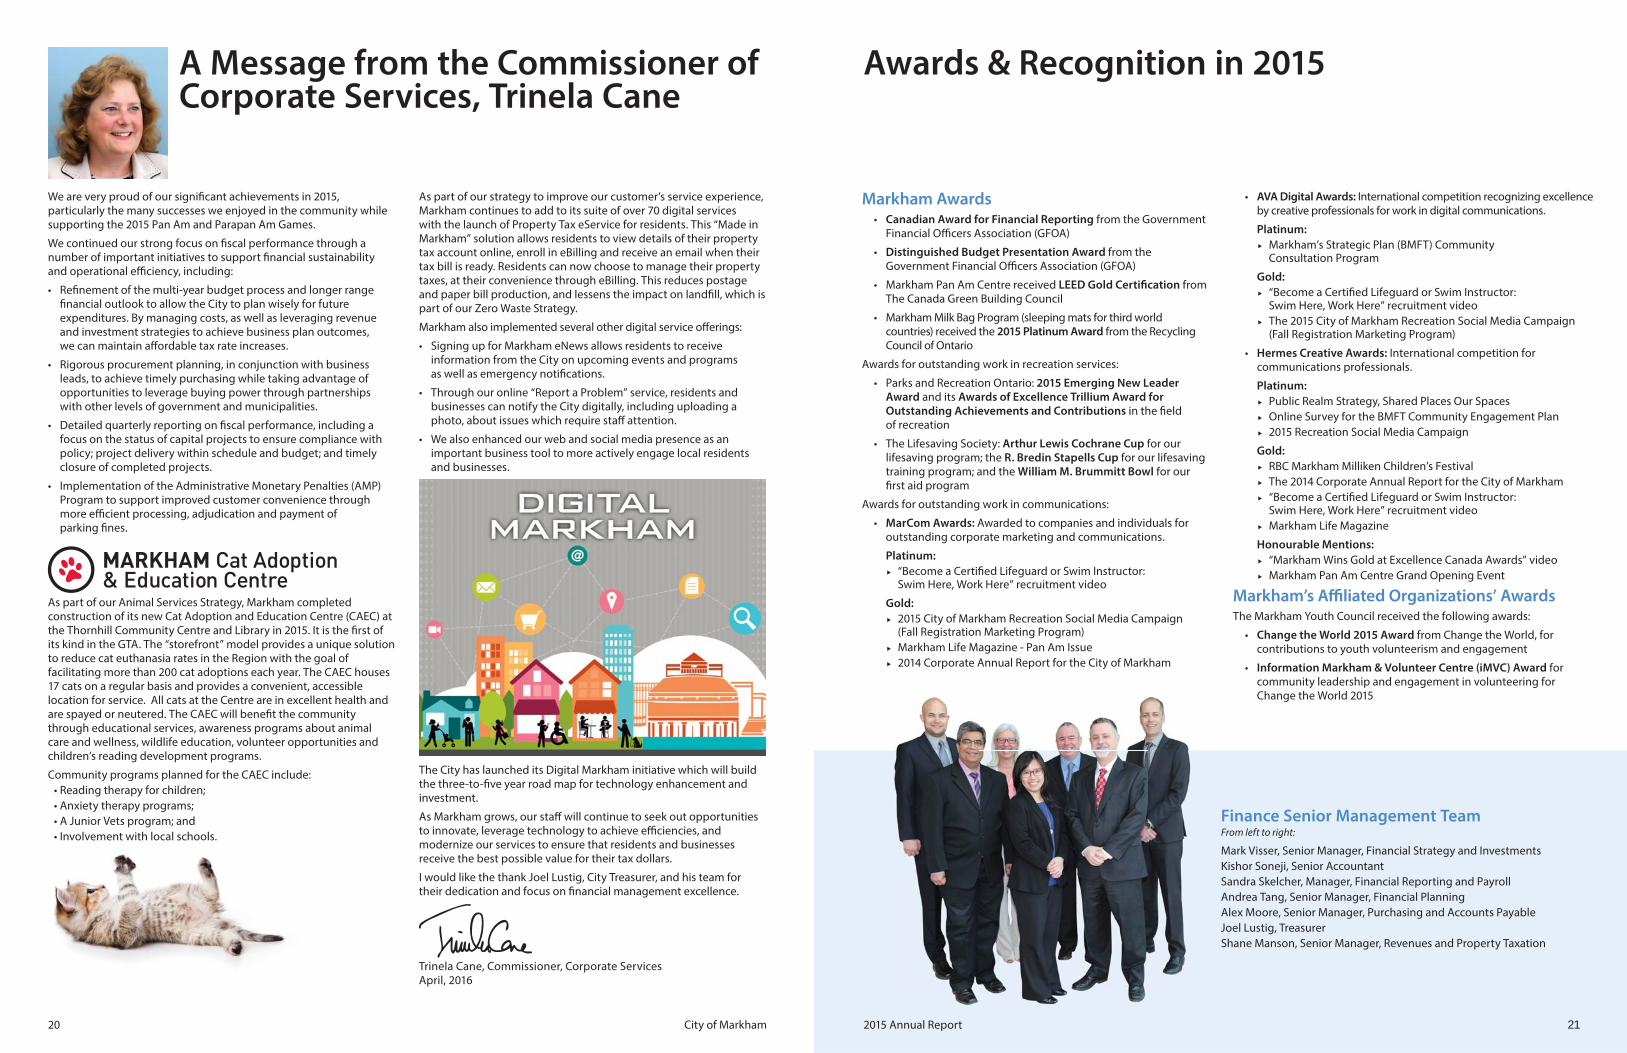
Finance Senior Management TeamFrom left to right:
Mark Visser, Senior Manager, Financial Strategy and Investments
Kishor Soneji, Senior Accountant
Sandra Skelcher, Manager, Financial Reporting and Payroll
Andrea Tang, Senior Manager, Financial Planning
Alex Moore, Senior Manager, Purchasing and Accounts Payable
Joel Lustig, Treasurer
Shane Manson, Senior Manager, Revenues and Property Taxation
We are very proud of our signifi cant achievements in 2015, particularly the many successes we enjoyed in the community while supporting the 2015 Pan Am and Parapan Am Games.
We continued our strong focus on fi scal performance through a number of important initiatives to support fi nancial sustainability and operational effi ciency, including:
• Refi nement of the multi-year budget process and longer range fi nancial outlook to allow the City to plan wisely for future expenditures. By managing costs, as well as leveraging revenue and investment strategies to achieve business plan outcomes, we can maintain aff ordable tax rate increases.
• Rigorous procurement planning, in conjunction with business leads, to achieve timely purchasing while taking advantage of opportunities to leverage buying power through partnerships with other levels of government and municipalities.
• Detailed quarterly reporting on fi scal performance, including a focus on the status of capital projects to ensure compliance with policy; project delivery within schedule and budget; and timely closure of completed projects.
• Implementation of the Administrative Monetary Penalties (AMP) Program to support improved customer convenience through more effi cient processing, adjudication and payment of parking fi nes.
As part of our Animal Services Strategy, Markham completed construction of its new Cat Adoption and Education Centre (CAEC) at the Thornhill Community Centre and Library in 2015. It is the fi rst of its kind in the GTA. The “storefront” model provides a unique solution to reduce cat euthanasia rates in the Region with the goal of facilitating more than 200 cat adoptions each year. The CAEC houses 17 cats on a regular basis and provides a convenient, accessible location for service. All cats at the Centre are in excellent health and are spayed or neutered. The CAEC will benefi t the community through educational services, awareness programs about animal care and wellness, wildlife education, volunteer opportunities and children’s reading development programs.
Community programs planned for the CAEC include:
• Reading therapy for children;
• Anxiety therapy programs;
• A Junior Vets program; and
• Involvement with local schools.
A Message from the Commissioner of Corporate Services, Trinela Cane
As part of our strategy to improve our customer’s service experience, Markham continues to add to its suite of over 70 digital services with the launch of Property Tax eService for residents. This “Made in Markham” solution allows residents to view details of their property tax account online, enroll in eBilling and receive an email when their tax bill is ready. Residents can now choose to manage their property taxes, at their convenience through eBilling. This reduces postage and paper bill production, and lessens the impact on landfi ll, which is part of our Zero Waste Strategy.
Markham also implemented several other digital service off erings:
• Signing up for Markham eNews allows residents to receive information from the City on upcoming events and programs as well as emergency notifi cations.
• Through our online “Report a Problem” service, residents and businesses can notify the City digitally, including uploading a photo, about issues which require staff attention.
• We also enhanced our web and social media presence as an important business tool to more actively engage local residents and businesses.
The City has launched its Digital Markham initiative which will build the three-to-fi ve year road map for technology enhancement and investment.
As Markham grows, our staff will continue to seek out opportunities to innovate, leverage technology to achieve effi ciencies, and modernize our services to ensure that residents and businesses receive the best possible value for their tax dollars.
I would like the thank Joel Lustig, City Treasurer, and his team for their dedication and focus on fi nancial management excellence.
Trinela Cane, Commissioner, Corporate ServicesApril, 2016
Markham Awards• Canadian Award for Financial Reporting from the Government
Financial Offi cers Association (GFOA)
• Distinguished Budget Presentation Award from the Government Financial Offi cers Association (GFOA)
• Markham Pan Am Centre received LEED Gold Certifi cation from The Canada Green Building Council
• Markham Milk Bag Program (sleeping mats for third world countries) received the 2015 Platinum Award from the Recycling Council of Ontario
Awards for outstanding work in recreation services:
• Parks and Recreation Ontario: 2015 Emerging New Leader Award and its Awards of Excellence Trillium Award for Outstanding Achievements and Contributions in the fi eld of recreation
• The Lifesaving Society: Arthur Lewis Cochrane Cup for our lifesaving program; the R. Bredin Stapells Cup for our lifesaving training program; and the William M. Brummitt Bowl for our fi rst aid program
Awards for outstanding work in communications:
• MarCom Awards: Awarded to companies and individuals for outstanding corporate marketing and communications.
Platinum: “Become a Certifi ed Lifeguard or Swim Instructor:
Swim Here, Work Here” recruitment video
Gold: 2015 City of Markham Recreation Social Media Campaign
(Fall Registration Marketing Program)
Markham Life Magazine - Pan Am Issue
2014 Corporate Annual Report for the City of Markham
• AVA Digital Awards: International competition recognizing excellence by creative professionals for work in digital communications.
Platinum: Markham’s Strategic Plan (BMFT) Community
Consultation Program
Gold: “Become a Certifi ed Lifeguard or Swim Instructor:
Swim Here, Work Here” recruitment video
The 2015 City of Markham Recreation Social Media Campaign (Fall Registration Marketing Program)
• Hermes Creative Awards: International competition for communications professionals.
Platinum: Public Realm Strategy, Shared Places Our Spaces
Online Survey for the BMFT Community Engagement Plan
2015 Recreation Social Media Campaign
Gold: RBC Markham Milliken Children’s Festival
The 2014 Corporate Annual Report for the City of Markham
“Become a Certifi ed Lifeguard or Swim Instructor: Swim Here, Work Here” recruitment video
Markham Life Magazine
Honourable Mentions: “Markham Wins Gold at Excellence Canada Awards” video
Markham Pan Am Centre Grand Opening Event
Markham’s Affi liated Organizations’ Awards The Markham Youth Council received the following awards:
• Change the World 2015 Award from Change the World, for contributions to youth volunteerism and engagement
• Information Markham & Volunteer Centre (iMVC) Award for community leadership and engagement in volunteering for Change the World 2015
Awards & Recognition in 2015
2015 Annual ReportCity of Markham 2120

2015 Financial Statements Review(All dollar amounts are in $000)
The Corporation of the City of Markham is pleased to present the 2015 Consolidated Financial Statements. The Consolidated Financial Statements are the responsibility of Management and have been prepared in accordance with the Municipal Act, 2001 based on the reporting standards set by the Public Sector Accounting Board (PSAB) of the Canadian Institute of Chartered Accountants. The consolidated statements include the fi nancial results of the City of Markham, the Markham Public Library Board, Community Boards and Business Improvement Areas (BIAs), as well as the City’s wholly owned investment in Markham Enterprises Corporation (MEC), including MEC’s shares in PowerStream Holdings Inc. of 34.185 per cent and in Markham District Energy Inc. (MDE) of 100 per cent.
Each year the City’s business units produce business plans that present their accomplishments from the previous year, and detail their growth requirements and new initiatives for the coming year. From this process, the budget is prepared to ensure it aligns with and supports the goals and strategic priorities of the City of Markham.
The Budget Committee, which consists of Members of Council, supported by senior staff , encourages input and feedback from stakeholders and uses a management-by-facts approach to ensure taxpayers are receiving value for their property tax dollars. Budget guidelines and priorities are set early in the process and budget requests are submitted to the Commissioners and CAO for rigorous review, resulting in a budget recommendation for the Budget Committee and Council.
The City is proud of its fi nancial performance and strategies to address growth and increased demand for services through Excellence through Effi ciency & Eff ectiveness (E3) initiatives. Without E3 there would have been a need for a property tax increase of approximately 20 per cent. The increase would have been paid out year after year by Markham taxpayers on a cumulative basis.
1. HighlightsAnnual (Current Year) SurplusThe Annual Surplus is shown on the Statement of Operations and Accumulated Surplus, and is the mathematical result of total revenues for the year, less total expenses. The current year surplus is $108,020, an increase of $21,112 over the surplus reported for 2014, and represents a favourable diff erence of $114,826 when compared to the 2015 budget.
Although the net budget versus actual variance was favourable in 2015, there are signifi cant plus and minus diff erences when comparing at the ‘Revenues’ or ‘Expenses’ levels. That is, the revenues variance to budget was favourable by $143,921 while expenses were unfavourable by $29,095.
Annual (Current Year) Surplus (Continued)
A key reason for the variances between budget and actual is that the City does not include certain unknown or highly unpredictable items when preparing the annual operating budget. The most prominent examples are observed in contributions from developers and deferred revenues earned:
• Contributions from developers consist mostly of assets that have been constructed by developers, and are transferred and recorded in City fi nancials at the time the City accepts responsibility for the maintenance of the municipal services. These include assets such as roads, sidewalks storm sewers, etc. This usually occurs within a minimum of three to four years from registration of a subdivision agreement, although it may be longer depending on the development. Contributed land is recorded earlier in the process at the time of plan registration. The value of contributed assets diff ers from year to year, based on the number of plans registered, timing of subdivision assumptions and the infrastructure constructed within each subdivision in any given year. These factors make it extremely diffi cult to predict (or budget) for these revenues.
• Deferred revenues earned refers to monies that were received and set aside in prior years but used for their intended purpose (earned), within the current year. During the year, $51,695 was earned, having been used to construct assets such as the South East Community Centre and Library, and parkland for school sites in Boxgrove. Again, the annual progress of the projects (spending of deferred revenues) is very diffi cult to predict.
Another reason for the variances between budget and actual is that the budget includes items that were originally represented in the City’s capital project budget. Because some of the projects are “operating” in nature, the associated revenues & expenses must be included in the calculation of the annual surplus. Although the budget for these projects is shown in the year in which it is approved, the actual spending often occurs in subsequent years. Therefore, the revenues or expense budgets often do not match the timing of the actual spending.
Accumulated Surplus
The Accumulated Surplus is derived by adding the current year Annual Surplus to the Accumulated Surplus of the prior year. The Accumulated Surplus includes the total Operating Surplus, the City’s equity in MEC, investment in tangible capital assets as well as reserve and reserve fund balances. The Accumulated Surplus has grown by an average of $128,848 per year over the past fi ve years.
Recovery of Expenses from the 2013 Ice Storm
The City of Markham experienced an extreme winter storm from December 21-22, 2013. Freezing rain and ice pellets led to signifi cant ice accumulation of approximately one inch, resulting in power outages due to fallen trees and tree limbs on the overhead power lines.
The total ice storm related costs were $10,000. The City submitted a claim of $7,087 to the Government of Ontario under the Ice Storm Assistance Program and received $6,142, equivalent to 86.7 per cent of the claim. The remaining expenses were deemed ineligible based on the guidelines issued by the Government of Ontario, the majority of which related to tree canopy and replacement costs.
Reserves & Reserve FundsReserves and Reserve Funds represent the means by which the City tracks monies set aside by Council for specifi c future purposes. The infl ows into these funds are from the operating budget and the outfl ows are generally to fund capital and other projects as directed by Council.
The Reserves and Reserve Funds totalled $191,028, of which $113,338 were Reserves and $77,690 were Reserve Funds. Although there was a decrease of $5,082 in 2015, Markham’s Reserves and Reserve Funds have seen an overall increase of 81.6 per cent from 2006 to 2015.
Ten-Year Reserve and Reserve Fund History
0 50 100 150 200
2006
2007
2008
2009
2010
2011
2012
2013
2014
2015
$105,178
$127,132
$126,860
$123,931
$182,691
$214,407
$216,091
$238,119
$196,110
$191,028 2015 Details$62,773 Life cycle replacement and capital
$54,114 Waterworks
$40,405 Employee future benefits
$14,132 Corporate rate stabilization
$12,389 Facility ramp-up
$7,215 Other
Reserves & Reserve Funds (Continued)
Although all municipalities report on Reserves and Reserve Funds, not all choose to fully fund the balances. The City’s total of the Cash & Cash Equivalents exceeds the amount that Council has directed be held in reserve.
A. Total Cash & Cash Equivalents 319,173Reserves 113,338
Reserve funds 77,690
Deferred reserve funds (Development charges, parkland & gas tax)
76,881
B. Total reserves & reserve funds & deferred reserve funds 267,909
A. less B. 51,264
Investment in Markham Enterprises Corporation (MEC)Markham Enterprises Corporation is a holding company that is wholly owned by the City. MEC, in turn, owns 100 per cent of Markham District Energy Inc. (MDE) and 34.185 per cent of PowerStream Holdings Inc. The City’s investment in MEC continues to grow each year as shown in the below table. The total investment each year is found by starting with the January 1 opening equity, adding the equity pick-up (MEC net income) plus the increase in share capital from the current year, and fi nally, by reducing the total by the amount of dividend paid to the City in the current year.
Investment in Markham Enterprises Corporation
2015 2014 2013
Equity in MEC, January 1, 2015 $ 245,836 $ 233,349 $ 227,736
Equity pick-up for the year 9,791 5,442 7,648
Adjustment due to IFRS - - -
Increase in share capital 4,980 12,208 3,550
Dividend paid by MEC to City (7,755) (5,162) (5,585)
Equity in MEC December 31, 2015 $ 252,852 $ 245,837 $233,349
$3,500,000
$3,400,000
$3,600,000
$3,700,000
$3,800,000
$3,900,000
$4,000,000
$4,100,000
$4,200,000
2011(restated)
2012 2013 2014 2015
Over $22M of revenue enhancements and expenditure reductions have been implemented since 2009
Markham recovered 86.7% of Ice Storm expenses claimed from the Province
Reserves and Reserve Funds have increased by 81.6% since 2006
Markham’s Accumulated Surplus has grown by 13.3% over the last 5 years, an average of $128,848 per year
Reserves and Reserve Funds are fully funded
Investment in Markham Enterprises Corporation has grown 8.4% over the last 3 years and by 17.5% over the last 5 years
2015 Annual ReportCity of Markham 2322
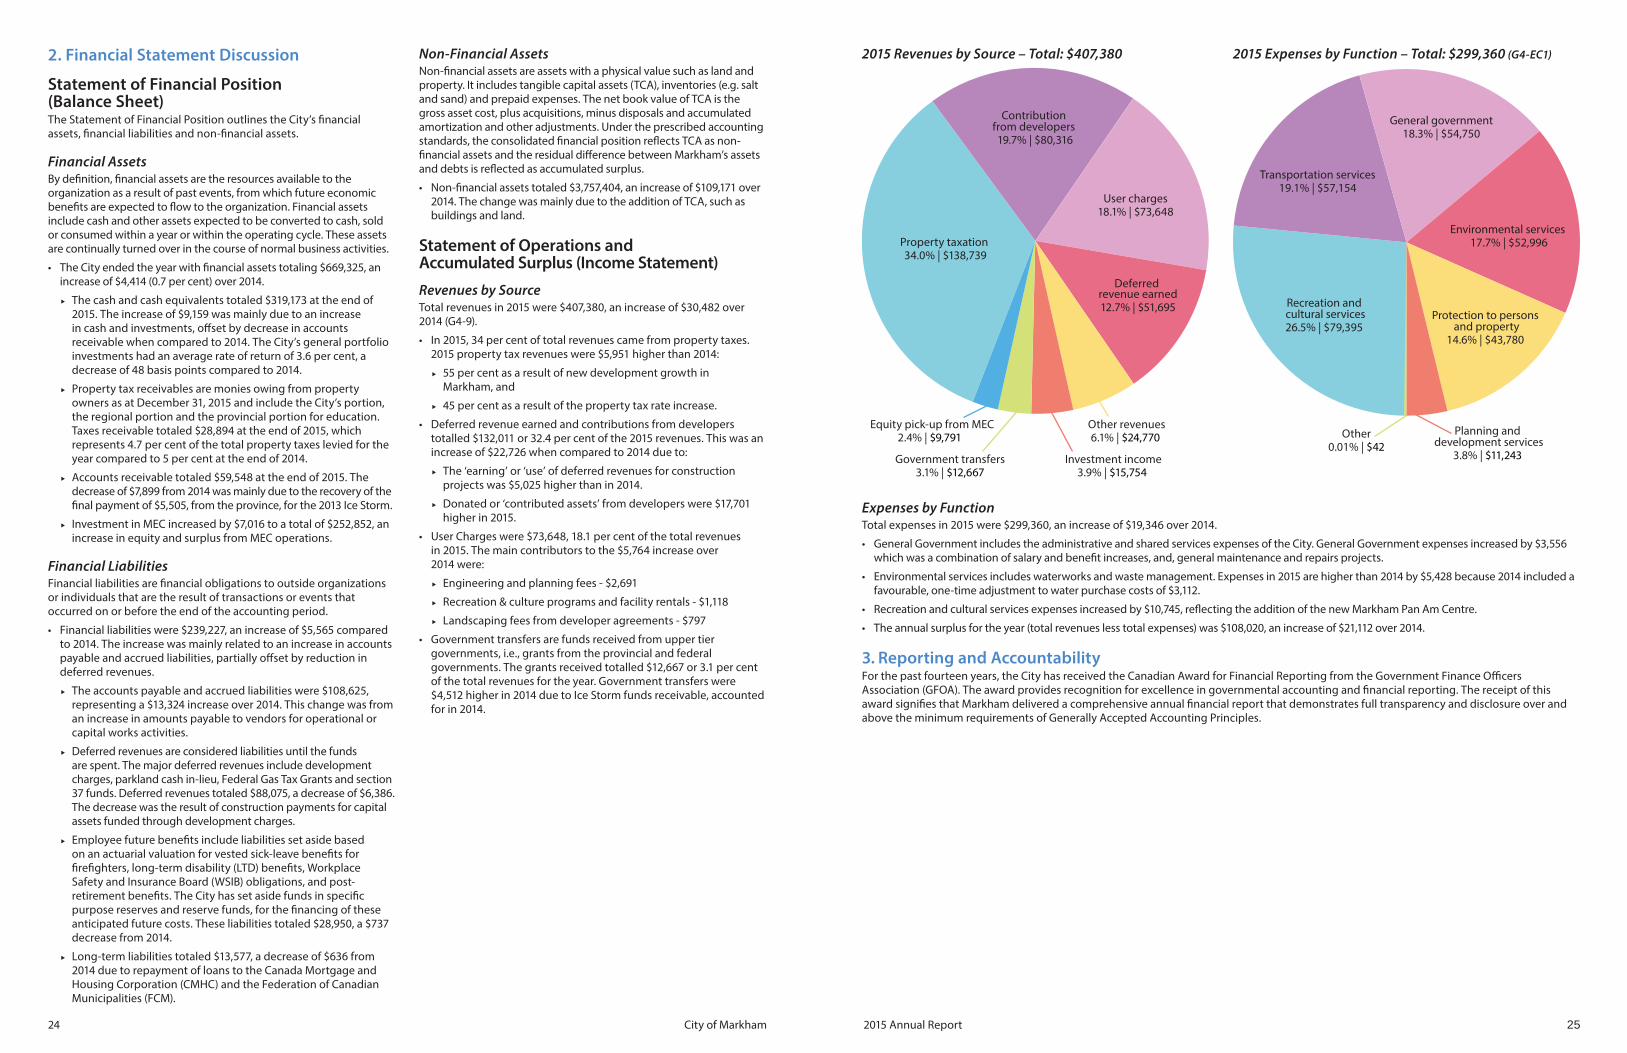
2. Financial Statement Discussion
Statement of Financial Position (Balance Sheet)The Statement of Financial Position outlines the City’s fi nancial assets, fi nancial liabilities and non-fi nancial assets.
Financial AssetsBy defi nition, fi nancial assets are the resources available to the organization as a result of past events, from which future economic benefi ts are expected to fl ow to the organization. Financial assets include cash and other assets expected to be converted to cash, sold or consumed within a year or within the operating cycle. These assets are continually turned over in the course of normal business activities.
• The City ended the year with fi nancial assets totaling $669,325, an increase of $4,414 (0.7 per cent) over 2014.
The cash and cash equivalents totaled $319,173 at the end of 2015. The increase of $9,159 was mainly due to an increase in cash and investments, off set by decrease in accounts receivable when compared to 2014. The City’s general portfolio investments had an average rate of return of 3.6 per cent, a decrease of 48 basis points compared to 2014.
Property tax receivables are monies owing from property owners as at December 31, 2015 and include the City’s portion, the regional portion and the provincial portion for education. Taxes receivable totaled $28,894 at the end of 2015, which represents 4.7 per cent of the total property taxes levied for the year compared to 5 per cent at the end of 2014.
Accounts receivable totaled $59,548 at the end of 2015. The decrease of $7,899 from 2014 was mainly due to the recovery of the fi nal payment of $5,505, from the province, for the 2013 Ice Storm.
Investment in MEC increased by $7,016 to a total of $252,852, an increase in equity and surplus from MEC operations.
Financial LiabilitiesFinancial liabilities are fi nancial obligations to outside organizations or individuals that are the result of transactions or events that occurred on or before the end of the accounting period.
• Financial liabilities were $239,227, an increase of $5,565 compared to 2014. The increase was mainly related to an increase in accounts payable and accrued liabilities, partially off set by reduction in deferred revenues.
The accounts payable and accrued liabilities were $108,625, representing a $13,324 increase over 2014. This change was from an increase in amounts payable to vendors for operational or capital works activities.
Deferred revenues are considered liabilities until the funds are spent. The major deferred revenues include development charges, parkland cash in-lieu, Federal Gas Tax Grants and section 37 funds. Deferred revenues totaled $88,075, a decrease of $6,386. The decrease was the result of construction payments for capital assets funded through development charges.
Employee future benefi ts include liabilities set aside based on an actuarial valuation for vested sick-leave benefi ts for fi refi ghters, long-term disability (LTD) benefi ts, Workplace Safety and Insurance Board (WSIB) obligations, and post-retirement benefi ts. The City has set aside funds in specifi c purpose reserves and reserve funds, for the fi nancing of these anticipated future costs. These liabilities totaled $28,950, a $737 decrease from 2014.
Long-term liabilities totaled $13,577, a decrease of $636 from 2014 due to repayment of loans to the Canada Mortgage and Housing Corporation (CMHC) and the Federation of Canadian Municipalities (FCM).
Non-Financial AssetsNon-fi nancial assets are assets with a physical value such as land and property. It includes tangible capital assets (TCA), inventories (e.g. salt and sand) and prepaid expenses. The net book value of TCA is the gross asset cost, plus acquisitions, minus disposals and accumulated amortization and other adjustments. Under the prescribed accounting standards, the consolidated fi nancial position refl ects TCA as non-fi nancial assets and the residual diff erence between Markham’s assets and debts is refl ected as accumulated surplus.
• Non-fi nancial assets totaled $3,757,404, an increase of $109,171 over 2014. The change was mainly due to the addition of TCA, such as buildings and land.
Statement of Operations and Accumulated Surplus (Income Statement)
Revenues by SourceTotal revenues in 2015 were $407,380, an increase of $30,482 over 2014 (G4-9).
• In 2015, 34 per cent of total revenues came from property taxes. 2015 property tax revenues were $5,951 higher than 2014:
55 per cent as a result of new development growth in Markham, and
45 per cent as a result of the property tax rate increase.
• Deferred revenue earned and contributions from developers totalled $132,011 or 32.4 per cent of the 2015 revenues. This was an increase of $22,726 when compared to 2014 due to:
The ‘earning’ or ‘use’ of deferred revenues for construction projects was $5,025 higher than in 2014.
Donated or ‘contributed assets’ from developers were $17,701 higher in 2015.
• User Charges were $73,648, 18.1 per cent of the total revenues in 2015. The main contributors to the $5,764 increase over 2014 were:
Engineering and planning fees - $2,691
Recreation & culture programs and facility rentals - $1,118
Landscaping fees from developer agreements - $797
• Government transfers are funds received from upper tier governments, i.e., grants from the provincial and federal governments. The grants received totalled $12,667 or 3.1 per cent of the total revenues for the year. Government transfers were $4,512 higher in 2014 due to Ice Storm funds receivable, accounted for in 2014.
Expenses by FunctionTotal expenses in 2015 were $299,360, an increase of $19,346 over 2014.
• General Government includes the administrative and shared services expenses of the City. General Government expenses increased by $3,556 which was a combination of salary and benefi t increases, and, general maintenance and repairs projects.
• Environmental services includes waterworks and waste management. Expenses in 2015 are higher than 2014 by $5,428 because 2014 included a favourable, one-time adjustment to water purchase costs of $3,112.
• Recreation and cultural services expenses increased by $10,745, refl ecting the addition of the new Markham Pan Am Centre.
• The annual surplus for the year (total revenues less total expenses) was $108,020, an increase of $21,112 over 2014.
3. Reporting and AccountabilityFor the past fourteen years, the City has received the Canadian Award for Financial Reporting from the Government Finance Offi cers Association (GFOA). The award provides recognition for excellence in governmental accounting and fi nancial reporting. The receipt of this award signifi es that Markham delivered a comprehensive annual fi nancial report that demonstrates full transparency and disclosure over and above the minimum requirements of Generally Accepted Accounting Principles.
Government transfers3.1% | $12,667
Investment income3.9% | $15,754
Equity pick-up from MEC2.4% | $9,791
Other revenues6.1% | $24,770
Deferred revenue earned12.7% | $51,695
User charges18.1% | $73,648
Contribution from developers 19.7% | $80,316
Property taxation 34.0% | $138,739
Recreation and cultural services26.5% | $79,395
Transportation services19.1% | $57,154
General government18.3% | $54,750
Environmental services 17.7% | $52,996
Protection to persons and property
14.6% | $43,780
Planning and development services
3.8% | $11,243
Other0.01% | $42
2015 Revenues by Source – Total: $407,380 2015 Expenses by Function – Total: $299,360 (G4-EC1)
2015 Annual ReportCity of Markham 2524
Independent Auditors’ Report (G4-33)
Council has approved a number of fi nancial policies to govern the preparation of the annual operating and capital budgets and handling of Markham’s day-to-day fi nancial operations. The purpose of these policies is to maintain strong fi scal stewardship, ensuring that Markham taxpayers are getting value for their money. Signifi cant Markham fi nancial policies are as follows:
Basis of AccountingMarkham recognizes sources of revenue and expenditures on the accrual basis of accounting. The accrual basis of accounting recognizes revenues as they are earned and expenditures when they are incurred and measurable as a result of receipt of goods and services and the creation of a legal obligation to pay.
Reserves/Reserve Funds PolicyReserves and Reserve Funds are grouped into two main categories: Working/Stabilization Reserves and Capital Reserves. Targets have been established for stabilization reserves based on best practices and capital reserves based on a review of life cycle replacement requirements for major Markham facilities and infrastructure. In addition, the policy prioritizes the distribution of annual operating budget surpluses to various reserves and determines the allocation of revenues from various companies owned by Markham.
Use of Assessment GrowthMarkham will transfer up to 25 per cent of tax revenue from the net annualized growth in assessment to the Life Cycle Replacement and Capital Reserve Fund to maintain and refurbish our existing infrastructure.
Use of Prior Year’s Surplus/Defi citMarkham has in place a number of policies to minimize operating defi cits, but should they occur, Markham maintains the fl exibility to utilize funds from the Corporate Rate Stabilization Reserve. Markham does not balance its budget by using prior year surpluses. Surpluses are transferred in accordance with Markham’s Reserves/Reserve Funds Policy.
Capital Budget Control PolicyThe policy sets out guidelines for reporting to Council regarding the closing of capital projects, reallocation of capital funds and requests for new capital projects.
The Corporation of the City of Markham
Financial Policies
Investment PolicyThe policy provides a framework to make investment decisions within acceptable risk levels. Markham strives for the maximum utilization of its cash resources within statutory limitations and the basic need to protect and preserve capital.
Development Charges Credit PolicyThe policy sets out guidelines for administration and issuance of development charge credits to developers. This is implemented through formal agreements with Markham.
Purchasing Policy Under By-Law 2004-341The purpose of the By-law is to establish policies and regulations respecting the City’s procurement, disposal and administrative service requirements, including the entering into of contracts and signing authority.
Expenditure Control PolicyThe purpose of this policy is to establish internal controls over the authorization of expenses. This procedure is subject to the limitations and guidelines established by Markham’s Purchasing By-law #2004-341.
Payment Acceptance PolicyThe policy provides direction on the forms of payment accepted by the organization, both in person and online payment methods including credit card and debit card payments.
KPMG LLP Telephone (416) 228-7000Yonge Corporate Centre Fax (416) 228-71234100 Yonge Street Suite Internet www.kpmg.caToronto ON M2P 2H3Canada
INDEPENDENT AUDITORS' REPORT
To the Members of Council, Inhabitants and RatepayersOf the Corporation of the City of Markham
We have audited the accompanying consolidated financial statements of the Corporation of the City of Markham (“the City”), which comprise the consolidated statement of financial position as at December 31, 2015, the consolidated statements of operations and accumulated surplus, change in net financial assets and cash flows for the year then ended, and notes, comprising a summary of significant accounting policies and other explanatory information.
Management's Responsibility for the Consolidated Financial Statements
Management is responsible for the preparation and fair presentation of these consolidated financial statements in accordance with Canadian public sector accounting standards, and for such internal control as management determines is necessary to enable the preparation of consolidated financial statements that are free from material misstatement, whether due to fraud or error.
Auditors’ Responsibility
Our responsibility is to express an opinion on these consolidated financial statements based on our audit. We conducted our audit in accordance with Canadian generally accepted auditing standards. Those standards require that we comply with ethical requirements and plan and perform an audit to obtain reasonable assurance about whether the consolidated financial statements are free from material misstatement.
An audit involves performing procedures to obtain audit evidence about the amounts and disclosures in the consolidated financial statements. The procedures selected depend on our judgment, including the assessment of the risks of material misstatement of the consolidated financial statements, whether due to fraud or error. In making those risk assessments, we consider internal control relevant to the City’s preparation and fair presentation of the consolidated financial statements in order to design audit procedures that are appropriate in the circumstances, but not for the purpose of expressing an opinion on the effectiveness of the City’s internal control. An audit also includes evaluating the appropriateness of accounting policies used and the reasonableness of accounting estimates made by management, as well as evaluating the overall presentation of the consolidated financial statements.
We believe that the audit evidence we have obtained is sufficient and appropriate to provide a basis for our audit opinion.
Opinion
In our opinion, the consolidated financial statements present fairly, in all material respects, the consolidated financial position of the Corporation of the City of Markham as at December 31, 2015, and its consolidated results of operations and accumulated surplus, its consolidated changes in net financial assets and its consolidated cash flows for the year then ended in accordance with Canadian public sector accounting standards.
Chartered Professional Accountants, Licensed Public Accountants
April 22, 2016Toronto, Canada KPMG LLIP is a Canadian limited liability partnership and a member firm of the KPMG
Network of independent member firms affiliated with KPMG International Cooperative(�KPMG International�), a Swiss entity. KPMG Canada provides services to KPMG LLP.
2015 Annual ReportCity of Markham 2726

The Corporation of the City of Markham
Consolidated Statement of Financial PositionDecember 31, 2015, with comparative fi gures for 2014
(All dollar amounts are in $000)
2015 2014
FINANCIAL ASSETSCash and cash equivalents (Note 4) $ 319,173 $ 310,014 Property taxes receivable (Note 7) 28,894 29,211
Unbilled user charges 7,786 10,472 Accounts receivable (Note 18) 59,548 67,447 Investment in Markham Enterprises Corporation (Note 19) 252,852 245,836 Other current assets 1,072 1,931
669,325 664,911
FINANCIAL LIABILITIESAccounts payable and accrued liabilities (Note 9) 108,625 95,301 Deferred revenues (Note 10) 88,075 94,461 Employee future benefi ts liabilities (Note 12) 28,950 29,687 Long-term liabilities (Note 6) 13,577 14,213
239,227 233,662
NET FINANCIAL ASSETS $ 430,098 $ 431,249
NON-FINANCIAL ASSETSTangible capital assets (Note 13) 3,754,464 3,645,299 Inventories of supplies 1,287 1,259 Inventories of land - heritage estates 94 94 Prepaid expenses 1,559 1,581
3,757,404 3,648,233
ACCUMULATED SURPLUS (Note 15) $ 4,187,502 $ 4,079,482
The accompanying notes are an integral part of these fi nancial statements.
2015 Budget
2015 Actual
2014 Actual
REVENUESProperty taxes $ 138,000 $ 138,739 $ 132,788
User charges (Note 11) 72,534 73,648 67,884
Government transfers (Note 14) 1,515 12,667 17,188
Contributions from developers and others - 80,316 62,615
Investment income 15,023 15,754 20,427
Tax penalties 3,500 3,426 3,393
Gain (loss) on sale of tangible capital assets - (101) 42
Deferred revenue earned 28,109 51,695 46,670
Equity pick-up from Markham Enterprises Corporation (Note 19) - 9,791 5,442
Interest earned on reserves and reserve funds - 317 1,147
Other 4,778 21,128 9,326
Total Revenues 263,459 407,380 366,922
EXPENSESGeneral government 49,448 54,750 51,194
Protection to persons and property 44,049 43,780 43,095
Transportation services 55,106 57,154 58,530
Environmental services 45,455 52,996 47,568
Recreation and cultural services 69,819 79,395 68,650
Planning and development services 6,350 11,243 10,929
Other 38 42 48
Total Expenses 270,265 299,360 280,014
ANNUAL SURPLUS (6,806) 108,020 86,908
ACCUMULATED SURPLUS, BEGINNING OF YEAR 4,079,482 4,079,482 3,992,574
ACCUMULATED SURPLUS, END OF YEAR (Note 15) $ 4,072,676 4,187,502 4,079,482
The accompanying notes are an integral part of these fi nancial statements.
(G4-EC1)
The Corporation of the City of Markham
Consolidated Statement of Operations and Accumulated SurplusYear ended December 31, 2015, with comparative fi gures for 2014(All dollar amounts are in $000)
2015 Annual ReportCity of Markham 2928
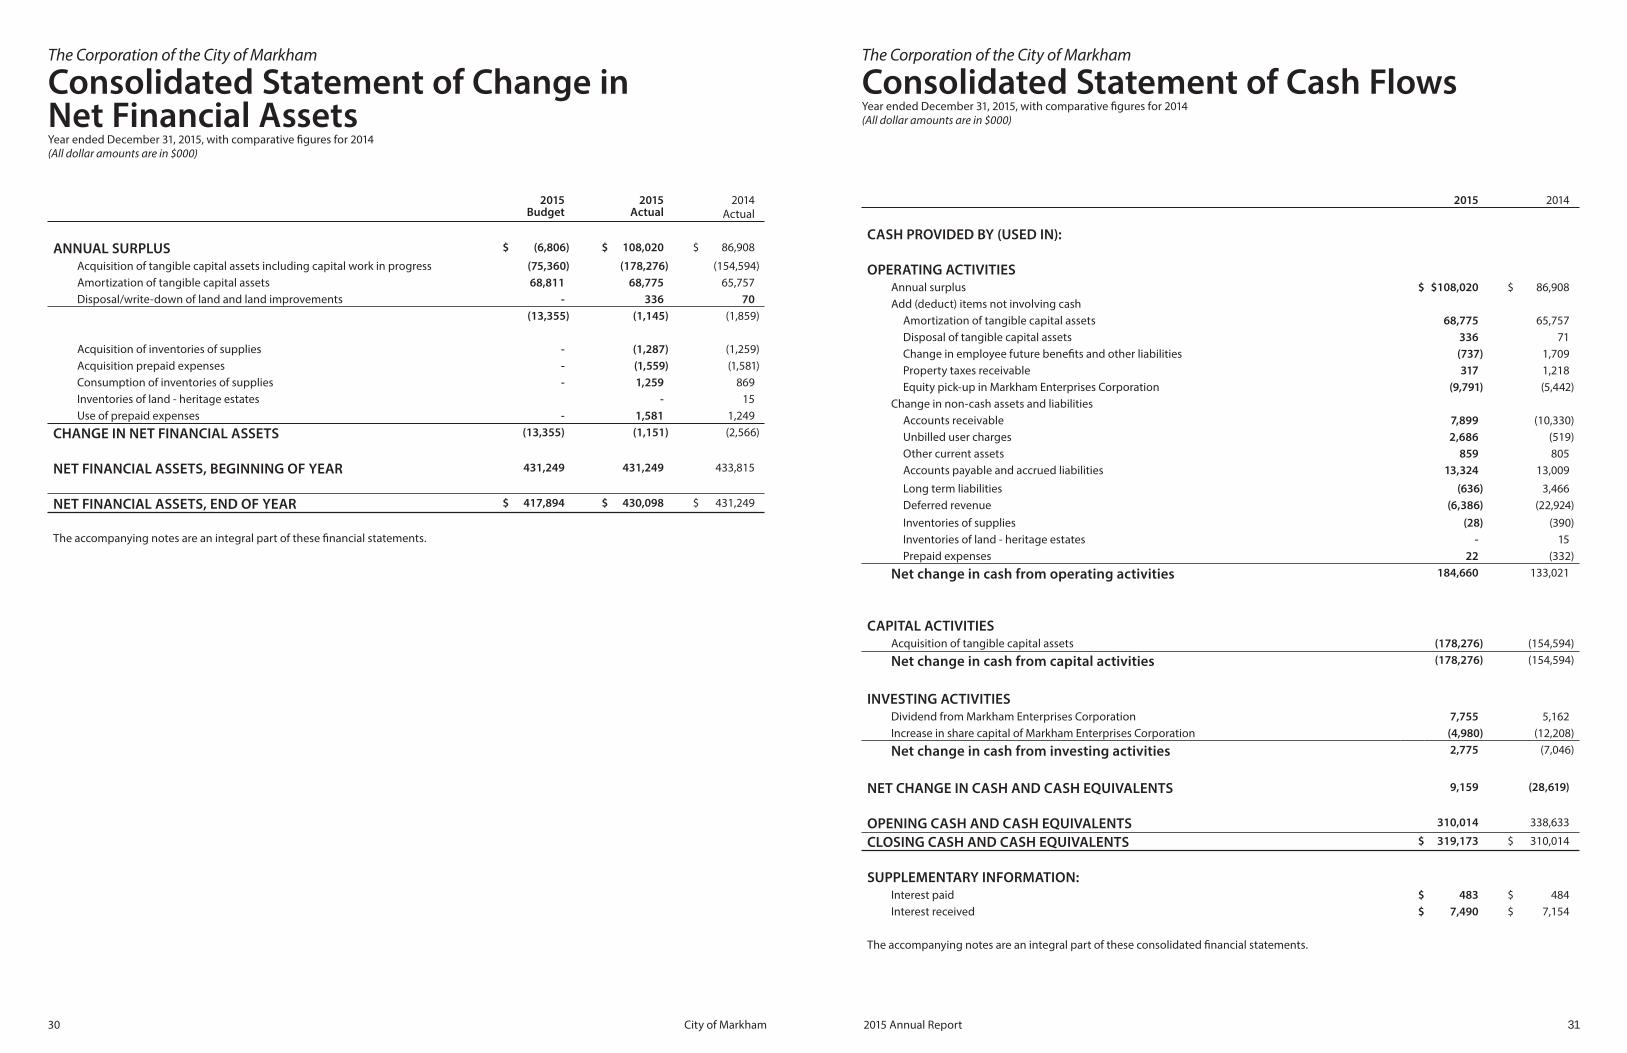
The Corporation of the City of Markham
Consolidated Statement of Change in Net Financial AssetsYear ended December 31, 2015, with comparative fi gures for 2014 (All dollar amounts are in $000)
2015 Budget
2015 Actual
2014 Actual
ANNUAL SURPLUS $ (6,806) $ 108,020 $ 86,908
Acquisition of tangible capital assets including capital work in progress (75,360) (178,276) (154,594)
Amortization of tangible capital assets 68,811 68,775 65,757
Disposal/write-down of land and land improvements - 336 70 (13,355) (1,145) (1,859)
Acquisition of inventories of supplies - (1,287) (1,259)
Acquisition prepaid expenses - (1,559) (1,581)
Consumption of inventories of supplies - 1,259 869
Inventories of land - heritage estates - 15
Use of prepaid expenses - 1,581 1,249
CHANGE IN NET FINANCIAL ASSETS (13,355) (1,151) (2,566)
NET FINANCIAL ASSETS, BEGINNING OF YEAR 431,249 431,249 433,815
NET FINANCIAL ASSETS, END OF YEAR $ 417,894 $ 430,098 $ 431,249
The accompanying notes are an integral part of these fi nancial statements.
The Corporation of the City of Markham
Consolidated Statement of Cash FlowsYear ended December 31, 2015, with comparative fi gures for 2014 (All dollar amounts are in $000)
2015 2014
CASH PROVIDED BY (USED IN):
OPERATING ACTIVITIESAnnual surplus $ $108,020 $ 86,908
Add (deduct) items not involving cash
Amortization of tangible capital assets 68,775 65,757
Disposal of tangible capital assets 336 71
Change in employee future benefi ts and other liabilities (737) 1,709
Property taxes receivable 317 1,218
Equity pick-up in Markham Enterprises Corporation (9,791) (5,442)
Change in non-cash assets and liabilities
Accounts receivable 7,899 (10,330)
Unbilled user charges 2,686 (519)
Other current assets 859 805
Accounts payable and accrued liabilities 13,324 13,009
Long term liabilities (636) 3,466
Deferred revenue (6,386) (22,924)
Inventories of supplies (28) (390)
Inventories of land - heritage estates - 15
Prepaid expenses 22 (332)
Net change in cash from operating activities 184,660 133,021
CAPITAL ACTIVITIESAcquisition of tangible capital assets (178,276) (154,594)
Net change in cash from capital activities (178,276) (154,594)
INVESTING ACTIVITIESDividend from Markham Enterprises Corporation 7,755 5,162
Increase in share capital of Markham Enterprises Corporation (4,980) (12,208)
Net change in cash from investing activities 2,775 (7,046)
NET CHANGE IN CASH AND CASH EQUIVALENTS 9,159 (28,619)
OPENING CASH AND CASH EQUIVALENTS 310,014 338,633
CLOSING CASH AND CASH EQUIVALENTS $ 319,173 $ 310,014
SUPPLEMENTARY INFORMATION:Interest paid $ 483 $ 484
Interest received $ 7,490 $ 7,154
The accompanying notes are an integral part of these consolidated fi nancial statements.
2015 Annual ReportCity of Markham 3130
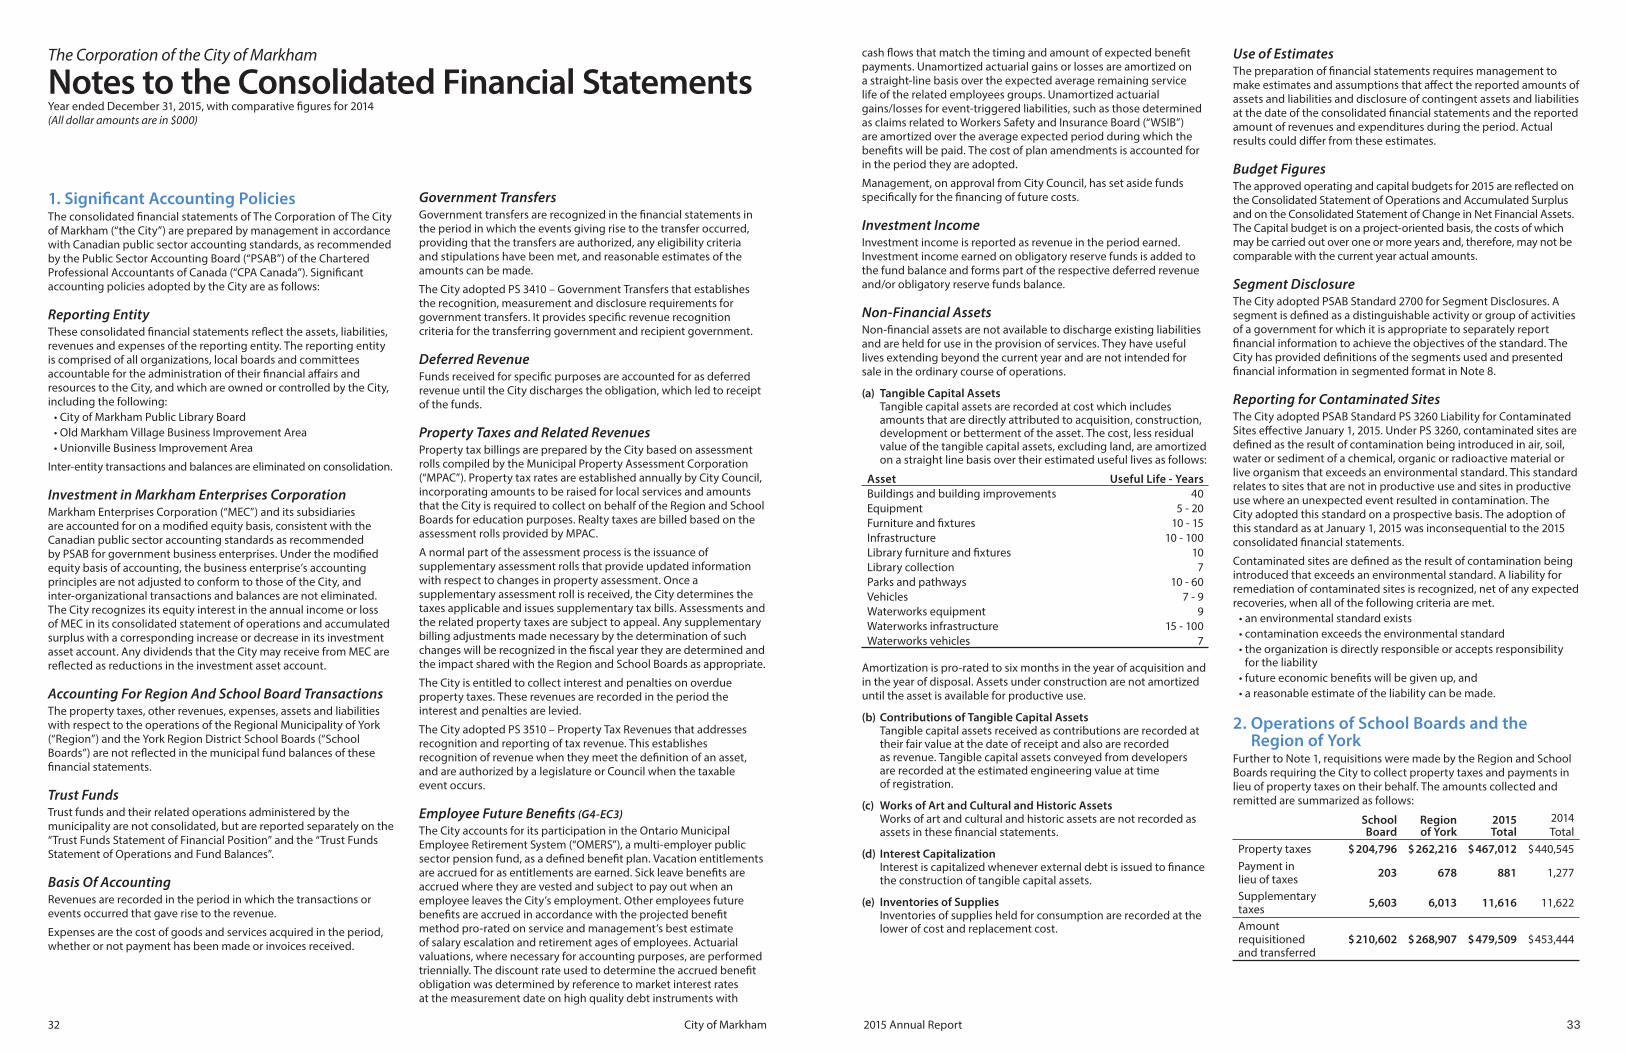
1. Signifi cant Accounting PoliciesThe consolidated fi nancial statements of The Corporation of The City of Markham (“the City”) are prepared by management in accordance with Canadian public sector accounting standards, as recommended by the Public Sector Accounting Board (“PSAB”) of the Chartered Professional Accountants of Canada (“CPA Canada”). Signifi cant accounting policies adopted by the City are as follows:
Reporting EntityThese consolidated fi nancial statements refl ect the assets, liabilities, revenues and expenses of the reporting entity. The reporting entity is comprised of all organizations, local boards and committees accountable for the administration of their fi nancial aff airs and resources to the City, and which are owned or controlled by the City, including the following:
• City of Markham Public Library Board
• Old Markham Village Business Improvement Area
• Unionville Business Improvement Area
Inter-entity transactions and balances are eliminated on consolidation.
Investment in Markham Enterprises Corporation Markham Enterprises Corporation (“MEC”) and its subsidiaries are accounted for on a modifi ed equity basis, consistent with the Canadian public sector accounting standards as recommended by PSAB for government business enterprises. Under the modifi ed equity basis of accounting, the business enterprise’s accounting principles are not adjusted to conform to those of the City, and inter-organizational transactions and balances are not eliminated. The City recognizes its equity interest in the annual income or loss of MEC in its consolidated statement of operations and accumulated surplus with a corresponding increase or decrease in its investment asset account. Any dividends that the City may receive from MEC are refl ected as reductions in the investment asset account.
Accounting For Region And School Board TransactionsThe property taxes, other revenues, expenses, assets and liabilities with respect to the operations of the Regional Municipality of York (“Region”) and the York Region District School Boards (“School Boards”) are not refl ected in the municipal fund balances of these fi nancial statements.
Trust FundsTrust funds and their related operations administered by the municipality are not consolidated, but are reported separately on the “Trust Funds Statement of Financial Position” and the “Trust Funds Statement of Operations and Fund Balances”.
Basis Of AccountingRevenues are recorded in the period in which the transactions or events occurred that gave rise to the revenue.
Expenses are the cost of goods and services acquired in the period, whether or not payment has been made or invoices received.
The Corporation of the City of Markham
Notes to the Consolidated Financial StatementsYear ended December 31, 2015, with comparative fi gures for 2014 (All dollar amounts are in $000)
Government TransfersGovernment transfers are recognized in the fi nancial statements in the period in which the events giving rise to the transfer occurred, providing that the transfers are authorized, any eligibility criteria and stipulations have been met, and reasonable estimates of the amounts can be made.
The City adopted PS 3410 – Government Transfers that establishes the recognition, measurement and disclosure requirements for government transfers. It provides specifi c revenue recognition criteria for the transferring government and recipient government.
Deferred RevenueFunds received for specifi c purposes are accounted for as deferred revenue until the City discharges the obligation, which led to receipt of the funds.
Property Taxes and Related RevenuesProperty tax billings are prepared by the City based on assessment rolls compiled by the Municipal Property Assessment Corporation (“MPAC”). Property tax rates are established annually by City Council, incorporating amounts to be raised for local services and amounts that the City is required to collect on behalf of the Region and School Boards for education purposes. Realty taxes are billed based on the assessment rolls provided by MPAC.
A normal part of the assessment process is the issuance of supplementary assessment rolls that provide updated information with respect to changes in property assessment. Once a supplementary assessment roll is received, the City determines the taxes applicable and issues supplementary tax bills. Assessments and the related property taxes are subject to appeal. Any supplementary billing adjustments made necessary by the determination of such changes will be recognized in the fi scal year they are determined and the impact shared with the Region and School Boards as appropriate.
The City is entitled to collect interest and penalties on overdue property taxes. These revenues are recorded in the period the interest and penalties are levied.
The City adopted PS 3510 – Property Tax Revenues that addresses recognition and reporting of tax revenue. This establishes recognition of revenue when they meet the defi nition of an asset, and are authorized by a legislature or Council when the taxable event occurs.
Employee Future Benefi ts (G4-EC3)
The City accounts for its participation in the Ontario Municipal Employee Retirement System (“OMERS”), a multi-employer public sector pension fund, as a defi ned benefi t plan. Vacation entitlements are accrued for as entitlements are earned. Sick leave benefi ts are accrued where they are vested and subject to pay out when an employee leaves the City’s employment. Other employees future benefi ts are accrued in accordance with the projected benefi t method pro-rated on service and management’s best estimate of salary escalation and retirement ages of employees. Actuarial valuations, where necessary for accounting purposes, are performed triennially. The discount rate used to determine the accrued benefi t obligation was determined by reference to market interest rates at the measurement date on high quality debt instruments with
cash fl ows that match the timing and amount of expected benefi t payments. Unamortized actuarial gains or losses are amortized on a straight-line basis over the expected average remaining service life of the related employees groups. Unamortized actuarial gains/losses for event-triggered liabilities, such as those determined as claims related to Workers Safety and Insurance Board (“WSIB”) are amortized over the average expected period during which the benefi ts will be paid. The cost of plan amendments is accounted for in the period they are adopted.
Management, on approval from City Council, has set aside funds specifi cally for the fi nancing of future costs.
Investment IncomeInvestment income is reported as revenue in the period earned. Investment income earned on obligatory reserve funds is added to the fund balance and forms part of the respective deferred revenue and/or obligatory reserve funds balance.
Non-Financial AssetsNon-fi nancial assets are not available to discharge existing liabilities and are held for use in the provision of services. They have useful lives extending beyond the current year and are not intended for sale in the ordinary course of operations.
(a) Tangible Capital AssetsTangible capital assets are recorded at cost which includes amounts that are directly attributed to acquisition, construction, development or betterment of the asset. The cost, less residual value of the tangible capital assets, excluding land, are amortized on a straight line basis over their estimated useful lives as follows:
Asset Useful Life - YearsBuildings and building improvements 40
Equipment 5 - 20
Furniture and fi xtures 10 - 15
Infrastructure 10 - 100
Library furniture and fi xtures 10
Library collection 7
Parks and pathways 10 - 60
Vehicles 7 - 9
Waterworks equipment 9
Waterworks infrastructure 15 - 100
Waterworks vehicles 7
Amortization is pro-rated to six months in the year of acquisition and in the year of disposal. Assets under construction are not amortized until the asset is available for productive use.
(b) Contributions of Tangible Capital AssetsTangible capital assets received as contributions are recorded at their fair value at the date of receipt and also are recorded as revenue. Tangible capital assets conveyed from developers are recorded at the estimated engineering value at time of registration.
(c) Works of Art and Cultural and Historic AssetsWorks of art and cultural and historic assets are not recorded as assets in these fi nancial statements.
(d) Interest CapitalizationInterest is capitalized whenever external debt is issued to fi nance the construction of tangible capital assets.
(e) Inventories of SuppliesInventories of supplies held for consumption are recorded at the lower of cost and replacement cost.
Use of EstimatesThe preparation of fi nancial statements requires management to make estimates and assumptions that aff ect the reported amounts of assets and liabilities and disclosure of contingent assets and liabilities at the date of the consolidated fi nancial statements and the reported amount of revenues and expenditures during the period. Actual results could diff er from these estimates.
Budget FiguresThe approved operating and capital budgets for 2015 are refl ected on the Consolidated Statement of Operations and Accumulated Surplus and on the Consolidated Statement of Change in Net Financial Assets. The Capital budget is on a project-oriented basis, the costs of which may be carried out over one or more years and, therefore, may not be comparable with the current year actual amounts.
Segment DisclosureThe City adopted PSAB Standard 2700 for Segment Disclosures. A segment is defi ned as a distinguishable activity or group of activities of a government for which it is appropriate to separately report fi nancial information to achieve the objectives of the standard. The City has provided defi nitions of the segments used and presented fi nancial information in segmented format in Note 8.
Reporting for Contaminated SitesThe City adopted PSAB Standard PS 3260 Liability for Contaminated Sites eff ective January 1, 2015. Under PS 3260, contaminated sites are defi ned as the result of contamination being introduced in air, soil, water or sediment of a chemical, organic or radioactive material or live organism that exceeds an environmental standard. This standard relates to sites that are not in productive use and sites in productive use where an unexpected event resulted in contamination. The City adopted this standard on a prospective basis. The adoption of this standard as at January 1, 2015 was inconsequential to the 2015 consolidated fi nancial statements.
Contaminated sites are defi ned as the result of contamination being introduced that exceeds an environmental standard. A liability for remediation of contaminated sites is recognized, net of any expected recoveries, when all of the following criteria are met.
• an environmental standard exists
• contamination exceeds the environmental standard
• the organization is directly responsible or accepts responsibility for the liability
• future economic benefi ts will be given up, and
• a reasonable estimate of the liability can be made.
2. Operations of School Boards and the Region of York
Further to Note 1, requisitions were made by the Region and School Boards requiring the City to collect property taxes and payments in lieu of property taxes on their behalf. The amounts collected and remitted are summarized as follows:
School Board
Regionof York
2015 Total
2014 Total
Property taxes $ 204,796 $ 262,216 $ 467,012 $440,545
Payment in lieu of taxes
203 678 881 1,277
Supplementary taxes
5,603 6,013 11,616 11,622
Amount requisitioned and transferred
$ 210,602 $ 268,907 $ 479,509 $ 453,444
2015 Annual ReportCity of Markham 3332

3. Trust FundsTrust funds administered by the City for the benefi t of others amounting to $2,316 (2014 - $2,298) have not been included in the “Consolidated Statement of Financial Position” nor have their operations been included in the “Consolidated Statement of Operations and Accumulated Surplus”. The trust funds have been reported separately on the “Trust Funds Statement of Financial Position” and “Trust Funds Statement of Financial Activities and Fund Balances”.
4. Cash and Cash Equivalents2015 2014
Cash $ 116,226 $ 75,860
Investments 202,947 234,154
$ 319,173 $ 310,014
Investments consist of authorized investments pursuant to the provisions of the Municipal Act, 2001 and include short-term instruments of various fi nancial institutions, government bonds, and treasury bills. Investments, which are reported at cost for money market and face value for bonds, had a market value of $227,254 (2014 - $245,432) at the end of the year. For the year 2015, the average rate of return earned was 3.62% (2014 – 4.10%). Cash balance includes investments in the amount of $15,000 (2014 - $6,000) which have a maturity date of less than three months.
5. Pension Agreements (G4-EC3)The City makes contributions to the Ontario Municipal Employees Retirement System (“OMERS”), which is a multi-employer plan, on behalf of its employees. The plan is a defi ned benefi t plan which specifi es the amount of the retirement benefi t to be received by the employees based on the length of credited service and average earnings. Employees contribute between 9.0% and 15.9% of their salary and the City matches the employee contribution.
Total OMERS contributions amounted to $20,546 (2014 - $20,274) of which $10,273 (2014 - $10,137) represented the City’s portion.
Since OMERS is a multi-employer pension plan, the City does not recognize any share of pension plan defi cit of $7.0 billion as of 2015 (2014 - $7.1 billion) based on fair market value of the Plan’s assets, as this is a joint responsibility of all Ontario municipalities and their employees.
6. Long Term LiabilitiesOn July 1, 2010 and April 14, 2014, the City received a loan of $12,000 from Canada Mortgage Housing Corporation (“CMHC”) and a $4,000 low-interest loan from Federation of Canadian Municipalities (“FCM”) respectively through the Region. As a lower-tier municipality, the City does not have the ability to borrow long-term funds, and therfore the borrowing was done through the Region. The loan received on July 1, 2010 was used to fund part of the purchase of the Markham District Energy Birchmount Plant. The plant was subsequently leased back to Markham District Energy (“MDE”), a 100% subsidiary of MEC. The loan received on April 14, 2014 was used to fund part of the cost of the construction of Cornell Community Centre and Library.
The loan of $12,000 is to be amortized over a period of 20 years, at an interest rate of 4.04%. An annual payment to the Region of $886 consists of principal and interest. The fi rst payment was due July 1, 2011. The loan of $4,000 is to be amortized over a period of 20 years, at an interest rate of 2%. An annual payment to Region of $244 consists of principal and interest. The fi rst payment was due October 4, 2014.
7. Property Taxes ReceivableThe balance in property taxes receivable, including penalties and interest, is comprised of the following:
2015 2014
Current year $ 19,628 $ 20,306
Arrears previous years 10,267 9,906
29,895 30,212
Less: Allowance for uncollectible taxes (1,001) (1,001)
$ 28,894 $ 29,211
MPAC is responsible for the valuation of the current value assessment (CVA) of all properties in Ontario. MPAC determines the CVA for all properties and provides it annually to municipalities in the form of an assessment roll, which municipalities use to calculate property taxes for each individual property. The Province of Ontario introduced a four-year property assessment cycle in 2009, which included a mandatory phase-in of reassessment increases for all properties. The Province chose to repeat the four-year assessment cycle and therefore, for the 2013 through 2016 tax years, all properties are assessed and taxed based on their CVA as of the valuation date of January 1, 2012. The 2016 taxation year marks the fourth and fi nal year of the current phase-in cycle. The City of Markham’s property tax revenue and tax receivables rely on the stability of the assessment roll, which is subject to annual assessment appeals that create an amount of uncertainty related to the amount of property tax receivables. This fi nancial uncertainty continues to illustrate the requirement of the provision allowance, which was established in the amount of $1,001 (2014 - $1,001). Further, as a result of an initiative by the Chair of the Assessment Review Board (ARB), a commitment was made by the ARB to address the regular and systemic backlog of all property assessment appeals, which resulted in a signifi cant increase in the property tax adjustments for the 2014 and 2015 taxation years.
There is no impact on the “Consolidated Statement of Operations and Accumulated Surplus”.
8. Segmented Information (G4-4)The City is a diverse municipal government that provides a wide range of services to its citizens. For management reporting purposes, the City’s operations and activities are organized functionally based on services provided. The segmented information with a brief description of the service area is as follows:
General Government:General government service area includes the Offi ce of Mayor and Members of Council, Chief Administrative Offi cer, Human Resources, Legal, Sustainability Offi ce, Legislative Services, Financial Services, Corporate Communications and Community Engagement, and Information Technology Services. The departments are responsible for general governance and corporate management.
Protection to Persons and Property:Protection service area includes Fire and Emergency Services and Building Standards. The departments are responsible to perform fi re prevention and protection, fi re alarm, building services and other auxiliary services.
Transportation Services:Transportation service area includes Roads, Parking Control and Asset Management. The departments are responsible for road maintenance, hard-top and loose-top maintenance, winter patrol, salt, sanding, snow removal, street lighting and administration of facilities and parking.
2015 2014
REVENUES $ $ $ $ $ $ $ $ $
Property taxes, grants in lieu, assessments 618,248 - - - 618,248 586,232
Collection for other authorities (479,509) - - - - - - (479,509) (453,444)
Property taxes for City purposes 138,739 - - - - - - 138,739 132,788
User charges 3,502 7,283 8,542 26,922 21,563 5,815 21 73,648 67,884
Government transfers 10,054 - 551 1,180 675 207 - 12,667 17,188
Contribution from developers and others 80,316 - - - - - - 80,316 62,615
Investment income 15,754 - - - - - - 15,754 20,427
Tax penalties 3,426 - - - - - - 3,426 3,393
Gain (loss) on sale of tangible capital assets (101) - - - - - - (101) 42
Deferred revenue earned 51,695 - - - - - - 51,695 46,670
Equity pick up from MarkhamEnterprises Corporation
9,791 - - - - - - 9,791 5,442
Interest earned on reserves and reserve funds
317 - - - - - - 317 1,147
Other 18,662 417 374 677 962 33 3 21,128 9,326
Total Revenues 332,155 7,700 9,467 28,779 23,200 6,055 24 407,380 366,922
EXPENSESSalaries, wages and employee benefi ts 31,623 40,317 12,756 7,824 38,734 7,221 - 138,475 125,247
Operating materials and supplies 11,112 1,195 4,484 5,638 12,405 3,087 42 37,963 39,014
Contracted services 9,055 745 12,707 15,547 12,497 413 - 50,964 46,761
Rents and fi nancial expenses (1,506) 73 146 2,460 638 522 - 2,333 2,462
External transfers to others 366 - - - - - - 366 289
Long term debt charges 484 - - - - - - 484 484
Amortization of tangible capital assets 3,616 1,450 27,061 21,527 15,121 - - 68,775 65,757
Total Expenses 54,750 43,780 57,154 52,996 79,395 11,243 42 299,360 280,014
Annual Surplus / (Defi cit) 277,405 (36,080) (47,687) (24,217) (56,195) (5,188) (18) 108,020 86,908
Prot
ectio
n to
Per
sons
and
Pro
pert
y
Gener
al G
over
nmen
t
Tran
spor
tatio
n Se
rvice
sEn
viro
nmen
tal S
ervi
ces
Recr
eatio
n an
d Cu
ltura
l Ser
vice
s
Plan
ning
and
Dev
elop
men
t
Oth
er
Environmental Services:Environmental service area includes Waterworks and Waste Management. The departments are responsible for the administration of the sanitary and storm sewer system, distribution of water, and the administration of garbage collection and garbage recycling.
Recreation and Cultural Services:The recreation and cultural services area includes Parks, Recreation Services, Culture Services and Markham Public Library. The departments are responsible for providing and facilitating the development and maintenance of high quality parks, recreation services and cultural services, and administration of libraries.
Planning and Development Services:Planning and development services area includes Planning, Urban Design and Engineering. The departments are responsible for administration of land use plans and policies for sustainable development of the city.
Other:The Legislative Services department is responsible for administration of cemetery maintenance.
2015 Annual ReportCity of Markham 3534
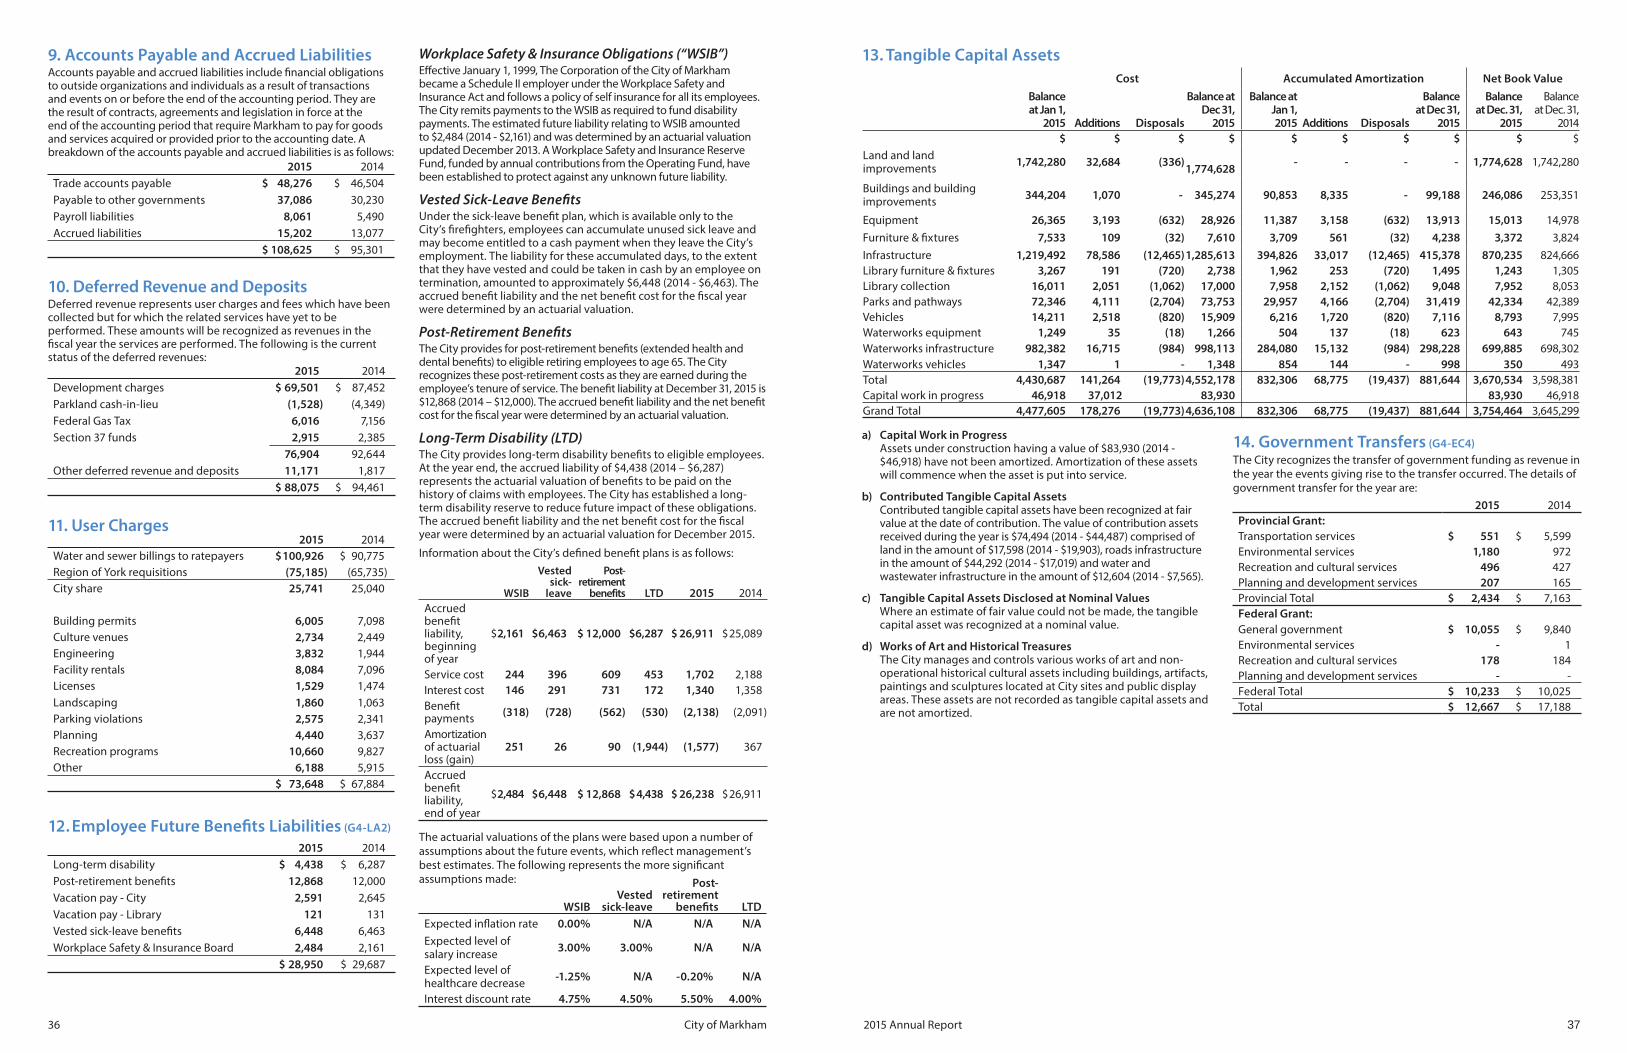
9. Accounts Payable and Accrued LiabilitiesAccounts payable and accrued liabilities include fi nancial obligations to outside organizations and individuals as a result of transactions and events on or before the end of the accounting period. They are the result of contracts, agreements and legislation in force at the end of the accounting period that require Markham to pay for goods and services acquired or provided prior to the accounting date. A breakdown of the accounts payable and accrued liabilities is as follows:
2015 2014
Trade accounts payable $ 48,276 $ 46,504
Payable to other governments 37,086 30,230
Payroll liabilities 8,061 5,490
Accrued liabilities 15,202 13,077
$ 108,625 $ 95,301
10. Deferred Revenue and DepositsDeferred revenue represents user charges and fees which have been collected but for which the related services have yet to be performed. These amounts will be recognized as revenues in the fi scal year the services are performed. The following is the current status of the deferred revenues:
2015 2014
Development charges $ 69,501 $ 87,452
Parkland cash-in-lieu (1,528) (4,349)
Federal Gas Tax 6,016 7,156
Section 37 funds 2,915 2,385
76,904 92,644
Other deferred revenue and deposits 11,171 1,817
$ 88,075 $ 94,461
11. User Charges2015 2014
Water and sewer billings to ratepayers $100,926 $ 90,775
Region of York requisitions (75,185) (65,735)
City share 25,741 25,040
Building permits 6,005 7,098
Culture venues 2,734 2,449
Engineering 3,832 1,944
Facility rentals 8,084 7,096
Licenses 1,529 1,474
Landscaping 1,860 1,063
Parking violations 2,575 2,341
Planning 4,440 3,637
Recreation programs 10,660 9,827
Other 6,188 5,915
$ 73,648 $ 67,884
12. Employee Future Benefi ts Liabilities (G4-LA2)
2015 2014
Long-term disability $ 4,438 $ 6,287
Post-retirement benefi ts 12,868 12,000
Vacation pay - City 2,591 2,645
Vacation pay - Library 121 131
Vested sick-leave benefi ts 6,448 6,463
Workplace Safety & Insurance Board 2,484 2,161
$ 28,950 $ 29,687
Workplace Safety & Insurance Obligations (“WSIB”)Eff ective January 1, 1999, The Corporation of the City of Markham became a Schedule II employer under the Workplace Safety and Insurance Act and follows a policy of self insurance for all its employees. The City remits payments to the WSIB as required to fund disability payments. The estimated future liability relating to WSIB amounted to $2,484 (2014 - $2,161) and was determined by an actuarial valuation updated December 2013. A Workplace Safety and Insurance Reserve Fund, funded by annual contributions from the Operating Fund, have been established to protect against any unknown future liability.
Vested Sick-Leave Benefi tsUnder the sick-leave benefi t plan, which is available only to the City’s fi refi ghters, employees can accumulate unused sick leave and may become entitled to a cash payment when they leave the City’s employment. The liability for these accumulated days, to the extent that they have vested and could be taken in cash by an employee on termination, amounted to approximately $6,448 (2014 - $6,463). The accrued benefi t liability and the net benefi t cost for the fi scal year were determined by an actuarial valuation.
Post-Retirement Benefi tsThe City provides for post-retirement benefi ts (extended health and dental benefi ts) to eligible retiring employees to age 65. The City recognizes these post-retirement costs as they are earned during the employee’s tenure of service. The benefi t liability at December 31, 2015 is $12,868 (2014 – $12,000). The accrued benefi t liability and the net benefi t cost for the fi scal year were determined by an actuarial valuation.
Long-Term Disability (LTD) The City provides long-term disability benefi ts to eligible employees. At the year end, the accrued liability of $4,438 (2014 – $6,287) represents the actuarial valuation of benefi ts to be paid on the history of claims with employees. The City has established a long-term disability reserve to reduce future impact of these obligations. The accrued benefi t liability and the net benefi t cost for the fi scal year were determined by an actuarial valuation for December 2015.
Information about the City’s defi ned benefi t plans is as follows:
WSIB
Vested sick-
leave
Post- retirement
benefits LTD 2015 2014
Accrued benefi t liability, beginning of year
$2,161 $6,463 $ 12,000 $6,287 $ 26,911 $25,089
Service cost 244 396 609 453 1,702 2,188
Interest cost 146 291 731 172 1,340 1,358
Benefi t payments
(318) (728) (562) (530) (2,138) (2,091)
Amortization of actuarial loss (gain)
251 26 90 (1,944) (1,577) 367
Accrued benefi t liability, end of year
$2,484 $6,448 $ 12,868 $4,438 $ 26,238 $26,911
The actuarial valuations of the plans were based upon a number of assumptions about the future events, which refl ect management’s best estimates. The following represents the more signifi cant assumptions made:
WSIBVested
sick-leave
Post-retirement
benefi ts LTDExpected infl ation rate 0.00% N/A N/A N/AExpected level of salary increase
3.00% 3.00% N/A N/A
Expected level of healthcare decrease
-1.25% N/A -0.20% N/A
Interest discount rate 4.75% 4.50% 5.50% 4.00%
Cost Accumulated Amortization Net Book Value Balance at Jan 1,
2015 Additions Disposals
Balance at Dec 31,
2015
Balance at Jan 1, 2015 Additions Disposals
Balance at Dec 31,
2015
Balance at Dec. 31,
2015
Balance at Dec. 31,
2014
$ $ $ $ $ $ $ $ $ $
Land and landimprovements
1,742,280 32,684 (336) 1,774,628 - - - - 1,774,628 1,742,280
Buildings and buildingimprovements
344,204 1,070 - 345,274 90,853 8,335 - 99,188 246,086 253,351
Equipment 26,365 3,193 (632) 28,926 11,387 3,158 (632) 13,913 15,013 14,978
Furniture & fi xtures 7,533 109 (32) 7,610 3,709 561 (32) 4,238 3,372 3,824
Infrastructure 1,219,492 78,586 (12,465)1,285,613 394,826 33,017 (12,465) 415,378 870,235 824,666
Library furniture & fi xtures 3,267 191 (720) 2,738 1,962 253 (720) 1,495 1,243 1,305
Library collection 16,011 2,051 (1,062) 17,000 7,958 2,152 (1,062) 9,048 7,952 8,053
Parks and pathways 72,346 4,111 (2,704) 73,753 29,957 4,166 (2,704) 31,419 42,334 42,389
Vehicles 14,211 2,518 (820) 15,909 6,216 1,720 (820) 7,116 8,793 7,995
Waterworks equipment 1,249 35 (18) 1,266 504 137 (18) 623 643 745
Waterworks infrastructure 982,382 16,715 (984) 998,113 284,080 15,132 (984) 298,228 699,885 698,302
Waterworks vehicles 1,347 1 - 1,348 854 144 - 998 350 493
Total 4,430,687 141,264 (19,773)4,552,178 832,306 68,775 (19,437) 881,644 3,670,534 3,598,381
Capital work in progress 46,918 37,012 83,930 83,930 46,918
Grand Total 4,477,605 178,276 (19,773)4,636,108 832,306 68,775 (19,437) 881,644 3,754,464 3,645,299
13. Tangible Capital Assets
a) Capital Work in ProgressAssets under construction having a value of $83,930 (2014 - $46,918) have not been amortized. Amortization of these assets will commence when the asset is put into service.
b) Contributed Tangible Capital AssetsContributed tangible capital assets have been recognized at fair value at the date of contribution. The value of contribution assets received during the year is $74,494 (2014 - $44,487) comprised of land in the amount of $17,598 (2014 - $19,903), roads infrastructure in the amount of $44,292 (2014 - $17,019) and water and wastewater infrastructure in the amount of $12,604 (2014 - $7,565).
c) Tangible Capital Assets Disclosed at Nominal ValuesWhere an estimate of fair value could not be made, the tangible capital asset was recognized at a nominal value.
d) Works of Art and Historical TreasuresThe City manages and controls various works of art and non-operational historical cultural assets including buildings, artifacts, paintings and sculptures located at City sites and public display areas. These assets are not recorded as tangible capital assets and are not amortized.
14. Government Transfers (G4-EC4)The City recognizes the transfer of government funding as revenue in the year the events giving rise to the transfer occurred. The details of government transfer for the year are:
2015 2014
Provincial Grant:Transportation services $ 551 $ 5,599
Environmental services 1,180 972
Recreation and cultural services 496 427
Planning and development services 207 165
Provincial Total $ 2,434 $ 7,163
Federal Grant:General government $ 10,055 $ 9,840
Environmental services - 1
Recreation and cultural services 178 184
Planning and development services - -
Federal Total $ 10,233 $ 10,025
Total $ 12,667 $ 17,188
2015 Annual ReportCity of Markham 3736
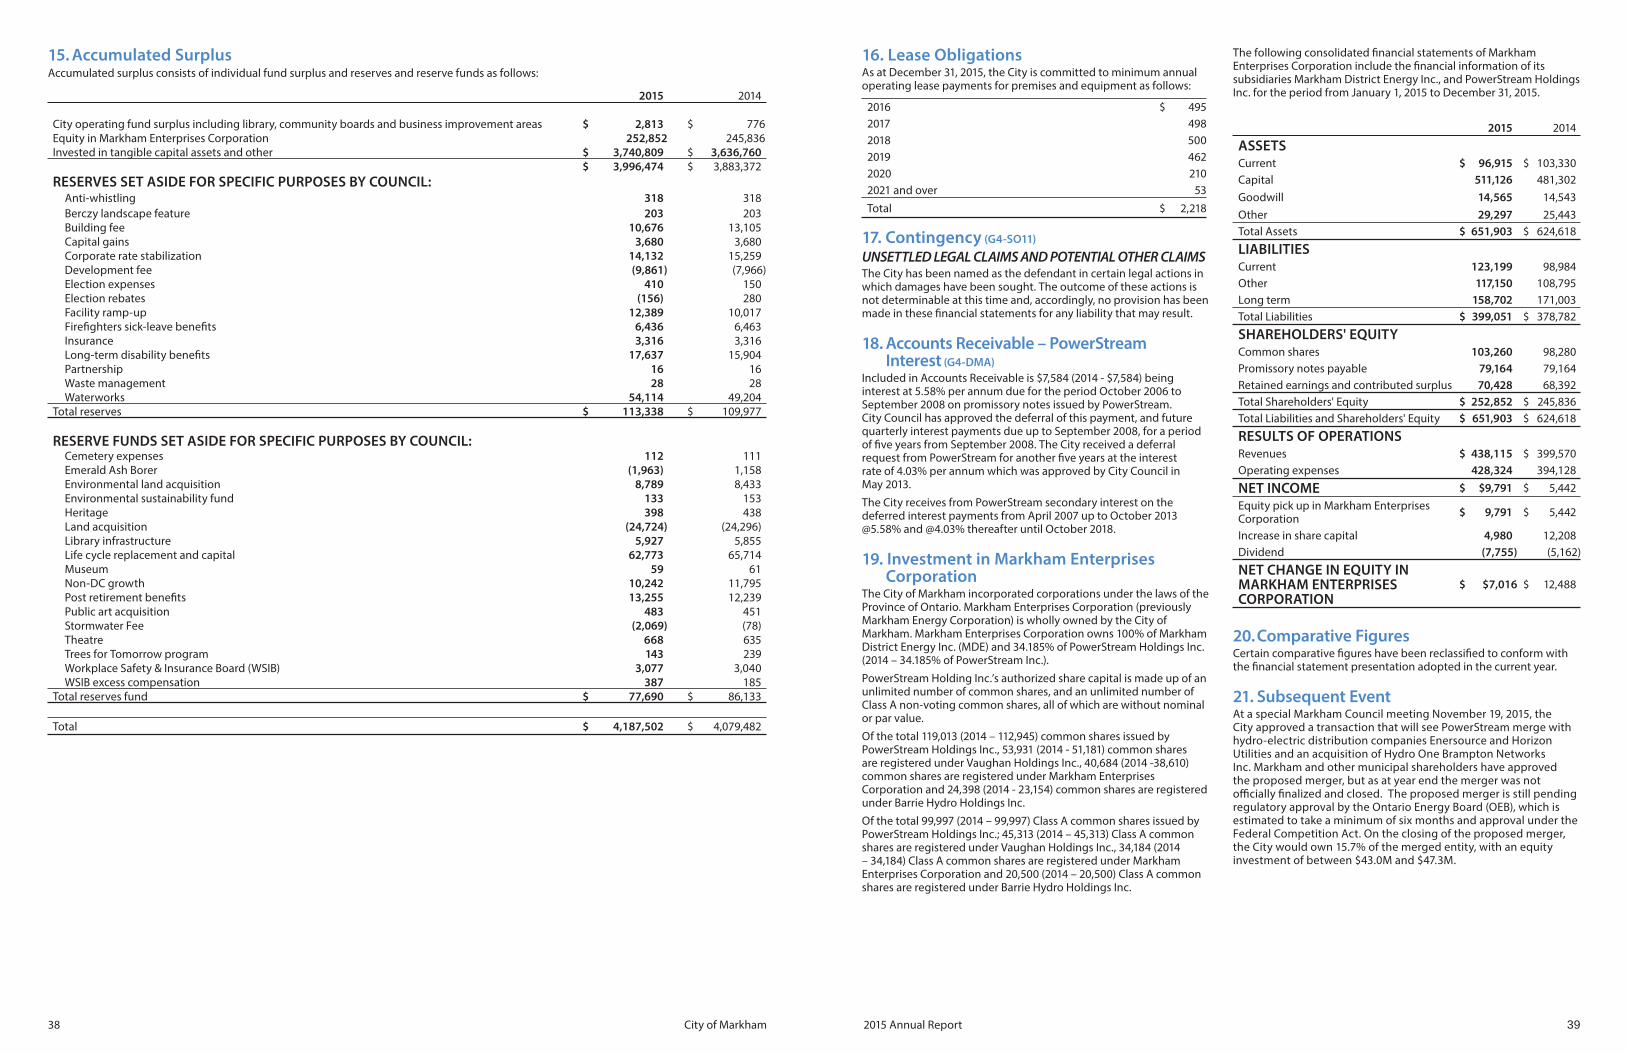
15. Accumulated SurplusAccumulated surplus consists of individual fund surplus and reserves and reserve funds as follows:
2015 2014
City operating fund surplus including library, community boards and business improvement areas $ 2,813 $ 776 Equity in Markham Enterprises Corporation 252,852 245,836 Invested in tangible capital assets and other $ 3,740,809 $ 3,636,760
$ 3,996,474 $ 3,883,372
RESERVES SET ASIDE FOR SPECIFIC PURPOSES BY COUNCIL:Anti-whistling 318 318
Berczy landscape feature 203 203 Building fee 10,676 13,105 Capital gains 3,680 3,680 Corporate rate stabilization 14,132 15,259 Development fee (9,861) (7,966)Election expenses 410 150 Election rebates (156) 280 Facility ramp-up 12,389 10,017 Firefi ghters sick-leave benefi ts 6,436 6,463 Insurance 3,316 3,316 Long-term disability benefi ts 17,637 15,904 Partnership 16 16 Waste management 28 28 Waterworks 54,114 49,204
Total reserves $ 113,338 $ 109,977
RESERVE FUNDS SET ASIDE FOR SPECIFIC PURPOSES BY COUNCIL:Cemetery expenses 112 111 Emerald Ash Borer (1,963) 1,158 Environmental land acquisition 8,789 8,433 Environmental sustainability fund 133 153 Heritage 398 438 Land acquisition (24,724) (24,296)Library infrastructure 5,927 5,855 Life cycle replacement and capital 62,773 65,714 Museum 59 61 Non-DC growth 10,242 11,795 Post retirement benefi ts 13,255 12,239 Public art acquisition 483 451 Stormwater Fee (2,069) (78)Theatre 668 635 Trees for Tomorrow program 143 239 Workplace Safety & Insurance Board (WSIB) 3,077 3,040 WSIB excess compensation 387 185
Total reserves fund $ 77,690 $ 86,133
Total $ 4,187,502 $ 4,079,482
16. Lease ObligationsAs at December 31, 2015, the City is committed to minimum annual operating lease payments for premises and equipment as follows:
2016 $ 495
2017 498
2018 500
2019 462
2020 210
2021 and over 53
Total $ 2,218
17. Contingency (G4-SO11)
UNSETTLED LEGAL CLAIMS AND POTENTIAL OTHER CLAIMSThe City has been named as the defendant in certain legal actions in which damages have been sought. The outcome of these actions is not determinable at this time and, accordingly, no provision has been made in these fi nancial statements for any liability that may result.
18. Accounts Receivable – PowerStream Interest (G4-DMA)
Included in Accounts Receivable is $7,584 (2014 - $7,584) being interest at 5.58% per annum due for the period October 2006 to September 2008 on promissory notes issued by PowerStream. City Council has approved the deferral of this payment, and future quarterly interest payments due up to September 2008, for a period of fi ve years from September 2008. The City received a deferral request from PowerStream for another fi ve years at the interest rate of 4.03% per annum which was approved by City Council in May 2013.
The City receives from PowerStream secondary interest on the deferred interest payments from April 2007 up to October 2013 @5.58% and @4.03% thereafter until October 2018.
19. Investment in Markham Enterprises Corporation
The City of Markham incorporated corporations under the laws of the Province of Ontario. Markham Enterprises Corporation (previously Markham Energy Corporation) is wholly owned by the City of Markham. Markham Enterprises Corporation owns 100% of Markham District Energy Inc. (MDE) and 34.185% of PowerStream Holdings Inc. (2014 – 34.185% of PowerStream Inc.).
PowerStream Holding Inc.’s authorized share capital is made up of an unlimited number of common shares, and an unlimited number of Class A non-voting common shares, all of which are without nominal or par value.
Of the total 119,013 (2014 – 112,945) common shares issued by PowerStream Holdings Inc., 53,931 (2014 - 51,181) common shares are registered under Vaughan Holdings Inc., 40,684 (2014 -38,610) common shares are registered under Markham Enterprises Corporation and 24,398 (2014 - 23,154) common shares are registered under Barrie Hydro Holdings Inc.
Of the total 99,997 (2014 – 99,997) Class A common shares issued by PowerStream Holdings Inc.; 45,313 (2014 – 45,313) Class A common shares are registered under Vaughan Holdings Inc., 34,184 (2014 – 34,184) Class A common shares are registered under Markham Enterprises Corporation and 20,500 (2014 – 20,500) Class A common shares are registered under Barrie Hydro Holdings Inc.
The following consolidated fi nancial statements of Markham Enterprises Corporation include the fi nancial information of its subsidiaries Markham District Energy Inc., and PowerStream Holdings Inc. for the period from January 1, 2015 to December 31, 2015.
2015 2014
ASSETSCurrent $ 96,915 $ 103,330
Capital 511,126 481,302
Goodwill 14,565 14,543
Other 29,297 25,443
Total Assets $ 651,903 $ 624,618
LIABILITIESCurrent 123,199 98,984
Other 117,150 108,795
Long term 158,702 171,003
Total Liabilities $ 399,051 $ 378,782
SHAREHOLDERS' EQUITYCommon shares 103,260 98,280
Promissory notes payable 79,164 79,164
Retained earnings and contributed surplus 70,428 68,392
Total Shareholders' Equity $ 252,852 $ 245,836
Total Liabilities and Shareholders' Equity $ 651,903 $ 624,618
RESULTS OF OPERATIONSRevenues $ 438,115 $ 399,570
Operating expenses 428,324 394,128
NET INCOME $ $9,791 $ 5,442
Equity pick up in Markham Enterprises Corporation
$ 9,791 $ 5,442
Increase in share capital 4,980 12,208
Dividend (7,755) (5,162)
NET CHANGE IN EQUITY IN MARKHAM ENTERPRISES CORPORATION
$ $7,016 $ 12,488
20. Comparative FiguresCertain comparative fi gures have been reclassifi ed to conform with the fi nancial statement presentation adopted in the current year.
21. Subsequent EventAt a special Markham Council meeting November 19, 2015, the City approved a transaction that will see PowerStream merge with hydro-electric distribution companies Enersource and Horizon Utilities and an acquisition of Hydro One Brampton Networks Inc. Markham and other municipal shareholders have approved the proposed merger, but as at year end the merger was not offi cially fi nalized and closed. The proposed merger is still pending regulatory approval by the Ontario Energy Board (OEB), which is estimated to take a minimum of six months and approval under the Federal Competition Act. On the closing of the proposed merger, the City would own 15.7% of the merged entity, with an equity investment of between $43.0M and $47.3M.
2015 Annual ReportCity of Markham 3938

Independent Auditors’ Report (G4-33)
STATEMENT OF FINANCIAL POSITIONDecember 31, 2015 with comparative fi gures for 2014 Total Total
2015 2014
Cash $75,228 $1,302,624 $6,047 $836,499 $9,547 $89,492 $2,319,437 $2,301,780
Payable to Varley-McKay Foundation - (3,820) - - - - (3,820) (3,984)
Fund balance $75,228 $1,298,804 $6,047 $836,499 $9,547 $89,492 $2,315,617 $2,297,796
STATEMENT OF FINANCIAL ACTIVITIES AND FUND BALANCESYear ended December 31, 2015with comparative fi gures for 2014
Receipts
Interest earned 2,550 45,700 257 28,503 324 3,033 80,367 85,292
Sale of plots - - - 14,760 - - 14,760 12,130
2,550 45,700 257 43,263 324 3,033 95,127 97,422
Expenses - - (3,103) (28,503) - - (31,606) (32,411)
Distributed to Foundation - (45,700) - - - - (45,700) (49,107)
- (45,700) (3,103) (28,503) - - (77,306) (81,518)
Excess/(Shortfall) of receipts over expenses 2,550 - (2,846) 14,760 324 3,033 17,821 15,904
Fund balance, beginning of year $72,678 $1,298,804 $8,893 $821,739 $9,223 $86,459 $2,297,796 $2,281,892
Fund balance, end of year $75,228 $1,298,804 $6,047 $836,499 $9,547 $89,492 $2,315,617 $2,297,796
The accompanying notes are an integral part of these fi nancial statements.
The Corporation of the City of Markham
Trust Funds
Mor
gan
Park
Tru
st
Varle
y- M
cKay
Trus
t M
arkh
am E
nviro
nmen
tal
Adviso
ry C
omm
ittee
Trus
t
Mar
kham
Hist
ory
Rese
arch
& Pub
licat
ion
Trus
t
Cem
eter
y Tr
ust
Old
er A
dults
In A
ctio
n Tr
ust
KPMG LLP Telephone (416) 228-7000 Yonge Corporate Centre Fax (416) 228-7123 4100 Yonge Street Suite Internet www.kpmg.ca Toronto ON M2P 2H3 Canada
INDEPENDENT AUDITORS' REPORT
To the Members of Council, Inhabitants and Ratepayers Of the City of Markham We have audited the accompanying financial statements of the Trust Funds of The Corporation of the City of Markham, which comprise the statement of financial position as at December 31, 2015, the statement of financial activities and fund balances, and notes, comprising a summary of significant accounting policies and other explanatory information.
Management's Responsibility for the Financial Statements
Management is responsible for the preparation and fair presentation of these financial statements in accordance with Canadian public sector accounting standards, and for such internal control as management determines is necessary to enable the preparation of financial statements that are free from material misstatement, whether due to fraud or error.
Auditors’ Responsibility
Our responsibility is to express an opinion on these financial statements based on our audit. We conducted our audit in accordance with Canadian generally accepted auditing standards. Those standards require that we comply with ethical requirements and plan and perform an audit to obtain reasonable assurance about whether the financial statements are free from material misstatement.
An audit involves performing procedures to obtain audit evidence about the amounts and disclosures in the financial statements. The procedures selected depend on our judgment, including the assessment of the risks of material misstatement of the financial statements, whether due to fraud or error. In making those risk assessments, we consider internal control relevant to the entity’s preparation and fair presentation of the financial statements in order to design audit procedures that are appropriate in the circumstances, but not for the purpose of expressing an opinion on the effectiveness of the entity’s internal control. An audit also includes evaluating the appropriateness of accounting policies used and the reasonableness of accounting estimates made by management, as well as evaluating the overall presentation of the financial statements.
We believe that the audit evidence we have obtained is sufficient and appropriate to provide a basis for our audit opinion.
Opinion
In our opinion, the financial statements present fairly, in all material respects, the financial position of the Trust Funds of The Corporation of the City of Markham as at December 31, 2015, and its statement of financial activities and fund balances for the year then ended in accordance with Canadian public sector accounting standards.
Chartered Professional Accountants, Licensed Public Accountants April 22, 2016 Toronto, Canada
KPMG LLIP is a Canadian limited liability partnership and a member firm of the KPMG network of independent member firms affiliated with KPMG International Cooperative (“KPMG International”), a Swiss entity. KPMG Canada provides services to KPMG LLP.
2015 Annual ReportCity of Markham 4140
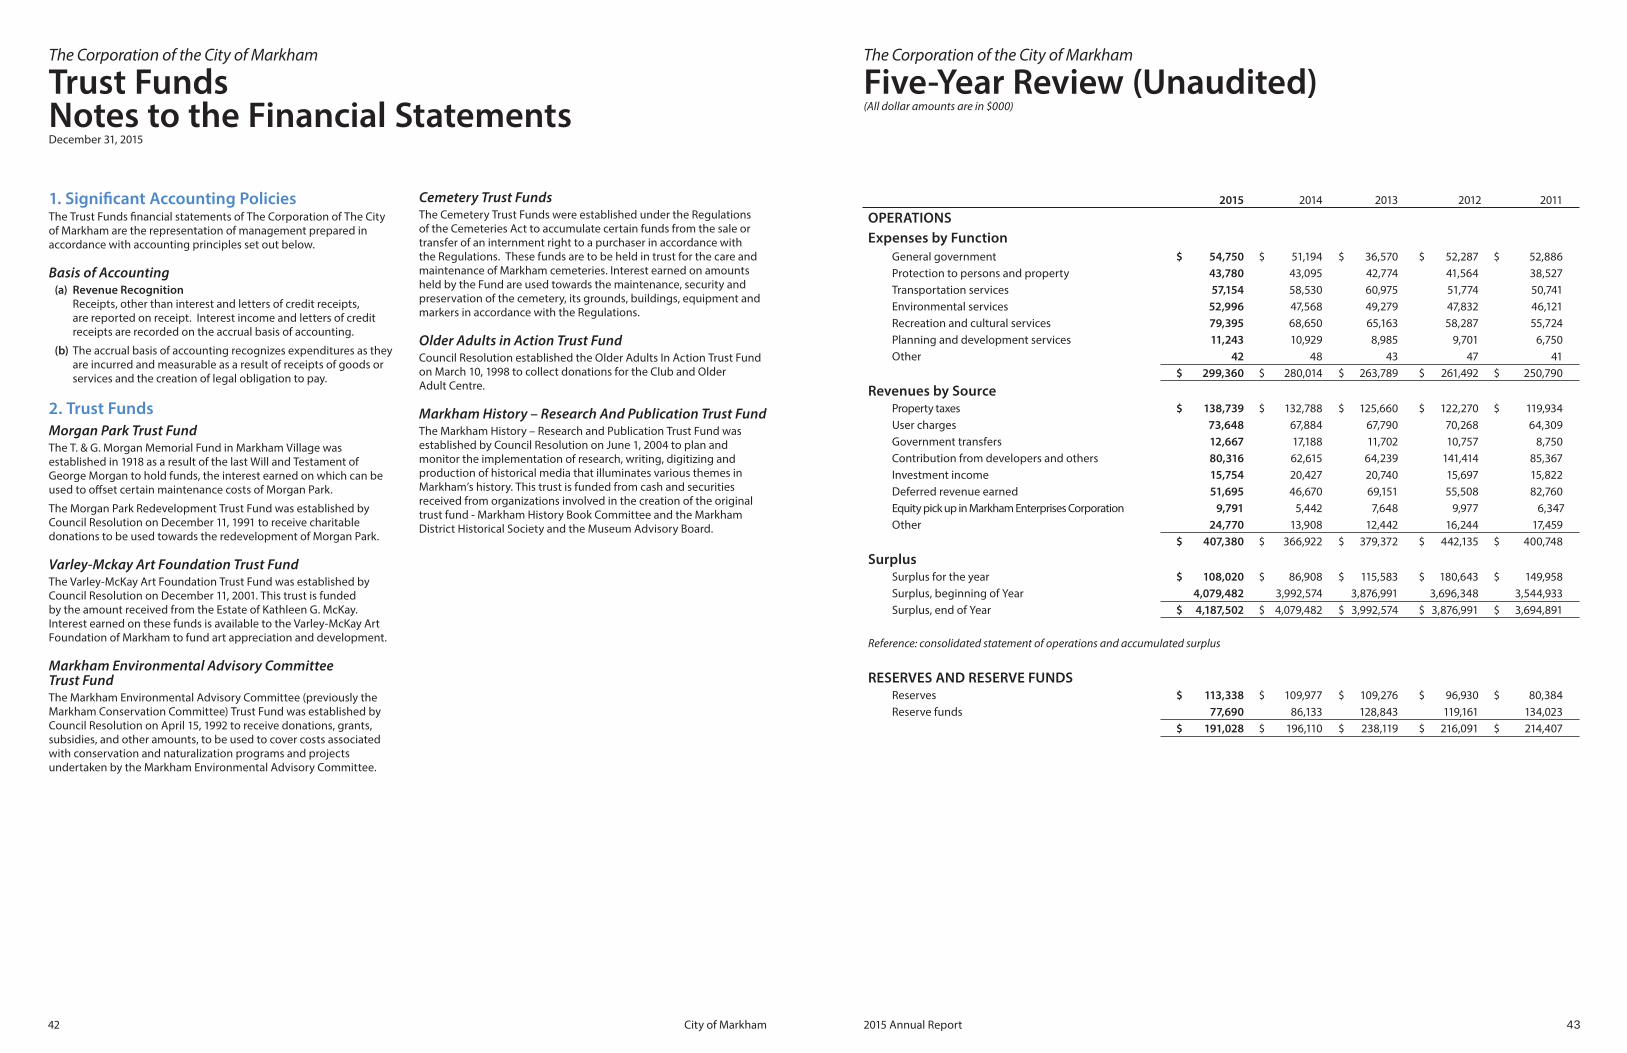
The Corporation of the City of Markham
Trust FundsNotes to the Financial StatementsDecember 31, 2015
1. Signifi cant Accounting PoliciesThe Trust Funds fi nancial statements of The Corporation of The City of Markham are the representation of management prepared in accordance with accounting principles set out below.
Basis of Accounting(a) Revenue Recognition
Receipts, other than interest and letters of credit receipts, are reported on receipt. Interest income and letters of credit receipts are recorded on the accrual basis of accounting.
(b) The accrual basis of accounting recognizes expenditures as they are incurred and measurable as a result of receipts of goods or services and the creation of legal obligation to pay.
2. Trust FundsMorgan Park Trust FundThe T. & G. Morgan Memorial Fund in Markham Village was established in 1918 as a result of the last Will and Testament of George Morgan to hold funds, the interest earned on which can be used to off set certain maintenance costs of Morgan Park.
The Morgan Park Redevelopment Trust Fund was established by Council Resolution on December 11, 1991 to receive charitable donations to be used towards the redevelopment of Morgan Park.
Varley-Mckay Art Foundation Trust FundThe Varley-McKay Art Foundation Trust Fund was established by Council Resolution on December 11, 2001. This trust is funded by the amount received from the Estate of Kathleen G. McKay. Interest earned on these funds is available to the Varley-McKay Art Foundation of Markham to fund art appreciation and development.
Markham Environmental Advisory Committee Trust FundThe Markham Environmental Advisory Committee (previously the Markham Conservation Committee) Trust Fund was established by Council Resolution on April 15, 1992 to receive donations, grants, subsidies, and other amounts, to be used to cover costs associated with conservation and naturalization programs and projects undertaken by the Markham Environmental Advisory Committee.
Cemetery Trust FundsThe Cemetery Trust Funds were established under the Regulations of the Cemeteries Act to accumulate certain funds from the sale or transfer of an internment right to a purchaser in accordance with the Regulations. These funds are to be held in trust for the care and maintenance of Markham cemeteries. Interest earned on amounts held by the Fund are used towards the maintenance, security and preservation of the cemetery, its grounds, buildings, equipment and markers in accordance with the Regulations.
Older Adults in Action Trust FundCouncil Resolution established the Older Adults In Action Trust Fund on March 10, 1998 to collect donations for the Club and Older Adult Centre.
Markham History – Research And Publication Trust FundThe Markham History – Research and Publication Trust Fund was established by Council Resolution on June 1, 2004 to plan and monitor the implementation of research, writing, digitizing and production of historical media that illuminates various themes in Markham’s history. This trust is funded from cash and securities received from organizations involved in the creation of the original trust fund - Markham History Book Committee and the Markham District Historical Society and the Museum Advisory Board.
The Corporation of the City of Markham
Five-Year Review (Unaudited)(All dollar amounts are in $000)
2015 2014 2013 2012 2011
OPERATIONSExpenses by Function
General government $ 54,750 $ 51,194 $ 36,570 $ 52,287 $ 52,886
Protection to persons and property 43,780 43,095 42,774 41,564 38,527
Transportation services 57,154 58,530 60,975 51,774 50,741
Environmental services 52,996 47,568 49,279 47,832 46,121
Recreation and cultural services 79,395 68,650 65,163 58,287 55,724
Planning and development services 11,243 10,929 8,985 9,701 6,750
Other 42 48 43 47 41
$ 299,360 $ 280,014 $ 263,789 $ 261,492 $ 250,790
Revenues by SourceProperty taxes $ 138,739 $ 132,788 $ 125,660 $ 122,270 $ 119,934
User charges 73,648 67,884 67,790 70,268 64,309
Government transfers 12,667 17,188 11,702 10,757 8,750
Contribution from developers and others 80,316 62,615 64,239 141,414 85,367
Investment income 15,754 20,427 20,740 15,697 15,822
Deferred revenue earned 51,695 46,670 69,151 55,508 82,760
Equity pick up in Markham Enterprises Corporation 9,791 5,442 7,648 9,977 6,347
Other 24,770 13,908 12,442 16,244 17,459
$ 407,380 $ 366,922 $ 379,372 $ 442,135 $ 400,748
SurplusSurplus for the year $ 108,020 $ 86,908 $ 115,583 $ 180,643 $ 149,958
Surplus, beginning of Year 4,079,482 3,992,574 3,876,991 3,696,348 3,544,933
Surplus, end of Year $ 4,187,502 $ 4,079,482 $ 3,992,574 $ 3,876,991 $ 3,694,891
Reference: consolidated statement of operations and accumulated surplus
RESERVES AND RESERVE FUNDSReserves $ 113,338 $ 109,977 $ 109,276 $ 96,930 $ 80,384
Reserve funds 77,690 86,133 128,843 119,161 134,023
$ 191,028 $ 196,110 $ 238,119 $ 216,091 $ 214,407
2015 Annual ReportCity of Markham 4342
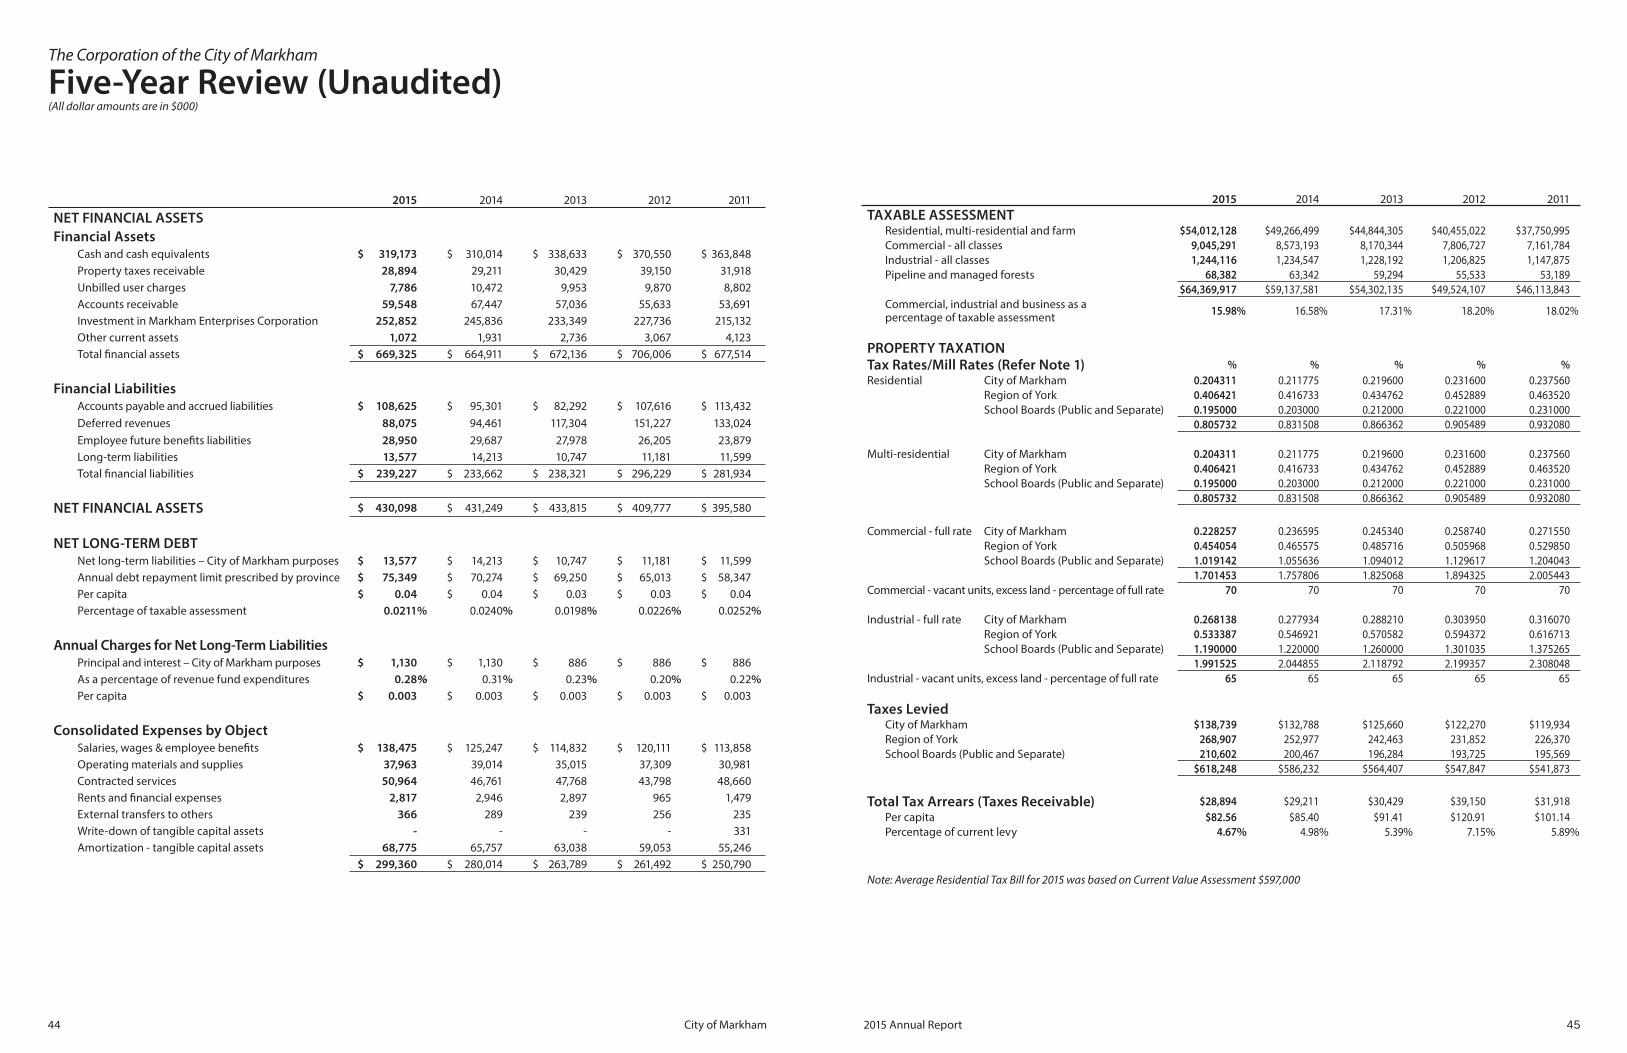
The Corporation of the City of Markham
Five-Year Review (Unaudited)(All dollar amounts are in $000)
2015 2014 2013 2012 2011
NET FINANCIAL ASSETSFinancial Assets
Cash and cash equivalents $ 319,173 $ 310,014 $ 338,633 $ 370,550 $ 363,848
Property taxes receivable 28,894 29,211 30,429 39,150 31,918
Unbilled user charges 7,786 10,472 9,953 9,870 8,802
Accounts receivable 59,548 67,447 57,036 55,633 53,691
Investment in Markham Enterprises Corporation 252,852 245,836 233,349 227,736 215,132
Other current assets 1,072 1,931 2,736 3,067 4,123
Total fi nancial assets $ 669,325 $ 664,911 $ 672,136 $ 706,006 $ 677,514
Financial LiabilitiesAccounts payable and accrued liabilities $ 108,625 $ 95,301 $ 82,292 $ 107,616 $ 113,432
Deferred revenues 88,075 94,461 117,304 151,227 133,024
Employee future benefi ts liabilities 28,950 29,687 27,978 26,205 23,879
Long-term liabilities 13,577 14,213 10,747 11,181 11,599
Total fi nancial liabilities $ 239,227 $ 233,662 $ 238,321 $ 296,229 $ 281,934
NET FINANCIAL ASSETS $ 430,098 $ 431,249 $ 433,815 $ 409,777 $ 395,580
NET LONG-TERM DEBTNet long-term liabilities – City of Markham purposes $ 13,577 $ 14,213 $ 10,747 $ 11,181 $ 11,599
Annual debt repayment limit prescribed by province $ 75,349 $ 70,274 $ 69,250 $ 65,013 $ 58,347
Per capita $ 0.04 $ 0.04 $ 0.03 $ 0.03 $ 0.04
Percentage of taxable assessment 0.0211% 0.0240% 0.0198% 0.0226% 0.0252%
Annual Charges for Net Long-Term Liabilities Principal and interest – City of Markham purposes $ 1,130 $ 1,130 $ 886 $ 886 $ 886
As a percentage of revenue fund expenditures 0.28% 0.31% 0.23% 0.20% 0.22%Per capita $ 0.003 $ 0.003 $ 0.003 $ 0.003 $ 0.003
Consolidated Expenses by ObjectSalaries, wages & employee benefi ts $ 138,475 $ 125,247 $ 114,832 $ 120,111 $ 113,858
Operating materials and supplies 37,963 39,014 35,015 37,309 30,981
Contracted services 50,964 46,761 47,768 43,798 48,660
Rents and fi nancial expenses 2,817 2,946 2,897 965 1,479
External transfers to others 366 289 239 256 235
Write-down of tangible capital assets - - - - 331
Amortization - tangible capital assets 68,775 65,757 63,038 59,053 55,246
$ 299,360 $ 280,014 $ 263,789 $ 261,492 $ 250,790
2015 2014 2013 2012 2011
TAXABLE ASSESSMENTResidential, multi-residential and farm $54,012,128 $49,266,499 $44,844,305 $40,455,022 $37,750,995
Commercial - all classes 9,045,291 8,573,193 8,170,344 7,806,727 7,161,784
Industrial - all classes 1,244,116 1,234,547 1,228,192 1,206,825 1,147,875
Pipeline and managed forests 68,382 63,342 59,294 55,533 53,189
$64,369,917 $59,137,581 $54,302,135 $49,524,107 $46,113,843
Commercial, industrial and business as a percentage of taxable assessment
15.98 % 16.58 % 17.31 % 18.20 % 18.02 %
PROPERTY TAXATIONTax Rates/Mill Rates (Refer Note 1) % % % % %Residential City of Markham 0.204311 0.211775 0.219600 0.231600 0.237560
Region of York 0.406421 0.416733 0.434762 0.452889 0.463520
School Boards (Public and Separate) 0.195000 0.203000 0.212000 0.221000 0.231000
0.805732 0.831508 0.866362 0.905489 0.932080
Multi-residential City of Markham 0.204311 0.211775 0.219600 0.231600 0.237560
Region of York 0.406421 0.416733 0.434762 0.452889 0.463520
School Boards (Public and Separate) 0.195000 0.203000 0.212000 0.221000 0.231000
0.805732 0.831508 0.866362 0.905489 0.932080
Commercial - full rate City of Markham 0.228257 0.236595 0.245340 0.258740 0.271550
Region of York 0.454054 0.465575 0.485716 0.505968 0.529850
School Boards (Public and Separate) 1.019142 1.055636 1.094012 1.129617 1.204043
1.701453 1.757806 1.825068 1.894325 2.005443
Commercial - vacant units, excess land - percentage of full rate 70 70 70 70 70
Industrial - full rate City of Markham 0.268138 0.277934 0.288210 0.303950 0.316070
Region of York 0.533387 0.546921 0.570582 0.594372 0.616713
School Boards (Public and Separate) 1.190000 1.220000 1.260000 1.301035 1.375265
1.991525 2.044855 2.118792 2.199357 2.308048
Industrial - vacant units, excess land - percentage of full rate 65 65 65 65 65
Taxes LeviedCity of Markham $138,739 $132,788 $125,660 $122,270 $119,934
Region of York 268,907 252,977 242,463 231,852 226,370
School Boards (Public and Separate) 210,602 200,467 196,284 193,725 195,569
$618,248 $586,232 $564,407 $547,847 $541,873
Total Tax Arrears (Taxes Receivable) $28,894 $29,211 $30,429 $39,150 $31,918
Per capita $82.56 $85.40 $91.41 $120.91 $101.14
Percentage of current levy 4.67% 4.98% 5.39% 7.15% 5.89%
Note: Average Residential Tax Bill for 2015 was based on Current Value Assessment $597,000
2015 Annual ReportCity of Markham 4544
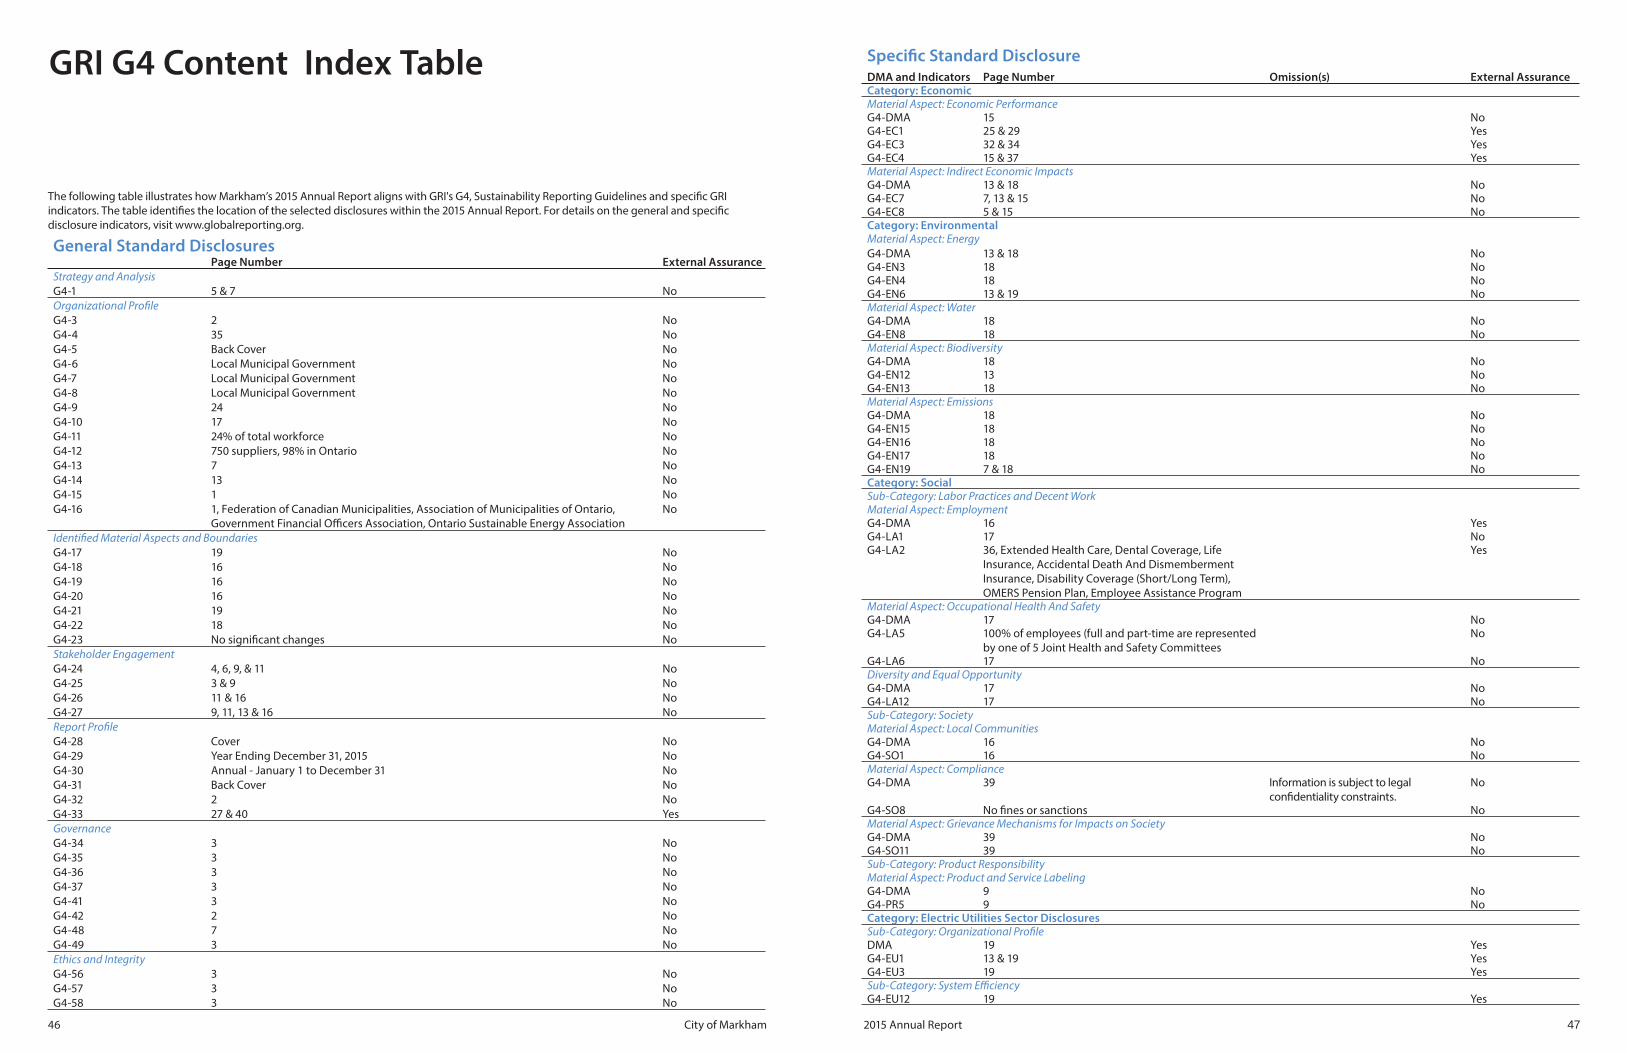
The following table illustrates how Markham’s 2015 Annual Report aligns with GRI's G4, Sustainability Reporting Guidelines and specifi c GRI indicators. The table identifi es the location of the selected disclosures within the 2015 Annual Report. For details on the general and specifi c disclosure indicators, visit www.globalreporting.org.
GRI G4 Content Index Table
General Standard DisclosuresPage Number External Assurance
Strategy and Analysis
G4-1 5 & 7 No
Organizational Profi le
G4-3 2 No
G4-4 35 No
G4-5 Back Cover No
G4-6 Local Municipal Government No
G4-7 Local Municipal Government No
G4-8 Local Municipal Government No
G4-9 24 No
G4-10 17 No
G4-11 24% of total workforce No
G4-12 750 suppliers, 98% in Ontario No
G4-13 7 No
G4-14 13 No
G4-15 1 No
G4-16 1, Federation of Canadian Municipalities, Association of Municipalities of Ontario, Government Financial Offi cers Association, Ontario Sustainable Energy Association
No
Identifi ed Material Aspects and Boundaries
G4-17 19 No
G4-18 16 No
G4-19 16 No
G4-20 16 No
G4-21 19 No
G4-22 18 No
G4-23 No signifi cant changes No
Stakeholder Engagement
G4-24 4, 6, 9, & 11 No
G4-25 3 & 9 No
G4-26 11 & 16 No
G4-27 9, 11, 13 & 16 No
Report Profi le
G4-28 Cover No
G4-29 Year Ending December 31, 2015 No
G4-30 Annual - January 1 to December 31 No
G4-31 Back Cover No
G4-32 2 No
G4-33 27 & 40 Yes
Governance
G4-34 3 No
G4-35 3 No
G4-36 3 No
G4-37 3 No
G4-41 3 No
G4-42 2 No
G4-48 7 No
G4-49 3 No
Ethics and Integrity
G4-56 3 No
G4-57 3 No
G4-58 3 No
Specifi c Standard DisclosureDMA and Indicators Page Number Omission(s) External AssuranceCategory: EconomicMaterial Aspect: Economic PerformanceG4-DMA 15 NoG4-EC1 25 & 29 YesG4-EC3 32 & 34 YesG4-EC4 15 & 37 YesMaterial Aspect: Indirect Economic ImpactsG4-DMA 13 & 18 NoG4-EC7 7, 13 & 15 NoG4-EC8 5 & 15 NoCategory: EnvironmentalMaterial Aspect: Energy
G4-DMA 13 & 18 NoG4-EN3 18 NoG4-EN4 18 NoG4-EN6 13 & 19 NoMaterial Aspect: WaterG4-DMA 18 NoG4-EN8 18 NoMaterial Aspect: BiodiversityG4-DMA 18 NoG4-EN12 13 NoG4-EN13 18 NoMaterial Aspect: EmissionsG4-DMA 18 NoG4-EN15 18 NoG4-EN16 18 NoG4-EN17 18 NoG4-EN19 7 & 18 NoCategory: SocialSub-Category: Labor Practices and Decent WorkMaterial Aspect: EmploymentG4-DMA 16 YesG4-LA1 17 NoG4-LA2 36, Extended Health Care, Dental Coverage, Life
Insurance, Accidental Death And Dismemberment Insurance, Disability Coverage (Short/Long Term), OMERS Pension Plan, Employee Assistance Program
Yes
Material Aspect: Occupational Health And SafetyG4-DMA 17 NoG4-LA5 100% of employees (full and part-time are represented
by one of 5 Joint Health and Safety CommitteesNo
G4-LA6 17 NoDiversity and Equal OpportunityG4-DMA 17 NoG4-LA12 17 NoSub-Category: SocietyMaterial Aspect: Local CommunitiesG4-DMA 16 NoG4-SO1 16 NoMaterial Aspect: ComplianceG4-DMA 39 Information is subject to legal
confi dentiality constraints.No
G4-SO8 No fi nes or sanctions NoMaterial Aspect: Grievance Mechanisms for Impacts on SocietyG4-DMA 39 NoG4-SO11 39 NoSub-Category: Product ResponsibilityMaterial Aspect: Product and Service LabelingG4-DMA 9 NoG4-PR5 9 NoCategory: Electric Utilities Sector DisclosuresSub-Category: Organizational Profi leDMA 19 YesG4-EU1 13 & 19 YesG4-EU3 19 YesSub-Category: System Effi ciencyG4-EU12 19 Yes
2015 Annual ReportCity of Markham 4746
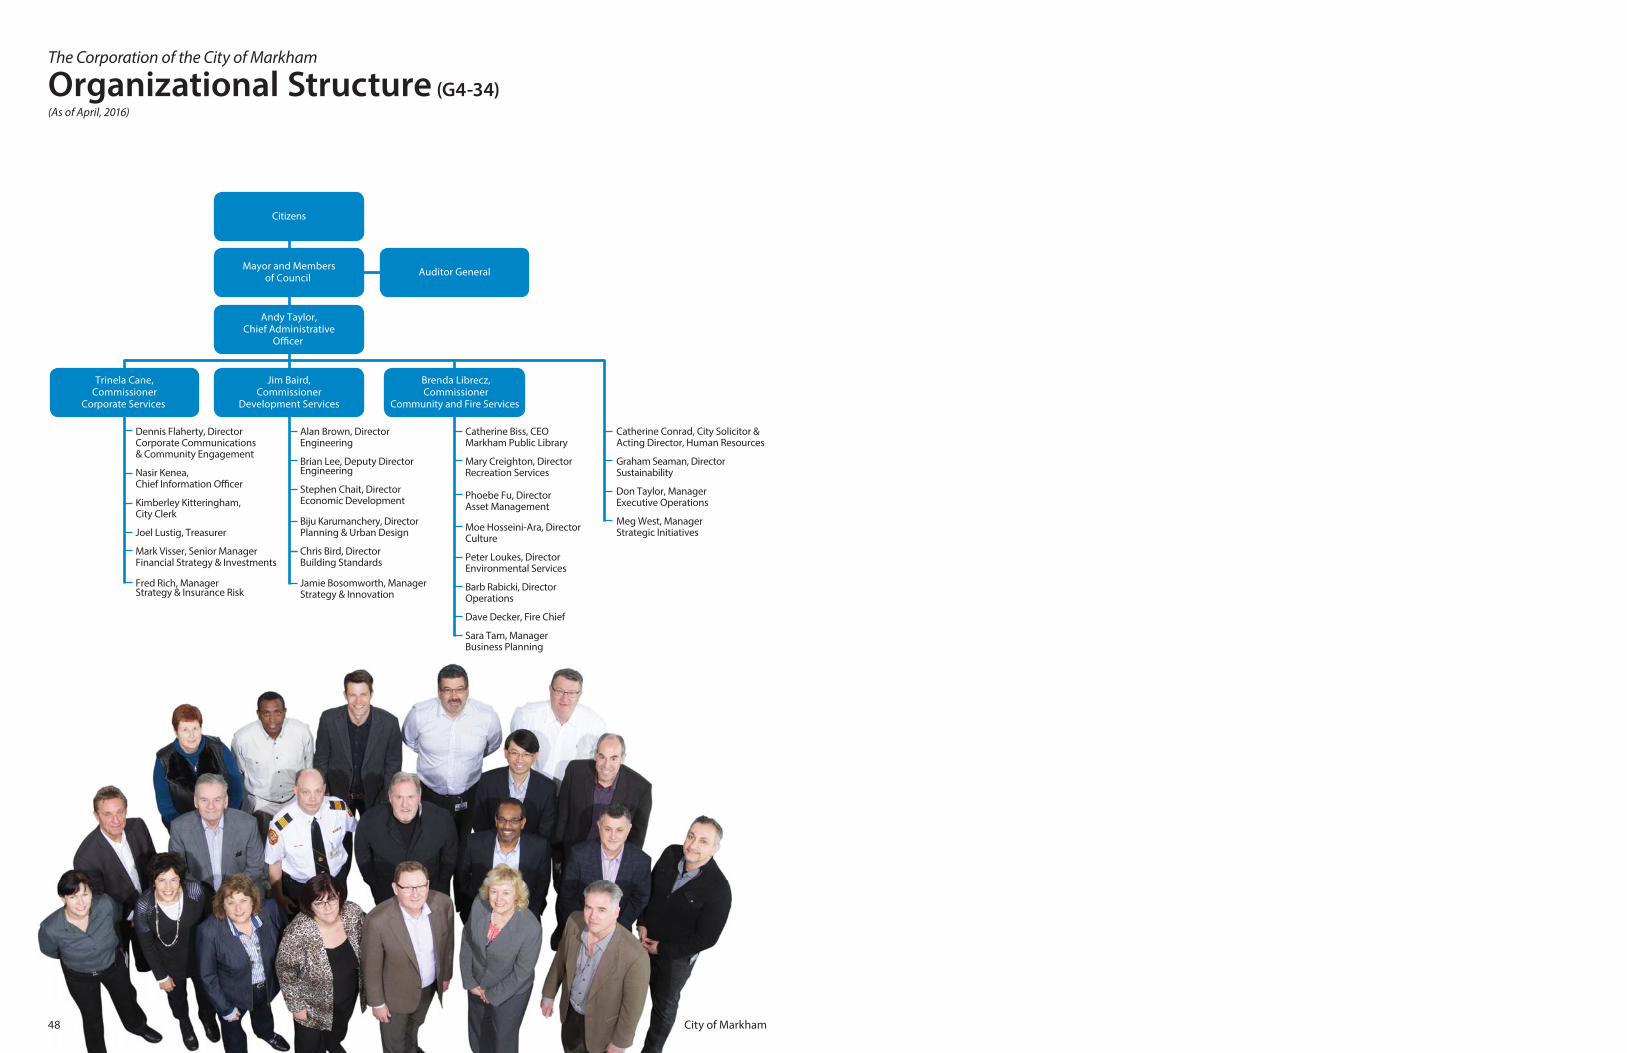
The Corporation of the City of Markham
Organizational Structure (G4-34)(As of April, 2016)
Citizens
Auditor GeneralMayor and Members
of Council
Andy Taylor,Chief Administrative
Officer
Trinela Cane,Commissioner
Corporate Services
Jim Baird,Commissioner
Development Services
Brenda Librecz,Commissioner
Community and Fire Services
Dennis Flaherty, Director Corporate Communications& Community Engagement
Nasir Kenea, Chief Information Officer
Kimberley Kitteringham,City Clerk
Joel Lustig, Treasurer
Mark Visser, Senior ManagerFinancial Strategy & Investments
Fred Rich, ManagerStrategy & Insurance Risk
Alan Brown, DirectorEngineering
Brian Lee, Deputy DirectorEngineering
Stephen Chait, DirectorEconomic Development
Biju Karumanchery, DirectorPlanning & Urban Design
Chris Bird, DirectorBuilding Standards
Jamie Bosomworth, Manager Strategy & Innovation
Catherine Biss, CEOMarkham Public Library
Mary Creighton, DirectorRecreation Services
Phoebe Fu, DirectorAsset Management
Moe Hosseini-Ara, Director Culture
Peter Loukes, DirectorEnvironmental Services
Barb Rabicki, DirectorOperations
Dave Decker, Fire Chief
Sara Tam, Manager Business Planning
Catherine Conrad, City Solicitor & Acting Director, Human Resources
Graham Seaman, DirectorSustainability
Don Taylor, ManagerExecutive Operations
Meg West, ManagerStrategic Initiatives
City of Markham48
Markham information in many languages
905-477-5530Please contact: Mayor Frank Scarpitti (G4-31)
City of Markham, Anthony Roman Centre (G4-5)
101 Town Centre Blvd., Markham, Ontario L3R 9W3
Tel: 905-475-4872 | Fax: [email protected] | markham.ca