Embed Size (px)
Citation preview
Combined operando Raman/UV-Vis-NIR spectroscopy
as a tool to study supported metal oxide catalysts at work
Het toepassen van operando Raman / UV-Vis-NIR spectroscopie voor het
bestuderen van metaaloxide katalysatoren onder reactiecondities
(met een samenvatting in het Nederlands)
Proefschrift
ter verkrijging van de graad van doctor aan de Universiteit Utrecht op gezag van de
rector magnificus, prof. dr. W.H. Gispen, ingevolge het besluit van het college voor
promoties in het openbaar te verdedigen op maandag 19 juni 2006 des middags te
4.15 uur
door
Stanislaus Josephus Tinnemans
geboren op 14 februari 1978, te Deurne

Promotor: Prof. dr. ir. B.M.W. Weckhuysen
Co-promotoren: Dr. T.A. Nijhuis
Dr. T. Visser
Contents
Chapter 1 General Introduction 1
Chapter 2 The development of an operando Raman / UV-Vis set-up for
monitoring supported chromium oxide catalysts during
propane dehydrogenation 21
Chapter 3 Quantitative operando Raman spectroscopy without the need
of an internal standard 41
Chapter 4 Quantitative Raman spectroscopy of supported metal oxide
catalysts: On-line determination of the amount of Cr6+ in a
catalytic reactor 61
Chapter 5 The role of coke during light alkane dehydrogenation
reactions over supported chromium oxide catalysts 79
Chapter 6 Summary and Concluding Remarks 95
Chapter 7 Samenvatting en Conclusies 99
List of publications and presentations 103
Dankwoord 105
Curriculum Vitae 108

ISBN-10: 0-393-4209-1
ISBN-13: 978-90-393-4209-1
Omslag: audivisuele dienst, Departement Scheikunde, Universiteit Utrecht
The research described in this thesis was financially supported by NWO

1
General Introduction
Chapter 1
2
Introduction
In 1666 Newton was the first to show that ‘white’ light from the sun consists of a
series of colors by means of a glass prism. The resulting spectrum was displayed on a
screen. This analysis of light was the beginning of the field of spectroscopy.
Throughout the centuries thereafter, different spectroscopic techniques have been
developed. All these methods have in common that they use radiation (as light is a
form of electromagnetic radiation) to interact with a sample. As the sample interacts
with the incoming beam, the resulting outgoing beam provides characteristic
information about the sample. A human eye is a kind of spectrometer. If one looks at
a piece of red paper, the following process occurs. Daylight (white light) interacts
with the paper surface. The complementary color is absorbed and the remaining light
is reflected and reaches the eye. In this case, this means that green is absorbed and
since this is the complementary color of red, the paper is seen as red.
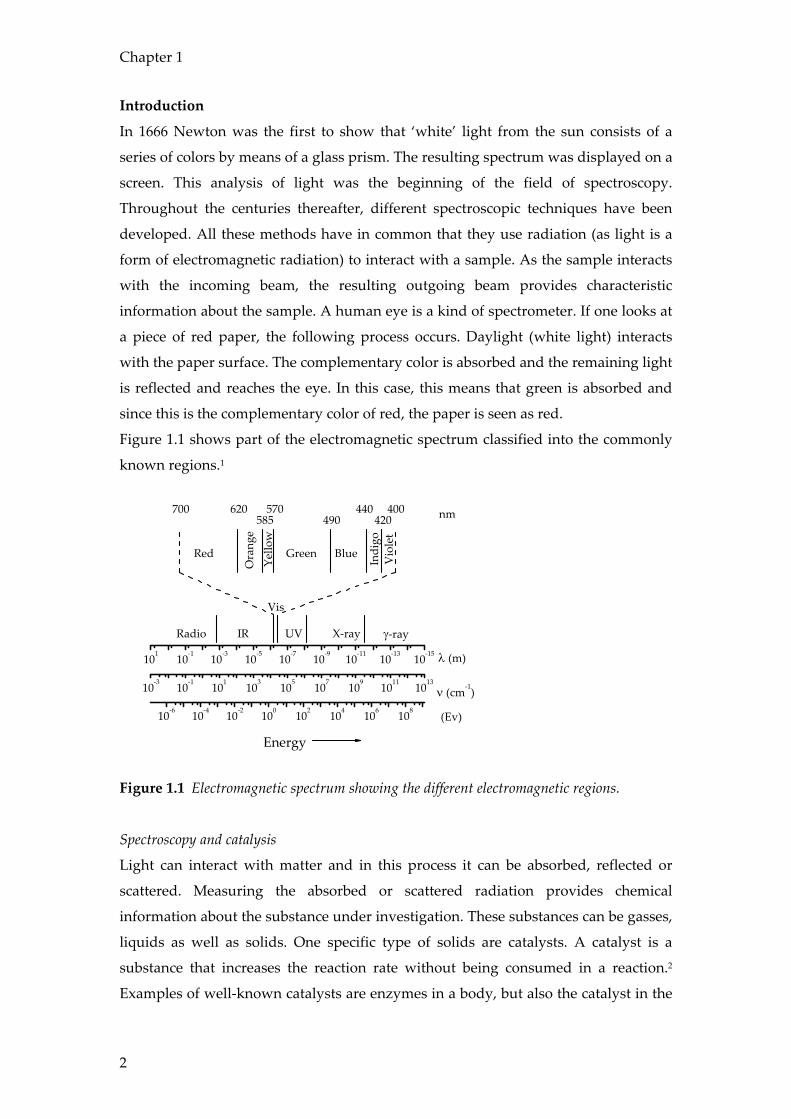
Figure 1.1 shows part of the electromagnetic spectrum classified into the commonly
known regions.1
101 10-1 10-3 10-5 10-7 10-9 10-11 10-13 10-15
10-3 10-1 101 103 105 107 109 1011 1013
10-6 10-4 10-2 100 102 104 106 108
Radio IR
Vis
UV X-ray γ-ray
λ (m)
(Ev)
ν (cm-1)
Energy
400420
440 490
570585
620700
Indi
goV
iole
t
BlueGreen
Yello
wO
rang
e
Red
nm
Figure 1.1 Electromagnetic spectrum showing the different electromagnetic regions.
Spectroscopy and catalysis
Light can interact with matter and in this process it can be absorbed, reflected or
scattered. Measuring the absorbed or scattered radiation provides chemical
information about the substance under investigation. These substances can be gasses,
liquids as well as solids. One specific type of solids are catalysts. A catalyst is a
substance that increases the reaction rate without being consumed in a reaction.2
Examples of well-known catalysts are enzymes in a body, but also the catalyst in the
General Introduction
3
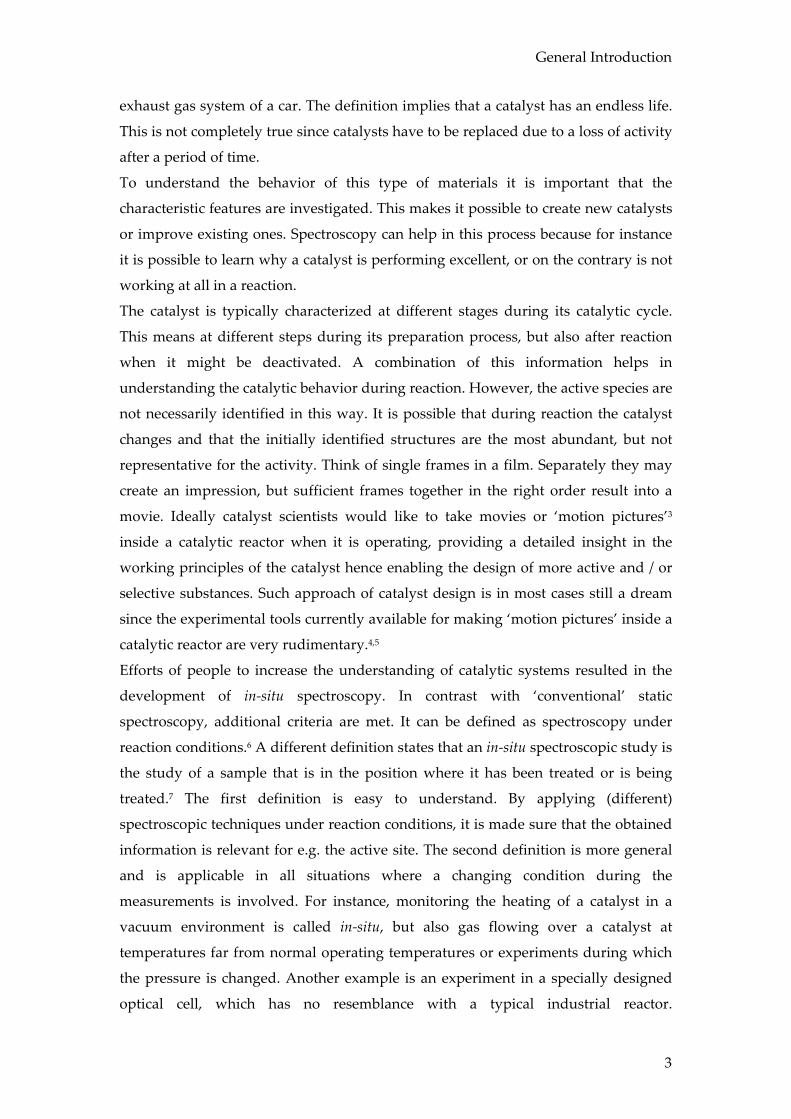
exhaust gas system of a car. The definition implies that a catalyst has an endless life.
This is not completely true since catalysts have to be replaced due to a loss of activity
after a period of time.
To understand the behavior of this type of materials it is important that the
characteristic features are investigated. This makes it possible to create new catalysts
or improve existing ones. Spectroscopy can help in this process because for instance
it is possible to learn why a catalyst is performing excellent, or on the contrary is not
working at all in a reaction.
The catalyst is typically characterized at different stages during its catalytic cycle.
This means at different steps during its preparation process, but also after reaction
when it might be deactivated. A combination of this information helps in
understanding the catalytic behavior during reaction. However, the active species are
not necessarily identified in this way. It is possible that during reaction the catalyst
changes and that the initially identified structures are the most abundant, but not
representative for the activity. Think of single frames in a film. Separately they may
create an impression, but sufficient frames together in the right order result into a
movie. Ideally catalyst scientists would like to take movies or ‘motion pictures’3
inside a catalytic reactor when it is operating, providing a detailed insight in the
working principles of the catalyst hence enabling the design of more active and / or
selective substances. Such approach of catalyst design is in most cases still a dream
since the experimental tools currently available for making ‘motion pictures’ inside a
catalytic reactor are very rudimentary.4,5
Efforts of people to increase the understanding of catalytic systems resulted in the
development of in-situ spectroscopy. In contrast with ‘conventional’ static
spectroscopy, additional criteria are met. It can be defined as spectroscopy under
reaction conditions.6 A different definition states that an in-situ spectroscopic study is
the study of a sample that is in the position where it has been treated or is being
treated.7 The first definition is easy to understand. By applying (different)
spectroscopic techniques under reaction conditions, it is made sure that the obtained
information is relevant for e.g. the active site. The second definition is more general
and is applicable in all situations where a changing condition during the
measurements is involved. For instance, monitoring the heating of a catalyst in a
vacuum environment is called in-situ, but also gas flowing over a catalyst at
temperatures far from normal operating temperatures or experiments during which
the pressure is changed. Another example is an experiment in a specially designed
optical cell, which has no resemblance with a typical industrial reactor.
Chapter 1
4
Recapitulating, the term in-situ spectroscopy is not always used rigorously, since the
experimental conditions may differ from relevant reaction conditions.
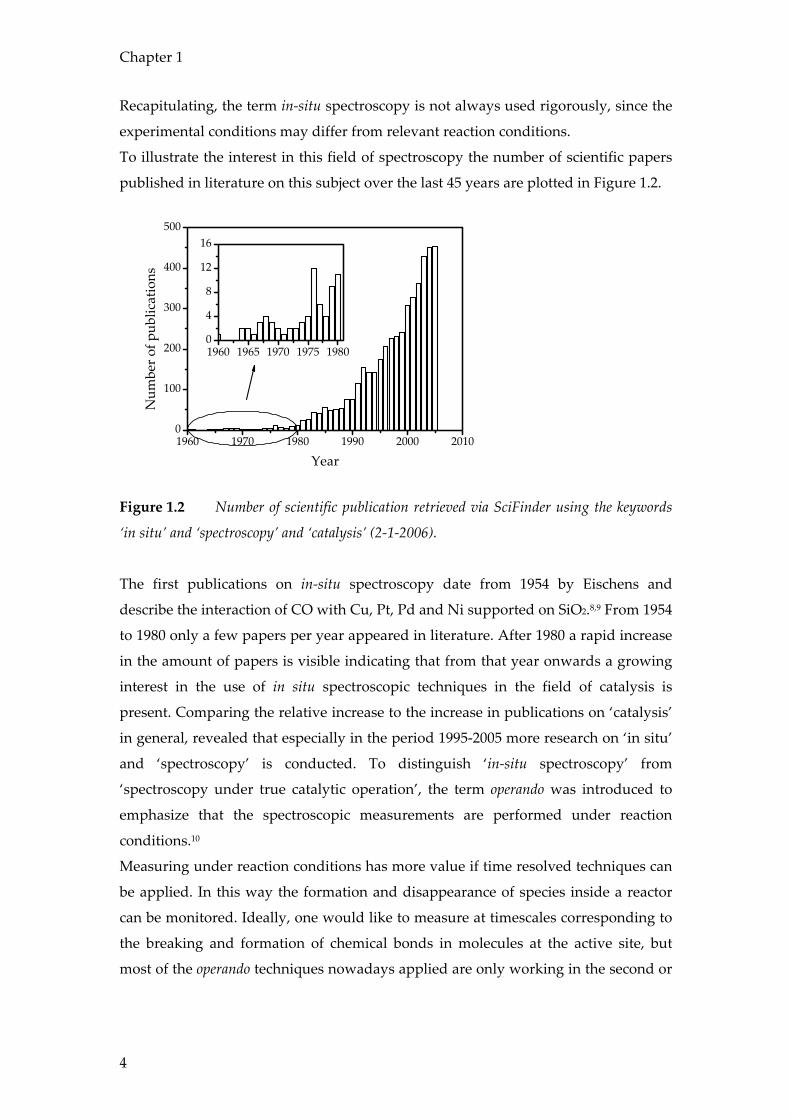
To illustrate the interest in this field of spectroscopy the number of scientific papers
published in literature on this subject over the last 45 years are plotted in Figure 1.2.
1960 1965 1970 1975 19800
4
8
12
16
1960 1970 1980 1990 2000 20100
100
200
300
400
500
Num
ber o
f pub
licat
ions
Year
Figure 1.2 Number of scientific publication retrieved via SciFinder using the keywords
‘in situ’ and ‘spectroscopy’ and ‘catalysis’ (2-1-2006).
The first publications on in-situ spectroscopy date from 1954 by Eischens and
describe the interaction of CO with Cu, Pt, Pd and Ni supported on SiO2.8,9 From 1954
to 1980 only a few papers per year appeared in literature. After 1980 a rapid increase
in the amount of papers is visible indicating that from that year onwards a growing
interest in the use of in situ spectroscopic techniques in the field of catalysis is
present. Comparing the relative increase to the increase in publications on ‘catalysis’
in general, revealed that especially in the period 1995-2005 more research on ‘in situ’
and ‘spectroscopy’ is conducted. To distinguish ‘in-situ spectroscopy’ from
‘spectroscopy under true catalytic operation’, the term operando was introduced to
emphasize that the spectroscopic measurements are performed under reaction
conditions.10
Measuring under reaction conditions has more value if time resolved techniques can
be applied. In this way the formation and disappearance of species inside a reactor
can be monitored. Ideally, one would like to measure at timescales corresponding to
the breaking and formation of chemical bonds in molecules at the active site, but
most of the operando techniques nowadays applied are only working in the second or
General Introduction
5
subsecond regime. In other words, only differences in relative population of active
sites and / or reactive intermediates can be assessed.
For measuring under reaction conditions it is important that these conditions are as
close to industrial practice as possible, i.e. realistic pressures and temperatures. This
implies that the experimental set-up can be regarded as a ‘true’ catalytic reactor.
Ideally the spectroscopic device is brought inside the reactor unaltering the processes
taking place inside.
In the last decade several operando set-ups have been built in various laboratories
combining the application of a spectroscopic technique with on-line activity
measurements.
Quartz wool
Catalyst
Gas feed Thermocouple
Quartz reactor
To on-lineGC Analysis
Probe
OvenLight Source
Spectrometer
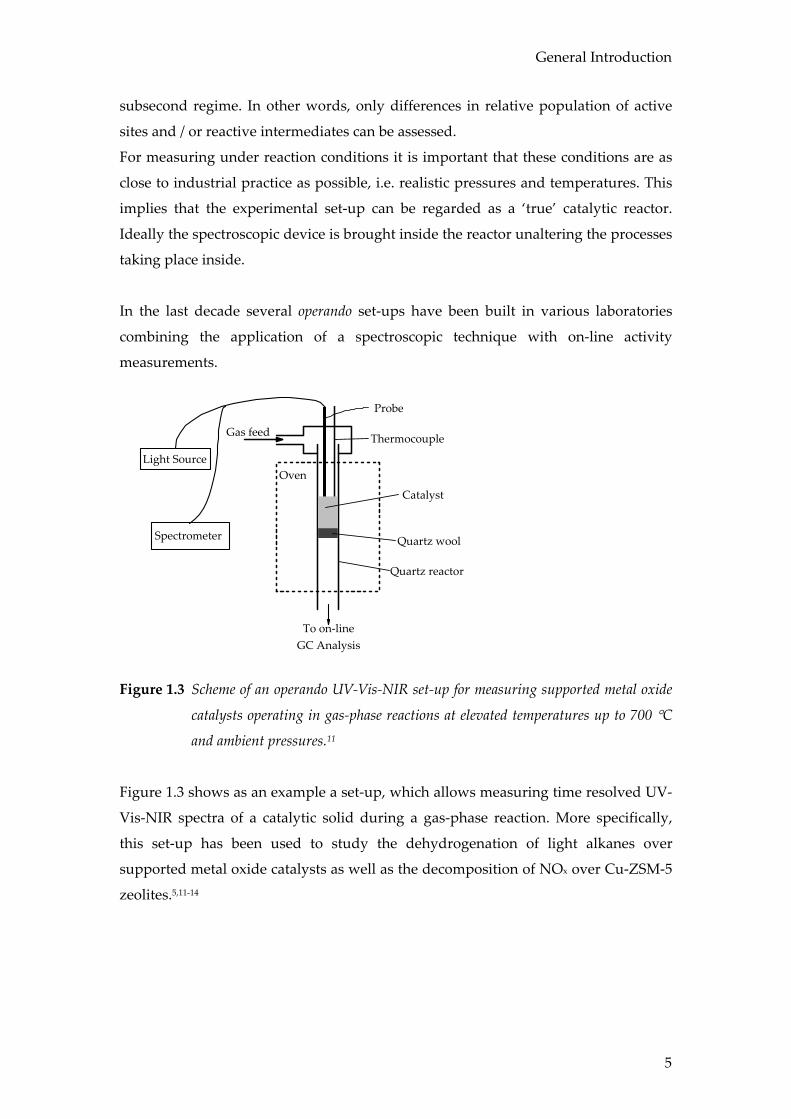
Figure 1.3 Scheme of an operando UV-Vis-NIR set-up for measuring supported metal oxide
catalysts operating in gas-phase reactions at elevated temperatures up to 700 °C
and ambient pressures.11
Figure 1.3 shows as an example a set-up, which allows measuring time resolved UV-
Vis-NIR spectra of a catalytic solid during a gas-phase reaction. More specifically,
this set-up has been used to study the dehydrogenation of light alkanes over
supported metal oxide catalysts as well as the decomposition of NOx over Cu-ZSM-5
zeolites.5,11-14
Chapter 1
6
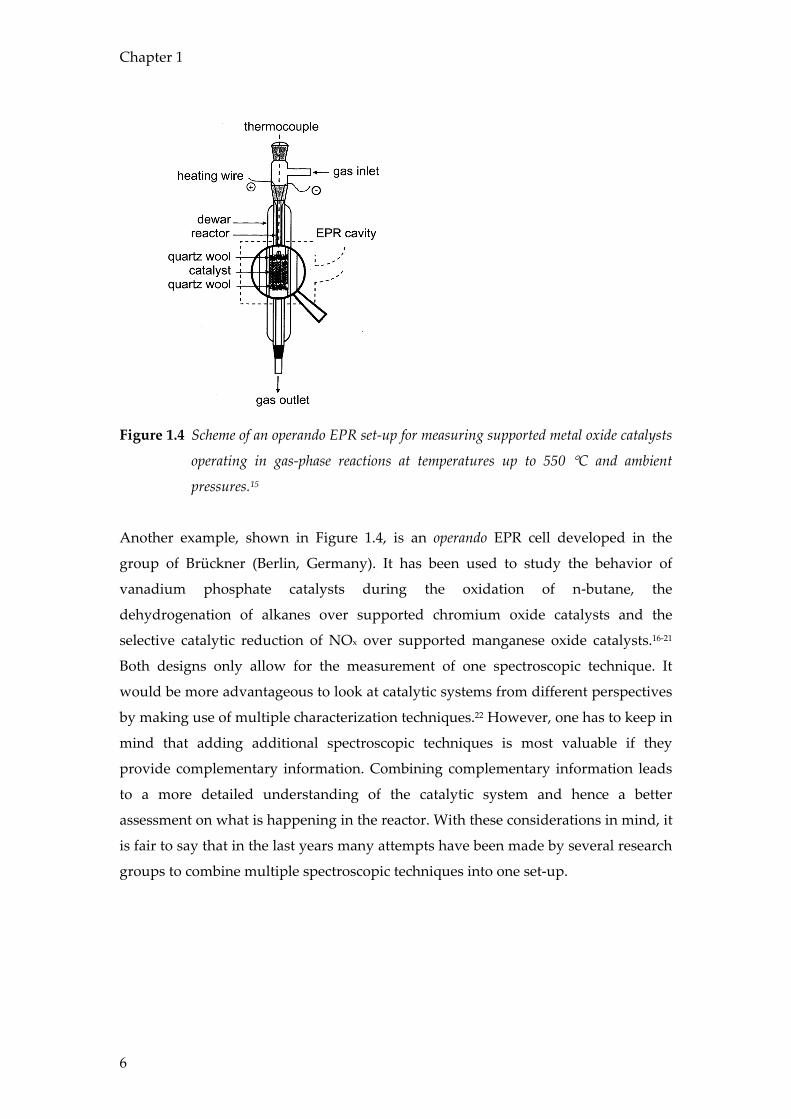
Figure 1.4 Scheme of an operando EPR set-up for measuring supported metal oxide catalysts
operating in gas-phase reactions at temperatures up to 550 °C and ambient
pressures.15
Another example, shown in Figure 1.4, is an operando EPR cell developed in the
group of Brückner (Berlin, Germany). It has been used to study the behavior of
vanadium phosphate catalysts during the oxidation of n-butane, the
dehydrogenation of alkanes over supported chromium oxide catalysts and the
selective catalytic reduction of NOx over supported manganese oxide catalysts.16-21
Both designs only allow for the measurement of one spectroscopic technique. It
would be more advantageous to look at catalytic systems from different perspectives
by making use of multiple characterization techniques.22 However, one has to keep in
mind that adding additional spectroscopic techniques is most valuable if they
provide complementary information. Combining complementary information leads
to a more detailed understanding of the catalytic system and hence a better
assessment on what is happening in the reactor. With these considerations in mind, it
is fair to say that in the last years many attempts have been made by several research
groups to combine multiple spectroscopic techniques into one set-up.
General Introduction
7
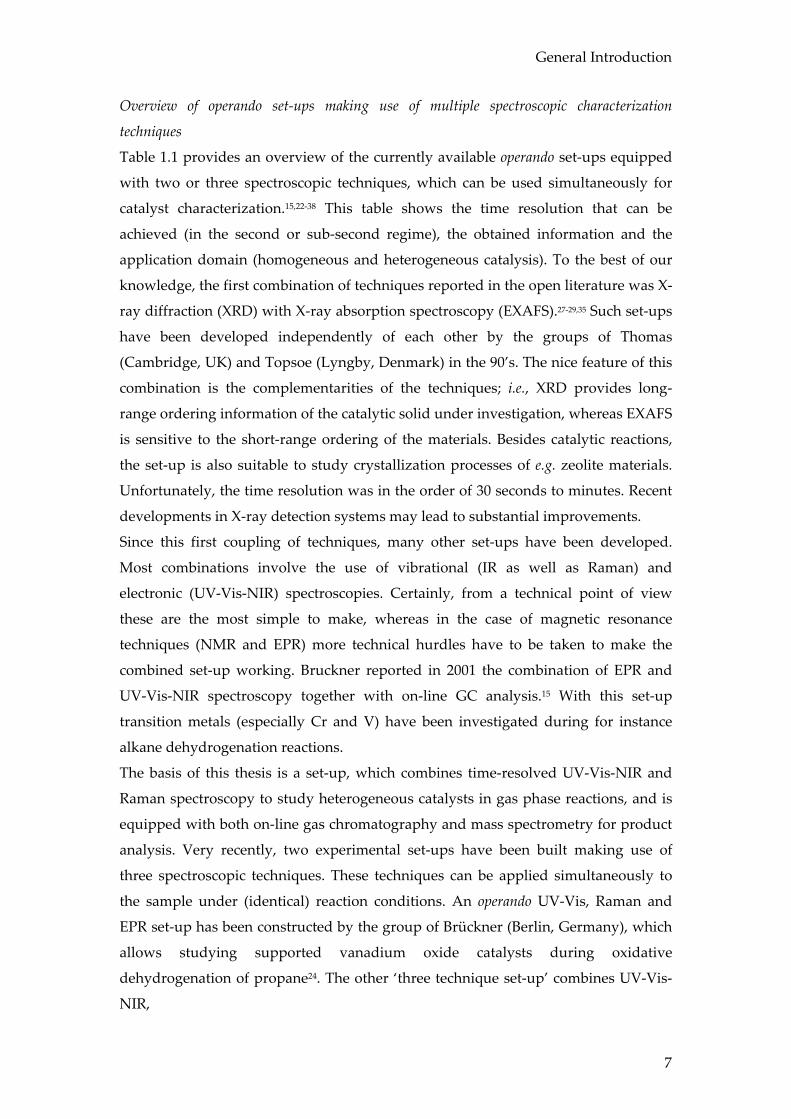
Overview of operando set-ups making use of multiple spectroscopic characterization
techniques
Table 1.1 provides an overview of the currently available operando set-ups equipped
with two or three spectroscopic techniques, which can be used simultaneously for
catalyst characterization.15,22-38 This table shows the time resolution that can be
achieved (in the second or sub-second regime), the obtained information and the
application domain (homogeneous and heterogeneous catalysis). To the best of our
knowledge, the first combination of techniques reported in the open literature was X-
ray diffraction (XRD) with X-ray absorption spectroscopy (EXAFS).27-29,35 Such set-ups
have been developed independently of each other by the groups of Thomas
(Cambridge, UK) and Topsoe (Lyngby, Denmark) in the 90’s. The nice feature of this
combination is the complementarities of the techniques; i.e., XRD provides long-
range ordering information of the catalytic solid under investigation, whereas EXAFS
is sensitive to the short-range ordering of the materials. Besides catalytic reactions,
the set-up is also suitable to study crystallization processes of e.g. zeolite materials.
Unfortunately, the time resolution was in the order of 30 seconds to minutes. Recent
developments in X-ray detection systems may lead to substantial improvements.
Since this first coupling of techniques, many other set-ups have been developed.
Most combinations involve the use of vibrational (IR as well as Raman) and
electronic (UV-Vis-NIR) spectroscopies. Certainly, from a technical point of view
these are the most simple to make, whereas in the case of magnetic resonance
techniques (NMR and EPR) more technical hurdles have to be taken to make the
combined set-up working. Bruckner reported in 2001 the combination of EPR and
UV-Vis-NIR spectroscopy together with on-line GC analysis.15 With this set-up
transition metals (especially Cr and V) have been investigated during for instance
alkane dehydrogenation reactions.
The basis of this thesis is a set-up, which combines time-resolved UV-Vis-NIR and
Raman spectroscopy to study heterogeneous catalysts in gas phase reactions, and is
equipped with both on-line gas chromatography and mass spectrometry for product
analysis. Very recently, two experimental set-ups have been built making use of
three spectroscopic techniques. These techniques can be applied simultaneously to
the sample under (identical) reaction conditions. An operando UV-Vis, Raman and
EPR set-up has been constructed by the group of Brückner (Berlin, Germany), which
allows studying supported vanadium oxide catalysts during oxidative
dehydrogenation of propane24. The other ‘three technique set-up’ combines UV-Vis-
NIR,
Chapter 1
8
Tabel 1.1 Existing combinations of characterization techniques for studying
homogeneous (Homo) and heterogeneous (Hetero) catalysts at work.
Techniques Time (s) Information to be obtained Domain Ref. XRD XAFS
30 10-30
⇒ Long-range structural order ⇒ Short-range structural order
Hetero 27-29,35
EPR UV-Vis-NIR
60-300 0.01-1
⇒ Paramagnetic transition metal ions ⇒ Electronic d-d and charge transfer
transitions of TMI
Hetero 15,22
Raman UV-Vis-NIR
2-120 0.01-1
⇒ Vibrational spectra of metal oxides and organic deposits, such as coke
⇒ Electronic d-d and charge transfer transitions of TMI
Hetero 32,33
ED-XAFS UV-Vis-NIR
0.01-1 0.0008
⇒ Coordination environment and oxidation state of M and Mn+
⇒ Electronic d-d and charge transfer transitions of TMI
Homo 36
Raman FT-IR
2-120 0.01-1
⇒ Vibrational spectra of metal oxides ⇒ Vibrational spectra of adsorbed species,
such as NO
Hetero 30
NMR UV-Vis-NIR
7200 0.01-1
⇒ Identification of organic molecules formed via chemical shift values
⇒ Electronic transitions (π* ← n and π* ← π) of organic molecules
Hetero 37
ED-XAFS FT-IR
6 0.01-1
⇒ Coordination environment and oxidation state of M and Mn+
⇒ Vibrational spectra of adsorbed species, such as CO and NO
Hetero 31
FT-IR Phase behavior monitoring
0.01-1
⇒ Vibrational spectra of reaction mixtures and adsorbed molecules
⇒ Video monitoring of phase behavior
Homo and
hetero
26,34
FT-IR UV-Vis-NIR
0.01-1 0.01-1
⇒ Vibrational spectra of reaction mixtures and adsorbed molecules
⇒ Electronic transitions of the catalyst material
Hetero 25
EPR UV-Vis-NIR Raman
60-300 0.01-1 2-120
⇒ Paramagnetic transition metal ions ⇒ Electronic d-d and charge transfer
transitions of transition metal ions ⇒ Vibrational spectra of metal oxides and
organic deposits, such as coke
Hetero 24
UV-Vis-NIR Raman ED-XAFS
0.05-1 0.05-1 0.003-1
⇒ Electronic d-d and charge transfer transitions of transition metal oxides
⇒ Vibrational spectra of metal oxides and organic deposits, such as coke
⇒ Coordination environment and oxidation state of metals and metal ions
Hetero 23
General Introduction
9
Raman and ED-XAFS in one spectroscopic-reaction cell and has been developed in
our group.23
One would anticipate at first sight that making combinations of two or three
spectroscopic techniques is rather straightforward. In principle one could couple all
the techniques mentioned in Table 1.1 in one catalytic reactor, creating a kind of
dream machine. Unfortunately, this instrument will simply not work because each
spectroscopic technique has its own sensitivity towards a specific catalytic system or
towards the reactants or solvents used. For instance, every technique has a
concentration range in which useful data can be gathered. If these ranges do not
overlap, the additional value of combining techniques is limited.39 Often a
compromise in which all techniques are not hampered too much has to be chosen.
In other words, one should first consider the catalytic application, the characteristics
of the catalytic material as well as the reaction medium before starting to assemble
the most appropriate techniques in one reactor system. One could even argue that a
reaction mechanism proposed based on experimental data obtained for a catalytic
system at low concentrations could be different from that obtained at high
concentrations.
As already mentioned briefly above, the development of a combined operando Raman
and UV-Vis-NIR set-up will be discussed in this thesis. This combination is able to
provide information on both vibrational and electronic transitions and therefore is
complementary. The possibility for providing new information about supported
metal oxide catalysts at work is explored with the dehydrogenation of propane over
Cr / Al2O3 catalysts as the case study. To provide the reader a better understanding of
the applied techniques, the basic theory will now be briefly discussed.
Theoretical background on Raman spectroscopy
In 1928, C.V. Raman and K.S. Krishnan published the observation that if (sun)light is
passed through some filters and focused on a liquid, the observed radiation not only
consists of the same wavelength as the incident beam (elastic scattering), but also of
scattered radiation of lower frequency (inelastic scattering).40 This observation was in
line with theoretical predictions of A. Smekal in 1923.41 Later it was shown that also
light with a higher frequency is present.
The inelastic scattered radiation contains information specific for the compound
under investigation. In Raman spectroscopy three different types of scattering are
Chapter 1
10
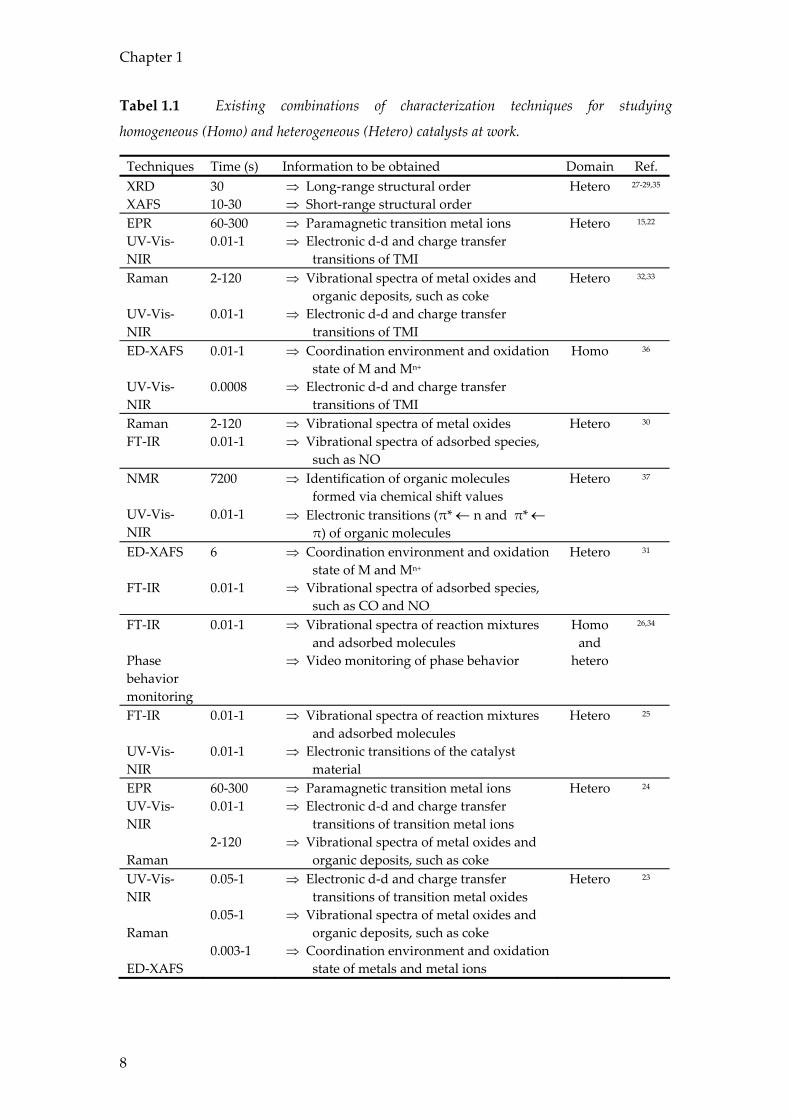
important namely the Rayleigh, the Stokes and the anti-Stokes scattering.
anti - StokesStokes
ν − νvib
Energy
Rayleigh
ν + νvib
νv = 0v = 1
anti-StokesStokesRayleighE
0
v = 2
Figure 1.5 Theoretical Raman spectrum (left) and an energy diagram (right) showing the
principal energy transfers related to Raman spectroscopy.
The left part of Figure 1.5 shows a typical Raman spectrum. In the right part the
corresponding energy transitions are illustrated. The first type of radiation is
Rayleigh scattering. In this process photons are elastically scattered and have the
same energy as the incident beam. Molecules are excited in a virtual state and upon
relaxation return to their original ground state. The release of energy during
relaxation equals the energy primarily absorbed. However, there is a very small
possibility, depending on the wavelength of the incident beam, that the energy of the
scattered radiation is of a different energy i.e. light is inelastically scattered. Most
often, this radiation will be of lower energy. In Raman spectroscopy this is called the
Stokes radiation. In Figure 1.5 (right) this is illustrated in the middle part where a
molecule is illuminated and falls back to an excited state. On the other hand, a
molecule can release radiation of higher energy if the final energy level of a molecule
is lower than the original one, the so called anti-Stokes radiation. A molecule, already
in an excited state, is illuminated and upon relaxation falls back into its ground state.
In this process, energy is transferred from the molecule into the radiation.
From Figure 1.5 (right) it is clear that the same vibration is involved in both the
Stokes and anti-Stokes shift, namely ν1 → ν0 = ν0 → ν1.
General Introduction
11
After defining the terms Stokes and anti-Stokes radiation, it is important to
understand the changes that are induced in the molecules. The amount of energy
transferred is typical for transitions between vibrational levels. This does not mean
that every vibration in a molecule is Raman active. Only those vibrations can be seen
with Raman spectroscopy in which the polarizability of the molecule is changed.
The electric field of the incident radiation (E) interacts with a molecule and may
induce a dipole moment (µ) of magnitude
Eµ α= (eq. 1.1)
In this equation, the polarizability is represented by α.
The incident radiation is a time varying quantity and if molecules are subjected to a
beam of radiation of frequency (ν) the electric field experienced by each molecule
varies according to
0 sin(2 )E E tπν= (eq. 1.2)
resulting in
0 sin 2E E tµ α α πν= = (eq. 1.3)
In Equation1.3 the induced dipole (µ) will emit radiation of its own oscillating
frequency and this explains the observed Rayleigh scattering. If molecules undergo
some internal motion like rotation or vibration, the polarizability can be changed
periodically and if a vibration of frequency νvib is involved, one can write
0 sin(2 )vibtα α β πν= + (eq. 1.4)
In this equation α0 represents the equilibrium polarizability and β the rate of change
of polarizability with the vibration.
Combining Equations 1.4 and 1.3 result in
0 0( sin(2 )) sin 2vibE t E tµ α α β πν πν= = + (eq. 1.5)
Chapter 1
12
This can be rewritten as
{ }0 0 01sin 2 cos 2 ( ) cos 2 ( )2 vib vibE t E t tµ α πν β π ν ν π ν ν= + − − + (eq. 1.6)
From Equation 1.6 one learns that the induced dipole has, besides the Rayleigh
component, also two components at a frequency of ν ± νvib. Note that these Stokes
and anti-Stokes frequencies are only present if β ≠ 0.
The ratio between anti-Stokes (AS) and Stokes (S) transitions can be derived from the
Maxwell-Boltzmann distribution of states42:
4
4
( )( )
Eupper vib kT
lower vib
N AS eN S
ν νν ν
−∆+= =
− (eq. 1.7)
In this equation ΔE represents the energy difference between the relaxed and excited
state, k the Boltzmann constant and T the temperature.
From Equation 1.7 it becomes clear that at moderate temperatures Stokes transitions
are more likely to occur than anti Stokes transitions. As a result a Stokes band is more
intense than the corresponding anti-Stokes band, see Figure 1.5 (left).
In principle light of every wavelength can be used to obtain a Raman spectrum.
However, to prevent overlapping spectra monochromatic light is used. In the early
days sources like a mercury arc were used. With the development of the laser in
combination with the improvements of the filters, more intense sources became
available. By applying laser technology the number of photons reaching the sample
was increased and so increasing the amount of Stokes (and anti-Stokes) radiation.
The result is a better sensitivity. From Equation 1.7 it becomes clear that the
excitation wavelength is also of influence on the Raman scattering. For instance, if
the wavelength of the laser is reduced by a factor 2 (from 1064 nm (9398.5 cm-1) to 532
nm (18797 cm-1)), the Stokes (and anti Stokes) bands are 16 times (24) more intense.
This implies that it is best to use short wavelength lasers, since then the Raman
efficiency is best. However, other phenomena are responsible for an influence on the
sample and should therefore be taken into consideration. For instance fluorescence
may occur.43 This is when in the decay from the virtual excited state light is emitted
by the sample. Also trace amounts of impurities can be responsible for this effect.
Fluorescence is very intense compared to the weak Raman effect and as a result the
General Introduction
13
Raman bands cannot be discriminated. Changing the wavelength of the laser to a
longer wavelength can sometimes be used to solve problems with fluorescence.44 The
explanation is that at a longer wavelength the energy transitions, responsible for the
fluorescence, are no longer possible. An alternative is using a deep UV laser (λ < 250
nm).45 The reason for the absence of fluorescence in using these high energy lasers is
not known. The disadvantage, however, is that photochemical processes may lead to
undesired side-reactions. Laser heating can also be a problem during measurements.
Especially blue and black samples are capable of absorbing light strongly and as a
result blackbody radiation may occur. Also the structure of the sample may change
due to this increased temperature.46
Theoretical background on UV-Vis-NIR diffuse reflectance spectroscopy
In contrast to Raman spectroscopy, where vibrational information is obtained, UV-
Vis-NIR spectroscopy probes the electronic transitions in a compound. Well-known
examples are the π* ← π and π* ← n transitions in organic molecules and the d-d and
charge-transfer (CT) transitions of inorganic materials.47
In solution, the absorption of a compound can easily be measured through the liquid,
i.e. in transmission. The obtained signal can be described by Beer’s Law:
A clε= (eq. 1.8)
This equation states that the absorption of a compound (in solution) is dependent on
its concentration (c), the path length through the cel (l) and an extinction coefficient
(ε). Solid materials, like heterogeneous catalysts, are most often not transparent and
as a result transmission spectroscopy cannot be applied on these samples. By using
UV-Vis-NIR diffuse reflectance spectroscopy (UV-Vis-NIR DRS) this problem can be
avoided. This technique is based on the transmission and diffuse reflection of light
by small particles. When light interacts with small particles it is either specular
reflected or diffuse reflected. In specular reflection the light is reflected on the surface
with the same angle as that of the incoming beam. Diffuse reflected light penetrates
the surface and after partial absorption and multiple scattering, appears again on the
surface. The reflected beam bears the structural and chemical information.
A theory for this phenomenon was initiated in the beginning of the 20th century by
Schuster48 and later further developed by Kubelka and Munk49.
Chapter 1
14
The result is the Schuster-Kubelka-Munk or Kubelka-Munk function:
2(1 )( )
2R KF RR S
∞∞
∞
−= = (eq. 1.9)
With this equation the diffuse reflection of a sample (R∞), measured as the light
intensity reflected from the powdered sample divided by the light intensity
measured from an ideally reference standard, can be related to an apparent
absorption (K) and apparent scattering coefficient (S). This equation is valid under
the following conditions:
1. The intensity of the scattered light must be equal in all directions, i.e. isotropic
light scattering.
2. The sample is irradiated with diffuse monochromatic light.
3. The sample should be of infinite thickness, typically > 2 mm.
4. The concentration of absorbing centers should be low and evenly distributed
throughout the sample.
5. Fluorescence should be absent.
In practice this means that randomly shaped particles containing low amounts of
light absorbing centers should be used. An extended theory was introduced by
Klier.50 In this theory a true absorption (αν) and true scattering (σν) coefficient are
related to K and S via:
Kνα η= and Sνσ χ= (eq. 1.10)
From Equations 1.9 and 1.10 it follows that:
2(1 )
2RR
ν
ν
α ησ χ
∞
∞
−= ⋅ (eq. 1.11)
It was shown that in the limit for small absorptions (K/S = 0 - 0.3) η and χ are equal to
1/2 and 4/3, respectively, and thus η/ χ has a fairly constant value of 3/8. This implies
that at low concentrations a quantitative determination of the concentration (C) is
possible via:
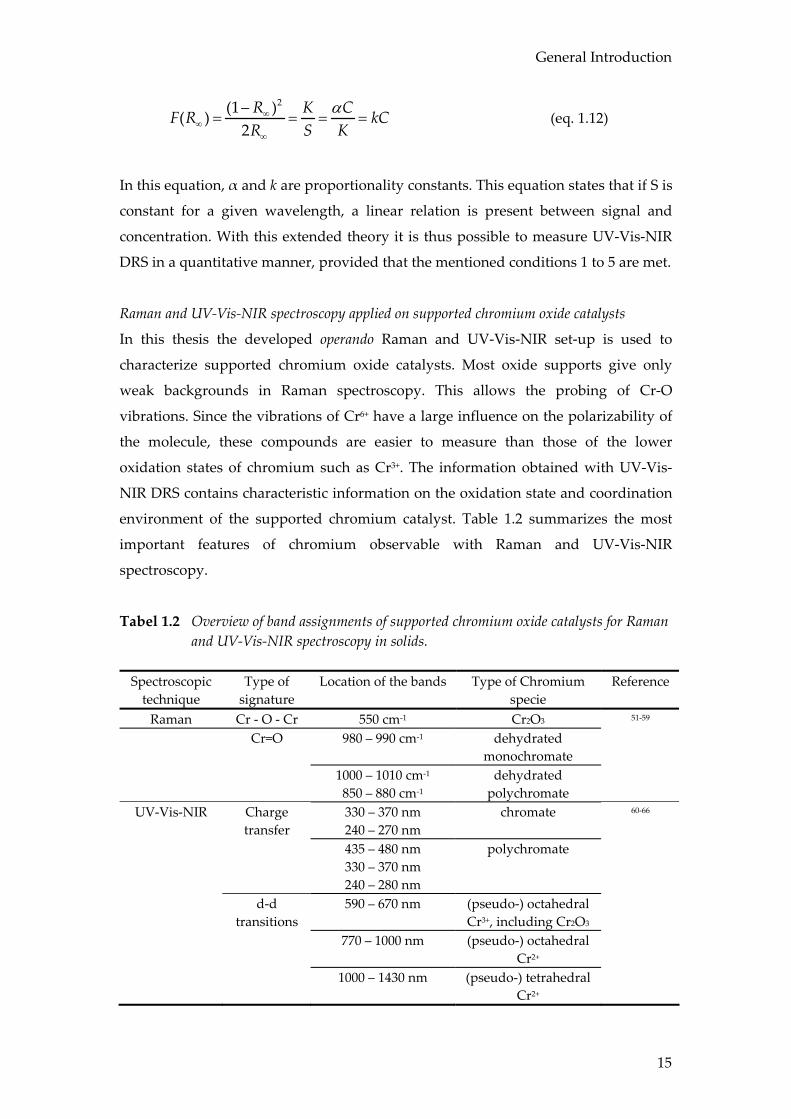
General Introduction
15
2(1 )( )2
R K CF R kCR S K
α∞∞
∞
−= = = = (eq. 1.12)
In this equation, α and k are proportionality constants. This equation states that if S is
constant for a given wavelength, a linear relation is present between signal and
concentration. With this extended theory it is thus possible to measure UV-Vis-NIR
DRS in a quantitative manner, provided that the mentioned conditions 1 to 5 are met.
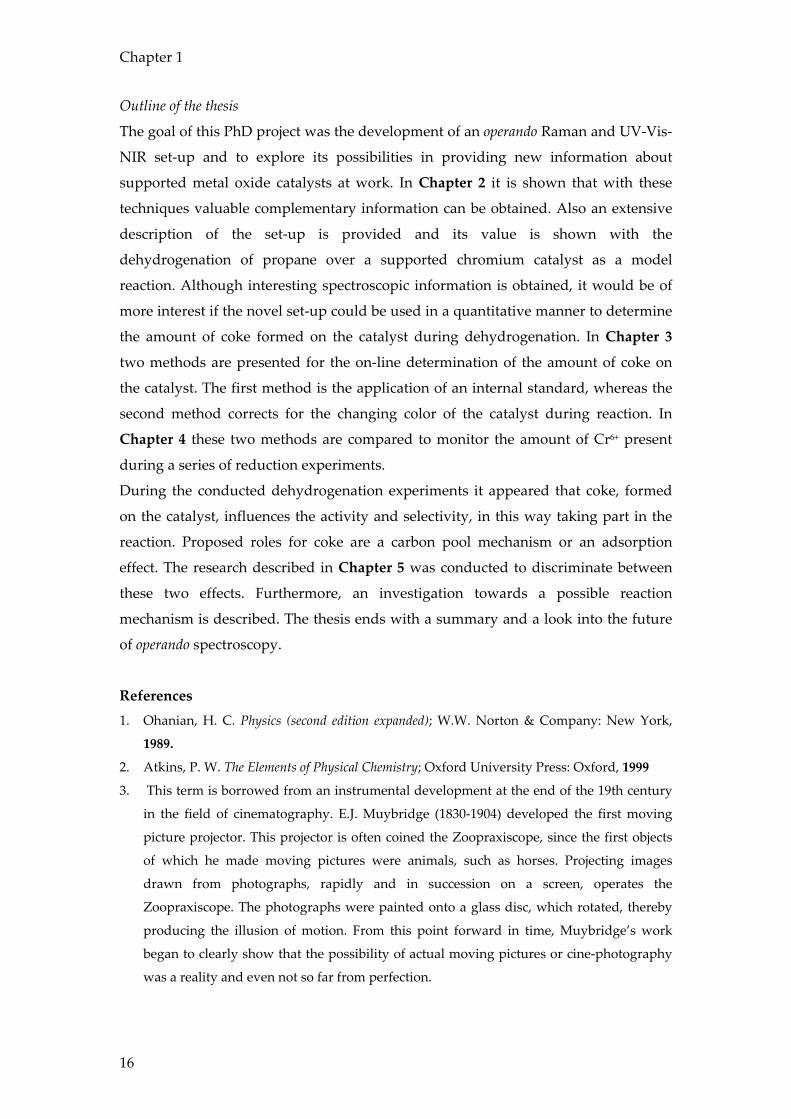
Raman and UV-Vis-NIR spectroscopy applied on supported chromium oxide catalysts
In this thesis the developed operando Raman and UV-Vis-NIR set-up is used to
characterize supported chromium oxide catalysts. Most oxide supports give only
weak backgrounds in Raman spectroscopy. This allows the probing of Cr-O
vibrations. Since the vibrations of Cr6+ have a large influence on the polarizability of
the molecule, these compounds are easier to measure than those of the lower
oxidation states of chromium such as Cr3+. The information obtained with UV-Vis-
NIR DRS contains characteristic information on the oxidation state and coordination
environment of the supported chromium catalyst. Table 1.2 summarizes the most
important features of chromium observable with Raman and UV-Vis-NIR
spectroscopy.
Tabel 1.2 Overview of band assignments of supported chromium oxide catalysts for Raman and UV-Vis-NIR spectroscopy in solids.
Spectroscopic
technique Type of
signature Location of the bands Type of Chromium
specie Reference
Raman Cr - O - Cr 550 cm-1 Cr2O3 51-59 Cr=O 980 – 990 cm-1 dehydrated
monochromate
1000 – 1010 cm-1
850 – 880 cm-1 dehydrated
polychromate
UV-Vis-NIR Charge transfer
330 – 370 nm 240 – 270 nm
chromate 60-66
435 – 480 nm 330 – 370 nm 240 – 280 nm
polychromate
d-d transitions
590 – 670 nm
(pseudo-) octahedral Cr3+, including Cr2O3
770 – 1000 nm (pseudo-) octahedral Cr2+
1000 – 1430 nm (pseudo-) tetrahedral Cr2+
Chapter 1
16
Outline of the thesis
The goal of this PhD project was the development of an operando Raman and UV-Vis-
NIR set-up and to explore its possibilities in providing new information about
supported metal oxide catalysts at work. In Chapter 2 it is shown that with these
techniques valuable complementary information can be obtained. Also an extensive
description of the set-up is provided and its value is shown with the
dehydrogenation of propane over a supported chromium catalyst as a model
reaction. Although interesting spectroscopic information is obtained, it would be of
more interest if the novel set-up could be used in a quantitative manner to determine
the amount of coke formed on the catalyst during dehydrogenation. In Chapter 3
two methods are presented for the on-line determination of the amount of coke on
the catalyst. The first method is the application of an internal standard, whereas the
second method corrects for the changing color of the catalyst during reaction. In
Chapter 4 these two methods are compared to monitor the amount of Cr6+ present
during a series of reduction experiments.
During the conducted dehydrogenation experiments it appeared that coke, formed
on the catalyst, influences the activity and selectivity, in this way taking part in the
reaction. Proposed roles for coke are a carbon pool mechanism or an adsorption
effect. The research described in Chapter 5 was conducted to discriminate between
these two effects. Furthermore, an investigation towards a possible reaction
mechanism is described. The thesis ends with a summary and a look into the future
of operando spectroscopy.
References 1. Ohanian, H. C. Physics (second edition expanded); W.W. Norton & Company: New York,
1989.
2. Atkins, P. W. The Elements of Physical Chemistry; Oxford University Press: Oxford, 1999
3. This term is borrowed from an instrumental development at the end of the 19th century
in the field of cinematography. E.J. Muybridge (1830-1904) developed the first moving
picture projector. This projector is often coined the Zoopraxiscope, since the first objects
of which he made moving pictures were animals, such as horses. Projecting images
drawn from photographs, rapidly and in succession on a screen, operates the
Zoopraxiscope. The photographs were painted onto a glass disc, which rotated, thereby
producing the illusion of motion. From this point forward in time, Muybridge’s work
began to clearly show that the possibility of actual moving pictures or cine-photography
was a reality and even not so far from perfection.
General Introduction
17
4. Haw, J. F., Ed.; In-situ spectroscopy in Heterogeneous Catalysis; Wiley-VCH: Weinheim, 2002,
pp 4.
5. Weckhuysen, B. M., Ed.; In-situ Spectroscopy of Catalysts; American Scientific Publishers:
Stevenson Ranch, 2004, pp 1.
6. Weckhuysen, B. M.; Van Der Voort, P.; Catana, G., Eds.; Spectroscopy of Transition Metal
Ions on Surfaces; Leuven University Press: Leuven, 2000.
7. Banares, M. A. Raman Spectroscopy. In In-situ Spectroscopy of Catalysts; Weckhuysen, B.
M., Ed.; American Scientific Publishers: Stevenson Ranch, 2004; pp 59.
8. Mapes, J. E.; Eischens, R. P., J. Phys. Chem., 1954, 58, 1059.
9. Eischens, R. P.; Plisken, W. A.; Francis, S. A., J. Chem. Phys., 1954, 24, 1986.
10. Weckhuysen, B. M., Phys. Chem. Chem. Phys., 2003, 5, 4351 Operando spectroscopy is the
shortened version of spectra of an operando or working catalyst. This name has been
proposed by M. A. Banares, E. Gaigneaux, G. Mestl and B.M. Weckhuysen in 2000 in
Washington DC during the ACS meeting.
11. Puurunen, R. L.; Beheydt, B. G.; Weckhuysen, B. M., J. Catal., 2001, 204, 253.
12. Puurunen, R. L.; Weckhuysen, B. M., J. Catal., 2002, 210, 418.
13. Groothaert, M. H.; Lievens, K.; van Bokhoven, J. A.; Battiston, A. A.; Weckhuysen, B. M.;
Pierloot, K.; Schoonheydt, R. A., Chem. Phys. Chem., 2003, 4, 626.
14. Groothaert, M. H.; Lievens, K.; Leeman, H.; Weckhuysen, B. M.; Schoonheydt, R. A., J.
Catal., 2003, 220, 500.
15. Bruckner, A., Chem. Comm., 2001, 2122.
16. Bentrup, U.; Bruckner, A.; Rudinger, C.; Eberle, H. J., Appl. Catal. A-Gen., 2004, 269, 237.
17. Bruckner, A., Phys. Chem. Chem. Phys., 2003, 5, 4461.
18. Bruckner, A. Electron Paramagnetic Resonance. In In-situ Spectroscopy of Catalysts;
Weckhuysen, B. M., Ed.; American Scientific Publishers: Stevenson Ranch, 2004; pp 219.
19. Bruckner, A.; Martin, A.; Kubias, B.; Lucke, B., J. Chem. Soc. Faraday Trans., 1998, 94, 2221.
20. Bruckner, A.; Martin, A.; Lucke, B.; Hannour, F. K., Stud. Surf. Sci. Catal., 1997, 110, 919.
21. Bruckner, A.; Martin, A.; Steinfeldt, N.; Wolf, G. U.; Lucke, B., J. Chem. Soc. Faraday Trans.,
1996, 92, 4257.
22. Bruckner, A., Catal. Rev.-Sci. Eng., 2003, 45, 97.
23. Beale, A. M.; Van der Eerden, A. M. J.; Kervinen, K.; Newton, M. A.; Weckhuysen, B. M.,
Chem. Comm., 2005, 24, 3015.
24. Bruckner, A., Chem. Comm., 2005, 1761.
25. Burgi, T., J. Catal., 2005, 229, 55.
26. Caravati, M.; Grunwaldt, J. D.; Baiker, A., Phys. Chem. Chem. Phys., 2005, 7, 278.
27. Clausen, B. S.; Grabaek, L.; Steffensen, G.; Hansen, P. L.; Topsoe, H., Catal. Lett., 1993, 20,
23.
28. Couves, J. W.; Thomas, J. M.; Waller, D.; Jones, R. H.; Dent, A. J.; Derbyshire, G. E.;
Greaves, G. N., Nature, 1991, 354, 465.
Chapter 1
18
29. Grunwaldt, J. D.; Molenbroek, A. M.; Topsoe, N. Y.; Topsoe, H.; Clausen, B. S., J. Catal.,
2000, 194, 452.
30. Le Bourdon, G.; Adar, F.; Moreau, M.; Morel, S.; Reffner, J.; Mamede, A. S.; Dujardin, C.;
Payen, E., Phys. Chem. Chem. Phys., 2003, 5, 4441.
31. Newton, M. A.; Jyoti, B.; Dent, A. J.; Fiddy, S. G.; Evans, J., Chem. Comm., 2004, 2382.
32. Nijhuis, T. A.; Tinnemans, S. J.; Visser, T.; Weckhuysen, B. M., Phys. Chem. Chem. Phys.,
2003, 5, 4361.
33. Nijhuis, T. A.; Tinnemans, S. J.; Visser, T.; Weckhuysen, B. M., Chem. Eng. Sci., 2004, 59,
5487.
34. Schneider, M. S.; Grunwaldt, J. D.; Burgi, T.; Baiker, A., Rev. Sci. Instrum., 2003, 74, 4121.
35. Shannon, I. J.; Maschmeyer, T.; Sankar, G.; Thomas, J. M.; Oldroyd, R. D.; Sheehy, M.;
Madill, D.; Waller, A. M.; Townsend, R. P., Catal. Lett., 1997, 44, 23.
36. Tromp, M. Development of time resolved XAFS spectroscopy techniques, Ph. D. Thesis; Utrecht
University: Utrecht, 2004.
37. Hunger, M.; Wang, W., Chem. Comm., 2004, 584.
38. Tinnemans, S. J.; Mesu, J. G.; Kervinen, K.; Visser, T.; Nijhuis, T. A.; Beale, A. M.; Keller,
D. E.; van der Eerden, A. M. J.; Weckhuysen, B. M., Catal. Today, 2006, 113, 3.
39. Kervinen, K.; Korpi, H.; Mesu, J. G.; Soulimani, F.; Repo, T.; Rieger, B.; Leskela, M.;
Weckhuysen, B. M., Eur. J. Inorg. Chem., 2005, 2591.
40. Raman, C. V.; Krishnan, K. S., Nature, 1928, 121, 501.
41. Smekal, A., Naturwiss., 1923, 11, 873.
42. Long, D. A. Raman Spectroscopy; McGraw-Hill Inc.: Great Britain, 1977
43. Knozinger, H.; Mestl, G., Top. Catal., 1999, 8, 45.
44. Jeziorowski, H.; Knozinger, H., Chem. Phys. Lett., 1976, 42, 162.
45. Asher, S. A.; Johnson, C. R., Science, 1984, 225, 311.
46. Bowie, B. T.; Chase, D. B.; Griffiths, P. R., Appl. Spectrosc., 2000, 54, 164A.
47. Atkins, P. W. Physical Chemistry (6th edition); Oxford University Press: Oxford, 2001, p.
502.
48. Schuster, A., J. Astrophys., 1905, 21, 1.
49. Kubelka, P.; Munk, F., Z. Techn. Phys., 1931, 12, 593.
50. Klier, K., J. Opt. Soc. Am., 1972, 62, 882.
51. Vuurman, M. A.; Wachs, I. E.; Stufkens, D. J.; Oskam, A., J. Mol. Catal., 1993, 80, 209.
52. Vuurman, M. A.; Wachs, I. E., J. Phys. Chem., 1992, 96, 5008.
53. Vuurman, M. A.; Stufkens, D. J.; Oskam, A.; Moulijn, J. A.; Kapteijn, F., J. Mol. Catal., 1990,
60, 83.
54. Vuurman, M. A.; Hardcastle, F. D.; Wachs, I. E., J. Mol. Catal., 1993, 84, 193.
55. Kim, D. S.; Wachs, I. E., J. Catal., 1993, 142, 166.
56. Kim, D. S.; Tatibouet, J. M.; Wachs, I. E., J. Catal., 1992, 136, 209.
57. Jehng, J. M.; Wachs, I. E.; Weckhuysen, B. M.; Schoonheydt, R. A., J. Chem. Soc. Faraday
Trans., 1995, 91, 953.
General Introduction
19
58. Hardcastle, F. D.; Wachs, I. E., J. Mol. Catal., 1988, 46, 173.
59. Deo, G.; Wachs, I. E., J. Phys. Chem., 1991, 95, 5889.
60. Zecchina, A.; Garrone, E.; Ghiotti, G.; Morterra, C.; Borello, E., J. Phys. Chem., 1975, 79,
966.
61. Weckhuysen, B. M.; Wachs, I. E.; Schoonheydt, R. A., Stud. Surf. Sci. Catal., 1994, 91, 151.
62. Weckhuysen, B. M.; Verberckmoes, A. A.; Buttiens, A. L.; Schoonheydt, R. A., J. Phys.
Chem., 1994, 98, 579.
63. Weckhuysen, B. M.; De Ridder, L. M.; Schoonheydt, R. A., J. Phys. Chem., 1993, 97, 4756.
64. Ghiotti, G.; Garrone, E.; Della Gatta, G.; Fubini, B.; Giamello, E., J. Catal., 1983, 80, 249.
65. Fubini, B.; Ghiotti, G.; Stradella, L.; Garrone, E.; Morterra, C., J. Catal., 1980, 66, 200.
66. Krauss, H. L.; Rebenstorf, B.; Westphal, U., Z. Anorg. Allgem. Chem., 1975, 414, 97.

Chapter 1
20
21
The development of an operando Raman / UV-Vis-NIR set-up for monitoring
supported chromium oxide catalysts during propane dehydrogenation.
Abstract
The implementation of operando Raman and UV-Vis-NIR spectroscopy into a novel
reactor system is described. This set-up is capable of monitoring heterogeneous
catalysts under reaction conditions. The potential of the set-up is demonstrated for
the catalytic dehydrogenation of propane. It is shown that these spectroscopic
techniques provide qualitative information on the changing oxidation state of the
catalyst and the coke formed during reaction. This information can be linked to
catalytic data as measured with on-line micro GC and mass spectrometry.
Chapter 2
22
Introduction
Propene is an important building block in chemical industries. Products are for
instance polypropene, propene oxide, oxo alcohols, acrylonitrile and cumene.
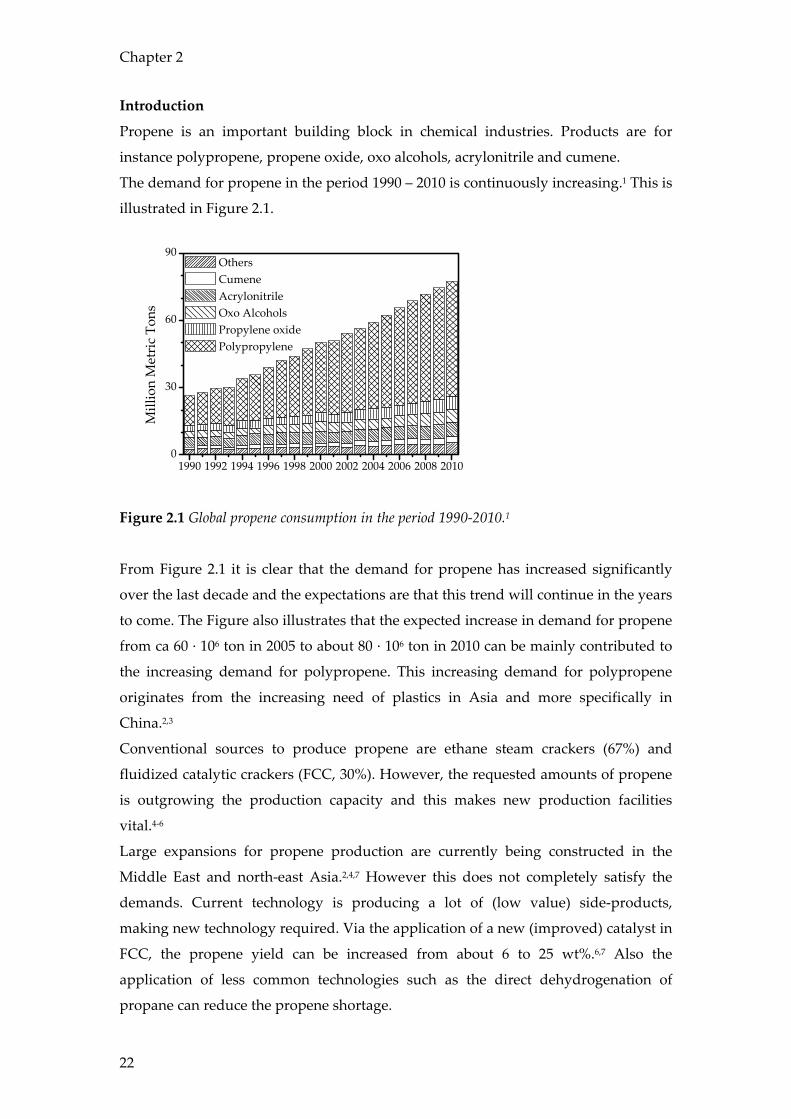
The demand for propene in the period 1990 – 2010 is continuously increasing.1 This is
illustrated in Figure 2.1.
1990 1992 1994 1996 1998 2000 2002 2004 2006 2008 20100
30
60
90
Mill
ion
Met
ric
Tons
Others Cumene Acrylonitrile Oxo Alcohols Propylene oxide Polypropylene
Figure 2.1 Global propene consumption in the period 1990-2010.1
From Figure 2.1 it is clear that the demand for propene has increased significantly
over the last decade and the expectations are that this trend will continue in the years
to come. The Figure also illustrates that the expected increase in demand for propene
from ca 60 · 106 ton in 2005 to about 80 · 106 ton in 2010 can be mainly contributed to
the increasing demand for polypropene. This increasing demand for polypropene
originates from the increasing need of plastics in Asia and more specifically in
China.2,3
Conventional sources to produce propene are ethane steam crackers (67%) and
fluidized catalytic crackers (FCC, 30%). However, the requested amounts of propene
is outgrowing the production capacity and this makes new production facilities
vital.4-6
Large expansions for propene production are currently being constructed in the
Middle East and north-east Asia.2,4,7 However this does not completely satisfy the
demands. Current technology is producing a lot of (low value) side-products,
making new technology required. Via the application of a new (improved) catalyst in
FCC, the propene yield can be increased from about 6 to 25 wt%.6,7 Also the
application of less common technologies such as the direct dehydrogenation of
propane can reduce the propene shortage.
The development of an operando Raman / UV-Vis-NIR set-up
23
Propane dehydrogenation offers some specific advantages to propene derivative
producers. First, the only product is propene. Companies specifically interested in
producing propene are not interested in producing ethene or higher olefins (C4+ co-
products) that are made from naphtha crackers, or gasoline and fuels from refineries.
Second, some of the best locations for propene derivative plants do not have good
access to propene. These sites represent a high demand for propene (derivatives), i.e.
near China. Given the high cost of shipping and storing propene, dehydrogenation of
propane is generally more cost-effective than buying propene for these locations.6,8
Until now the direct dehydrogenation has found limited use because the economics
are heavily dependent on the price of the feedstock, i.e. the price of propane.
However, the economics have changed and the price difference between propane
and propene is now making the dehydrogenation more attractive. As a result the
amount of propene produced via dehydrogenation is expected to double during the
next five years from 1.2 to 2.4 · 106 metric tons per year when new plants come in
production in Saudi Arabia (Al-Jubail).6,9
Currently there are five industrial dehydrogenation processes available. These are
the Catofin process, the Oleflex process, Steam active reforming (STAR), fluidized
bed dehydrogenation (FBD) and the Linde process. To the best of our knowledge
only the Catofin and Oleflex processes are currently commercially applied for the
dehydrogenation of propane. The different methods will be briefly described in the
next paragraphs.
The first process available for the dehydrogenation of propane is the Catofin or
Houdry process (ABB Lummus).5,6,10-13 The process is widely used in the
dehydrogenation of iso-butane to iso-butene, an important primary product in the
production of methyl tertiary butyl ether (MTBE). With the pressure on this market
due to the banning of MTBE from fuels for environmental reasons, new applications
for the Catofin process are developed. An example is the dehydrogenation of
propane. A Catofin plant usually contains five cyclically shallow bed operated
reactors containing a chromium oxide on alumina catalyst. The process is typically
run at a temperature around 575 °C and at a subatmospheric pressure of 0.2-0.5 bar.
Each reactor undergoes a cycle of typically 12 minutes of propane dehydrogenation,
3 minutes purge/evacuation, 12 minutes of catalyst regeneration using air and 3
minutes of purge/evacuation optionally followed by a catalyst reduction. The five
reactors are switched in such a manner that the overall plant operates in a continuous
Chapter 2
24
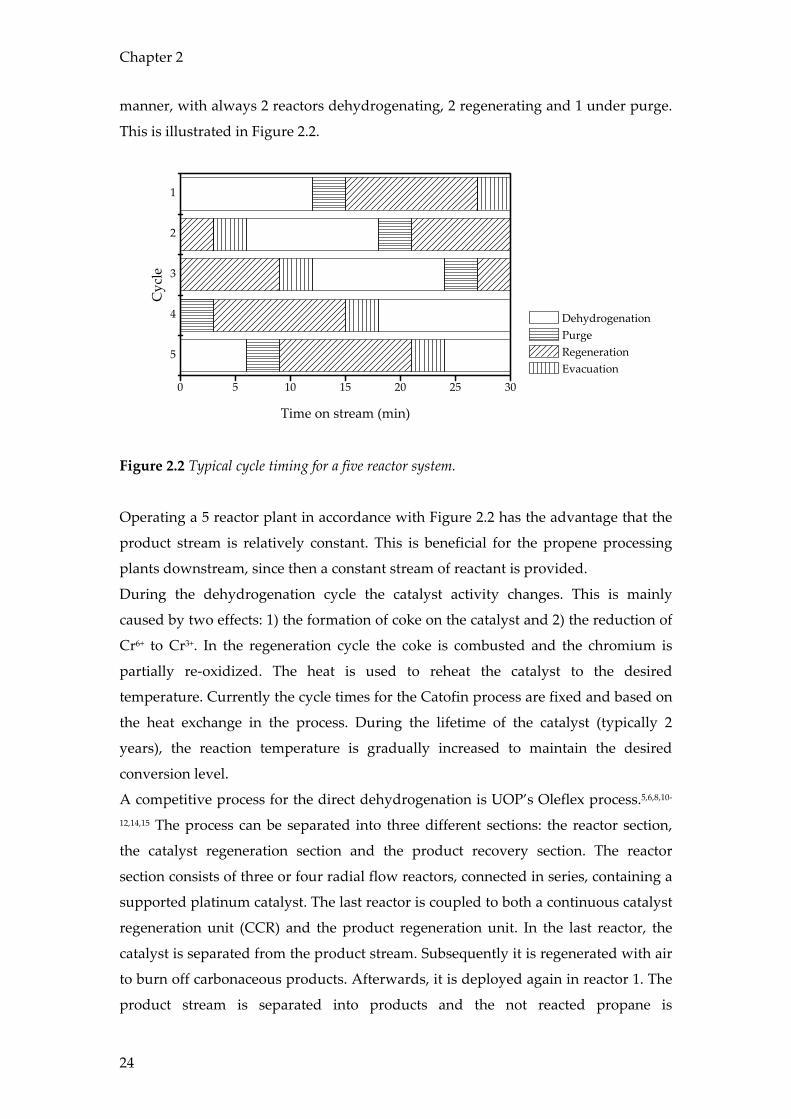
manner, with always 2 reactors dehydrogenating, 2 regenerating and 1 under purge.
This is illustrated in Figure 2.2.
5
4
3
2
1
0 5 10 15 20 25 30
Time on stream (min)
Cyc
le
Dehydrogenation Purge Regeneration Evacuation
Figure 2.2 Typical cycle timing for a five reactor system.
Operating a 5 reactor plant in accordance with Figure 2.2 has the advantage that the
product stream is relatively constant. This is beneficial for the propene processing
plants downstream, since then a constant stream of reactant is provided.
During the dehydrogenation cycle the catalyst activity changes. This is mainly
caused by two effects: 1) the formation of coke on the catalyst and 2) the reduction of
Cr6+ to Cr3+. In the regeneration cycle the coke is combusted and the chromium is
partially re-oxidized. The heat is used to reheat the catalyst to the desired
temperature. Currently the cycle times for the Catofin process are fixed and based on
the heat exchange in the process. During the lifetime of the catalyst (typically 2
years), the reaction temperature is gradually increased to maintain the desired
conversion level.
A competitive process for the direct dehydrogenation is UOP’s Oleflex process.5,6,8,10-
12,14,15 The process can be separated into three different sections: the reactor section,
the catalyst regeneration section and the product recovery section. The reactor
section consists of three or four radial flow reactors, connected in series, containing a
supported platinum catalyst. The last reactor is coupled to both a continuous catalyst
regeneration unit (CCR) and the product regeneration unit. In the last reactor, the
catalyst is separated from the product stream. Subsequently it is regenerated with air
to burn off carbonaceous products. Afterwards, it is deployed again in reactor 1. The
product stream is separated into products and the not reacted propane is
The development of an operando Raman / UV-Vis-NIR set-up
25
reintroduced into the feed. The catalyst is typically a Pt / Sn on alumina catalyst.
Typical reaction temperatures of the Oleflex process are 525 - 705 °C at pressures of
1-3 bar.
The third process makes use of STeam Active Reforming (STAR).6,12,16-18 This process
was developed by Phillips Petroleum Co, and is now licensed by Uhde (Germany).
By adding oxygen to the feed, the equilibrium is shifted towards the product side,
since the oxygen reacts with part of the hydrogen formed during dehydrogenation.
The catalyst contains Pt as active phase promoted with tin on a support of zinc
aluminate or magnesium aluminate with calcium aluminate as binder. The reaction
is operated at 6 – 9 bar and 500 – 600 °C. There are two major requirements for this
catalyst. First it has to be stable in the presence of steam and oxygen second it should
maintain its activity for dehydrogenation and does not convert hydrocarbons in
carbon oxides and hydrogen. Since small amounts of coke are formed on the catalyst
it is necessary to regenerate the catalyst after 7 hours for a period of 1 hour in oxygen
/ air. By using multiple reactors similar to Figure 2.2 the product stream is kept as
constant as possible. The process has commercially been proven by the
dehydrogenation of 1-butene to butadiene and the dehydrogenation of butane. A
pilot-plant study for the dehydrogenation of propane has been performed.
The fluidized bed dehydrogenation (FBD) is licenced by Snamprogetti and
Yarsintez.5,11,15,18 In this process the pure alkane feed bubbles through the staged
fluidized bed reactor at 1.1 - 1.5 bar. Since coke is formed on the alumina supported
chromium catalyst a regeneration of the catalyst is required. Therefore part of the
catalyst is continuously moved to a regenerator and back. Typical operating
temperatures are 550 – 600 °C. This process is commercially used for the
dehydrogenation of isobutane and isopentane.
The last process described in this context is the Linde process (Linde, BASF).5,15,18 This
process is performed in three fixed bed reactors. Two operate under
dehydrogenation conditions while the third is regenerated by combusting the coke
on the catalyst with a steam / air mixture. The catalyst in this process is a CrOx /
Al2O3. The process is operated at a temperature of 590 °C and is kept at nearly
isothermal conditions, to minimize thermal cracking and coke formation. A pilot
plant study for the dehydrogenation of propane has been performed.
An overview of important parameters for all five described processes is provided in
Table 2.1.
Chapter 2
26
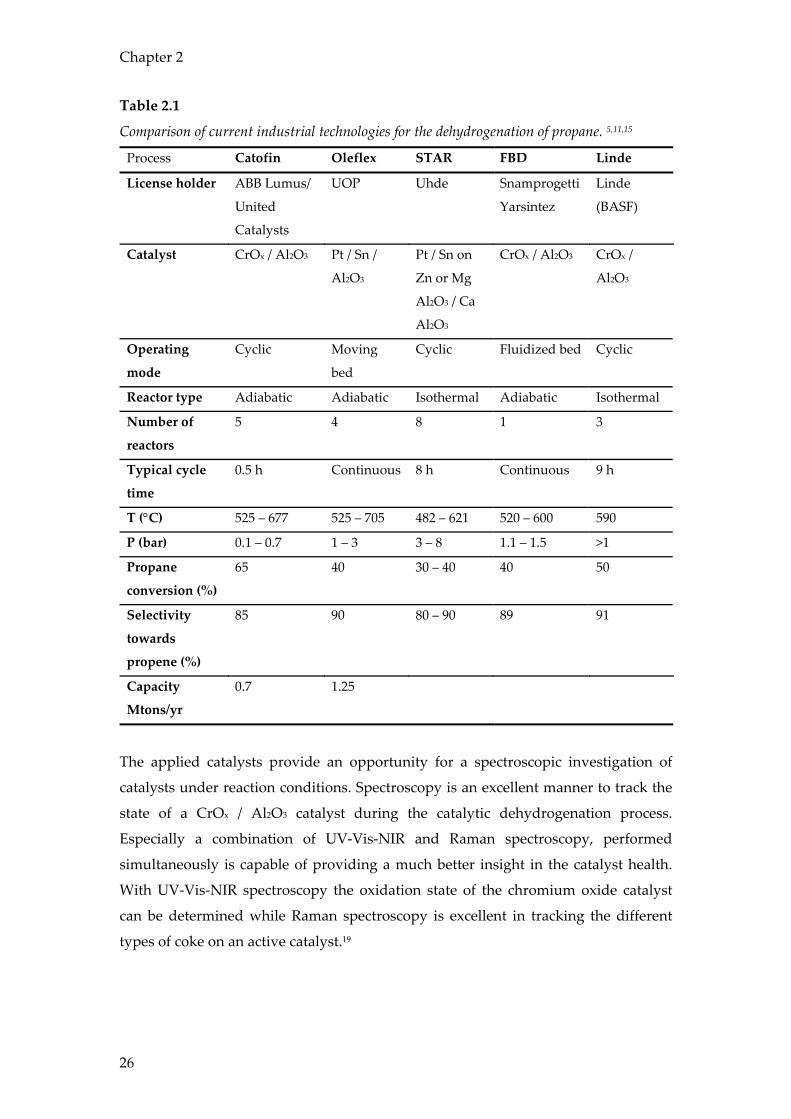
Table 2.1
Comparison of current industrial technologies for the dehydrogenation of propane. 5,11,15
Process Catofin Oleflex STAR FBD Linde
License holder ABB Lumus/
United
Catalysts
UOP Uhde Snamprogetti
Yarsintez
Linde
(BASF)
Catalyst CrOx / Al2O3 Pt / Sn /
Al2O3
Pt / Sn on
Zn or Mg
Al2O3 / Ca
Al2O3
CrOx / Al2O3 CrOx /
Al2O3
Operating
mode
Cyclic Moving
bed
Cyclic Fluidized bed Cyclic
Reactor type Adiabatic Adiabatic Isothermal Adiabatic Isothermal
Number of
reactors
5 4 8 1 3
Typical cycle
time
0.5 h Continuous 8 h Continuous 9 h
T (°C) 525 – 677 525 – 705 482 – 621 520 – 600 590
P (bar) 0.1 – 0.7 1 – 3 3 – 8 1.1 – 1.5 >1
Propane
conversion (%)
65 40 30 – 40 40 50
Selectivity
towards
propene (%)
85 90 80 – 90 89 91
Capacity
Mtons/yr
0.7 1.25
The applied catalysts provide an opportunity for a spectroscopic investigation of
catalysts under reaction conditions. Spectroscopy is an excellent manner to track the
state of a CrOx / Al2O3 catalyst during the catalytic dehydrogenation process.
Especially a combination of UV-Vis-NIR and Raman spectroscopy, performed
simultaneously is capable of providing a much better insight in the catalyst health.
With UV-Vis-NIR spectroscopy the oxidation state of the chromium oxide catalyst
can be determined while Raman spectroscopy is excellent in tracking the different
types of coke on an active catalyst.19
The development of an operando Raman / UV-Vis-NIR set-up
27
Therefore, the aim of this work was to develop an operando Raman / UV-Vis-NIR set-
up in which the Catofin process could be investigated under typical operating
conditions, i.e. at elevated temperatures.
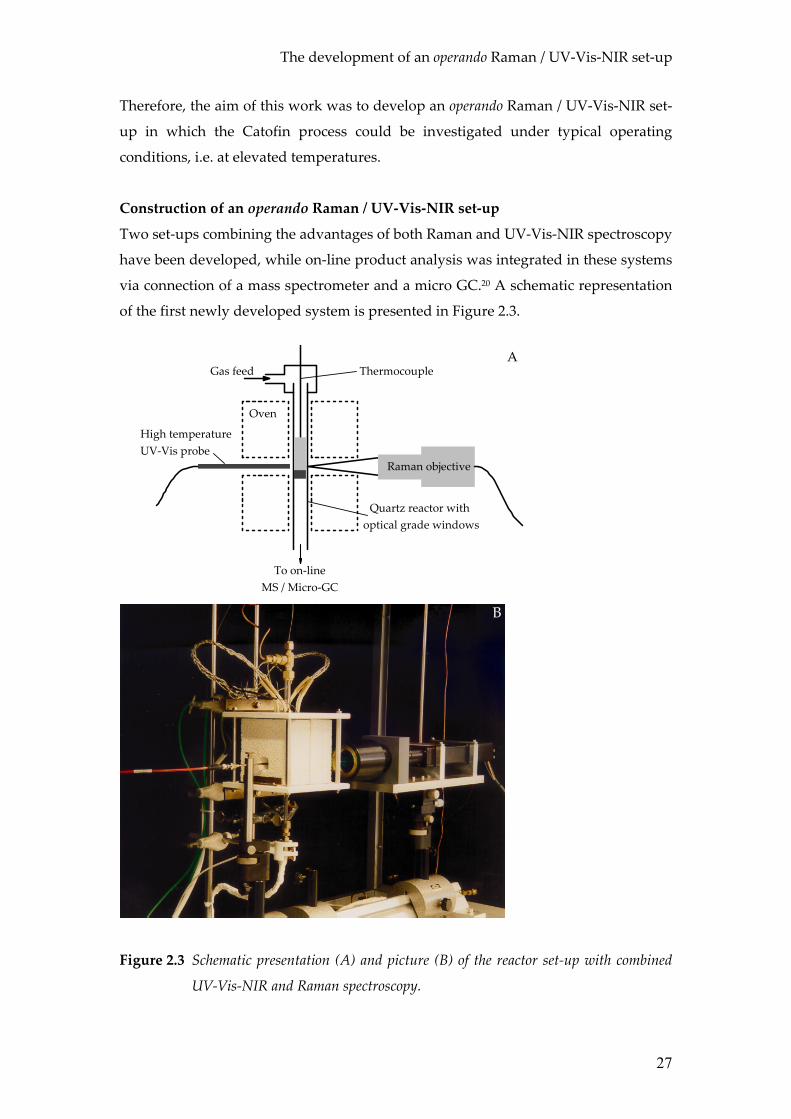
Construction of an operando Raman / UV-Vis-NIR set-up
Two set-ups combining the advantages of both Raman and UV-Vis-NIR spectroscopy
have been developed, while on-line product analysis was integrated in these systems
via connection of a mass spectrometer and a micro GC.20 A schematic representation
of the first newly developed system is presented in Figure 2.3.
AGas feed Thermocouple
Quartz reactor with optical grade windows
To on-lineMS / Micro-GC
Raman objective
High temperature UV-Vis probe
Oven
Figure 2.3 Schematic presentation (A) and picture (B) of the reactor set-up with combined
UV-Vis-NIR and Raman spectroscopy.
B
Chapter 2
28
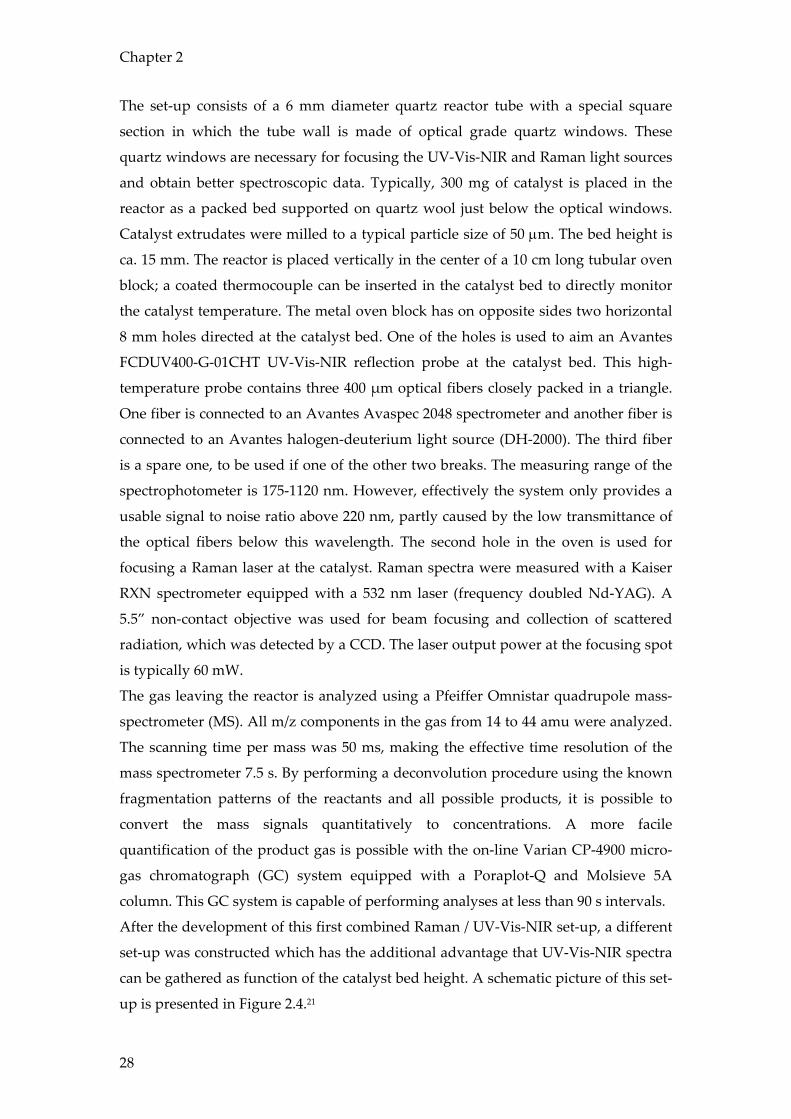
The set-up consists of a 6 mm diameter quartz reactor tube with a special square
section in which the tube wall is made of optical grade quartz windows. These
quartz windows are necessary for focusing the UV-Vis-NIR and Raman light sources
and obtain better spectroscopic data. Typically, 300 mg of catalyst is placed in the
reactor as a packed bed supported on quartz wool just below the optical windows.
Catalyst extrudates were milled to a typical particle size of 50 µm. The bed height is
ca. 15 mm. The reactor is placed vertically in the center of a 10 cm long tubular oven
block; a coated thermocouple can be inserted in the catalyst bed to directly monitor
the catalyst temperature. The metal oven block has on opposite sides two horizontal
8 mm holes directed at the catalyst bed. One of the holes is used to aim an Avantes
FCDUV400-G-01CHT UV-Vis-NIR reflection probe at the catalyst bed. This high-
temperature probe contains three 400 µm optical fibers closely packed in a triangle.
One fiber is connected to an Avantes Avaspec 2048 spectrometer and another fiber is
connected to an Avantes halogen-deuterium light source (DH-2000). The third fiber
is a spare one, to be used if one of the other two breaks. The measuring range of the
spectrophotometer is 175-1120 nm. However, effectively the system only provides a
usable signal to noise ratio above 220 nm, partly caused by the low transmittance of
the optical fibers below this wavelength. The second hole in the oven is used for
focusing a Raman laser at the catalyst. Raman spectra were measured with a Kaiser
RXN spectrometer equipped with a 532 nm laser (frequency doubled Nd-YAG). A
5.5” non-contact objective was used for beam focusing and collection of scattered
radiation, which was detected by a CCD. The laser output power at the focusing spot
is typically 60 mW.
The gas leaving the reactor is analyzed using a Pfeiffer Omnistar quadrupole mass-
spectrometer (MS). All m/z components in the gas from 14 to 44 amu were analyzed.
The scanning time per mass was 50 ms, making the effective time resolution of the
mass spectrometer 7.5 s. By performing a deconvolution procedure using the known
fragmentation patterns of the reactants and all possible products, it is possible to
convert the mass signals quantitatively to concentrations. A more facile
quantification of the product gas is possible with the on-line Varian CP-4900 micro-
gas chromatograph (GC) system equipped with a Poraplot-Q and Molsieve 5A
column. This GC system is capable of performing analyses at less than 90 s intervals.
After the development of this first combined Raman / UV-Vis-NIR set-up, a different
set-up was constructed which has the additional advantage that UV-Vis-NIR spectra
can be gathered as function of the catalyst bed height. A schematic picture of this set-
up is presented in Figure 2.4.21
The development of an operando Raman / UV-Vis-NIR set-up
29
Gas feed Thermocouple
Quartz reactor with optical grade windows
To on-lineMS / Micro-GC
Raman objective
High temperature UV-Vis probes
Oven
A
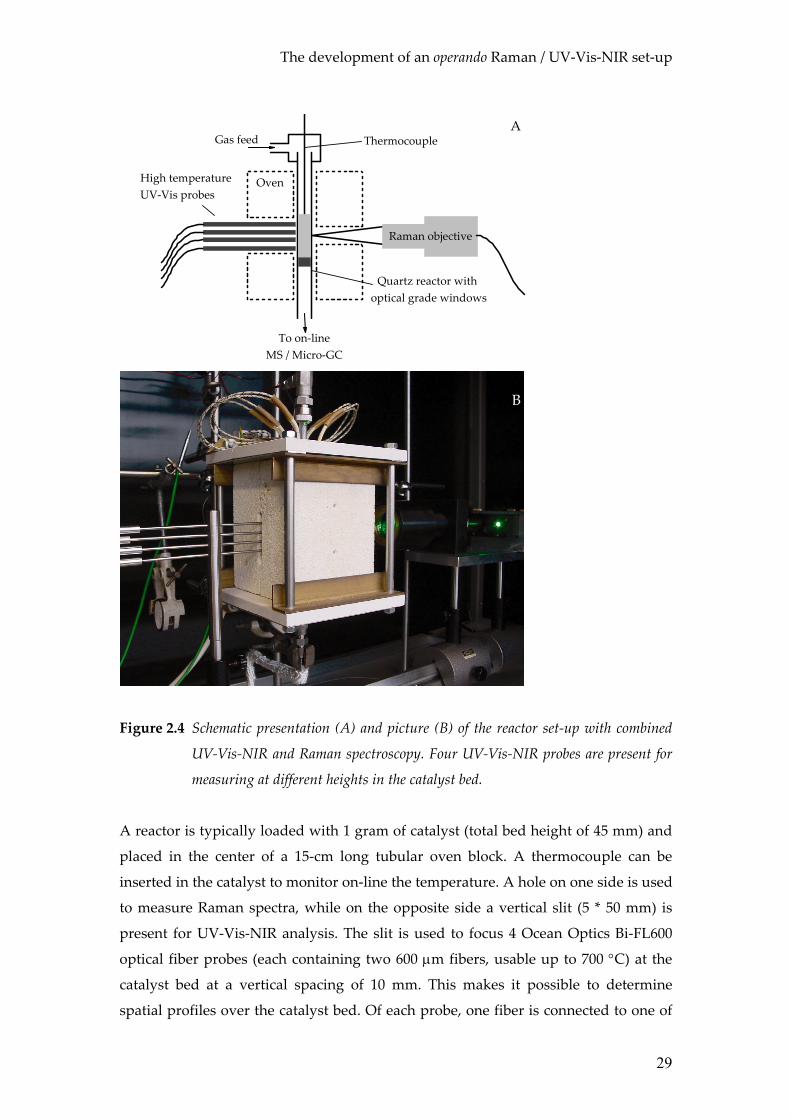
Figure 2.4 Schematic presentation (A) and picture (B) of the reactor set-up with combined
UV-Vis-NIR and Raman spectroscopy. Four UV-Vis-NIR probes are present for
measuring at different heights in the catalyst bed.
A reactor is typically loaded with 1 gram of catalyst (total bed height of 45 mm) and
placed in the center of a 15-cm long tubular oven block. A thermocouple can be
inserted in the catalyst to monitor on-line the temperature. A hole on one side is used
to measure Raman spectra, while on the opposite side a vertical slit (5 * 50 mm) is
present for UV-Vis-NIR analysis. The slit is used to focus 4 Ocean Optics Bi-FL600
optical fiber probes (each containing two 600 µm fibers, usable up to 700 °C) at the
catalyst bed at a vertical spacing of 10 mm. This makes it possible to determine
spatial profiles over the catalyst bed. Of each probe, one fiber is connected to one of
B
Chapter 2
30
the four channels of an Avaspec-2048-4 spectrometer (Avantes) and another fiber is
connected to a DH-2000 BAL halogen-deuterium light source (Ocean optics). The
Raman system is the same system as described earlier for the first set-up. In this set-
up on-line gas analysis is performed via a Compact GC (Interscience) equipped with
a Porabond-Q and a Molsieve-5A column. The GC is capable of performing analyses
within 60 s.
Application of the set-up
After construction of the set-ups, their strength in combining multiple spectroscopic
techniques, under reaction conditions, were tested for the dehydrogenation of
propane over an industrial-like 13 wt% Cr / Al2O3 catalyst for a series of
dehydrogenation-regeneration cycles. The reactor was heated at 10 °C min-1 from
room temperature to a catalyst temperature of 550 °C in a gas stream of 3 ml min-1 of
O2 (Hoek Loos, 99.995%) in 12 ml min-1 of He (Hoek Loos, 99,996%). After heating,
the reactor was operated isothermally at a pressure of 1.5 bar in cycles of alternating
dehydrogenation for ca. 50 min with 2 ml propane (Hoek Loos, 99.92%) in 20 ml min-
1 of He and regenerating for ca. 50 min with 3 ml min-1 of O2 in 12 ml min-1 of He.
During the first 120 s of each cycle UV-Vis-NIR measurements were performed with
a 1 s interval to track the rapid changes on the catalyst, after this time measurements
were carried out at a 1 min interval. The UV-Vis-NIR spectrometer was used with an
integration time of 28 ms and typically 40 spectra were averaged to improve the
signal to noise ratio and a Halon white disk was used as a white reference. The
resulting time resolution was, therefore, ≈ 1 s. Raman spectra were recorded with an
exposure time of 3 s, while 10 spectra were accumulated. This resulted in a spectral
recording time of 180 s. Measurements were performed at 5 min intervals. During
the entire experiment the product gas composition was monitored using the MS. The
temperature of the catalyst was monitored using a small thermocouple in the middle
of the bed.
In the second set-up the catalyst was heated to 550 °C (10°C min-1) in a gas stream of
10 ml min-1 of O2 and 40 ml min-1 of He. After heating, dehydrogenation cycles of 50
minutes (10 ml min-1 of C3H8 and 40 ml min-1 of He) were alternated with
regeneration cycles (10 ml min-1 of O2 and 40 ml min-1 of He). During the first 120 s of
each cycle UV-Vis-NIR spectra were measured with a 1 s interval. After this time,
measurements were performed with a 60 s interval. Raman spectra were taken every
The development of an operando Raman / UV-Vis-NIR set-up
31
300 s. During the entire experiment the product gas composition was monitored via
GC.
Results and Discussion
Monitoring a catalyst during the dehydrogenation of propane
The catalytic results of the experiment are shown in Figure 2.5 for a 13 wt% Cr /
Al2O3 catalyst. The simultaneously measured spectroscopic data are presented in
Figure 2.6.
0 50 100 150 200 250 300 3500
20
40
60
80
100
CO2
O2
C3H
6
C3H
8
Cycle 3Cycle 2Cycle 1
Gas
Com
posi
tion
(%, e
xcep
t He)
Time (min)
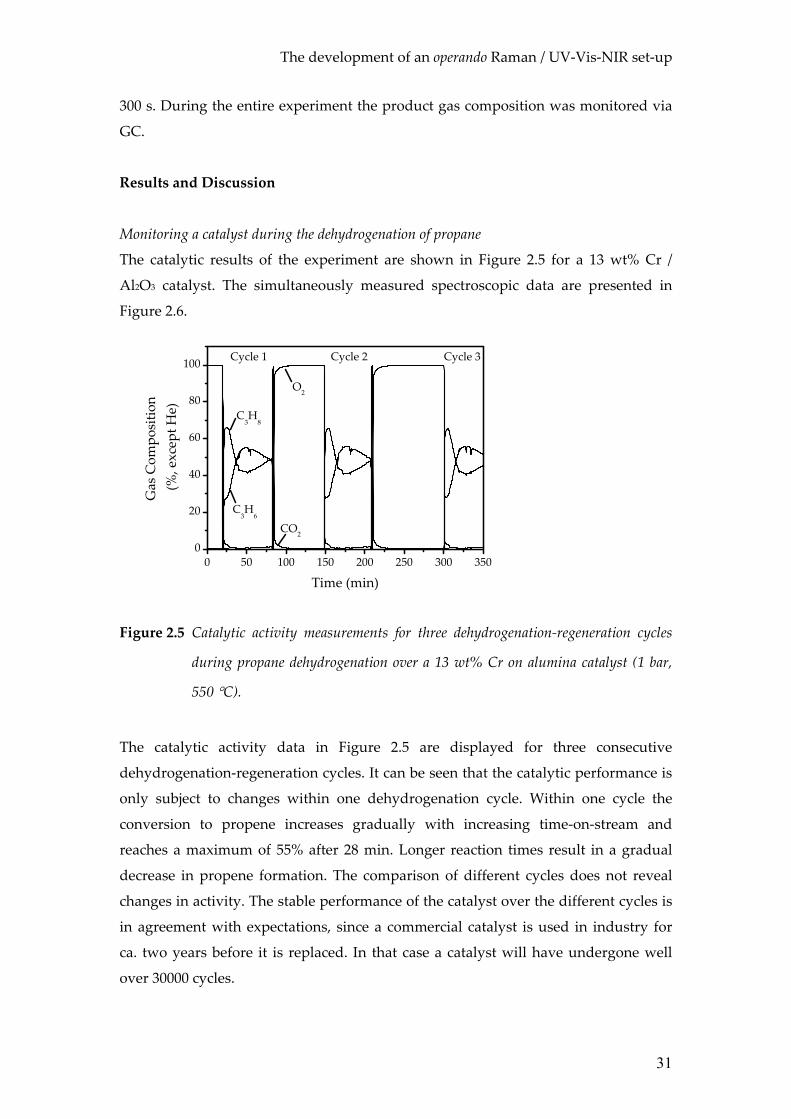
Figure 2.5 Catalytic activity measurements for three dehydrogenation-regeneration cycles
during propane dehydrogenation over a 13 wt% Cr on alumina catalyst (1 bar,
550 °C).
The catalytic activity data in Figure 2.5 are displayed for three consecutive
dehydrogenation-regeneration cycles. It can be seen that the catalytic performance is
only subject to changes within one dehydrogenation cycle. Within one cycle the
conversion to propene increases gradually with increasing time-on-stream and
reaches a maximum of 55% after 28 min. Longer reaction times result in a gradual
decrease in propene formation. The comparison of different cycles does not reveal
changes in activity. The stable performance of the catalyst over the different cycles is
in agreement with expectations, since a commercial catalyst is used in industry for
ca. two years before it is replaced. In that case a catalyst will have undergone well
over 30000 cycles.
Chapter 2
32
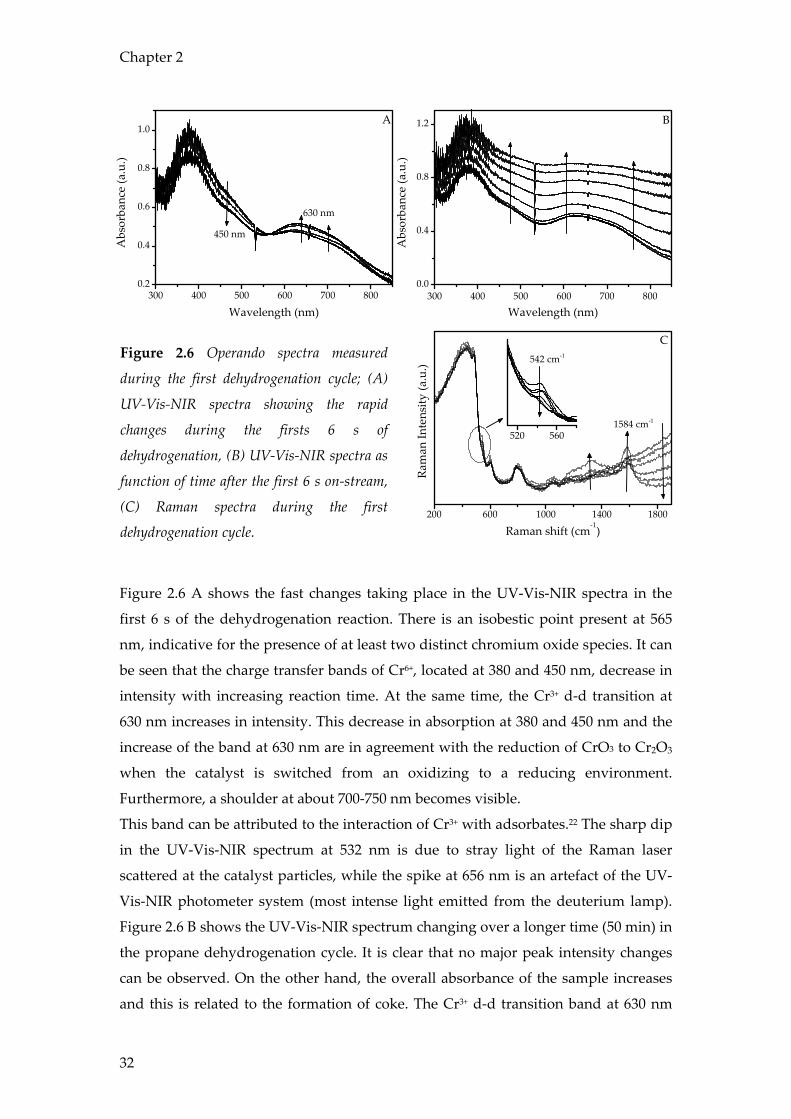
Figure 2.6 Operando spectra measured
during the first dehydrogenation cycle; (A)
UV-Vis-NIR spectra showing the rapid
changes during the firsts 6 s of
dehydrogenation, (B) UV-Vis-NIR spectra as
function of time after the first 6 s on-stream,
(C) Raman spectra during the first
dehydrogenation cycle.
Figure 2.6 A shows the fast changes taking place in the UV-Vis-NIR spectra in the
first 6 s of the dehydrogenation reaction. There is an isobestic point present at 565
nm, indicative for the presence of at least two distinct chromium oxide species. It can
be seen that the charge transfer bands of Cr6+, located at 380 and 450 nm, decrease in
intensity with increasing reaction time. At the same time, the Cr3+ d-d transition at
630 nm increases in intensity. This decrease in absorption at 380 and 450 nm and the
increase of the band at 630 nm are in agreement with the reduction of CrO3 to Cr2O3
when the catalyst is switched from an oxidizing to a reducing environment.
Furthermore, a shoulder at about 700-750 nm becomes visible.
This band can be attributed to the interaction of Cr3+ with adsorbates.22 The sharp dip
in the UV-Vis-NIR spectrum at 532 nm is due to stray light of the Raman laser
scattered at the catalyst particles, while the spike at 656 nm is an artefact of the UV-
Vis-NIR photometer system (most intense light emitted from the deuterium lamp).
Figure 2.6 B shows the UV-Vis-NIR spectrum changing over a longer time (50 min) in
the propane dehydrogenation cycle. It is clear that no major peak intensity changes
can be observed. On the other hand, the overall absorbance of the sample increases
and this is related to the formation of coke. The Cr3+ d-d transition band at 630 nm
300 400 500 600 700 8000.0
0.4
0.8
1.2 B
Abs
orba
nce
(a.u
.)
Wavelength (nm)300 400 500 600 700 800
0.2
0.4
0.6
0.8
1.0
450 nm
630 nm
Abs
orba
nce
(a.u
.)
Wavelength (nm)
A
200 600 1000 1400 1800
520 560
C
1584 cm-1Ra
man
Inte
nsity
(a.u
.)
Raman shift (cm-1)
542 cm-1
The development of an operando Raman / UV-Vis-NIR set-up
33
becomes less pronounced over time. This can also be explained by the coverage of
the chromium oxide by coke. Coke formation is evident from the Raman spectra in
Figure 2.6 C. The bands that appear in the region 1200-1650 cm-1 are attributed to
(poly)aromatic ring stretching C-C vibrations.19,23-31 Fluorescence of the catalyst,
causing the increasing baseline at high wavenumbers, decreases during the
dehydrogenation cycle. It is likely that this phenomenon is also due to the coke
formation on the catalyst. The bands at 200, 605, 810 and 1060 cm-1, which can be
observed in the Raman spectra, are originating from the quartz windows of the
reactor. Another interesting Raman band could be observed at 542 cm-1. This Raman
band is assigned to the presence of Cr2O332,33 and gradually decreases with increasing
reaction time. Since Cr3+ is unlikely to be reduced further at the applied reaction
conditions, this disappearance is most probably associated with the formation of
coke covering the Cr2O3 surface as it limits Raman scattering of the underlying layer.
In combining the spectroscopic information of Figure 2.6 with the catalytic
information of Figure 2.5, coke formation, as observed by both Raman and UV-Vis-
NIR, is the most likely cause of the decrease in catalyst activity over time. In the
oxidation cycles this coke is combusted from the catalyst as can be concluded from
the formation of CO2 in the beginning of the regeneration cycle and from the increase
in the catalyst bed temperature of about 10 - 15 °C (Figure 2.7). During the catalyst
regeneration the UV-Vis-NIR spectra return completely to the initial state of Figure
2.6 A in less than 15 s. Both coke combustion and (partial) chromium oxide
reoxidation take place simultaneously. This rapid change in the observed state of the
catalyst is in agreement with the fact that the mass spectrometer detects a short
carbon dioxide production immediately after the start of the oxidation cycle. Also,
the increased catalyst temperature resulting from the heat released by the coke
combustion is observed only for a short time. The smaller CO2 production peak
observed by the mass spectrometer at the beginning of the propane dehydrogenation
cycle is caused by the reduction of the Cr6+ to Cr3+ by propane. In industry, this loss of
propane is often circumvented by a short catalyst reduction using hydrogen
immediately before switching to propane.
Both the UV-Vis-NIR and Raman spectra after dehydrogenation and regeneration
show a reversible behavior of the catalyst. This is in good agreement with the activity
data, which shows an identical performance of the catalyst in subsequent cycles.
Chapter 2
34
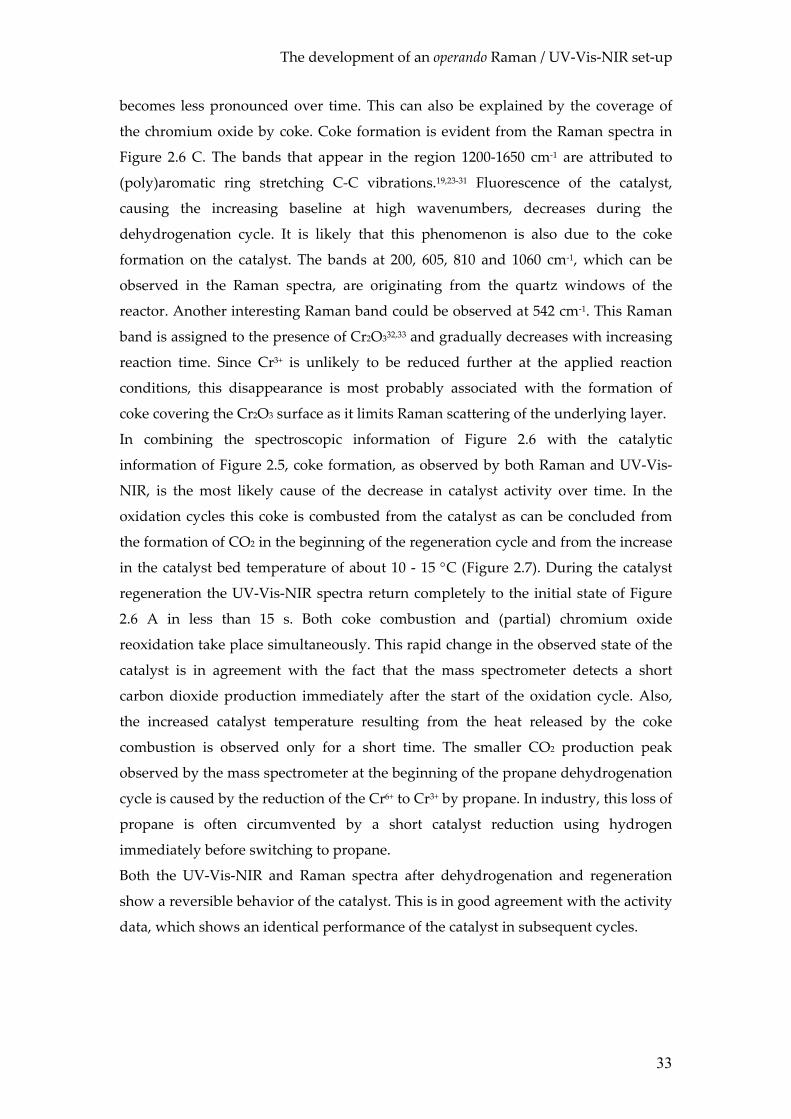
The strength of the set-up is the application of two spectroscopic techniques together
with on-line product analysis. Therefore an overview of the most important
information is presented in Figure 2.7 for one dehydrogenation-regeneration cycle.
100 120 140 160 180 200 220
0.4
0.8
1.2
1.6
E
Time (min)
Ram
an 5
42 c
m-1
0.8
1.2
1.6
2.0
D
Ram
an 1
584
cm-1
0.0
0.2
0.4
0.6
0.8
C
UV
-Vis
850
nm
545
550
555
560
B
Tem
pera
ture
(o C)
0.0
0.2
0.4
0.6
0.8
1.0
Gas
com
posi
tion
(*10
0%)
CO2
Propene
A
Figure 2.7 Overview of the most relevant observed changes in measured signals during a
complete dehydrogenation-regeneration cycle of propane over a 13 wt% Cr-on-
alumina catalyst. (A) Observed propene (solid) and CO2 (dots) fraction in the gas
phase; (B) catalyst bed temperature; (C) UV-Vis-NIR absorbance at 850 nm,
corresponding to the overall increase in absorbance due to coke formation on the
catalyst; (D) Raman signal at 1584 cm-1 Raman shift corresponding to the major
coke component formed; (E) Raman signal at 542 cm-1 corresponding to
crystalline Cr2O3.
The development of an operando Raman / UV-Vis-NIR set-up
35
From Figure 2.7 the consistence of the applied spectroscopic techniques can be
concluded. The UV-Vis-NIR signal at 850 nm (indicative of the increasing overall
absorbance of the sample due to coke formation) increases similarly fast as the
Raman signal at 1584 cm-1 and at a similar rate as the Raman band at 542 cm-1
disappears due to coke coverage of Cr2O3. Furthermore, it can be seen that the
decreasing catalyst activity observed using on-line mass spectrometry activity data
agrees well with the spectroscopically observed coke build-up on the catalyst. For the
combustion of coke in the catalyst regeneration steps, the information obtained using
MS, UV-Vis-NIR, Raman and reactor temperature is also in excellent agreement.
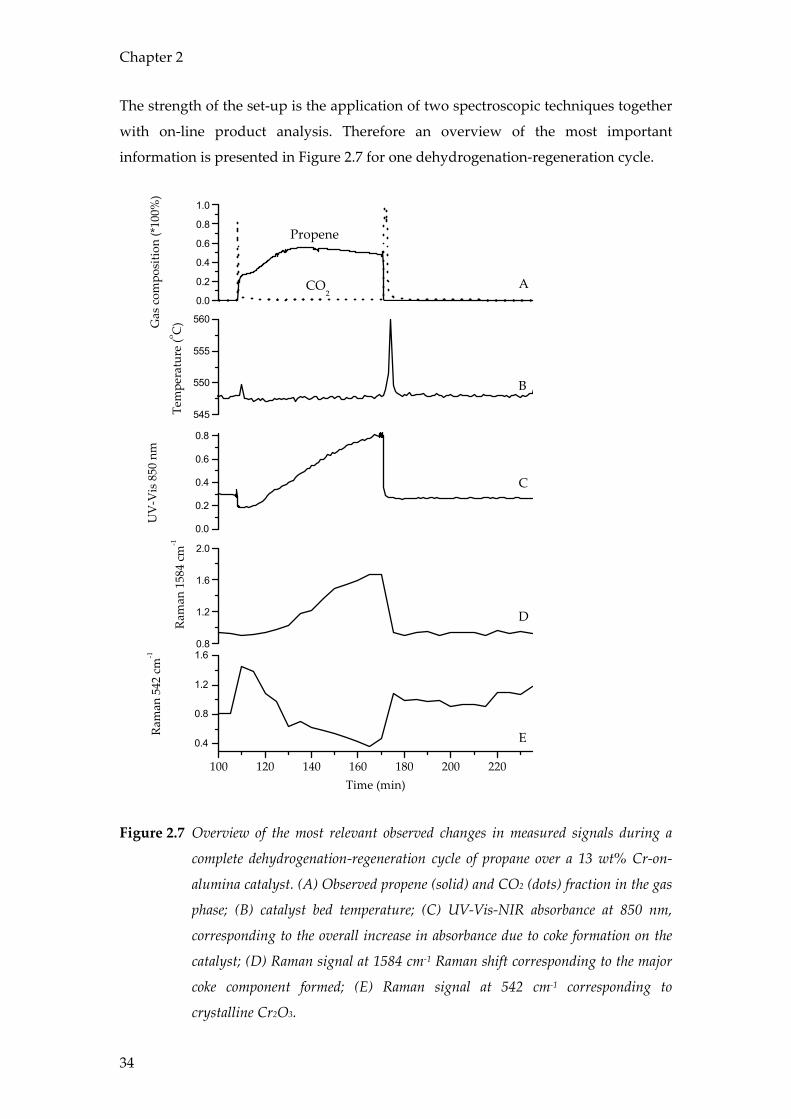
Differences in coke formation over the catalyst bed measured during the dehydrogenation of
propane.
The second operando Raman / UV-Vis-NIR set-up is capable of measuring UV-Vis-
NIR spectra, not only as a function of time, but also as a function of the catalyst bed
height. Therefore a dehydrogenation experiment was performed with a 13 wt% Cr /
Al2O3 catalyst and during this experiment the catalyst was monitored via 4 UV-Vis-
NIR probes according to Figure 2.4. Simultaneously the activity was measured via
GC measurements and Raman spectra were collected. The activity data measured via
GC is presented in Figure 2.8.
0 50 100 150 200 2500
20
40
60
80
100
Conversion (%)
Time (min)
Selectivity
Figure 2.8 Activity data of a 13 wt% Cr / Al2O3 catalyst measured during propane
dehydrogenation.
The activity data in Figure 2.8 are in good agreement with the catalytic results of
Figure 2.5. The activity goes through a maximum before decreasing again.
Chapter 2
36
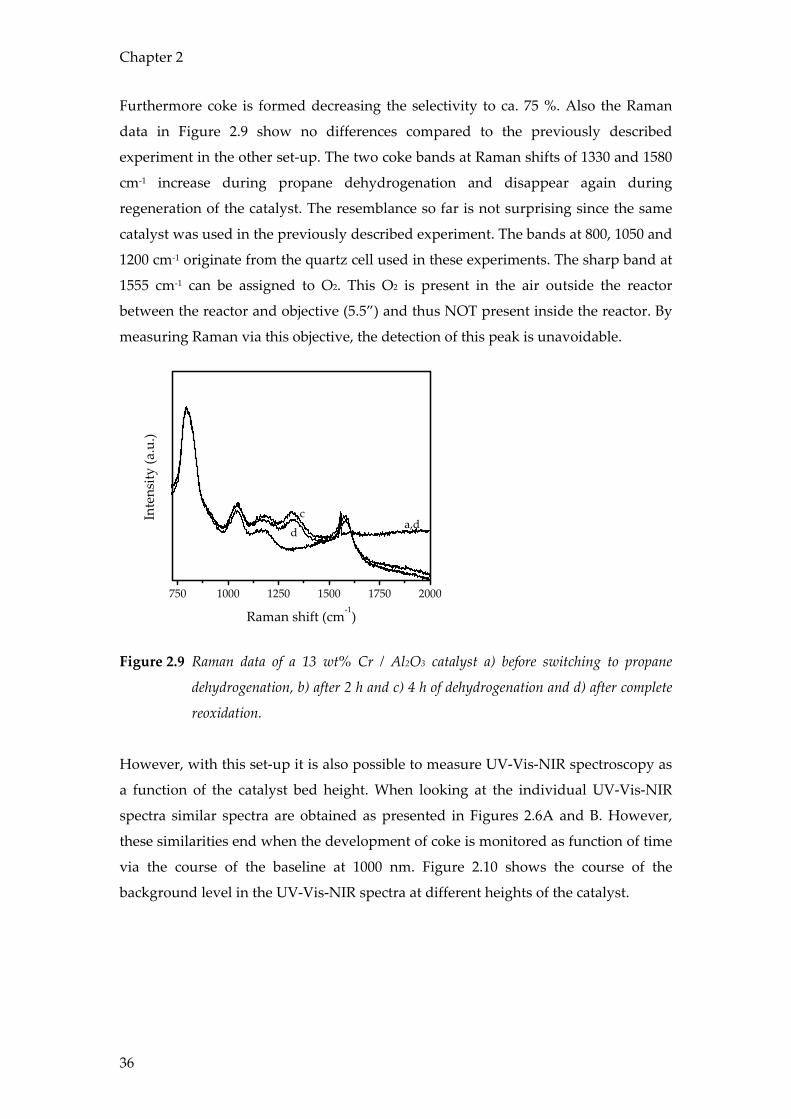
Furthermore coke is formed decreasing the selectivity to ca. 75 %. Also the Raman
data in Figure 2.9 show no differences compared to the previously described
experiment in the other set-up. The two coke bands at Raman shifts of 1330 and 1580
cm-1 increase during propane dehydrogenation and disappear again during
regeneration of the catalyst. The resemblance so far is not surprising since the same
catalyst was used in the previously described experiment. The bands at 800, 1050 and
1200 cm-1 originate from the quartz cell used in these experiments. The sharp band at
1555 cm-1 can be assigned to O2. This O2 is present in the air outside the reactor
between the reactor and objective (5.5”) and thus NOT present inside the reactor. By
measuring Raman via this objective, the detection of this peak is unavoidable.
750 1000 1250 1500 1750 2000
Inte
nsity
(a.u
.)
Raman shift (cm-1)
a,dc
d
Figure 2.9 Raman data of a 13 wt% Cr / Al2O3 catalyst a) before switching to propane
dehydrogenation, b) after 2 h and c) 4 h of dehydrogenation and d) after complete
reoxidation.
However, with this set-up it is also possible to measure UV-Vis-NIR spectroscopy as
a function of the catalyst bed height. When looking at the individual UV-Vis-NIR
spectra similar spectra are obtained as presented in Figures 2.6A and B. However,
these similarities end when the development of coke is monitored as function of time
via the course of the baseline at 1000 nm. Figure 2.10 shows the course of the
background level in the UV-Vis-NIR spectra at different heights of the catalyst.
The development of an operando Raman / UV-Vis-NIR set-up
37
0 50 100 150 200 250
4
3
2
1
Abs
orpt
ion
(a.u
.)
Time (min)
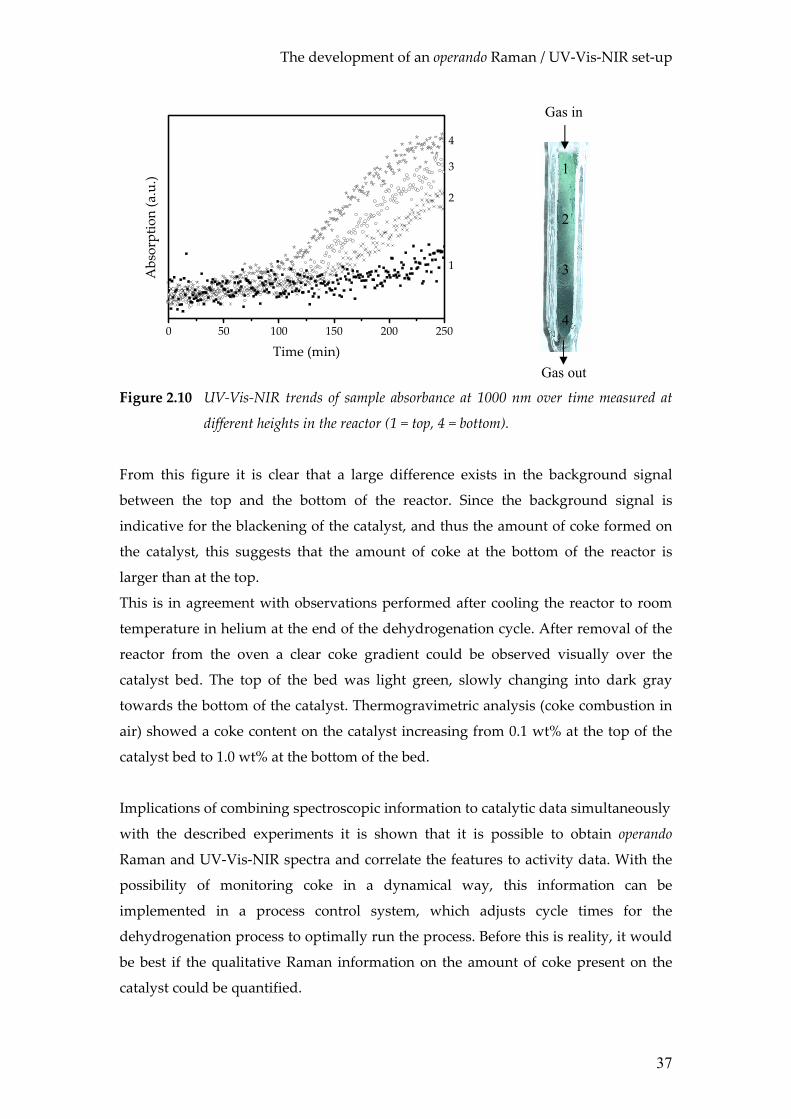
Figure 2.10 UV-Vis-NIR trends of sample absorbance at 1000 nm over time measured at
different heights in the reactor (1 = top, 4 = bottom).
From this figure it is clear that a large difference exists in the background signal
between the top and the bottom of the reactor. Since the background signal is
indicative for the blackening of the catalyst, and thus the amount of coke formed on
the catalyst, this suggests that the amount of coke at the bottom of the reactor is
larger than at the top.
This is in agreement with observations performed after cooling the reactor to room
temperature in helium at the end of the dehydrogenation cycle. After removal of the
reactor from the oven a clear coke gradient could be observed visually over the
catalyst bed. The top of the bed was light green, slowly changing into dark gray
towards the bottom of the catalyst. Thermogravimetric analysis (coke combustion in
air) showed a coke content on the catalyst increasing from 0.1 wt% at the top of the
catalyst bed to 1.0 wt% at the bottom of the bed.
Implications of combining spectroscopic information to catalytic data simultaneously
with the described experiments it is shown that it is possible to obtain operando
Raman and UV-Vis-NIR spectra and correlate the features to activity data. With the
possibility of monitoring coke in a dynamical way, this information can be
implemented in a process control system, which adjusts cycle times for the
dehydrogenation process to optimally run the process. Before this is reality, it would
be best if the qualitative Raman information on the amount of coke present on the
catalyst could be quantified.
Gas in
Gas out
1
2
3
4
Chapter 2
38
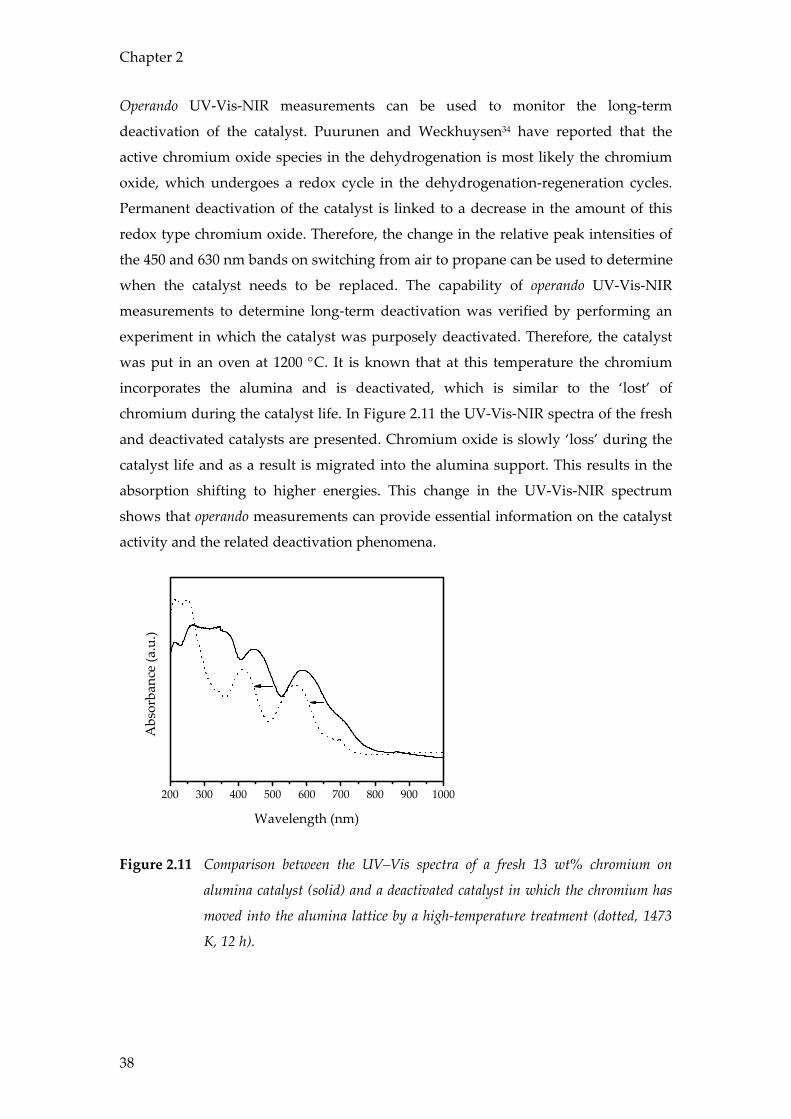
Operando UV-Vis-NIR measurements can be used to monitor the long-term
deactivation of the catalyst. Puurunen and Weckhuysen34 have reported that the
active chromium oxide species in the dehydrogenation is most likely the chromium
oxide, which undergoes a redox cycle in the dehydrogenation-regeneration cycles.
Permanent deactivation of the catalyst is linked to a decrease in the amount of this
redox type chromium oxide. Therefore, the change in the relative peak intensities of
the 450 and 630 nm bands on switching from air to propane can be used to determine
when the catalyst needs to be replaced. The capability of operando UV-Vis-NIR
measurements to determine long-term deactivation was verified by performing an
experiment in which the catalyst was purposely deactivated. Therefore, the catalyst
was put in an oven at 1200 °C. It is known that at this temperature the chromium
incorporates the alumina and is deactivated, which is similar to the ‘lost’ of
chromium during the catalyst life. In Figure 2.11 the UV-Vis-NIR spectra of the fresh
and deactivated catalysts are presented. Chromium oxide is slowly ‘loss’ during the
catalyst life and as a result is migrated into the alumina support. This results in the
absorption shifting to higher energies. This change in the UV-Vis-NIR spectrum
shows that operando measurements can provide essential information on the catalyst
activity and the related deactivation phenomena.
200 300 400 500 600 700 800 900 1000
Abs
orba
nce
(a.u
.)
Wavelength (nm)
Figure 2.11 Comparison between the UV–Vis spectra of a fresh 13 wt% chromium on
alumina catalyst (solid) and a deactivated catalyst in which the chromium has
moved into the alumina lattice by a high-temperature treatment (dotted, 1473
K, 12 h).
The development of an operando Raman / UV-Vis-NIR set-up
39
Conclusions
The results in this chapter show the value of combining operando spectroscopic
techniques with on-line product analysis using mass spectrometry and / or micro-
GC. It has been shown that operando spectroscopy is an effective method to study the
dynamics of a chromium oxide catalyst during the dehydrogenation of propane. UV-
Vis-NIR spectroscopy is able to monitor the oxidation state of the catalyst and the
changing background signal is indicative for the coke content on the catalyst. Raman
spectroscopy provides information on the coke content on the catalyst, which is in
agreement with UV-Vis-NIR spectroscopy. Increasing the number of UV-Vis-NIR
probes makes it possible to monitor the catalyst as a function of the catalyst bed
height. It is suggested that the system could be up-scaled to an industrial
environment if the amount of coke can be determined, i.e. if on-line quantitative
information could be gathered.
References 1. Eramo, M., Asia Petrochemical Industry Conference Raw Materials Committee Meeting,
Kuala Lumpur, Malaysia, 2004.
2. Short, P. L., Chem. Eng. News, 2005, 83, 30.
3. Milmo, S., Chem. World, 2005, 2, 36.
4. Tullo, A. H., Chem. Eng. News, 2003, 81, 15.
5. Aitani, A. M., Oil Gas Eur. Mag., 2004, 30, 36.
6. Parkinson, G., CEPmagazine, 2004.
7. Walther, M., Oil & Gas J., 2003, 101, 52.
8. Houdek, J. M.; Andersen, J., ARTC 8th Annual Meeting, Kuala Lumpur, 2005.
9. Tan, L., Asia Petrochemical Industry Conference Raw Materials Committee Meeting,
Kuala Lumpur, Malaysia, 2004.
10. Calamur, N.; Carrera, M. Propylene. In Kirk-Othmer Encyclopedia of Chemical
Technology; online edition ed.; John Wiley & Sons, Inc, 1996.
11. Bhasin, M. M.; Mccain, J. H.; Vora, B. V.; Imai, T.; Pujado, P. R., Appl. Catal. A-Gen., 2001,
221, 397.
12. Eisele, P.; Killpack, R. Propene. In Ullmannʹs Encyclopedia of Industrial Chemistry;
online edition ed.; Wiley-VCH Verlag GmbH & Co., 2000.
13. Catofin Dehydrogenation, 2005 at www.ABB.com
14. Oleflex tm Process for Propylene Production, 2004 at www.UOP.com
15. Buyanov, R. A.; Pakhomov, N. A., Kinet. Catal., 2001, 42, 64.
16. The Uhde Star Process ʹOxydehydrogenation of light paraffins to olefinsʹ, 2003 at
www.uhde.de.
Chapter 2
40
17. Uhdeʹs STAR process - Oxydehydrogenation of propane or butanes to olefins, 2004 at
www.uhde.de.
18. Buonomo, F.; Sanfilippo, D.; Trifiro, F. Dehydrogenation Reactions. In Handbook of
Heterogeneous Catalysis; Ertl, G., Knozinger, H., Weitkamp, J., Eds.; VCH: Weinheim,
1997; Vol. 5.
19. Chua, Y. T.; Stair, P. C., J. Catal., 2003, 213, 39.
20. Nijhuis, T. A.; Tinnemans, S. J.; Visser, T.; Weckhuysen, B. M., Phys. Chem. Chem. Phys.,
2003, 5, 4361.
21. Nijhuis, T. A.; Tinnemans, S. J.; Visser, T.; Weckhuysen, B. M., Chem. Eng. Sci., 2004, 59,
5487.
22. Scarano, D.; Spoto, G.; Bordiga, S.; Carnelli, L.; Ricchiardi, G.; Zecchina, A., Langmuir,
1994, 10, 3094.
23. Vidano, R. P.; Fischbach, D. B.; Willis, L. J.; Loehr, T. M., Solid State Commun., 1981, 39,
341.
24. Lespade, P.; Marchand, A.; Couzi, M.; Cruege, F., Carbon, 1984, 22, 375.
25. Ager, J. W.; Veirs, D. K.; Shamir, J.; Rosenblatt, G. M., J. Appl. Phys., 1990, 68, 3598.
26. Kong, F.; Kostecki, R.; Nadeau, G.; Song, X.; Zaghib, K.; Kinoshita, K.; McLarnon, F., J.
Power Sources, 2001, 97-8, 58.
27. Sze, S. K.; Siddique, N.; Sloan, J. J.; Escribano, R., Atmos. Environ., 2001, 35, 561.
28. Compagnini, G.; Puglisi, O.; Foti, G., Carbon, 1997, 35, 1793.
29. Escribano, R.; Sloan, J. J.; Siddique, N.; Sze, N.; Dudev, T., Vibr. Spectrosc., 2001, 26, 179.
30. Mertes, S.; Dippel, B.; Schwarzenbock, A., J. Aerosol Sci., 2004, 35, 347.
31. Wang, Y.; Alsmeyer, D. C.; McCreery, R. L., Chem. Mat., 1990, 2, 557.
32. Vuurman, M. A.; Hardcastle, F. D.; Wachs, I. E., J. Mol. Catal., 1993, 84, 193.
33. Weckhuysen, B. M.; Wachs, I. E.; Schoonheydt, R. A., Chem. Rev., 1996, 96, 3327.
34. Puurunen, R. L.; Weckhuysen, B. M., J. Catal., 2002, 210, 418.
41
Quantitative operando Raman spectroscopy without the need of an internal
standard
Abstract
The diffuse reflectance properties of a catalyst may change during catalyst operation.
A common cause is a changing oxidation state of or coke formation on the catalyst.
As a result the observed Raman intensity is affected and the signal cannot be used in
a quantitative manner. A method was developed in which the change of color
measured via UV-Vis-NIR is related to the ‘observed’ Raman intensity. This results
in a ‘true’ Raman intensity, which comprises quantitative information. To verify this
method, it was compared to the quantification using an internal standard. Both
methods were applied to the formation of coke on a Cr / Al2O3 catalyst during
propane dehydrogenation. It was found that the results were in good agreement.
Therefore, this newly developed method proved to be an elegant manner for the
qualitative as well as quantitative monitoring of the amount of coke in a reactor.
Chapter 3
42
Introduction
Raman spectroscopy is a useful characterization tool. However, most studies based
on Raman spectroscopy are applied in a qualitative manner. The number of
quantitative studies is limited. A reason for this is that besides a change in
concentration of the scattering species also other parameters like variations in laser
excitation intensity, instrumental settings, sample positioning, temperature
fluctuations, etc. might influence the Raman intensities. Furthermore, Raman
intensities also depend on the scattering and absorption properties of the sample. As
a consequence, progressive darkening of a catalyst during reaction by e.g. coke
formation may strongly affect the intensities of the Raman spectra.
One way to quantify Raman spectra is by normalizing the Raman bands of a species
of interest to those of a specific scattering standard, which is assumed to remain
unaffected during reaction. In principle, for supported metal oxide catalysts, the
Raman bands of the bulk support material can be used. Several supports, like for
instance zirconia, contain intense Raman bands. However, the relative ratio between
the support band and metal oxide band can change due to temperature differences
making them not suitable for use as an internal standard.1 Also reduction of the
support would change the ratio of the bands, making the support not applicable as
internal standard. A third example is the coverage of the sample with for instance
coke. This affects the ‘visible amount’ of bulk material. Closely related to this is a
possible change in self absorption of the sample during dehydrogenation. Black
materials are known to suffer from self absorption. In this process the scattered
radiation is absorbed by neighboring black (dark) particles and cannot be detected
anymore. As a result the observed Raman intensity is not related to a concentration,
and thus cannot be used in a quantitative manner.
To correct for these possible changes, an unreactive standard of known concentration
can be mixed homogeneously with the catalyst. Such internal standards should not
interact with the catalyst material, or perturb the spectrum of the supported metal
oxide catalyst. Internal standards should also be strong Raman scatterers, so that a
small quantity produces a signal of adequate intensity. Several successful
applications of an internal standard are known in the literature.2-9 An example of
such a compound is boron nitride (BN), which is known to exhibit only one intense
Raman band at 1367 cm-1, while the vibrational bands of most supported metal
oxides appear below 1200 cm-1.
An alternative approach could be to measure the color of the sample directly with
UV-Vis-NIR spectroscopy. It is known that the scattering and absorption properties
Development of quantitative Raman spectroscopy
43
of a catalytic solid can be described by the diffuse reflectance R∞ of the solid.10-13
Progressive darkening of the catalytic solid due to e.g. coke formation during a
dehydrogenation reaction may lead to a decreasing R∞ and, as a result, the
proportionality between the Raman band intensities and the concentration of the
corresponding species is no longer valid. In order to compare Raman intensities at
different times-on-stream inside a catalytic reactor, the relationship between the
diffuse reflectance of the catalytic solid of infinite thickness (R∞) and the Raman
intensity (Ψ∞) must be known. Already in 1967 Schrader and Bergmann14 derived an
approximate expression to correlate the Raman intensity (Ψ∞) to the diffuse
reflectance (R∞) based on the Kubelka-Munk formalism. This was later improved by
Waters15 and Kuba and Knözinger16 into the following expression:
0 ( )IΨ G Rsρ
∞= ⋅∞ (eq. 3.1)
(1 )( )
(1 )R RG R
R∞ ∞
∞∞
+=
− (eq. 3.2)
In Equation 3.1, Ψ∞ represents the observed Raman intensity for a powdered sample
of infinite thickness, I0 the exciting Raman laser intensity, ρ the coefficient of Raman
generation (Raman cross-section) and s the scattering coefficient. The equation is
valid based on the assumption that the scattering of the solid s does not change. This
implies e.g. that the catalyst particles may not aggregate during reaction leaving the
scattering coefficient s unaltered. G(R∞) can then be directly determined via Equation
3.2 by measuring R∞ with UV-Vis-NIR diffuse reflectance spectroscopy.
Figure 3.1 illustrates the dependence of G(R∞) on R∞. It is evident that when R∞ → 100
% the function G(R∞) goes to infinity. Furthermore, small changes of R∞ between 90
and 100% strongly affect the observed Raman intensity Ψ∞. Thus, Raman intensities
may decrease significantly as a function of time during reaction although the density
of the corresponding Raman sensitive species remains unchanged. Fortunately,
Equations 3.1 and 3.2 allow then to calculate the correction for the Raman intensity of
such species assuming s to be constant. This means that Ψ∞ has to be divided by
G(R∞). The combined operando Raman / UV-Vis-NIR set-up described in Chapter 2 is
capable of measuring both Raman and UV-Vis-NIR spectroscopy simultaneously
under working conditions. In Chapter 2 only the qualitative potential of this set-up is
discussed.
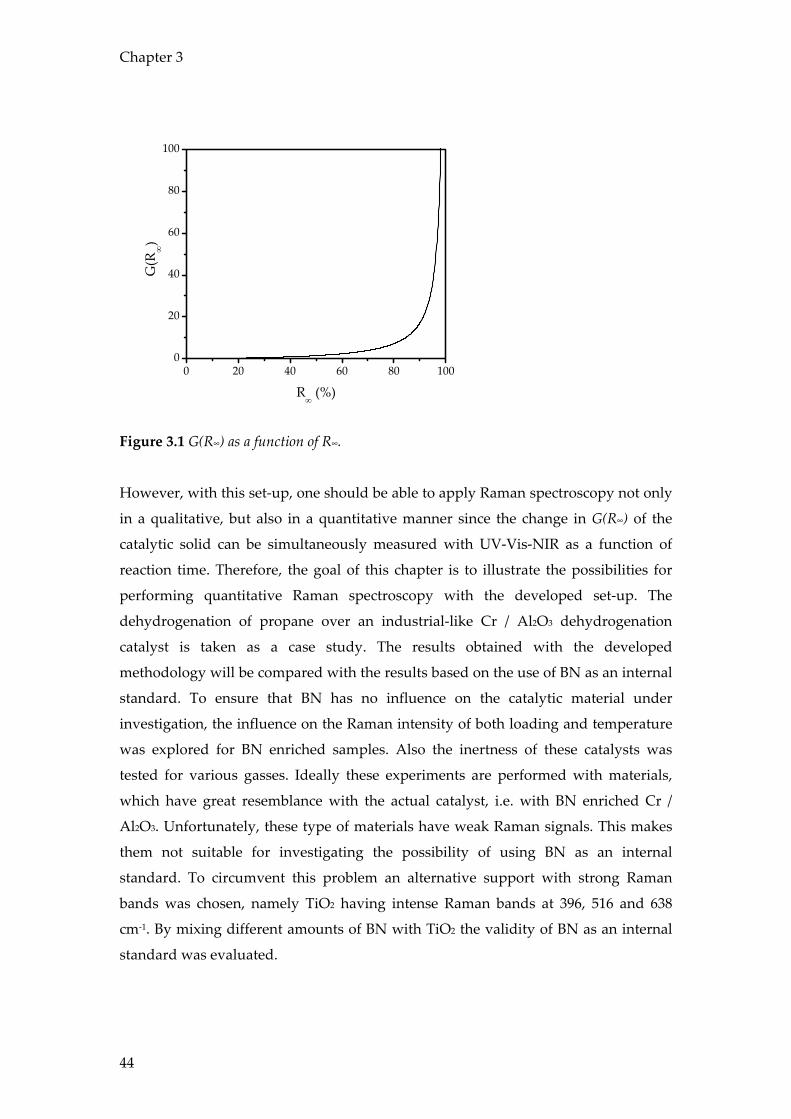
Chapter 3
44
0 20 40 60 80 1000
20
40
60
80
100G
(R∞)
R∞ (%)
Figure 3.1 G(R∞) as a function of R∞.
However, with this set-up, one should be able to apply Raman spectroscopy not only
in a qualitative, but also in a quantitative manner since the change in G(R∞) of the
catalytic solid can be simultaneously measured with UV-Vis-NIR as a function of
reaction time. Therefore, the goal of this chapter is to illustrate the possibilities for
performing quantitative Raman spectroscopy with the developed set-up. The
dehydrogenation of propane over an industrial-like Cr / Al2O3 dehydrogenation
catalyst is taken as a case study. The results obtained with the developed
methodology will be compared with the results based on the use of BN as an internal
standard. To ensure that BN has no influence on the catalytic material under
investigation, the influence on the Raman intensity of both loading and temperature
was explored for BN enriched samples. Also the inertness of these catalysts was
tested for various gasses. Ideally these experiments are performed with materials,
which have great resemblance with the actual catalyst, i.e. with BN enriched Cr /
Al2O3. Unfortunately, these type of materials have weak Raman signals. This makes
them not suitable for investigating the possibility of using BN as an internal
standard. To circumvent this problem an alternative support with strong Raman
bands was chosen, namely TiO2 having intense Raman bands at 396, 516 and 638
cm-1. By mixing different amounts of BN with TiO2 the validity of BN as an internal
standard was evaluated.
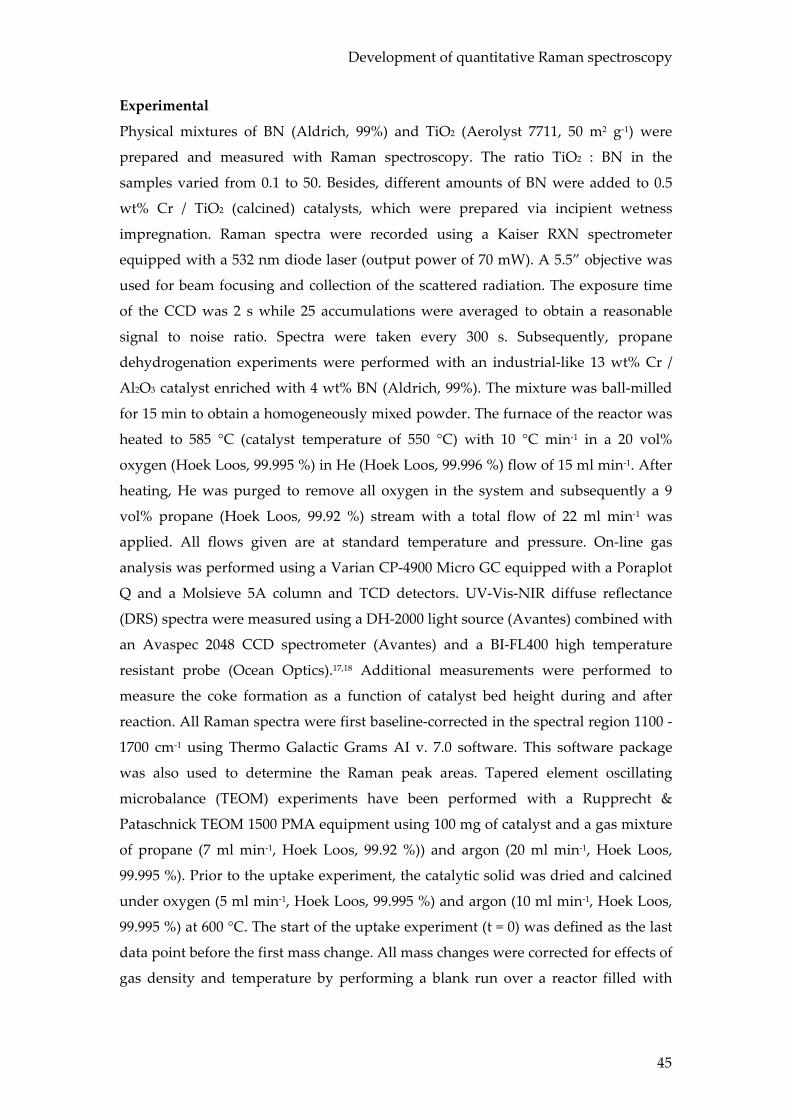
Development of quantitative Raman spectroscopy
45
Experimental
Physical mixtures of BN (Aldrich, 99%) and TiO2 (Aerolyst 7711, 50 m2 g-1) were
prepared and measured with Raman spectroscopy. The ratio TiO2 : BN in the
samples varied from 0.1 to 50. Besides, different amounts of BN were added to 0.5
wt% Cr / TiO2 (calcined) catalysts, which were prepared via incipient wetness
impregnation. Raman spectra were recorded using a Kaiser RXN spectrometer
equipped with a 532 nm diode laser (output power of 70 mW). A 5.5” objective was
used for beam focusing and collection of the scattered radiation. The exposure time
of the CCD was 2 s while 25 accumulations were averaged to obtain a reasonable
signal to noise ratio. Spectra were taken every 300 s. Subsequently, propane
dehydrogenation experiments were performed with an industrial-like 13 wt% Cr /
Al2O3 catalyst enriched with 4 wt% BN (Aldrich, 99%). The mixture was ball-milled
for 15 min to obtain a homogeneously mixed powder. The furnace of the reactor was
heated to 585 °C (catalyst temperature of 550 °C) with 10 °C min-1 in a 20 vol%
oxygen (Hoek Loos, 99.995 %) in He (Hoek Loos, 99.996 %) flow of 15 ml min-1. After
heating, He was purged to remove all oxygen in the system and subsequently a 9
vol% propane (Hoek Loos, 99.92 %) stream with a total flow of 22 ml min-1 was
applied. All flows given are at standard temperature and pressure. On-line gas
analysis was performed using a Varian CP-4900 Micro GC equipped with a Poraplot
Q and a Molsieve 5A column and TCD detectors. UV-Vis-NIR diffuse reflectance
(DRS) spectra were measured using a DH-2000 light source (Avantes) combined with
an Avaspec 2048 CCD spectrometer (Avantes) and a BI-FL400 high temperature
resistant probe (Ocean Optics).17,18 Additional measurements were performed to
measure the coke formation as a function of catalyst bed height during and after
reaction. All Raman spectra were first baseline-corrected in the spectral region 1100 -
1700 cm-1 using Thermo Galactic Grams AI v. 7.0 software. This software package
was also used to determine the Raman peak areas. Tapered element oscillating
microbalance (TEOM) experiments have been performed with a Rupprecht &
Pataschnick TEOM 1500 PMA equipment using 100 mg of catalyst and a gas mixture
of propane (7 ml min-1, Hoek Loos, 99.92 %)) and argon (20 ml min-1, Hoek Loos,
99.995 %). Prior to the uptake experiment, the catalytic solid was dried and calcined
under oxygen (5 ml min-1, Hoek Loos, 99.995 %) and argon (10 ml min-1, Hoek Loos,
99.995 %) at 600 °C. The start of the uptake experiment (t = 0) was defined as the last
data point before the first mass change. All mass changes were corrected for effects of
gas density and temperature by performing a blank run over a reactor filled with
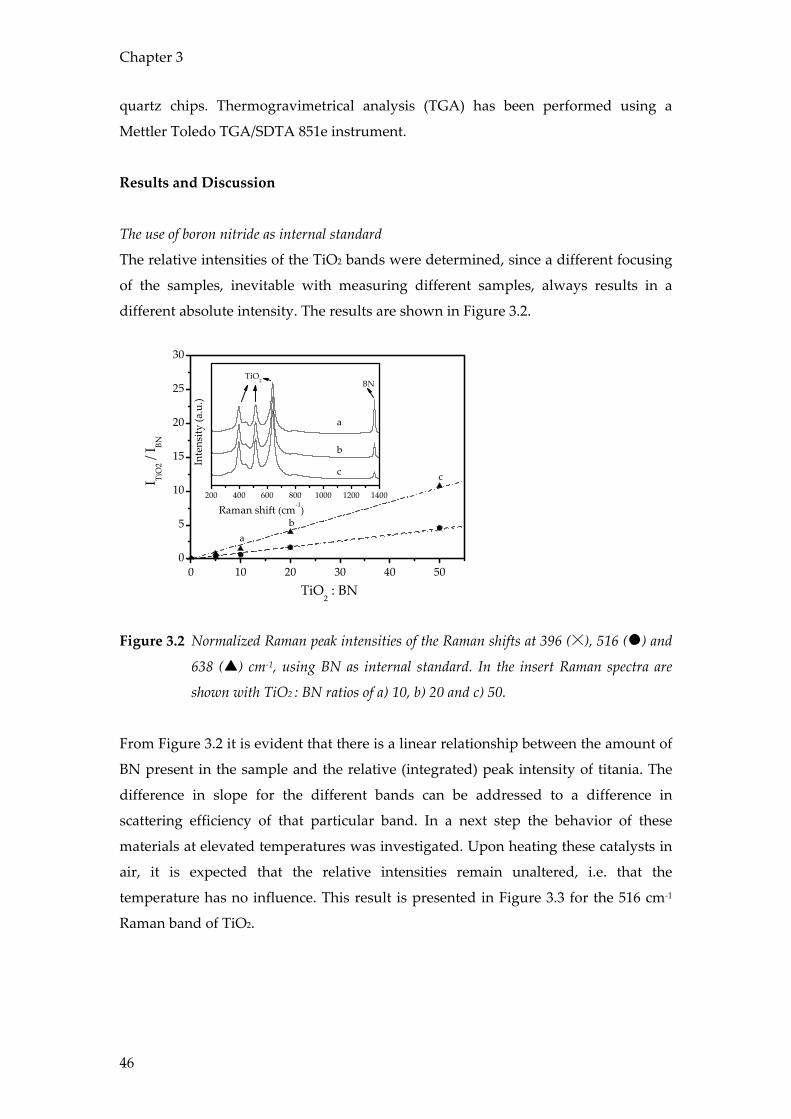
Chapter 3
46
quartz chips. Thermogravimetrical analysis (TGA) has been performed using a
Mettler Toledo TGA/SDTA 851e instrument.
Results and Discussion
The use of boron nitride as internal standard
The relative intensities of the TiO2 bands were determined, since a different focusing
of the samples, inevitable with measuring different samples, always results in a
different absolute intensity. The results are shown in Figure 3.2.
0 10 20 30 40 500
5
10
15
20
25
30
200 400 600 800 1000 1200 1400
TiO2 : BN
I TiO
2 / I BN
a
b
Inte
nsity
(a.u
.)
Raman shift (cm-1)
c
ab
c
BNTiO
2
Figure 3.2 Normalized Raman peak intensities of the Raman shifts at 396 ( ), 516 ( ) and
638 ( ) cm-1, using BN as internal standard. In the insert Raman spectra are
shown with TiO2 : BN ratios of a) 10, b) 20 and c) 50.
From Figure 3.2 it is evident that there is a linear relationship between the amount of
BN present in the sample and the relative (integrated) peak intensity of titania. The
difference in slope for the different bands can be addressed to a difference in
scattering efficiency of that particular band. In a next step the behavior of these
materials at elevated temperatures was investigated. Upon heating these catalysts in
air, it is expected that the relative intensities remain unaltered, i.e. that the
temperature has no influence. This result is presented in Figure 3.3 for the 516 cm-1
Raman band of TiO2.
Development of quantitative Raman spectroscopy
47
100 200 300 400 500 6000.0
0.5
1.0
1.5
2.0
I TiO
2 / I BN
Temperature (oC)
Figure 3.3 Temperature dependency of the 516 cm-1 band of TiO2 (TiO2 : BN = 20 : 1).
From this Figure it is evident that the influence of temperature on the relative
intensity is small at temperatures above ca. 350 °C. After cooling it appeared that the
process is completely reversible and therefore the use of BN as an internal standard,
especially at higher temperatures, is possible. Besides, during heating the band of BN
shifted gradually to 1350 cm-1. After cooling this band was at its original position of
1367 cm-1. Since the temperature is of little influence it is of course important to check
the inertness of BN. Feeding different gasses like propane and hydrogen over the
reactor at temperatures up to 600 ˚C revealed that BN does not take part in any
reaction at these conditions. Therefore it can be concluded that BN is applicable as an
internal standard for supported metal oxide catalysts during dehydrogenation
reactions.
Monitoring the propane dehydrogenation of a boron nitride enriched Cr / Al2O3 catalyst
during propane dehydrogenation
Figure 3.4 shows a representative set of time-resolved Raman spectra of an
industrial-like 13 wt% Cr/Al2O3 propane dehydrogenation catalyst mixed with BN
under working conditions at 550 °C. It can be concluded from this Figure that the
Raman band of BN, located at 1350 cm-1 (slightly shifted from the 1367 cm-1 position
due to temperature effects) decreases in intensity as the reaction proceeds. The
formation of coke is seen most easily by the upcoming (broad) Raman bands located
at 1580 cm-1 and at 1330 cm-1, the latter close to the Raman band position of the BN
standard, which may hamper quantification. These two Raman bands can be
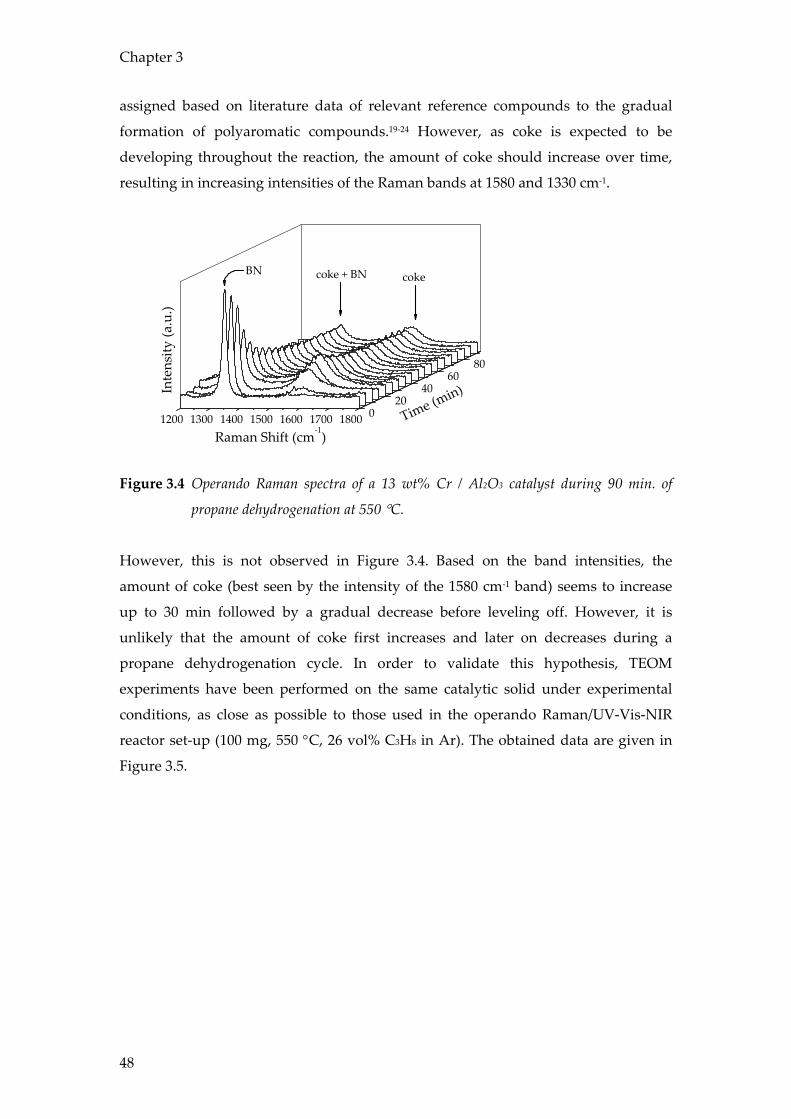
Chapter 3
48
assigned based on literature data of relevant reference compounds to the gradual
formation of polyaromatic compounds.19-24 However, as coke is expected to be
developing throughout the reaction, the amount of coke should increase over time,
resulting in increasing intensities of the Raman bands at 1580 and 1330 cm-1.
1800170016001500140013001200 020
4060
80
BN
Inte
nsity
(a.u
.)
Time (min)
Raman Shift (cm-1)
coke + BN coke
Figure 3.4 Operando Raman spectra of a 13 wt% Cr / Al2O3 catalyst during 90 min. of
propane dehydrogenation at 550 °C.
However, this is not observed in Figure 3.4. Based on the band intensities, the
amount of coke (best seen by the intensity of the 1580 cm-1 band) seems to increase
up to 30 min followed by a gradual decrease before leveling off. However, it is
unlikely that the amount of coke first increases and later on decreases during a
propane dehydrogenation cycle. In order to validate this hypothesis, TEOM
experiments have been performed on the same catalytic solid under experimental
conditions, as close as possible to those used in the operando Raman/UV-Vis-NIR
reactor set-up (100 mg, 550 °C, 26 vol% C3H8 in Ar). The obtained data are given in
Figure 3.5.
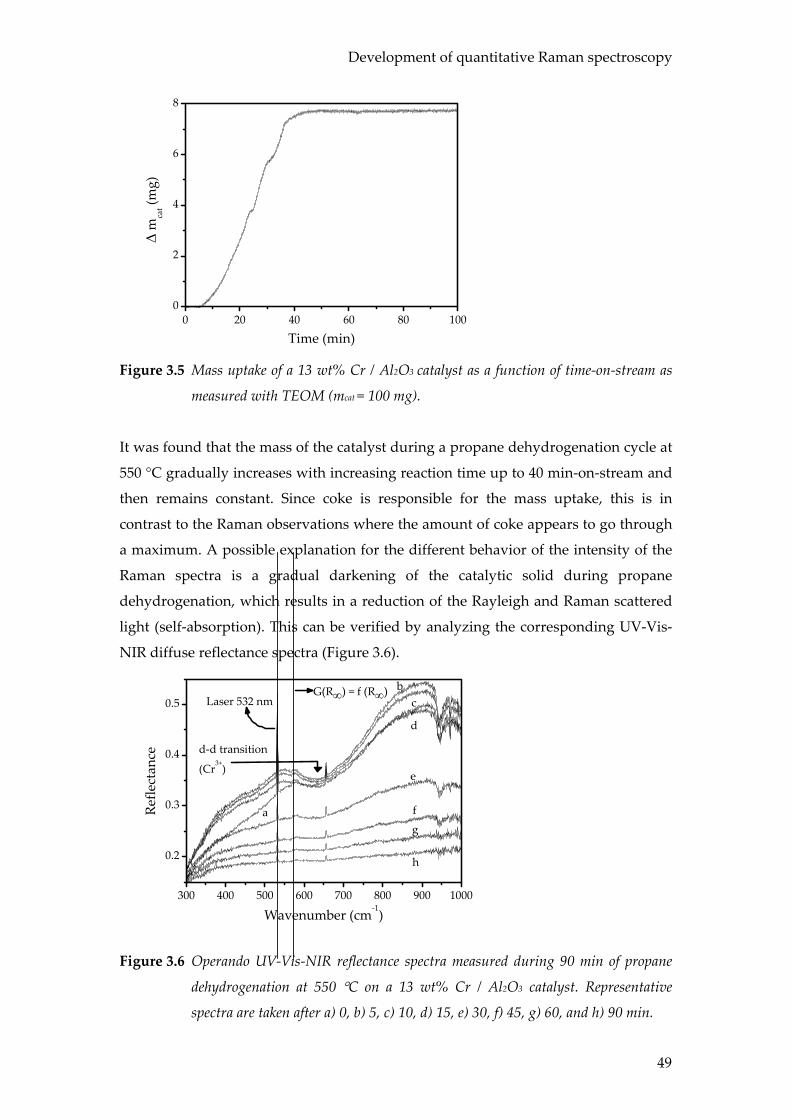
Development of quantitative Raman spectroscopy
49
0 20 40 60 80 1000
2
4
6
8
∆ m
cat (m
g)
Time (min)
Figure 3.5 Mass uptake of a 13 wt% Cr / Al2O3 catalyst as a function of time-on-stream as
measured with TEOM (mcat = 100 mg).
It was found that the mass of the catalyst during a propane dehydrogenation cycle at
550 °C gradually increases with increasing reaction time up to 40 min-on-stream and
then remains constant. Since coke is responsible for the mass uptake, this is in
contrast to the Raman observations where the amount of coke appears to go through
a maximum. A possible explanation for the different behavior of the intensity of the
Raman spectra is a gradual darkening of the catalytic solid during propane
dehydrogenation, which results in a reduction of the Rayleigh and Raman scattered
light (self-absorption). This can be verified by analyzing the corresponding UV-Vis-
NIR diffuse reflectance spectra (Figure 3.6).
300 400 500 600 700 800 900 1000
0.2
0.3
0.4
0.5 Laser 532 nm
d-d transition
(Cr3+)
h
G(R∞) = f (R∞)
d
g
f
e
cb
aRefle
ctan
ce
Wavenumber (cm-1)
Figure 3.6 Operando UV-Vis-NIR reflectance spectra measured during 90 min of propane
dehydrogenation at 550 °C on a 13 wt% Cr / Al2O3 catalyst. Representative
spectra are taken after a) 0, b) 5, c) 10, d) 15, e) 30, f) 45, g) 60, and h) 90 min.
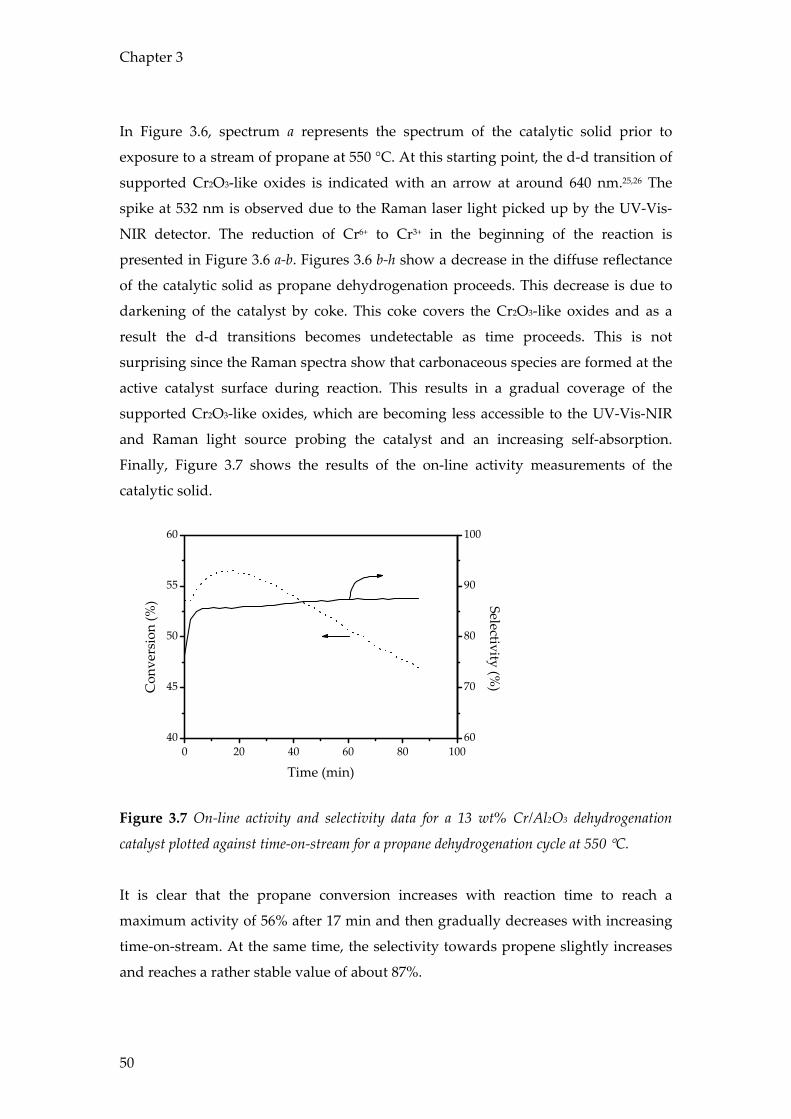
Chapter 3
50
In Figure 3.6, spectrum a represents the spectrum of the catalytic solid prior to
exposure to a stream of propane at 550 °C. At this starting point, the d-d transition of
supported Cr2O3-like oxides is indicated with an arrow at around 640 nm.25,26 The
spike at 532 nm is observed due to the Raman laser light picked up by the UV-Vis-
NIR detector. The reduction of Cr6+ to Cr3+ in the beginning of the reaction is
presented in Figure 3.6 a-b. Figures 3.6 b-h show a decrease in the diffuse reflectance
of the catalytic solid as propane dehydrogenation proceeds. This decrease is due to
darkening of the catalyst by coke. This coke covers the Cr2O3-like oxides and as a
result the d-d transitions becomes undetectable as time proceeds. This is not
surprising since the Raman spectra show that carbonaceous species are formed at the
active catalyst surface during reaction. This results in a gradual coverage of the
supported Cr2O3-like oxides, which are becoming less accessible to the UV-Vis-NIR
and Raman light source probing the catalyst and an increasing self-absorption.
Finally, Figure 3.7 shows the results of the on-line activity measurements of the
catalytic solid.
0 20 40 60 80 10040
45
50
55
60
60
70
80
90
100
Con
vers
ion
(%)
Time (min)
Selectivity (%)
Figure 3.7 On-line activity and selectivity data for a 13 wt% Cr/Al2O3 dehydrogenation
catalyst plotted against time-on-stream for a propane dehydrogenation cycle at 550 °C.
It is clear that the propane conversion increases with reaction time to reach a
maximum activity of 56% after 17 min and then gradually decreases with increasing
time-on-stream. At the same time, the selectivity towards propene slightly increases
and reaches a rather stable value of about 87%.
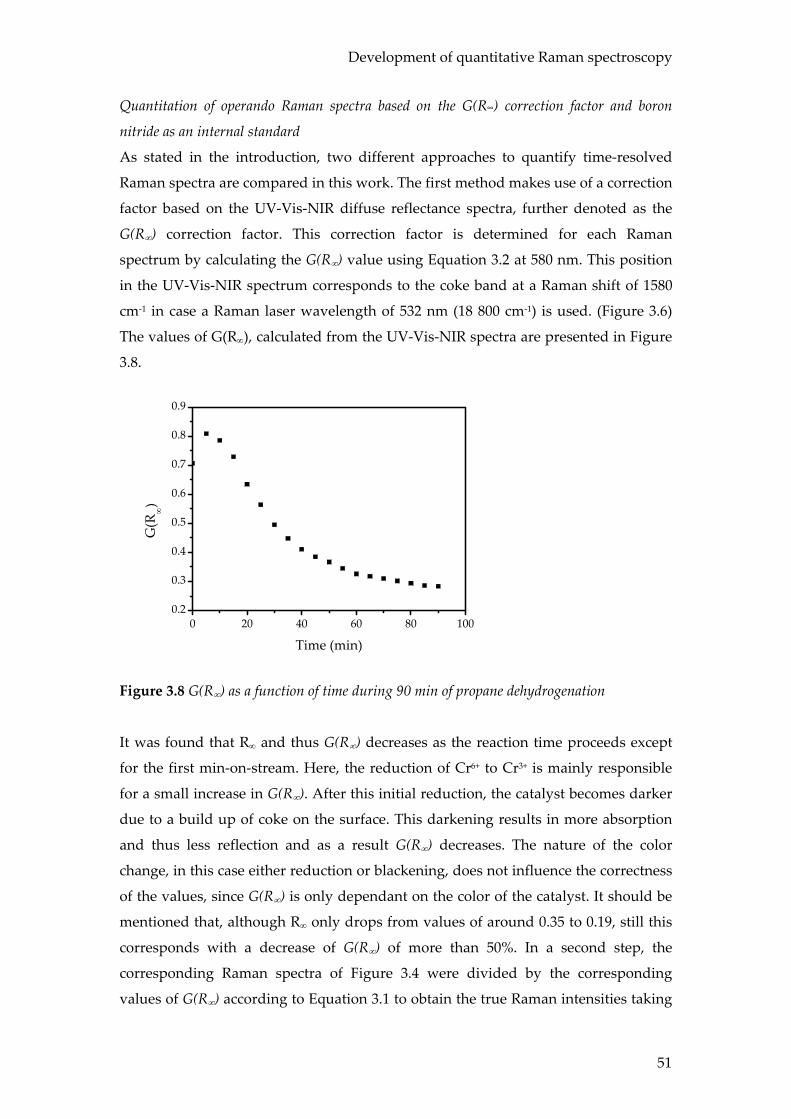
Development of quantitative Raman spectroscopy
51
Quantitation of operando Raman spectra based on the G(R∞) correction factor and boron
nitride as an internal standard
As stated in the introduction, two different approaches to quantify time-resolved
Raman spectra are compared in this work. The first method makes use of a correction
factor based on the UV-Vis-NIR diffuse reflectance spectra, further denoted as the
G(R∞) correction factor. This correction factor is determined for each Raman
spectrum by calculating the G(R∞) value using Equation 3.2 at 580 nm. This position
in the UV-Vis-NIR spectrum corresponds to the coke band at a Raman shift of 1580
cm-1 in case a Raman laser wavelength of 532 nm (18 800 cm-1) is used. (Figure 3.6)
The values of G(R∞), calculated from the UV-Vis-NIR spectra are presented in Figure
3.8.
0 20 40 60 80 1000.2
0.3
0.4
0.5
0.6
0.7
0.8
0.9
G(R
∞)
Time (min)
Figure 3.8 G(R∞) as a function of time during 90 min of propane dehydrogenation
It was found that R∞ and thus G(R∞) decreases as the reaction time proceeds except
for the first min-on-stream. Here, the reduction of Cr6+ to Cr3+ is mainly responsible
for a small increase in G(R∞). After this initial reduction, the catalyst becomes darker
due to a build up of coke on the surface. This darkening results in more absorption
and thus less reflection and as a result G(R∞) decreases. The nature of the color
change, in this case either reduction or blackening, does not influence the correctness
of the values, since G(R∞) is only dependant on the color of the catalyst. It should be
mentioned that, although R∞ only drops from values of around 0.35 to 0.19, still this
corresponds with a decrease of G(R∞) of more than 50%. In a second step, the
corresponding Raman spectra of Figure 3.4 were divided by the corresponding
values of G(R∞) according to Equation 3.1 to obtain the true Raman intensities taking
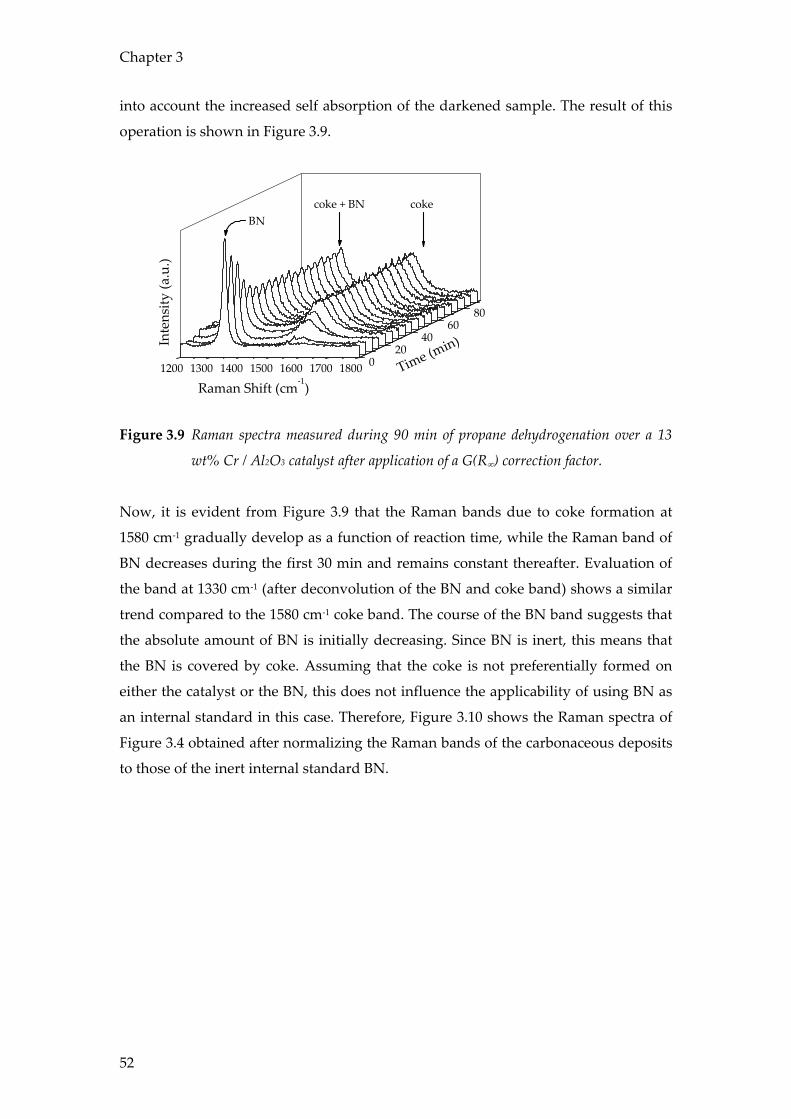
Chapter 3
52
into account the increased self absorption of the darkened sample. The result of this
operation is shown in Figure 3.9.
1800170016001500140013001200 020
4060
80
BN
Inte
nsity
(a.u
.)
Time (min)
Raman Shift (cm-1)
coke + BN coke
Figure 3.9 Raman spectra measured during 90 min of propane dehydrogenation over a 13
wt% Cr / Al2O3 catalyst after application of a G(R∞) correction factor.
Now, it is evident from Figure 3.9 that the Raman bands due to coke formation at
1580 cm-1 gradually develop as a function of reaction time, while the Raman band of
BN decreases during the first 30 min and remains constant thereafter. Evaluation of
the band at 1330 cm-1 (after deconvolution of the BN and coke band) shows a similar
trend compared to the 1580 cm-1 coke band. The course of the BN band suggests that
the absolute amount of BN is initially decreasing. Since BN is inert, this means that
the BN is covered by coke. Assuming that the coke is not preferentially formed on
either the catalyst or the BN, this does not influence the applicability of using BN as
an internal standard in this case. Therefore, Figure 3.10 shows the Raman spectra of
Figure 3.4 obtained after normalizing the Raman bands of the carbonaceous deposits
to those of the inert internal standard BN.
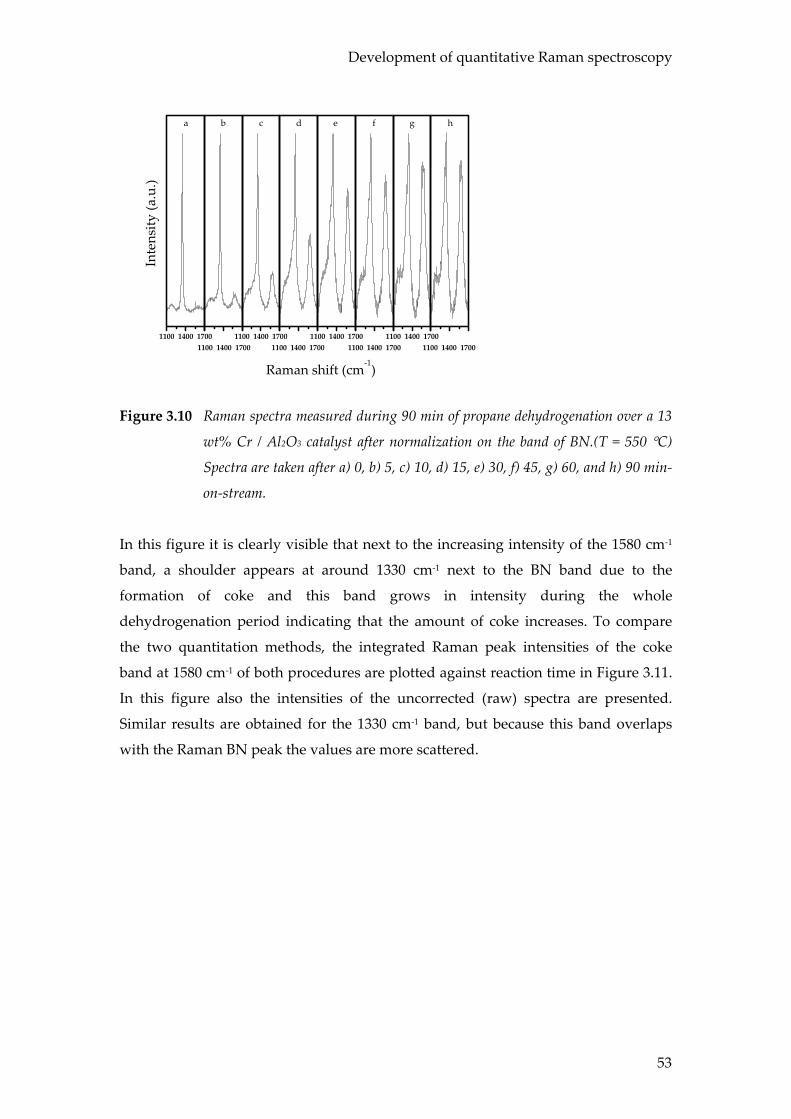
Development of quantitative Raman spectroscopy
53
1100 1400 17001100 1400 1700
1100 1400 17001100 1400 1700
1100 1400 17001100 1400 1700
1100 1400 17001100 1400 1700
Inte
nsity
(a.u
.)
a b
c
d
Raman shift (cm-1)
e
f
g
h
Figure 3.10 Raman spectra measured during 90 min of propane dehydrogenation over a 13
wt% Cr / Al2O3 catalyst after normalization on the band of BN.(T = 550 °C)
Spectra are taken after a) 0, b) 5, c) 10, d) 15, e) 30, f) 45, g) 60, and h) 90 min-
on-stream.
In this figure it is clearly visible that next to the increasing intensity of the 1580 cm-1
band, a shoulder appears at around 1330 cm-1 next to the BN band due to the
formation of coke and this band grows in intensity during the whole
dehydrogenation period indicating that the amount of coke increases. To compare
the two quantitation methods, the integrated Raman peak intensities of the coke
band at 1580 cm-1 of both procedures are plotted against reaction time in Figure 3.11.
In this figure also the intensities of the uncorrected (raw) spectra are presented.
Similar results are obtained for the 1330 cm-1 band, but because this band overlaps
with the Raman BN peak the values are more scattered.
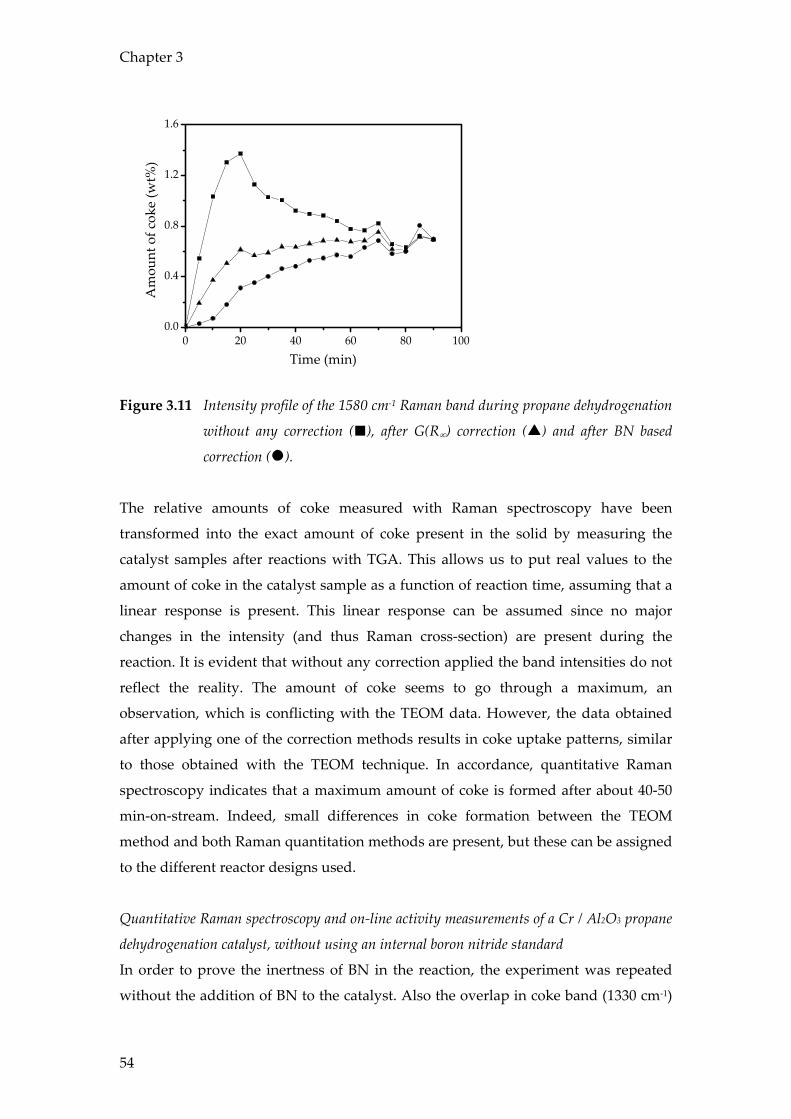
Chapter 3
54
0 20 40 60 80 1000.0
0.4
0.8
1.2
1.6
Am
ount
of c
oke
(wt%
)
Time (min)
Figure 3.11 Intensity profile of the 1580 cm-1 Raman band during propane dehydrogenation
without any correction ( ), after G(R∞) correction ( ) and after BN based
correction ( ).
The relative amounts of coke measured with Raman spectroscopy have been
transformed into the exact amount of coke present in the solid by measuring the
catalyst samples after reactions with TGA. This allows us to put real values to the
amount of coke in the catalyst sample as a function of reaction time, assuming that a
linear response is present. This linear response can be assumed since no major
changes in the intensity (and thus Raman cross-section) are present during the
reaction. It is evident that without any correction applied the band intensities do not
reflect the reality. The amount of coke seems to go through a maximum, an
observation, which is conflicting with the TEOM data. However, the data obtained
after applying one of the correction methods results in coke uptake patterns, similar
to those obtained with the TEOM technique. In accordance, quantitative Raman
spectroscopy indicates that a maximum amount of coke is formed after about 40-50
min-on-stream. Indeed, small differences in coke formation between the TEOM
method and both Raman quantitation methods are present, but these can be assigned
to the different reactor designs used.
Quantitative Raman spectroscopy and on-line activity measurements of a Cr / Al2O3 propane
dehydrogenation catalyst, without using an internal boron nitride standard
In order to prove the inertness of BN in the reaction, the experiment was repeated
without the addition of BN to the catalyst. Also the overlap in coke band (1330 cm-1)
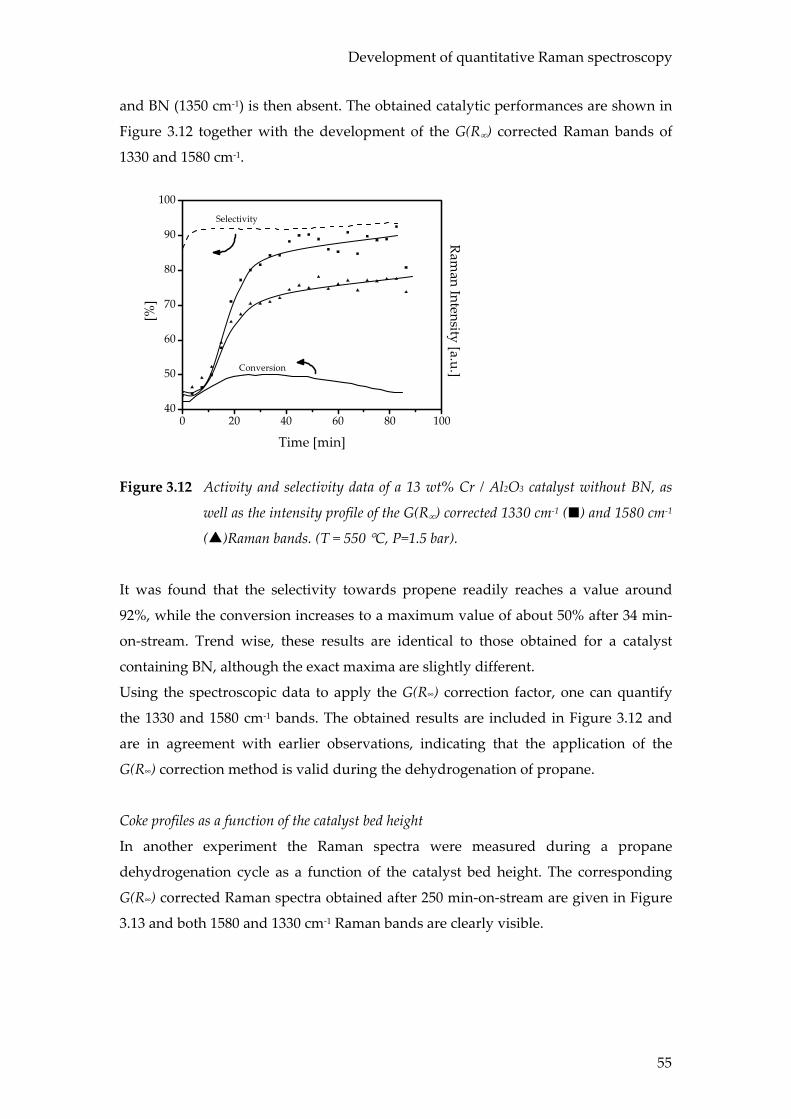
Development of quantitative Raman spectroscopy
55
and BN (1350 cm-1) is then absent. The obtained catalytic performances are shown in
Figure 3.12 together with the development of the G(R∞) corrected Raman bands of
1330 and 1580 cm-1.
0 20 40 60 80 10040
50
60
70
80
90
100Selectivity
Conversion
Raman Intensity [a.u.]
[%]
Time [min]
Figure 3.12 Activity and selectivity data of a 13 wt% Cr / Al2O3 catalyst without BN, as
well as the intensity profile of the G(R∞) corrected 1330 cm-1 ( ) and 1580 cm-1
( )Raman bands. (T = 550 °C, P=1.5 bar).
It was found that the selectivity towards propene readily reaches a value around
92%, while the conversion increases to a maximum value of about 50% after 34 min-
on-stream. Trend wise, these results are identical to those obtained for a catalyst
containing BN, although the exact maxima are slightly different.
Using the spectroscopic data to apply the G(R∞) correction factor, one can quantify
the 1330 and 1580 cm-1 bands. The obtained results are included in Figure 3.12 and
are in agreement with earlier observations, indicating that the application of the
G(R∞) correction method is valid during the dehydrogenation of propane.
Coke profiles as a function of the catalyst bed height
In another experiment the Raman spectra were measured during a propane
dehydrogenation cycle as a function of the catalyst bed height. The corresponding
G(R∞) corrected Raman spectra obtained after 250 min-on-stream are given in Figure
3.13 and both 1580 and 1330 cm-1 Raman bands are clearly visible.
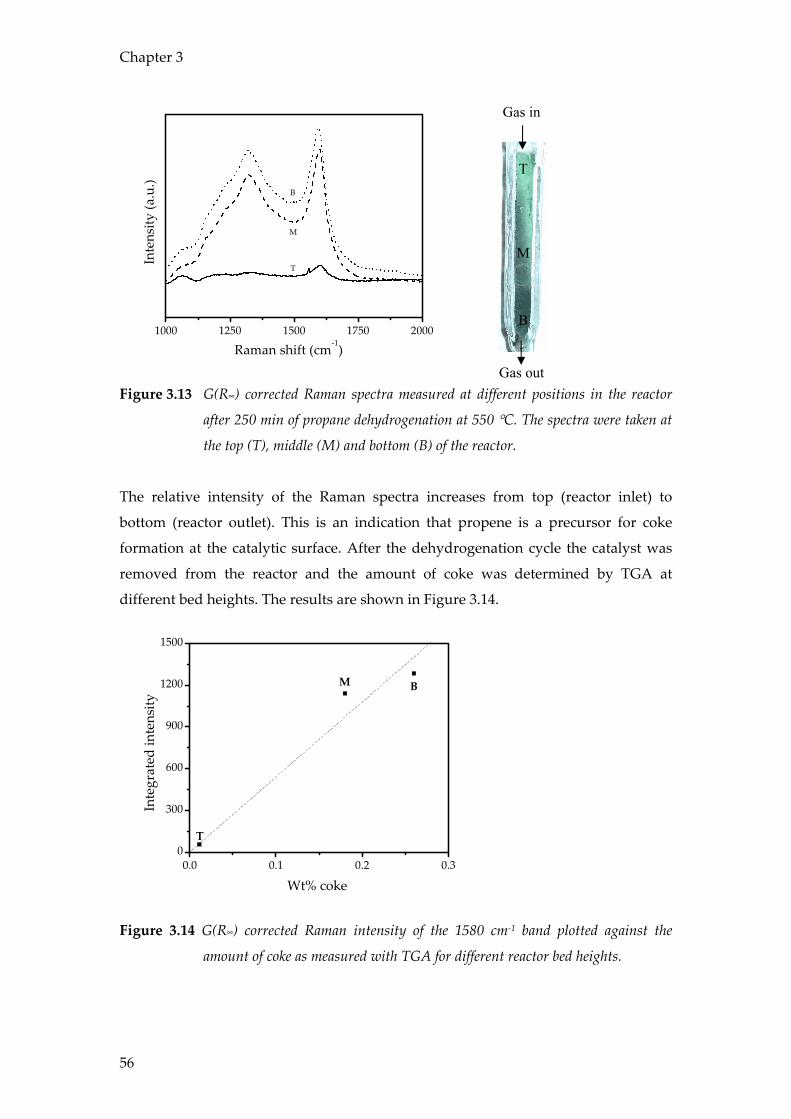
Chapter 3
56
1000 1250 1500 1750 2000
Inte
nsity
(a.u
.)
Raman shift (cm-1)
B
M
T
Figure 3.13 G(R∞) corrected Raman spectra measured at different positions in the reactor
after 250 min of propane dehydrogenation at 550 °C. The spectra were taken at
the top (T), middle (M) and bottom (B) of the reactor.
The relative intensity of the Raman spectra increases from top (reactor inlet) to
bottom (reactor outlet). This is an indication that propene is a precursor for coke
formation at the catalytic surface. After the dehydrogenation cycle the catalyst was
removed from the reactor and the amount of coke was determined by TGA at
different bed heights. The results are shown in Figure 3.14.
0.0 0.1 0.2 0.30
300
600
900
1200
1500
BM
T
Inte
grat
ed in
tens
ity
Wt% coke
Figure 3.14 G(R∞) corrected Raman intensity of the 1580 cm-1 band plotted against the
amount of coke as measured with TGA for different reactor bed heights.
Gas in
Gas out
T
M
B
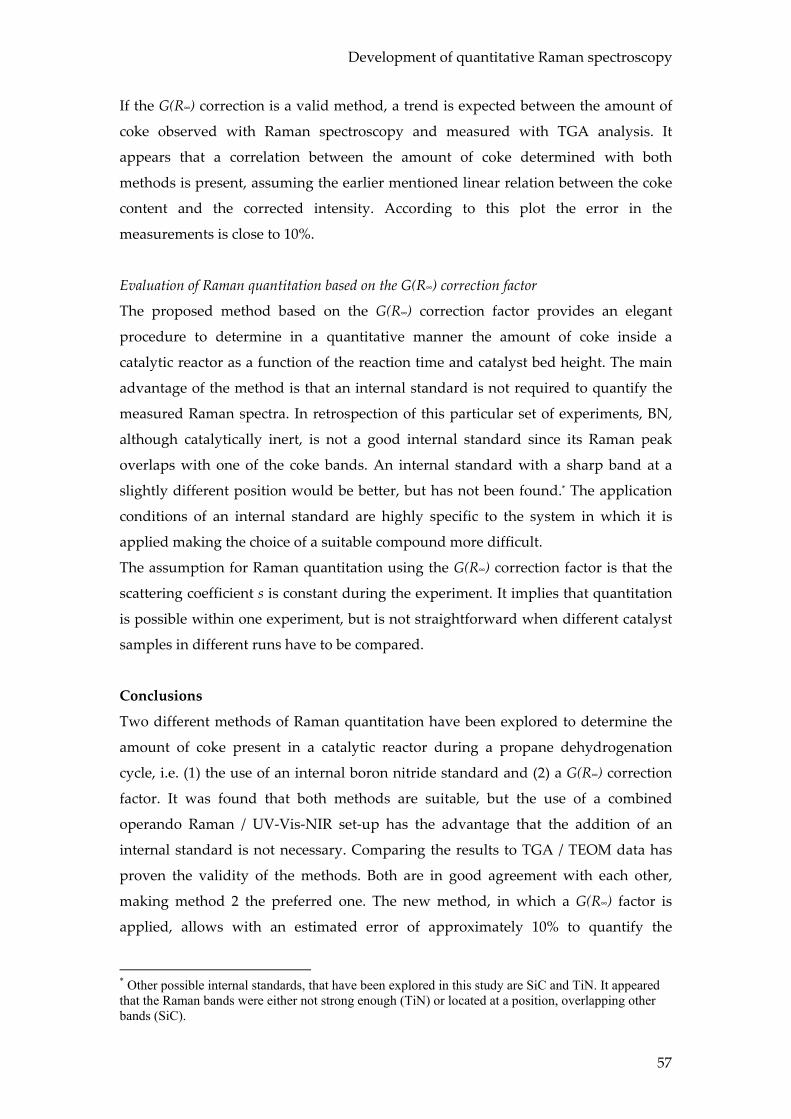
Development of quantitative Raman spectroscopy
57
If the G(R∞) correction is a valid method, a trend is expected between the amount of
coke observed with Raman spectroscopy and measured with TGA analysis. It
appears that a correlation between the amount of coke determined with both
methods is present, assuming the earlier mentioned linear relation between the coke
content and the corrected intensity. According to this plot the error in the
measurements is close to 10%.
Evaluation of Raman quantitation based on the G(R∞) correction factor
The proposed method based on the G(R∞) correction factor provides an elegant
procedure to determine in a quantitative manner the amount of coke inside a
catalytic reactor as a function of the reaction time and catalyst bed height. The main
advantage of the method is that an internal standard is not required to quantify the
measured Raman spectra. In retrospection of this particular set of experiments, BN,
although catalytically inert, is not a good internal standard since its Raman peak
overlaps with one of the coke bands. An internal standard with a sharp band at a
slightly different position would be better, but has not been found.* The application
conditions of an internal standard are highly specific to the system in which it is
applied making the choice of a suitable compound more difficult.
The assumption for Raman quantitation using the G(R∞) correction factor is that the
scattering coefficient s is constant during the experiment. It implies that quantitation
is possible within one experiment, but is not straightforward when different catalyst
samples in different runs have to be compared.
Conclusions
Two different methods of Raman quantitation have been explored to determine the
amount of coke present in a catalytic reactor during a propane dehydrogenation
cycle, i.e. (1) the use of an internal boron nitride standard and (2) a G(R∞) correction
factor. It was found that both methods are suitable, but the use of a combined
operando Raman / UV-Vis-NIR set-up has the advantage that the addition of an
internal standard is not necessary. Comparing the results to TGA / TEOM data has
proven the validity of the methods. Both are in good agreement with each other,
making method 2 the preferred one. The new method, in which a G(R∞) factor is
applied, allows with an estimated error of approximately 10% to quantify the
* Other possible internal standards, that have been explored in this study are SiC and TiN. It appeared that the Raman bands were either not strong enough (TiN) or located at a position, overlapping other bands (SiC).
Chapter 3
58
amount of coke formed during a propane dehydrogenation reaction as a function of
catalyst bed height as well as the reaction time in an industrial-like reactor.
Acknowledgements
B. van der Linden (Delft University of Technology) and F. Broersma (Utrecht
University) are acknowledged for performing the TGA and TEOM measurements
described in this chapter.
References 1. Li, C.; Li, M., J. Raman Spectrosc., 2002, 33, 301.
2. Aarnoutse, P. J.; Westerhuis, J. A., Anal. Chem., 2005, 77, 1228.
3. Baltrus, J. P.; Makovsky, L. E.; Stencel, J. M.; Hercules, D. M., Anal. Chem., 1985, 57, 2500.
4. Bergwerff, J. A.; Visser, T.; Leliveld, B. R. G.; Rossenaar, B. D.; de Jong, K. P.;
Weckhuysen, B. M., J. Am. Chem. Soc., 2004, 126, 14548.
5. Chan, S. S.; Bell, A. T., J. Catal., 1984, 89, 433.
6. Schmidt, K. J.; Zhang, S. L.; Michaelian, K. H.; Webb, M. A.; Loppnow, G. R., Appl.
Spectrosc., 1999, 53, 1206.
7. Vankeirsbilck, T.; Vercauteren, A.; Baeyens, W.; Van der Weken, G.; Verpoort, F.; Vergote,
G.; Remon, J. P., Trends Anal. Chem., 2002, 21, 869.
8. Zheng, X.; Fu, W.; Albin, S.; Wise, K. L.; Javey, A.; Cooper, J. B., Appl. Spectrosc., 2001, 55,
382.
9. Wu, Z.; Zhang, C.; Stair, P. C., Catal. Today, 2006, in press.
10. Kellerman, R. In Spectroscopy in Heterogeneous Catalysis; Delgass, W. N., L., H. G.,
Kellerman, R., Lunsford, J. H., Eds.; Academic Press: New York, 1979.
11. Kortum, G. Reflectance Spectroscopy: Principles, Methods and Applications; Springer-Verlag:
Berlin, Heidelberg and New York, 1969.
12. Schoonheydt, R. A. In Characterization of Heterogeneous Catalysts; Delannay, F., Ed.; Marcel
Dekker Inc: New York and Basel, 1984.
13. Weckhuysen, B. M., Ed.; In-situ Spectroscopy of Catalysts; American Scientific Publishers:
Stevenson Ranch, 2004, pp 255.
14. Schrader, B.; Bergmann, G., Z Anal. Chem, 1967, 225, 230.
15. Waters, D. N., Spectroc. Acta Pt. A-Molec. Biomolec. Spectr., 1994, 50, 1833.
16. Kuba, S.; Knozinger, H., J. Raman Spectrosc., 2002, 33, 325.
17. Nijhuis, T. A.; Tinnemans, S. J.; Visser, T.; Weckhuysen, B. M., Phys. Chem. Chem. Phys.,
2003, 5, 4361.
Development of quantitative Raman spectroscopy
59
18. Nijhuis, T. A.; Tinnemans, S. J.; Visser, T.; Weckhuysen, B. M., Chem. Eng. Sci., 2004, 59,
5487.
19. Sze, S. K.; Siddique, N.; Sloan, J. J.; Escribano, R., Atmos. Environ., 2001, 35, 561.
20. Mertes, S.; Dippel, B.; Schwarzenbock, A., J. Aerosol Sci., 2004, 35, 347.
21. Kong, F.; Kostecki, R.; Nadeau, G.; Song, X.; Zaghib, K.; Kinoshita, K.; McLarnon, F., J.
Power Sources, 2001, 97-8, 58.
22. Escribano, R.; Sloan, J. J.; Siddique, N.; Sze, N.; Dudev, T., Vibr. Spectrosc., 2001, 26, 179.
23. Compagnini, G.; Puglisi, O.; Foti, G., Carbon, 1997, 35, 1793.
24. Chua, Y. T.; Stair, P. C., J. Catal., 2003, 213, 39.
25. Weckhuysen, B. M.; Wachs, I. E.; Schoonheydt, R. A., Chem. Rev., 1996, 96, 3327.
26. Puurunen, R. L.; Weckhuysen, B. M., J. Catal., 2002, 210, 418.

Chapter 3
60
61
Quantitative Raman spectroscopy of supported metal oxide catalysts: On-line
determination of the amount of Cr6+ in a catalytic reactor
Abstract
In continuation of previous work on the applicability of the G(R∞) correction factor
for the quantification of Raman spectra of coke during propane dehydrogenation
experiments, research has been carried out on the potential of this correction factor
for the quantification of supported metal oxides during reduction experiments. For
this purpose, supported chromium oxide catalysts have been studied by combined
in-situ Raman and UV-Vis-NIR spectroscopy during temperature programmed
reduction experiments with hydrogen as reducing agent. The goal was to quantify
on-line the amount of Cr6+ in a reactor based on the measured in-situ Raman spectra.
During these experiments, a significant temperature effect was observed, which has
been investigated in more detail with a thermal imaging technique. The results
revealed a temperature increase ‘on the spot’ that can exceed 100°C. It implies that
Raman spectroscopy can have a considerable effect on the local reaction conditions
and explains observed inconsistencies between the in-situ UV-Vis-NIR and Raman
data. In order to minimize this heating effect, reduction of the laser power,
mathematical matching of the spectroscopic data, a different cell design and a change
in reaction conditions has been evaluated. It is demonstrated that increasing the
reactor temperature is the most feasible method to solve the heating problem. Next, it
allows the application of in-situ Raman spectroscopy in a reliable quantitative way
without the need of an internal standard.
Chapter 4
62
Introduction
In Chapter 3, it has been demonstrated that the amount of coke, that is formed on a
Cr/Al2O3 propane dehydrogenation catalyst, can be quantified with in-situ Raman
spectroscopy by using a G(R∞) correction factor.1 This factor can be directly
determined with in-situ UV-Vis-NIR spectroscopy using a previously developed
combined Raman / UV-Vis-NIR set-up.2,3 The results turned out to be in good
agreement with those obtained by applying boron nitride as an internal standard.
Furthermore, they are consistent with independently conducted thermogravimetrical
results along the reactor bed. At that time, it was that the G(R∞) correction factor
method should in principle work for every active Raman active species present in the
catalyst sample.
In order to determine the correctness of this hypothesis, the temperature
programmed reduction of a series of Cr / Al2O3 catalysts in the presence of hydrogen
as reducing agent are investigated. The colour of this catalyst system is known to
change as a result of the reduction treatment and the conversion of Cr6+ to Cr3+ can be
monitored with in-situ UV-Vis-NIR spectroscopy by measuring the intensity changes
of the Cr6+ charge transfer (CT) and Cr3+ d-d transition bands. These spectral features
should be accompanied by an intensity decrease of the characteristic Cr=O (Cr6+)
stretching vibration at around 996 cm-1 as measured with in-situ Raman
spectroscopy. The goal of this work is to show the general validity of the G(R∞)
correction factor for the Raman quantification of this Cr6+-species during temperature
programmed reduction experiments. It will, however, be shown that a local Raman
heating effect complicates this quantitative approach.
Experimental
A series of catalyst materials was prepared by the incipient wetness impregnation
method using CrO3 solutions and an alumina support (Sasol, Puralox SCCA-5/200,
188 m2 g-1). After impregnation the catalysts were dried for 12 h at 60 °C and
subsequently for 12 h at 120 °C. The catalysts were then calcined in air at 550°C (10°C
min-1) for 5 h. After calcination, 0.1 wt% of boron nitride (BN, Aldrich, 99%) was
added to the catalysts as an internal standard and they were ball-milled for 15 min to
obtain a homogeneously mixed powder at a speed of 2000 rpm.
For a reduction experiment typically 300 mg of catalyst was loaded in a quartz
reactor, which forms part of the combined in-situ Raman / UV-Vis-NIR set-up
described in previous papers.2,3 First, the catalyst was heated to 550°C at a rate of
10°C min-1 in a mixture of 3 ml min-1 O2 (Hoek Loos, 99.995%) and 12 ml min-1 He
Quantitative Raman spectroscopy of supported metal oxide catalysts
63
(Hoek Loos, 99.996%). The temperature was kept at 550°C for 5 h before cooling
down to 100°C. After this drying step, He was purged to remove all O2 from the
system. Subsequently, the reduction was started in parallel with on-line Raman and
UV-Vis-NIR analysis, by flowing 0.5 ml min-1 of a reducing agent (H2, Hoekloos,
99.0%) in 39.5 ml min-1 of He, unless otherwise stated.
UV-Vis-NIR spectra were measured using a DH2000 light source (Avantes)
combined with an Avaspec 2048 CCD spectrometer (Avantes) and a BI-FL400 high
temperature resistant probe (Ocean Optics). Raman spectra were recorded using a
Kaiser RXN spectrometer equipped with a 532 nm diode laser (output power could
be varied up to 60 mW). The laser power was measured via an Orion PD display
detector (Ophir Optronics Ltd). A 5.5” objective was used for beam focusing and
collection of the scattered radiation. Typically the exposure time of the CCD camera
was 2 s and 25 spectra were accumulated to obtain a reasonable signal to noise ratio.
The spectra were analyzed with Thermo Galactic Grams AI v. 7.0 software. In
addition, IR-thermography experiments were carried out with a Jade J550M InSb BB
Camera (CEDIP Infrared Systems) equipped with a 50 mm lens and a 20 mm
extension ring. The applied camera wavelength was 3.9 µm with an estimated
temperature sensitivity of 20 mK. An ex-situ TPR measurement was performed using
an Autochem II 2920 (Micromiretics). The catalyst was heated from 25 °C to 600 °C at
a rate of 5 °C min-1 in a gas stream of 5 % H2 in Ar.
Results and Discussion
Development of a calibration line
A first step towards the application of a spectroscopic technique in a quantitative
manner is the development of a calibration line. In Raman spectroscopy, Cr6+ has a
characteristic Raman shift around 996 cm-1 originating from the Cr=O vibration.4-7
However, from our previous work where the amount of coke has been quantified
with in-situ Raman spectroscopy it is known that the observed Raman intensity is not
always in agreement with the ‘true’ Raman intensity.1 Therefore, BN was added to
the catalyst samples as an internal standard. The choice for BN was made because it
is inert, and a strong Raman scatterer. A calibration line of the chromium band in a
series of alumina-supported chromium oxide catalysts, enriched with BN as internal
standard, differing in their chromium oxide loading is presented in Figure 4.1.
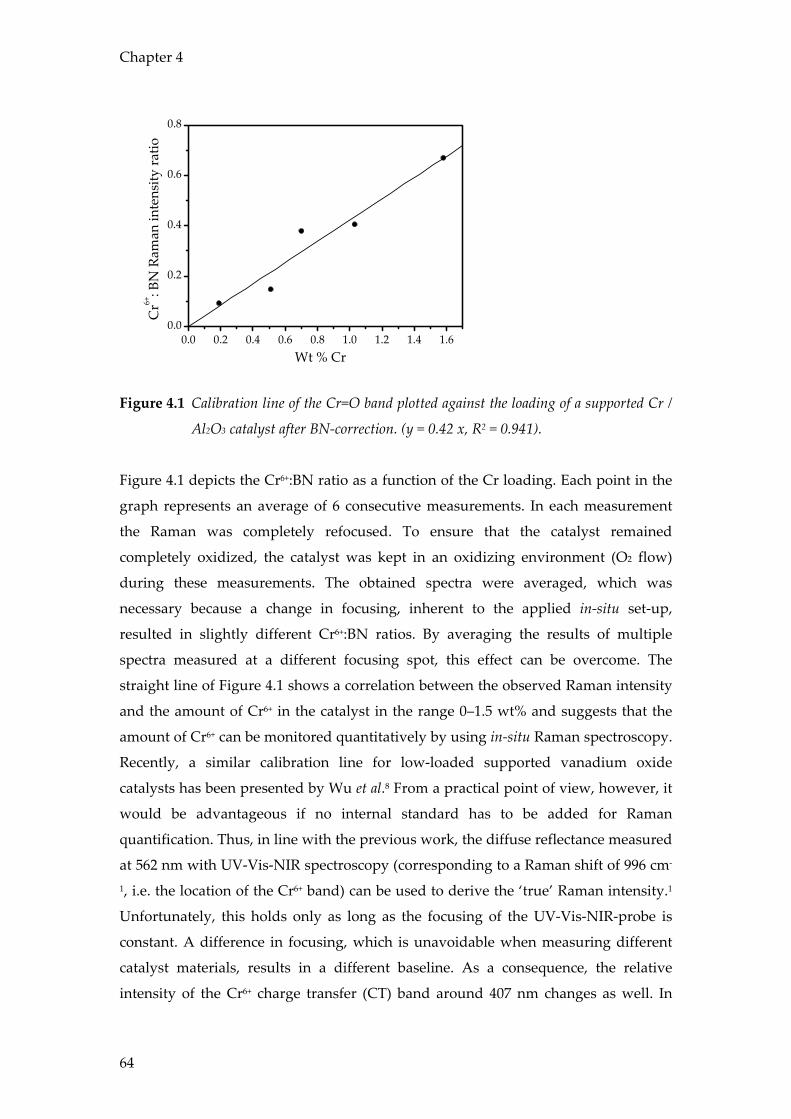
Chapter 4
64
0.0 0.2 0.4 0.6 0.8 1.0 1.2 1.4 1.60.0
0.2
0.4
0.6
0.8
Cr6+
: BN
Ram
an in
tens
ity ra
tio
Wt % Cr
Figure 4.1 Calibration line of the Cr=O band plotted against the loading of a supported Cr /
Al2O3 catalyst after BN-correction. (y = 0.42 x, R2 = 0.941).
Figure 4.1 depicts the Cr6+:BN ratio as a function of the Cr loading. Each point in the
graph represents an average of 6 consecutive measurements. In each measurement
the Raman was completely refocused. To ensure that the catalyst remained
completely oxidized, the catalyst was kept in an oxidizing environment (O2 flow)
during these measurements. The obtained spectra were averaged, which was
necessary because a change in focusing, inherent to the applied in-situ set-up,
resulted in slightly different Cr6+:BN ratios. By averaging the results of multiple
spectra measured at a different focusing spot, this effect can be overcome. The
straight line of Figure 4.1 shows a correlation between the observed Raman intensity
and the amount of Cr6+ in the catalyst in the range 0–1.5 wt% and suggests that the
amount of Cr6+ can be monitored quantitatively by using in-situ Raman spectroscopy.
Recently, a similar calibration line for low-loaded supported vanadium oxide
catalysts has been presented by Wu et al.8 From a practical point of view, however, it
would be advantageous if no internal standard has to be added for Raman
quantification. Thus, in line with the previous work, the diffuse reflectance measured
at 562 nm with UV-Vis-NIR spectroscopy (corresponding to a Raman shift of 996 cm-
1, i.e. the location of the Cr6+ band) can be used to derive the ‘true’ Raman intensity.1
Unfortunately, this holds only as long as the focusing of the UV-Vis-NIR-probe is
constant. A difference in focusing, which is unavoidable when measuring different
catalyst materials, results in a different baseline. As a consequence, the relative
intensity of the Cr6+ charge transfer (CT) band around 407 nm changes as well. In
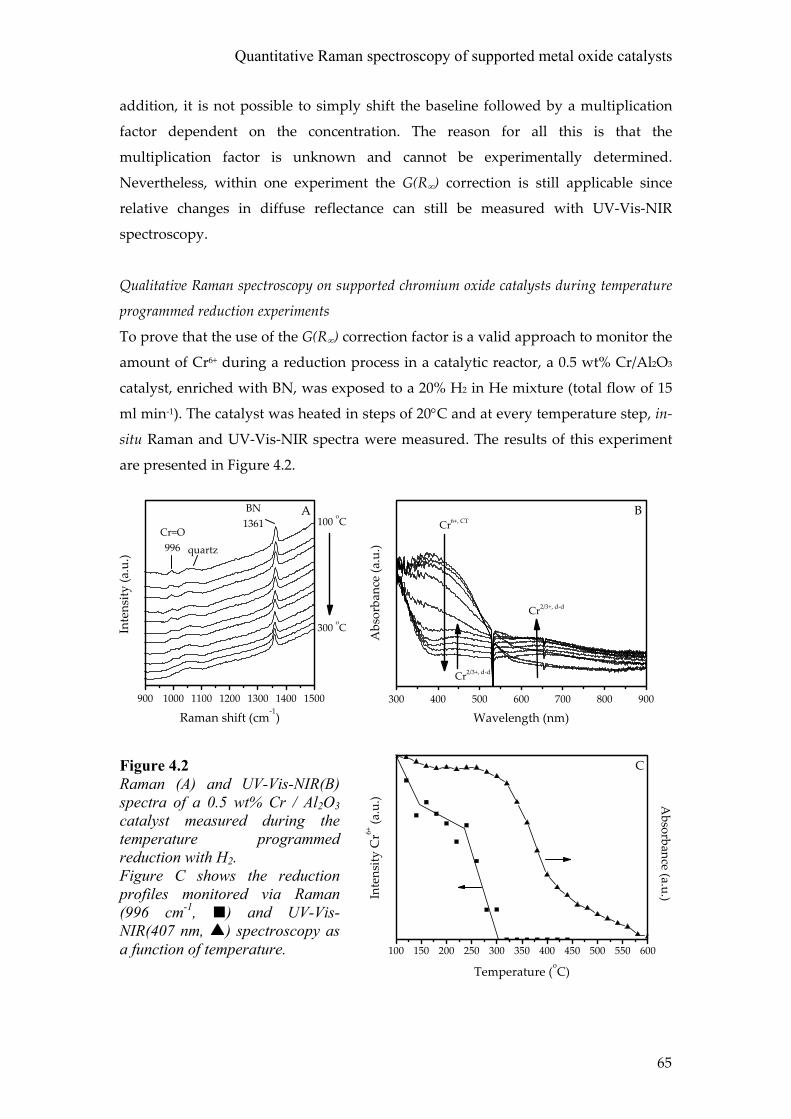
Quantitative Raman spectroscopy of supported metal oxide catalysts
65
addition, it is not possible to simply shift the baseline followed by a multiplication
factor dependent on the concentration. The reason for all this is that the
multiplication factor is unknown and cannot be experimentally determined.
Nevertheless, within one experiment the G(R∞) correction is still applicable since
relative changes in diffuse reflectance can still be measured with UV-Vis-NIR
spectroscopy.
Qualitative Raman spectroscopy on supported chromium oxide catalysts during temperature
programmed reduction experiments
To prove that the use of the G(R∞) correction factor is a valid approach to monitor the
amount of Cr6+ during a reduction process in a catalytic reactor, a 0.5 wt% Cr/Al2O3
catalyst, enriched with BN, was exposed to a 20% H2 in He mixture (total flow of 15
ml min-1). The catalyst was heated in steps of 20°C and at every temperature step, in-
situ Raman and UV-Vis-NIR spectra were measured. The results of this experiment
are presented in Figure 4.2.
900 1000 1100 1200 1300 1400 1500
100 oCCr=O996
300 oCInte
nsity
(a.u
.)
Raman shift (cm-1)
BN1361
quartz
A
300 400 500 600 700 800 900
Cr6+, CT
Cr2/3+, d-d
Cr2/3+, d-d
Abs
orba
nce
(a.u
.)
Wavelength (nm)
B
Figure 4.2 Raman (A) and UV-Vis-NIR(B) spectra of a 0.5 wt% Cr / Al2O3 catalyst measured during the temperature programmed reduction with H2. Figure C shows the reduction profiles monitored via Raman (996 cm-1, ) and UV-Vis-NIR(407 nm, ) spectroscopy as a function of temperature. 100 150 200 250 300 350 400 450 500 550 600
Inte
nsity
Cr6+
(a.u
.)
Temperature (oC)
C
Absorbance (a.u.)
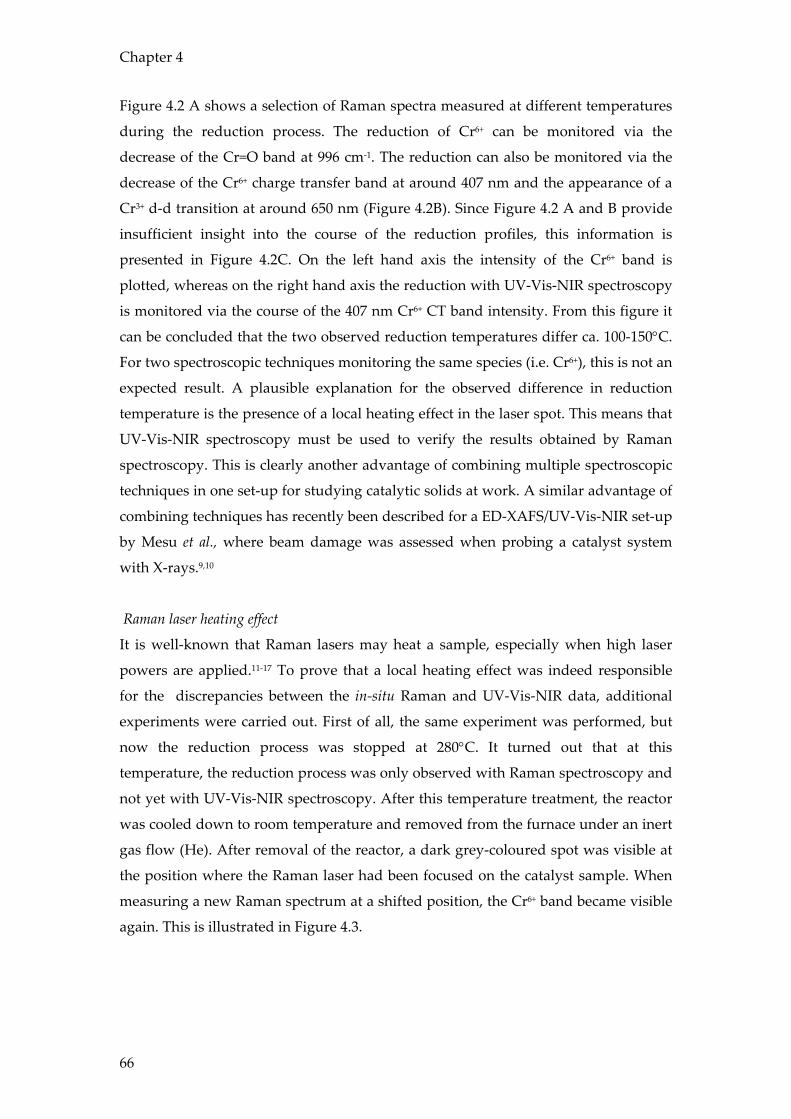
Chapter 4
66
Figure 4.2 A shows a selection of Raman spectra measured at different temperatures
during the reduction process. The reduction of Cr6+ can be monitored via the
decrease of the Cr=O band at 996 cm-1. The reduction can also be monitored via the
decrease of the Cr6+ charge transfer band at around 407 nm and the appearance of a
Cr3+ d-d transition at around 650 nm (Figure 4.2B). Since Figure 4.2 A and B provide
insufficient insight into the course of the reduction profiles, this information is
presented in Figure 4.2C. On the left hand axis the intensity of the Cr6+ band is
plotted, whereas on the right hand axis the reduction with UV-Vis-NIR spectroscopy
is monitored via the course of the 407 nm Cr6+ CT band intensity. From this figure it
can be concluded that the two observed reduction temperatures differ ca. 100-150°C.
For two spectroscopic techniques monitoring the same species (i.e. Cr6+), this is not an
expected result. A plausible explanation for the observed difference in reduction
temperature is the presence of a local heating effect in the laser spot. This means that
UV-Vis-NIR spectroscopy must be used to verify the results obtained by Raman
spectroscopy. This is clearly another advantage of combining multiple spectroscopic
techniques in one set-up for studying catalytic solids at work. A similar advantage of
combining techniques has recently been described for a ED-XAFS/UV-Vis-NIR set-up
by Mesu et al., where beam damage was assessed when probing a catalyst system
with X-rays.9,10
Raman laser heating effect
It is well-known that Raman lasers may heat a sample, especially when high laser
powers are applied.11-17 To prove that a local heating effect was indeed responsible
for the discrepancies between the in-situ Raman and UV-Vis-NIR data, additional
experiments were carried out. First of all, the same experiment was performed, but
now the reduction process was stopped at 280°C. It turned out that at this
temperature, the reduction process was only observed with Raman spectroscopy and
not yet with UV-Vis-NIR spectroscopy. After this temperature treatment, the reactor
was cooled down to room temperature and removed from the furnace under an inert
gas flow (He). After removal of the reactor, a dark grey-coloured spot was visible at
the position where the Raman laser had been focused on the catalyst sample. When
measuring a new Raman spectrum at a shifted position, the Cr6+ band became visible
again. This is illustrated in Figure 4.3.
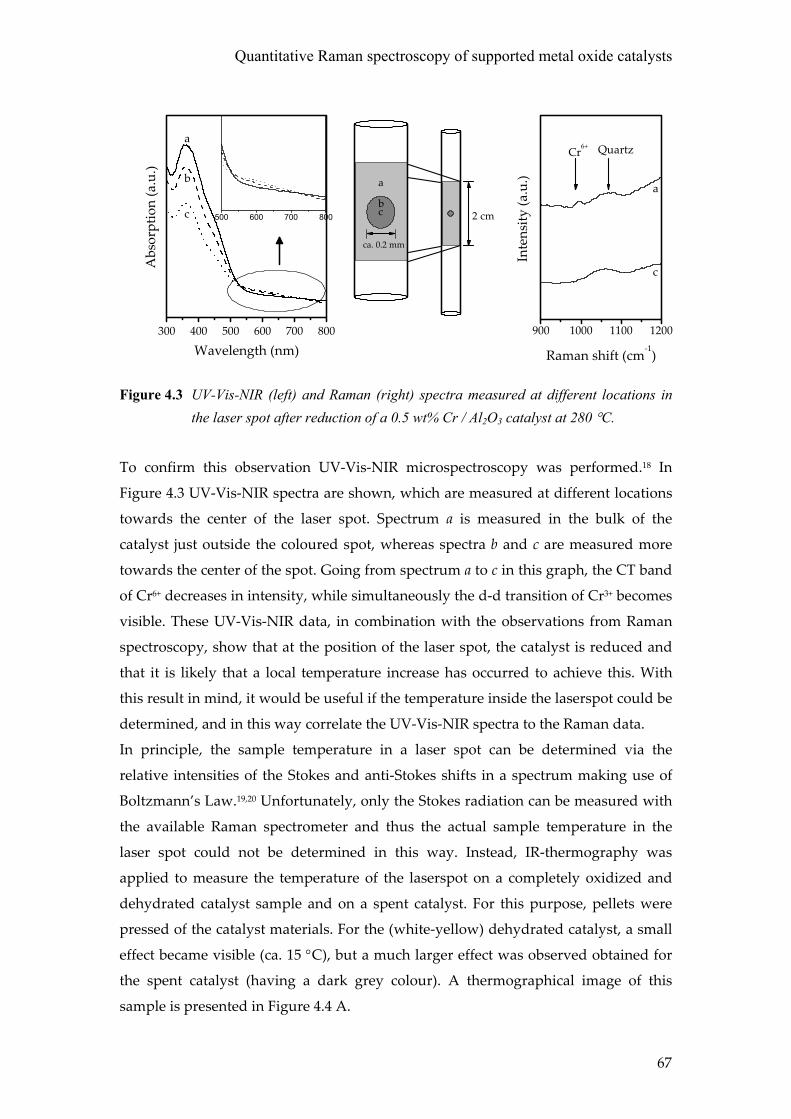
Quantitative Raman spectroscopy of supported metal oxide catalysts
67
300 400 500 600 700 800
500 600 700 800c
b
aA
bsor
ptio
n (a
.u.)
Wavelength (nm)
c
a
bc
ca. 0.2 mm
2 cm
Figure 4.3 UV-Vis-NIR (left) and Raman (right) spectra measured at different locations in
the laser spot after reduction of a 0.5 wt% Cr / Al2O3 catalyst at 280 °C.
To confirm this observation UV-Vis-NIR microspectroscopy was performed.18 In
Figure 4.3 UV-Vis-NIR spectra are shown, which are measured at different locations
towards the center of the laser spot. Spectrum a is measured in the bulk of the
catalyst just outside the coloured spot, whereas spectra b and c are measured more
towards the center of the spot. Going from spectrum a to c in this graph, the CT band
of Cr6+ decreases in intensity, while simultaneously the d-d transition of Cr3+ becomes
visible. These UV-Vis-NIR data, in combination with the observations from Raman
spectroscopy, show that at the position of the laser spot, the catalyst is reduced and
that it is likely that a local temperature increase has occurred to achieve this. With
this result in mind, it would be useful if the temperature inside the laserspot could be
determined, and in this way correlate the UV-Vis-NIR spectra to the Raman data.
In principle, the sample temperature in a laser spot can be determined via the
relative intensities of the Stokes and anti-Stokes shifts in a spectrum making use of
Boltzmann’s Law.19,20 Unfortunately, only the Stokes radiation can be measured with
the available Raman spectrometer and thus the actual sample temperature in the
laser spot could not be determined in this way. Instead, IR-thermography was
applied to measure the temperature of the laserspot on a completely oxidized and
dehydrated catalyst sample and on a spent catalyst. For this purpose, pellets were
pressed of the catalyst materials. For the (white-yellow) dehydrated catalyst, a small
effect became visible (ca. 15 °C), but a much larger effect was observed obtained for
the spent catalyst (having a dark grey colour). A thermographical image of this
sample is presented in Figure 4.4 A.
900 1000 1100 1200
Inte
nsity
(a.u
.)
Raman shift (cm-1)
a
c
Cr6+ Quartz
Chapter 4
68
Figure 4.4 A) IR-thermographic image of a catalyst pellet after exposure to propane for 90
min. B) Observed temperature at the catalytic surface when a 532 nm laser (50
mW) is focused at this material.
The bright spot in this image clearly shows that the Raman laser is heating the
catalyst sample locally, an effect which was already expected from the previous
experiments. Figure 4.4 B was obtained when analyzing the data along the diameter
of the laser spot, indicating that a local temperature increase of 70°C is possible.
Furthermore, extrapolating the slopes in these graphs, suggest that even larger
temperature effects (> 100°C) are not unlikely, in line with the data presented in
Figure 4.2 C.
Application of quantitative Raman spectroscopy during a series of temperature programmed
reduction cycles
It will be clear from the heat effect, observed during the temperature programmed
reduction experiments, that this complicates the application of the G(R∞) correction
factor. Recall that this factor corrects for the actual colour of the catalyst sample. In
the laser spot, the catalyst will be heated and reduced and the colour consequently
will change. However, simultaneously measured in-situ UV-Vis-NIR spectra do not
show a colour change, which is due to the lower temperature of the remaining part
of the catalyst material. Therefore, it is not possible to calculate the G(R∞) correction
factor directly. This problem can be overcome by ‘shifting’ the course of the
reduction of the Cr6+ band to lower temperatures, in order to let this reduction
coincide with the observed reduction in Raman spectroscopy. In other words, shift
the UV-Vis-NIR spectra of Figure 4.2C to lower temperatures in such a way that the
heat effect is eliminated. After doing this, the G(R∞) correction can be applied. The
0 1 2 3 4 5 6 7 840
50
60
70
80
90
100
110
120
Tem
pera
ture
(o C)
Length (mm)
B105 100 97 93 88 83 78 71 64 56 46 35
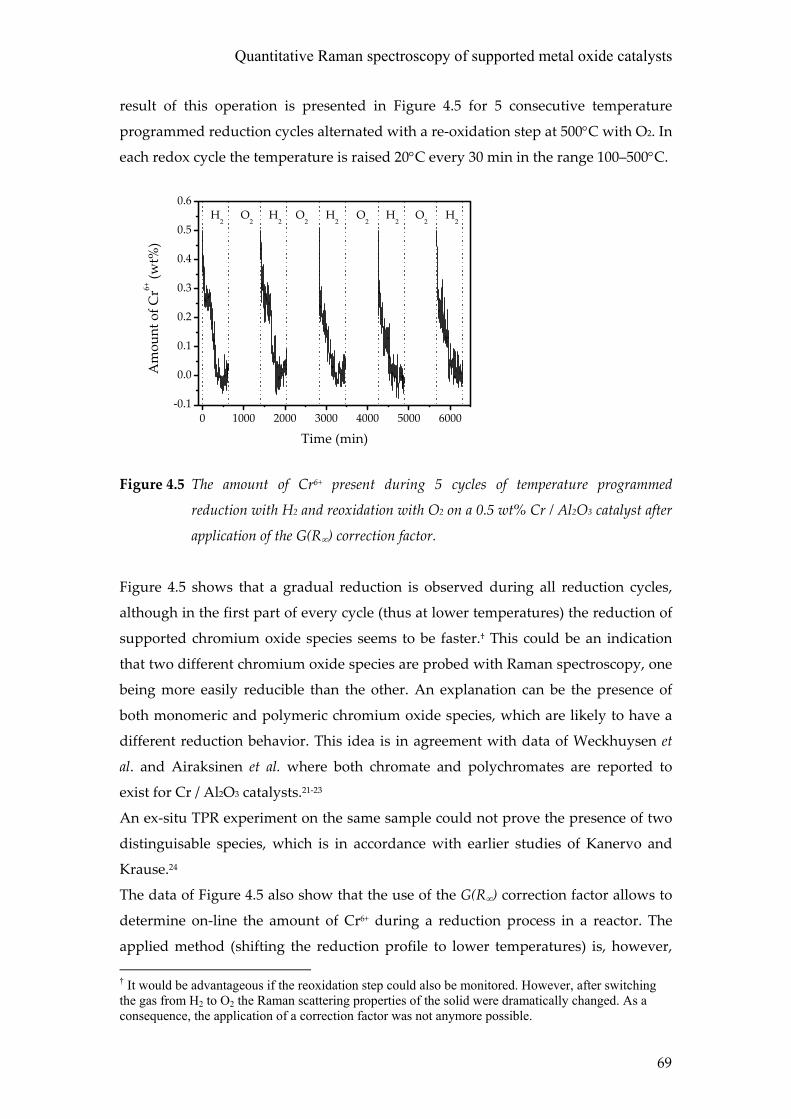
Quantitative Raman spectroscopy of supported metal oxide catalysts
69
result of this operation is presented in Figure 4.5 for 5 consecutive temperature
programmed reduction cycles alternated with a re-oxidation step at 500°C with O2. In
each redox cycle the temperature is raised 20°C every 30 min in the range 100–500°C.
0 1000 2000 3000 4000 5000 6000-0.1
0.0
0.1
0.2
0.3
0.4
0.5
0.6O
2
Am
ount
of C
r6+ (w
t%)
Time (min)
H2
O2
H2
O2
H2
O2
H2
H2
Figure 4.5 The amount of Cr6+ present during 5 cycles of temperature programmed
reduction with H2 and reoxidation with O2 on a 0.5 wt% Cr / Al2O3 catalyst after
application of the G(R∞) correction factor.
Figure 4.5 shows that a gradual reduction is observed during all reduction cycles,
although in the first part of every cycle (thus at lower temperatures) the reduction of
supported chromium oxide species seems to be faster.† This could be an indication
that two different chromium oxide species are probed with Raman spectroscopy, one
being more easily reducible than the other. An explanation can be the presence of
both monomeric and polymeric chromium oxide species, which are likely to have a
different reduction behavior. This idea is in agreement with data of Weckhuysen et
al. and Airaksinen et al. where both chromate and polychromates are reported to
exist for Cr / Al2O3 catalysts.21-23
An ex-situ TPR experiment on the same sample could not prove the presence of two
distinguisable species, which is in accordance with earlier studies of Kanervo and
Krause.24
The data of Figure 4.5 also show that the use of the G(R∞) correction factor allows to
determine on-line the amount of Cr6+ during a reduction process in a reactor. The
applied method (shifting the reduction profile to lower temperatures) is, however, † It would be advantageous if the reoxidation step could also be monitored. However, after switching the gas from H2 to O2 the Raman scattering properties of the solid were dramatically changed. As a consequence, the application of a correction factor was not anymore possible.
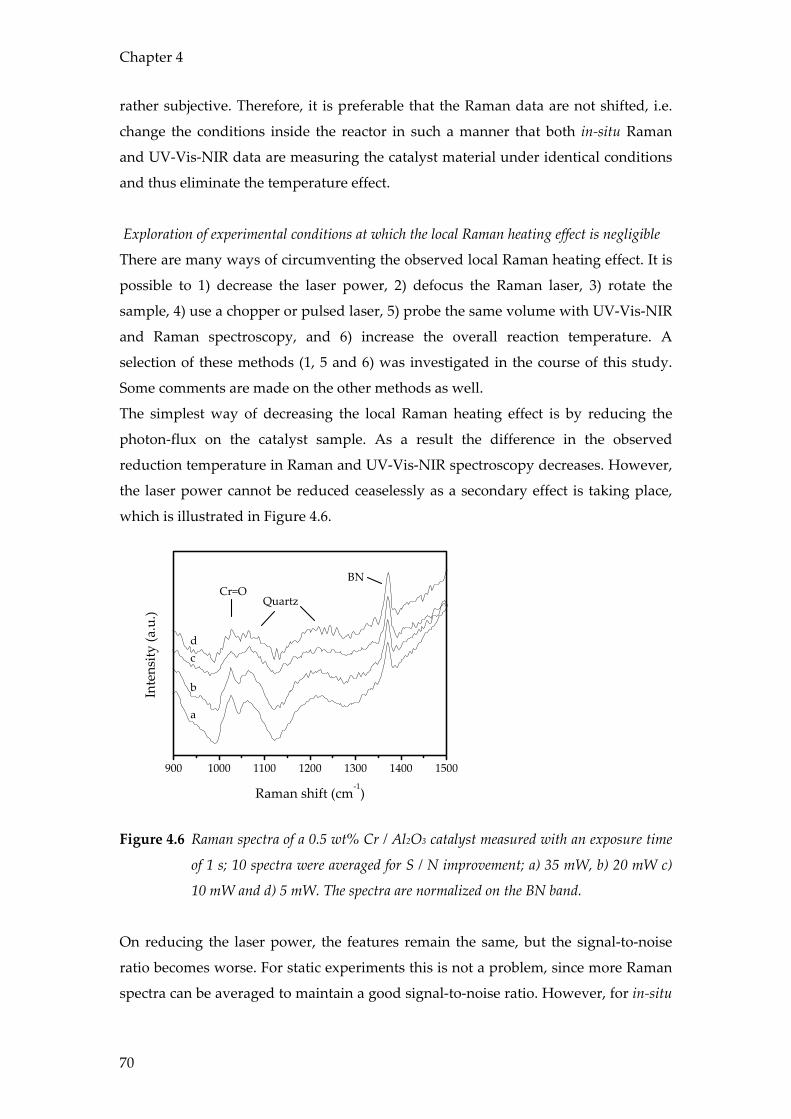
Chapter 4
70
rather subjective. Therefore, it is preferable that the Raman data are not shifted, i.e.
change the conditions inside the reactor in such a manner that both in-situ Raman
and UV-Vis-NIR data are measuring the catalyst material under identical conditions
and thus eliminate the temperature effect.
Exploration of experimental conditions at which the local Raman heating effect is negligible
There are many ways of circumventing the observed local Raman heating effect. It is
possible to 1) decrease the laser power, 2) defocus the Raman laser, 3) rotate the
sample, 4) use a chopper or pulsed laser, 5) probe the same volume with UV-Vis-NIR
and Raman spectroscopy, and 6) increase the overall reaction temperature. A
selection of these methods (1, 5 and 6) was investigated in the course of this study.
Some comments are made on the other methods as well.
The simplest way of decreasing the local Raman heating effect is by reducing the
photon-flux on the catalyst sample. As a result the difference in the observed
reduction temperature in Raman and UV-Vis-NIR spectroscopy decreases. However,
the laser power cannot be reduced ceaselessly as a secondary effect is taking place,
which is illustrated in Figure 4.6.
900 1000 1100 1200 1300 1400 1500
Inte
nsity
(a.u
.)
Raman shift (cm-1)
a
b
cd
QuartzCr=O
BN
Figure 4.6 Raman spectra of a 0.5 wt% Cr / Al2O3 catalyst measured with an exposure time
of 1 s; 10 spectra were averaged for S / N improvement; a) 35 mW, b) 20 mW c)
10 mW and d) 5 mW. The spectra are normalized on the BN band.
On reducing the laser power, the features remain the same, but the signal-to-noise
ratio becomes worse. For static experiments this is not a problem, since more Raman
spectra can be averaged to maintain a good signal-to-noise ratio. However, for in-situ
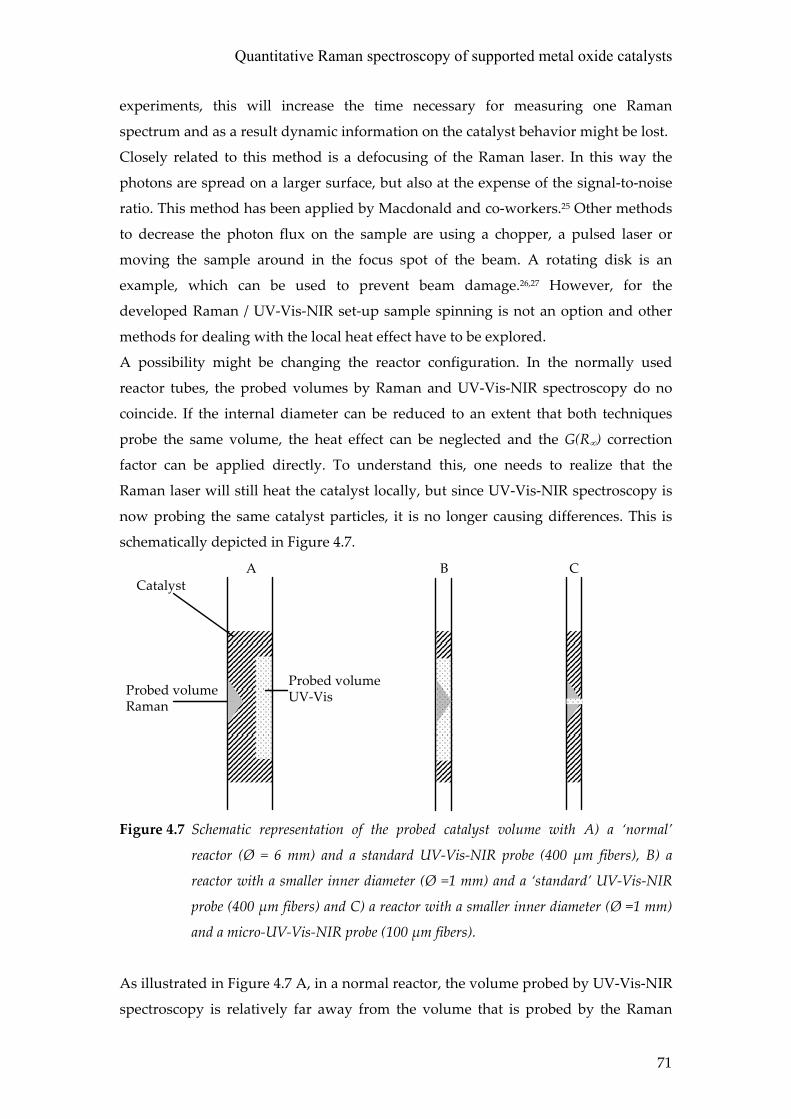
Quantitative Raman spectroscopy of supported metal oxide catalysts
71
experiments, this will increase the time necessary for measuring one Raman
spectrum and as a result dynamic information on the catalyst behavior might be lost.
Closely related to this method is a defocusing of the Raman laser. In this way the
photons are spread on a larger surface, but also at the expense of the signal-to-noise
ratio. This method has been applied by Macdonald and co-workers.25 Other methods
to decrease the photon flux on the sample are using a chopper, a pulsed laser or
moving the sample around in the focus spot of the beam. A rotating disk is an
example, which can be used to prevent beam damage.26,27 However, for the
developed Raman / UV-Vis-NIR set-up sample spinning is not an option and other
methods for dealing with the local heat effect have to be explored.
A possibility might be changing the reactor configuration. In the normally used
reactor tubes, the probed volumes by Raman and UV-Vis-NIR spectroscopy do no
coincide. If the internal diameter can be reduced to an extent that both techniques
probe the same volume, the heat effect can be neglected and the G(R∞) correction
factor can be applied directly. To understand this, one needs to realize that the
Raman laser will still heat the catalyst locally, but since UV-Vis-NIR spectroscopy is
now probing the same catalyst particles, it is no longer causing differences. This is
schematically depicted in Figure 4.7.
Probed volume Raman
Catalyst
Probed volume UV-Vis
A B C
Figure 4.7 Schematic representation of the probed catalyst volume with A) a ‘normal’
reactor (Ø = 6 mm) and a standard UV-Vis-NIR probe (400 µm fibers), B) a
reactor with a smaller inner diameter (Ø =1 mm) and a ‘standard’ UV-Vis-NIR
probe (400 µm fibers) and C) a reactor with a smaller inner diameter (Ø =1 mm)
and a micro-UV-Vis-NIR probe (100 µm fibers).
As illustrated in Figure 4.7 A, in a normal reactor, the volume probed by UV-Vis-NIR
spectroscopy is relatively far away from the volume that is probed by the Raman
Chapter 4
72
spectrometer. Since the heat effect of the Raman laser is very local a temperature
effect will not be detected with UV-Vis-NIR spectroscopy at the opposite side of the
reactor. If the inner diameter of the reactor is reduced, as in Figure 4.7B, the situation
changes. The small volume probed by Raman spectroscopy is now overlapping with
the sample volume probed by UV-Vis-NIR spectroscopy. However, only a very small
portion of the volume probed with UV-Vis-NIR consists of reduced chromium oxide
species and therefore the reduction will still be difficult te detect. Instead, if the
probed volume is more or less the same for both spectroscopic techniques, the
reduction, caused by the laser might be observable with UV-Vis-NIR spectroscopy
(Figure 4.7 C).
Unfortunately, an investigation using a reactor with an internal diameter of 1 mm
and a micro-UV-Vis-NIR probe28 showed that the difference in observed reduction
temperature is still present and close to 100°C. This observation can be explained by
the limited penetration depth of the laser which makes that the volumes probed by
Raman and UV-Vis-NIR spectroscopy are not identical. Since solid phase Raman
spectroscopy is merely a surface technique, this would require a reactor with an
inner diameter in the order of microns, but such reactor tube would easily be
plugged. This means that, although it is theoretically possible to create a reactor in
which the temperature effect is minimized, this reactor tube could never be used for
in-situ experiments in a practical manner.
Finally, circumventing the local heating effect was studied by changing the reaction
conditions. Since it is shown that it is necessary to get a homogeneous temperature
distribution throughout the reactor tube, this means that the overall reaction
temperature must be increased. The influence of the temperature of the reactor on
the difference in observed reduction behavior was investigated by performing
isothermal reductions with hydrogen at different temperatures in the range 400-
500°C. The results of these experiments are given in Figure 4.8.
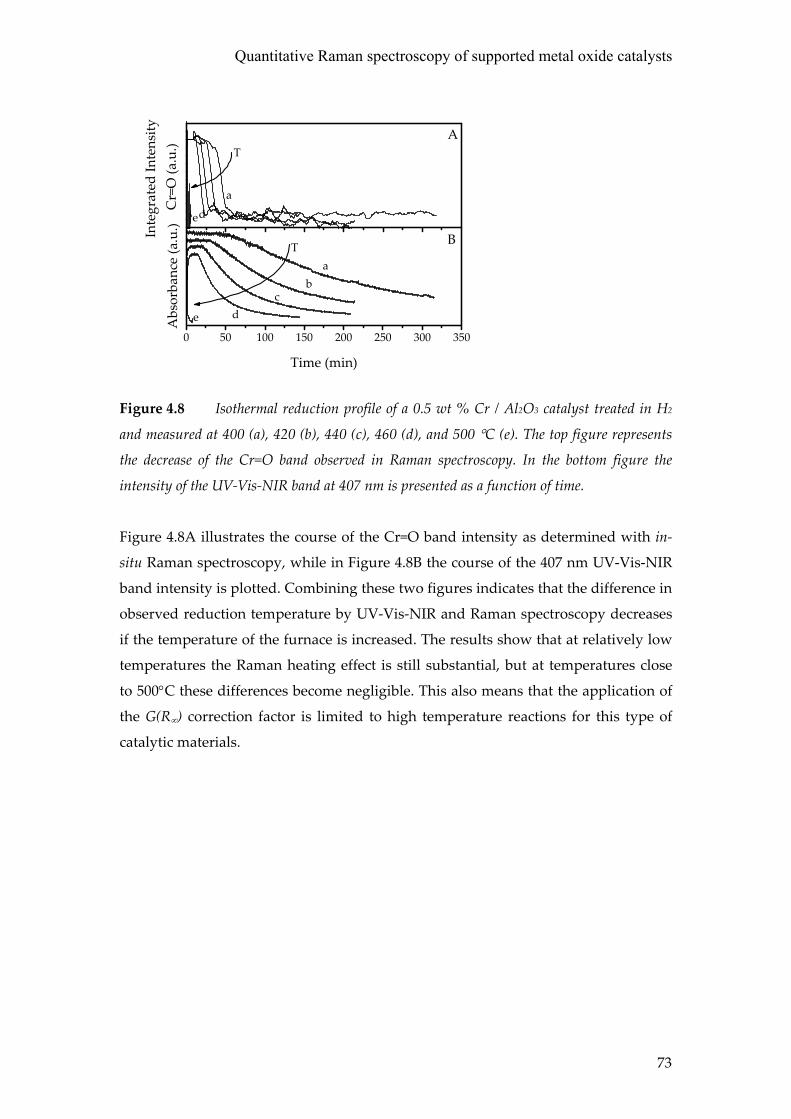
Quantitative Raman spectroscopy of supported metal oxide catalysts
73
0 50 100 150 200 250 300 350
e dc
b
T
Abs
orba
nce
(a.u
.)
Time (min)
a
B
A
ed
a
Inte
grat
ed In
tens
ity
Cr=
O (a
.u.) T
Figure 4.8 Isothermal reduction profile of a 0.5 wt % Cr / Al2O3 catalyst treated in H2
and measured at 400 (a), 420 (b), 440 (c), 460 (d), and 500 °C (e). The top figure represents
the decrease of the Cr=O band observed in Raman spectroscopy. In the bottom figure the
intensity of the UV-Vis-NIR band at 407 nm is presented as a function of time.
Figure 4.8A illustrates the course of the Cr=O band intensity as determined with in-
situ Raman spectroscopy, while in Figure 4.8B the course of the 407 nm UV-Vis-NIR
band intensity is plotted. Combining these two figures indicates that the difference in
observed reduction temperature by UV-Vis-NIR and Raman spectroscopy decreases
if the temperature of the furnace is increased. The results show that at relatively low
temperatures the Raman heating effect is still substantial, but at temperatures close
to 500°C these differences become negligible. This also means that the application of
the G(R∞) correction factor is limited to high temperature reactions for this type of
catalytic materials.
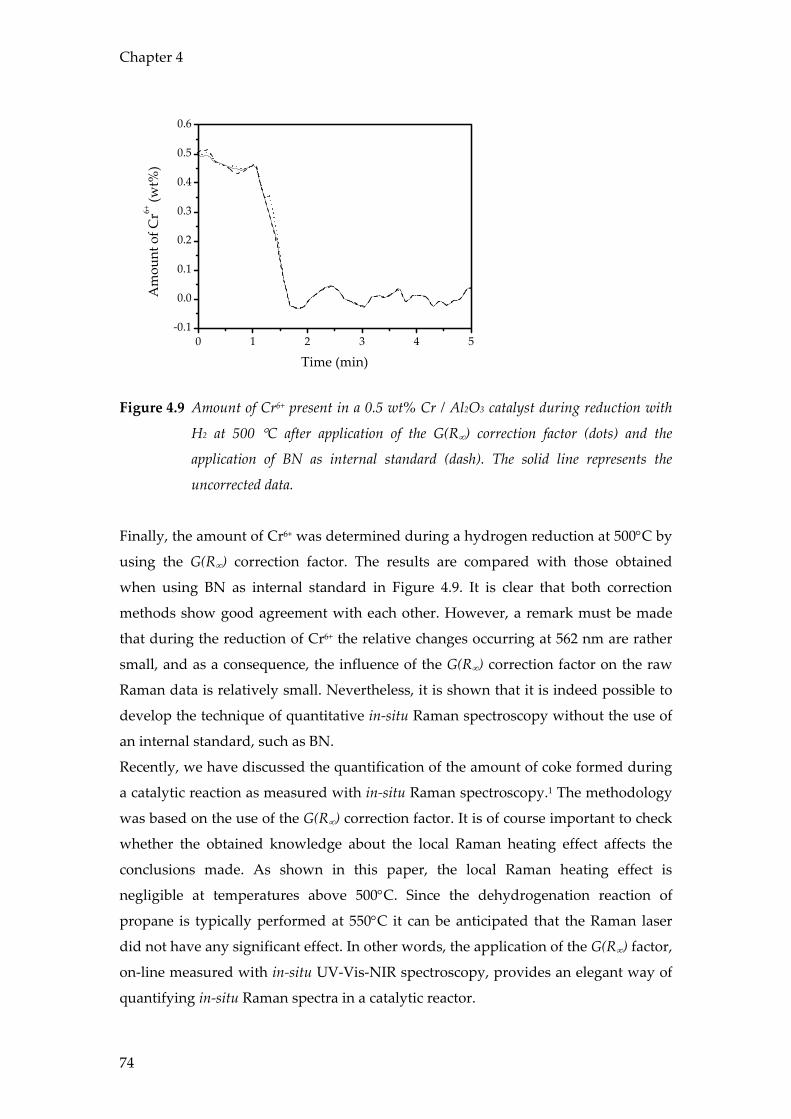
Chapter 4
74
0 1 2 3 4 5-0.1
0.0
0.1
0.2
0.3
0.4
0.5
0.6
Am
ount
of C
r6+ (w
t%)
Time (min)
Figure 4.9 Amount of Cr6+ present in a 0.5 wt% Cr / Al2O3 catalyst during reduction with
H2 at 500 °C after application of the G(R∞) correction factor (dots) and the
application of BN as internal standard (dash). The solid line represents the
uncorrected data.
Finally, the amount of Cr6+ was determined during a hydrogen reduction at 500°C by
using the G(R∞) correction factor. The results are compared with those obtained
when using BN as internal standard in Figure 4.9. It is clear that both correction
methods show good agreement with each other. However, a remark must be made
that during the reduction of Cr6+ the relative changes occurring at 562 nm are rather
small, and as a consequence, the influence of the G(R∞) correction factor on the raw
Raman data is relatively small. Nevertheless, it is shown that it is indeed possible to
develop the technique of quantitative in-situ Raman spectroscopy without the use of
an internal standard, such as BN.
Recently, we have discussed the quantification of the amount of coke formed during
a catalytic reaction as measured with in-situ Raman spectroscopy.1 The methodology
was based on the use of the G(R∞) correction factor. It is of course important to check
whether the obtained knowledge about the local Raman heating effect affects the
conclusions made. As shown in this paper, the local Raman heating effect is
negligible at temperatures above 500°C. Since the dehydrogenation reaction of
propane is typically performed at 550°C it can be anticipated that the Raman laser
did not have any significant effect. In other words, the application of the G(R∞) factor,
on-line measured with in-situ UV-Vis-NIR spectroscopy, provides an elegant way of
quantifying in-situ Raman spectra in a catalytic reactor.
Quantitative Raman spectroscopy of supported metal oxide catalysts
75
Conclusions
It is shown that a combined in-situ Raman / UV-Vis-NIR set-up allows the on-line
monitoring of the redox process of a supported chromium oxide catalyst during a
series of temperature programmed reduction cycles. The UV-Vis-NIR spectra can be
used to quantify the Raman spectra by performing a G(R∞) correction with an
uncertainty of less than 10%. It is shown that this method is always applicable as
long as the temperature is homogeneously distributed throughout the reactor bed.
This is of great importance since a Raman laser is able to cause a local heating effect,
which in one of our experiments resulted in a difference in observed reduction
temperature of more than 100°C for both spectroscopic techniques. In other words, a
combined set-up allows with one technique (UV-Vis-NIR) to verify the results
obtained with another technique (Raman).
Furthermore, it is shown that circumventing this local Raman heating effect is far
from trivial as is often assumed. Reducing the laser power results in a reduced
sample heating, but at the expense of the signal-to-noise ratio. If the observed
reaction processes are slow, this is not really a problem. However, with fast reaction
processes taking place in a reactor, one might loose important information. Changing
the cell design is only useful if the same sample volume can be probed by both
spectroscopic techniques. In heterogeneous catalysis, this method is generally
inapplicable since the required inner diameter of the reactor would cause severe
reactor plugging. Increasing the overall reaction temperature clearly reduces the
Raman heating effect, but limits the applicability of the experimental set-up to high-
temperature catalytic reactions. It is shown that for the systems under investigation
the heat effect becomes negligible when the reactor temperature is close to 500°C.
Nevertheless, carefully selecting the reaction parameters makes it possible to use in-
situ Raman spectroscopy in a quantitative manner making use of the G(R∞) correction
factor.
Acknowledgements
Dr. P. Brémond (CEDIP Infrared Systems) and P. van Riel (L-A-P Specialty Products
& Services) are kindly acknowledged for their contribution to the IR-thermography
experiments.
Chapter 4
76
References 1. Tinnemans, S. J.; Kox, M. H. F.; Nijhuis, T. A.; Visser, T.; Weckhuysen, B. M., Phys. Chem.
Chem. Phys., 2005, 7, 211.
2. Nijhuis, T. A.; Tinnemans, S. J.; Visser, T.; Weckhuysen, B. M., Phys. Chem. Chem. Phys.,
2003, 5, 4361.
3. Nijhuis, T. A.; Tinnemans, S. J.; Visser, T.; Weckhuysen, B. M., Chem. Eng. Sci., 2004, 59,
5487.
4. Vuurman, M. A.; Hardcastle, F. D.; Wachs, I. E., J. Mol. Catal., 1993, 84, 193.
5. Vuurman, M. A.; Stufkens, D. J.; Oskam, A.; Moulijn, J. A.; Kapteijn, F., J. Mol. Catal., 1990,
60, 83.
6. Weckhuysen, B. M.; Wachs, I. E.; Schoonheydt, R. A., Chem. Rev., 1996, 96, 3327.
7. Weckhuysen, B. M.; Schoonheydt, R. A.; Jehng, J. M.; Wachs, I. E.; Cho, S. J.; Ryoo, R.;
Kijlstra, S.; Poels, E., J. Chem. Soc. Faraday Trans., 1995, 91, 3245.
8. Wu, Z.; Zhang, C.; Stair, P. C., Catal. Today, 2006, in press.
9. Mesu, J. G.; van der Eerden, A. M. J.; de Groot, F. M. F.; Weckhuysen, B. M., J. Phys. Chem.
B, 2005, 109, 4042.
10. Tinnemans, S. J.; Mesu, J. G.; Kervinen, K.; Visser, T.; Nijhuis, T. A.; Beale, A. M.; Keller,
D. E.; van der Eerden, A. M. J.; Weckhuysen, B. M., Catal. Today, 2006, 113, 3.
11. Bowie, B. T.; Chase, D. B.; Griffiths, P. R., Appl. Spectrosc., 2000, 54, 164A.
12. Everall, N. J.; Lumsdon, J.; Christopher, D. J., Carbon, 1991, 29, 133.
13. Johansson, J.; Pettersson, S.; Taylor, L. S., J. Pharm. Biom. Anal., 2002, 30, 1223.
14. Kagi, H.; Tsuchida, I.; Wakatsuki, M.; Takahashi, K.; Kamimura, N.; Iuchi, K.; Wada, H.,
Geochim. Cosmochim. Acta, 1994, 58, 3527.
15. Paolone, A.; Sacchetti, A.; Corridoni, T.; Postorino, P.; Cantelli, R.; Rousse, G.; Masquelier,
C., Solid State Ionics, 2004, 170, 135.
16. Schrader, B.; Hoffmann, A.; Keller, S., Spectrochim. acta. prt. A, 1991, 47, 1135.
17. Shebanova, O. N.; Lazor, P., J. Raman Spectrosc., 2003, 34, 845.
18. van de Water, L. G.; Bergwerff, J. A.; Nijhuis, T. A.; de Jong, K. P.; Weckhuysen, B. M., J.
Am. Chem. Soc., 2005, 127, 5024.
19. Long, D. A. Raman Spectroscopy; McGraw-Hill Inc.: Great Britain, 1977.
20. Kip, B. J.; Meier, R. J., Appl. Spectrosc., 1990, 44, 707.
21. Weckhuysen, B. M.; Verberckmoes, A. A.; Buttiens, A. L.; Schoonheydt, R. A., J. Phys.
Chem., 1994, 98, 579.
22. Weckhuysen, B. M.; De Ridder, L. M.; Schoonheydt, R. A., J. Phys. Chem., 1993, 97, 4756.
Quantitative Raman spectroscopy of supported metal oxide catalysts
77
23. Airaksinen, S. M. K.; Krause, A. O. I.; Sainio, J.; Lahtinen, J.; Chao, K. J.; Guerrero-Perez,
M. O.; Banares, M. A., Phys. Chem. Chem. Phys., 2003, 5, 4371.
24. Kanervo, J. M.; Krause, A. O. I., J. Catal., 2002, 207, 57.
25. Macdonald, A. M.; Vaughan, A. S.; Wyeth, P., J. Raman Spectrosc., 2005, 36, 185.
26. Kiefer, W.; Bernstein, H. J., Appl. Spectrosc., 1971, 25, 500.
27. Sloane, H. J.; Cook, R. B., Appl. Spectrosc., 1972, 26, 589.
28. Beale, A. M.; Van der Eerden, A. M. J.; Kervinen, K.; Newton, M. A.; Weckhuysen, B. M.,
Chem. Comm., 2005, 24, 3015.

Chapter 4
78
79
The role of coke on light alkane dehydrogenation reactions over supported
chromium oxide catalysts
Abstract
Research has been carried out on the role of coke in the catalytic dehydrogenation of
light alkanes. For this purpose, the formation of coke during the catalytic cycle has
been monitored as a function of time by two combined operando techniques, i.e.,
Raman / UV-Vis-NIR and EPR / UV-Vis-NIR spectroscopy. The results of both
methods are in good agreement. The Raman / UV-Vis-NIR set-up showed a
maximum in activity after ca. 35 min-on-stream. EPR spectroscopy could not confirm
this maximum due to inherent differences in reaction conditions. From independent
dehydrogenation experiments with 13C-ethane, it was found that the coke, formed on
the catalyst surface, is not involved in the dehydrogenation mechanism. However, by
combining the activity data with the simultaneously obtained spectroscopic
information, it is demonstrated that coke is important to facilitate propane
adsorption near the active chromium site.
Chapter 5
80
Introduction
In Chapters 2 and 3, it has been shown that the activity of a propane
dehydrogenation catalyst goes through a maximum after approximately 20 min-on-
stream, while the selectivity towards propene remains constant. When looking at the
catalyst with UV-Vis-NIR spectroscopy, Cr6+ is reduced in the first minutes of the
cycle and thereafter coke is formed on the surface. This is confirmed by Raman
spectroscopy. Combining this information indicates that coke plays an important role
in the reaction. This is supported by recent work of the group of Schlögl, in which it
is shown that carbon nanomaterials are active in the dehydrogenation of
ethylbenzene to styrene.1,2 However, the results of Chapters 2 and 3 can also be
explained by a mechanism, in which coke facilitates an enhanced propane adsorption
near the active site. A way to enlarge insight into the precise role of coke during
dehydrogenation is to combine spectroscopic information with activity data. Since
electron paramagnetic resonance (EPR) spectroscopy is capable of measuring both
paramagnetic chromium species and coke radicals3-17, it was decided to perform such
a study on the role of coke by means of operando EPR / UV-Vis-NIR spectroscopy in
parallel with the previously described combined Raman / UV-Vis-NIR method. Since
valuable additional information can be extracted from experiments with isotopic
labeled gasses, it was also decided to study the catalytic process using 13C containing
hydrocarbons and D2. With respect to isotopic labeling experiments, it is remarkable
to note that such labeling experiments have only been reported for unsupported
chromium oxide catalysts, namely Cr2O3.18,19
Experimental
Experiments were carried out in three different set-ups: 1) operando Raman / UV-Vis-
NIR , 2) operando EPR / UV-Vis-NIR set-up and 3) fixed bed.
Raman / UV-Vis-NIR
In the Raman / UV –Vis set-up, 300 mg of a 13 wt% Cr / Al2O3 catalyst was typically
placed in quartz reactor and heated at a rate of 10 °C min-1 to 550 °C in a 20 vol% O2
(Hoek Loos, 99.995%) in He (99.996%) flow. After heating, He was purged to remove
all O2 in the system and subsequently a 9 vol% propane (Hoek Loos, 99.92 %) stream
with a total flow of 22 ml min-1 was applied. All flows given are at standard
temperature and pressure. On-line gas analysis was performed using a Varian CP-
4900 Micro GC equipped with a Poraplot Q and a Molsieve 5A column and TCD
detectors. UV-Vis-NIR diffuse reflectance (DRS) spectra were measured using a DH-
The role of coke during light alkane dehydrogenation
81
2000 light source (Avantes) combined with an Avaspec 2048 CCD spectrometer
(Avantes) and a BI-FL400 high temperature resistant probe (Ocean Optics).20 Raman
spectra were recorded using a Kaiser RXN spectrometer equipped with a 532 nm
diode laser (output power of 60 mW). A 5.5” objective was used for beam focusing
and collection of the scattered radiation.21 The exposure time of the CCD detector
was 2 s, while 25 accumulations were averaged to obtain a reasonable signal to noise
ratio. Spectra were taken every 225 s. The intensities of the Raman bands were
determined using Thermo Galactic Grams AI v. 7.0 software.
EPR / UV-Vis-NIR
Operando EPR / UV-Vis-NIR was performed with a fixed-bed tubular quartz reactor
with an inner diameter of 3 mm, located within a double-wall quartz dewar. This
reactor was placed into the rectangular cavity of an ELEXSYS 500-10/12 EPR
spectrometer (Bruker). A preheated stream of nitrogen was used to heat the sample.
EPR spectra were recorded in X-band (ν = 9.28 GHz) using a microwave power of 15
mW, a modulation frequency of 100 kHz and a modulation amplitude of 0.5 mT. As
reference, the signal of 2,2-diphenyl-1-picrylhydracyl hydrate (DPPH) was used. UV-
Vis-NIR spectra were recorded with an AVASPEC spectrometer (Avantes) in
combination with a DH 2000 deuterium-halogen light source (Avantes). The probe is
a cylindrical quartz sensor (Optran UV 1500/1800 T, length 200 mm, diameter 1.5
mm, CeramOptec GmbH), which is focused on top of the reactor bed. More details
about this setup can be found in the literature.3,4 Experiments in this set-up were
carried out at 500 °C.†
Fixed bed
Experiments with labeled compounds were carried out in a tubular fixed bed quartz
reactor with an inner diameter of 7 mm. The temperature in the catalyst bed was
measured by a thermocouple contained in a quartz well (outer diameter of 3 mm),
which was placed directly under the catalyst bed. The same catalyst as described
above was pretreated by heating to 580 °C in a He stream and exposure to 20 vol% O2
in He for 30 min at 580 °C before flushing with He. Unless otherwise specified, the
reaction mixture was composed of 2 ml min-1 ethane and 20 ml min-1 He. Catalyst
regeneration was performed by exposure to a 20 vol% O2 in He stream for 30 min at
† Unfortunately, measuring in this set-up at higher temperatures was not possible. At 500 °C the dehydrogenation activity will be low. Nevertheless, the catalyst will show reduction behavior and coke will be formed on the surface due to cracking.
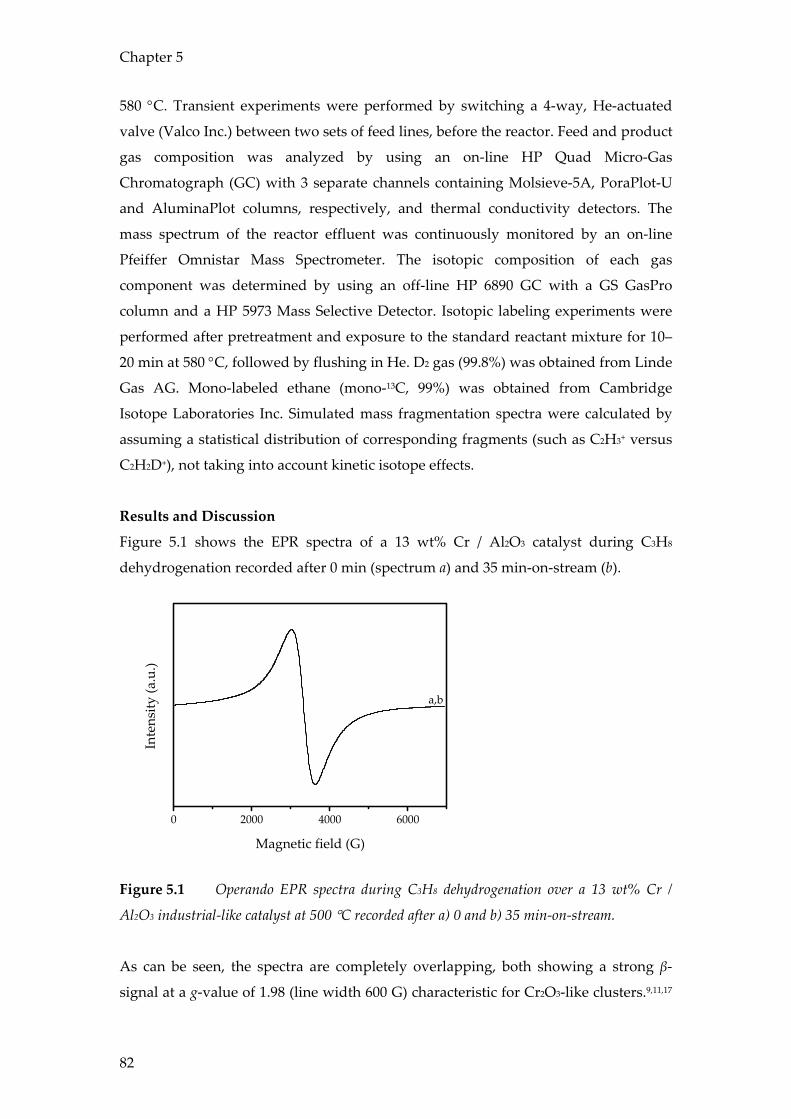
Chapter 5
82
580 °C. Transient experiments were performed by switching a 4-way, He-actuated
valve (Valco Inc.) between two sets of feed lines, before the reactor. Feed and product
gas composition was analyzed by using an on-line HP Quad Micro-Gas
Chromatograph (GC) with 3 separate channels containing Molsieve-5A, PoraPlot-U
and AluminaPlot columns, respectively, and thermal conductivity detectors. The
mass spectrum of the reactor effluent was continuously monitored by an on-line
Pfeiffer Omnistar Mass Spectrometer. The isotopic composition of each gas
component was determined by using an off-line HP 6890 GC with a GS GasPro
column and a HP 5973 Mass Selective Detector. Isotopic labeling experiments were
performed after pretreatment and exposure to the standard reactant mixture for 10–
20 min at 580 °C, followed by flushing in He. D2 gas (99.8%) was obtained from Linde
Gas AG. Mono-labeled ethane (mono-13C, 99%) was obtained from Cambridge
Isotope Laboratories Inc. Simulated mass fragmentation spectra were calculated by
assuming a statistical distribution of corresponding fragments (such as C2H3+ versus
C2H2D+), not taking into account kinetic isotope effects.
Results and Discussion
Figure 5.1 shows the EPR spectra of a 13 wt% Cr / Al2O3 catalyst during C3H8
dehydrogenation recorded after 0 min (spectrum a) and 35 min-on-stream (b).
0 2000 4000 6000
Inte
nsity
(a.u
.)
Magnetic field (G)
a,b
Figure 5.1 Operando EPR spectra during C3H8 dehydrogenation over a 13 wt% Cr /
Al2O3 industrial-like catalyst at 500 °C recorded after a) 0 and b) 35 min-on-stream.
As can be seen, the spectra are completely overlapping, both showing a strong β-
signal at a g-value of 1.98 (line width 600 G) characteristic for Cr2O3-like clusters.9,11,17
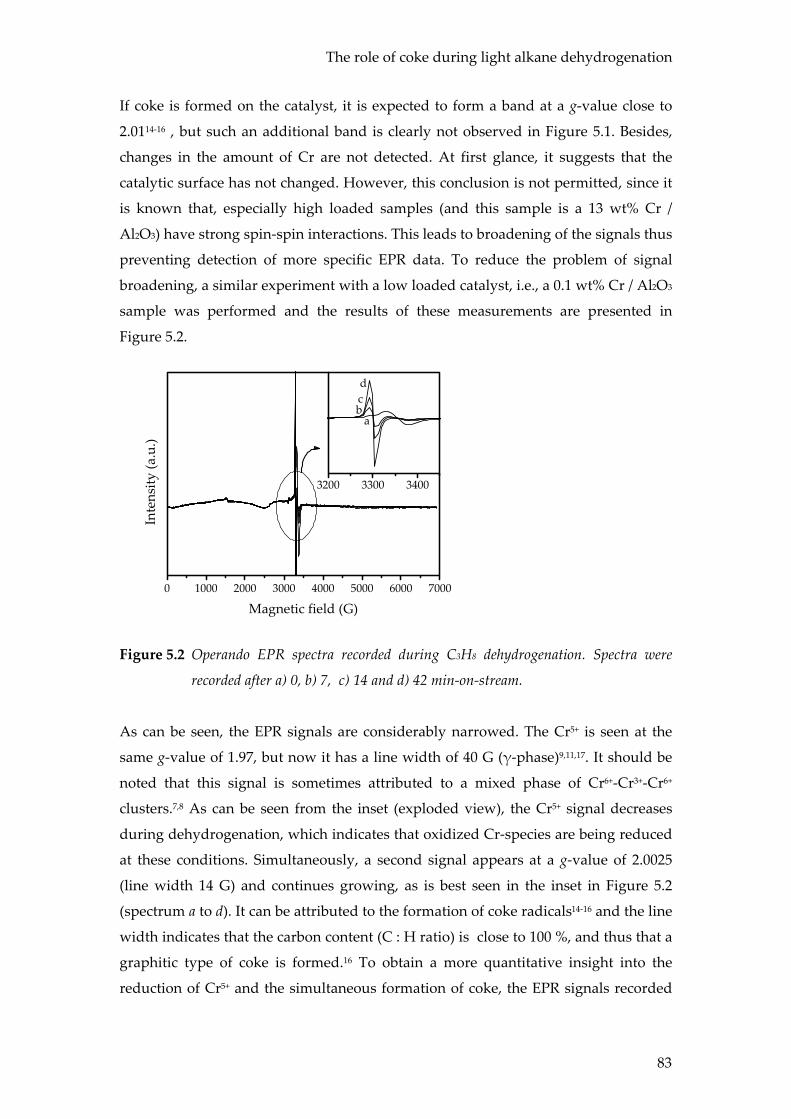
The role of coke during light alkane dehydrogenation
83
If coke is formed on the catalyst, it is expected to form a band at a g-value close to
2.0114-16 , but such an additional band is clearly not observed in Figure 5.1. Besides,
changes in the amount of Cr are not detected. At first glance, it suggests that the
catalytic surface has not changed. However, this conclusion is not permitted, since it
is known that, especially high loaded samples (and this sample is a 13 wt% Cr /
Al2O3) have strong spin-spin interactions. This leads to broadening of the signals thus
preventing detection of more specific EPR data. To reduce the problem of signal
broadening, a similar experiment with a low loaded catalyst, i.e., a 0.1 wt% Cr / Al2O3
sample was performed and the results of these measurements are presented in
Figure 5.2.
0 1000 2000 3000 4000 5000 6000 7000
3200 3300 3400
Inte
nsity
(a.u
.)
Magnetic field (G)
abcd
Figure 5.2 Operando EPR spectra recorded during C3H8 dehydrogenation. Spectra were
recorded after a) 0, b) 7, c) 14 and d) 42 min-on-stream.
As can be seen, the EPR signals are considerably narrowed. The Cr5+ is seen at the
same g-value of 1.97, but now it has a line width of 40 G (γ-phase)9,11,17. It should be
noted that this signal is sometimes attributed to a mixed phase of Cr6+-Cr3+-Cr6+
clusters.7,8 As can be seen from the inset (exploded view), the Cr5+ signal decreases
during dehydrogenation, which indicates that oxidized Cr-species are being reduced
at these conditions. Simultaneously, a second signal appears at a g-value of 2.0025
(line width 14 G) and continues growing, as is best seen in the inset in Figure 5.2
(spectrum a to d). It can be attributed to the formation of coke radicals14-16 and the line
width indicates that the carbon content (C : H ratio) is close to 100 %, and thus that a
graphitic type of coke is formed.16 To obtain a more quantitative insight into the
reduction of Cr5+ and the simultaneous formation of coke, the EPR signals recorded
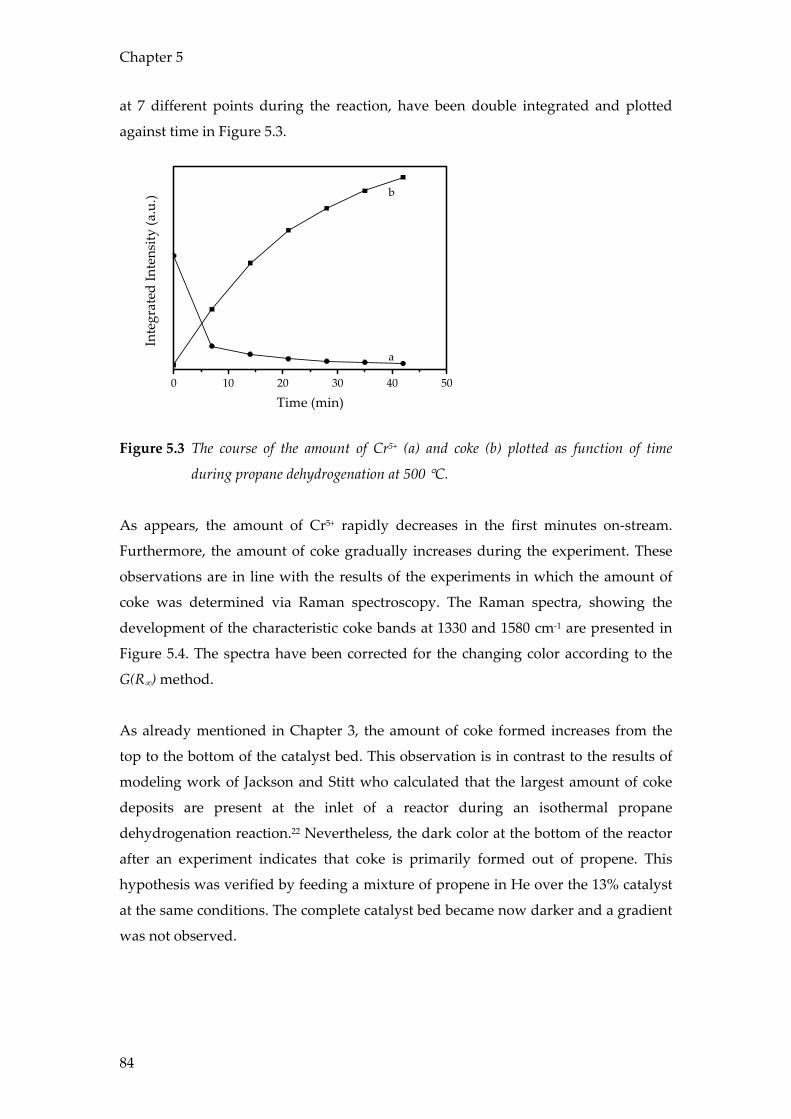
Chapter 5
84
at 7 different points during the reaction, have been double integrated and plotted
against time in Figure 5.3.
0 10 20 30 40 50
b
Inte
grat
ed In
tens
ity (a
.u.)
Time (min)
a
Figure 5.3 The course of the amount of Cr5+ (a) and coke (b) plotted as function of time
during propane dehydrogenation at 500 °C.
As appears, the amount of Cr5+ rapidly decreases in the first minutes on-stream.
Furthermore, the amount of coke gradually increases during the experiment. These
observations are in line with the results of the experiments in which the amount of
coke was determined via Raman spectroscopy. The Raman spectra, showing the
development of the characteristic coke bands at 1330 and 1580 cm-1 are presented in
Figure 5.4. The spectra have been corrected for the changing color according to the
G(R∞) method.
As already mentioned in Chapter 3, the amount of coke formed increases from the
top to the bottom of the catalyst bed. This observation is in contrast to the results of
modeling work of Jackson and Stitt who calculated that the largest amount of coke
deposits are present at the inlet of a reactor during an isothermal propane
dehydrogenation reaction.22 Nevertheless, the dark color at the bottom of the reactor
after an experiment indicates that coke is primarily formed out of propene. This
hypothesis was verified by feeding a mixture of propene in He over the 13% catalyst
at the same conditions. The complete catalyst bed became now darker and a gradient
was not observed.
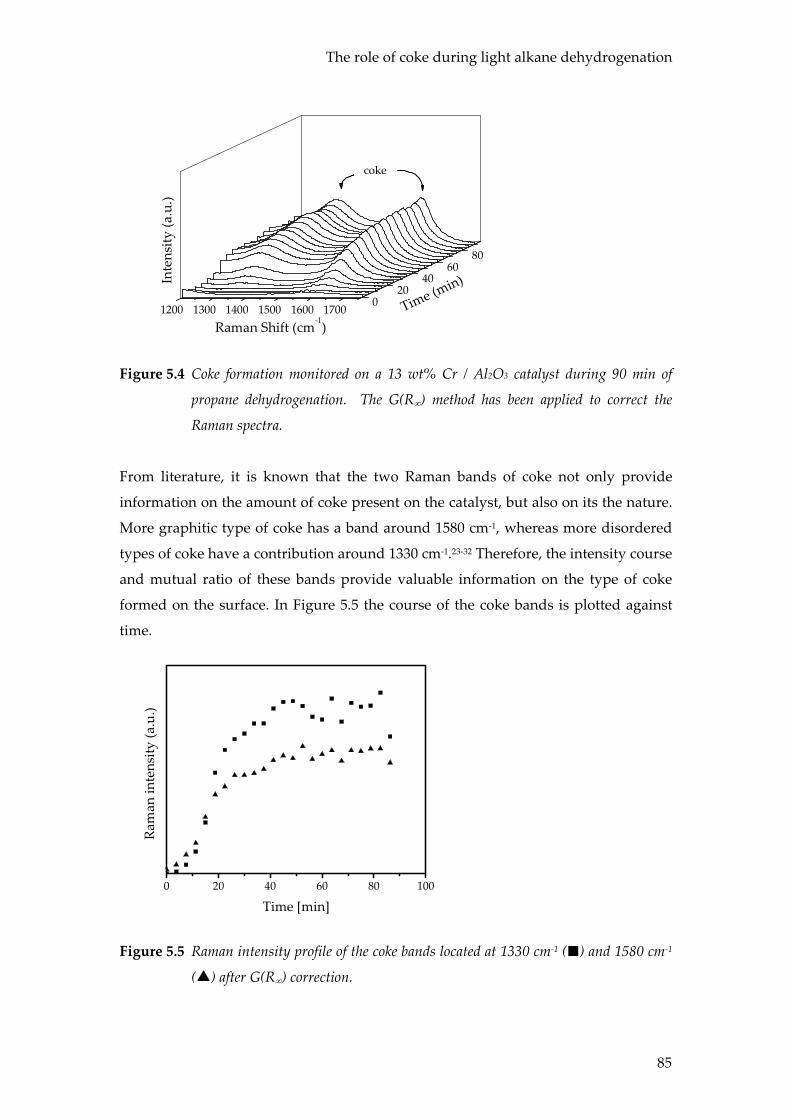
The role of coke during light alkane dehydrogenation
85
1700160015001400130012000
2040
6080
cokeIn
tens
ity (a
.u.)
Time (min)
Raman Shift (cm-1)
Figure 5.4 Coke formation monitored on a 13 wt% Cr / Al2O3 catalyst during 90 min of
propane dehydrogenation. The G(R∞) method has been applied to correct the
Raman spectra.
From literature, it is known that the two Raman bands of coke not only provide
information on the amount of coke present on the catalyst, but also on its the nature.
More graphitic type of coke has a band around 1580 cm-1, whereas more disordered
types of coke have a contribution around 1330 cm-1.23-32 Therefore, the intensity course
and mutual ratio of these bands provide valuable information on the type of coke
formed on the surface. In Figure 5.5 the course of the coke bands is plotted against
time.
0 20 40 60 80 100
Ram
an in
tens
ity (a
.u.)
Time [min]
Figure 5.5 Raman intensity profile of the coke bands located at 1330 cm-1 ( ) and 1580 cm-1
( ) after G(R∞) correction.
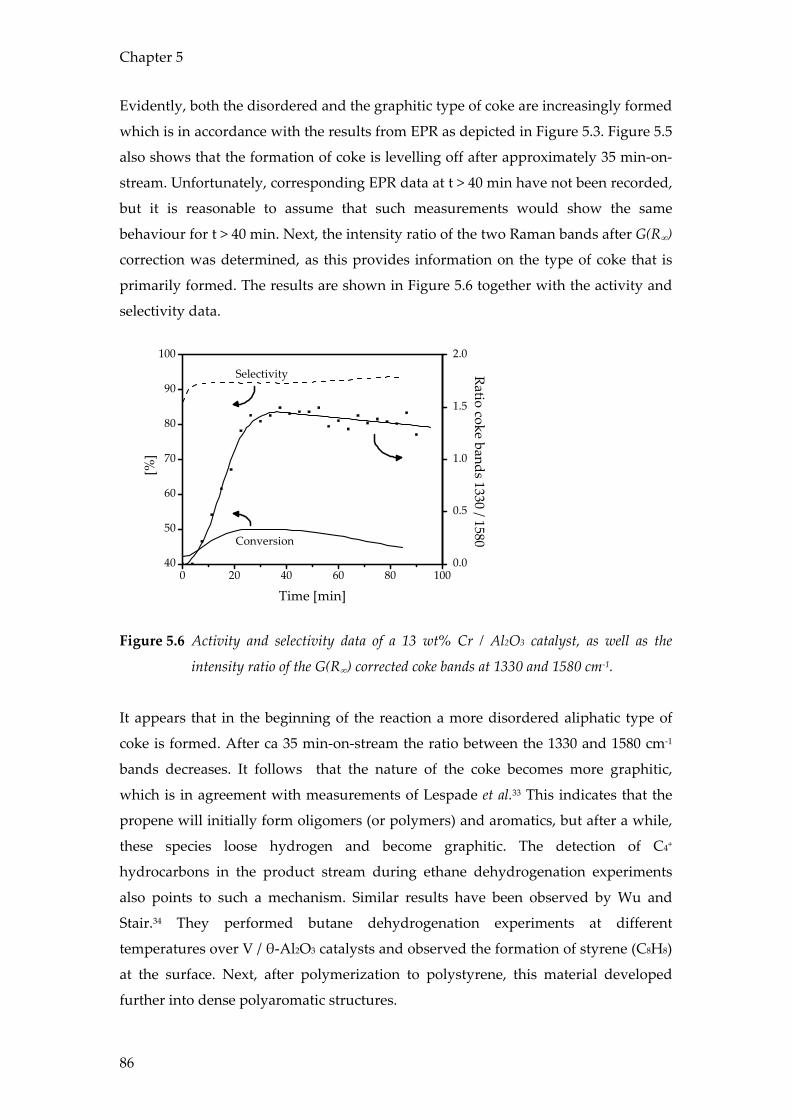
Chapter 5
86
Evidently, both the disordered and the graphitic type of coke are increasingly formed
which is in accordance with the results from EPR as depicted in Figure 5.3. Figure 5.5
also shows that the formation of coke is levelling off after approximately 35 min-on-
stream. Unfortunately, corresponding EPR data at t > 40 min have not been recorded,
but it is reasonable to assume that such measurements would show the same
behaviour for t > 40 min. Next, the intensity ratio of the two Raman bands after G(R∞)
correction was determined, as this provides information on the type of coke that is
primarily formed. The results are shown in Figure 5.6 together with the activity and
selectivity data.
0 20 40 60 80 10040
50
60
70
80
90
100
0.0
0.5
1.0
1.5
2.0
Selectivity
Conversion
Ratio coke bands 1330 / 1580
[%]
Time [min]
Figure 5.6 Activity and selectivity data of a 13 wt% Cr / Al2O3 catalyst, as well as the
intensity ratio of the G(R∞) corrected coke bands at 1330 and 1580 cm-1.
It appears that in the beginning of the reaction a more disordered aliphatic type of
coke is formed. After ca 35 min-on-stream the ratio between the 1330 and 1580 cm-1
bands decreases. It follows that the nature of the coke becomes more graphitic,
which is in agreement with measurements of Lespade et al.33 This indicates that the
propene will initially form oligomers (or polymers) and aromatics, but after a while,
these species loose hydrogen and become graphitic. The detection of C4+
hydrocarbons in the product stream during ethane dehydrogenation experiments
also points to such a mechanism. Similar results have been observed by Wu and
Stair.34 They performed butane dehydrogenation experiments at different
temperatures over V / θ-Al2O3 catalysts and observed the formation of styrene (C8H8)
at the surface. Next, after polymerization to polystyrene, this material developed
further into dense polyaromatic structures.
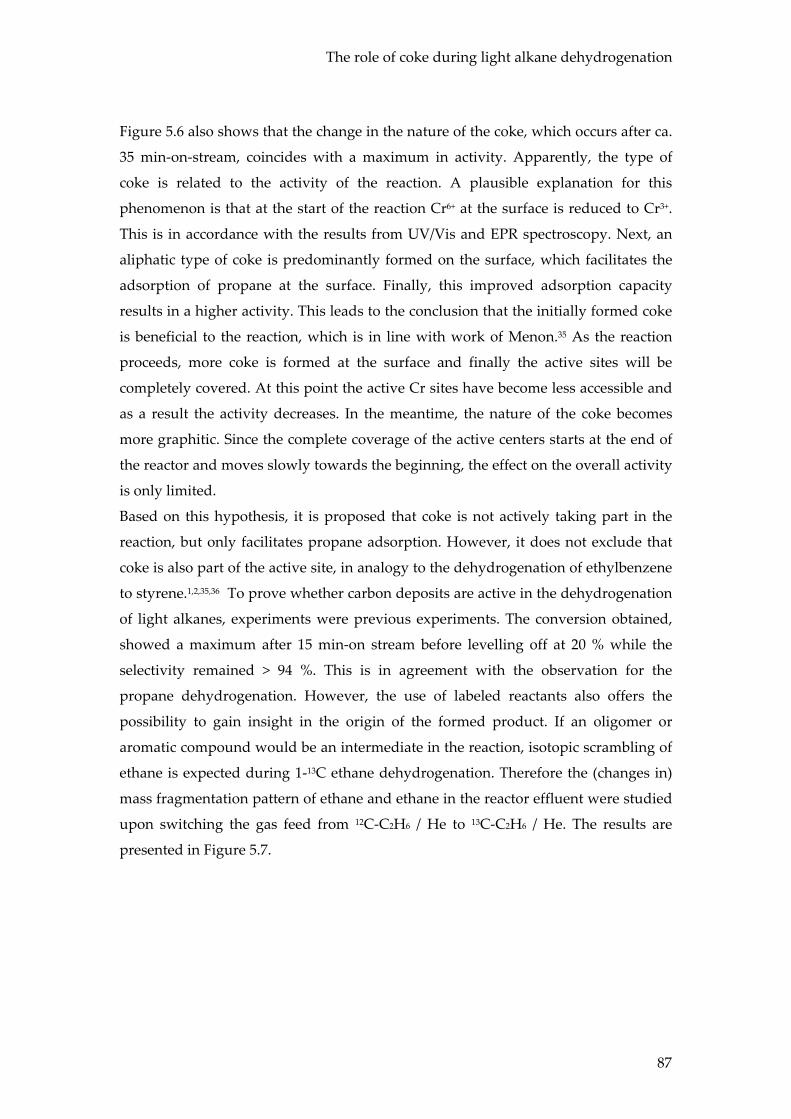
The role of coke during light alkane dehydrogenation
87
Figure 5.6 also shows that the change in the nature of the coke, which occurs after ca.
35 min-on-stream, coincides with a maximum in activity. Apparently, the type of
coke is related to the activity of the reaction. A plausible explanation for this
phenomenon is that at the start of the reaction Cr6+ at the surface is reduced to Cr3+.
This is in accordance with the results from UV/Vis and EPR spectroscopy. Next, an
aliphatic type of coke is predominantly formed on the surface, which facilitates the
adsorption of propane at the surface. Finally, this improved adsorption capacity
results in a higher activity. This leads to the conclusion that the initially formed coke
is beneficial to the reaction, which is in line with work of Menon.35 As the reaction
proceeds, more coke is formed at the surface and finally the active sites will be
completely covered. At this point the active Cr sites have become less accessible and
as a result the activity decreases. In the meantime, the nature of the coke becomes
more graphitic. Since the complete coverage of the active centers starts at the end of
the reactor and moves slowly towards the beginning, the effect on the overall activity
is only limited.
Based on this hypothesis, it is proposed that coke is not actively taking part in the
reaction, but only facilitates propane adsorption. However, it does not exclude that
coke is also part of the active site, in analogy to the dehydrogenation of ethylbenzene
to styrene.1,2,35,36 To prove whether carbon deposits are active in the dehydrogenation
of light alkanes, experiments were previous experiments. The conversion obtained,
showed a maximum after 15 min-on stream before levelling off at 20 % while the
selectivity remained > 94 %. This is in agreement with the observation for the
propane dehydrogenation. However, the use of labeled reactants also offers the
possibility to gain insight in the origin of the formed product. If an oligomer or
aromatic compound would be an intermediate in the reaction, isotopic scrambling of
ethane is expected during 1-13C ethane dehydrogenation. Therefore the (changes in)
mass fragmentation pattern of ethane and ethane in the reactor effluent were studied
upon switching the gas feed from 12C-C2H6 / He to 13C-C2H6 / He. The results are
presented in Figure 5.7.
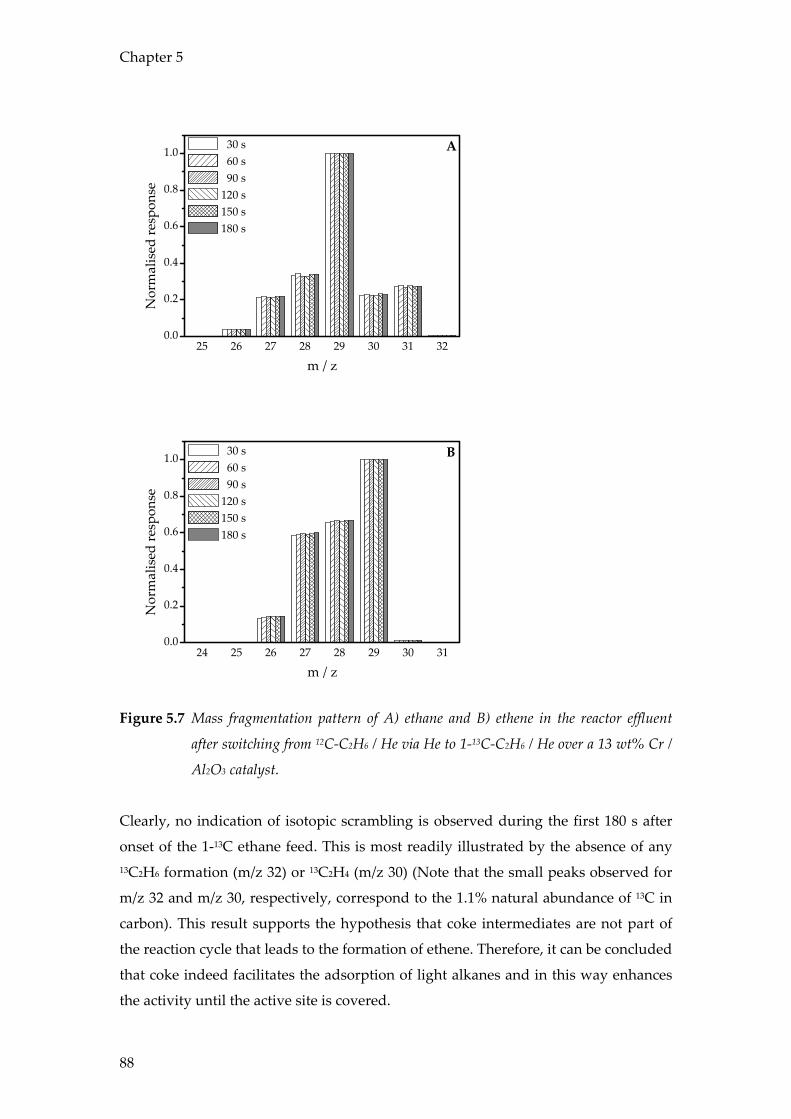
Chapter 5
88
25 26 27 28 29 30 31 320.0
0.2
0.4
0.6
0.8
1.0 A
Nor
mal
ised
resp
onse
m / z
30 s 60 s 90 s 120 s 150 s 180 s
24 25 26 27 28 29 30 310.0
0.2
0.4
0.6
0.8
1.0
Nor
mal
ised
resp
onse
m / z
30 s 60 s 90 s 120 s 150 s 180 s
B
Figure 5.7 Mass fragmentation pattern of A) ethane and B) ethene in the reactor effluent
after switching from 12C-C2H6 / He via He to 1-13C-C2H6 / He over a 13 wt% Cr /
Al2O3 catalyst.
Clearly, no indication of isotopic scrambling is observed during the first 180 s after
onset of the 1-13C ethane feed. This is most readily illustrated by the absence of any 13C2H6 formation (m/z 32) or 13C2H4 (m/z 30) (Note that the small peaks observed for
m/z 32 and m/z 30, respectively, correspond to the 1.1% natural abundance of 13C in
carbon). This result supports the hypothesis that coke intermediates are not part of
the reaction cycle that leads to the formation of ethene. Therefore, it can be concluded
that coke indeed facilitates the adsorption of light alkanes and in this way enhances
the activity until the active site is covered.
The role of coke during light alkane dehydrogenation
89
This conclusion is in agreement with literature, stating that the dehydrogenation is
initiated by physisorption of the alkane on coordinatively unsaturated Cr3+
centers.13,19,37 A C-H bond is subsequently activated and new O-H and Cr-Alkyl
bonds are formed. The alkene is then formed from a transfer of hydrogen from the
alkyl to the chromium. This reaction is thought to be the rate determining step in the
process. The reaction cycle is completed via the formation of H2 and a regeneration of
the Cr site. In a possible parallel mechanism, ethane coordinates to a hydrochromium
site, leading to the formation of a Cr-alkyl and H2. The cycle is completed via a β-H
transfer to the Cr and ethene desorption. These mechanisms, schematically depicted
in Figure 5.8, have recently been discussed by Lillehaug et al., who studied this
reaction via quantum chemical methods.38
Figure 5.8 Schematic reaction mechanism for the dehydrogenation of alkanes over a Cr /
Al2O3 catalyst.
To further confirm the reaction mechanism, experiments were carried out by feeding
both 12C ethane and D2 over the catalyst in a 2:1:20 ratio (C2H6:D2:He). The mass
fragmentation patterns of ethane and ethane, obtained for this reaction, are presented
in Figure 5.9 together with simulated data.
+C2H6
O
Cr
O
H
O
CH2
Cr
O O
CH2 OH
Cr
O O
H2O
H
-C2H4 -H2
-H2
+C2H6
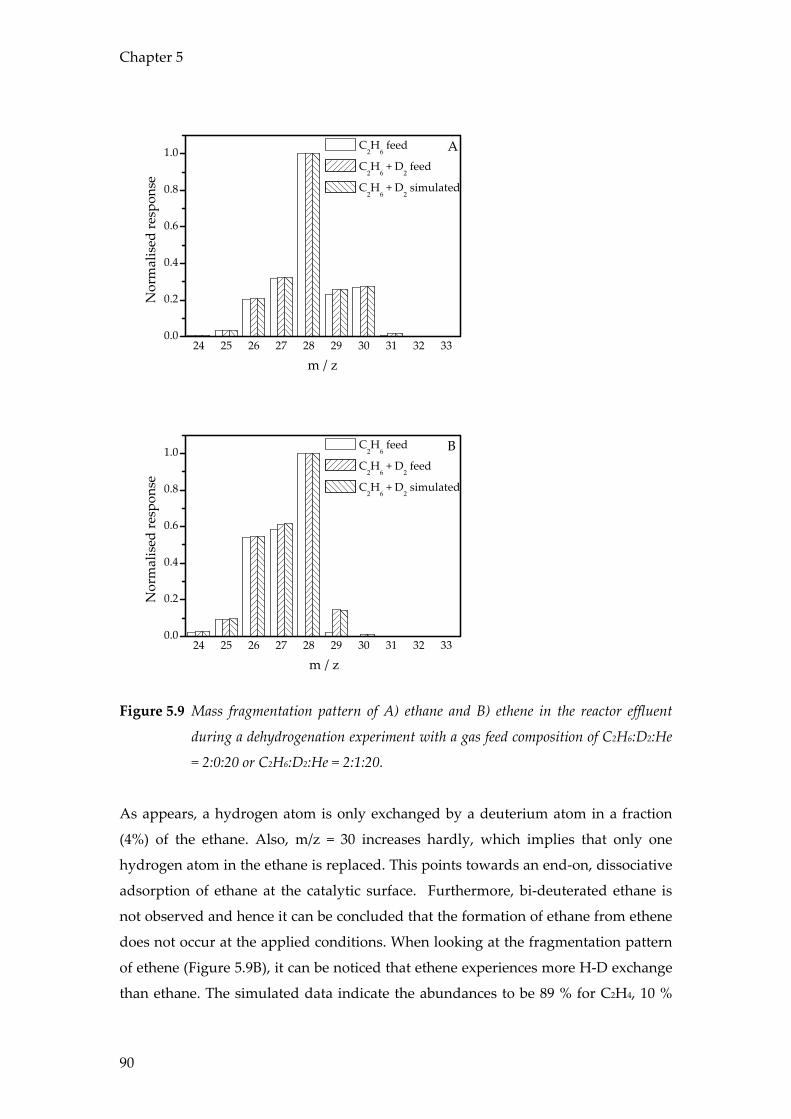
Chapter 5
90
24 25 26 27 28 29 30 31 32 330.0
0.2
0.4
0.6
0.8
1.0
Nor
mal
ised
resp
onse
m / z
C2H
6 feed
C2H
6 + D
2 feed
C2H
6 + D
2 simulated
A
24 25 26 27 28 29 30 31 32 330.0
0.2
0.4
0.6
0.8
1.0
Nor
mal
ised
resp
onse
m / z
C2H
6 feed
C2H
6 + D
2 feed
C2H
6 + D
2 simulated
B
Figure 5.9 Mass fragmentation pattern of A) ethane and B) ethene in the reactor effluent
during a dehydrogenation experiment with a gas feed composition of C2H6:D2:He
= 2:0:20 or C2H6:D2:He = 2:1:20.
As appears, a hydrogen atom is only exchanged by a deuterium atom in a fraction
(4%) of the ethane. Also, m/z = 30 increases hardly, which implies that only one
hydrogen atom in the ethane is replaced. This points towards an end-on, dissociative
adsorption of ethane at the catalytic surface. Furthermore, bi-deuterated ethane is
not observed and hence it can be concluded that the formation of ethane from ethene
does not occur at the applied conditions. When looking at the fragmentation pattern
of ethene (Figure 5.9B), it can be noticed that ethene experiences more H-D exchange
than ethane. The simulated data indicate the abundances to be 89 % for C2H4, 10 %
The role of coke during light alkane dehydrogenation
91
for C2H3D and 1 % for C2H2D2. This suggests that ethene can be easily adsorbed end-
on as an ethyl entity, either hydrogenating to ethane or dehydrogenating back to
ethene. Another explanation can be that ethene is deuterated, and subsequently
deprotonated on Bronsted-acid sites on the Al2O3 support, as has been observed by
Amenomiya.39 Finally, it must be noted that the overall dehydrogenation reaction is
an equilibrium reaction. It implies that, in case more H2 is added to the stream, the
equilibrium will shift towards the formation of ethane with an increase in the
amount of deuterated ethane as a result.
Conclusions
Operando EPR / UV-Vis-NIR spectroscopy performed in parallel to operando Raman /
UV-Vis-NIR is a valuable way to obtain more detailed insight into events that take
place during alkane dehydogenation over chromium oxide catalysts. The two-track
approach allows quantitative monitoring of the oxidative state of the chromium
species and the reduction and formation of coke as function of time. The results of
the partly complementary methods are highly consistent, but the EPR / UV-Vis-NIR
requires low loaded chromium catalysts to obtain useful data.
Isotopic labeling experiments show that ethane dehydrogenation proceeds via an
end-on, dissociative adsorption of ethane on a Cr3+–O active site at the catalyst
surface. This experimental finding confirms the results reported by Burwell et al. for
higher alkanes on Cr2O319 and the recent theoretical work of Lillehaug et al.38
Furthermore, it is concluded that coke deposits, formed during the activation, are not
actively involved in the ethane dehydrogenation cycle. The current view is that coke
facilitates propane adsorption in the initial stage of the catalytic process. Next, after
the activation period, coke covers the active Cr site and as a result the activity drops.
This is substantiated by the Raman spectroscopic data which demonstrate that the
type of coke evolves from a disordered aliphatic form to a more graphitic type.
Acknowledgements
Prof. Olsbye, A. Virnovskaia and Ø. Prytz are kindly acknowledged for performing
the measurements with labeled compounds. The Ph. D. grant of A.V. is financed by
Statoil through the VISTA program, contract no. 6446.
Chapter 5
92
References 1. Mestl, G.; Maksimova, N. I.; Keller, N.; Roddatis, V. V.; Schlögl, R., Angew. Chem. Int. Ed.,
2001, 40, 2066.
2. Keller, N.; Maksimova, N. I.; Roddatis, V. V.; Schur, M.; Mestl, G.; Butenko, Y. V.;
Kuznetsov, V. L.; Schlögl, R., Angew. Chem. Int. Edit., 2002, 41, 1885.
3. Bruckner, A., Phys. Chem. Chem. Phys., 2003, 5, 4461.
4. Bruckner, A.; Kondratenko, E., Catal. Today, 2006, in press.
5. Mentasty, L. R.; Gorriz, O. F.; Cadus, L. E., Ind. Eng. Chem. Res., 1999, 38, 396.
6. Cimino, A.; Cordischi, D.; Derossi, S.; Ferraris, G.; Gazzoli, D.; Indovina, V.; Occhiuzzi,
M.; Valigi, M., J. Catal., 1991, 127, 761.
7. Ellison, A.; Sing, K. S. W., J. Chem. Soc. Faraday Trans., 1978, 74, 2807.
8. Ellison, A.; Sing, K. S. W., J. Chem. Soc. Faraday Trans., 1978, 74, 2017.
9. Khaddar-Zine, S.; Ghorbel, A.; Naccache, C., J. Mol. Catal. A-Chem., 1999, 150, 223.
10. Yanez-Limon, J. M.; Perez-Roblez, J. F.; Gonzalez-Hernandez, J.; Zamorano-Ulloa, R.;
Ramirez-Rosales, D., Thin Solid Films, 2000, 373, 184.
11. Weckhuysen, B. M.; Wachs, I. E.; Schoonheydt, R. A., Chem. Rev., 1996, 96, 3327.
12. Weckhuysen, B. M.; Wachs, I. E.; Schoonheydt, R. A., Stud. Surf. Sci. Catal., 1994, 91, 151.
13. Weckhuysen, B. M.; Schoonheydt, R. A., Catal. Today, 1999, 51, 223.
14. Karge, H. G.; Lange, J.-P.; Gutsze, A.; Laniecki, M., J. Catal., 1988, 114, 114.
15. Li, C.; Takanohashi, T.; Saito, I., Energy and Fuels, 2002, 16, 1116.
16. Ingram, D., Third biennial carbon conference, 1957, 93.
17. OʹReilly, D. E.; Mac Iver, D. S., J. Phys. Chem., 1962, 66, 276.
18. Burwell, R. L.; L., H. G.; Taylor, K. C.; Read, J. F., Adv. Catal., 1969, 20, 1.
19. Burwell, R. L.; Littlewood, A. B.; Cardew, M.; Pass, G.; Stoddart, C. T. H., J. Am. Chem.
Soc., 1960, 82, 6272.
20. Nijhuis, T. A.; Tinnemans, S. J.; Visser, T.; Weckhuysen, B. M., Chem. Eng. Sci., 2004, 59,
5487.
21. Nijhuis, T. A.; Tinnemans, S. J.; Visser, T.; Weckhuysen, B. M., Phys. Chem. Chem. Phys.,
2003, 5, 4361.
22. Jackson, S. D.; Stitt, E. H., Curr. Top. Catal., 2002, 3, 245.
23. Ager, J. W.; Veirs, D. K.; Shamir, J.; Rosenblatt, G. M., J. Appl. Phys., 1990, 68, 3598.
24. Bowling, R. J.; Packard, R. T.; McCreery, R. L., J. Am. Chem. Soc., 1989, 111, 1217.
25. Katagiri, G.; Ishida, H.; Ishitani, A., Carbon, 1988, 26, 565.
26. Nakamizo, M.; Tamai, K., Carbon, 1984, 22, 197.
The role of coke during light alkane dehydrogenation
93
27. Escribano, R.; Sloan, J. J.; Siddique, N.; Sze, N.; Dudev, T., Vibr. Spectrosc., 2001, 26, 179.
28. Kong, F.; Kostecki, R.; Nadeau, G.; Song, X.; Zaghib, K.; Kinoshita, K.; McLarnon, F., J.
Power Sources, 2001, 97-8, 58.
29. Mertes, S.; Dippel, B.; Schwarzenbock, A., J. Aerosol Sci., 2004, 35, 347.
30. Wang, Y.; Alsmeyer, D. C.; McCreery, R. L., Chem. Mat., 1990, 2, 557.
31. Compagnini, G.; Puglisi, O.; Foti, G., Carbon, 1997, 35, 1793.
32. Sze, S. K.; Siddique, N.; Sloan, J. J.; Escribano, R., Atmos. Environ., 2001, 35, 561.
33. Lespade, P.; Marchand, A.; Couzi, M.; Cruege, F., Carbon, 1984, 22, 375.
34. Wu, Z.; Stair, P. C., J. Catal., 2006, 237, 220.
35. Menon, P. G., J. Mol. Catal., 1990, 59, 207.
36. Echigoya, E.; Sano, H.; Tanaka, M., 8th International Congress on Catalysis, Berlin,
1984,V623.
37. Derossi, S.; Ferraris, G.; Fremiotti, S.; Garrone, E.; Ghiotti, G.; Campa, M. C.; Indovina, V.,
J. Catal., 1994, 148, 36.
38. Lillehaug, S.; Borve, K. J.; Sierka, M.; Sauer, J. A., J. Phys. Org. Chem., 2004, 17, 990.
39. Amenomiya, Y., J. Catal., 1968, 12, 198.

Chapter 5
94

95
Summary and Concluding Remarks
Chapter 6
96
Spectroscopic techniques can provide characteristic information about a catalytic
material. These techniques can be applied at different stages of the catalyst lifetime,
for instance before and after deactivation and this results in valuable information.
However, information about the nature of the deactivation is not obtained and it
would be interesting to investigate a catalyst during a reaction, i.e. to perform
operando spectroscopy. The combination of different operando spectroscopic
techniques provides even more information as long as the applied techniques are
complementary. Therefore the aim of this work was to combine two complementary
spectroscopic techniques, namely Raman and UV-Vis-NIR, into one operando reaction
set-up. Raman spectroscopy provides vibrational information, whereas information
about electronic transitions can be gathered with UV-Vis-NIR. In Chapter 2 the
development of this combination is described. The developed set-up was tested for
the dehydrogenation of propane over a Cr / Al2O3 catalyst. Traditionally, propene is a
side product formed in ethylene steam crackers and fluidized catalytic crackers.
However, the requested amount of propene is outgrowing the production capacity,
making new routes, like the dehydrogenation, vital to comply with the demand. It is
shown that coke species, formed on the catalytic surface, can be monitored with
Raman spectroscopy. Furthermore, it is shown that simultaneously measured UV-
Vis-NIR spectra provide information about the chromium site on the catalyst.
Unfortunately, the obtained information was qualitative and it would be very
advantageous if the information could also be used in a quantitative manner.
Especially since the operando Raman spectra, measured during dehydrogenation,
suggested a role for coke in the dehydrogenation process. In Chapter 3 the amount of
coke formed on the catalyst during dehydrogenation, was determined via
quantitative Raman spectroscopy. A new method was developed, in which the
observed Raman intensity was corrected for the changing color (absorption) of the
catalyst. By measuring simultaneously the changing color (absorption at a specific
wavelength) of the catalyst via UV-Vis-NIR spectroscopy, a G(R∞) correction factor
could be determined. This factor was used to quantify the Raman signal. The results
of the application of the G(R∞) correction factor were compared with the
quantification of the Raman data making use of BN as an internal standard. The
Summary and Concluding Remarks
97
latter approach is a more commonly known procedure to quantify Raman signals. It
appeared that both methods showed good agreement, making the newly developed
method preferable since the addition of an extra compound (namely the internal
standard) is not required. It is stated that the method is generally applicable.
Therefore, in Chapter 4 the amount of Cr6+ in Cr / Al2O3 catalysts was monitored
during temperature programmed reduction experiments. It appeared that the laser
was capable of heating the sample locally and as a consequence; the color was not the
same throughout the reactor. This made the application of the G(R∞) correction not
straightforward. Several attempts were made to circumvent this heat effect and every
method had its own strengths and limitations. Furthermore, it is shown that if the
experimental conditions are chosen carefully, Raman spectroscopy can be performed
in a quantitative manner. Finally, in Chapter 5 the role of coke was explored in more
detail. Experiments with labeled compounds revealed that ethane dehydrogenation
proceeds via an end-on dissociative adsorption of ethane on a Cr3+–O active site at
the catalyst surface. No evidence was found that coke deposits, formed during the
activation, are involved in the ethane dehydrogenation cycle. Furthermore, it
appeared propene is precursor for coke formed on the catalyst during the
dehydrogenation. Initially, this coke enhances the propane adsorption and as a result
the activity increases. Here after, coke starts blocking the active site, and as a result
the activity will drop making a regeneration step necessary. Raman spectroscopy
showed that during reaction the type of coke present changes from a more aliphatic
to a more graphitic type of coke.
In other words, combining multiple operando spectroscopic techniques into one set-
up proves to be a very useful approach in gathering information on catalytic
reactions. Someone may state that the information can also be gathered by
performing separate experiments. To some extent this is true for qualitative
information. However, different experiments are likely to result in different reaction
conditions. Furthermore, it is very useful if one technique can be used to verify the
results obtained by a second technique. In this way it was possible to observe the
heat affect, and address it to the heating of the Raman laser. This effect of a high
energy radiation source on a catalyst is often neglected. Furthermore, it is shown
Chapter 6
98
that, if the heat effect can be eliminated, it is possible to use the UV-Vis-NIR data for
the quantification of the Raman signals. An application that would not have been
possible if different experiments were performed.
For the reasons mentioned above, combining spectroscopic techniques is very useful.
New set-ups combining three operando characterization techniques (e.g. EPR / Raman
/ UV-Vis-NIR and ED-XAFS / Raman / UV-Vis-NIR) have the potential of providing
even more insight about a catalyst in action. However, one must realize that the
addition of a spectroscopic technique is not straightforward. Every technique has its
own sensitivity and thus concentration range in which useful data can be gathered.
This must be taken into account when building a new set-up.
These examples show the value of operando spectroscopy in a research environment
for rational catalyst design. However, in industrial companies the application of
multiple spectroscopic techniques could also be very useful. Instead of controlling
the reactor via the analysis of the product stream, the catalyst can be directly
monitored. The condition of the catalyst is known at any time and an optimal
performance can be maintained by intervening in a very early stage, if necessary. As
an example one could think of the combination of UV-Vis-NIR and Raman
spectroscopy for the control of a propane dehydrogenation plant. Together, they
provide information on the amount of coke present on the catalyst and this
information can be used to start a regeneration cycle. In other words, operando
spectroscopy has great potential for on-line catalyst monitoring and reaction control.

99
Samenvatting and Slotopmerkingen
Hoofdstuk 7
100
De toepassing van spectroscopische technieken kan karakteristieke informatie
verschaffen over een katalysator. Dit kan worden gedaan door te meten in de
verschillende stadia van de levensduur van de katalysator. Bijvoorbeeld voor en na
het deactiveren. Op deze manier wordt waardevolle informatie verkregen. Echter,
informatie over de oorsprong van de deactivering zal onmeetbaar zijn. Daarom is het
nuttig om een katalysator tijdens een reactie te meten, oftewel het toepassen van
operando spectroscopie. Indien meerdere complementaire operando spectroscopische
technieken worden gecombineerd, zal nog meer informatie verkregen worden.
Daarom was het doel van dit onderzoek het combineren van twee complementaire
spectroscopische technieken, te weten Raman en UV-Vis-NIR, in één operando
opstelling. Raman verschaft informatie over de vibratietoestanden van moleculen,
terwijl electronische overgangen gemeten kunnen worden met UV-Vis-NIR. In
Hoofdstuk 2 is de ontwikkeling van de opstelling beschreven en is deze getest
tijdens de dehydrogenering van propaan. Propene wordt typisch gemaakt als
bijproduct in etheen stoomkrakers en katalytische vloeistofkrakers. Aangezien de
vraag naar propeen de productiecapaciteit overtreft, worden nieuwe productieroutes
zoals de dehydrogenering steeds belangrijker. Het is aangetoond dat de vorming
van poly-aromatische koolwaterstoffen (coke) op het oppervlak van de katalysator,
gevolgd kan worden met Raman spectroscopy. Tegelijkertijd gemeten UV-Vis-NIR
spectra geven informatie over de aanwezige chroom-site. Helaas is al deze informatie
kwalitatief. Het zou echter waardevol zijn als ook deze informatie over kwantitatief
gebruikt zou kunnen worden. Temeer daar de Raman spectra een actieve rol voor
coke in het proces suggereren. Een kwantitatieve bepaling van het coke gehalte,
gemeten met Raman spectroscopie, is beschreven in Hoofdstuk 3. Een nieuwe
methode is ontwikkeld, waarin the Raman intensiteit gecorrigeerd wordt voor de
veranderde kleur van katalysator. Deze verandering van kleur (absorptie bij een
specifieke golflengte) is tegelijk gemeten met UV-Vis-NIR spectroscopie en
resulteerde in een G(R∞) correctie factor. Met behulp van deze factor is het mogelijk
om het Raman signaal te kwantificeren. De op deze manier behaalde resultaten zijn
vergeleken met de toepassing van een interne standaard. Deze laatste methode is een
meer traditionele manier om Raman signalen te kwantificeren. Beide methoden
Samenvatting en Slotopmerkingen
101
geven overeenkomstige resultaten. Dit maakt dat de nieuw ontwikkelde G(R∞)
correctie-factor de voorkeur geniet. In dat geval hoeft geen extra stof, zoals een
interne standaard, te worden toegevoegd. Tevens wordt gesteld dat deze methode
algemeen toepasbaar is. Om die reden is in Hoofdstuk 4 de hoeveelheid Cr6+ in een
Cr / Al2O3 katalysator gemeten tijdens reductie-experimenten waarbij de
temperatuur langzaam wordt verhoogd. Hierbij bleek dat de laser in staat was om
het monster locaal te verwarmen. Dit had als consequentie dat de kleur in de reactor
niet langer homogeen verdeeld was en dus dat de toepassing van de ontwikkelde
G(R∞) correctie factor niet direct mogelijk was. Meerdere pogingen zijn ondernomen
om dit effect te omzeilen waarbij bleek dat iedere methode zijn eigen voor- en
nadelen kende. Er is tevens aangetoond dat bij zorgvuldig gekozen reactie
omstandigheden het mogelijk is om Raman spectroscopie op een kwantitatieve
manier toe te passen. Tot slot wordt in Hoofdstuk 5 dieper ingegaan op de rol van
coke tijdens de dehydrogenering. Uit experimenten met gelabelde reactanten blijkt
dat de dehydrogenering van ethaan geschiedt via een end-on dissociatieve adsorptie
van ethaan op een Cr3+-O actieve site op het oppervlak. Er is geen bewijs gevonden
dat coke residuen, gevormd tijdens de activering, actief betrokken zijn in het reactie-
mechanisme. Verder bleek dat propeen pre-cursor is voor de gevormde coke op het
oppervlak. De coke zorgt voor een initieel toenemende adsorptie van propaan op het
oppervlak, met een toenemende activiteit tot gevolg. Op een gegeven moment is er
teveel coke en zullen tevens actieve sites geblokkeerd worden met als resultaat een
afnemende activiteit en de noodzaak voor een regeneratie. Uit de Raman data bleek
verder dat tijdens de reactie het type coke veranderde van alifatisch naar grafitisch.
Al met al blijkt dat het toepassen van meerdere operando spectroscopische technieken
in één opstelling zeer waardevol is voor het bestuderen van katalysatoren. Natuurlijk
zou iemand de kritiek kunnen uiten dat deze informatie ook in aparte experimenten
verzameld kan worden. Dit geldt tot op zekere hoogte voor de kwalitatieve
informatie. Echter hierbij moet worden aangetekend dat het zeer moeilijk is om echt
identieke reactiecondities te waarborgen. Daarbij komt nog dat het waardevol kan
zijn om de ene techniek de andere te laten controleren. Op deze manier was het
mogelijk om het warmte-effect toe te schrijven aan de Raman laser. Dit belangrijke
Hoofdstuk 7
102
effect van hoog energetische straling wordt vaak verwaarloosd. Tevens is
aangetoond dat, wanneer het warmte-effect uitgeschakeld kan worden, het mogelijk
is om met behulp van UV-Vis-NIR spectroscopie het Raman signaal te kwantificeren.
Om deze redenen is het combineren van meerdere technieken zeer nuttig. Nog meer
informatie komt beschikbaar met de opstellingen waarbij drie technieken (EPR /
Raman / UV-Vis-NIR en ED-XAFS / Raman / UV-Vis-NIR) zijn geïntegreerd. Hierbij
moet wel worden opgemerkt dat het niet altijd gemakkelijk is om meerdere
technieken te implementeren. Iedere techniek heeft immers zijn eigen specifieke
gevoeligheid en hierop zullen de monsters moeten worden aangepast. Een
compromis is dan ook vaak noodzakelijk.
De hierboven beschreven voorbeelden geven een inzicht in de waarde van operando
spectroscopie in een onderzoeksomgeving. Echter, ook in een industriële omgeving
kan het toepassen van meerdere technieken zeer waardevol zijn. In plaats van te
sturen op basis van productstroom, zal het mogelijk worden om de katalysator direct
te bestuderen. Hierbij wordt het mogelijk om eerder in te grijpen als de katalysator
tekenen van deactivering laat zien om een optimale conditie te behouden. Hierbij
valt te denken aan bijvoorbeeld processturing van de dehydrogenering van propaan
met behulp van Raman en UV-Vis-NIR. Samen zijn zij in staat om de hoeveelheid
coke op de katalysator te meten en deze informatie kan worden teruggekoppeld voor
het starten van een regeneratie. De toekomst van operando spectroscopie ligt dus
zowel bij het analyseren van een proces als het aansturen.
103
List of Publications and Presentations
Publications
T.A. Nijhuis, S.J. Tinnemans, T. Visser, B.M. Weckhuysen, Operando spectroscopic
investigation of supported metal oxide catalysts by combined time-resolved UV-
VIS/Raman/on-line mass spectrometry, Phys. Chem. Chem. Phys., 2003, 5, 4361-4365.
T.A. Nijhuis, S.J. Tinnemans, T. Visser, B.M. Weckhuysen, Towards real-time
spectroscopic process control for the dehydrogenation of propane over supported chromium
oxide catalysts, Chem. Eng. Sci., 2004, 59, 5487.
O.L.J. Gijzeman, J.N.J. van Lingen, J.H. van Lenthe, S.J. Tinnemans, D.E. Keller and
B.M. Weckhuysen, A new model for the molecular structure of supported vanadium oxide
catalysts, Chem. Phys. Lett., 2004, 397, 277.
S. J. Tinnemans, M. H. F. Kox, T. A. Nijhuis, T. Visser, B. M. Weckhuysen, Real time
quantitative Raman spectroscopy of supported metal oxide catalysts without the need of an
internal standard, Phys. Chem. Chem. Phys., 2005, 7, 211.
U. Olsbye, A. Virnovskaia, Ø. Prytz, S.J. Tinnemans, B.M. Weckhuysen, Mechanistic
insight in the ethane dehydrogenation reaction over Cr/Al2O3 catalysts, Catal. Lett., 2005,
103, 1-2, 143.
S.J. Tinnemans, J.G. Mesu, K. Kervinen, T. Visser., T.A. Nijhuis, A.M. Beale, D.E.
Keller, A.M.J van der Eerden, B.M. Weckhuysen, Combining operando techniques in one
spectroscopic-reaction cell: New opportunities for elucidating the active site and related
reaction mechanism in catalysis, Catal. Today, 2006, 113, 3.
S. J. Tinnemans, M.H.F. Kox, M.W. Sletering, T.A. Nijhuis, T.Visser and B.M.
Weckhuysen, Dealing with a local heating effect when measuring catalytic solids in a
reactor with Raman spectroscopy, Phys. Chem. Chem. Phys., 2006, accepted.
104
Presentations
S.J. Tinnemans, T.A. Nijhuis, T. Visser, B.M. Weckhuysen, Synchronised Operando UV-
Vis and Raman Spectroscopy on Catalytic Solids, Poster presented at the First
International Congress on Operando Spectroscopy, Lunteren, March 2003.
S.J. Tinnemans, T.A. Nijhuis, T. Visser, B.M. Weckhuysen, Synchronised Operando UV-
Vis and Raman Spectroscopy on Catalytic Solids, Poster presented at the 4th Netherlands’
Catalysis and Chemistry Conference, Noordwijkerhout, March 2003.
S.J. Tinnemans, T.A. Nijhuis, T. Visser, B.M. Weckhuysen, Synchronised Operando UV-
Vis and Raman Spectroscopy on Catalytic Solids, Poster presented at the On-line
Analyser symposium: Spectroscopy as on-line measuring tool, Antwerp, Belgium,
February 2004.
S.J. Tinnemans, T.A. Nijhuis, T. Visser, B.M. Weckhuysen, Operando UV-Vis-NIR and
Raman spectroscopy on supported metal oxides during propane dehydrogenation, Lecture
given at the 5th Netherlands’ Catalysis and Chemistry Conference, Noordwijkerhout,
March 2004.
S.J. Tinnemans, T.A. Nijhuis, T. Visser, B.M. Weckhuysen, Synchronised Operando UV-
Vis and Raman Spectroscopy on Catalytic Solids, Poster presented at the COST D15
workshop, La Colle sur Loup, France, October 2004.
S.J. Tinnemans, T.A. Nijhuis, T. Visser, B.M. Weckhuysen, Towards real-time
spectroscopic process control for propane dehydrogenation, Lecture given at the First
Conference of the European Union Coordination Action “CO-ordination of
Nanostructured Catalytic Oxides Research and Development in Europe”:
CONCORDE, Louvain-la-Neuve, Belgium, January 2005.
105
Dankwoord
Nu zit het er na vier jaar dan echt bijna op. Voor mij betekent dit dat ik nu de kans
krijg om een aantal mensen in het bijzonder te bedanken die hebben bijgedragen aan
de totstandkoming van dit proefschrift. Allereerst mijn promotor prof. Weckhuysen.
Beste Bert, bedankt dat jij mij de kans hebt gegeven om te promoveren en tevens om
mezelf verder te ontwikkelen. Het waren soms roerige tijden waarbij jij altijd achter
mij hebt gestaan. Ik kan niet beschrijven hoeveel dat voor mij betekend heeft. Tevens
ben ik zeer blij geweest met al jouw snelle correctiewerk (Waar haal je toch de tijd
vandaan?). Natuurlijk wil ik ook mijn beide co-promotoren bedanken. XanderN,
bedankt voor alle hulp die ik heb ontvangen. Zonder jou zou de set-up niet zo
makkelijk te bedienen zijn. Tevens heb jij mij geïntroduceerd in een hele nieuwe (af
en toe verslavende) wereld. Hopelijk kom ik je nog vaak tegen (al dan niet on-line).
Heel veel geluk samen met je vrouw en fijn dat je er op deze dag toch bij kan zijn.
Tom, jouw deur stond altijd open voor raad of advies. Door jouw (al dan niet
gevraagde) kritische opmerkingen werd ik regelmatig aan het denken gezet. Bedankt
daarvoor.
Voor het ontwerpen en bouwen van de opstelling wil ik ook AdM bedanken. Mede
met behulp van jouw praktische kijk hebben we een mooie opstelling kunnen
bouwen. Natuurlijk wil ik jou ook bedanken voor alle overige ondersteuning die je
geboden hebt.
In dit dankwoord mag ook zeker de glasblazerij niet vergeten worden. De
spectroscopische cellen, door jullie gemaakt, hebben in belangrijke mate bijgedragen
aan het kunnen werken met de opstelling en het verkrijgen van goede data. Voor mij
is het absolute hoogtepunt van jullie kunde de speciale Mickey van glas. Hij staat
nog steeds te pronken in de kast en iedereen die hem ziet is onder de indruk.
Tijdens mijn promotie heb ik het geluk gehad om twee afstudeerders te mogen
begeleiden. Als eerste was daar Marianne. Ik had je verteld dat ik graag
kwantitatieve Raman wilde kunnen doen en dat we daarvoor een studie naar een
interne standaard nodig hadden. Het bleek allemaal toch wat ingewikkelder dan
gedacht, maar jij hebt wel laten zien wat er met een interne standaard mogelijk is.
Bedankt en veel succes met je eigen promotie onderzoek. Bijna aansluitend kwam
Marco. Na het toepassen van kwantitatieve Raman op de coke band, wilden we nu
de Cr-band kwantificeren tijdens reductie. We wisten dat de laser verantwoordelijk
was voor lokale verhitting, maar we dachten dat het effect boven de 100 °C wel mee
zou vallen. Dit bleek een illusie, maar het vinden van een oplossing is uiteindelijk
106
toch gelukt. Bedankt voor jouw inzet en veel succes bij het afronden van de laatste
onderdelen van je studie.
Dr. Brückner, I would like to thank you for giving me the opportunity of measuring
operando EPR / Raman / UV-Vis spectroscopy in Berlin. Working with a different
operando set-up learned me that more of these type of set-ups are necessary.
I also wish to thank prof. Olsbye for all the labeling experiments she performed in
her group and the email discussions.
Natuurlijk wil ik ook mijn kamergenoten bedanken voor alle gezelligheid die zij mij
altijd hebben gegeven. Willem, het was altijd leuk om met jou te discussiëren over
de meest uiteenlopende onderwerpen. Cristina, de snelheid waarmee jij Nederlands
hebt geleerd, verbaast me nog steeds. Niels, wanneer leer je nu eindelijk eens muziek
(dus geen herrie) te waarderen?
Naast deze mensen wil ik natuurlijk ook de rest van de collega’s bedanken voor alle
gezelligheid en overige zaken die op directe of indirecte wijze hebben bijgedragen
aan dit boekje.
XanderT, ik heb jou leren kennen tijdens mijn studie. Altijd kon ik terecht voor een
praatje en onze lunches zal ik missen. Hopelijk blijf je zo verstandig om af en toe je
rust te nemen zodat je mij niet meer zo hoeft te laten schrikken. Fijn dat jij op deze
dag naast mij wilt staan. Hopelijk lukt het je jouw ambities waar te maken.
Daphne, aan het begin van mijn promotietijd kende ik jou nog niet. In de loop van de
tijd werd jij een hele goede vriendin waarbij ik maar een minpunt kan bedenken: Je
blijft maar bezig met je Vanadium. Ik zal onze (bijna) dagelijkse kop thee missen .
Ook heb ik nooit begrepen waarom andere mensen onze gesprekken niet konden
volgen. Dat wisselen van gespreksonderwerpen sprak toch voor zich. Dat jij mijn
getuige wilde zijn tijdens mijn bruiloft heeft veel voor mij betekend evenals het feit
dat jij tijdens mijn promotie naast mij wil staan. Hopelijk blijven we elkaar nog
regelmatig spreken en zien.
In een dankwoord kunnen natuurlijk de meest dierbaren om mij heen niet ontbreken.
Pa, als pater familias heb jij altijd klaar gestaan met je wijze raad. Ofschoon ik
wellicht niet altijd (meteen) luisterde, heb ik er toch veel aan gehad. Bedankt voor je
steun. Marjon en Yvonne, betere zussen kan ik me niet wensen. Bedankt dat jullie
altijd naar mij hebben willen luisteren als ik daar behoefte aan had. Jullie gegil toen je
hoorde dat je (een echte) tante zou worden, zal ik nooit vergeten.
Ma (de Jager), altijd stond u klaar voor mij als ik daar behoefte aan had. (Ook als dat
betekende om 6.00 uur opstaan om mij op de trein te zetten). Bedankt! Myrna, Erwin,
Lisa en Marc, bij jullie kon ik altijd terecht voor een kop thee. Het raar doen met de

107
tweeling, daar zijn ooms tenslotte voor, zorgde dat ik mijn hoofd weer even helemaal
leeg kon maken.
Het laatste stuk in dit dankwoord is gereserveerd voor de mij meest dierbare
persoon. Ilona, eerst als verloofde en later als echtgenote heb jij mij altijd gesteund en
bent altijd in mij blijven geloven. Na een geweldige trouwdag vorig jaar, zullen we
op de dag van mijn promotie kersverse ouders zijn. Een compleet nieuwe dimensie
in ons mooie leven. Hopelijk zullen we er samen nog lang van mogen genieten.
Stan
108
Curriculum Vitae
Stanislaus Josepus Tinnemans werd op 14 februari 1978 geboren in Deurne. In 1997
behaalde hij het VWO diploma aan het Christelijk College Zeist. Aansluitend werd
de opleiding Scheikunde gedaan aan de Universiteit Utrecht. Met universitaire stages
bij de vakgroepen Fysisch Organische Chemie en Anorganische Chemie en Katalyse
werd het doctoraal diploma in 2002 behaald. In de periode 2002-2006 werd een
promotieonderzoek uitgevoerd in de vakgroep Anorganische Chemie en Katalyse
(Universiteit Utrecht) onder supervisie van prof. Dr. Ir. B.M. Weckhuysen, Dr. T.A.
Nijuis en Dr. T. Visser. De resultaten van dat onderzoek hebben geleid tot dit
proefschrift.