Embed Size (px)
Citation preview
1
Supporting Information
Rec. Nat. Prod. 10:5 (2016) 649-653
Cytotoxic and Antibacterial Activities of Constituents from
Calophyllum ferrugineum Ridley
Nurul Iman Aminudin1, Farediah Ahmad
1*,
Muhammad Taher2 and Razauden Mohamed Zulkifli
3
1Department of Chemistry, Faculty of Science, Universiti Teknologi Malaysia, 81310, Skudai,
Johor, Malaysia
2Kulliyyah of Pharmacy, International Islamic University Malaysia, Jalan Sultan Ahmad Shah,
Bandar Indera Mahkota, 25200, Kuantan, Pahang, Malaysia
3Department of Bioscience and Health Sciences, Faculty of Biosciences and Medical
Engineering, Universiti Teknologi Malaysia, 81310, Skudai, Johor, Malaysia
Table of Contents Page
Experimental Details 3
Cytotoxic Activity 3
Antibacterial Activity 3
Statistical Analysis of Data 3
Bar Graph on Cytotoxic Activity of Isoapetalic acid (1) and Apetalic acid (2) 4
S1: IR spectrum of Isoapetalic acid (1)
S2: 1H NMR spectrum of Isoapetalic acid (1)
S3: 1H NMR spectrum of Isoapetalic acid (1) (Expansion)
S4: DEPTQ spectrum of Isoapetalic acid (1)
S5: DEPTQ_Q spectrum of Isoapetalic acid (1)
S6: EIMS spectrum of Isoapetalic acid (1)
S7: IR spectrum of Apetalic acid (2)
5
6
6
7
7
8
9
2
S8: 1H NMR spectrum of Apetalic acid (2)
S9: 1H NMR spectrum of Apetalic acid (2) (Expansion)
S10: DEPTQ spectrum of Apetalic acid (2)
S11: DEPTQ_Q spectrum of Apetalic acid (2)
S12: EIMS spectrum of Apetalic acid (2)
S13: IR spectrum of 6-Hydroxy-2-methoxyxanthone (3)
S14: 1H NMR spectrum of 6-Hydroxy-2-methoxyxanthone (3)
S15: 1H NMR spectrum of 6-Hydroxy-2-methoxyxanthone (3) (Expansion)
S16: DEPTQ spectrum of 6-Hydroxy-2-methoxyxanthone (3)
S17: DEPTQ_Q spectrum of 6-Hydroxy-2-methoxyxanthone (3)
S18: EIMS spectrum of 6-Hydroxy-2-methoxyxanthone (3)
S19: IR spectrum of ent-Epicatechin (4)
S20: 1H NMR spectrum of ent-Epicatechin (4)
S21: 13
C/DEPT spectra of ent-Epicatechin (4)
S22: EIMS spectrum of ent-Epicatechin (4)
S23: S22: IR spectrum of Betulinic acid (5)
S24: 1H NMR spectrum of Betulinic acid (5)
S25: DEPTQ spectrum of Betulinic acid (5)
S26: DEPTQ_Q spectrum of Betulinic acid (5)
S27: EIMS spectrum of Betulinic acid (5)
S28: IR spectrum of Protocatechuic acid (6)
S29: 1H NMR of Protocatechuic acid (6)
S30: 13
C/DEPT spectra of Protocatechuic acid (6)
S31: EIMS spectrum of Protocatechuic acid (6)
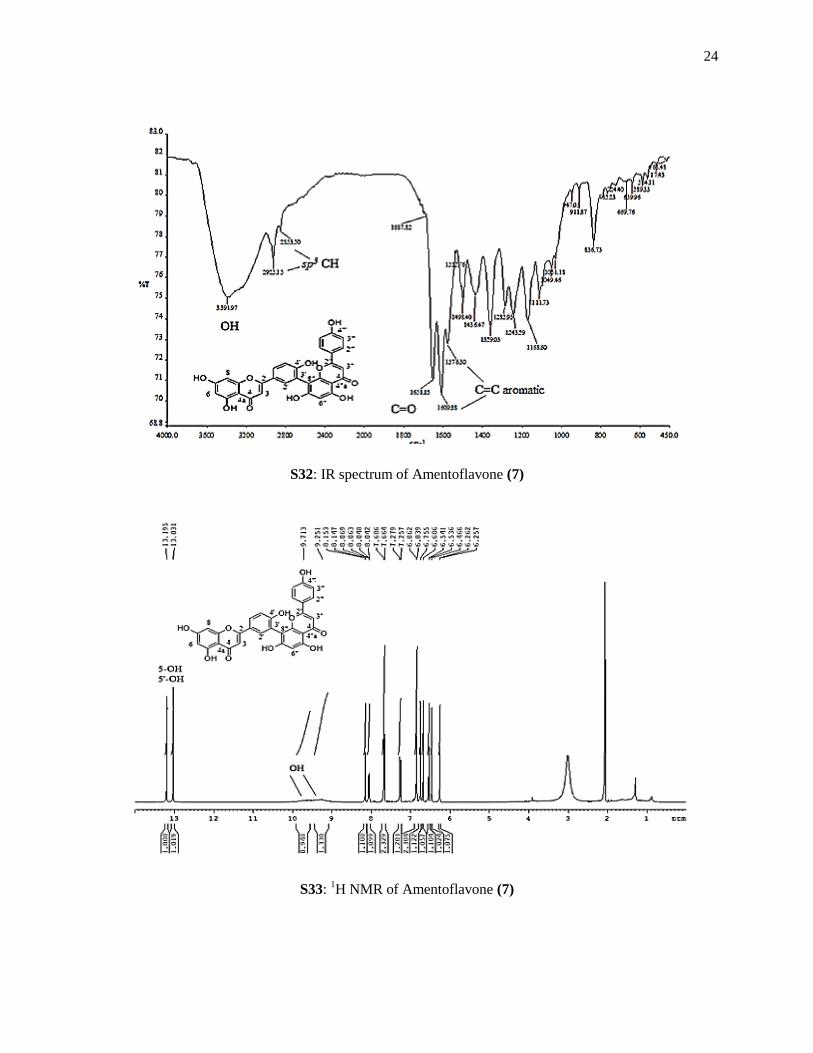
S32: IR spectrum of Amentoflavone (7)
S33: 1H NMR of Amentoflavone (7)
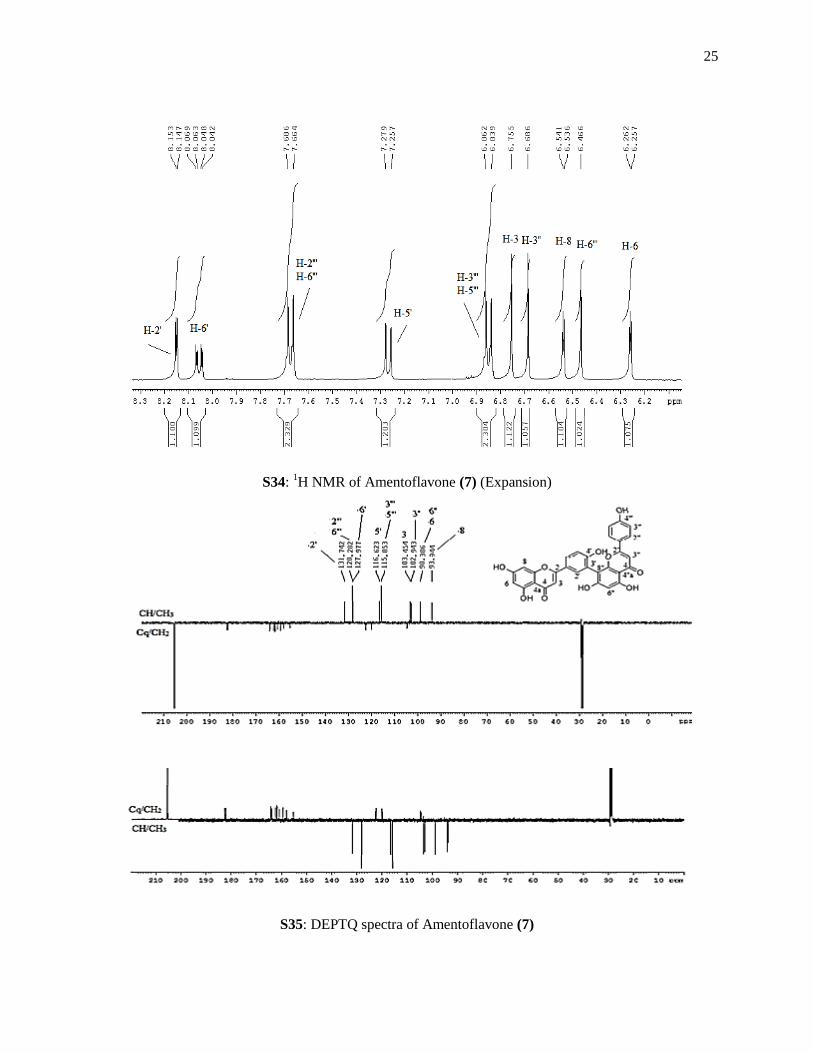
S34: 1H NMR of Amentoflavone (7) (Expansion)
S35: DEPTQ spectra of Amentoflavone (7)
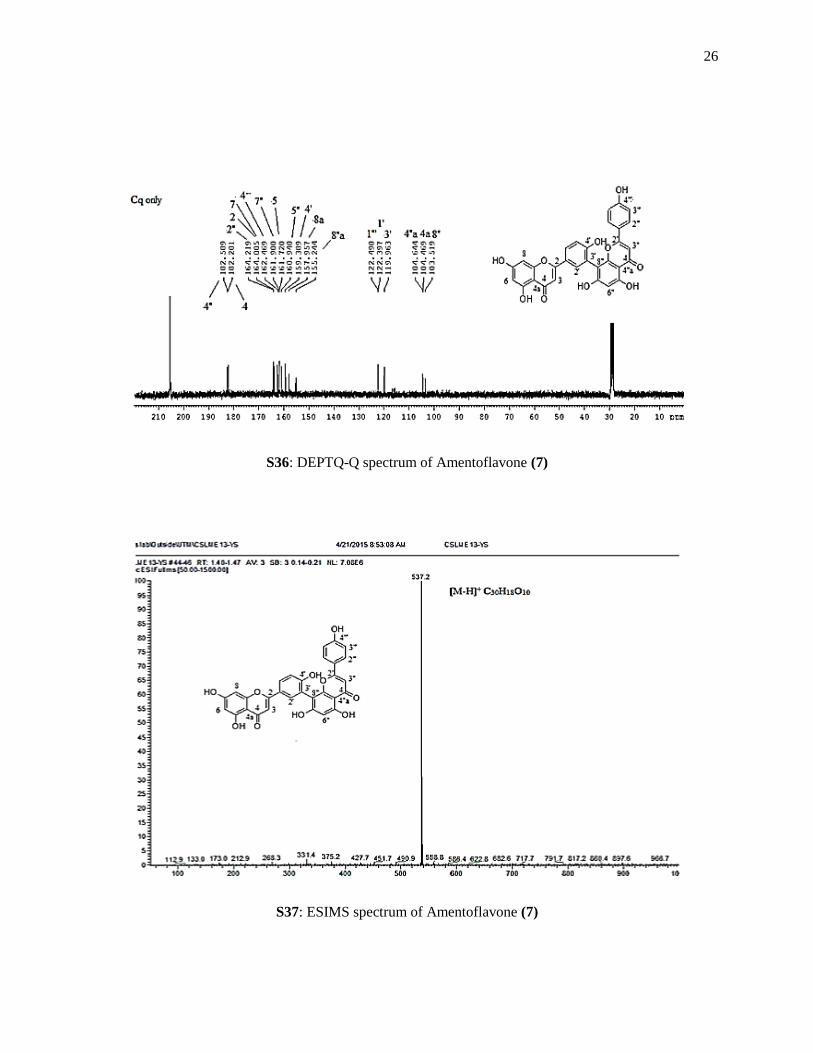
S36: DEPTQ-Q spectrum of Amentoflavone (7)
S37: ESIMS spectrum of Amentoflavone (7)
9
10
10
11
11
12
13
13
14
14
15
16
16
17
17
18
19
19
20
20
21
22
22
23
24
24
25
25
26
26
References 27
3
Experimental Details
Cytotoxic Activity:
The cytotoxic activity was evaluated by MTT colorimetric assay [1,2]. The sample stock solution (100
µg/mL) was dissolve in 1% (v/v) DMSO in phosphate buffered saline (PBS). The samples were further
diluted with DMEM to afford concentration ranging from 100 – 3.13 µg/mL obtained from twofold
dilution. The cells were cultured in Dulbecco’s modified Eagle’s Medium (DMEM) media supplemented
with 10% fetal bovine serum and 2% penicillin-streptomycin. In brief, 90 µL of cell suspension in
DMEM were seeded in 96-well microplate and was counted directly by using trypan blue dye. The cells
were treated with samples after reaching confluence (2 x 10⁵ cell/mL) and were pre-incubated at 37ºC in
humidified atmosphere with 5% CO2 for 24 hours. 20 µL of MTT (5 mg/mL in PBS) was added to all
well in dark condition and pre-incubated for another 4 hours. 100 µL of DMSO was added to all well to
solubilize the water-insoluble purple formazan crystal formed and pre-incubated in dark condition at
room temperature. The absorbance was read after 1 hour at 570 nm and 630 nm as the reference
wavelength. Untreated cells served as control group and considered as 100% of viable cells. Results were
expressed as percentage of cell viability of samples relative to the untreated control cell following the
formula;
%Inhibition Concentration (%IC) = [(Asample - AMTT blank)/ (Acontrol - AMTT blank)] x 100%%
where Asample is the absorbance of cells treated with samples, AMTT blank is the absorbance of MTT reagent
with DMSO only and Acontrol is the absorbance of untreated control cells.
Antibacterial Activity:
The antibacterial activity of all compounds was tested quantitatively by evaluating their minimum
inhibition concentration (MIC). The MIC was carried out by micro-broth dilution [3–7]. The sample stock
solution (1000 µg/mL) was prepared in 5% DMSO in nutrient broth (NB) supplemented with 0.02% (v/v)
Tween 80. Further twofold dilution with NB was performed to afford concentration of samples from 100
– 7.81 µg/mL. 50 µL of bacteria inocula (106 CFU/mL) was dispensed in the 96-well microplate followed
by 50 µL of the sample solution. The microplates were pre-incubated for 24 hour at 37ºC for S. aureus, E.
coli and P. aeruginosa and 30 ºC for B. subtilis. 25 µL of 2-(4-Iodophenyl)-3-(4-nitrophenyl)-5-phenyl-
2H-tetrazolium (INT) (0.2 mg/mL in distilled water) solution was added to all wells and were further pre-
incubated for at least 30 minutes. Bacteria growth in the wells was indicated by formation of reddish-pink
colour while clear well indicates inhibition of bacteria growth by the sample. Streptomycin sulphate was
employed as positive control in this assay.
Statistical Analysis of Data:
Three replicates of each sample were used for statistical analysis with values reported as mean ± SD.
Standard curves were generated and calculation of the 50% inhibitory concentration (IC50) values was
4
performed using GraphPad Prism for Windows (version 5.02) software. The Student’s t-test was carried
out using SPSS (version 22) software to study the comparison between treatment of samples and
untreated control. A value of p < 0.05 was considered significantly different.
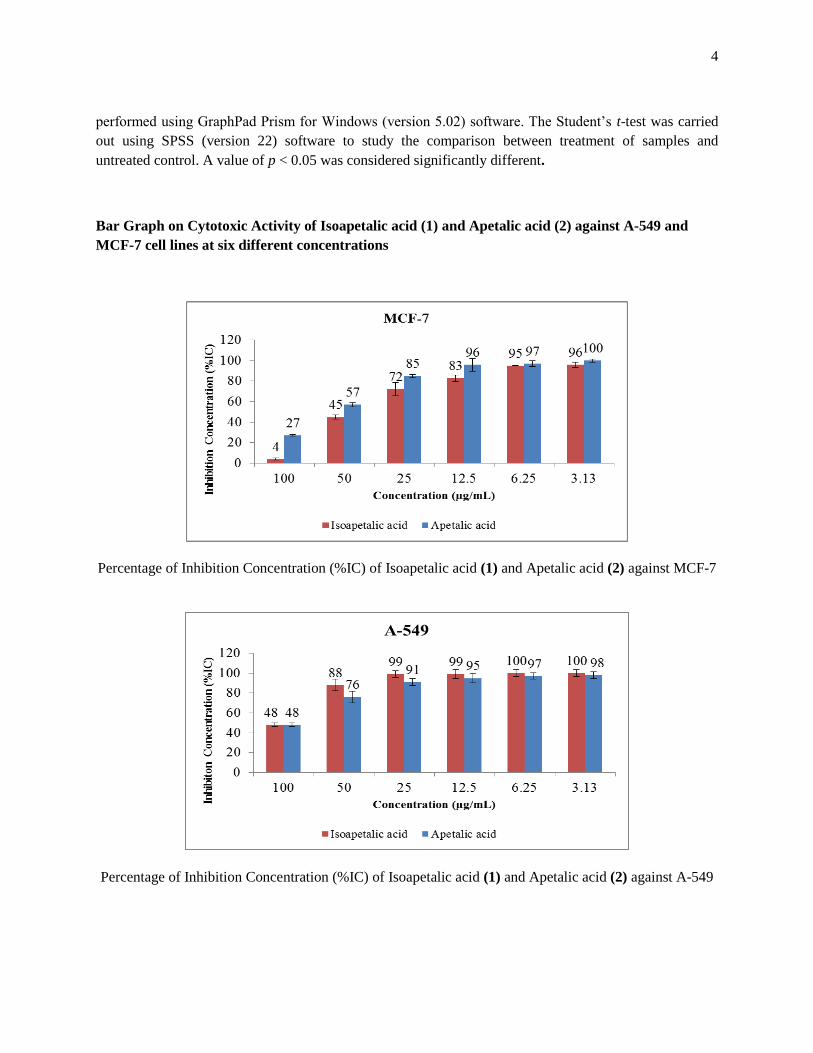
Bar Graph on Cytotoxic Activity of Isoapetalic acid (1) and Apetalic acid (2) against A-549 and
MCF-7 cell lines at six different concentrations
Percentage of Inhibition Concentration (%IC) of Isoapetalic acid (1) and Apetalic acid (2) against MCF-7
Percentage of Inhibition Concentration (%IC) of Isoapetalic acid (1) and Apetalic acid (2) against A-549
5
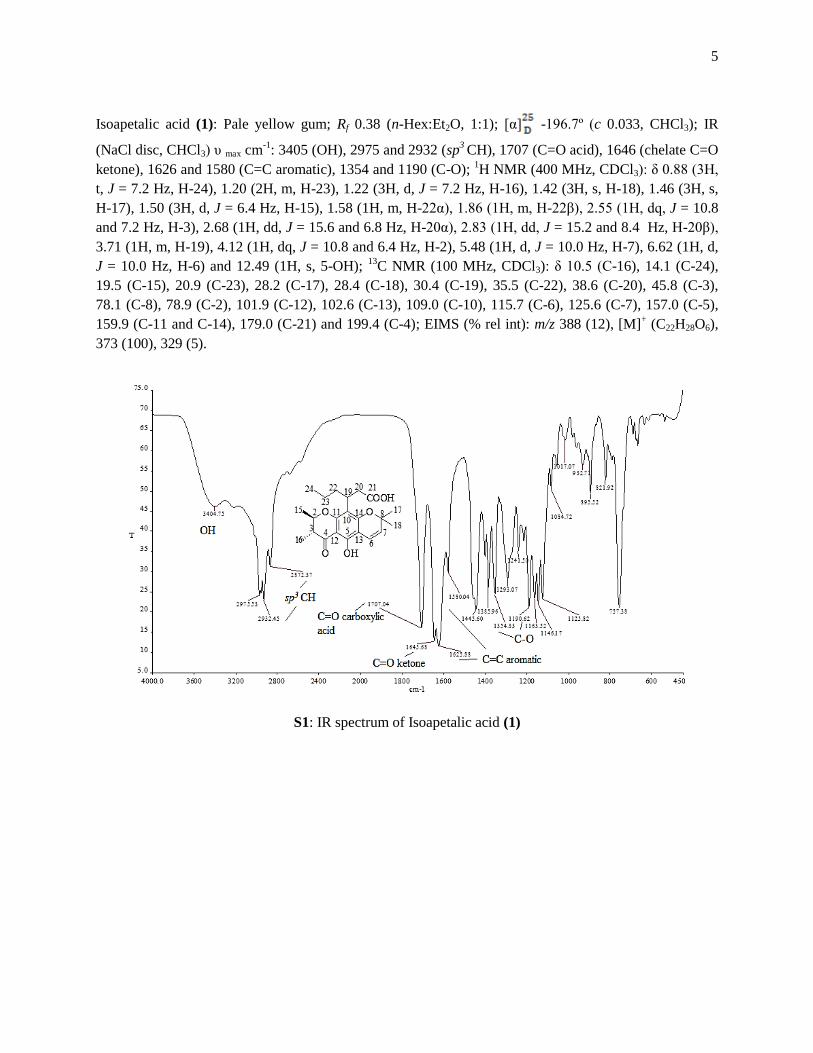
Isoapetalic acid (1): Pale yellow gum; Rf 0.38 (n-Hex:Et2O, 1:1); [α] -196.7º (c 0.033, CHCl3); IR
(NaCl disc, CHCl3) υ max cm-1
: 3405 (OH), 2975 and 2932 (sp3 CH), 1707 (C=O acid), 1646 (chelate C=O
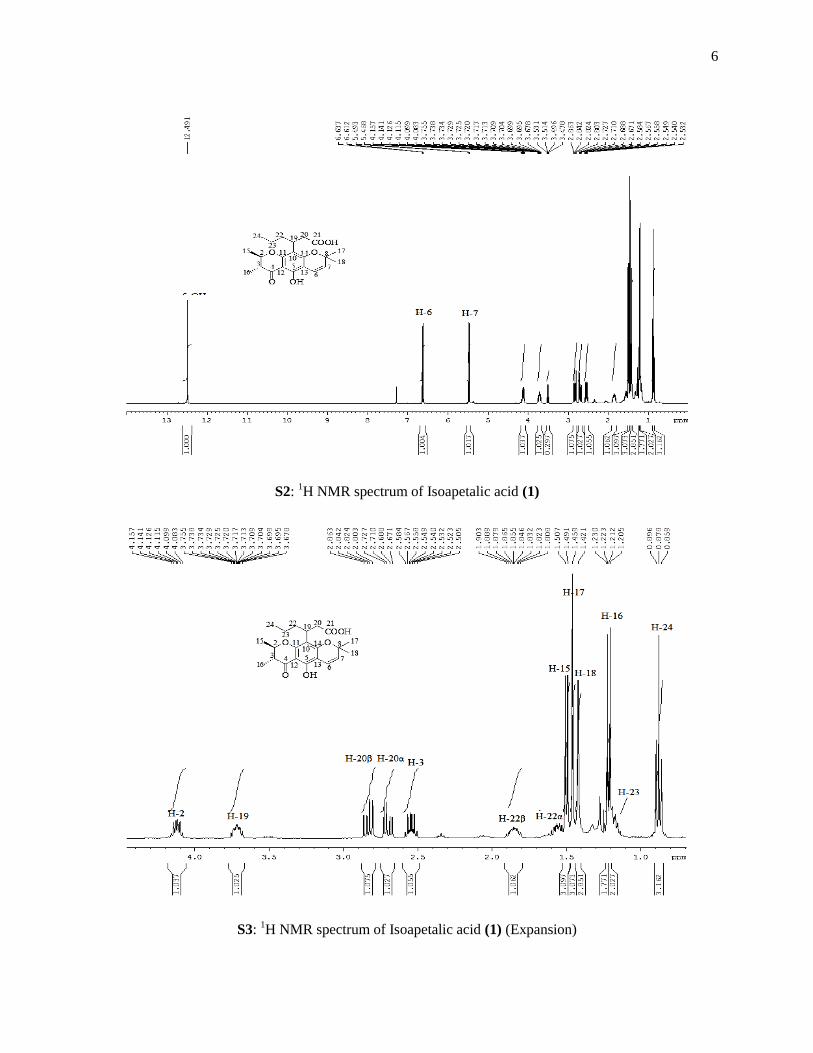
ketone), 1626 and 1580 (C=C aromatic), 1354 and 1190 (C-O); 1H NMR (400 MHz, CDCl3): δ 0.88 (3H,
t, J = 7.2 Hz, H-24), 1.20 (2H, m, H-23), 1.22 (3H, d, J = 7.2 Hz, H-16), 1.42 (3H, s, H-18), 1.46 (3H, s,
H-17), 1.50 (3H, d, J = 6.4 Hz, H-15), 1.58 (1H, m, H-22α), 1.86 (1H, m, H-22β), 2.55 (1H, dq, J = 10.8
and 7.2 Hz, H-3), 2.68 (1H, dd, J = 15.6 and 6.8 Hz, H-20α), 2.83 (1H, dd, J = 15.2 and 8.4 Hz, H-20β),
3.71 (1H, m, H-19), 4.12 (1H, dq, J = 10.8 and 6.4 Hz, H-2), 5.48 (1H, d, J = 10.0 Hz, H-7), 6.62 (1H, d,
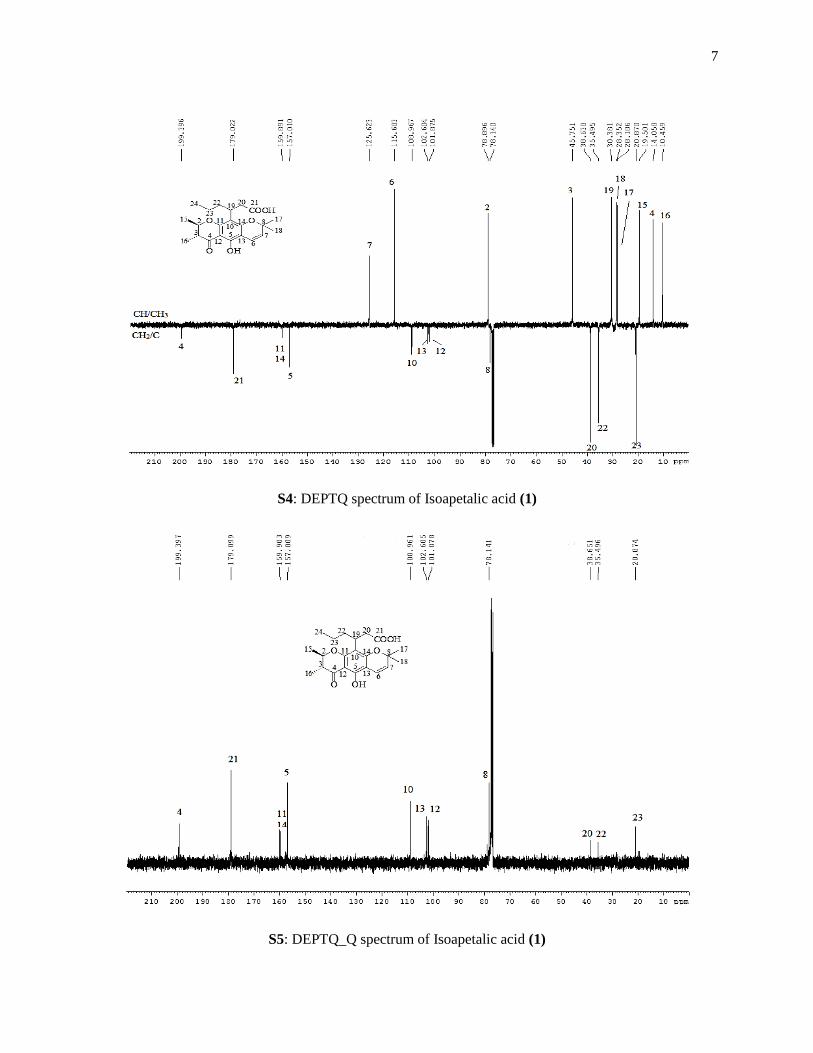
J = 10.0 Hz, H-6) and 12.49 (1H, s, 5-OH); 13
C NMR (100 MHz, CDCl3): δ 10.5 (C-16), 14.1 (C-24),
19.5 (C-15), 20.9 (C-23), 28.2 (C-17), 28.4 (C-18), 30.4 (C-19), 35.5 (C-22), 38.6 (C-20), 45.8 (C-3),
78.1 (C-8), 78.9 (C-2), 101.9 (C-12), 102.6 (C-13), 109.0 (C-10), 115.7 (C-6), 125.6 (C-7), 157.0 (C-5),
159.9 (C-11 and C-14), 179.0 (C-21) and 199.4 (C-4); EIMS (% rel int): m/z 388 (12), [M]+ (C22H28O6),
373 (100), 329 (5).
S1: IR spectrum of Isoapetalic acid (1)
6
S2: 1H NMR spectrum of Isoapetalic acid (1)
S3: 1H NMR spectrum of Isoapetalic acid (1) (Expansion)
7
S4: DEPTQ spectrum of Isoapetalic acid (1)
S5: DEPTQ_Q spectrum of Isoapetalic acid (1)
8
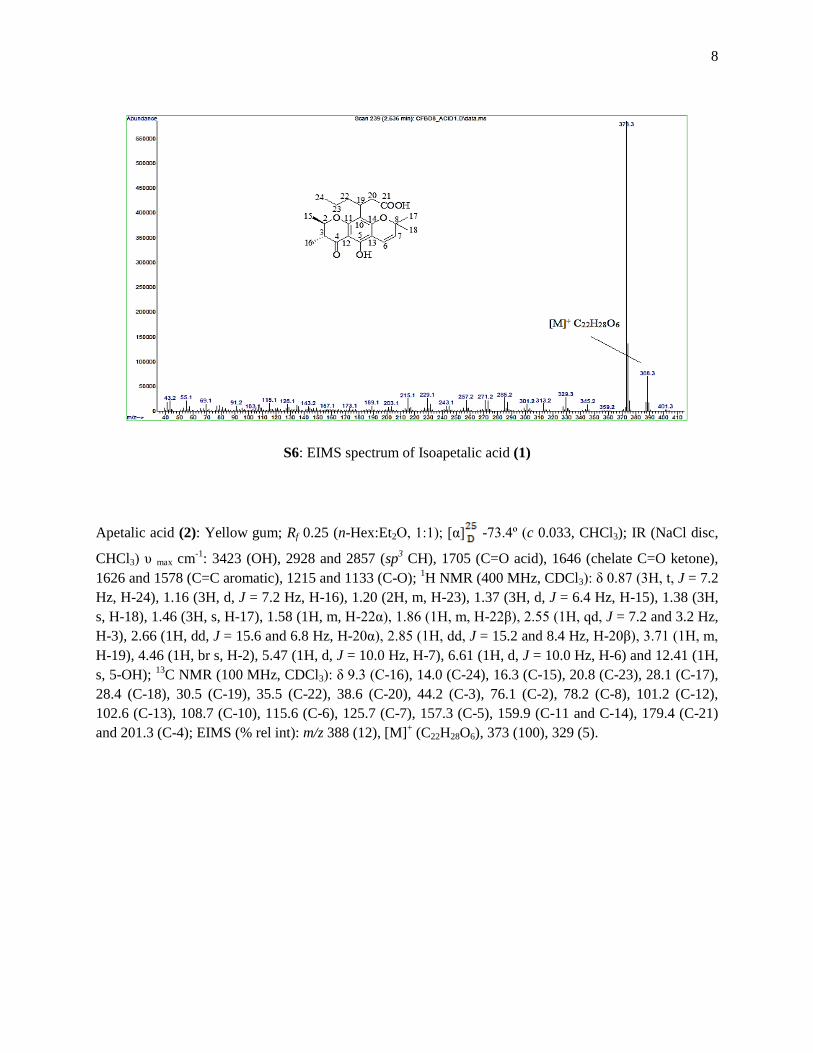
S6: EIMS spectrum of Isoapetalic acid (1)
Apetalic acid (2): Yellow gum; Rf 0.25 (n-Hex:Et2O, 1:1); [α] -73.4º (c 0.033, CHCl3); IR (NaCl disc,
CHCl3) υ max cm-1
: 3423 (OH), 2928 and 2857 (sp3 CH), 1705 (C=O acid), 1646 (chelate C=O ketone),
1626 and 1578 (C=C aromatic), 1215 and 1133 (C-O); 1H NMR (400 MHz, CDCl3): δ 0.87 (3H, t, J = 7.2
Hz, H-24), 1.16 (3H, d, J = 7.2 Hz, H-16), 1.20 (2H, m, H-23), 1.37 (3H, d, J = 6.4 Hz, H-15), 1.38 (3H,
s, H-18), 1.46 (3H, s, H-17), 1.58 (1H, m, H-22α), 1.86 (1H, m, H-22β), 2.55 (1H, qd, J = 7.2 and 3.2 Hz,
H-3), 2.66 (1H, dd, J = 15.6 and 6.8 Hz, H-20α), 2.85 (1H, dd, J = 15.2 and 8.4 Hz, H-20β), 3.71 (1H, m,
H-19), 4.46 (1H, br s, H-2), 5.47 (1H, d, J = 10.0 Hz, H-7), 6.61 (1H, d, J = 10.0 Hz, H-6) and 12.41 (1H,
s, 5-OH); 13
C NMR (100 MHz, CDCl3): δ 9.3 (C-16), 14.0 (C-24), 16.3 (C-15), 20.8 (C-23), 28.1 (C-17),
28.4 (C-18), 30.5 (C-19), 35.5 (C-22), 38.6 (C-20), 44.2 (C-3), 76.1 (C-2), 78.2 (C-8), 101.2 (C-12),
102.6 (C-13), 108.7 (C-10), 115.6 (C-6), 125.7 (C-7), 157.3 (C-5), 159.9 (C-11 and C-14), 179.4 (C-21)
and 201.3 (C-4); EIMS (% rel int): m/z 388 (12), [M]+ (C22H28O6), 373 (100), 329 (5).
9
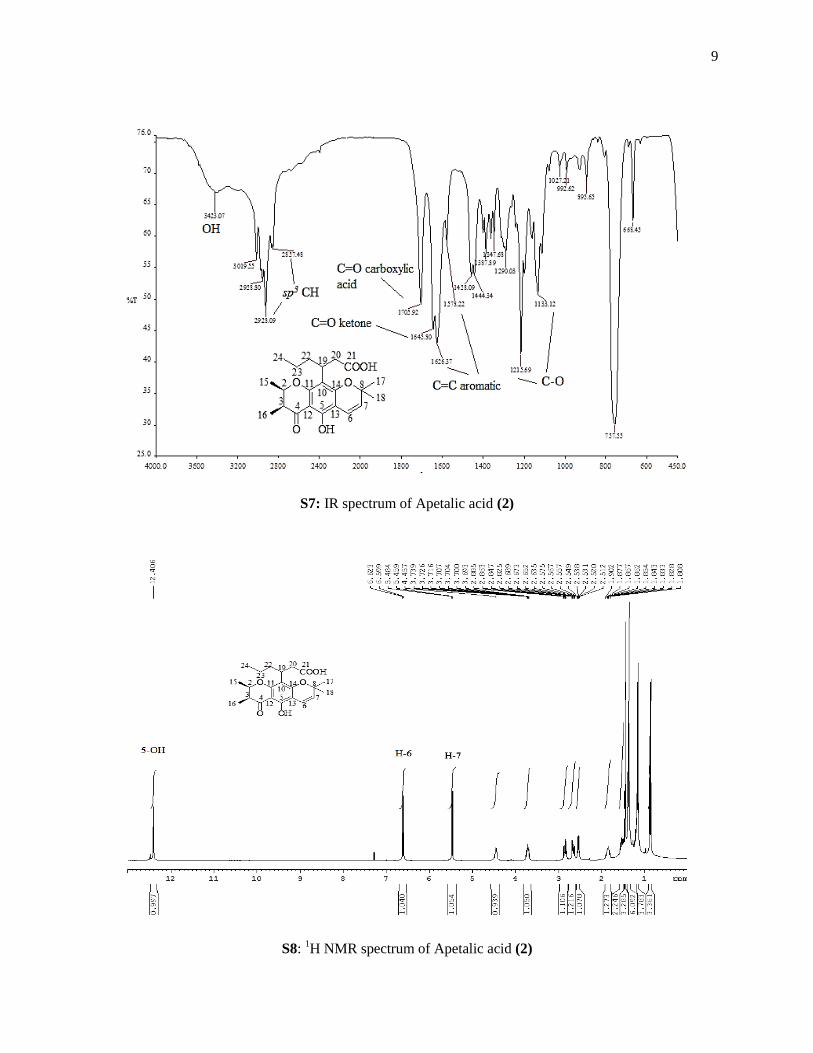
S7: IR spectrum of Apetalic acid (2)
S8: 1H NMR spectrum of Apetalic acid (2)
10
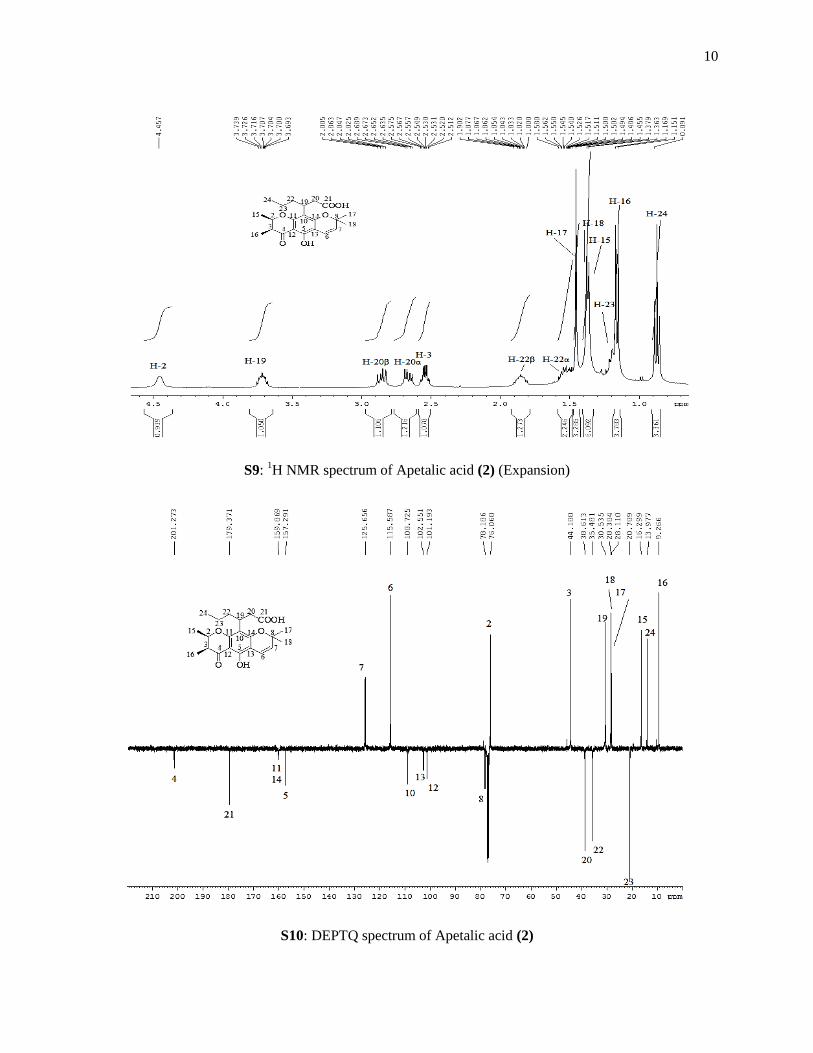
S9: 1H NMR spectrum of Apetalic acid (2) (Expansion)
S10: DEPTQ spectrum of Apetalic acid (2)
11
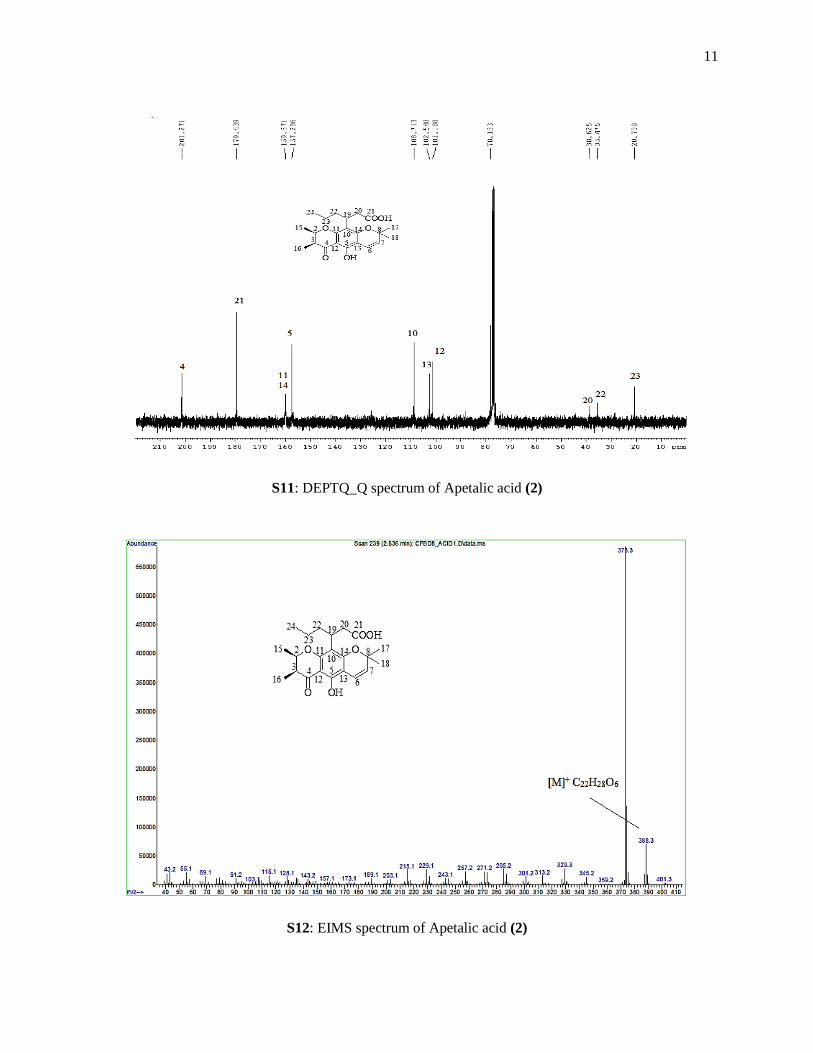
S11: DEPTQ_Q spectrum of Apetalic acid (2)
S12: EIMS spectrum of Apetalic acid (2)
12
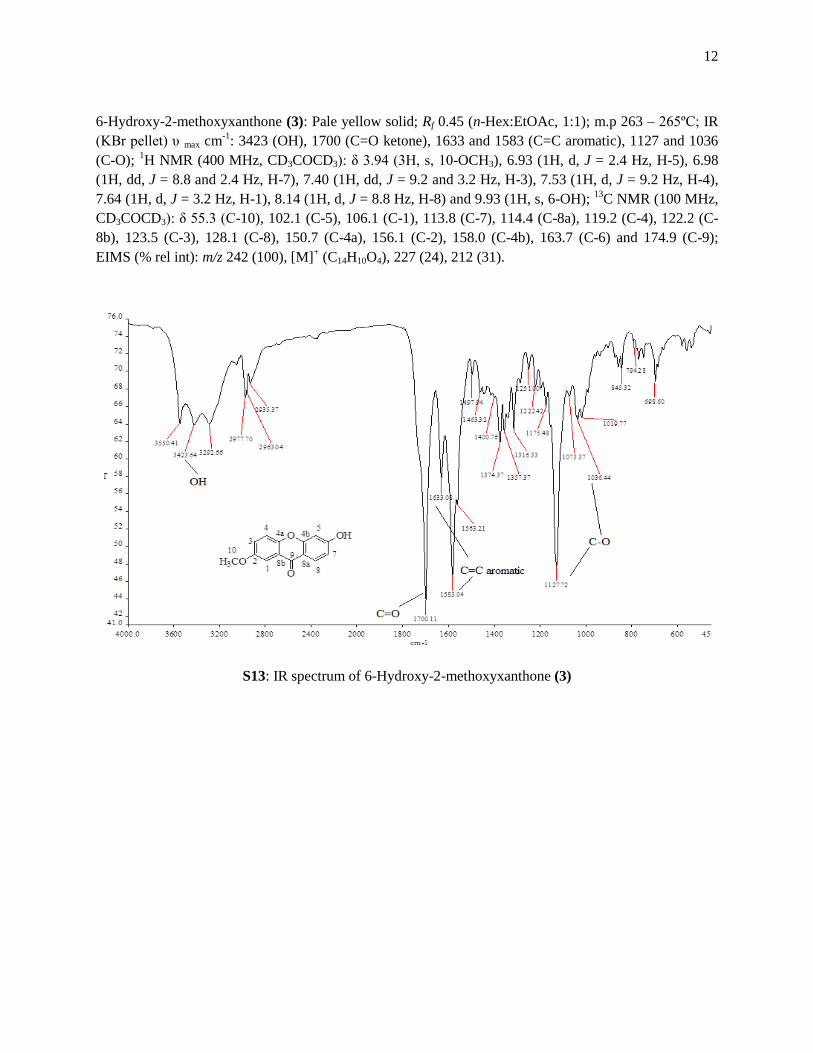
6-Hydroxy-2-methoxyxanthone (3): Pale yellow solid; Rf 0.45 (n-Hex:EtOAc, 1:1); m.p 263 – 265ºC; IR
(KBr pellet) υ max cm-1
: 3423 (OH), 1700 (C=O ketone), 1633 and 1583 (C=C aromatic), 1127 and 1036
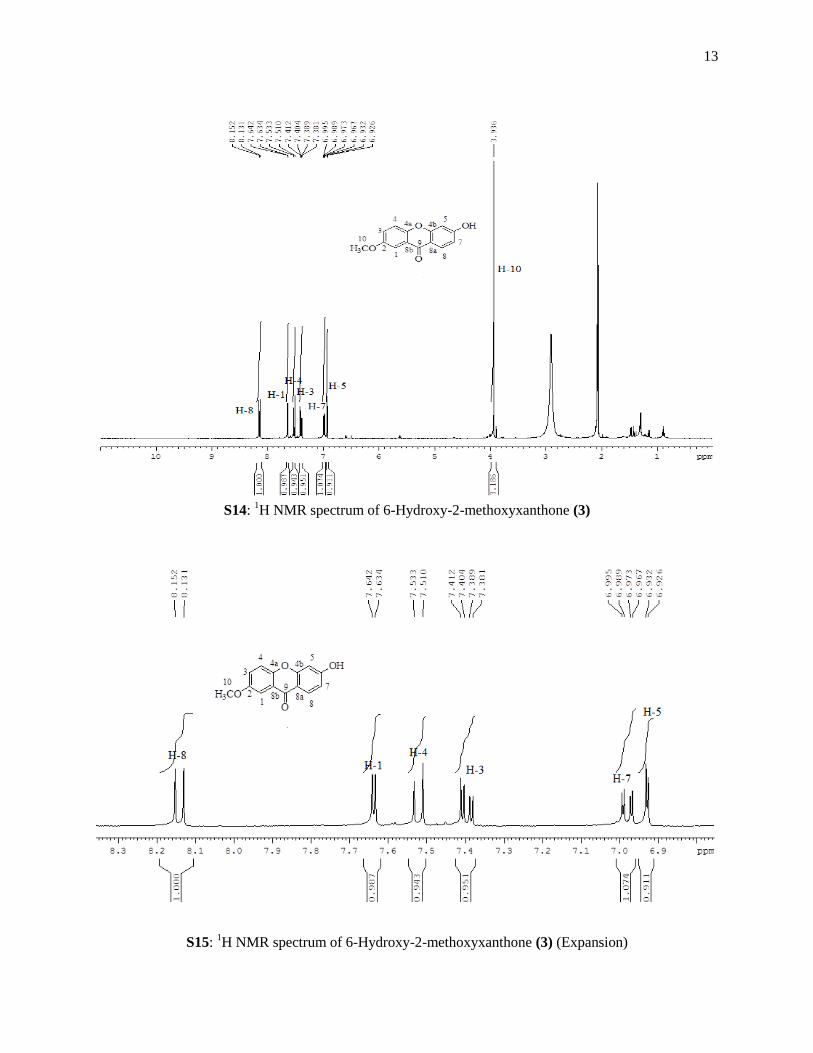
(C-O); 1H NMR (400 MHz, CD3COCD3): δ 3.94 (3H, s, 10-OCH3), 6.93 (1H, d, J = 2.4 Hz, H-5), 6.98
(1H, dd, J = 8.8 and 2.4 Hz, H-7), 7.40 (1H, dd, J = 9.2 and 3.2 Hz, H-3), 7.53 (1H, d, J = 9.2 Hz, H-4),
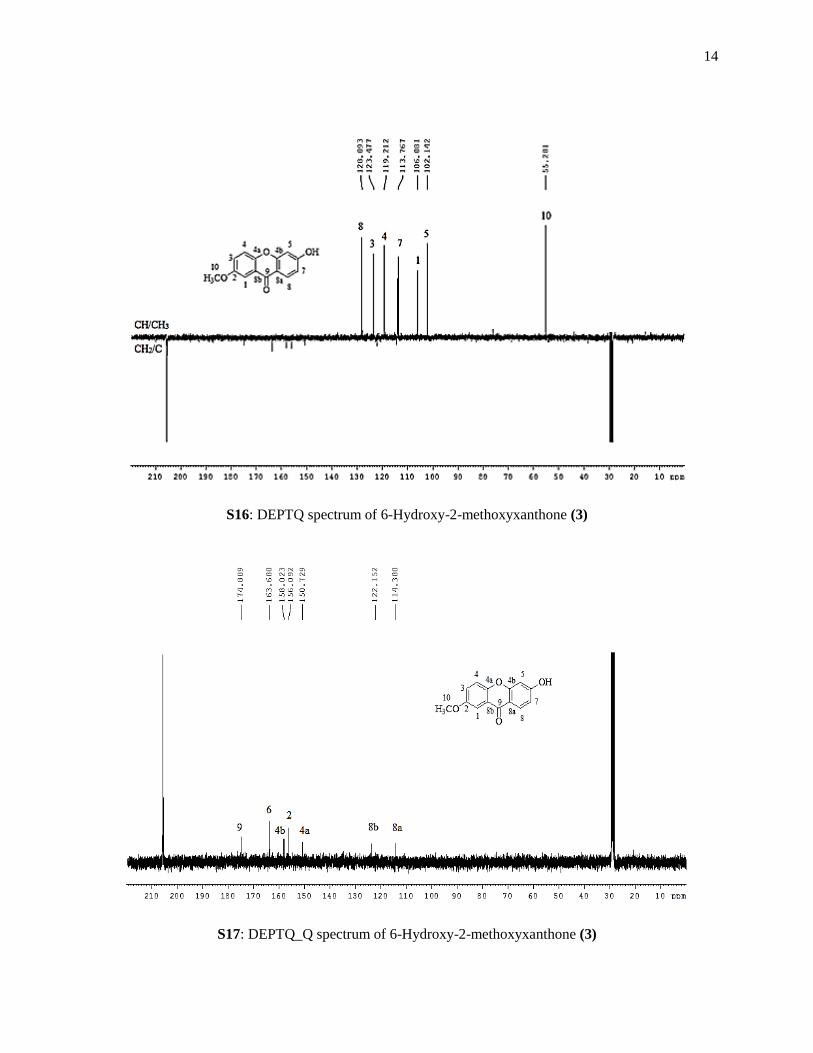
7.64 (1H, d, J = 3.2 Hz, H-1), 8.14 (1H, d, J = 8.8 Hz, H-8) and 9.93 (1H, s, 6-OH); 13
C NMR (100 MHz,
CD3COCD3): δ 55.3 (C-10), 102.1 (C-5), 106.1 (C-1), 113.8 (C-7), 114.4 (C-8a), 119.2 (C-4), 122.2 (C-
8b), 123.5 (C-3), 128.1 (C-8), 150.7 (C-4a), 156.1 (C-2), 158.0 (C-4b), 163.7 (C-6) and 174.9 (C-9);
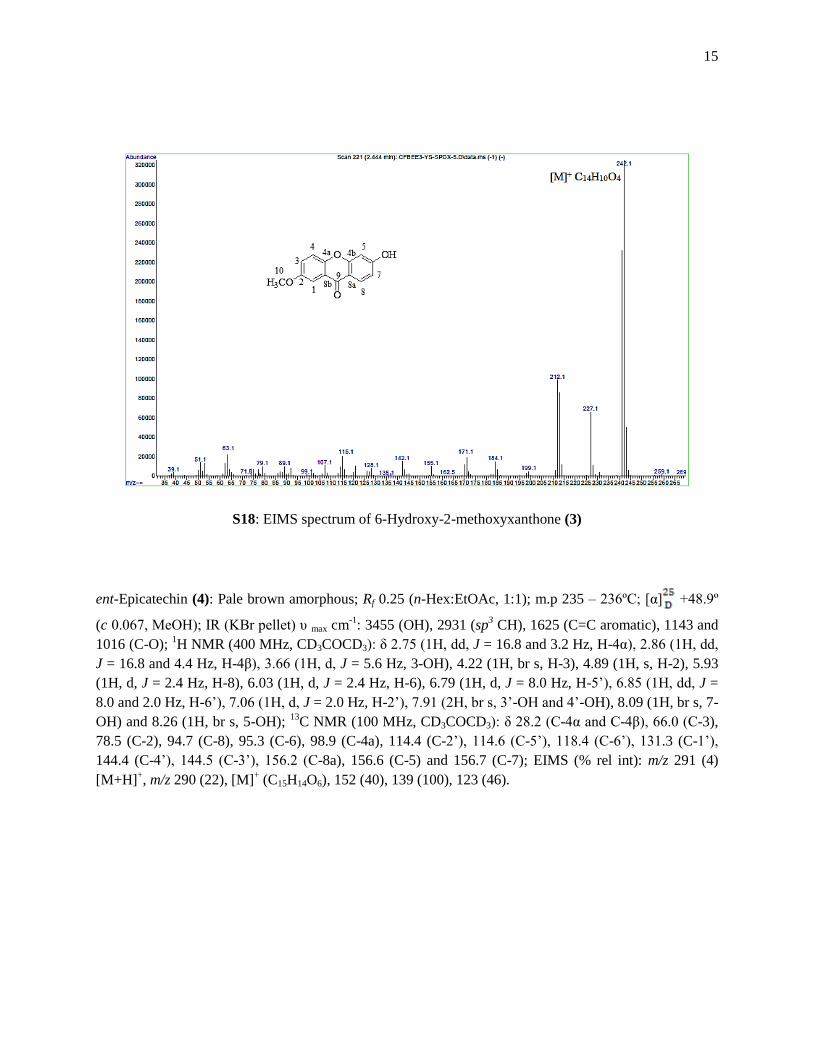
EIMS (% rel int): m/z 242 (100), [M]+ (C14H10O4), 227 (24), 212 (31).
S13: IR spectrum of 6-Hydroxy-2-methoxyxanthone (3)
13
S14:
1H NMR spectrum of 6-Hydroxy-2-methoxyxanthone (3)
S15: 1H NMR spectrum of 6-Hydroxy-2-methoxyxanthone (3) (Expansion)
14
S16: DEPTQ spectrum of 6-Hydroxy-2-methoxyxanthone (3)
S17: DEPTQ_Q spectrum of 6-Hydroxy-2-methoxyxanthone (3)
15
S18: EIMS spectrum of 6-Hydroxy-2-methoxyxanthone (3)
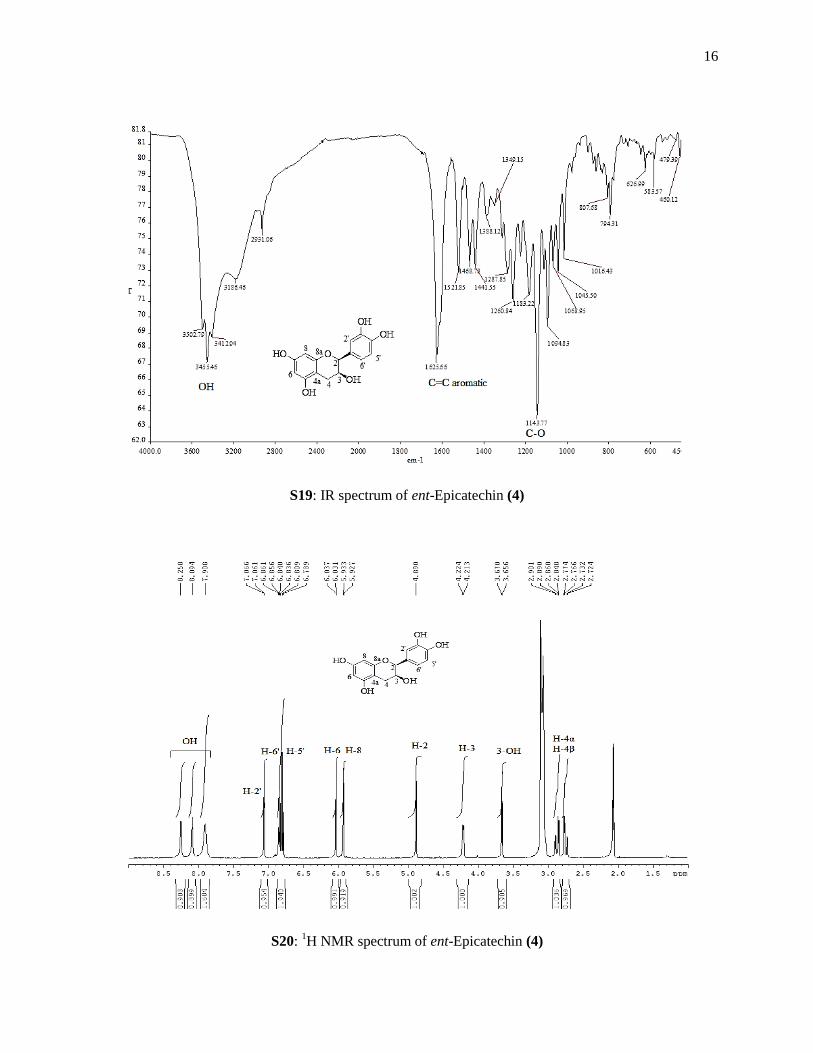
ent-Epicatechin (4): Pale brown amorphous; Rf 0.25 (n-Hex:EtOAc, 1:1); m.p 235 – 236ºC; [α] +48.9º
(c 0.067, MeOH); IR (KBr pellet) υ max cm-1
: 3455 (OH), 2931 (sp3 CH), 1625 (C=C aromatic), 1143 and
1016 (C-O); 1H NMR (400 MHz, CD3COCD3): δ 2.75 (1H, dd, J = 16.8 and 3.2 Hz, H-4α), 2.86 (1H, dd,
J = 16.8 and 4.4 Hz, H-4β), 3.66 (1H, d, J = 5.6 Hz, 3-OH), 4.22 (1H, br s, H-3), 4.89 (1H, s, H-2), 5.93
(1H, d, J = 2.4 Hz, H-8), 6.03 (1H, d, J = 2.4 Hz, H-6), 6.79 (1H, d, J = 8.0 Hz, H-5’), 6.85 (1H, dd, J =
8.0 and 2.0 Hz, H-6’), 7.06 (1H, d, J = 2.0 Hz, H-2’), 7.91 (2H, br s, 3’-OH and 4’-OH), 8.09 (1H, br s, 7-
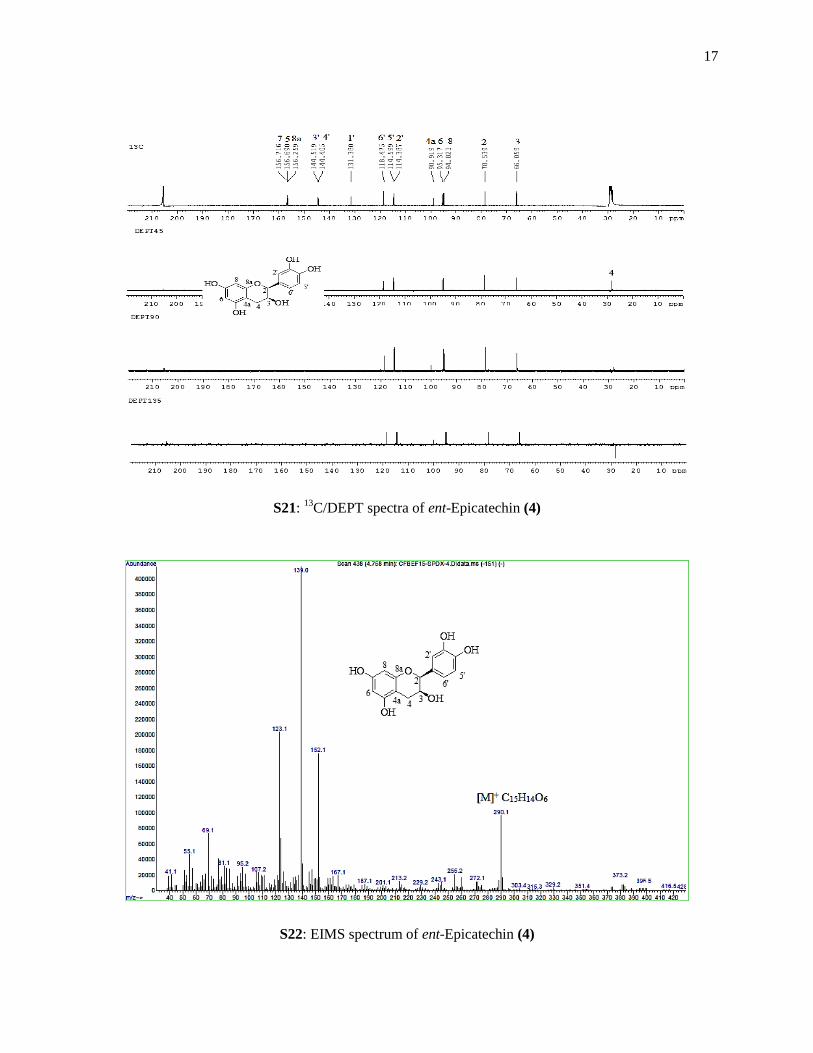
OH) and 8.26 (1H, br s, 5-OH); 13
C NMR (100 MHz, CD3COCD3): δ 28.2 (C-4α and C-4β), 66.0 (C-3),
78.5 (C-2), 94.7 (C-8), 95.3 (C-6), 98.9 (C-4a), 114.4 (C-2’), 114.6 (C-5’), 118.4 (C-6’), 131.3 (C-1’),
144.4 (C-4’), 144.5 (C-3’), 156.2 (C-8a), 156.6 (C-5) and 156.7 (C-7); EIMS (% rel int): m/z 291 (4)
[M+H]+, m/z 290 (22), [M]
+ (C15H14O6), 152 (40), 139 (100), 123 (46).
16
S19: IR spectrum of ent-Epicatechin (4)
S20: 1H NMR spectrum of ent-Epicatechin (4)
17
S21: 13
C/DEPT spectra of ent-Epicatechin (4)
S22: EIMS spectrum of ent-Epicatechin (4)
18
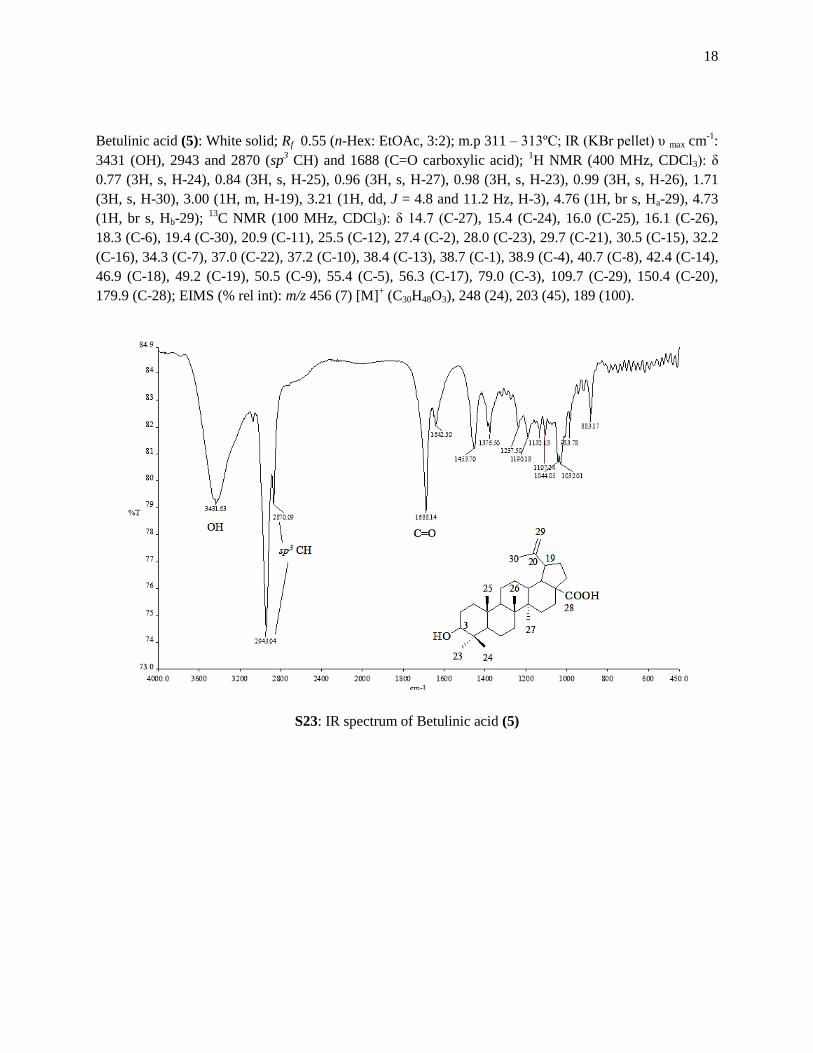
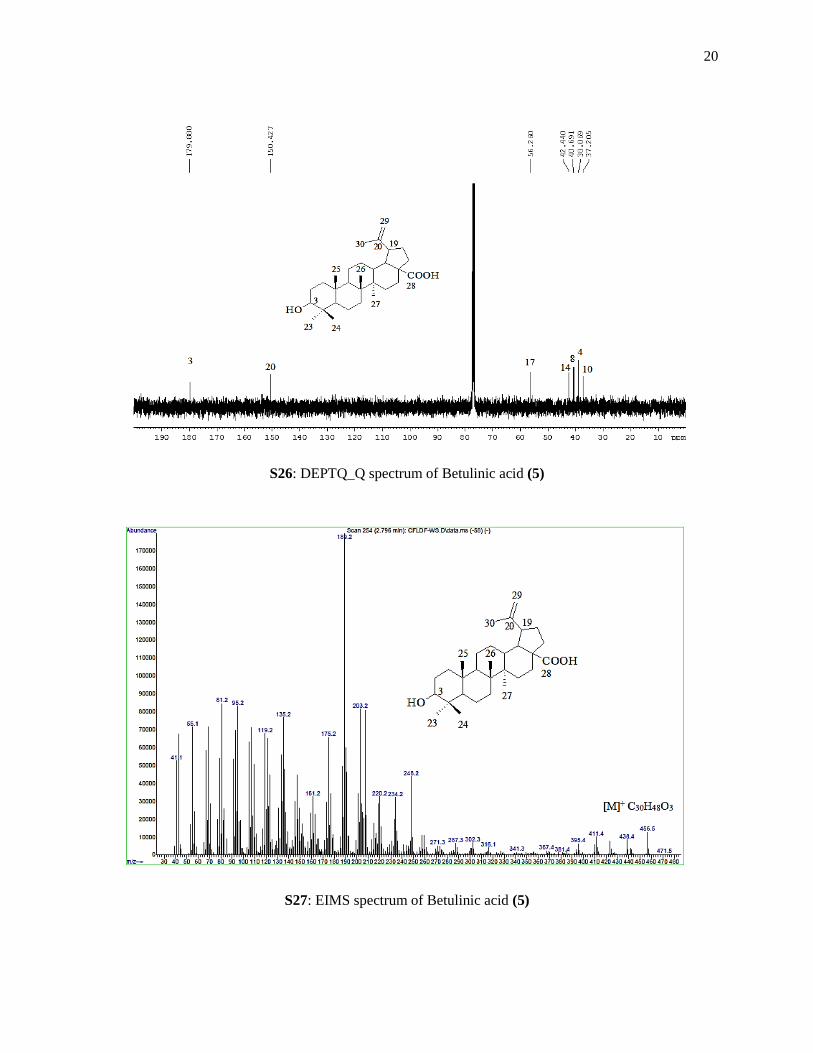
Betulinic acid (5): White solid; Rf 0.55 (n-Hex: EtOAc, 3:2); m.p 311 – 313ºC; IR (KBr pellet) υ max cm-1
:
3431 (OH), 2943 and 2870 (sp3 CH) and 1688 (C=O carboxylic acid);
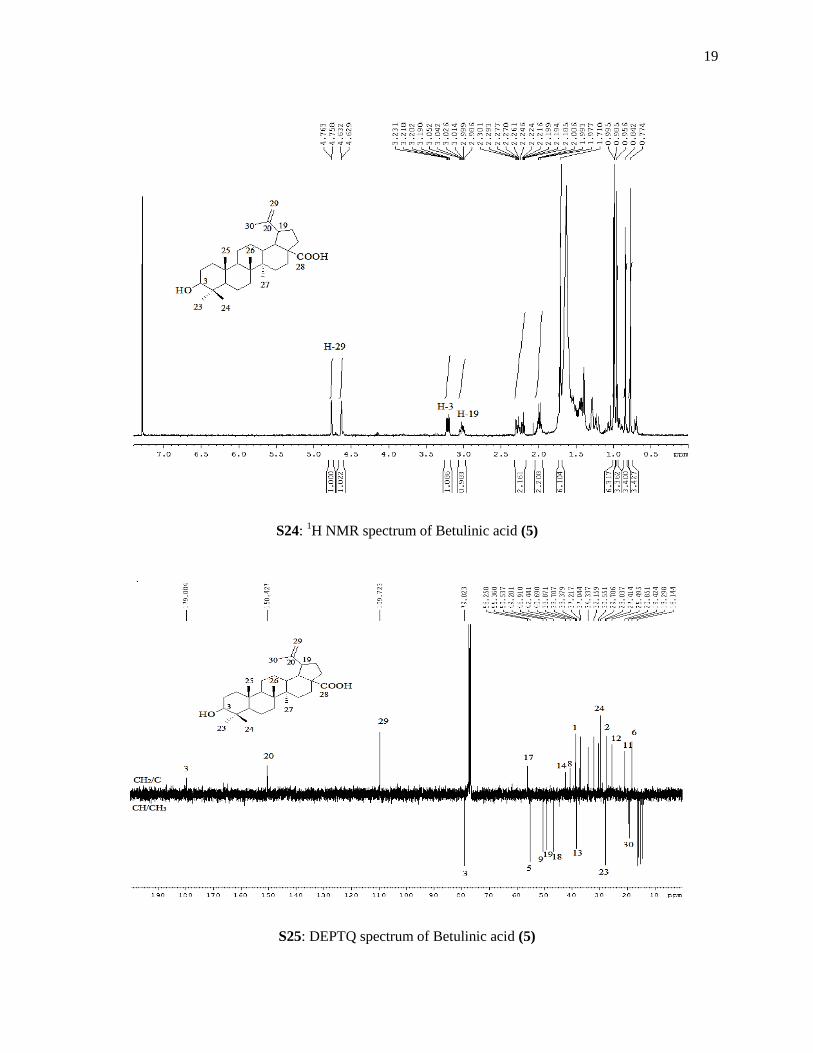
1H NMR (400 MHz, CDCl3): δ
0.77 (3H, s, H-24), 0.84 (3H, s, H-25), 0.96 (3H, s, H-27), 0.98 (3H, s, H-23), 0.99 (3H, s, H-26), 1.71
(3H, s, H-30), 3.00 (1H, m, H-19), 3.21 (1H, dd, J = 4.8 and 11.2 Hz, H-3), 4.76 (1H, br s, Ha-29), 4.73
(1H, br s, Hb-29); 13
C NMR (100 MHz, CDCl3): δ 14.7 (C-27), 15.4 (C-24), 16.0 (C-25), 16.1 (C-26),
18.3 (C-6), 19.4 (C-30), 20.9 (C-11), 25.5 (C-12), 27.4 (C-2), 28.0 (C-23), 29.7 (C-21), 30.5 (C-15), 32.2
(C-16), 34.3 (C-7), 37.0 (C-22), 37.2 (C-10), 38.4 (C-13), 38.7 (C-1), 38.9 (C-4), 40.7 (C-8), 42.4 (C-14),
46.9 (C-18), 49.2 (C-19), 50.5 (C-9), 55.4 (C-5), 56.3 (C-17), 79.0 (C-3), 109.7 (C-29), 150.4 (C-20),
179.9 (C-28); EIMS (% rel int): m/z 456 (7) [M]+ (C30H48O3), 248 (24), 203 (45), 189 (100).
S23: IR spectrum of Betulinic acid (5)
19
S24: 1H NMR spectrum of Betulinic acid (5)
S25: DEPTQ spectrum of Betulinic acid (5)
20
S26: DEPTQ_Q spectrum of Betulinic acid (5)
S27: EIMS spectrum of Betulinic acid (5)
21
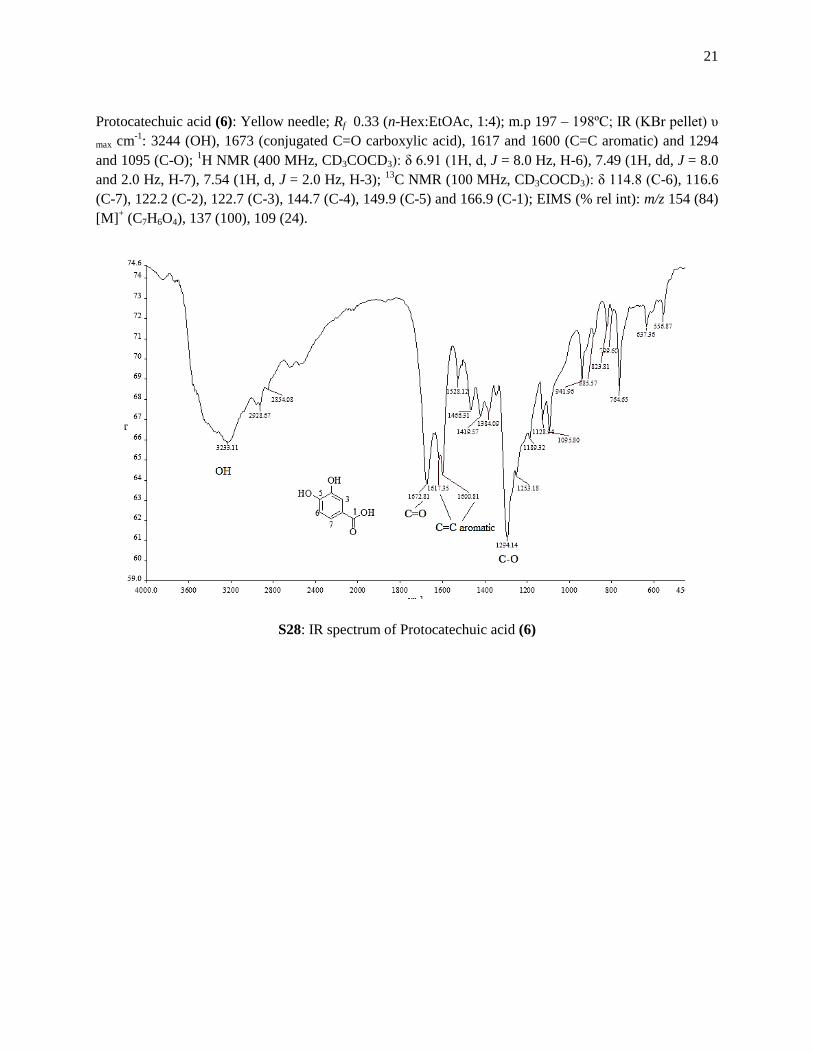
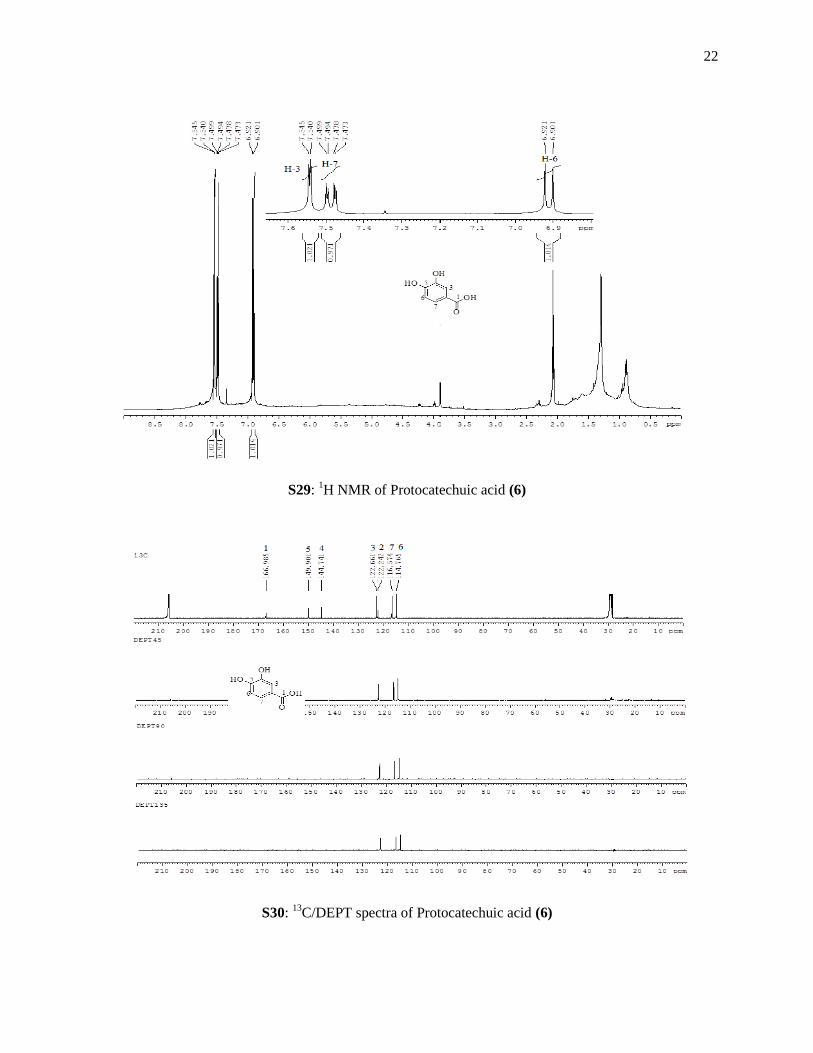
Protocatechuic acid (6): Yellow needle; Rf 0.33 (n-Hex:EtOAc, 1:4); m.p 197 – 198ºC; IR (KBr pellet) υ
max cm-1
: 3244 (OH), 1673 (conjugated C=O carboxylic acid), 1617 and 1600 (C=C aromatic) and 1294
and 1095 (C-O); 1H NMR (400 MHz, CD3COCD3): δ 6.91 (1H, d, J = 8.0 Hz, H-6), 7.49 (1H, dd, J = 8.0
and 2.0 Hz, H-7), 7.54 (1H, d, J = 2.0 Hz, H-3); 13
C NMR (100 MHz, CD3COCD3): δ 114.8 (C-6), 116.6
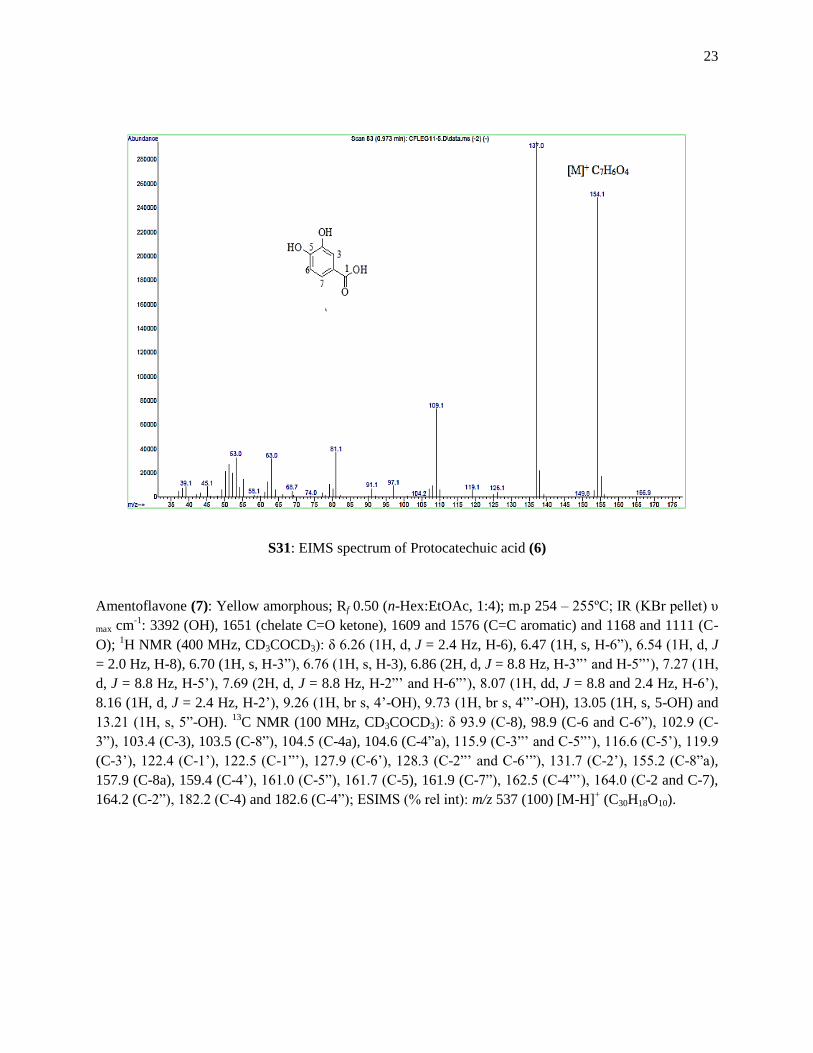
(C-7), 122.2 (C-2), 122.7 (C-3), 144.7 (C-4), 149.9 (C-5) and 166.9 (C-1); EIMS (% rel int): m/z 154 (84)
[M]+ (C7H6O4), 137 (100), 109 (24).
S28: IR spectrum of Protocatechuic acid (6)
22
S29: 1H NMR of Protocatechuic acid (6)
S30: 13
C/DEPT spectra of Protocatechuic acid (6)
23
S31: EIMS spectrum of Protocatechuic acid (6)
Amentoflavone (7): Yellow amorphous; Rf 0.50 (n-Hex:EtOAc, 1:4); m.p 254 – 255ºC; IR (KBr pellet) υ
max cm-1
: 3392 (OH), 1651 (chelate C=O ketone), 1609 and 1576 (C=C aromatic) and 1168 and 1111 (C-
O); 1H NMR (400 MHz, CD3COCD3): δ 6.26 (1H, d, J = 2.4 Hz, H-6), 6.47 (1H, s, H-6”), 6.54 (1H, d, J
= 2.0 Hz, H-8), 6.70 (1H, s, H-3”), 6.76 (1H, s, H-3), 6.86 (2H, d, J = 8.8 Hz, H-3”’ and H-5”’), 7.27 (1H,
d, J = 8.8 Hz, H-5’), 7.69 (2H, d, J = 8.8 Hz, H-2”’ and H-6”’), 8.07 (1H, dd, J = 8.8 and 2.4 Hz, H-6’),
8.16 (1H, d, J = 2.4 Hz, H-2’), 9.26 (1H, br s, 4’-OH), 9.73 (1H, br s, 4”’-OH), 13.05 (1H, s, 5-OH) and
13.21 (1H, s, 5”-OH). 13
C NMR (100 MHz, CD3COCD3): δ 93.9 (C-8), 98.9 (C-6 and C-6”), 102.9 (C-
3”), 103.4 (C-3), 103.5 (C-8”), 104.5 (C-4a), 104.6 (C-4”a), 115.9 (C-3”’ and C-5”’), 116.6 (C-5’), 119.9
(C-3’), 122.4 (C-1’), 122.5 (C-1”’), 127.9 (C-6’), 128.3 (C-2”’ and C-6’”), 131.7 (C-2’), 155.2 (C-8”a),
157.9 (C-8a), 159.4 (C-4’), 161.0 (C-5”), 161.7 (C-5), 161.9 (C-7”), 162.5 (C-4”’), 164.0 (C-2 and C-7),
164.2 (C-2”), 182.2 (C-4) and 182.6 (C-4”); ESIMS (% rel int): m/z 537 (100) [M-H]+ (C30H18O10).
24
S32: IR spectrum of Amentoflavone (7)
S33: 1H NMR of Amentoflavone (7)
25
S34: 1H NMR of Amentoflavone (7) (Expansion)
S35: DEPTQ spectra of Amentoflavone (7)
26
S36: DEPTQ-Q spectrum of Amentoflavone (7)
S37: ESIMS spectrum of Amentoflavone (7)
27
References
[1] A. A. Kaikabo and J. N. Eloff (2011). Antibacterial activity of two biflavonoids from Garcinia
livingstonei leaves against Mycobacterium smegmatis, J. Ethnopharmacol. 138, 253–255.
[2] T. Mosmann (1983). Rapid colorimetric assay for cellular growth and survival: Application to
proliferation and cytotoxicity assays, J. Immunol. Methods, 65, 55–63.
[3] M. Taher, D. Susanti, M. F. Rezali, F. S. A. Zohri, S. J.A. Ichwan, S.I. Alkhamaiseh and F.
Ahmad (2012). Apoptosis, antimicrobial and antioxidant activities of phytochemicals from
Garcinia malaccensis Hk.f., Asian Pac. J. Trop. Med. 5, 136–141.
[4] A. S. Ahmed, E. E. Elgorashi, N. Moodley, L. J. McGaw, V. Naidoo and J. Eloff (2012). The
antimicrobial, antioxidative, anti-inflammatory activity and cytotoxicity of different fractions of
four South African Bauhinia species used traditionally to treat diarrhoea, J. Ethnopharmacol. 143,
826–839.
[5] S. Perumal, S. Pillai, L. W. Cai, R. Mahmud and S. Ramanathan (2012). Determination of
minimum inhibitory concentration of Euphorbia hirta (L.) extracts by tetrazolium microplate
assay, J. Nat. Prod. 5, 68–76.
[6] C. Sarikurkcu, G. Zengin, M. Oskay, S. Uysal, R. Ceylan and A. Aktumsek (2015).Composition,
antioxidant, antimicrobial and enzyme inhibition activities of two Origanum vulgare subspecies
(subsp. vulgare and subsp. hirtum) essential oils, Ind. Crops. Prod. 70, 178–184.
[7] A. S. Sufian, K. Ramasamy, N. Ahmat, Z. A. Zakaria and M. I. M. Yusof (2013). Isolation and
identification of antibacterial and cytotoxic compounds from the leaves of Muntingia calabura L.,
J. Ethnopharmacol. 146, 198–204.