Embed Size (px)
Citation preview

Monika KellererMarienhospital Stuttgart
Ärztliche DirektorinZentrum für Innere Medizin I
Diabetes Update

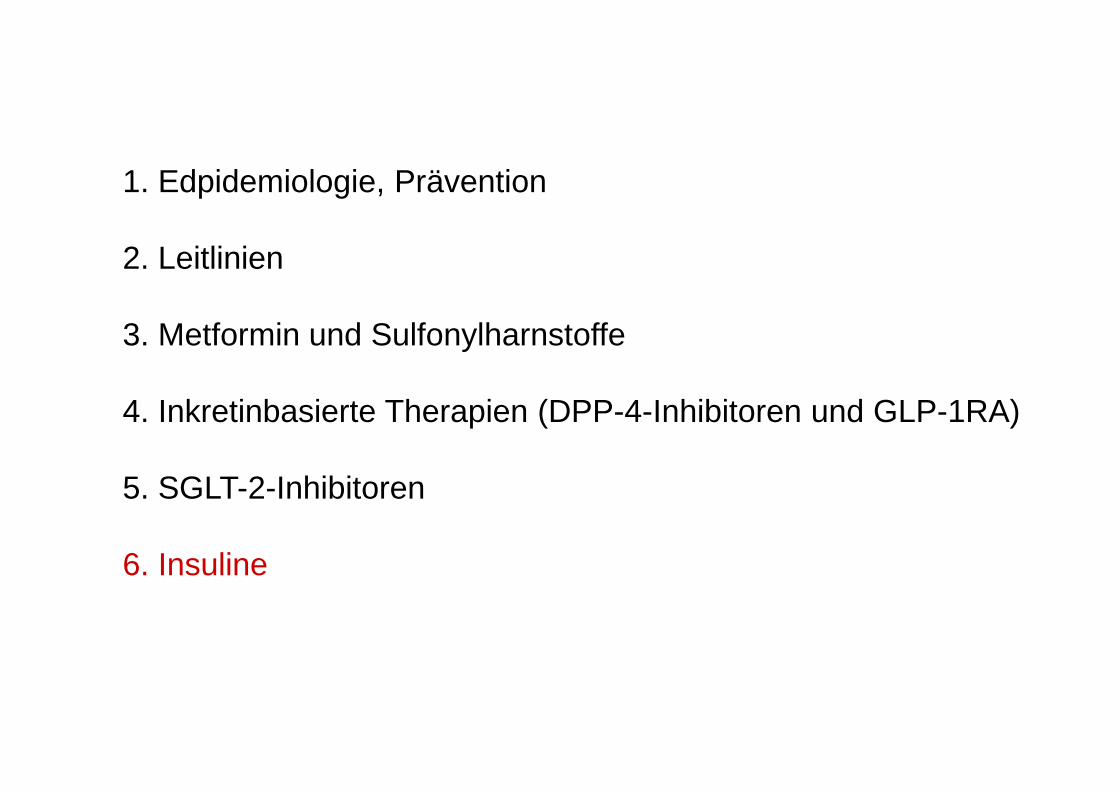
1. Edpidemiologie, Prävention
2. Leitlinien
3. Metformin und Sulfonylharnstoffe
4. Inkretinbasierte Therapien (DPP-4-Inhibitoren und GLP-1RA)
5. SGLT-2-Inhibitoren
6. Insuline

International Diabetes Federation, 2014.
Zahlen zur Diabetesepidemiologie:IDF Atlas 2014

Lebensstilintervention kann die Manifestation von Diabetes bei Patienten mit Prädiabetes verzögern (Diabetes Prevention Program Outcomes Study)
Diabetes Prevention Program Research Group Lancet 2009; 374:1677-86 und ADA San Francisco 2014
0 1 2 3 4 5 6 7 8 9 100
10
20
30
40
50
60
Kum
ulat
ive
Inzi
denz
(%
)
-34%
LebensstilMetforminPlacebo
15J Follow up
-18%-27%

Langfristige und positive Effekte einer Lebensstili ntervention23 Jahre Follow up aus der Da Qing Diabetes Prevent ion Study
Li G, et al., Lancet Diabetes Endocrinol 2014, 2:474-80
RR-48%-65%-21%
RR-13%-21%-19%

Diabetes Care 2015, 38: Suppl 1, S41-48
Standards of Care, ADA 2015Approaches to Glycemic Treatment,

1. Edpidemiologie, Prävention
2. Leitlinien
3. Metformin und Sulfonylharnstoffe
4. Inkretinbasierte Therapien (DPP-4-Inhibitoren und GLP-1RA)
5. SGLT-2-Inhibitoren
6. Insuline

ADA Statement zu Metformin bei eingeschränkter Nierenfunktion:

Aktuelle NVL-Empfehlung zu Metformin bei eingeschränkter Nierenfunktion:
(Quelle: NVL Antihyperglykämische Therapie des Diabetes mellitus Typ-2www.versorgungsleitlinien.de, Seite 144)


Odds ratios for all-cause mortality during SH treatment: Any SH (monotherapy combination) versus any non-SH treatment Analysis included non-randomized cohort studies only; I2 = 97,1; p = 0,0001.
Sulfonylharnstoff-Therapie und Assoziation mit„All-cause“ Mortalität
SH = Sulfonylharnstoff, I 2 = Maß der Heterogenität, RE Model = Random Effects Model
Author(s) and Year alive (N) deaths (N)non-SHSH
alive (N) deaths (N)
Evans et al., 2006
Johnson et al., 2005
Schramm et al., 2011
Schramm et al., 2011
Sillars et al., 2010
5.308
2.899
57.757
5.278
396
373
320
3.942
961
137
2.248
862
42.513
2.737
503
38
61
827
169
81
RE Model
Odds Ratios [95% Cl]
4.16 [ 2.97, 5.83 ]
1.56 [ 1.17, 2.07 ]
3.51 [ 3.25, 3.79 ]
2.95 [ 2.49, 3.49 ]
2.15 [ 1.58, 2.91 ]
2.72 [ 1.95, 3.79 ]
0.05 0.25 1.00 6.00
Odds Ratio (log scale)
Forst et al., Diabetes & Vascular Disease Research, Jan 7, 2013

Warfarin
33%
Trombozyten -aggregations-
hemmer
11%
Insulin
13%
orale
Antidiabetika/SH
11%
Andere
32%
Warfarin
Trombozyten-aggregationshemmerInsulin
orale Antidiabetika
andere Medikamente
Krankenhauseinweisungen in den USA aufgrund von Medikamenten
Modifiziert nach Budnitz et al. N Engl J Med. 2011 Nov 24;365(21):2002-12
Orale Antidiabetika: 10.656 stationäre Einweisungen
Alter über 65 Jahre. Analyse von 5.077 Fällen

1. Edpidemiologie, Prävention
2. Leitlinien
3. Metformin und Sulfonylharnstoffe
4. Inkretinbasierte Therapien (DPP-4-Inhibitoren und GLP-1RA)
5. SGLT-2-Inhibitoren
6. Insuline

GLP-1 Rezeptor-Analoga
Exenatid 2xtgl. und 1xwöchentlich
Liraglutid 1x täglich
Albiglutid 1xwöchentlich
Dulaglutid 1xwöchentlich

GLP-1 Analoga mit einmal wöchentlicher Gabe


Dulaglutide: Development Program
• Five pivotal studies, AWARD 1 – 5• Long-term Phase 3 cardiovascular outcome study, REWIND, currently
enrolling patients
AWARD = Assessment of Weekly AdministRation of LY2189265 in DiabetesREWIND = Researching Cardiovascular Events with a Weekly INcretin in Diabetes

Efficacy and Safety of Dulaglutide vs Comparator in Type 2 Diabetes
(AWARD-1)
Carol Wysham1, Thomas Blevins2, Richard Arakaki3, Gildred Colon4, Pedro Garcia5, Charles Atisso6, Debra Kuhstoss6, Jamie Scism-Bacon6, Mark Lakshmanan6
1Spokane, Washington, USA; 2Austin, Texas, USA; 3Honolulu, Hawaii, USA; 4San Juan, Puerto Rico; 5Monterrey, Mexico; 6Indianapolis, Indiana, USA
Oral presentation presented at the American Diabete s Association’s 73 rd Scientific Sessions; June 21-25, 2013; Chicago, IL. Oral Presentation 66-OR
Wysham et al., Canadian J Diabetes 2013

HbA1c-Änderung mit Dulaglutide
19
††p<0.001, superiority vs EX BID 10 µg a; *p<0.001, superiority vs PL a, §§§§ p<0.001 vs PLa1-sided p-value adjusted for multiplicity, based on a procedure to control Type 1 errorITT without post-rescue values, ANCOVA using LOCF analysis
Week 26
Baseline A1C = 8.07%
-1.51
-1.3
-0.99
-0.46
-1.8
-1.6
-1.4
-1.2
-1.0
-0.8
-0.6
-0.4
-0.2
0.0
DU 1.5 mg
DU 0.75 mg
EX BID
PL
A1C, Change from Baseline(%, LS Mean
SE)
††, *
††
- 1.05 ( - 1.22, - 0.88) *
Wysham C et al. Diabetes, 2013;62(Suppl 1):66Wysham et al., Canadian J Diabetes 2013

Weight Change Over Time to 26 Weeks
20
* p<0.05 vs PL; # p<0.05 vs EX BIDITT without post-rescue values, MMRM analysis
- 1.50
0.04
- 1.34
1.39
-2.2
-1.7
-1.2
-0.7
-0.2
0.3
0.8
1.3
1.8
2.3
0 2 4 6 8 10 12 14 16 18 20 22 24 26
DU 1.5 mg
DU 0.75 mg
EX BID
PL
Weight, Change
from
Baseline
(kg, LS Mean
SE)
Weeks
Baseline Weight = 96.0 kg
*
* , #
*
*
*
* , #
*
*
* , #
* , #
*
* , #
* , #
*
*
Wysham C et al. Diabetes, 2013;62(Suppl 1):66Wysham et al., Canadian J Diabetes 2013

Adverse Events/Hypoglycemia
21
* p<0.05 vs PL; # p<0.05 vs EX BIDaThis case adjudicated as Chronic
26 Weeks DU 1.5 mgN = 279
DU 0.75 mgN = 280
EX BIDN = 276
PLN = 141
Any AE , n (%) 215 (77.1) 199 (71.1) 198 (71.7) 104 (73.8)
Gastrointestinal AE, n (%)Nausea 78 (28.0) * 45 (16.1) *,# 71 (25.7) * 8 (5.7)Vomiting 47 (16.8) *,# 17 (6.1) *,# 30 (10.9) * 2 (1.4)Diarrhea 31 (11.1) 22 (7.9) 16 (5.8) 8 (5.7)
Injection site reaction, n (%) 8 (2.9) 10 (3.6) 13 (4.7) 2 (1.4)
Hypoglycemia (=70 mg/ dL )Total (events/ pt /year), mean (SD) 0.5 (2.3) 1.1 (5.9) 1.5 (5.7) 0.4 (2.6)
Severe Hypoglycemia, n (%) 0 0 1 (0.4) 0
52 Weeks DU 1.5 mg/DU 0.75 mgN = 559
EX BIDN = 276
PLN = 141
Pancreatitis, n (n/1000 pt yrs) 1a (1.8) 0 (0.0) 0 (0.0)
Pancreatic cancer, n 1 0 0
Wysham C et al. Diabetes, 2013;62(Suppl 1):66Wysham et al., Canadian J Diabetes 2013

Sicherheit inkretinbasierten Therapien

1. Edpidemiologie, Prävention
2. Leitlinien
3. Metformin und Sulfonylharnstoffe
4. Inkretinbasierte Therapien (DPP-4-Inhibitoren und GLP-1RA)
5. SGLT-2-Inhibitoren
6. Insuline

Dapagliflozin Versus Sulfonylurea as Add-on to Metformin: Change in HbA1c Over 4 years
• HbA1c durability was better with dapagliflozin than glipizide– The rise from 52–208 weeks was less compared with g lipizide, giving a significant
difference between treatments at 208 weeks
Del Prato S, et al. ADA 2013; poster 62-LB.
*Data are adjusted mean change from baseline ±95% CI derived from a longitudinal repeated-measures mixed model.

Dapagliflozin Versus Sulfonylurea as Add-on to Metformin: Change in Weight Over 4 years
• Weight reduction with dapagliflozin at 52 weeks was maintained up to 208 weeks, whereas weight gain with glipizide at 52 weeks remained stable
Del Prato S, et al. ADA 2013; poster 62-LB.
*Data are adjusted mean change from baseline ±95% CI derived from a longitudinal repeated-measures mixed model.

Empagliflozin: HbA1c-Senkung bei Patienten mit schlechter glykämischer Kontrolle (HbA1c >10 %)
Open Label-Arme aus 3 Phase-III-Studien
Adjustierte mittlere Veränderung zum HbA1c-Ausgangswert (%, SE)
-3,70 (0,21)1
0
Woche Baseline 6 12 18 24
Monotherapie 87 77 74 73 66
Add-on zu Metformin
69 66 60 58 48
Add-on zu Metformin+SH
101 94 89 77 70
-3,23 (0,22)2
-2,89 (0,16)3
Patienten, n
Roden M, et al. Lancet Diabetes Endocrinol. 2013;1(3):208–19. / 2. Häring HU et al. Diabetes Care. 2014; 37(6):1650-9. / 3. Häring H-U, et al. Diabetes Care. 2013;36:3396–404.

Änderung des Körpergewichts und der Energiezufuhr unter Canagliflozin bei Patienten mit T2DM
Polidori D, et al. Diabetologia (2014); 57:[Suppl1]:S331. Präsentiert auf dem 50th Annual Meeting of the European Association for the Study of Diabetes, Wien, Österreich, 15.-19. September 2014; Poster:#922
Beobachtete Körpergewichtsveränderung*
Plateau ab Woche 26
Glukoseausscheidung & Kalorienverlust:Körpergewicht
–5
–1
0
–2
–4
–3
Kör
perg
ewic
ht (
%)
Zeit (Wochen)
PBO/SITA (n=89) CANA 300mg (n=153)CANA 100mg (n=129)
Berechnete Energiezufuhr
Energiezufuhr
Plateau ab Woche 26: Kalorienverlust = Energiezufuhr
∆E
nerg
iezu
fuhr
(kc
al/T
ag)
–300
0
300
500
400
200
100
–100
–200
Zeit (Wochen)0 6 12 18 26 34 42 520 6 12 18 26 34 42 52
1. Edpidemiologie, Prävention
2. Leitlinien
3. Metformin und Sulfonylharnstoffe
4. Inkretinbasierte Therapien (DPP-4-Inhibitoren und GLP-1RA)
5. SGLT-2-Inhibitoren
6. Insuline

Wirkdauer 6 h 12 h 24 h
Schnell wirkendes Analoginsulin (Glulisin, Lispro, Aspart)
Humaninsulin
Verzögerungsinsulin NPH
Langwirkendes Analoginsulin Glargin
Langwirkendes Analoginsulin Detemir
Insuline unterscheiden sich in ihrer Pharmakokinetik
Langwirkendes Analoginsulin Degludec

Mittlere Glucose-Infusionsrate unter Steady-state-Bedingungen – Insulin degludec
Heise T et al., Diabetes, Obesity and Metabolism 14: 944–950, 2012
Glu
kose
-Inf
usio
nsra
te (
mg/
(kg*
min
))
Zeit seit der Injektion (Stunden)
IDeg 0,4 E/kg
IDeg 0,8 E/kg
IDeg 0,6 E/kg
Insulin degludec Insulin glargin
0,4 E/kg 0,6 E/kg 0,8 E/kg 0,4 E/kg 0,6 E/kg 0,8 E/kg
Halbwertszeit(Stunden)
25,9 27,0 23,9 11,8 14,0 11,9
Mittelwert 25,4 Stunden 12,5 Stunden
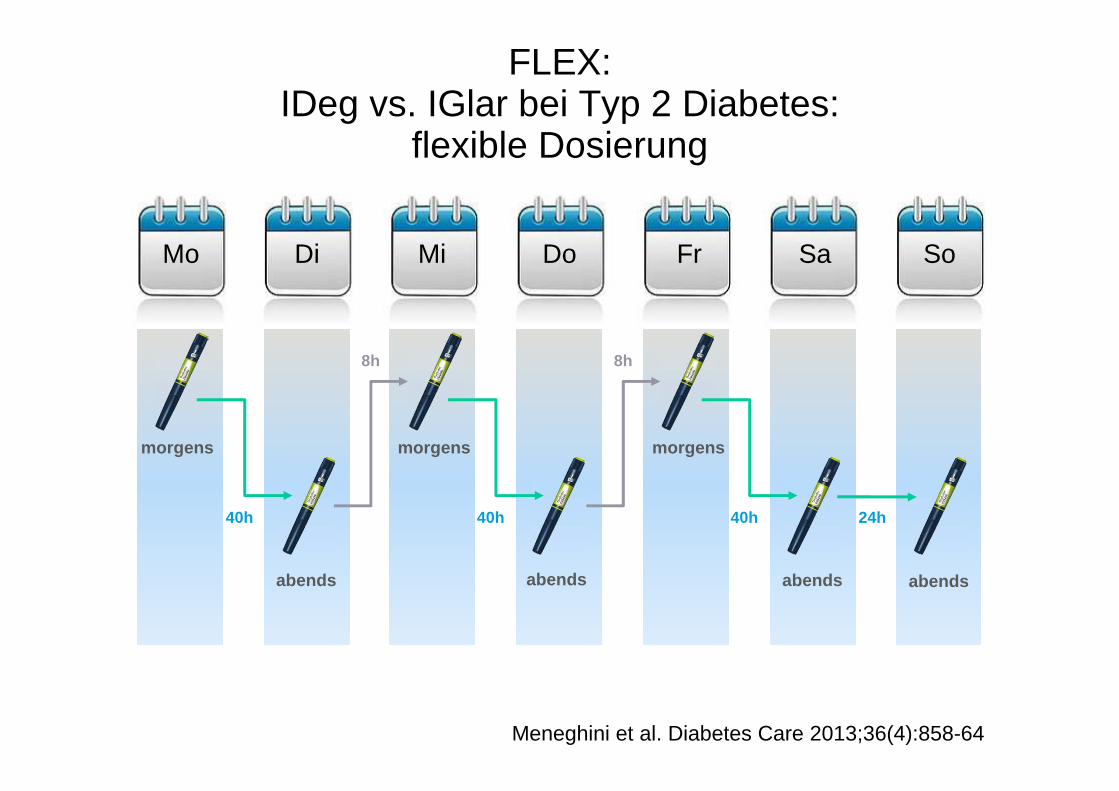
FLEX: IDeg vs. IGlar bei Typ 2 Diabetes:
flexible Dosierung
morgens
Mo Di Mi Do Fr Sa So
morgens morgens
abends abends abends abends
40h 40h 40h
8h 8h
24h
Meneghini et al. Diabetes Care 2013;36(4):858-64

FLEX: HbA1c im Zeitverlauf
6,0
6,5
7,0
7,5
8,0
8,5
9,0
9,5
0 2 4 6 8 10 12 14 16 18 20 22 24 26
Zeit (Wochen)
HbA1c(%)
IDeg Flexibel/IGlar Nicht unterlegen
IDeg Flexibel/IDeg FixNicht unterlegen
0,0
IDeg Flexibel (n=229)
IDeg Fix (n=228)
IGlar (n=230)
Meneghini et al. Diabetes Care 2013;36(4):858-64

FLEX: Bestätigte nächtliche Hypoglykämien
IDeg Flexibel (n=230)
IDeg Fix (n=226)
IGlar (n=229)
Bes
tätig
te n
ächt
liche
Hyp
ogly
käm
ien
(kum
ulat
ive
Anz
ahl d
er E
reig
niss
e pr
o P
atie
nten
jahr
)
0,00
0,04
0,08
0,12
0,16
0,20
0,24
0,28
0,32
0,36
Zeit (Wochen)0 2 4 6 8 10 12 14 16 18 20 22 24 26
23% Risiko-reduktionRR: 0,77
[0,44;1,35]
RR: 1,18[0,66;2,12]
Meneghini et al. Diabetes Care 2013;36(4):858-64
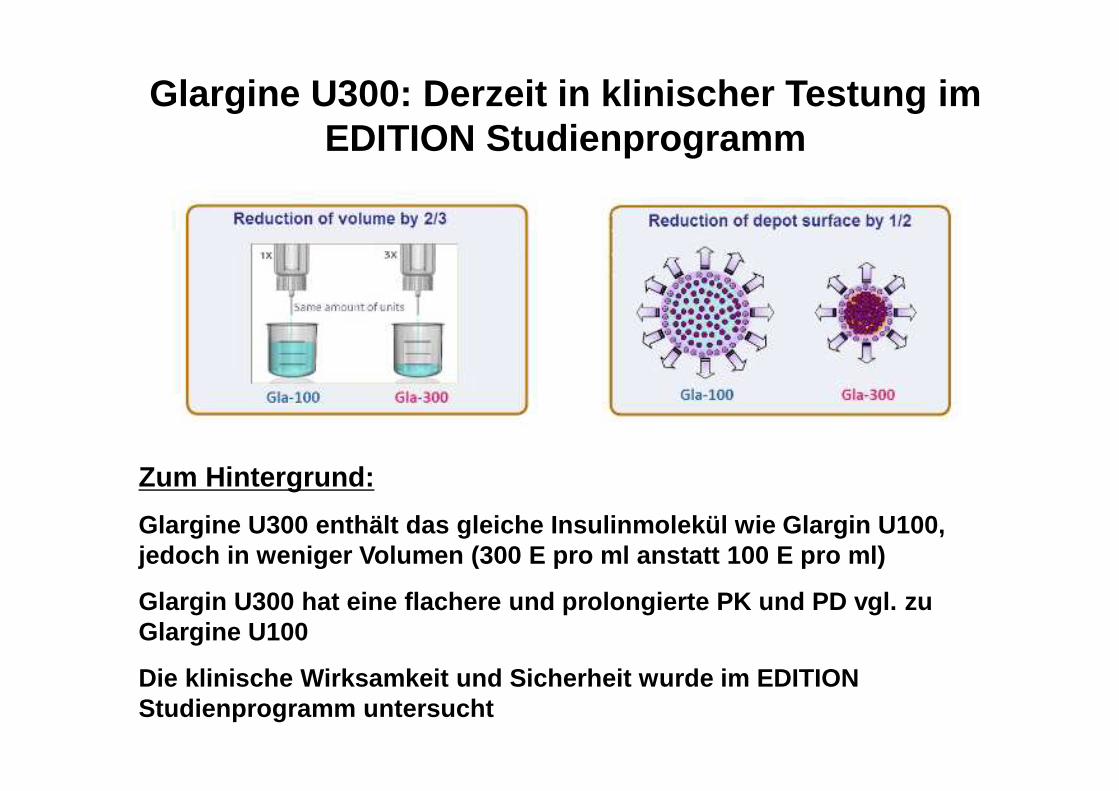
Zum Hintergrund:
Glargine U300 enthält das gleiche Insulinmolekül wi e Glargin U100, jedoch in weniger Volumen (300 E pro ml anstatt 100 E pro ml)
Glargin U300 hat eine flachere und prolongierte PK und PD vgl. zu Glargine U100
Die klinische Wirksamkeit und Sicherheit wurde im E DITION Studienprogramm untersucht
Glargine U300: Derzeit in klinischer Testung im EDITION Studienprogramm

Diabetestechnologieerstmals Alternative zu
BZ-Fingersticks

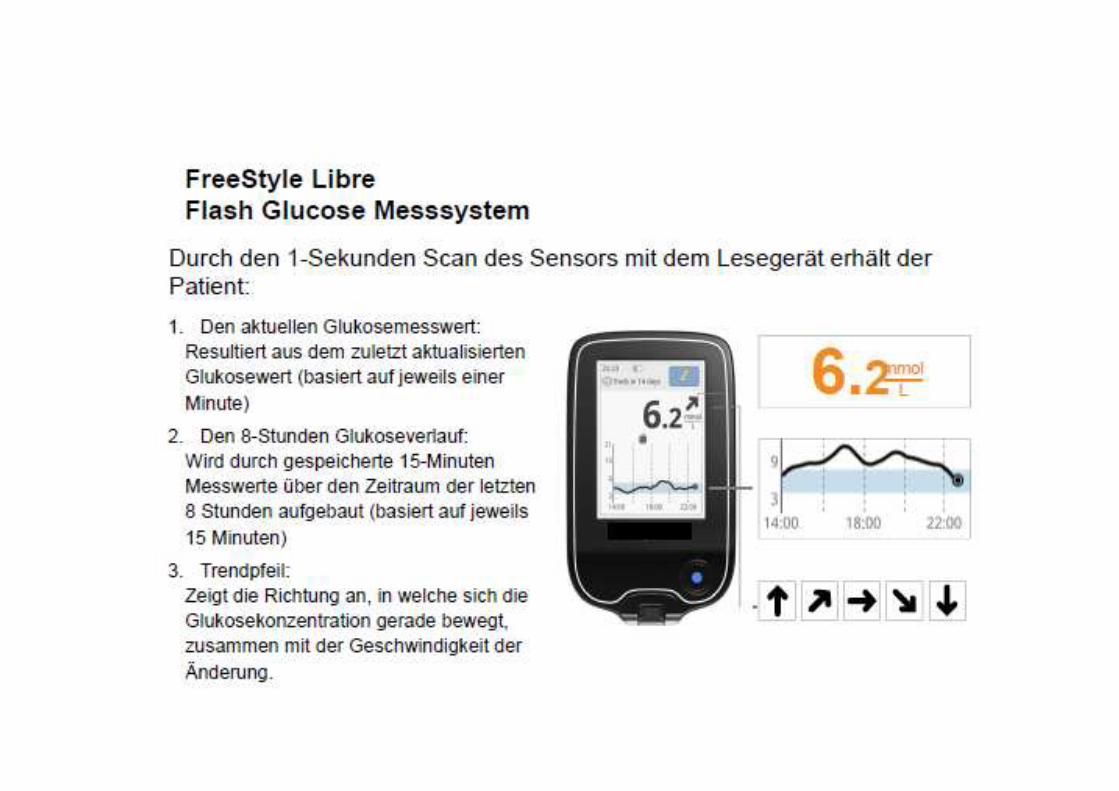
Neue Diabetestechnologie: Glukosebestimmung ohne Blut ( Flash Glucose Monitoring)
Durch 1-Sekunden-Scan des Sensors mit dem Messgerät durch Kleidung bis zu 4 cm erhält der Patient:
• den aktuellen Glukosemesswert
• den 8-Stunden Glukoseverlauf
• den Trend, in welche Richtung sich die Glukosekonzentration gerade bewegt
1. http://abbottnextfrontier.com/freestyle-libre [Zugriff am: 30.09.2014]; 2. Pressemitteilung vom 03.09.2014. Verfügbar unter: https://www.a]bbottdiabetescare.com/press-room/2014/2014-e.html
Beginnt mit Einführung dieser neuen Technologie das Ende der Fingersticks?

Monika KellererMarienhospital Stuttgart
Ärztliche DirektorinZentrum für Innere Medizin I
Vielen Dank für die Aufmerksamkeit!