Embed Size (px)
Citation preview
저 시-비 리- 경 지 2.0 한민
는 아래 조건 르는 경 에 한하여 게
l 저 물 복제, 포, 전송, 전시, 공연 송할 수 습니다.
다 과 같 조건 라야 합니다:
l 하는, 저 물 나 포 경 , 저 물에 적 된 허락조건 명확하게 나타내어야 합니다.
l 저 터 허가를 면 러한 조건들 적 되지 않습니다.
저 에 른 리는 내 에 하여 향 지 않습니다.
것 허락규약(Legal Code) 해하 쉽게 약한 것 니다.
Disclaimer
저 시. 하는 원저 를 시하여야 합니다.
비 리. 하는 저 물 리 목적 할 수 없습니다.
경 지. 하는 저 물 개 , 형 또는 가공할 수 없습니다.
한국 성인에서 사구체여과율과 알부민뇨로
정의한 만성신질환과 비만의 연 성
-국민건강 양조사 제5기 2, 3차년도 (2011, 2012)와
제6기 1, 2차년도 (2013, 2014) 자료를 이용하여-
연세대학교 보건대학원
역학건강증진학과 역학 공
김 윤 지
한국 성인에서 사구체여과율과 알부민뇨로
정의한 만성신질환과 비만의 연 성
-국민건강 양조사 제5기 2, 3차년도 (2011, 2012)와
제6기 1, 2차년도 (2013, 2014) 자료를 이용하여-
지도 지 선 하 교수
이 논문을 보건학석사 학 논문으로 제출함
2016년 6월 일
연세대학교 보건대학원
역학건강증진학과 역학 공
김 윤 지
김윤지의 보건학석사 학 논문을 인준함
연세대학교 보건대학원
2016년 6월 일
감사의 말
2년이라는 시간 동안 에게는 많은 변화가 있었습니다. 그 에서 가장 보
람된 일 하나가 연세 학교 보건 학원생이 된 것입니다. 병원 일을 하면
서 공부를 하는 것이 힘들 때도 있었지만, 여러 교수님들의 재미있는 강의를
들으며 제 자신이 성장해 나가는 것을 느낄 때 뿌듯하 고, 열정 이고 성실
한 학원 동기들과의 만남은 제 생활의 활력소가 되어주었습니다. 늦게 시작
한 석사 과정이지만 여러 과목들을 배우면서 보건의료인으로서 알아야하고 공
부해야할 것이 많다는 것을 깨달았고 배움의 시간들이 무척 소 하고 즐거웠
습니다. 아직도 배우고 싶은 것들이 많은데 졸업을 해야한다는 것이 아쉽기도
합니다.
이 을 쓰면서 제 인생에 도움을 주신 분들이 무나 많다는 것을 새삼
깨닫습니다. 우선 역사 깊은 연세 학교 보건 학원에 입학을 허락해주시고
논문이 완성되기까지 자상하게 지도해주신 지선하 교수님과 김희진 교수님께
깊은 감사의 말 을 올립니다. 한 친 히 논문을 지도해주신 김 창 교수님
께도 깊은 감사를 드립니다. 가르침을 주신 모든 교수님들과 조교 선생님들께
감사드리며, 특히 인간미 넘치는 통계 강의를 해주셨던 남정모 교수님과 박소
희 교수님께 진심으로 감사드립니다.
내분비내과를 공할 수 있도록 해주시고 심과 애정을 주셨던 김세화 교
수님께 감사의 말 을 올립니다. 임의 시 에 학원을 시작할 수 있도록
배려해 주시고 격려해 주신 장학철 교수님께 깊은 감사를 드립니다. 부족한
에게 다양한 연구의 기회와 가르침을 주신 임수 교수님, 최성희 교수님, 김
경민 교수님께도 깊은 감사의 마음을 하고 싶습니다. 논문과 연구 활동을
많이 챙겨주셨던 조 민 교수님, 곽수헌 교수님, 김정희 교수님께도 진심으로
감사의 말씀을 드리고 싶습니다. 그리고 병원 생활을 하면서 학원 공부를
지속할 수 있도록 배려해 주신 이동엽 병원장님, 안풍기 표원장님께도 감사
의 말씀을 드립니다.
마지막으로 다 큰 딸을 아직까지도 걱정해 주시고 학원 생활을 늘 격려
해 주신 사랑하는 부모님과 같은 곳을 바라보며 용기를 잃지 않고 인생의 길
을 걸어갈 수 있도록 도와주는 한결같은 남편, 언제나 밝고 씩씩한 딸에게 마
음 깊이 사랑을 합니다.
2016년 6월
김윤지 올림
- i -
차 례
국문요약 ······················································································································ⅵ
Ⅰ. 서론 ·························································································································1
1. 연구의 배경 필요성 ·······················································································1
2. 연구의 목 ···········································································································4
Ⅱ. 연구방법 ···············································································································5
1. 연구 모형 ···············································································································5
2. 연구대상 자료 ·································································································6
3. 변수의 선정 정의 ···························································································7
4. 분석 방법 ·············································································································12
Ⅲ. 연구결과 ·············································································································14
1. 연구 대상자의 일반 특성 ···········································································14
2. 연구대상자의 BMI에 따른 일반 특성 ···················································16
3. KDIGO 2012 지침에 따른 만성신질환 유병률 ·········································22
4. BMI 범주에 따른 사구체여과률로 분류한 만성신질환의 유병률 ···········24
5. BMI 범주에 따른 ACR로 분류한 만성신질환 유병률 ·····························26
6. BMI 범주에 따른 GFR과 ACR로 평가된 CKD의 유병률 ························28
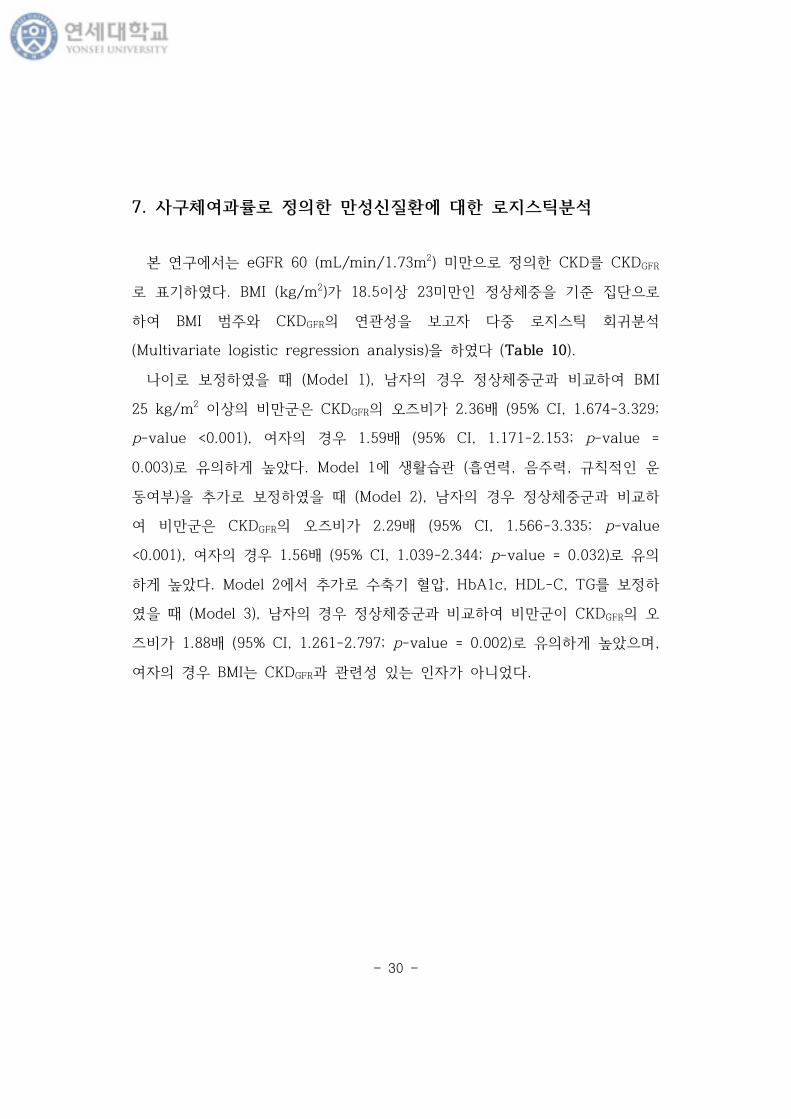
7. 사구체여과률로 정의한 만성신질환에 대한 로지스틱분석 ·······················30
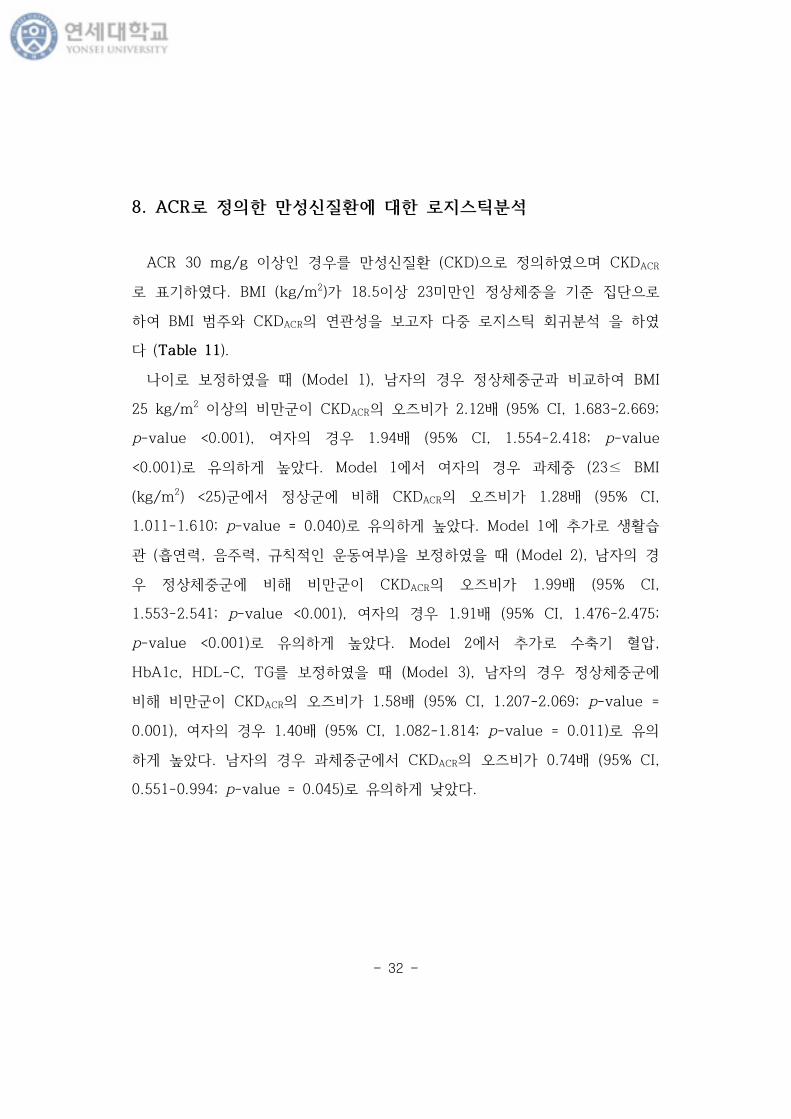
8. ACR로 정의한 만성신질환에 대한 로지스틱분석 ······································32
- ii -
9. 사구체여과율과 ACR로 정의한 만성신질환에 대한 로지스틱분석 ········34
Ⅳ. 고찰 ·······················································································································36
Ⅴ. 결론 ·······················································································································43
참고문헌 ······················································································································44
부 록 ······························································································································54
Abstract ·····················································································································60
- iii -
표 차 례
Table 1. GFR categories in CKD ·············································································8
Table 2. Albuminuria categories in CKD ······························································9
Table 3. Prognosis of CKD by GFR and Albuminuria Categories ················10
Table 4. Clinical characteristics of study participants ········································15
Table 5. Clinical characteristics of male participants according to BMI
categories ····································································································18
Table 6. Clinical characteristics of male participants according to BMI
categories ····································································································19
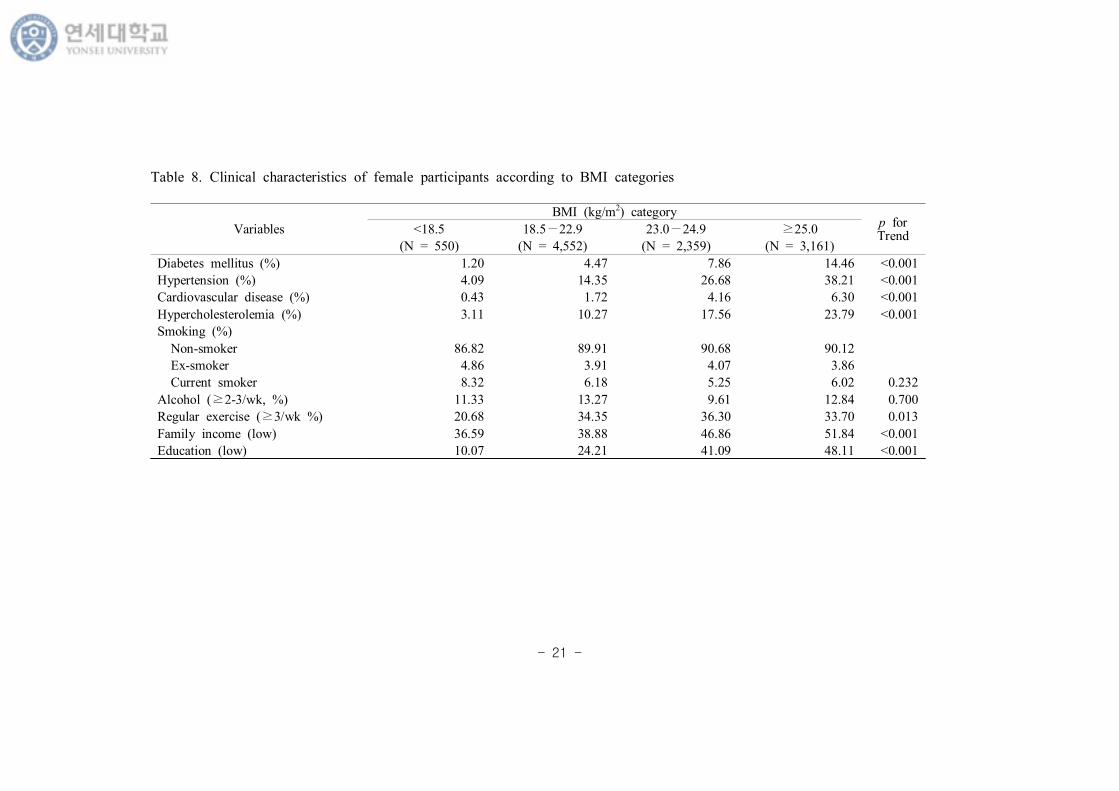
Table 7. Clinical characteristics of female participants according to BMI
categories ·····································································································20
Table 8. Clinical characteristics of female participants according to BMI
categories ·····································································································21
Table 9. Prevalence of CKD defined by eGFR and ACR in Korea
population ··································································································23
Table 10. Multivariate-adjusted odds raitos of BMI for chronic kidney
disease defined by eGFR (CKDGFR) ·················································31
Table 11. Multivariate-adjusted odds ratios of BMI for chronic kidney
disease defined by ACR (CKDACR) ····················································33
Table 12. Multivariate-adjusted odds ratios of BMI for chronic kidney
disease defined by eGFR and ACR (CKDRisk) ······························35
- iv -
그 림 차 례
Figure 1. Research model of the study. ··································································5
Figure 2. Flowchart of study participants. ······························································6
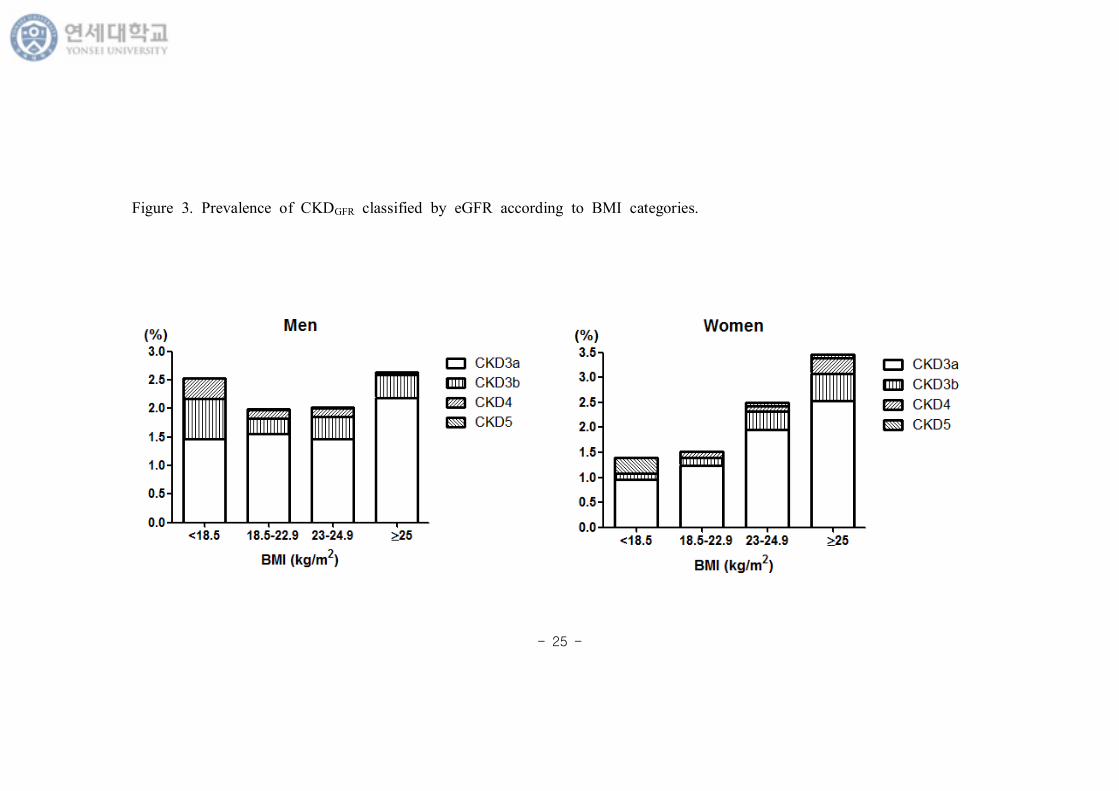
Figure 3. Prevalence of CKDGFR classified by eGFR according to BMI
categories. ··································································································25
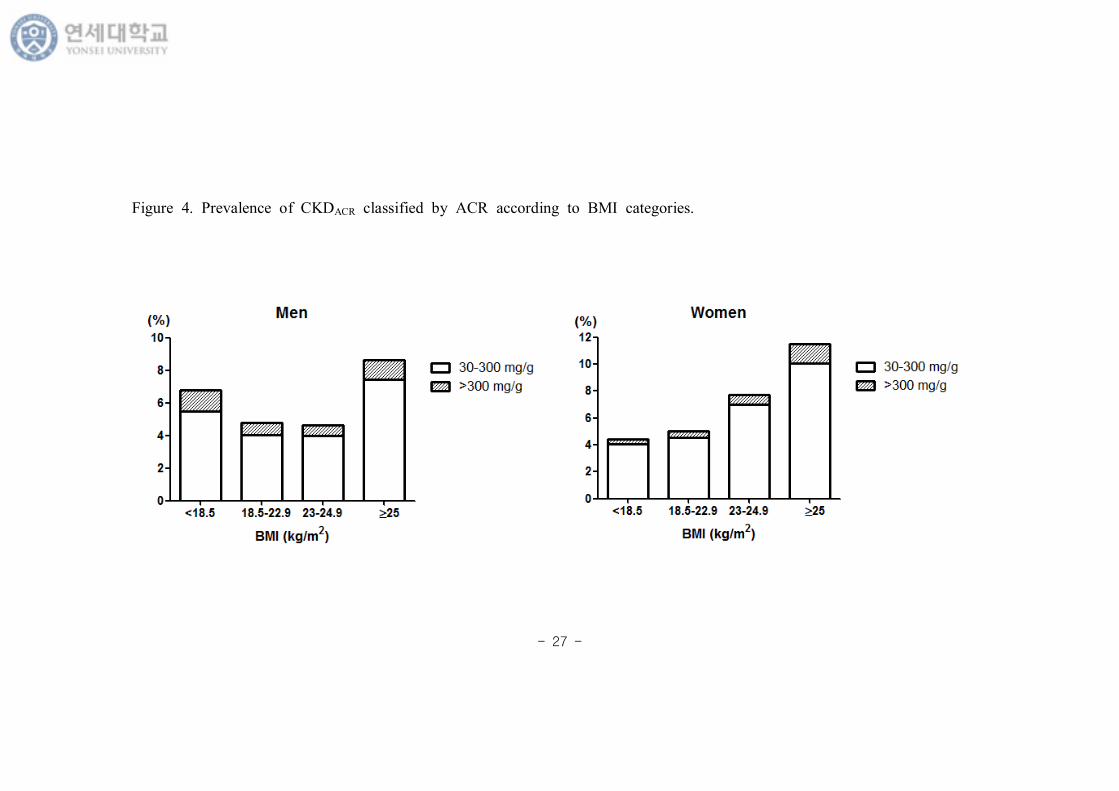
Figure 4. Prevalence of CKDACR classified by ACR according to BMI
categories. ··································································································27
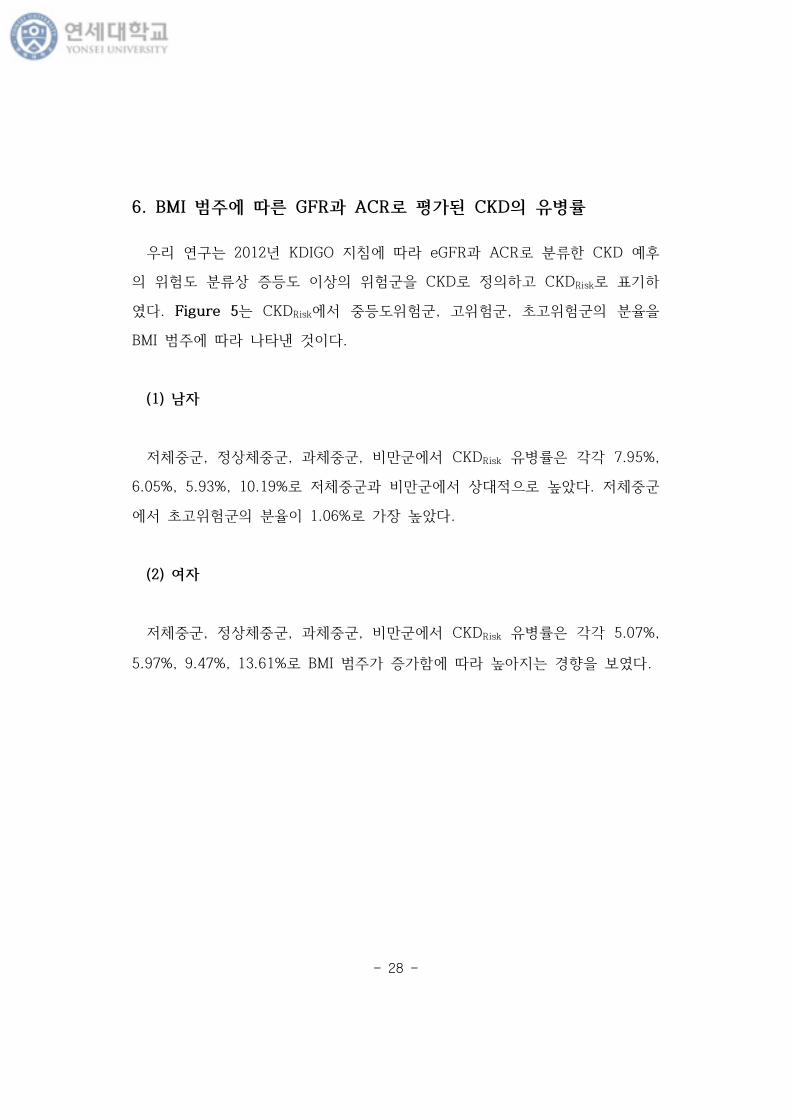
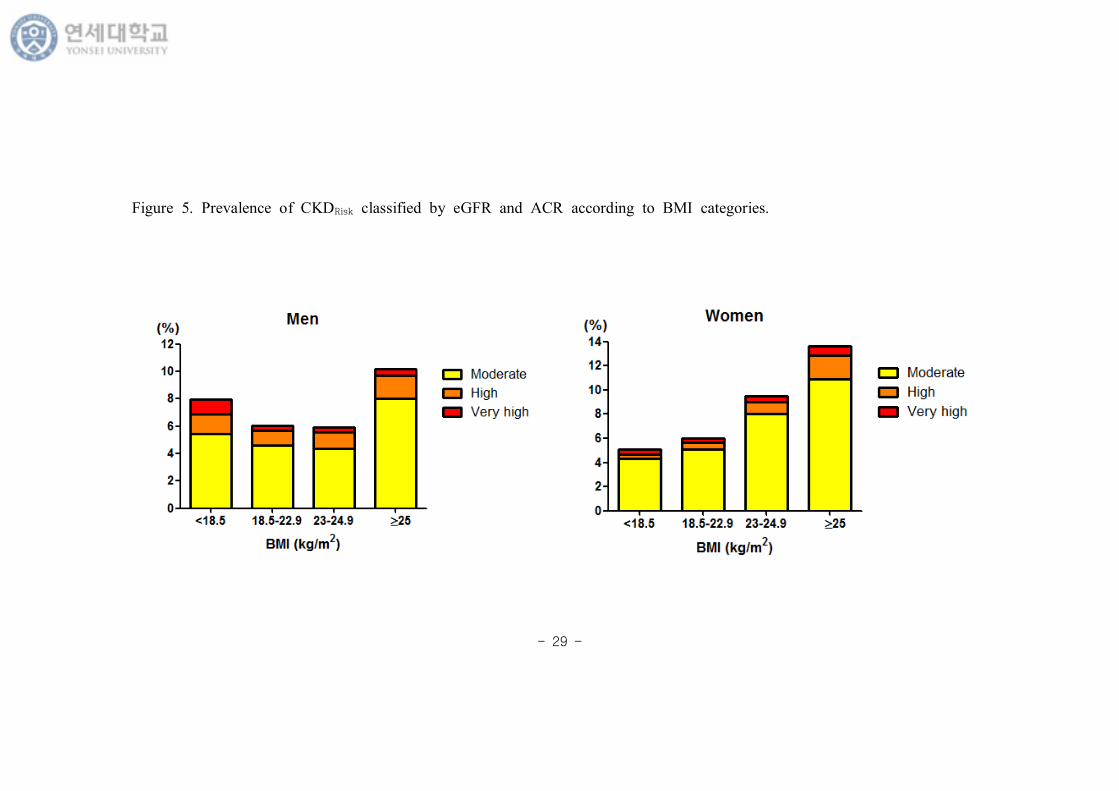
Figure 5. Prevalence of CKDRisk classified by eGFR and ACR according to
BMI categories. ···························································································29
- v -
부 록 차 례
Supplement 1. Multivariate-adjusted odds raitos of BMI for CKD defined
by eGFR (CKDGFR) ·········································································54
Supplement 2. Multivariate-adjusted odds ratios BMI for CKD defined by
ACR (CKDACR) ·················································································55
Supplement 3. Multivariate-adjusted odds ratios of BMI for CKD defined
by eGFR and ACR (CKDRisk) ······················································56
Supplement 4. Multivariate-adjusted odds raitos of waist circumference for
CKD defined by eGFR (CKDGFR) ···············································57
Supplement 5. Multivariate-adjusted odds ratios of waist circumference for
CKD defined by ACR (CKDACR) ················································58
Supplement 6. Multivariate-adjusted odds ratios of waist circumference for
CKD classified by eGFR and ACR (CKDRisk) ·························59
- vi -
요 약
한 에 사 체여과 과 알부민뇨 한
만 신질 과 만 연
만과 만 신질 (CKD) 계 그 병 증가 고 있는 요
공 보건 다. 2012 KDIGO 지 CKD 원 , 사 체
여과 (GFR), 알부민뇨 (ACR) 께 평가 것 강 고 있다. 지만 만
과 CKD 본 부분 연 들 CKD GFR 는 단 뇨
고 있다. 본 연 는 GFR과 ACR CKD 분 여
에 만과 CKD 연 알아보고자 다.
본 연 는 특 는 민건강 양 사 5 (2011, 2012)
6 (2013, 2014) 자료 용 단 연 다. 민건강 양 사 원시자
료는 복 본 계 (complex sampling design) 므 검진, 건강 자료
부 별 연 분 간 통 가 산출 법 사용 다.
estimated GFR (eGFR) 60 (mL/min/1.73m2) 미만 CKD
CKDGFR 고, ACR 30 mg/g 상 CKD CKDACR
다. eGFR과 ACR 그룹 분 CKD 후 험도 범주 상 등도
상 험 CKD 고 CKDRisk 다. 만과 CKD
다 지스틱 회귀분 (Multivariate logistic regression analysis) 통
분 다.
분 상자는 19 상 임신, 암 병 , 증 간질 간경변
- vii -
병 , 검사 결 있는 경우 등 19,331명 (남자
8,709명, 여자 10,622명) 었다.
분 결과, 우리나 eGFR 60 (mL/min/1.73m2) 미만 CKD 병
2.2% Urine ACR ≥30 mg/g 상 CKD 병 6.7% 다. CKD
후 등도 상 험 병 8.1% 다.
CKDGFR에 다 지스틱 분 에 나 , 연 , 주 , 운동 , 축
압, 당 색소 (HbA1c), HDL 스 , 지 보 후, 남자 경
우 상체 과 여 BMI 25 kg/m2 상 만 CKDGFR 즈 가
1.88 (95% CI, 1.261-2.797; p-value = 0.002) 게 높았 , 여자
경우 BMI는 CKDGFR과 있는 자가 아니었다. 지만 eGFR과 ACR
CKDRisk에 다 지스틱 분 에 란변 들 보 후, 남자 경
우 상체 과 여 만 CKDRisk 즈 가 1.65 (95% CI,
1.289-2.115; p-value <0.001), 여자 경우 1.38 (95% CI, 1.088-1.754;
p-value = 0.008) 게 높았다. 남자 경우 과체 (23≤ BMI
(kg/m2) <25) 상체 에 CKDRisk 즈 가 0.74 (95% CI,
0.569-0.957; p-value = 0.022) 게 낮았다.
우리 연 에 BMI 25 kg/m2 상 만 남 모 에 상 체 에
CKDRisk 험도 게 높 , eGFR 과 ACR 께 사용 여 CKD
평가 여자에 CKD 험 자 만 과소평가 지 않 있었
다. 추후 종단 연 실험 연 통 남 과 여 에 CKD 진행
에 과체 과 만 역 연 요가 있 것 사료 다.
심어 : 만, 만 신질 , 사 체여과 , 알부민뇨
- 1 -
Ⅰ.
1. 연 경 필요
만 신질 (chronic kidney disease, CKD) 계 그 사회
경 부담 증가 고 있는 질 (Levey AS, 2007), 우리나 민건강
양 사 2007-2010 보고에 , 20 상 에 CKD 병
2.6-7.7% 알 있다 (Shin et al., 2014). 신 능 지속 감소
결 나 식 등 신 요법 요 는 말 신부 (end stage
renal disease, ESRD) 진행 심 질 병증 생 험
높아지고 5 생 60~70% 낮아진다. 특히 고 당뇨병 자 증
가 자 는 증가 는 추 , 2014 내 말 신부 자
병 80,674명에 는 미 ESRD 자 병 70%,
본 50% 도 다 (Jin et al., 2015).
CKD 분 2002 도에 미 신장재단 (National
Kidney Foundation, NIF) Kidney Dialysis Outcomes Quality Initiative
(K/DOQI) 지 (guideline) 많 다. 지 에 CKD는
신장 손상 지 나 상 가지고 있거나 사 체여과 (glomerular
filtration rate, GFR) 60 mL/min/1.73 m2 미만 상태가 3개월 상
지속 는 것 고 있다 (2002 K/DOQI clinical practice guidelines).
지만 2012 계신장 회 임상진료지 개 Kidney Disease
Improving Global Outcome ( KDIGO)는 CKD가 주요 질 들 생
사망 과 연 고 여 자 후 있도 CKD 분
욱 분 다 (KDIGO 2012 Clinical Practice Guideline).
- 2 -
KDIGO 지 1,555,332명 포 45개 트 경 에
체 사망 , 심 사망 , 말 신부 , 신손상, 만 신질 진행에
상 험도가 GFR과 요 알부민-크 아티닌 (albumin-to-creatinine
ratio, ACR)에 차 보 는 것 보고 , CKD 단 히
GFR만 는 것에 다. 알부민뇨는
요소실 (urine loss rate) 고 알부민 출 (albumin excretion
rate, AER) 나 ACR , 단 뇨보다 사 체 과 변 에 특
고 민감 다 (KDIGO 2012 Clinical Practice Guideline). 여러 연 들
알부민뇨가 CKD 후 보고 있다 (Gansevoort et al., 2011;
Matsushita et al., 2010; Hallan et al., 2009; Brantsma et al., 2008).
나 , 별, 종, 고 압, 고 당, 상지질 증, 연, 만, 심 병
등 만 신질 진행에 향 미 는 미 있는 변 들 알 있다
(Kidney Disease Improving Global Outcomes 2012 Clinical Practice
Guideline). 특히, 만 고 압, 당뇨병, 심 질 등 만 질 사망
증가 원 다 (Guh et al., 2009). 계 1980 후 만 병
2 가 증가 (World Health Organization, 2016), 근 20
사 에 우리나 만 병 체 30~35%에 도
(보건복지부, 2011−2020) 만 심각 공 보건 다.
만 사증후 주요 요소 도 , 내 단 연 추
찰 연 통 사증후 자에 CKD 생 나 병 건강 에
높다고 보고 있다 (Song, Sung and Lee, 2015; Kang et al.,
2014). 근 내 트 연 결과에 , 사 건강 도 만
경우 CKD 험 1.38 높았 만 아니 사 상
있는 경우 그 험도가 1.37 높았다 (Jung et al., 2015). Framingham
- 3 -
offspring study 용 여 신질 생 자 보고자 했 연 에
신질 생에 BMI 즈 는 1.23 게 높았다 (Fox et al.,
2004). 트 연 에 는 과체 만 자 경우, 사증후
계없 CKD 험 각각 1.31 , 2.39 높았다 (Cao et al.,
2015).
지만 다 연 들 CKD GFR 는 단 뇨 고 있다.
본 연 는 2012 KDIGO 지 에 GFR과 ACR 께 사용 여 CKD
고 에 만과 CKD 연 알아보고자 다.
- 4 -
2. 연 목
본 연 는 특 는 민건강 양 사 5 2차
도 (2011), 3차 도 (2012) 6 1차 도 (2013), 2차 도 (2014) 자료
용 여 만 19 상 에 만과 만 신질 악 고자 다.
첫째, 2012 KDIGO 지 에 사 체여과 과 알부민뇨 분 여
만 신질 과 만 연 사 다.
째, 사 체여과 과 알부민뇨 범주에 만 신질 병
사 다.
- 5 -
Ⅱ. 연 법
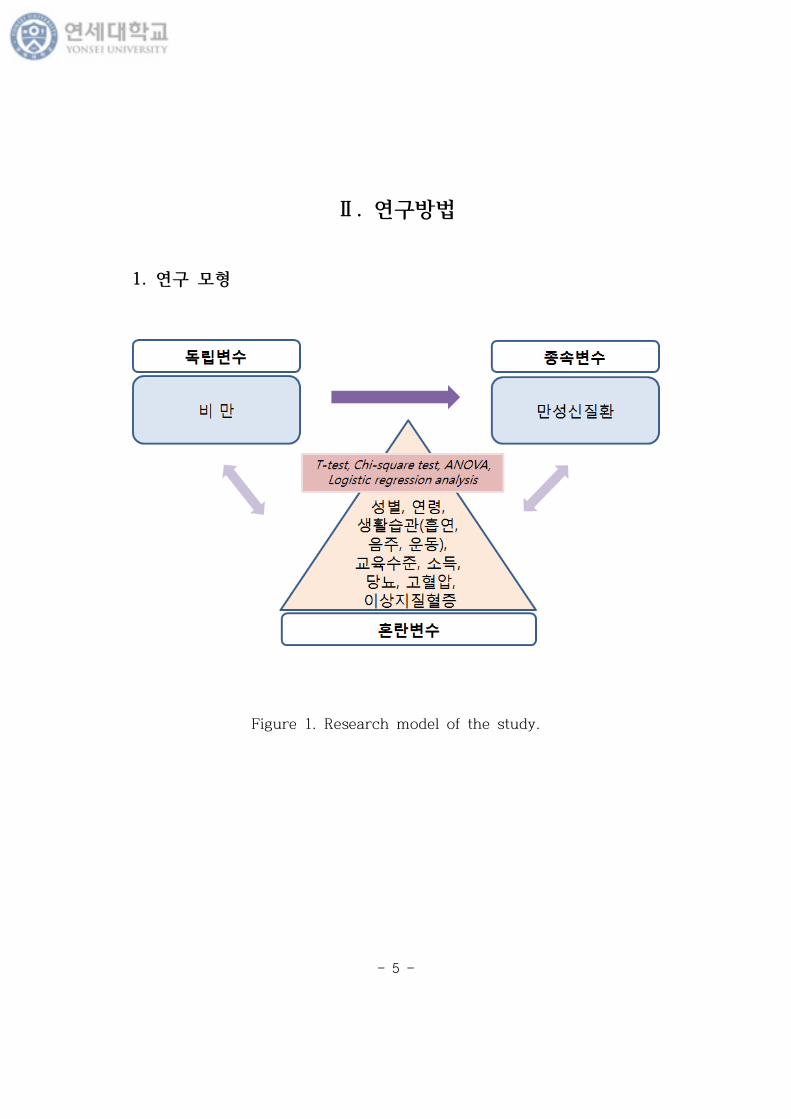
1. 연 모
Figure 1. Research model of the study.
- 6 -
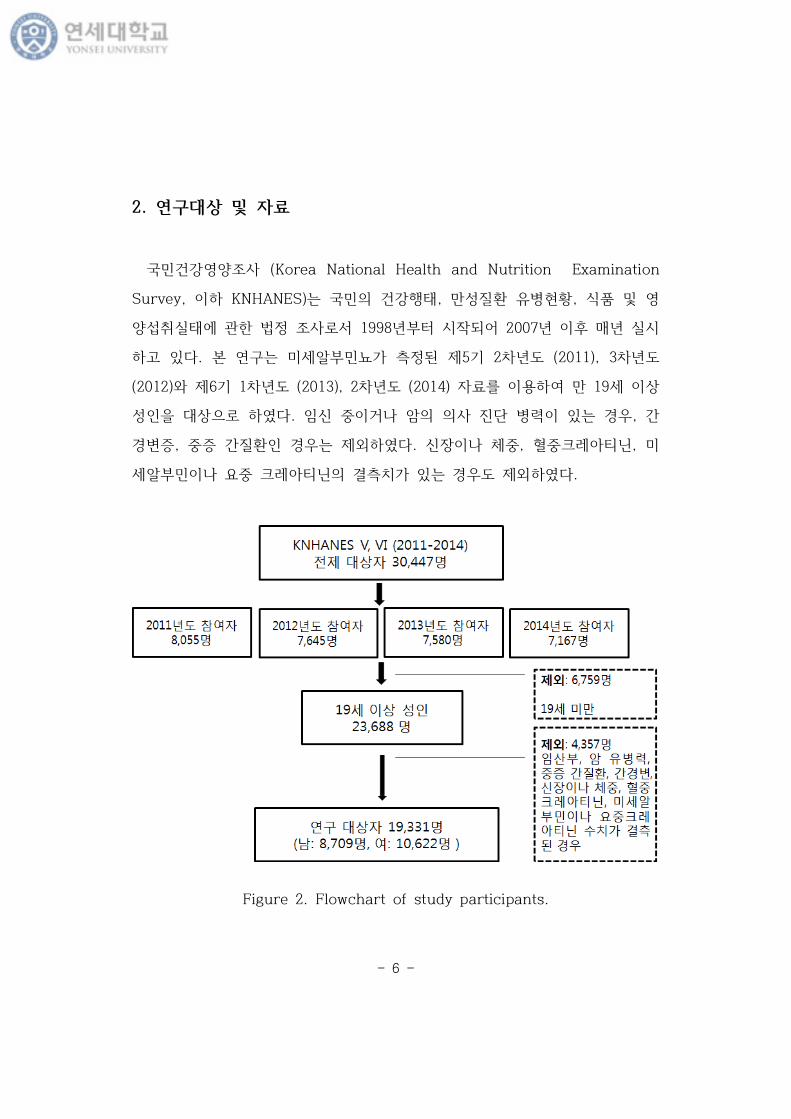
2. 연 상 자료
민건강 양 사 (Korea National Health and Nutrition Examination
Survey, KNHANES)는 민 건강행태, 만 질 병 , 식품
양 취실태에 법 사 1998 부 시작 어 2007 후 매 실시
고 있다. 본 연 는 미 알부민뇨가 5 2차 도 (2011), 3차 도
(2012) 6 1차 도 (2013), 2차 도 (2014) 자료 용 여 만 19 상
상 다. 임신 거나 암 사 진단 병 있는 경우, 간
경변증, 증 간질 경우는 다. 신장 나 체 , 크 아티닌, 미
알부민 나 요 크 아티닌 결 가 있는 경우도 다.
Figure 2. Flowchart of study participants.
- 7 -
3. 변
고 압 축 압 140 mmHg 상 는 압 90 mmHg 상
는 고 압약 복용자 는 사진단자 다. 상과 고 압 단계 고
압 없 다. 당뇨병 공복시 당 126 상 는 당뇨병약 복용
슐린 주사 여 는 사진단자 공복 당장애는 당뇨 없
다. 고 스 증 스 240 mg/dL 상 거
나 스 강 복용 고 있는 사람 다. 연 재 연
여부에 재 움, 가끔 움 ‘ 재 연’, 과거에 웠 나 재 연
‘과거 연’, 당 ‘ 연’ 3개 그룹 분 다. 주는 근 1
간 주 2-3회 상 마신 경우 주 다. 가계 소득
4분 에 소득 다.
낮 고 과 높 분 다. 신체 동 1주
간 근 운동 나 연 운동 3 상 경우 규 운동 경우
분 다.
본 연 에 는 우리나 만과 만 신질 연 알아보고자
민건강 양 사 목에 종속변 , 독립변 그리고 란변 다 과 같
다.
가. 종속변
1) 사 체여과 (GFR) 만 신질
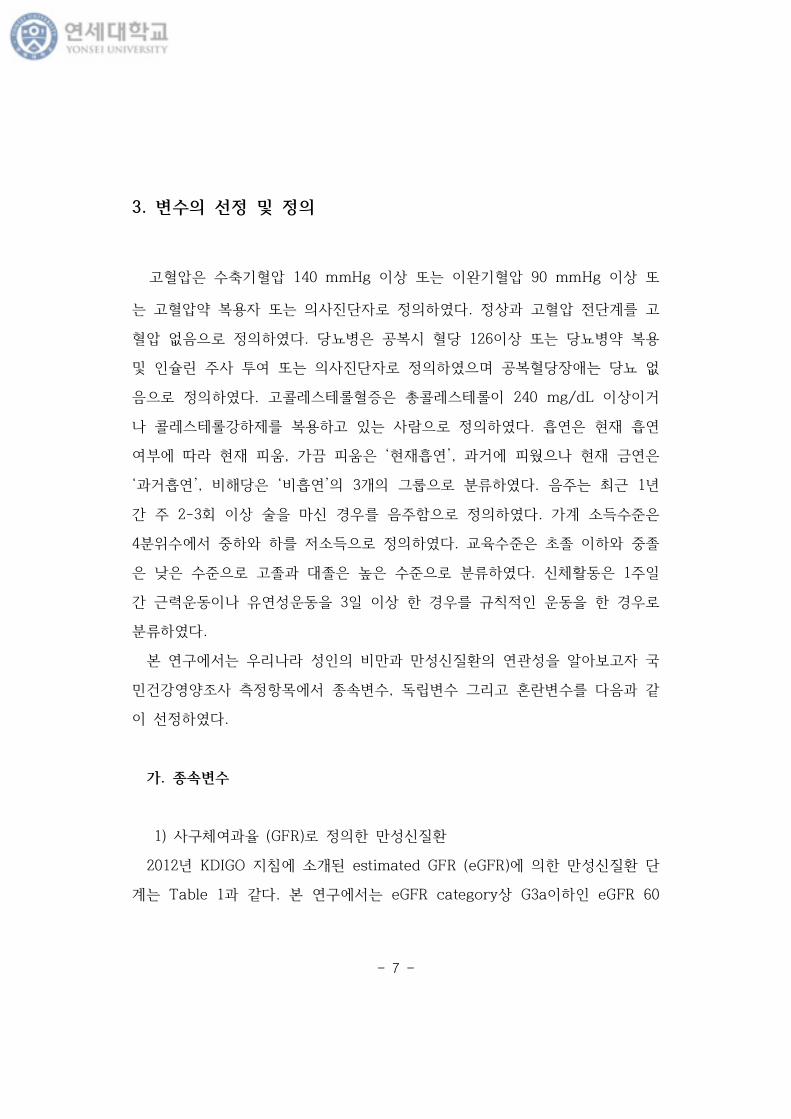
2012 KDIGO 지 에 소개 estimated GFR (eGFR)에 만 신질 단
계는 Table 1과 같다. 본 연 에 는 eGFR category상 G3a eGFR 60
- 8 -
eGFR
categoryeGFR (mL/min/1.73m2) Terms
G1 ≥90 Normal or high
G2 60−89 Mildly decreased
G3a 45−59 Mildly to moderately decreased
G3b 30−44 Moderately to severely decreased
G4 15−29 Severely decreased
G5 <15 Kidney failure
(mL/min/1.73m2) 미만 CKD 고 CKDGFR 다.
Table 1. GFR categories in CKD
*source: Kidney Disease Improving Global Outcomes 2012 Clinical Practice Guideline
for the Evaluation and Management of chronic kidney disease. Kidney Int Suppl 2013
(3).
MDRD (Modification of Diet in Renal Disease) 공식 평균 eGFR
40 (mL/min/1.73m2) 만 신질 자들 상 만들어진 것 상
거나 상에 가 운 eGFR 보 는 경우에는 도가 떨어질 있다 (Shin
et al., 2014). 본 연 에 는 eGFR 2012 KDIGO에
시 CKD-EPI (Chronic Kidney Disease Epidemiology Collaboration) 공식
용 다.
● CKD-EPI 공식
(1) 남 : sCr ≤ 0.9, 141 X ((sCr/0.9)-0.411) X (0.993age)
sCr > 0.9, 141 X ((sCr/0.9)-1.209) X (0.993age)
(2) 여 : sCr ≤ 0.7, 144 X ((sCr/0.7)-0.329) X (0.993age)
sCr > 0.7, 144 X ((sCr/0.7)-1.209) X (0.993age)
- 9 -
CategoryAER
(mg/24 hours)
ACR
(approximate equivalent)Terms
(mg/mmol) (mg/g)
A1 <30 <3 <30Normal to mildly
increased
A2 30−300 3−30 30−300 Moderately increased
A3 >300 >30 >300 Severely increased
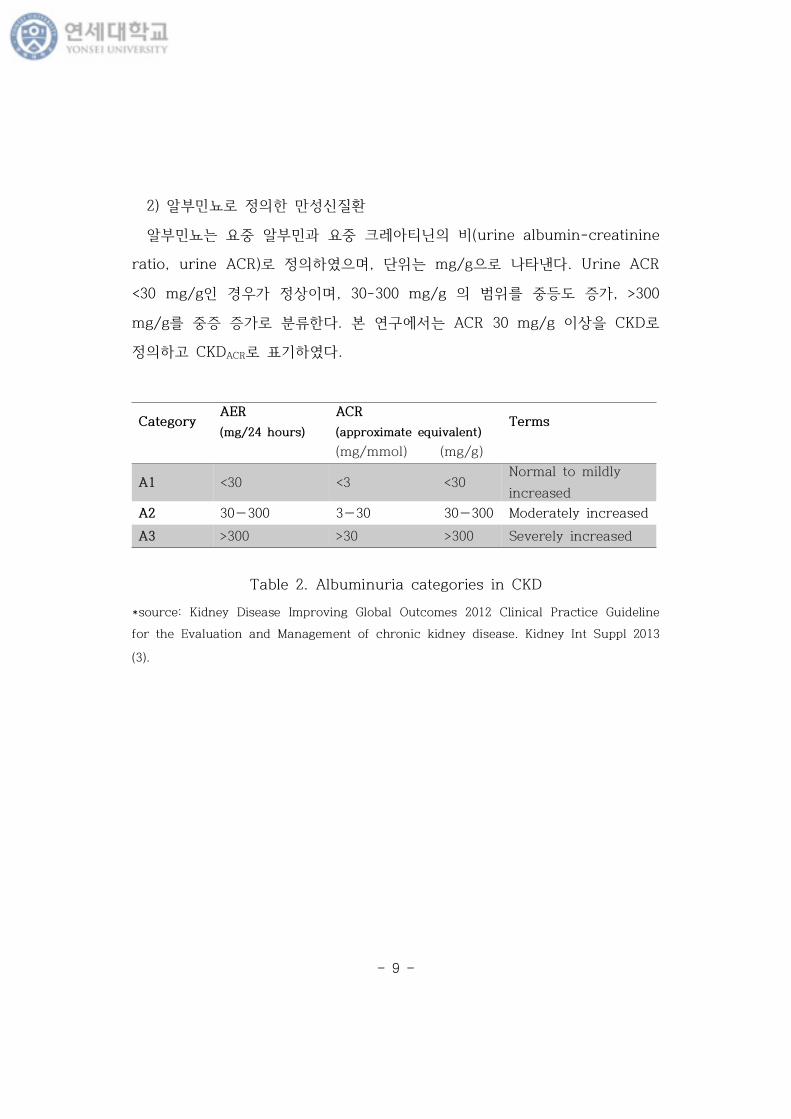
2) 알부민뇨 만 신질
알부민뇨는 요 알부민과 요 크 아티닌 (urine albumin-creatinine
ratio, urine ACR) , 단 는 mg/g 나타낸다. Urine ACR
<30 mg/g 경우가 상 , 30-300 mg/g 범 등도 증가, >300
mg/g 증 증가 분 다. 본 연 에 는 ACR 30 mg/g 상 CKD
고 CKDACR 다.
Table 2. Albuminuria categories in CKD
*source: Kidney Disease Improving Global Outcomes 2012 Clinical Practice Guideline
for the Evaluation and Management of chronic kidney disease. Kidney Int Suppl 2013
(3).
- 10 -
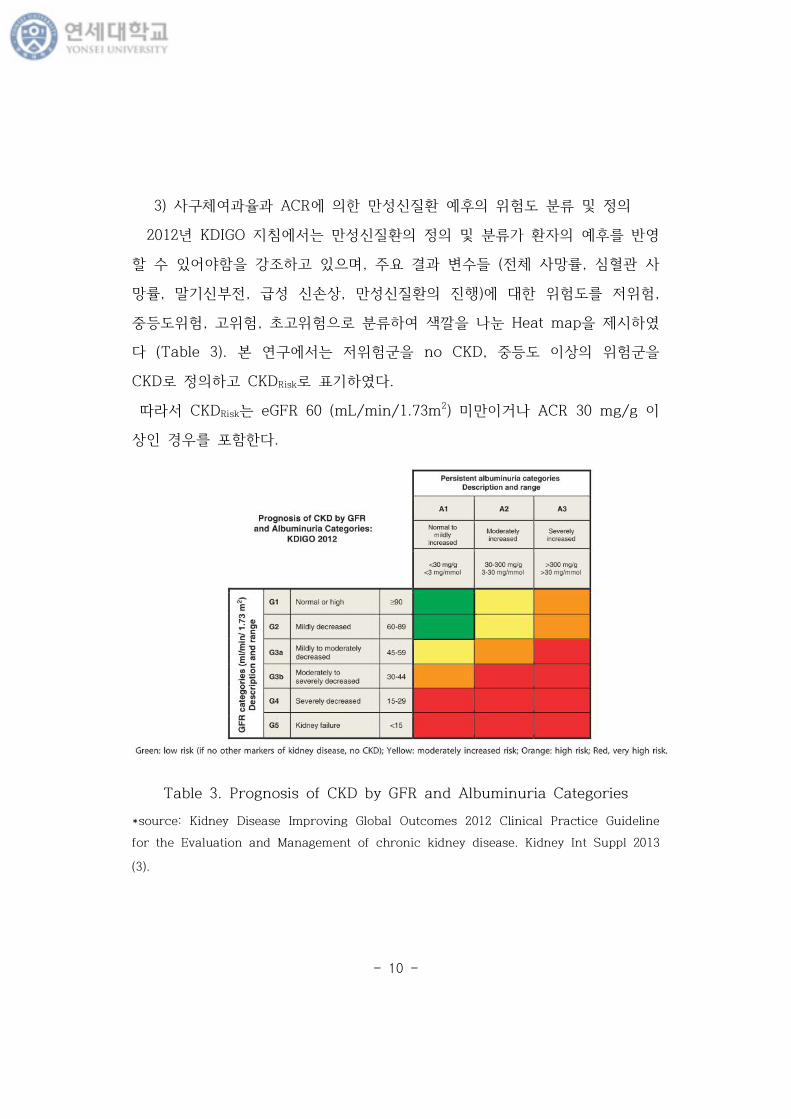
3) 사 체여과 과 ACR에 만 신질 후 험도 분
2012 KDIGO 지 에 는 만 신질 분 가 자 후
있어야 강 고 있 , 주요 결과 변 들 ( 체 사망 , 심 사
망 , 말 신부 , 신손상, 만 신질 진행)에 험도 험,
등도 험, 고 험, 고 험 분 여 색 나 Heat map 시
다 (Table 3). 본 연 에 는 험 no CKD, 등도 상 험
CKD 고 CKDRisk 다.
CKDRisk는 eGFR 60 (mL/min/1.73m2) 미만 거나 ACR 30 mg/g
상 경우 포 다.
Table 3. Prognosis of CKD by GFR and Albuminuria Categories
*source: Kidney Disease Improving Global Outcomes 2012 Clinical Practice Guideline
for the Evaluation and Management of chronic kidney disease. Kidney Int Suppl 2013
(3).
- 11 -
나. 독립변
체질량지 (body mass index, BMI)는 체 (kg) 신장 곱(m2)
나 값 아시아-태평양 사용 여 다 과 같 분 다 (WHO
expert consultation, 2004).
● BMI 범주에
체 : BMI <18.5 kg/m2,
상체 : 18.5≤ BMI <23 kg/m2
과체 : 23≤ BMI <25 kg/m2,
만: BMI ≥25 kg/m2
다. 란변
나 , 연 , 주 , 신체 동 (운동 습 ), 축 압, 당 색소
(Hemoglobin A1c, HbA1c), 고 도 지단 스 (High density
lipoprotein-cholesterol, HDL-C), 지 (Triglyceride, TG)
란변 사용 다.
- 12 -
4. 분 법
민건강 양 사 원시자료는 복 본 계 (complex sampling design)
므 자료 통계처리 분 , 집락, 가 고 다. 본 연
는 민건강 양 사 5 2011 , 2012 자료 6 2013 , 2014
자료 용 므 간 통 가 용 , 건강 과 검
진 자료에 연 분 가 사용 다. 변 는 분산추
본 계 시 분 에 사 가 1개 부 통 것 고, 집락
변 는 1차 추출단 사 다. 집락추출 변 (Psu), 분산추
(Kstrata), 통 가 용 Survey procedure 통 통계처리
실시 다.
본 연 상자 , 사회경 임상 자료 특
Proc Surveymeans 용 통계량 (Mean ± Standard error, N (%))
시 , 차는 Taylor series linearization variance
estimation method 계산 었다. 연속 변 분 시 집단 간 차 는
T-test, 집단 상 간 차 는 분산분 (ANOVA) 검 Proc
Surveyreg 용 다. 범주 변 는 Proc Surveyfreq 용 여 도
산출 고, 도에 Rao-Scott chi-square 법
용 여 검 다. BMI 범주에 CKD 즈 (Odds ratio, OR)
95% 신뢰 간 (confidence interval, CI) 평가 고자 Proc Surveylogistic
용 여 란변 들 보 다 지스틱 회귀분 (Multivariate logistic
regression analysis) 실행 다. 공복 당, HbA1c, TG, AST (aspartate
aminotransferase), ALT (alanine aminotransferase), Urine ACR 곡
분포 (skewed distribution) 보여 그 변 여 p-value 산출 다.
- 13 -
자료 분 SAS 9.2 version (SAS Institute Lnc, Vary, Nc, USA) 사
용 통계 검 0.05 다.
- 14 -
Ⅲ. 연 결과
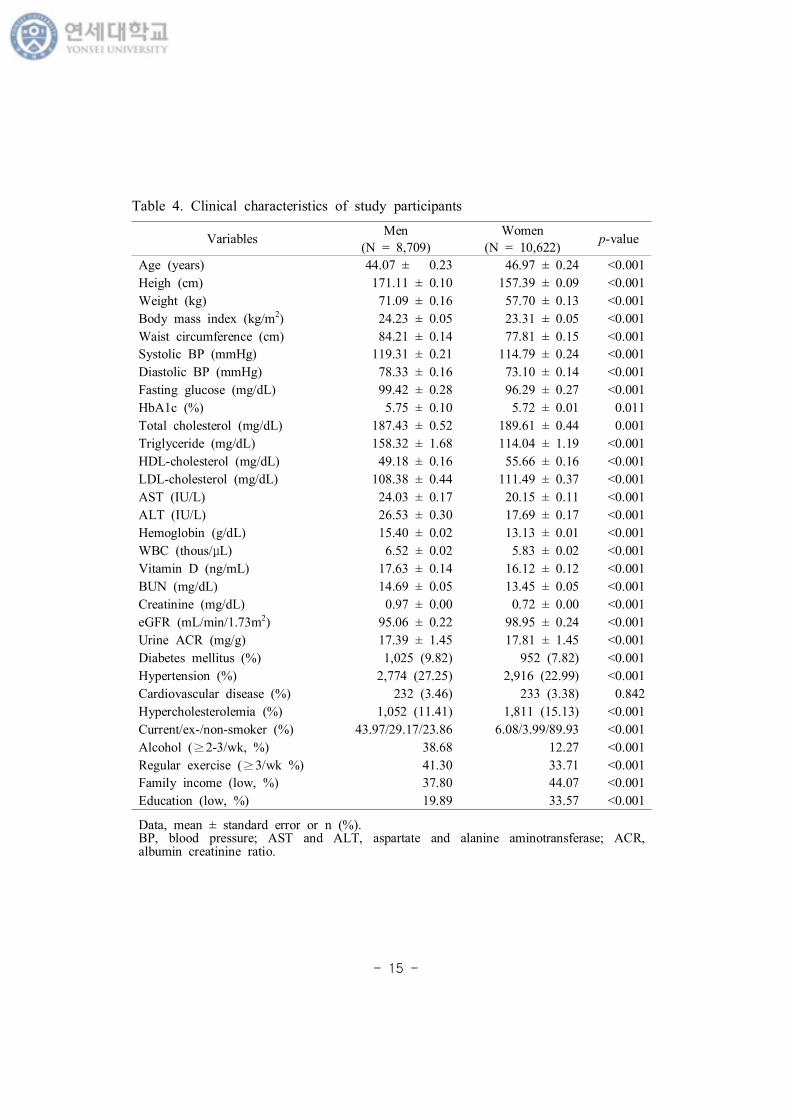
1. 연 상자 특
우리나 만과 만 신질 (CKD) 연 상자
특 Table 4에 시 다. 분 상자는 19,331명 남자는 8,709
명, 여자는 1,806명 었다.
남자는 평균 44.07 , 여자는 평균 46.97 남자가 여자에 2.90
어 다 (p <0.001). 키는 남자가 여자에 13.72 cm 컸 , 체 남
자가 13.39 kg 많았다 (각 p <0.001). 체질량지 는 남자가 여자에
0.92 kg/m2 높았다 (p <0.001). 허리 는 남 각각 84.21 cm, 77.81
cm 차 보 다 (p <0.001). 남자 축 압 여자
에 각각 4.52 mmHg, 5.23 mmHg 높았다 (p <0.001). 사
지 분 결과, 스 , LDL 스 여자에 게
높았 지 남자에 높았다. AST, ALT, 헤모 ,
타민 D 는 모 남자에 높았다 (p <0.001). CKD-EPI 공식에
eGFR 남자 경우 여자보다 3.88 mL/min/1.73m2 낮 보 다
(p <0.001). Urine ACR는 여자 경우 남자보다 0.42 mg/g 높았다 (p
<0.001). 당뇨병, 고 압 병 남자 경우 각각 9.82%, 27.25% 여자에
게 높았다. 심근경색 허 심질 병 남 차 가
없었다. 고 스 증 남자에 여자에 3.72% 높았다. 연 과
주 남자에 게 높았 , 남자가 여자에 주 3회 상 규
운동 는 경우가 7.59% 많았다. 가계 소득 남자가 여자에
게 높았다.
- 15 -
VariablesMen Women
p-value(N = 8,709) (N = 10,622)
Age (years) 44.07 ± 0.23 46.97 ± 0.24 <0.001
Heigh (cm) 171.11 ± 0.10 157.39 ± 0.09 <0.001
Weight (kg) 71.09 ± 0.16 57.70 ± 0.13 <0.001
Body mass index (kg/m2) 24.23 ± 0.05 23.31 ± 0.05 <0.001
Waist circumference (cm) 84.21 ± 0.14 77.81 ± 0.15 <0.001
Systolic BP (mmHg) 119.31 ± 0.21 114.79 ± 0.24 <0.001
Diastolic BP (mmHg) 78.33 ± 0.16 73.10 ± 0.14 <0.001
Fasting glucose (mg/dL) 99.42 ± 0.28 96.29 ± 0.27 <0.001
HbA1c (%) 5.75 ± 0.10 5.72 ± 0.01 0.011
Total cholesterol (mg/dL) 187.43 ± 0.52 189.61 ± 0.44 0.001
Triglyceride (mg/dL) 158.32 ± 1.68 114.04 ± 1.19 <0.001
HDL-cholesterol (mg/dL) 49.18 ± 0.16 55.66 ± 0.16 <0.001
LDL-cholesterol (mg/dL) 108.38 ± 0.44 111.49 ± 0.37 <0.001
AST (IU/L) 24.03 ± 0.17 20.15 ± 0.11 <0.001
ALT (IU/L) 26.53 ± 0.30 17.69 ± 0.17 <0.001
Hemoglobin (g/dL) 15.40 ± 0.02 13.13 ± 0.01 <0.001
WBC (thous/μL) 6.52 ± 0.02 5.83 ± 0.02 <0.001
Vitamin D (ng/mL) 17.63 ± 0.14 16.12 ± 0.12 <0.001
BUN (mg/dL) 14.69 ± 0.05 13.45 ± 0.05 <0.001
Creatinine (mg/dL) 0.97 ± 0.00 0.72 ± 0.00 <0.001
eGFR (mL/min/1.73m2) 95.06 ± 0.22 98.95 ± 0.24 <0.001
Urine ACR (mg/g) 17.39 ± 1.45 17.81 ± 1.45 <0.001
Diabetes mellitus (%) 1,025 (9.82) 952 (7.82) <0.001
Hypertension (%) 2,774 (27.25) 2,916 (22.99) <0.001
Cardiovascular disease (%) 232 (3.46) 233 (3.38) 0.842
Hypercholesterolemia (%) 1,052 (11.41) 1,811 (15.13) <0.001
Current/ex-/non-smoker (%) 43.97/29.17/23.86 6.08/3.99/89.93 <0.001
Alcohol (≥2-3/wk, %) 38.68 12.27 <0.001
Regular exercise (≥3/wk %) 41.30 33.71 <0.001
Family income (low, %) 37.80 44.07 <0.001
Education (low, %) 19.89 33.57 <0.001
Data, mean ± standard error or n (%).BP, blood pressure; AST and ALT, aspartate and alanine aminotransferase; ACR, albumin creatinine ratio.
Table 4. Clinical characteristics of study participants
- 16 -
2. 연 상자 BMI에 따 특
(1) 남자
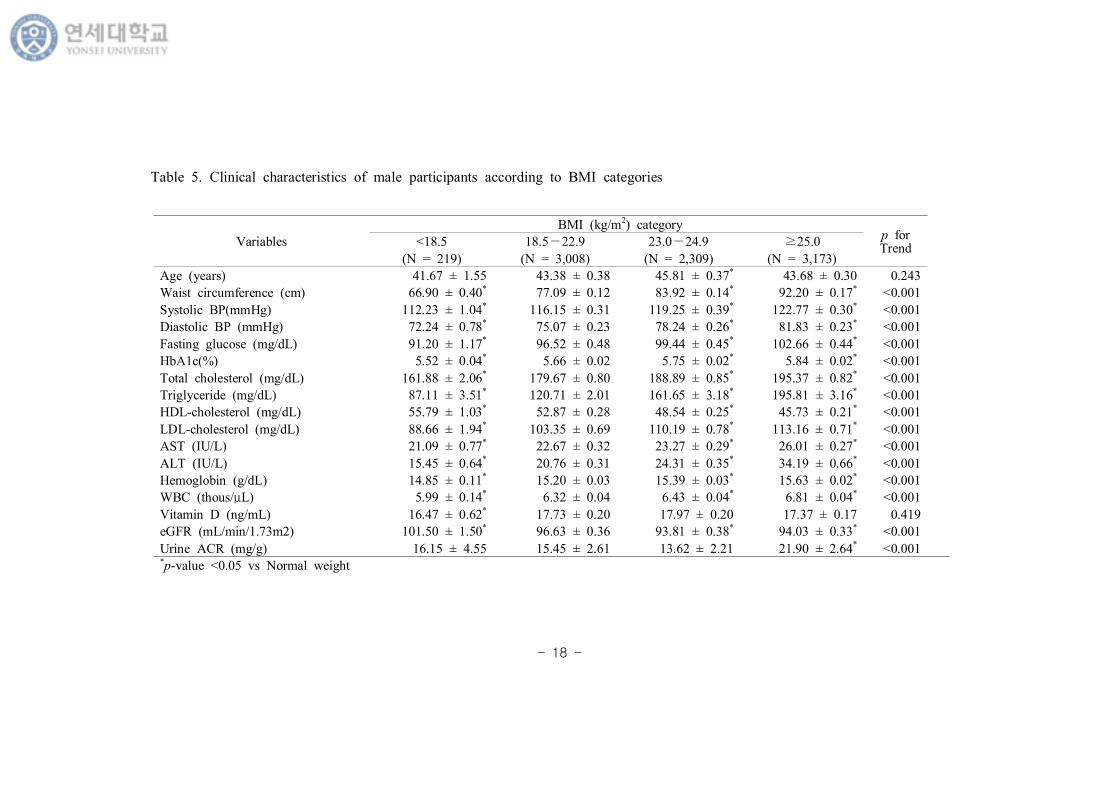
남자 상자 BMI에 특 Table 5, 6에 시 다. BMI
범주에 특 경향 p for Trend 시 고, 상체
집단 여 각 간 차 부 (*) 시 다.
나 는 상체 에 과체 에 2.43 많았 BMI에 경
향 지 않았다. 허리 , 압, 공복 당과 HbA1c, 스 ,
지 , LDL 스 , AST, ALT, Hb, WBC, urine ACR BMI 범주가 높
아짐에 게 증가 는 경향 보 다 (p for Trend <0.001). HDL
스 과 eGFR BMI 범주가 높아질 감소 는 경향 보 다 (p for
Trend <0.001). 타민 D 는 BMI 범주에 경향 보 지 않
았다 (p for Trend = 0.419).
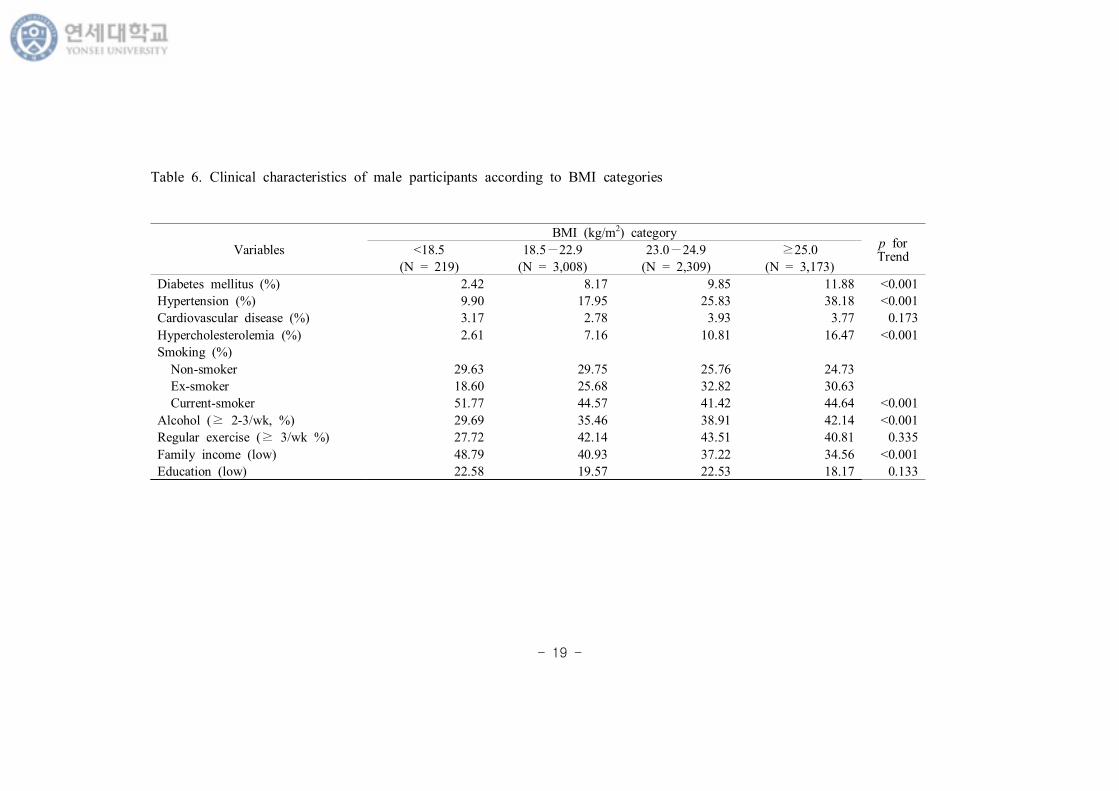
당뇨병, 고 압, 고 스 증 병 BMI 범주가 증가 는 경
향 보 다 (p for Trend <0.001). 심근경색 허 심질 병
BMI 범주에 경향 보 지 않았다 (p for Trend = 0.173). 체
에 재 연자 분 가장 높았다. 1주 에 2~3회 상 마시는
도는 BMI 범주가 높아질 게 증가 는 경향 보 다 (p for
Trend <0.001). 체 에 규 운동 는 분 가장 낮았 나 BMI
범주에 경향 보 지는 않았다. 가계 소득 BMI 범주가 높아질
소득 분 낮아지는 경향 보 다 (p for Trend <0.001). 만 에
분 가장 낮았 나 BMI 범주에 경향 지 않았다 (p
for Trend = 0.133).
- 17 -
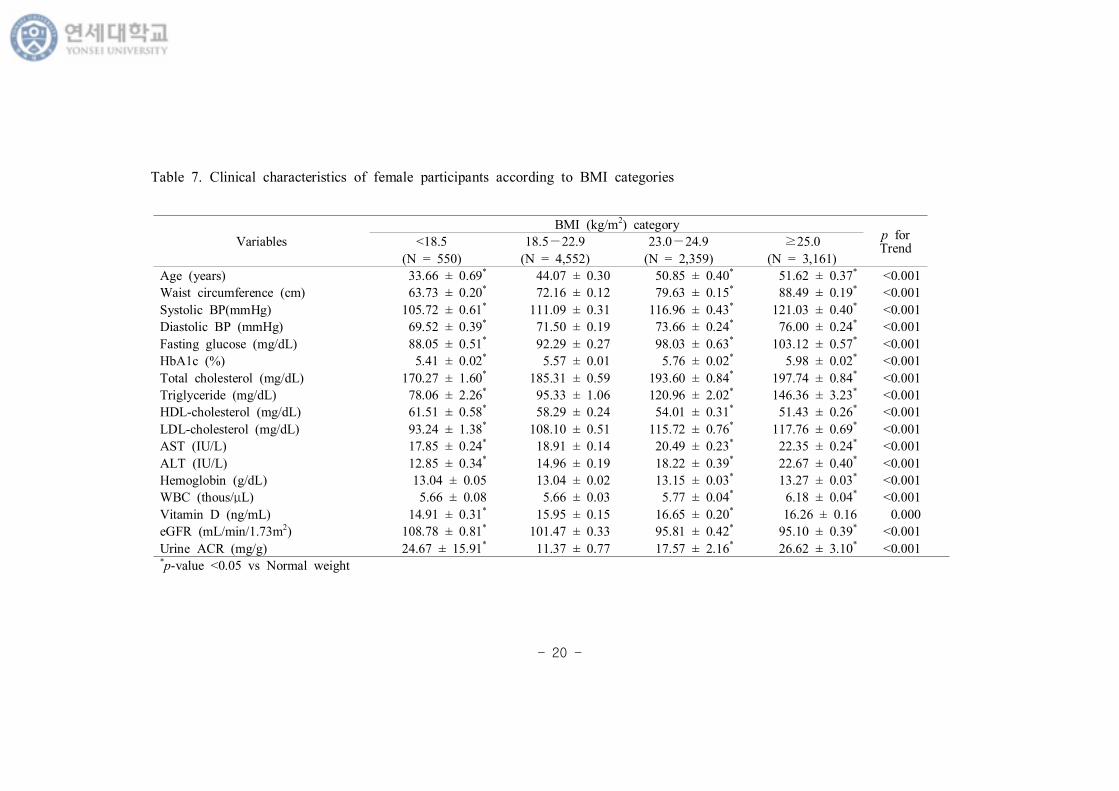
(2) 여자
여자 상자 BMI에 특 Table 7, 8에 시 다. BMI
범주에 특 경향 p for Trend 시 고, 상체
집단 여 각 간 차 부 (*) 시 다.
상체 과 여 체 나 가 10 어 BMI 범주가
높아질 나 가 증가 는 경향 보 다 (p for Trend <0.001). 허리
, 압, 공복 당과 HbA1c, 스 , 지 , LDL 스 , AST,
ALT, Hb, WBC, urine ACR BMI 범주가 높아짐에 게 증가 는
경향 보 다 (p for Trend <0.001). HDL 스 과 eGFR BMI 범주가
높아질 감소 는 경향 보 다 (p for Trend <0.001). 타민 D 는
BMI 범주가 높아짐에 게 증가 는 경향 보 다 (p for Trend =
0.000).
당뇨병, 고 압, 고 스 증, 심근경색 허 심질 병
BMI가 증가 에 증가 는 경향 보 다 (p for Trend <0.001). 연 과
주 BMI에 경향 보 지 않았다. 체 에 규
운동 는 가장 낮았다. 소득 과 BMI 범주가 높아질
증가 는 경향 보 다 (p for Trend <0.001).
- 18 -
Variables
BMI (kg/m2) categoryp for Trend
<18.5 18.5−22.9 23.0−24.9 ≥25.0
(N = 219) (N = 3,008) (N = 2,309) (N = 3,173)
Age (years) 41.67 ± 1.55 43.38 ± 0.38 45.81 ± 0.37* 43.68 ± 0.30 0.243
Waist circumference (cm) 66.90 ± 0.40* 77.09 ± 0.12 83.92 ± 0.14* 92.20 ± 0.17* <0.001
Systolic BP(mmHg) 112.23 ± 1.04* 116.15 ± 0.31 119.25 ± 0.39* 122.77 ± 0.30* <0.001
Diastolic BP (mmHg) 72.24 ± 0.78* 75.07 ± 0.23 78.24 ± 0.26* 81.83 ± 0.23* <0.001
Fasting glucose (mg/dL) 91.20 ± 1.17* 96.52 ± 0.48 99.44 ± 0.45* 102.66 ± 0.44* <0.001
HbA1c(%) 5.52 ± 0.04* 5.66 ± 0.02 5.75 ± 0.02* 5.84 ± 0.02* <0.001
Total cholesterol (mg/dL) 161.88 ± 2.06* 179.67 ± 0.80 188.89 ± 0.85* 195.37 ± 0.82* <0.001
Triglyceride (mg/dL) 87.11 ± 3.51* 120.71 ± 2.01 161.65 ± 3.18* 195.81 ± 3.16* <0.001
HDL-cholesterol (mg/dL) 55.79 ± 1.03* 52.87 ± 0.28 48.54 ± 0.25* 45.73 ± 0.21* <0.001
LDL-cholesterol (mg/dL) 88.66 ± 1.94* 103.35 ± 0.69 110.19 ± 0.78* 113.16 ± 0.71* <0.001
AST (IU/L) 21.09 ± 0.77* 22.67 ± 0.32 23.27 ± 0.29* 26.01 ± 0.27* <0.001
ALT (IU/L) 15.45 ± 0.64* 20.76 ± 0.31 24.31 ± 0.35* 34.19 ± 0.66* <0.001
Hemoglobin (g/dL) 14.85 ± 0.11* 15.20 ± 0.03 15.39 ± 0.03* 15.63 ± 0.02* <0.001
WBC (thous/μL) 5.99 ± 0.14* 6.32 ± 0.04 6.43 ± 0.04* 6.81 ± 0.04* <0.001
Vitamin D (ng/mL) 16.47 ± 0.62* 17.73 ± 0.20 17.97 ± 0.20 17.37 ± 0.17 0.419
eGFR (mL/min/1.73m2) 101.50 ± 1.50* 96.63 ± 0.36 93.81 ± 0.38* 94.03 ± 0.33* <0.001
Urine ACR (mg/g) 16.15 ± 4.55 15.45 ± 2.61 13.62 ± 2.21 21.90 ± 2.64* <0.001*p-value <0.05 vs Normal weight
Table 5. Clinical characteristics of male participants according to BMI categories
- 19 -
Variables
BMI (kg/m2) categoryp for Trend
<18.5 18.5−22.9 23.0−24.9 ≥25.0
(N = 219) (N = 3,008) (N = 2,309) (N = 3,173)
Diabetes mellitus (%) 2.42 8.17 9.85 11.88 <0.001
Hypertension (%) 9.90 17.95 25.83 38.18 <0.001
Cardiovascular disease (%) 3.17 2.78 3.93 3.77 0.173
Hypercholesterolemia (%) 2.61 7.16 10.81 16.47 <0.001
Smoking (%)
Non-smoker 29.63 29.75 25.76 24.73
Ex-smoker 18.60 25.68 32.82 30.63
Current-smoker 51.77 44.57 41.42 44.64 <0.001
Alcohol (≥ 2-3/wk, %) 29.69 35.46 38.91 42.14 <0.001
Regular exercise (≥ 3/wk %) 27.72 42.14 43.51 40.81 0.335
Family income (low) 48.79 40.93 37.22 34.56 <0.001
Education (low) 22.58 19.57 22.53 18.17 0.133
Table 6. Clinical characteristics of male participants according to BMI categories
- 20 -
Variables
BMI (kg/m2) categoryp for Trend
<18.5 18.5−22.9 23.0−24.9 ≥25.0
(N = 550) (N = 4,552) (N = 2,359) (N = 3,161)
Age (years) 33.66 ± 0.69* 44.07 ± 0.30 50.85 ± 0.40* 51.62 ± 0.37* <0.001
Waist circumference (cm) 63.73 ± 0.20* 72.16 ± 0.12 79.63 ± 0.15* 88.49 ± 0.19* <0.001
Systolic BP(mmHg) 105.72 ± 0.61* 111.09 ± 0.31 116.96 ± 0.43* 121.03 ± 0.40* <0.001
Diastolic BP (mmHg) 69.52 ± 0.39* 71.50 ± 0.19 73.66 ± 0.24* 76.00 ± 0.24* <0.001
Fasting glucose (mg/dL) 88.05 ± 0.51* 92.29 ± 0.27 98.03 ± 0.63* 103.12 ± 0.57* <0.001
HbA1c (%) 5.41 ± 0.02* 5.57 ± 0.01 5.76 ± 0.02* 5.98 ± 0.02* <0.001
Total cholesterol (mg/dL) 170.27 ± 1.60* 185.31 ± 0.59 193.60 ± 0.84* 197.74 ± 0.84* <0.001
Triglyceride (mg/dL) 78.06 ± 2.26* 95.33 ± 1.06 120.96 ± 2.02* 146.36 ± 3.23* <0.001
HDL-cholesterol (mg/dL) 61.51 ± 0.58* 58.29 ± 0.24 54.01 ± 0.31* 51.43 ± 0.26* <0.001
LDL-cholesterol (mg/dL) 93.24 ± 1.38* 108.10 ± 0.51 115.72 ± 0.76* 117.76 ± 0.69* <0.001
AST (IU/L) 17.85 ± 0.24* 18.91 ± 0.14 20.49 ± 0.23* 22.35 ± 0.24* <0.001
ALT (IU/L) 12.85 ± 0.34* 14.96 ± 0.19 18.22 ± 0.39* 22.67 ± 0.40* <0.001
Hemoglobin (g/dL) 13.04 ± 0.05 13.04 ± 0.02 13.15 ± 0.03* 13.27 ± 0.03* <0.001
WBC (thous/μL) 5.66 ± 0.08 5.66 ± 0.03 5.77 ± 0.04* 6.18 ± 0.04* <0.001
Vitamin D (ng/mL) 14.91 ± 0.31* 15.95 ± 0.15 16.65 ± 0.20* 16.26 ± 0.16 0.000
eGFR (mL/min/1.73m2) 108.78 ± 0.81* 101.47 ± 0.33 95.81 ± 0.42* 95.10 ± 0.39* <0.001
Urine ACR (mg/g) 24.67 ± 15.91* 11.37 ± 0.77 17.57 ± 2.16* 26.62 ± 3.10* <0.001*p-value <0.05 vs Normal weight
Table 7. Clinical characteristics of female participants according to BMI categories
- 21 -
Variables
BMI (kg/m2) categoryp for Trend
<18.5 18.5−22.9 23.0−24.9 ≥25.0
(N = 550) (N = 4,552) (N = 2,359) (N = 3,161)
Diabetes mellitus (%) 1.20 4.47 7.86 14.46 <0.001
Hypertension (%) 4.09 14.35 26.68 38.21 <0.001
Cardiovascular disease (%) 0.43 1.72 4.16 6.30 <0.001
Hypercholesterolemia (%) 3.11 10.27 17.56 23.79 <0.001
Smoking (%)
Non-smoker 86.82 89.91 90.68 90.12
Ex-smoker 4.86 3.91 4.07 3.86
Current smoker 8.32 6.18 5.25 6.02 0.232
Alcohol (≥2-3/wk, %) 11.33 13.27 9.61 12.84 0.700
Regular exercise (≥3/wk %) 20.68 34.35 36.30 33.70 0.013
Family income (low) 36.59 38.88 46.86 51.84 <0.001
Education (low) 10.07 24.21 41.09 48.11 <0.001
Table 8. Clinical characteristics of female participants according to BMI categories
- 22 -
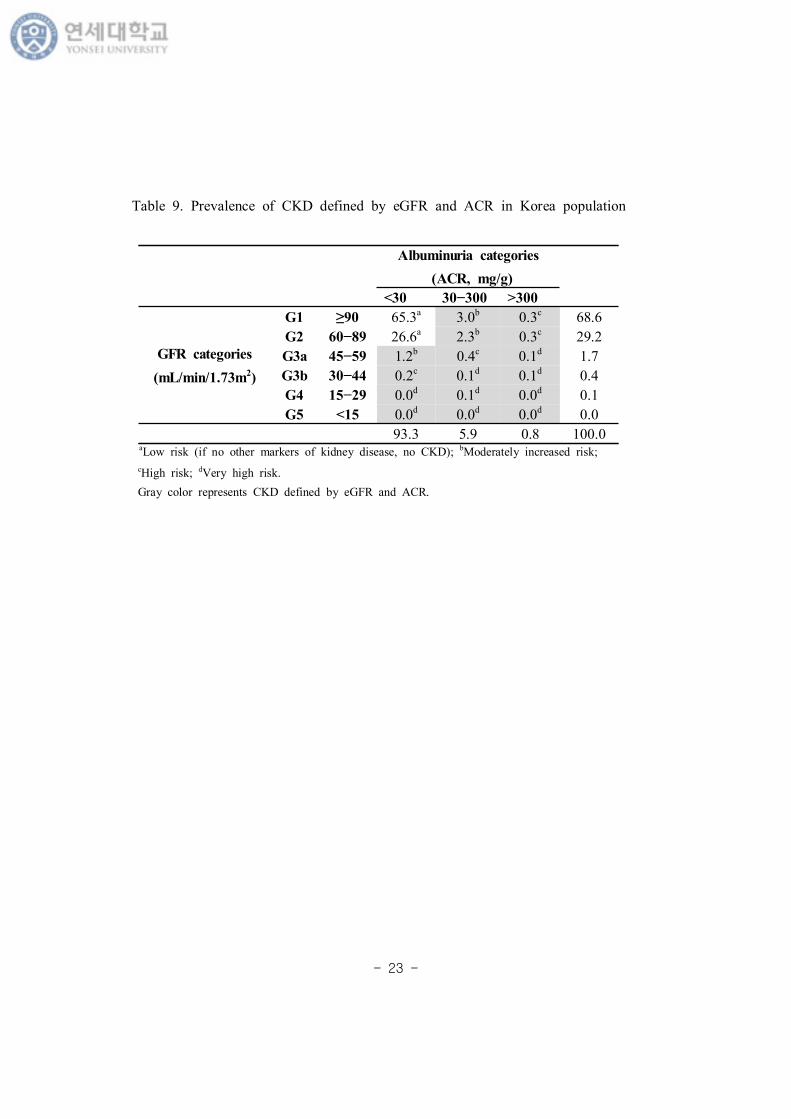
3. KDIGO 2012 지침에 따 만 신질 병
Table 9 2012 KDIGO에 eGFR과 ACR에 CKD 후 분
탕 본 연 분 상자 19,331 명 CKD 병 나타낸 것
다. 우리나 eGFR 분 stage 3 CKD 병 2.2%
Urine ACR 30mg/g 상 CKD 병 6.7% 다.
CKD 후 험도 분 상 험 , 등도 험 , 고 험 , 고 험
분 각각 91.9%, 6.5%, 1.2%, 0.4% 다. eGFR 60 mL/min/1.73m2
미만 ACR 30mg/g 상 등도 험 상에 당 는 CKD 병
8.1% 다.
- 23 -
Albuminuria categories
(ACR, mg/g)
<30 30−300 >300
GFR categories
(mL/min/1.73m2)
G1 ≥90 65.3a 3.0b 0.3c 68.6
G2 60−89 26.6a 2.3b 0.3c 29.2
G3a 45−59 1.2b 0.4c 0.1d 1.7
G3b 30−44 0.2c 0.1d 0.1d 0.4
G4 15−29 0.0d 0.1d 0.0d 0.1
G5 <15 0.0d 0.0d 0.0d 0.0
93.3 5.9 0.8 100.0
Table 9. Prevalence of CKD defined by eGFR and ACR in Korea population
aLow risk (if no other markers of kidney disease, no CKD); bModerately increased risk;
cHigh risk; dVery high risk.
Gray color represents CKD defined by eGFR and ACR.
- 24 -
4. BMI 범주에 따 사 체여과 분 한 만 신질 병
(1) 남자
체 , 상체 , 과체 , 만 에 eGFR 60 mL/min/1.73m2 미
만 CKDGFR 병 각각 2.53%, 1.99%, 2.02%, 2.64% 체 과 만
에 상 그 값 높 U자 태 보 다. CKD stage 3b 4 분
체 에 가장 높았다 (Figure 3).
(2) 여자
체 , 상체 , 과체 , 만 에 eGFR 60 mL/min/1.73m2 미
만 CKDGFR 병 각각 1.40%, 1.52%, 2.49%, 3.45% BMI 범주가 증가
에 높아지는 경향 보 다. CKD stage 5 분 체 에
0.31% 가장 높았다 (Figure 3).
- 25 -
Figure 3. Prevalence of CKDGFR classified by eGFR according to BMI categories.
- 26 -
5. BMI 범주에 따 ACR 분 한 만 신질 병
(1) 남자
ACR 30 mg/g 상 CKDACR 병 체 , 상체 , 과체 ,
만 에 각각 6.78%, 4.80%, 4.64%, 8.63% 체 과 만 에 상
높았다. (Figure 4).
(2) 여자
ACR 30 mg/g 상 CKDACR 병 체 , 상체 , 과체 ,
만 에 각각 4.40%, 5.0%, 7.74%, 11.51% BMI 범주가 증가 에 높
아지는 경향 보 다 (Figure 4).
- 27 -
Figure 4. Prevalence of CKDACR classified by ACR according to BMI categories.
- 28 -
6. BMI 범주에 따 GFR과 ACR 평가 CKD 병
우리 연 는 2012 KDIGO 지 에 eGFR과 ACR 분 CKD 후
험도 분 상 증등도 상 험 CKD 고 CKDRisk
다. Figure 5는 CKDRisk에 등도 험 , 고 험 , 고 험 분
BMI 범주에 나타낸 것 다.
(1) 남자
체 , 상체 , 과체 , 만 에 CKDRisk 병 각각 7.95%,
6.05%, 5.93%, 10.19% 체 과 만 에 상 높았다. 체
에 고 험 분 1.06% 가장 높았다.
(2) 여자
체 , 상체 , 과체 , 만 에 CKDRisk 병 각각 5.07%,
5.97%, 9.47%, 13.61% BMI 범주가 증가 에 높아지는 경향 보 다.
- 29 -
Figure 5. Prevalence of CKDRisk classified by eGFR and ACR according to BMI categories.
- 30 -
7. 사 체여과 한 만 신질 에 한 지스틱분
본 연 에 는 eGFR 60 (mL/min/1.73m2) 미만 CKD CKDGFR
다. BMI (kg/m2)가 18.5 상 23미만 상체 집단
여 BMI 범주 CKDGFR 연 보고자 다 지스틱 회귀분
(Multivariate logistic regression analysis) 다 (Table 10).
나 보 (Model 1), 남자 경우 상체 과 여 BMI
25 kg/m2 상 만 CKDGFR 즈 가 2.36 (95% CI, 1.674-3.329;
p-value <0.001), 여자 경우 1.59 (95% CI, 1.171-2.153; p-value =
0.003) 게 높았다. Model 1에 생 습 ( 연 , 주 , 규 운
동여부) 추가 보 (Model 2), 남자 경우 상체 과
여 만 CKDGFR 즈 가 2.29 (95% CI, 1.566-3.335; p-value
<0.001), 여자 경우 1.56 (95% CI, 1.039-2.344; p-value = 0.032)
게 높았다. Model 2에 추가 축 압, HbA1c, HDL-C, TG 보
(Model 3), 남자 경우 상체 과 여 만 CKDGFR
즈 가 1.88 (95% CI, 1.261-2.797; p-value = 0.002) 게 높았 ,
여자 경우 BMI는 CKDGFR과 있는 자가 아니었다.

- 31 -
VariableMen Women
Odds ratio (95% CI) Odds ratio (95% CI)
Model 1
BMI (kg/m2)
<18.5 0.770 (0.370−1.601) 1.835 (0.694−4.849)
18.5−22.9 1.0 (ref.) 1.0 (ref.)
23−24.9 1.156 (0.798−1.673) 1.186 (0.834−1.686)
≥25 2.360* (1.674−3.329) 1.588* (1.171−2.153)
Model 2
BMI (kg/m2)
<18.5 0.476 (0.172−1.319) 2.144 (0.580−7.921)
18.5−22.9 1.0 (ref.) 1.0 (ref.)
23−24.9 0.969 (0.651−1.442) 0.764 (0.464−1.257)
≥25 2.285* (1.566−3.335) 1.560* (1.039−2.344)
Model 3
BMI (kg/m2)
<18.5 0.620 (0.218−1.766) 2.388 (0.613−9.301)
18.5−22.9 1.0 (ref.) 1.0 (ref.)
23−24.9 0.868 (0.575−1.312) 0.693 (0.415−1.156)
≥25 1.878* (1.261−2.797) 1.372 (0.904−2.084)
Table 10. Multivariate-adjusted odds raitos of BMI for chronic kidney disease
defined by eGFR (CKDGFR)
*p-value <0.05
Model 1 was adjusted for age. Model 2 was adjusted for the variables in model 1, plus
smoking, drinking and exercise habits. Model 3 was adjusted for the variables in model 2, plus
systolic blood pressure (SBP), HbA1c, high-density lipoprotein cholesterol (HDL-C), triglyceride
(TG).
- 32 -
8. ACR 한 만 신질 에 한 지스틱분
ACR 30 mg/g 상 경우 만 신질 (CKD) CKDACR
다. BMI (kg/m2)가 18.5 상 23미만 상체 집단
여 BMI 범주 CKDACR 연 보고자 다 지스틱 회귀분
다 (Table 11).
나 보 (Model 1), 남자 경우 상체 과 여 BMI
25 kg/m2 상 만 CKDACR 즈 가 2.12 (95% CI, 1.683-2.669;
p-value <0.001), 여자 경우 1.94 (95% CI, 1.554-2.418; p-value
<0.001) 게 높았다. Model 1에 여자 경우 과체 (23≤ BMI
(kg/m2) <25) 에 상 에 CKDACR 즈 가 1.28 (95% CI,
1.011-1.610; p-value = 0.040) 게 높았다. Model 1에 추가 생 습
( 연 , 주 , 규 운동여부) 보 (Model 2), 남자 경
우 상체 에 만 CKDACR 즈 가 1.99 (95% CI,
1.553-2.541; p-value <0.001), 여자 경우 1.91 (95% CI, 1.476-2.475;
p-value <0.001) 게 높았다. Model 2에 추가 축 압,
HbA1c, HDL-C, TG 보 (Model 3), 남자 경우 상체 에
만 CKDACR 즈 가 1.58 (95% CI, 1.207-2.069; p-value =
0.001), 여자 경우 1.40 (95% CI, 1.082-1.814; p-value = 0.011)
게 높았다. 남자 경우 과체 에 CKDACR 즈 가 0.74 (95% CI,
0.551-0.994; p-value = 0.045) 게 낮았다.

- 33 -
VariableMen Women
Odds ratio (95% CI) Odds ratio (95% CI)
Model 1
BMI (kg/m2)
<18.5 1.368 (0.720−2.599) 1.301 (0.819−2.066)
18.5−22.9 1.0 (ref.) 1.0 (ref.)
23−24.9 0.919 (0.708−1.192) 1.276* (1.011−1.610)
≥25 2.120* (1.683−2.669) 1.939* (1.554−2.418)
Model 2
BMI (kg/m2)
<18.5 1.303 (0.614−2.766) 1.064 (0.595−1.901)
18.5−22.9 1.0 (ref.) 1.0 (ref.)
23−24.9 0.808 (0.608−1.073) 1.273 (0.955−1.697)
≥25 1.986* (1.553−2.541) 1.911* (1.476−2.475)
Model 3
BMI (kg/m2)
<18.5 1.922 (0.862−4.285) 1.133 (0.632−2.033)
18.5−22.9 1.0 (ref.) 1.0 (ref.)
23−24.9 0.740* (0.551−0.994) 1.088 (0.815−1.453)
≥25 1.580* (1.207−2.069) 1.401* (1.082−1.814)
Table 11. Multivariate-adjusted odds ratios of BMI for chronic kidney disease
defined by ACR (CKDACR)
*p-value <0.05
Model 1 was adjusted for age. Model 2 was adjusted for the variables in model 1, plus
smoking, drinking and exercise habits. Model 3 was adjusted for the variables in model 2, plus
systolic blood pressure (SBP), HbA1c, high-density lipoprotein cholesterol (HDL-C), triglyceride
(TG).
- 34 -
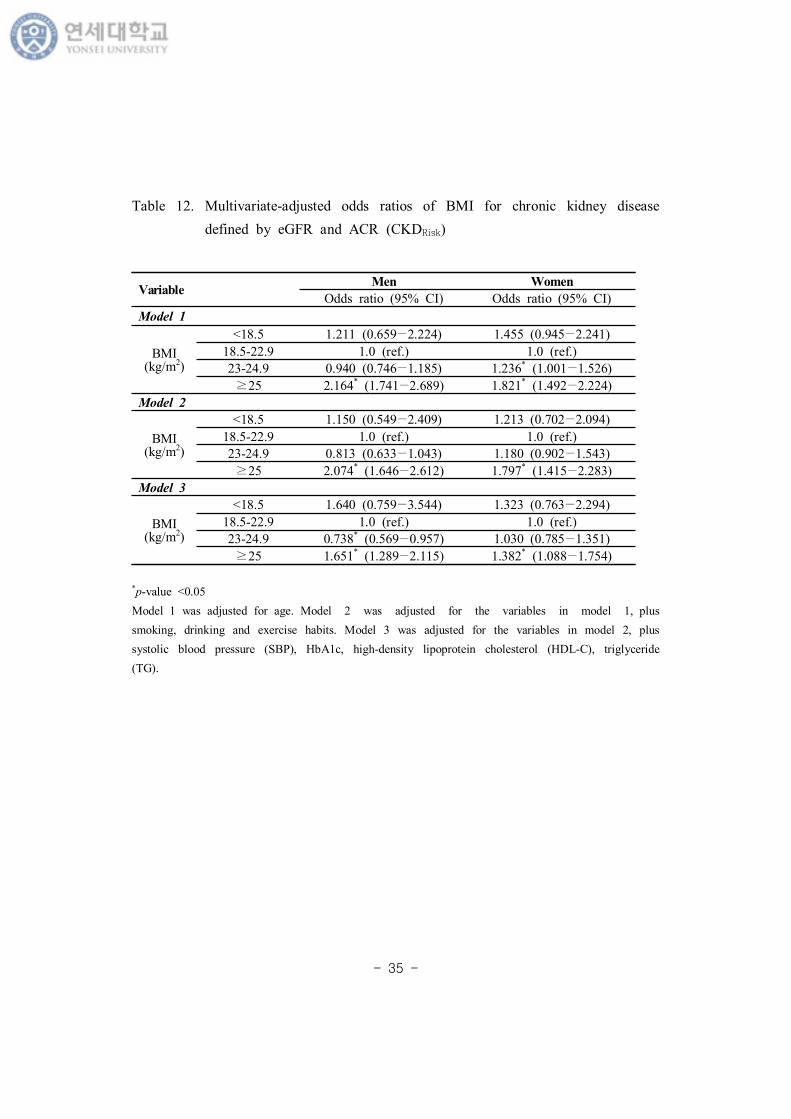
9. 사 체여과 과 ACR 한 만 신질 에 한 지스틱분
우리 연 는 2012 KDIGO 지 에 GFR과 ACR 분 CKD 후
험도 분 상 증등도 상 험 CKD 고 CKDRisk 다.
BMI (kg/m2)가 18.5 상 23미만 상체 집단 여 BMI 범주
CKDRisk 연 알아보고자 다 지스틱 회귀분 다 (Table 12).
나 보 (Model 1), 남자 경우 상체 과 여 BMI
25 kg/m2 상 만 CKDRisk 즈 가 2.16 (95% CI, 1.741-2.689,
; p-value <0.001), 여자 경우 1.82 (95% CI, 1.492-2.224; p-value
<0.001) 게 높았다. 여자 경우 과체 (23≤ BMI (kg/m2) <25)
상체 과 여 CKDRisk 즈 가 1.24 (95% CI, 1.001-1.526;
p-value = 0.049) 게 높았다. Model 1에 추가 생 습 ( 연 ,
주 , 규 운동여부) 보 (Model 2), 남자 경우 상체
과 여 BMI 25 kg/m2 상 만 CKDRisk 즈 가 2.07 (95%
CI, 1.646-2.612; p-value <0.001), 여자 경우 1.80 (95% CI,
1.415-2.283; p-value <0.001) 게 높았다. Model 2에 추가 축
압, HbA1c, HDL-C, TG 보 (Model 3), 남자 경우 상체
과 여 만 CKDRisk 즈 가 1.65 (95% CI, 1.289-2.115;
p-value <0.001), 여자 경우 1.38 (95% CI, 1.088-1.754; p-value =
0.008) 게 높았다. 남자 경우 과체 에 상체 에
CKDRisk 즈 가 0.74 (95% CI, 0.569-0.957; p-value = 0.022)
게 낮았다.
- 35 -
VariableMen Women
Odds ratio (95% CI) Odds ratio (95% CI)
Model 1
BMI (kg/m2)
<18.5 1.211 (0.659−2.224) 1.455 (0.945−2.241)
18.5-22.9 1.0 (ref.) 1.0 (ref.)
23-24.9 0.940 (0.746−1.185) 1.236* (1.001−1.526)
≥25 2.164* (1.741−2.689) 1.821* (1.492−2.224)
Model 2
BMI (kg/m2)
<18.5 1.150 (0.549−2.409) 1.213 (0.702−2.094)
18.5-22.9 1.0 (ref.) 1.0 (ref.)
23-24.9 0.813 (0.633−1.043) 1.180 (0.902−1.543)
≥25 2.074* (1.646−2.612) 1.797* (1.415−2.283)
Model 3
BMI (kg/m2)
<18.5 1.640 (0.759−3.544) 1.323 (0.763−2.294)
18.5-22.9 1.0 (ref.) 1.0 (ref.)
23-24.9 0.738* (0.569−0.957) 1.030 (0.785−1.351)
≥25 1.651* (1.289−2.115) 1.382* (1.088−1.754)
Table 12. Multivariate-adjusted odds ratios of BMI for chronic kidney disease
defined by eGFR and ACR (CKDRisk)
*p-value <0.05
Model 1 was adjusted for age. Model 2 was adjusted for the variables in model 1, plus
smoking, drinking and exercise habits. Model 3 was adjusted for the variables in model 2, plus
systolic blood pressure (SBP), HbA1c, high-density lipoprotein cholesterol (HDL-C), triglyceride
(TG).
- 36 -
Ⅳ. 고찰
본 연 는 민건강 양 사 5 2, 3차 도 (2011, 2012) 6 1, 2
차 도 (2013, 2014) 자료 용 여 우리나 만 19 상 19,331명 (남자
8,709명, 여자 10,622명) 상 eGFR과 ACR CKDRisk 만
연 분 다. 남 모 에 상체 과 여 BMI 25 kg/m2
상 만 CKDRisk 험도가 높았 , eGFR만 CKD
, 여자 경우 만과 CKDGFR사 없었다.
Moorhead (1982)는 30 과도 지질 (lipid) 신장 축 CKD 진행에
향 다는 지질 독 (lipid toxicity) 개 안 다. 그 후, 만,
사증후 당뇨병 모 용 동 실험들 지 사 체, 근
뇨 등 신장 직에 축 는 것 찰 다 (Mount et al., 2015;
Kume et al., 2007). 고지 식 에 사 체경 단 뇨가 생
, plasminogen activator inhibitor-1 (PAI-1), vascular endothelial
growth factor (VEGF), type IV collagen, fibronectin 등 신장 증
가 다 (Jiang et al., 2005). 포내 과도 free fatty acid (FFA)
가 fatty acylCoA, diacylglycerol과 같 독 사 질 신장 내 축
는 지질 독 주요 자 알 있 , 다 reactive
oxygen species (ROS) 생 , 포내 신 달과 란, 염증
(proinflammatory) (profibrotic) 자들 분 , 지질에
포자 (lipoapoptosis) 등 있다 (Bobulescu, 2010). 고 슐린 증에
renin-angiotensin system 가 사 체 과여과 고 압, 내
포 능 상 등 다 (Rutkowski et al., 2006).
Othman 등(2009) 당뇨병 자에 CKD 진행 (>1 ml/min/1.73
- 37 -
m2/year) 도가 BMI상 상체 에 44.7% , 과체 나 만
에 각각 62%, 79.5% 높다고 보고 다. , Brown 등(2012)
당뇨병 자에 eGFR 변 CKD 진행 BMI 연 없
다고 보고 다. Framingham offspring cohort 자료 용 연 에 는
BMI 30 kg/m2 상 만 CKD 연 있었 나 당뇨, 고 압, 연
등 심 질 험요 들 보 후에는 연 보 지 않았다
(Foster et al., 2008). 내 종단 연 는 사증후 아니지만 BMI가
25 kg/m2 상 경우 CKD 즈 가 2.03 높다고 보고 (Song,
Sung and Lee, 2015), 다 내 연 에 도 사 건강 만 에
CKD 생 1.3 높았다고 보고 다 (Jung et al., 2015). 근에
내 향 트 연 에 BMI가 증가 eGFR 60
mL/min/l .73 m2 미만 CKD 생 과체 에 3.5 , 만 에 6.7
높았다 (Chang et al., 2016). 우리 연 에 BMI 25 kg/m2 상 만
란변 들 보 에는 남 모 에 eGFR 60 mL/min/l .73 m2 미
만 CKD (CKDGFR) 험도 높 나, 생 습 ( 연 , 주 , 신체
동), 축 압, HbA1c, 지 그리고 HDL 스 모 보 후
에는 남자에 만 양 보 다.
아시아 상 만과 CKD 연 본 연 들 주 남자에 그
경향 보 다. 본 키나 건강 검진 자료 용
트 연 에 남자에 만 BMI 21 kg/m2 상과 ESRD 진행 사
양 보 다 (Iseki et al., 2004). 싱가포 연 에 도 BMI 상 과체
만과 eGFR 60 mL/min/l .73 m2 미만 CKD 사 남
자에 만 다 (Shankaret al., 2008). 아시아 에도 스트리아에 진
행 당뇨, 고 압 심 질 병 있는 고 험 상
트 연 에 eGFR 남자에 만 BMI 보 다 (Nagel
- 38 -
et al., 2013). 만 신질 진행에 별 끼 는 향에 타 분 결과
에 남 다양 원 신질 진행과 양 보 다 (Neugarten,
Acharya and Silbiger, 2000). 러 연 결과들과는 달리 본 미야자키
요다 지역 트 연 에 는 CKD가 아닌 1,506명 남 10
간 추 찰 결과, 여자에 만 BMI 증가가 CKD 생과
보 다. 지만 연 는 러 결과 원 에 뚜 시 주고 있지
않다 (Komura et al., 2013). 스 엘 단 연 에 도 만과 CKD
연 나 , 압, 당뇨, 상지질 증, 연 등 보 후 여자에 만
다. 연 에 는 여자에 러 뚜 했 것에 ,
여 연 높았 남자에 여자 상자 가 었 므 통계
편견 작용했 있 다 (Cohen et al., 2013). 우리 연
에 만과 CKDGFR 연 남자에 만 것 다 연 결과
다.
남 CKD 진행 차 명 는 몇 가지 들 있다. 동 , 포 실
험 통 에스트 (estradiol) 산지움 포 (mesangial cell) 증식
시키고 겐 (collagen) 감소시킴 사 체경 진행 늦추
는 것 었 , 스토스 (testosterone) 러 신장 보 효
과 보 지 않았다 (Kwan et al., 1996). 안드 겐 (androgen) 근
뇨 재 증가시키거나 닌-안지 신계 (renin-angiotensin system)
시킴 사 체 고 압과 신손상 는 것 알 있다
(Reckelhoff and Granger, 1999). 다 연 는 Testosterone 사람 근
뇨 포에 포소 (apoptosis) 경 시 신손상 는
것 보고 다 (Verzola et al., 2004). 그 에도 남 여 에 연
높고 (Stengel et al., 2013; Stengel et al., 2000), 단 질, 많
취 , estradiol 강 산 역 는 phenolic hydroxyl group
- 39 -
포 고 있어 여자에 신손상에 보 작용 는 것 알 있다
(Silbiger and Neugarten, 1995).
아시안 에 알부민뇨가 많 생 (Fischbacher et al.,
2003), 단 뇨 동 당뇨신병증 (proteinurinc diabetic kidney disease)
병 도 높 것 알 있다 (Chandie Shaw et al., 2002;
Bhalla et al., 2013). 우리 연 에 eGFR 60 mL/min/l .73 m2 미만 CKD
병 2.2% , 는 미 민건강 양 사 (NHANES)
1999-2006 자료에 18,026명 상 보고 CKD stage 3 병
6.7%에 낮 다. ACR 30 mg/g 상 CKD 병 우리 자
료상 6.7% 미 과 거 동 보 다. 같 결과는 아시아 에
알부민뇨 CKD 평가 는 요 요 시 다.
알부민뇨는 복부 만과 높 것 알 있 , 남아시아
(South Asian) 상 연 에 허리-엉 가 클 알부
민뇨 상 험도가 4.1 높았다 (Chandie shaw et al., 2007).
트 연 는 복부 만과 ACR 30 mg/g 상 알부민뇨 양
보고 있다 (Lin et al., 2012). 다 연 에 는 BMI
28.0 kg/m2 상 허리-엉 복부 만 동시에 만
는 경우 ACR 상승 즈 가 1.82 높았다 (Du et al., 2014). 우리 연
에 도 남 모 BMI 25 kg/m2 상 만 허리 4 사분 에
속 는 경우 CKDACR 험도 게 높 , 는 아시아 다 연
들과 사 결과 다.
우리 연 에 남자 경우 BMI (kg/m2) 23 상 25미만 과체 CKDRisk
험도가 낮았다. 남자 경우 체 에 CKD 분 상 나
과체 에 높았다. 몇몇 체계 고찰 타분 연 들에 CKD 자
만 역 (obesity paradox)에 언 있다 (Ahmadi et al.,
- 40 -
2015; Lu et al., 2014). 즉, CKD 자 경우 체 에 사망 높고
과체 거나 약간 만 경우에 히 사망 나 CKD 진행 낮았
다는 것 다. 우리 연 결과는 연 obesity paradox 견
맥상통 는 부분 도 있다. 지만 2008−2011 KNHANES 자료 용
근 내 연 에 CKD는 근감소증과 양 연 보 근감소증
없는 남자 상자들 평균 BMI가 23.8 kg/m2 과체 에 속 다
(Moon et al., 2015). 우리 연 에 근 량 는 없었지만,
과체 에 근 량 다 보다 많았 가능 없다.
만 지 BMI가 아닌 허리 사용 는 것 CKD 연 보
는 다는 연 결과들 있다. 내 향 트 연 는 허리
, 허리-엉 , 허리 -신장 는 신 능 감소 양 연
있 나 BMI는 보 지 않는다고 보고 다 (Oh, Quan,
and Jeong, 2013). 트 연 에 도 BMI가 아닌 허리-엉
가 CKD 생과 양 연 보 다고 보고 다 (Elsayed et
al., 2008). 키 2 당뇨병 자 상 연 에 24시간 Urine
albumin excretion rate는 허리 양 연 보 , BMI는
creatinine clearance 양 연 보 다. 지만 체 보 후
BMI는 신 능과 없었다 (Afsar et al., 2011). 우리 연 에 남자
경우 3, 4 사분 허리 , 여자 경우 4 사분 허리 는
CKDACR, CKDRisk 양 연 보 다 (Supplement Table 5, 6).
지만 BMI 마찬가지 허리 는 란 변 모 보 경우, 남자에
만 CKDGFR과 양 연 보 다 (Supplement Table 4).
우리 연 에 CKDGFR 남자에 나 , HbA1c 양 보 ,
HDL 스 주 과는 연 보 고, 여자 경우 나 ,
HbA1c 양 보 다 (Supplement Table 1). 나 고 당 신
- 41 -
능 악 주요 원 임 잘 알 있 , 낮 HDL 스 과 CKD
생 연 여러 사증후 연 통 보고 있다 (Fox et al.,
2004; Okada et al., 2014). 우리 연 에 여러 란 변 보 후 남자
에 주 과 CKDGFR 사 에 보 것 , 남자 체 상
체 에 CKD 분 높았 나 알 취량 가장 낮았 었
것 보 다. CKDACR 남자 경우 나 , 축 압, HbA1c, 지
과 양 연 보 여자 경우 나 , 축 압, HbA1c 양 연
보 고, 운동 과는 연 보 다 (Supplement Table 2). 신체
동 많 는 사람에 게 는 사람 CKD 생 상 험도가 2
상 높 것 보고 있다 (Stengel, Tarver–Carr and Powe, 2003;
Perneger et al., 1999). 우리 연 에 여자 경우 운동과 CKDACR 사 에
보 것 단 연 는 고 , 고 험 에 히 운
동 규 고 있 가능 있 므 알부민뇨 운동과 연
향 연 볼 요가 있겠다.
본 연 첫째, 민건강 양 사는 단 연 시간 후
계 분명 게 시 없 므 과 계 명 히 규명 가 어 다.
째, CKD는 상 3개월 상 지속 는 신 능 미 므 eGFR과
ACR 복 가 요 나 우리 자료는 1회 값 탕 다.
째, 만 BMI 만 는 것 내장 지 , 근 량과 같 사
향 주는 자들 분 없었다. 그러나 우리 연 는 내장지 과 연
높 복부 만 미 는 허리 용 CKD
다 (Supplement Table 4−6). 째, 만 간 시 지 않았다.
실 어린 시 과체 었 경우가 그 지 않 경우에 에
CKD 생과 연 높 것 알 있 므 (Silverwood et al.,
2013), 과거 만 여부 간도 분 시 고 야 부분 다. 러
- 42 -
에도 불 고, 우리 자료는 특 는 민건강
양 사 용 2011 부 2014 지 4 자료 통 여 분
많 상자 포 다. 통계 분 에 복 본
계 시 용 여 도 신뢰 높 다. 만과 CKD 본
부분 연 들 CKD eGFR 만 평가 거나 단 뇨 는 ACR 분
다. 에 우리 연 에 는 2012 KDIGO 지 여 eGFR과
ACR CKD 분 , 남 모 에 만과 CKDRisk
연 다. 우리 연 는 알부민뇨 병 상 높
우리나 에 CKD 평가 단 히 eGFR 만 는 것 자 만
CKD에 미 는 향 과소평가 있 시사 다.
- 43 -
Ⅴ. 결
본 연 는 에 eGFR과 ACR CKD 만 연
분 다. 남 모 에 상체 과 여 BMI 25 kg/m2 상 만
CKDRisk 험도가 높았 , 남자 경우 과체 에 CKDRisk 험
도가 낮았다. 지만 eGFR 만 CKD (CKDGFR), 만과
CKDGFR 연 남자에 만 다. eGFR 뿐만 아니 ACR
께 사용 여 CKD 평가 는 것 남 모 에 만과 같 CKD
자 과소평가 지 않 있었다. 추후 종단 연 실험 연 통
남 과 여 에 CKD 진행에 있어 만과 과체 역 알아볼
요가 있 것 사료 다.
- 44 -
참고 헌
Levey AS, Atkins R, Coresh J, Cohen EP, Collins AJ, Eckardt KU,
Nahas ME, Jaber BL, Jadoul M, Levin A, Powe NR, Rossert J,
Wheeler DC, Lameire N, Eknoyan G. Chronic kidney disease as a
global public health problem: approaches and initiatives—a
position statement from kidney disease improving global outcomes.
Kidney Int 2007;72(3):247–59.
Shin SY, Kwon MJ, Park H, Woo HY. Comparison of chronic kidney
disease prevalence examined by the chronic kidney disease
epidemiology collaboration equation with that by the modification
of diet in renal disease equation in korean adult population.
J Clin Lab Anal 2014;28(4):320–7.
Jin DC, Yun SR, Lee SW, Han SW, Kim W, Park J, Kim YK. Lessons
from 30 years’ data of Korean end-stage renal disease registry,
1985–2015. Kidney Res Clin Pract 2015;34(3):132–9.
National Kidney Foundation. K/DOQI clinical practice guidelines for
chronic kidney disease: Evaluation, classification, and stratification.
Am J Kidney Dis 2002;39:S1-266.
Kidney Disease Improving Global Outcomes 2012 Clinical Practice
Guideline for the Evaluation and Management of chronic kidney
disease. Kidney Int Suppl 2013;3(1);1-150.
- 45 -
Gansevoort RT, Matsushita K, van der Velde M, Astor BC, Woodward
M, Levey AS, de Jong PE, Coresh J. Lower estimated eGFR and
higher albuminuria are associated with adverse kidney outcomes. A
collaborative meta-analysis of general and high-risk population
cohorts. Kidney Int 2011;80(1):93–104.
Matsushita K, van der Velde M, Astor BC, Woodward M, Levey AS, de
Jong PE, Coresh J, Gansevoort RT. Association of estimated
glomerular filtration rate and albuminuria with all-cause and
cardiovascular mortality in general population cohorts: a
collaborative meta-analysis. Lancet 2010;375(9731):2073–81.
Hallan SI, Ritz E, Lydersen S, Romundstad S, Kvenild K, Orth SR.
Combining eGFR and albuminuria to classify CKD improves
prediction of ESRD. J Am Soc Nephrol 2009;20(5):1069–77.
Brantsma AH, Bakker SJ, Hillege HL, de Zeeuw D, de Jong PE,
Gansevoort RT. Cardiovascular and renal outcome in subjects with
K/DOQI stage 1–3 chronic kidney disease: the importance of
urinary albumin excretion. Nephrol Dial Transplant 2008;23(12):3851
–8.
Guh DP, Zhang W, Bansback N, Amarsi Z, Birmingham CL, Anis AH.
The incidence of co-morbidities related to obesity and overweight:
a systematic review and meta-analysis. BMC Public Health
2009;9:88.
- 46 -
World health organization 2016. Fact sheet on obesity and overweight.
Available from: URL:http://www.who.int/mediacentre/factsheet/fs311/en/
보건복지부. 3차 민건강증진종 계획. 2011-2020.
Song YM, Sung J, Lee K. Longitudinal relationships of metabolic
syndrome and obesity with kidney function: Healthy Twin Study.
Clin Exp Nephrol 2015;19(5):887-94.
Kang YU, Kim HY, Choi JS, Kim CS, Bae EH, Ma SK, Kim SW.
Metabolic syndrome and chronic kidney disease in an adult Korean
population: results from the Korean National Health Screening.
PLoS One 2014;9(5):e93795.
Jung CH, Lee MJ, Kang YM, Hwang JY, Kim EH, Park JY, Kim HK, Lee
WJ. The risk of chronic kidney disease in a metabolically healthy
obese population. Kidney Int 2015;88(4):843-50.
Fox CS, Larson MG, Leip EP, Culleton B, Wilson PW, Levy D.
Predictors of New-Onset Kidney Disease in a Community-Based
Population. JAMA 2004;291(7):844-50.
Cao X, Zhou J, Yuan H, Wu L, Chen Z. Chronic kidney disease among
overweight and obesity with and without metabolic syndrome in an
urban Chinese cohort. BMC Nephrol 2015;16:85.
- 47 -
WHO expert consultation. Appropriate body-mass index for Asian
populations and its implications for policy and intervention
strategies. Lancet 2004;363:157–63.
Moorhead JF, Chan MK, El-Nahas M, Varghese Z. Lipid nephrotoxicity
in chronic progressive glomerular and tubulo-interstitial disease.
Lancet 1982;2(8311):1309–11.
Mount P, Davies M, Choy SW, Cook N, Power D. Obesity-Related
Chronic Kidney Disease—The Role of Lipid Metabolism. Metabolites
2015;5(4):720-32.
Kume S, Uzu T, Araki S, Sugimoto T, Isshiki K, Chin-Kanasaki M,
Sakaguchi M, Kubota N, Terauchi Y, Kadowaki T, Haneda M,
Kashiwagi A, Koya D. Role of altered renal lipid metabolism in the
development of renal injury induced by a high-fat diet. J Am Soc.
Nephrol 2007;18(10):2715–23.
Jiang T, Wang Z, Proctor G, Moskowitz S, Liebman SE, Rogers T,
Lucia MS, Li J, Levi M. Diet-induced obesity in c57bl/6j mice
causes increased renal lipid accumulation and glomerulosclerosis
via a sterol regulatory element-binding protein-1c-dependent
pathway. J Biol Chem 2005;280(37):32317–25.
Bobulescu IA. Renal lipid metabolism and lipotoxicity. Curr Opin
Nephrol Hypertens 2010;19(4):393–402.
- 48 -
Rutkowski P, Klassen A, Sebekova K, Bahner U, Heidland A. Renal
Disease in Obesity: The Need for Greater Attention. J Ren Nutr
2006;16(3):216-23.
Othman M, Kawar B, El Nahas AM. Influence of obesity on progression
of non-diabetic chronic kidney disease: A retrospective cohort
study. Nephron Clin Pract 2009;113(1):c16-23.
Brown RN, Mohsen A, Green D, Hoefield RA, Summers LK, Middleton
RJ, O'Donoghue DJ, Kalra PA, New DI. Body mass index has no
effect on rate of progression of chronic kidney disease in
non-diabetic subjects. Nephrol Dial Transplant 2012;27(7):2776-80.
Foster MC, Hwang SJ, Larson MG, Lichtman JH, Parikh NI, Vasan RS,
Levy D, Fox CS. Overweight, Obesity, and the Development of
Stage 3 CKD: The Framingham Heart Study. Am J Kidney Dis
2008;52(1):39-48.
Chang Y, Ryu S, Choi Y, Zhang Y, Cho J, Kwon MJ, Hyun YY, Lee KB,
Kim H, Jung HS, Yun KE, Ahn J, Rampal S, Zhao D, Suh BS,
Chung EC, Shin H, Pastor-Barriuso R, Guallar E. Metabolically
Healthy Obesity and Development of Chronic Kidney Disease A
cohort sutdy. Ann Intern Med 2016;164(5):305-12.
Iseki K, Ikemiya Y, Kinjo K, Inoue T, Iseki C, Takishita S. Body mass
index and the risk of development of end-stage renal disease in a
screened cohort. Kidney Int 2004;65(5):1870-6.
- 49 -
Shankar A, Leng C, Chia KS, Koh D, Tai ES, Saw SM, Lim SC, Wong
TY. Association between body mass index and chronic kidney
disease in men and women: population-based study of Malay
adults in Singapore. Nephrol Dial Transplant 2008;23(6):1910-8.
Nagel G, Zitt E, Peter R, Pompella A, Concin H, Lhotta K. Body mass
index and metabolic factors predict glomerular filtration rate and
albuminuria over 20 years in a high-risk population. BMC Nephrol
2013;14:177
Neugarten J, Acharya A, Silbiger SR. Effect of Gender on the
Progression of Nondiabetic Renal Disease: A Meta-Analysis. J Am
Soc Nephrol 2000;11(2):319-29.
Komura H, Nomura I, Kitamura K, Kuwasako K, Kato J. Gender
difference in relationship between body mass index and
development of chronic kidney disease. BMC Res Notes 2013;6:463.
Cohen E1, Fraser A, Goldberg E, Milo G, Garty M, Krause I.
Association between the body mass index and chronic kidney
disease in men and women. A population-based study from Israel.
Nephrol Dial Transplant 2013;28 Suppl 4:iv130-5.
Kwan G, Neugarten J, Sherman M, Ding Q, Fotadar U, Lei J, Silbiger S.
Effects of sex hormones on mesangial cell proliferation and
collagen synthesis. Kidney Int 1996;50(4):1173-9.
- 50 -
Reckelhoff JF, Granger JP. Role of androgens in mediating
hypertension and renal injury. Clin Exp Pharmacol Physiol 1999
;26(2):127-31.
Verzola D, Gandolfo MT, Salvatore F, Villaggio B, Gianiorio F, Traverso
P, Deferrari G, Garibotto G. Testosterone promotes apoptotic
damage in human renal tubular cells. Kidney Int
2004;65(4):1252-61.
Stengel B, Tarver-Carr ME, Powe NR, Eberhardt MS, Brancati FL.
Lifestyle Factors, Obesity and the Risk of Chronic Kidney Disease.
Epidemiology 2003;14(4):479–87
Stengel B, Couchoud C, Cénée S, Hémon D. Age, blood pressure and
smoking effects on chronic renal failure in primary glomerular
nephropathies. Kidney Int 2000;57(6):2519-26.
Silbiger SR, Neugarten J. The Impact of Gender on the Progression of
Chronic Renal Disease. Am J Kidney Dis 1995;25(4):515-33.
Fischbacher CM, Bhopal R, Rutter MK, Unwin NC, Marshall SM, White
M, Al-berti KG. Microalbuminuria is more frequent in South Asian
than in European origin populations: a comparative study in
Newcastle, UK. Diabet Med 2003;20(1):31–6.
Chandie Shaw PK, Vandenbroucke JP, Tjandra YI, Rosendaal FR,
Rosman JB, Geerlings W, de Charro FT, van Es LA: Increased
- 51 -
end-stage diabetic nephropathyin Indo-Asian immigrants living in
the Netherlands. Diabetologia 2002;45(3):337–41.
Bhalla V, Zhao B, Azar KM, Wang EJ, Choi S, Wong EC, Fortmann SP,
Palaniappan LP. Racial/Ethnic Differences in the Prevalence of
Proteinuric and Nonproteinuric Diabetic Kidney Disease. Diabetes
Care 2013;36(5):1215–21.
Chandie Shaw PK1, Berger SP, Mallat M, Frölich M, Dekker FW,
Rabelink TJ. Central Obesity Is an Independent Risk Factor for
Albuminuria in Nondiabetic South Asian Subjects. Diabetes Care
2007;30(7):1840–4.
Lin WY, Pi-Sunyer FX, Liu CS, Li CI, Davidson LE, Li TC, Lin CC.
Central Obesity and Albuminuria: Both Cross-Sectional and
Longitudinal Studies in Chinese. PLoS One 2012;7(12):e47960
Du N, Peng H, Chao X, Zhang Q, Tian H, Li H. Interaction of obesity
and central obesity on elevated urinary albumin-to-creatinine
ratio. PLoS One 2014;9(6):e98926.
Ahmadi SF, Zahmatkesh G, Ahmadi E, Streja E, Rhee CM, Gillen DL,
De Nicola L, Minutolo R, Ricardo AC, Kovesdy CP, Kalantar-Zadeh
K. Association of Body Mass Index with Clinical Outcomes in
Non-Dialysis-Dependent Chronic Kidney Disease: A Systematic
Review and Meta-Analysis. Cardiorenal Med 2015;6(1):37-49.
- 52 -
Lu JL, Kalantar-Zadeh K, Ma JZ, Quarles LD, Kovesdy CP. Association
of body mass index with outcomes in patients with CKD. J Am Soc
Nephrol 2014;25(9):2088-96.
Moon SJ, Kim TH, Yoon SY, Chung JH, Hwang HJ. Relationship
between Stage of Chronic Kidney Disease and Sarcopenia in
Korean Aged 40 Years and Older Using the Korea National Health
and Nutrition Examination Surveys (KNHANES IV-2, 3, and V-1, 2),
2008-2011. PLoS One 2015;10(6):e0130740.
Oh H, Quan SA, Jeong JY, Jang SN, Lee JE, Kim DH. Waist
Circumference, Not Body Mass Index, Is Associated with Renal
Function Decline in Korean Population: Hallym Aging Study. PLoS
One 2013;8(3):e59071.
Elsayed EF, Sarnak MJ, Tighiouart H, Griffith JL, Kurth T, Salem DN,
Levey AS, Weiner DE. Waist-to-Hip Ratio, Body Mass Index, and
Subsequent Kidney Disease and Death. Am J Kidney Dis. 2008
;52(1):29-38.
Afsar B, Elsurer R, Güner E, Kirkpantur A. Which Anthropometric
Parameter Is Best Related With Urinary Albumin Excretion and
Creatinine Clearance in Type 2 Diabetes: Body Mass Index, Waist
Circumference, Waist-to-Hip Ratio, or Conicity Index? J Ren Nutr
2011;21(6):472-8.
- 53 -
Okada R, Yasuda Y, Tsushita K, Wakai K, Hamajima N, Matsuo S. The
number of metabolic syndrome components is a good risk
indicator for both early- and late-stage kidney damage. Nutr
Metab Cardiovasc Dis 2014;24(3):277–85.
Perneger TV, Whelton PK, Puddey IB, Klag MJ. Risk of End-stage Renal
Disease Associated with Alcohol Consumption. Am J Epidemiol
1999;150(12):1275-81.
Silverwood RJ, Pierce M, Hardy R, Thomas C, Ferro C, Savage C,
Sattar N, Kuh D, Nitsch D. Early-Life Overweight Trajectory and
CKD in the 1946 British Birth Cohort Study. Am J Kidney Dis
2013;62(2):276-84.
- 54 -
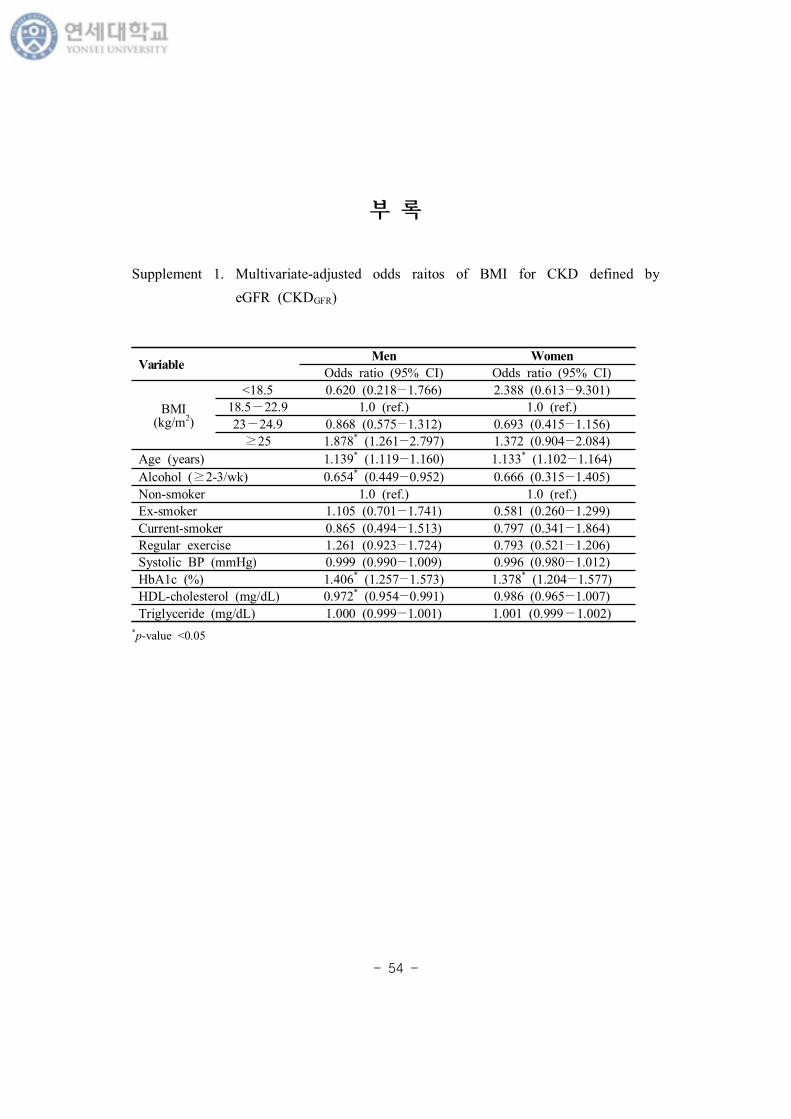
VariableMen Women
Odds ratio (95% CI) Odds ratio (95% CI)
BMI (kg/m2)
<18.5 0.620 (0.218−1.766) 2.388 (0.613−9.301)
18.5−22.9 1.0 (ref.) 1.0 (ref.)
23−24.9 0.868 (0.575−1.312) 0.693 (0.415−1.156)
≥25 1.878* (1.261−2.797) 1.372 (0.904−2.084)
Age (years) 1.139* (1.119−1.160) 1.133* (1.102−1.164)
Alcohol (≥2-3/wk) 0.654* (0.449−0.952) 0.666 (0.315−1.405)
Non-smoker 1.0 (ref.) 1.0 (ref.)
Ex-smoker 1.105 (0.701−1.741) 0.581 (0.260−1.299)
Current-smoker 0.865 (0.494−1.513) 0.797 (0.341−1.864)
Regular exercise 1.261 (0.923−1.724) 0.793 (0.521−1.206)
Systolic BP (mmHg) 0.999 (0.990−1.009) 0.996 (0.980−1.012)
HbA1c (%) 1.406* (1.257−1.573) 1.378* (1.204−1.577)
HDL-cholesterol (mg/dL) 0.972* (0.954−0.991) 0.986 (0.965−1.007)
Triglyceride (mg/dL) 1.000 (0.999−1.001) 1.001 (0.999−1.002)
부
Supplement 1. Multivariate-adjusted odds raitos of BMI for CKD defined by
eGFR (CKDGFR)
*p-value <0.05
- 55 -
VariableMen Women
Odds ratio (95% CI) Odds ratio (95% CI)
BMI (kg/m2)
<18.5 1.922 (0.862−4.285) 1.133 (0.632−2.033)
18.5−22.9 1.0 (ref.) 1.0 (ref.)
23−24.9 0.740* (0.551−0.994) 1.088 (0.815−1.453)
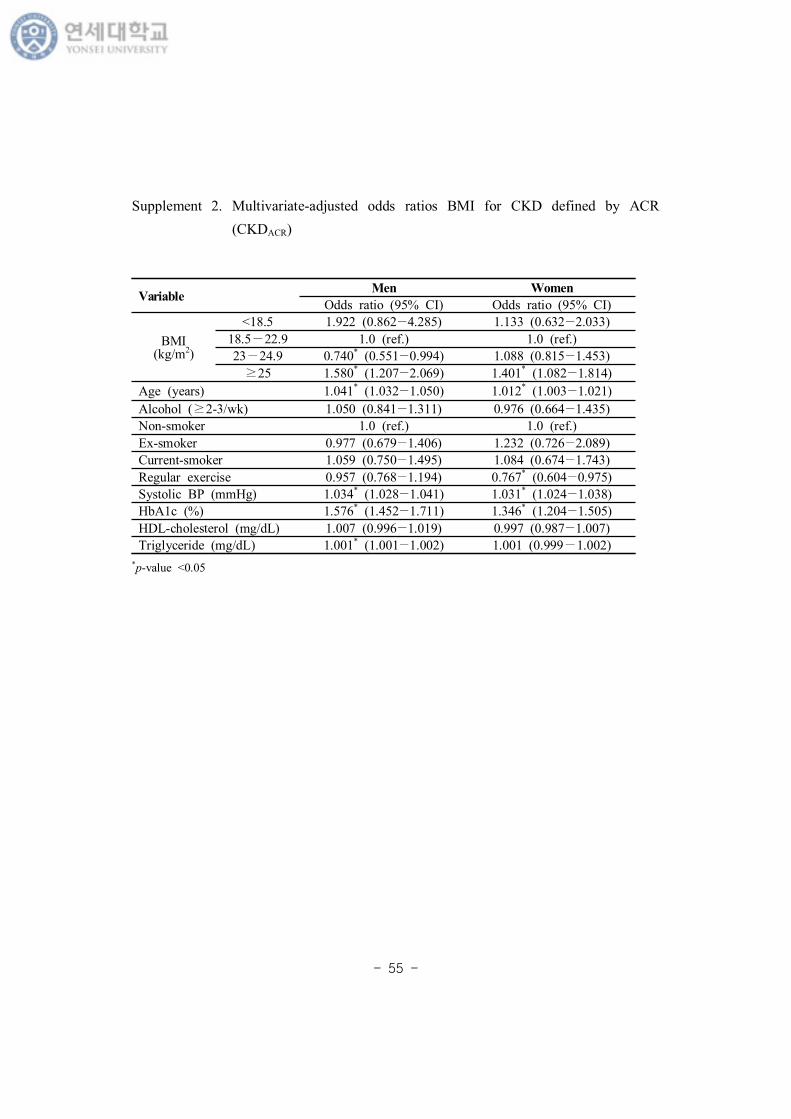
≥25 1.580* (1.207−2.069) 1.401* (1.082−1.814)
Age (years) 1.041* (1.032−1.050) 1.012* (1.003−1.021)
Alcohol (≥2-3/wk) 1.050 (0.841−1.311) 0.976 (0.664−1.435)
Non-smoker 1.0 (ref.) 1.0 (ref.)
Ex-smoker 0.977 (0.679−1.406) 1.232 (0.726−2.089)
Current-smoker 1.059 (0.750−1.495) 1.084 (0.674−1.743)
Regular exercise 0.957 (0.768−1.194) 0.767* (0.604−0.975)
Systolic BP (mmHg) 1.034* (1.028−1.041) 1.031* (1.024−1.038)
HbA1c (%) 1.576* (1.452−1.711) 1.346* (1.204−1.505)
HDL-cholesterol (mg/dL) 1.007 (0.996−1.019) 0.997 (0.987−1.007)
Triglyceride (mg/dL) 1.001* (1.001−1.002) 1.001 (0.999−1.002)
Supplement 2. Multivariate-adjusted odds ratios BMI for CKD defined by ACR
(CKDACR)
*p-value <0.05

- 56 -
VariableMen Women
Odds ratio (95% CI) Odds ratio (95% CI)
BMI (kg/m2)
<18.5 1.640 (0.759−3.544) 1.323 (0.763−2.294)
18.5-22.9 1.0 (ref.) 1.0 (ref.)
23-24.9 0.738* (0.569−0.957) 1.030 (0.785−1.351)
≥25 1.651* (1.289−2.115) 1.382* (1.088−1.754)
Age (years) 1.059* (1.050−1.069) 1.031* (1.022−1.040)
Alcohol (≥2-3/wk) 0.964 (0.786−1.183) 0.998 (0.694−1.435)
Non-smoker 1.0 (ref.) 1.0 (ref.)
Ex-smoker 0.997 (0.722−1.376) 1.166 (0.697−1.952)
Current-smoker 1.017 (0.740−1.399) 1.120 (0.713−1.759)
Regular exercise 0.986 (0.809−1.203) 0.773* (0.617−0.969)
Systolic BP (mmHg) 1.027* (1.021−1.033) 1.024* (1.018−1.031)
HbA1c (%) 1.549* (1.430−1.678) 1.326* (1.190−1.476)
HDL-cholesterol (mg/dL) 1.002 (0.992−1.013) 0.996 (0.986−1.005)
Triglyceride (mg/dL) 1.001* (1.001−1.002) 1.001 (0.999−1.002)
Supplement 3. Multivariate-adjusted odds ratios of BMI for CKD defined by
eGFR and ACR (CKDRisk)
*p-value <0.05
- 57 -
VariableMen Women
Odds ratio (95% CI) Odds ratio (95% CI)
Model 1
Waist circumference
(cm)
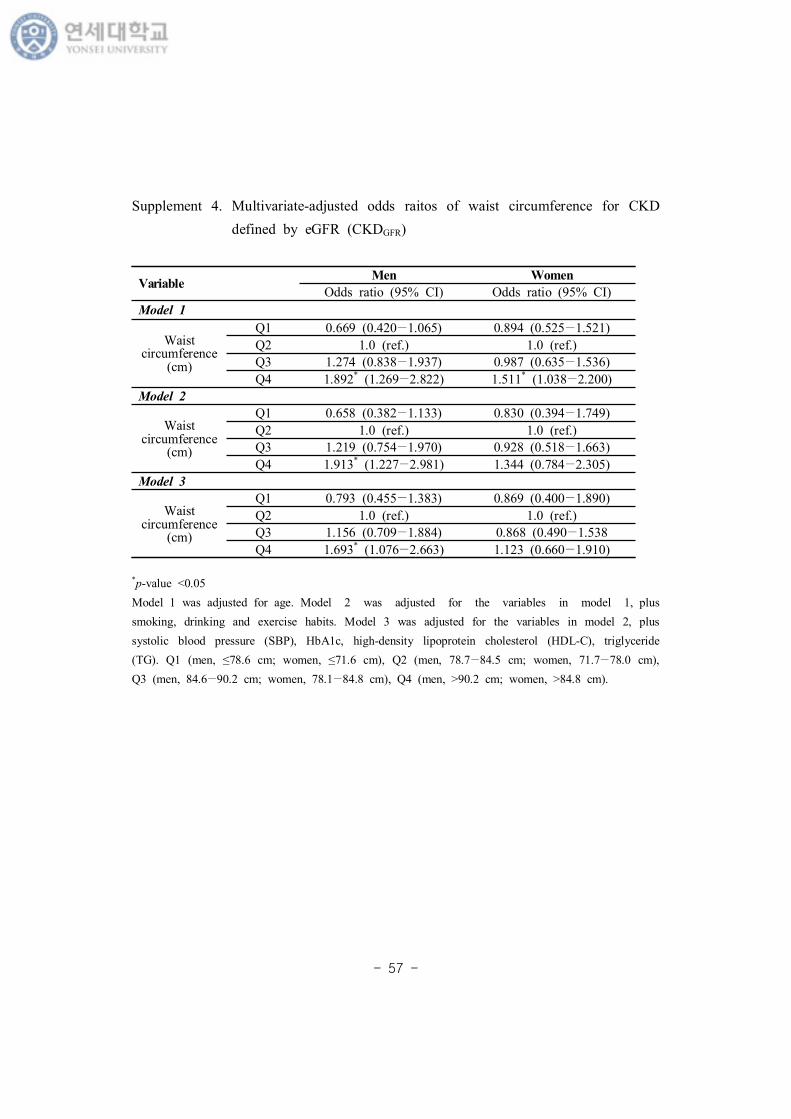
Q1 0.669 (0.420−1.065) 0.894 (0.525−1.521)
Q2 1.0 (ref.) 1.0 (ref.)
Q3 1.274 (0.838−1.937) 0.987 (0.635−1.536)
Q4 1.892* (1.269−2.822) 1.511* (1.038−2.200)
Model 2
Waist circumference
(cm)
Q1 0.658 (0.382−1.133) 0.830 (0.394−1.749)
Q2 1.0 (ref.) 1.0 (ref.)
Q3 1.219 (0.754−1.970) 0.928 (0.518−1.663)
Q4 1.913* (1.227−2.981) 1.344 (0.784−2.305)
Model 3
Waist circumference
(cm)
Q1 0.793 (0.455−1.383) 0.869 (0.400−1.890)
Q2 1.0 (ref.) 1.0 (ref.)
Q3 1.156 (0.709−1.884) 0.868 (0.490−1.538
Q4 1.693* (1.076−2.663) 1.123 (0.660−1.910)
Supplement 4. Multivariate-adjusted odds raitos of waist circumference for CKD
defined by eGFR (CKDGFR)
*p-value <0.05
Model 1 was adjusted for age. Model 2 was adjusted for the variables in model 1, plus
smoking, drinking and exercise habits. Model 3 was adjusted for the variables in model 2, plus
systolic blood pressure (SBP), HbA1c, high-density lipoprotein cholesterol (HDL-C), triglyceride
(TG). Q1 (men, ≤78.6 cm; women, ≤71.6 cm), Q2 (men, 78.7−84.5 cm; women, 71.7−78.0 cm),
Q3 (men, 84.6−90.2 cm; women, 78.1−84.8 cm), Q4 (men, >90.2 cm; women, >84.8 cm).
- 58 -
VariableMen Women
Odds ratio (95% CI) Odds ratio (95% CI)
Model 1
Waist circumference
(cm)
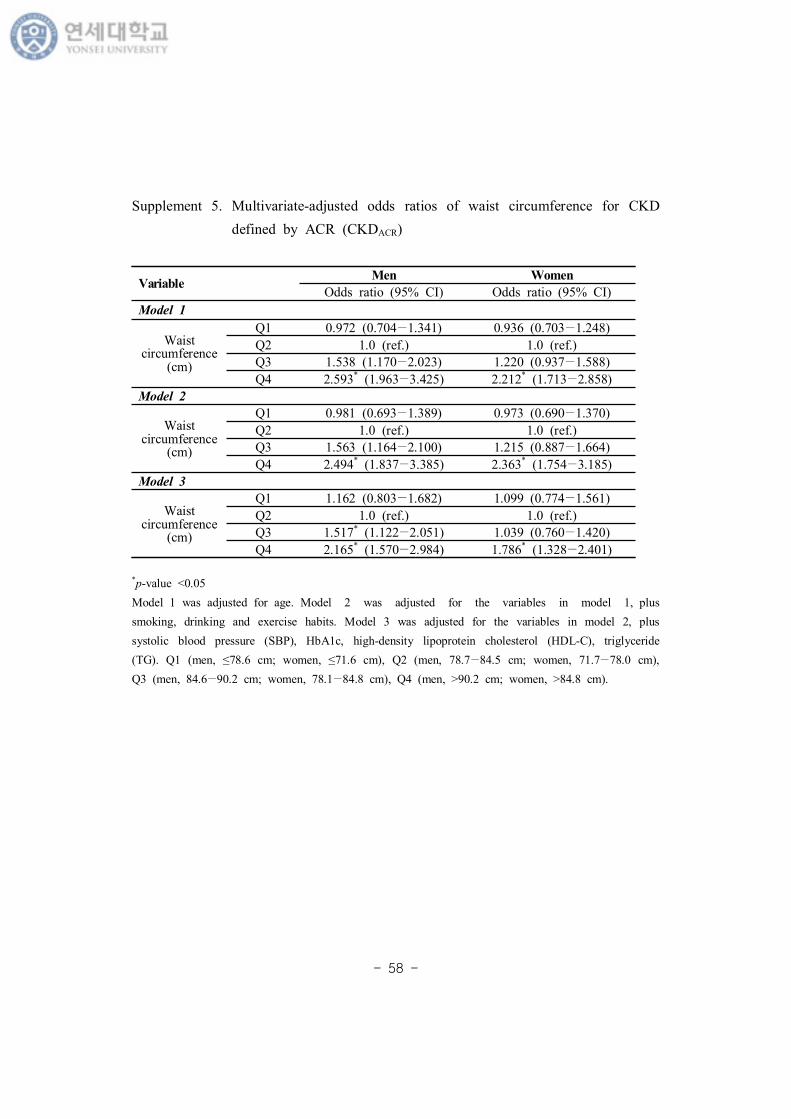
Q1 0.972 (0.704−1.341) 0.936 (0.703−1.248)
Q2 1.0 (ref.) 1.0 (ref.)
Q3 1.538 (1.170−2.023) 1.220 (0.937−1.588)
Q4 2.593* (1.963−3.425) 2.212* (1.713−2.858)
Model 2
Waist circumference
(cm)
Q1 0.981 (0.693−1.389) 0.973 (0.690−1.370)
Q2 1.0 (ref.) 1.0 (ref.)
Q3 1.563 (1.164−2.100) 1.215 (0.887−1.664)
Q4 2.494* (1.837−3.385) 2.363* (1.754−3.185)
Model 3
Waist circumference
(cm)
Q1 1.162 (0.803−1.682) 1.099 (0.774−1.561)
Q2 1.0 (ref.) 1.0 (ref.)
Q3 1.517* (1.122−2.051) 1.039 (0.760−1.420)
Q4 2.165* (1.570−2.984) 1.786* (1.328−2.401)
Supplement 5. Multivariate-adjusted odds ratios of waist circumference for CKD
defined by ACR (CKDACR)
*p-value <0.05
Model 1 was adjusted for age. Model 2 was adjusted for the variables in model 1, plus
smoking, drinking and exercise habits. Model 3 was adjusted for the variables in model 2, plus
systolic blood pressure (SBP), HbA1c, high-density lipoprotein cholesterol (HDL-C), triglyceride
(TG). Q1 (men, ≤78.6 cm; women, ≤71.6 cm), Q2 (men, 78.7−84.5 cm; women, 71.7−78.0 cm),
Q3 (men, 84.6−90.2 cm; women, 78.1−84.8 cm), Q4 (men, >90.2 cm; women, >84.8 cm).
- 59 -
VariableMen Women
Odds ratio (95% CI) Odds ratio (95% CI)
Model 1
Waist circumference
(cm)
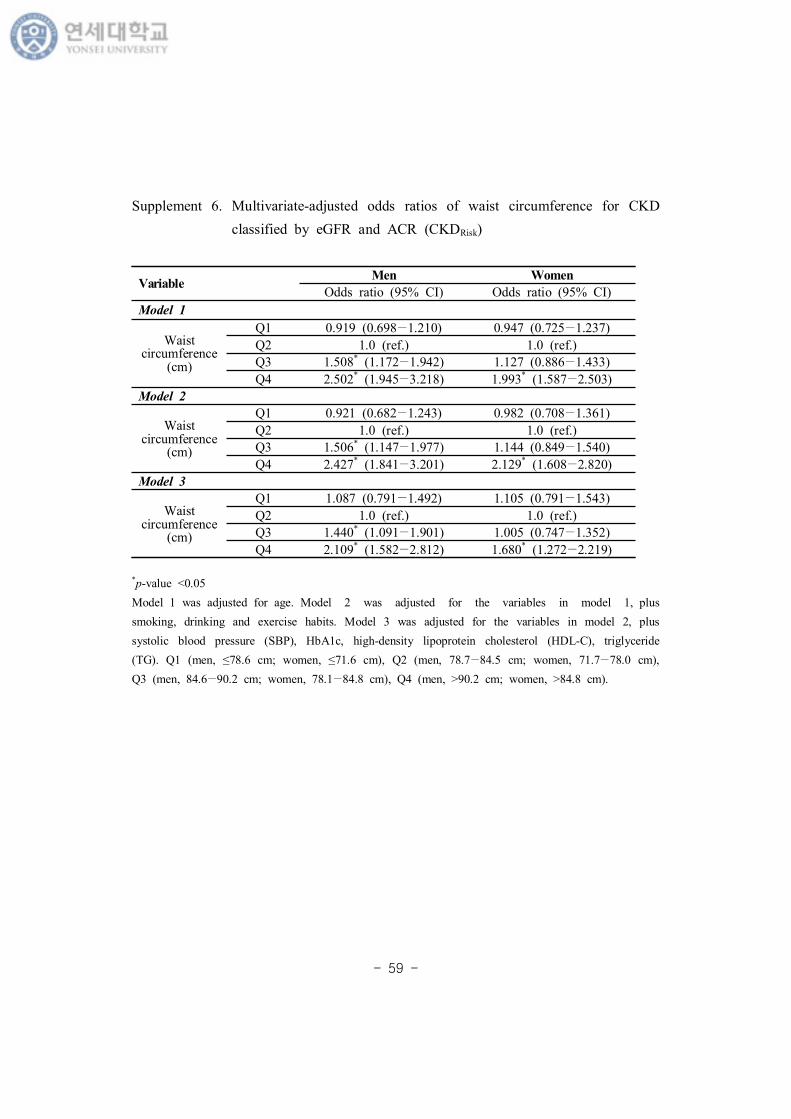
Q1 0.919 (0.698−1.210) 0.947 (0.725−1.237)
Q2 1.0 (ref.) 1.0 (ref.)
Q3 1.508* (1.172−1.942) 1.127 (0.886−1.433)
Q4 2.502* (1.945−3.218) 1.993* (1.587−2.503)
Model 2
Waist circumference
(cm)
Q1 0.921 (0.682−1.243) 0.982 (0.708−1.361)
Q2 1.0 (ref.) 1.0 (ref.)
Q3 1.506* (1.147−1.977) 1.144 (0.849−1.540)
Q4 2.427* (1.841−3.201) 2.129* (1.608−2.820)
Model 3
Waist circumference
(cm)
Q1 1.087 (0.791−1.492) 1.105 (0.791−1.543)
Q2 1.0 (ref.) 1.0 (ref.)
Q3 1.440* (1.091−1.901) 1.005 (0.747−1.352)
Q4 2.109* (1.582−2.812) 1.680* (1.272−2.219)
Supplement 6. Multivariate-adjusted odds ratios of waist circumference for CKD
classified by eGFR and ACR (CKDRisk)
*p-value <0.05
Model 1 was adjusted for age. Model 2 was adjusted for the variables in model 1, plus
smoking, drinking and exercise habits. Model 3 was adjusted for the variables in model 2, plus
systolic blood pressure (SBP), HbA1c, high-density lipoprotein cholesterol (HDL-C), triglyceride
(TG). Q1 (men, ≤78.6 cm; women, ≤71.6 cm), Q2 (men, 78.7−84.5 cm; women, 71.7−78.0 cm),
Q3 (men, 84.6−90.2 cm; women, 78.1−84.8 cm), Q4 (men, >90.2 cm; women, >84.8 cm).
- 60 -
Abstract
The association of obesity with chronic kidney
disease defined by glomerular filtration rate and
albuminuria in Korean adults
: The 5th (2011, 2012) and 6th (2013, 2014) Korea National
Health and Nutrition Examination Survey
Yoon Ji Kim
Graduate School of Public Health
Yonsei University
(Directed by Professor Sun Ha Jee, PhD)
Obejectives: The increasing rates of obesity and Chronic Kidney
Disease (CKD) have become a global public health burden. The 2012
KDIGO guidelines highlight the need to define CKD with cause,
glomerular filtration rate (GFR) category, and albuminuria category.
However, most studies that have examined the link between obesity
and CKD defined CKD with GFR or proteinuria. The aim of this study
was to examine the association between obesity and CKD defined with
GFR and albuminuria in Korean adults.
Methods: This study was based on the data obtained from 5th (2011,
- 61 -
2012) and 6th (2013, 2014) Korea National Health and Nutrition
Examination Survey (KNHANES). It is a nationwide cross-sectional
survey of nationally representative non-institutionalized civilians in the
Republic of Korea. A stratified, multistage probability sampling design
was used to select household units. Because KNHANES is a complex
sampling design, we used SAS SURVEY procedure for statistical
analysis.
CKD defined as estimated GFR (eGFR) <60 mL/min/1.73m2 was
designated as CKDGFR, while CKD defined as ACR ≥30 mg/g was
designated as CKDACR. Moderate to very high risk groups in the
classification of CKD prognosis were presented as CKDRisk. Multivariate
logistic regression analysis was used to estimate the odds of BMI for
CKD.
Results: We analyzed 19,331 participants over the age of 19 years
(8,709 males, 10,622 females), excluding the pregnant and persons with
a history of cancer, advanced liver disease or history of liver
cirrhosis, and missing essential data.
The prevalences of CKDGFR, CKDACR, and CKDRisk were 2.2%, 6.7%, and
8.1%, respectively. Men with BMI ≥25 kg/m2 had 1.88 times greater
risk of CKDGFR than normal BMI group in multivariate adjusted model
(95% CI, 1.261-2.797; p = 0.002). In women, BMI was not associated
with CKDGFR in adjusted model. Obese men had 1.65 times greater risk
of CKDRisk than those with normal weight (95% CI, 1.289-2.115; p
<0.001), and obese women was 1.38 times greater risk of CKDRisk than
- 62 -
those with normal weight (95% CI, 1.088-1.754; p = 0.008). While, the
odds ratio for CKDRisk among men with overweight was 0.74 times less
than those with normal weight (95% CI, 0.569-0.957; p = 0.022).
Conclusions: Our study found that obesity was significantly associated
with an increased risk of CKD, defined by eGFR and ACR. But when
CKD was only defined by eGFR, obesity as a CKD risk factor could be
overlooked in women. Future longitudinal studies and experimental
research investigating the role of overweight and obesity in CKD
progression will be beneficial.
Key words: obesity, chronic kidney disease, glomerular filtration rate,
albuminuria


![Intradialytic hypotension [투석 중 저혈압]](https://img.pdfslide.tips/doc/110x75/559b14a31a28ab7c308b4573/intradialytic-hypotension--559c08e7a3733.jpg)