Embed Size (px)
Citation preview
PR
IFY
SG
OL
BA
NG
OR
/ B
AN
GO
R U
NIV
ER
SIT
Y
Early stimulation and nutrition
Attanasio, Orazio; Baker-Henningham, Helen; Bernal, Raquel; Meghir, Costas;Pineda, Diana; Rubio-Codina, Marta
NBER Working Paper Series
DOI:10.3386/w25059
Published: 17/09/2018
Peer reviewed version
Cyswllt i'r cyhoeddiad / Link to publication
Dyfyniad o'r fersiwn a gyhoeddwyd / Citation for published version (APA):Attanasio, O., Baker-Henningham, H., Bernal, R., Meghir, C., Pineda, D., & Rubio-Codina, M.(2018). Early stimulation and nutrition: The impacts of a scalable intervention. NBER WorkingPaper Series. https://doi.org/10.3386/w25059
Hawliau Cyffredinol / General rightsCopyright and moral rights for the publications made accessible in the public portal are retained by the authors and/orother copyright owners and it is a condition of accessing publications that users recognise and abide by the legalrequirements associated with these rights.
• Users may download and print one copy of any publication from the public portal for the purpose of privatestudy or research. • You may not further distribute the material or use it for any profit-making activity or commercial gain • You may freely distribute the URL identifying the publication in the public portal ?
Take down policyIf you believe that this document breaches copyright please contact us providing details, and we will remove access tothe work immediately and investigate your claim.
01. Apr. 2020

1
Early Stimulation: The Impacts of a Scalable Intervention§
Orazio Attanasio (University College in London, IFS & NBER)
Helen Baker-Henningham (Bangor University and University of the West Indies)
Raquel Bernal (Universidad de Los Andes)
Costas Meghir (Yale, NBER and IFS)
Diana Pineda (Fundación Éxito)
Marta Rubio-Codina (IADB)
18/07/2018
Abstract
In this paper, we evaluate the effects of the implementation of a structured early stimulation
curriculum and a nutritional intervention through public parenting support services for
vulnerable families living in rural areas of Colombia (known as FAMI), on children’s development
and parental behaviors. We use a clustered randomized controlled trial that assigns 87 towns to
treatment and control, to evaluate the effects of these interventions on children growth and
development. 1,460 children younger than 1 year of age were assessed at baseline. The
interventions were also complemented with training, supervision and coaching of FAMI program
facilitators. We assessed program effects on children’s nutritional status, and on cognitive and
socioemotional development; as well as on parental practices. The interventions had positive and
significant effects on the Bayley-III cognitive scale (0.15 SD), receptive language (0.11 SD),
expressive language (0.14 SD) and gross motor scales (0.14 SD). We also report a reduction in the
risk of stunting of -0.13 SDs. We do not find any effects on socio-emotional development. We
report positive and statistically significant effects on the number of toy materials at home (0.36
SD), the number of varieties of play materials (0.28 SD), and the number of varieties of play
activities with adults at home over the past three days (0.17 SD).
________________________________________________
§ This study was funded by Grand Challenges Canada Grant 0462-03-10 and by Fundacion Exito. Orazio Attanasio was partly funded by ERC Advanced Grant AdG – 695300. Costas Meghir was partly funded by the NIH grant R01HD7210, the Cowles Foundation and ISPS at Yale. This trial is registered at the ISRCTN Registry, trial number ISRCTN93757590. The Universidad de los Andes ethics committee (No. 287/2014) and the University College London research ethics committee (No 2168/011) approved this study. We would like to the Instituto Colombiano de Bienestar Familiar (ICBF), ICBF program supervisors in Cundinamarca, Santander and Boyacá and program coordinators at Fundación Éxito for their cooperation in facilitating the intervention; the FAMI program providers, children and families who willingly participated in this study; all the study staff including our nine tutors and María Lucía Gómez our field manager; all the research staff including Santiago Lacouture, Alejandro Sánchez and Sara Ramírez; the data collection team from IQuartil; and the experts from Grand Challenges Canada.

2
1. Introduction
Human capital underpins basic outcomes in the life of individuals, including career,
marriage and even intergenerational outcomes. However, the process of human capital
development is particularly problematic amongst deprived populations: individuals from low
income environments typically underachieve in education and in their subsequent careers, are
more prone to ill health and have shorter life spans and are more often involved in crime (Britto
et al., 2017; Black et al., 2017). These issues are particularly salient in developing countries, both
because poor individuals there are more vulnerable and more likely to be exposed to many
negative shocks and because delays in the process of human development may cause important
delays in the process of economic growth and development.
It is now widely understood that the process of human capital development starts very
early in the life cycle and that the first few years are crucially important (Cunha, Heckman,
Lochner & Masterov, 2006; Engle et al., 2007; Heckman, 2006; Yoshikawa et al., 2013). At the
same, here is mounting evidence that the early years, being extremely malleable are also
salient for policy, as sensible interventions can achieve important goals and promote human
development in important domains at different ages.
Over the last couple of decades, the scientific evidence on the determinants of early child
development (ECD), the types of interventions that improve it and the populations that most
benefit from them, has advanced significantly (Britto et al., 2017; Black et al., 2017). And yet,
scalable policies that will prevent the effects of poverty on human development have proved
elusive, in part because often they do not address the central issue, namely that deficits
accumulate very early on and may be hard to reverse, and in part because much of the evidence
is based on small closely supervised trials. The effectiveness of scalable interventions that can
be deployed given the available financial and human resources and can form the basis of policy
is not well explored. Even in developed countries, such as the US, where there is evidence on
the effectiveness of early years intensive interventions in generating long term impacts, such as
the Perry Pre School Program and the Abecedarian program, the evidence on programs at scale,
such as Head Start, is more limited and controversial (see, for instance, the recent papers by
Bitler et al. (2014), Carneiro and Ginja (2014) and Kline and Walters (2016) as well as earlier
papers such as Currie and Duncan (1995)). Similarly, while the evidence on the long run impacts
from a small and intensive trial in Jamaica is very strong (see, for instance, Walker, 2005, 2006,
2011), evidence on scalable versions of similar interventions is limited (see, for instance,
Attanasio et al., 2014, Andrew et al, 2018).
In this paper, we address the question of whether it is possible to improve the
development of children in poor communities by providing structured parent support and early
stimulation as well as nutritional supplementation in the context of a pre-existing parenting
support program. Our starting point are existing studies (that we cite) that show how intensive
ECD interventions delivered through home visits can have large and long-lasting effects on
human capital development. Specifically, we designed, implemented and tested by a cluster

3
randomized controlled trial (RCT) a low-cost intervention designed to improve the quality of
early childhood care and stimulation, as well as nutrition. The fact that we use the infrastructure
of a pre-existing intervention and that we worked closely with the government institution
running it, implies that our program can, almost by construction, be scaled up easily. The main
question we are asking is whether offering access to high quality early stimulation and nutrition
in poor environments through a scalable intervention can improve child human capital and
ultimately mitigate the effects of poverty.
In addition to provide estimates of the average impact of the scalable intervention we
study on several outcomes, we also study how the impact differed across subgroups of the
population and therefore, implicitly, identify the distributional effects of the program. Finally,
we present some suggestive evidence of the mechanisms through which the intervention
achieves the impacts we estimate performing a mediation analysis. The latter is important not
only from an academic point of view, but also from a policy perspective as it points out to the
channel that future programs and interventions might want to target.
As well as emphasizing the central role that early stimulation can have in child
development, our paper also has direct implications for the importance of safety net programs,
such as Food Stamps in the US (see Hoynes et al., 2016) for child outcomes. These programs
can improve nutrition for children by providing more resources to parents. Our paper shows
that providing such nutritional supplementation directly can improve children outcomes as
parents do not crowd out the additional resources received by the household.
Our intervention was introduced within the structure of an existing government
parenting program in Colombia and was targeted to deprived communities. In this sense, our
analysis does not estimate the impact of the intervention relative to no intervention. Rather,
like in Kline and Walters (2016) that stress that the impact of Head Start is estimated relative to
other child care alternatives, in our context, we measure the impact of improving the
functioning of an existing program by changing its content and quality. Within this context, we
improve quality in specific ways; we consider a number of outcomes, such as cognitive
development, language and height of children and associated mechanisms through which they
are achieved, including changes in parental behavior.
The Family, Women and Infancy Program (FAMI, for its acronym in Spanish) was first
established in 1991 in Colombia. It aims at improving pre-and postnatal services for vulnerable
pregnant women and their new-born children up to age two. It is delivered through weekly
group meetings and one monthly home visit. However, the program operational guidelines are
very vague and the actual content being delivered heavily relies on the initiative of the local
women running it, known as FAMI mothers. Effectively, the guidelines provide little structure
or guidance to the FAMI mothers on how to offer effective and high quality parenting support
and early stimulation. One of the key research questions is precisely whether a structured
curriculum provides the basis for high quality ECD services in this environment, where low-
skilled providers have little training and knowledge about ECD.
4
Our work is informed by earlier studies of ECD interventions using structured curricula in
developing countries, such as the well-known Jamaica home visiting intervention currently
known as Reach Up and Learn (Grantham-McGregor and Smith, 2016; Grantham-McGregor and
Walker, 2015). Studies of these interventions have shown the potential for dramatically
changing the trajectory of human capital development for children in highly deprived
environments (see, for example Grantham McGregor et al., 1991; Walker et al., 2005 & 2006
and the 22-year follow-up of the same experiment in Walker et al., 2011 and Gertler et al.,
2014). Attanasio et al. (2014, 2018) implemented a similar home visiting program in Colombia
using the Reach-Up curriculum suitably adapted to the context. Whilst the intervention was
implemented at a larger scale (in number of children and number of municipalities) than the
original Jamaican study, both these trials were tightly controlled and supervised by the research
teams and, what is more important, they were based on weekly one-hour one-to-one home
sessions, which may limit their scalability. Similarly, Yousafzai et al (2014) evaluate the
integration of an early stimulation intervention into a community-based health service in
Pakistan in 80 catchment areas in four districts. The authors use the Care for Development
(UNICEF) curriculum and rely on Reach Up materials and play activities. After allocating the four
areas randomly to a treatment, they report positive effects on cognitive and socio-emotional
development.
We use a curriculum inspired in Reach Up and Learn -with extensive adaptation- for use
in an existing public parenting support program targeted to poor families, which is mainly
delivered in weekly group sessions. Similar structured curricula have been successfully
implemented in diverse settings such as Jamaica, Bangladesh and Colombia, India, Pakistan and
Peru (see Grantham-McGregor and Smith, 2016; Grantham-McGregor and Walker, 2015 and
Yousafzai, 2014), mostly using individual home visits. We thus assess the feasibility, impact and
efficiency of enhancing the quality of an already existing parenting program at scale. Ours is
one of the few trials to assess the feasibility and impact of a new intervention grafted on an
existing delivery platform. Many countries offer parenting services with reasonable enrolment
rates but are of poor quality. The question addressed in this paper is whether it is possible to
effectively improve existing programs at scale and obtain positive impacts on children.
Moreover, ours is one of the first studies of group visits, which is important at several levels.
The program under study is run by women in the communities (known as FAMI mothers)
that we trained and coached throughout. The fact that the individuals running the program are
members of the community is another important aspect of this research. The success of
programs that aim at changing individual behaviour, without necessarily providing program
beneficiaries additional resource is likely to depend on community ownership and participation.
Lastly, while the emphasis is on promoting early development and stimulation through group
sessions, the intervention also has a nutritional component and it also includes a home visiting
component, as we describe in more detail below. The former can provide some important
synergies to the operation of the program and provide an incentive to participation. The latter
complements in a novel way group visits with a more personalized intervention.

5
The program was randomized across 87 towns in three of Colombia’s 32 departments
and lasted for an average of 10.4 months. We focus both on outcomes reflecting child
development and on how parental investments in their children change as a result of the
intervention. The intervention had positive and significant effects on overall child development
as measured by the Bayley Scales of Infant and Toddler Development (0.15 SD, p-value=0.048).
Importantly, we also report a reduction in the risk of stunting, as measured by the fraction of
children whose height for age is below -1 SD (-0.11 SD, p-value=0.098). We also find that the
impacts are considerably larger for the poorest set of beneficiaries. This evidence is consistent
with the findings on other programs, such as those on Head Start in the US, reported by Bitler
et al (2014).
How the intervention changes parental behaviour is important both for the long run
sustainability of the program and to start understanding the channels through which the
intervention yields the estimated impacts. We show that there was a large positive effect on
the quality of the learning environment at home (0.34 SD, p-value=0.000), which indicates that
parents are reinforcing the intervention with their own investments. A simple mediation
analysis seems to indicate that a large fraction of the program’s impact is indeed explained by
the change in parental behavior and investment.
These results indicate that an intervention like the one we study is extremely promising.
It provides a deliverable and scalable project whose cost, as we show below, compares
favorably with the cost of alternative models that have been implemented by the Colombian
government at the national level. Furthermore, as it uses the infrastructure of an existing
program, it can be deployed at scale with the existing human resources. The impacts achieved
are remarkable especially if one considers that most children only attended a limited number
of sessions. This last aspect relates to the fact that we studied a program as it would deployed
at scale, with possible limitations to its implementation. Such a model might provide a blueprint
both in terms of the content of the intervention and its success in changing parental investment
and in terms of the implementation and scalability of such programs.
The rest of the paper is organized as follows. The next section describes the Colombian
context in terms of ECD policy and the intervention we assess. Section 3 discusses the
evaluation design and provides basic descriptive statistics. In Section 4, we present the
empirical strategy and the main evaluation results. Finally, Section 5 concludes and discusses
policy implications.
2. Background and intervention
In this section, we describe the details of the pre-existing program on which our
intervention operated and of the intervention itself.
6
2.1 Description of the existing parent support program
The FAMI program, run by the Colombian Family Welfare Agency (ICBF for its acronym in
Spanish),1 is aimed at supporting families during pregnancy, childbirth and early childhood with
nutrition, health monitoring and childrearing. Beneficiaries are identified by their score in
SISBEN, Colombia’s proxy means test for the targeting of most social policies and based on
household socio-economic characteristics. For the child stimulation component, which is our
focus, the program is delivered through weekly group sessions of about two hours each, and
one monthly home visit that lasts about an hour for parents of children 0-24 months of age. The
program also delivers a nutritional supplement that corresponds to 22%-27% of the (monthly)
recommended nutritional intake. The size of each FAMI unit varies between 12 and 15
beneficiaries. Of these, approximately 75% are parents of children 0-24 months of age and 25%
are pregnant women.
The program is delivered by women in the community with a high school degree but no
specific training on ECD, necessarily. More importantly, there is no national guideline for the
content (i.e. curriculum) to be delivered during the group sessions or home visits, other than
some general operational guidelines and broad learning standards.2 The average cost of FAMI
program delivery is 310 US dollars (USD) per child per year (Bernal, 2013).
2.2 Description of the intervention
The enhancement to the existing FAMI program that we assess aims at improving its
quality in a scalable fashion. The main idea is to introduce a structured curriculum,
implementable at scale, that offers precise guidelines to the facilitators who, at the beginning
of the intervention, receive specific training on its delivery. The program consists of four
complementary elements: (i) a structured early stimulation curriculum to improve child
development; (ii) pedagogical materials to facilitate the delivery of the curriculum; (iii) itinerant
training, supervision, and coaching for FAMI program facilitators; and (iv) a nutritional
supplement that is larger and of better quality than the one that had been typically received by
FAMI participants, along with nutrition education during group sessions and home visits, and
other materials such as recipe books and cards with age appropriate nutrition messages.
The proposed curriculum is based on Reach Up and Learn, although it required extensive
adjustment since the FAMI program is mostly delivered through group meetings and Reach Up
and Learn was designed for home visit delivery. For example, the adapted curriculum includes
several new components such as group discussions, additional language activities, activities for
children aged birth-6 months, and cards with nutrition information. It aims to support mothers
to provide developmentally appropriate activities for their children (in particular, activities that
promote language, cognitive and motor development), as well as reinforcing maternal
1 The ICBF is a governmental agency that runs most government programs targeted to children in Colombia. 2 This applies to all public ECD services in the country. The Board for Early Childhood has emphasized the principle of curricular freedom, and national standards are intentionally broad. Program providers are expected to adapt the learning standards to their own programs.
7
knowledge about feeding and nutrition. The activities designed for the curriculum include 24
home visiting sessions and 20 group meeting sessions for children 6 months-2 years of age, and
four additional group sessions for babies under 5 months of age. It is important to stress that the
curriculum was designed to be delivered by facilitators without specific nor specialized
knowledge of child development. For this reason, it is quite prescriptive.
Although most of the program content was delivered through the weekly group sessions,
the monthly home visits provided an opportunity to better tailor the activity to the
developmental level of the child, and to introduce other, more difficult activities to handle in
groups, additional language activities, and specific ideas on how to use daily home activities (care
routines and household chores) to promote child development. The curriculum involved
materials to be used during home visits and group meetings, including age-appropriate books,
puzzles, home-made toys, pictures, construction blocks and nutrition cards. The cost of these
materials was of about USD 27 (at the 2015-16 exchange rate) per child per year. The program
also included sessions to teach mothers how to elaborate home-made toys with recyclable
materials that could be used to practice the activities proposed by the curriculum with children
at home. This way, most mothers were able to set up a toy library for home use.
A team of nine tutors, with college degrees in psychology and social work, trained and
supervised by the research team, trained the FAMI mothers in the intervention before it started.
They also coached them continuously throughout its entire duration by means of on-the-job
observations and feedback sessions provided, which took place approximately every 6 weeks.
Finally, the intervention also included a nutritional component, delivering a monthly
nutritional supplement to FAMI participants. The nutritional supplement provided 35% of daily
calorie intake requirements and 54% of daily protein intake requirements for pregnant women,
breastfeeding mothers and children younger than 2 years of age each month. Its composition
directly aimed at improving the height for age indicator, given the provision of high protein
content, as well as, fats, vitamins and minerals. The cost of the package and delivery was USD 26
per month.3
The hypothesis that we test is whether these enhancements to the FAMI program had
positive effects on children’s development and maternal knowledge, maternal self-efficacy, and
parental investments in children (or the quality of the home environment). Whether it did or not
depends both on the design and the delivery of the program but also on how parents react to it.
Specifically, the parents may crowd in resources and time if the program turns what used to be
inaccessible goals for their children into realistic targets. On the other hand, they could
redistribute resources amongst household members, leading to crowding out of household effort
and resources by the program. Our data design will only estimate the overall effect. Appendix 1
provides greater detail on the curriculum, the intervention and its practical implementation.
3 The nutritional component was designed in collaboration with Fundación Éxito (FE). FE’s main strategy, known as Gen Cero, is aimed at reducing the prevalence of stunting (13%) and risk of stunting, i.e., height for age between -2 and -1 SD (30%), among children younger than five.

8
3. Sampling design, descriptive statistics and implementation
The study took place between September 2014 and July 2016. The intervention itself was
intended to operate for 15 months between the end of 2014 and March 2016. In practice, total
duration varied mainly to accommodate the initial training, lasting 45 weeks on average with a
range of 34-58 weeks.
The study towns were located in three departments in central Colombia (Cundinamarca,
Boyacá, and Santander). They were all chosen to have (i) less than 40,000 inhabitants, to avoid
large urban centers; (ii) at least two FAMI units;4 and (iii) no more than one unit of another public
parenting program called Modalidad Familiar (MF), launched nationally in 2014.5 Out of a
population of 135 such towns we randomly drew 49 for the treatment group and 47 for the
control. We further assigned the remaining 39 towns of our universe to a randomly ordered
waiting list. When we realized that some towns had made the complete transition to the new MF
program we dropped these towns and drew from this waiting list (whether in treatment or
control). We could successfully replace 10 of the 19 towns that no longer ran the FAMI program.
That yielded a final sample of 87 towns, with 46 in the treatment group and 41 in the control
group.6 Each town had an average of four FAMI units in the final sample. In particular, 171 FAMI
units received the treatment while 169 FAMI units remained as control. Appendix 3 includes a
flow chart showing how the final study towns were selected.7
In each FAMI unit, we sampled all participant children 0-12 months of age at baseline
leading to a sample of N=1,460 children. Each town had an average of 17 children in the targeted
age group. Overall, a total of 702 children in 171 FAMI units in 46 towns received the treatment;
and there were 758 children in 169 FAMI units in 41 towns in the control group, which continued
to receive the FAMI program as usual. The actual number of children per FAMI varied from one
to 11 with a mean of 4.3 and SD of 1.9. The number of FAMIs per town in our final sample ranged
from one to 13 with a mean of 3.9 and SD 2.3. At follow-up, we tried to reach all children,
4 This requirement is associated with the power calculations for the trial, and to facilitate the logistics associated with training and coaching by tutors who had to travel across various towns. 5 The MF is a public parenting program that was introduced during the first half of 2014. MF is similar to FAMI in that it serves beneficiaries through one monthly home visit and one weekly group meeting but: (1) it serves children 0-5 years of age while FAMI units serve children aged 0-2; (2) it has infrastructure for group meetings while FAMI uses other community spaces or the FAMI’s own home; (3) serves, on average, 45 beneficiaries as compared to 15 in FAMI; (4) is led by a professional and an assistant, as compared to a single person who is not required to have a college degree in FAMI; (5) offers a nutritional supplement that is five times bigger than in FAMI; and (6) has access to a group of professionals including a psychologist and a nutritionist who support MF activities. The presence of MF is balanced between control and treatment samples, so that our RCT estimates the effect of enhancing the FAMI in the presence of some MF. In our sample only 7% of the children leave a FAMI to join the MF. 6 The Figure in Appendix 2 shows the final distribution of treatment and control towns in the sample. 7 Power calculations assumed program effects of 0.25 of a SD relative to the control on the Bayley, obtained using 4
FAMI units per town and 4 children aged 0-12 months of age per FAMI. We assumed an inter-class correlation between towns of 0.04 (in the Bayley-III scale), as reported by Attanasio et al. (2014) for a similar study in Colombia that was implemented in towns with similar characteristics and targeted to the same population. This sample provided 95% power at the 5% significance level, allowing for an attrition rate of 10%.

9
regardless of whether they were still attending a FAMI or not, and regardless of the length of
their exposure to FAMI.
3.1 Data and child developmental measures
We measure different developmental domains using several tests that have been used
extensively in evaluations of early care or education and/or have been recommended for
developing countries (Fernald et al., 2017). Details are provided in Appendix 4. Most of the
instruments were available in Spanish, or had been previously translated; and many had been
used in Colombia before amongst similar populations. Our experimental design defined a number
of primary outcomes. These include measures of nutritional status—namely, externally
standardized Z-scores following World Health Organization (WHO) standards (WHO Multicentre
Growth Reference Study Group, 2006, 2007); cognitive, language and motor development,
measured by the Bayley Scales of Infant and Toddler Development, third edition (Bayley, 2006)
and socio-emotional development, as measured by the Ages and Stages Questionnaire: Socio-
Emotional (ASQ:SE) (Squires, Bricker, and Twombly, 2009a). Height and weight were collected in
both rounds, whereas developmental measures were only collected at follow up. Further details
on these measures are provided in Appendix 4.
We always report age-standardized scores to deal with differences in scores across ages.
For the analysis, we use internally age-standardized scores, where raw scores were standardized
using the sample mean and SD calculated from weighted local smoothing regressions. Using
internally standardized scores also allows us to examine each scale separately. We also
constructed a total Bayley score by factor analyzing the internally age-standardized scores of the
five scales. To describe the study population in a more general context, we report the
composite—or externally standardized—score. These scores are obtained following the norms
provided in the test manual, which use as a reference a population of US children8 and hence
might not be appropriate for Colombia.
We also collected detailed socio-economic information, including maternal vocabulary
scores –a proxy for maternal IQ– measured by the Spanish version of the Peabody Picture
Vocabulary (PPVT or TVIP, Padilla, Lugo & Dunn, 1986) and a number of other variables that speak
to the mechanisms underlying the effects.9 Specifically, we consider the quality of the home
environment, maternal self-efficacy, maternal knowledge on child development, and food
insecurity. We will discuss these in the empirical results section.
Finally, background information on FAMI mothers was collected directly from them in
both rounds. In addition to basic sociodemographic characteristics, we also collected verbal
ability and knowledge on child development using the same tests as for mothers.
8 The externally standardized scores have mean 100 and SD 15 in the reference population. 9 Child assessments and anthropometric measures were collected by testers with degrees in psychology and health
respectively, and the rest of the household survey variables were collected by interviewers. The household survey was collected prior to the child assessments.

10
3.2 Descriptive statistics
Table 1 shows some baseline characteristics by treatment status. At baseline, children
were, on average, 5.6 months of age and in about 27% of the cases the father was absent from
their household. Households had two children, on average; maternal average schooling was 8.6
years; and 23% of mothers were teenagers. In 2010, the teenage pregnancy rate was 21%
nationwide and 30% for young girls living in households in the poorest income quintile.
Table 1. Sociodemographic characteristics of children and families at baseline by randomization status
Treatment Control p-value RW
Sociodemographic characteristics
Child's age in months 5.72 5.51 0.353 0.976 (3.39) (3.26) Child's birth weight (gr) 3189 3156 0.442 0.981 (572) (500) Maternal age (number of years) 26.16 26.47 0.421 0.981 (6.84) (6.70) Maternal years of schooling 8.85 8.41 0.121 0.751 (3.42) (3.31) Household Income (COP thousands) 526.1 477.2 0.232 0.930 (388.1) (340.7) Household size 4.08 4.10 0.931 0.990 (1.47) (1.43) Maternal PPVT (raw score) 22.32 19.76 0.037** 0.379 (8.53) (8.08) Child's gender (% male) 51.9 50.9 0.729 0.990 First born (%) 46.6 45.1 0.648 0.990 Teenage mothers (%) 25.4 20.9 0.059* 0.567 Father present (%) 69.7 75.1 0.035** 0.379 Owns home (%) 37.1 39.6 0.623 0.990 Household in poverty (%) a 58.7 64 0.298 0.950
Intermediate outcomes
FCI Home Environment Quality b -0.03 0.03 0.625 0.866 (0.96) (1.02) Parental knowledge c 29.26 29.49 0.680 0.944 (3.61) (3.44) Maternal self-efficacy 26.50 26.49 0.974 0.977 (5.51) (4.67) Food insecurity (%) 50.4 41.9 0.222 0.520
No. of observations 700 756
Note: ***p<0.01; **p<0.05; *p<0.1. Standard deviations in parentheses. RW: p-values adjusted for multiple testing using the Romano-Wolf step-down method. a % of households with total income below the poverty line in 2014 (USD 50 person/month). b First Principal Component of age-standardized FCI subscales. c Only available at follow-up (raw scores presented).
Average household income was COP 501 thousand per month (US 178) which represents
81% of the legal monthly minimum wage in 2014. Close to 70% of these households had
answered the SISBEN survey for screening of social program eligibility—a good proxy for
poverty—and 96% of those surveyed were deemed eligible for social programs (i.e., they scored
in SISBEN levels 1 and 2). Similarly, 62% of households in the sample had a total income below
11
the poverty line adjusted for household size. In 2014, the poverty rate was 42% in semi-urban
and rural areas of Colombia.
In terms of the home learning environment, on average, these households owned 2.6
books, magazines or newspapers, 1.4 different varieties of play materials for young children in
the household, and the adults report to have engaged in 2.5 different types of play activities with
young children over the past 3 days10. Finally, close to 45% of households in the sample report to
be food insecure. According to data available in the National Nutritional Status Survey (ENSIN for
its acronym in Spanish, 2010), 42% of Colombian households reported to be food insecure by the
same measure.
Comparing baseline characteristics, we find some statistically significant differences: the
proportion of fathers living with the child is larger in the control group (75% vs. 70%) and
maternal verbal raw scores by PPVT are higher in the treatment group (22.32 vs. 19.76 score
points). On the other hand, stunting is lower in the treatment group than in the control group at
baseline (9% vs. 14%) and the difference is statistically significant at 7.5%. However, once we
adjust for multiple hypothesis testing using the Romano and Wolf (2015) step-down procedure
none of these differences are significant.
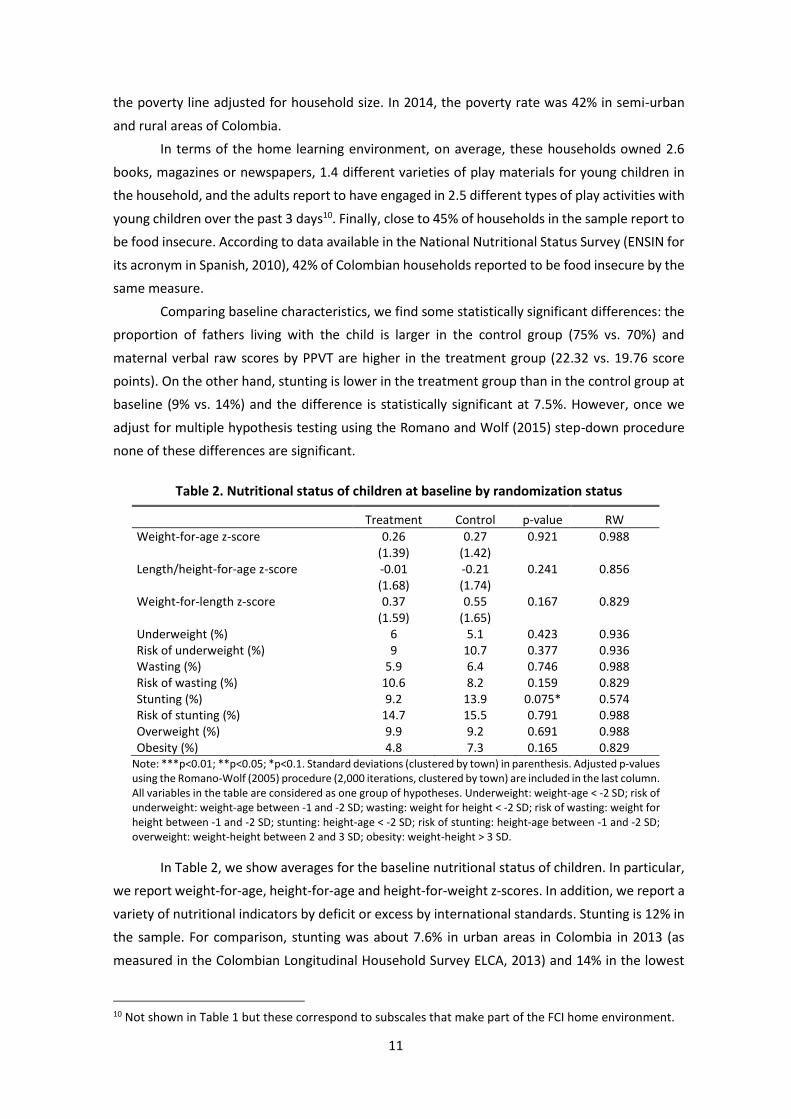
Table 2. Nutritional status of children at baseline by randomization status
Treatment Control p-value RW
Weight-for-age z-score 0.26 0.27 0.921 0.988 (1.39) (1.42) Length/height-for-age z-score -0.01 -0.21 0.241 0.856 (1.68) (1.74) Weight-for-length z-score 0.37 0.55 0.167 0.829 (1.59) (1.65) Underweight (%) 6 5.1 0.423 0.936 Risk of underweight (%) 9 10.7 0.377 0.936 Wasting (%) 5.9 6.4 0.746 0.988 Risk of wasting (%) 10.6 8.2 0.159 0.829 Stunting (%) 9.2 13.9 0.075* 0.574 Risk of stunting (%) 14.7 15.5 0.791 0.988 Overweight (%) 9.9 9.2 0.691 0.988 Obesity (%) 4.8 7.3 0.165 0.829
Note: ***p<0.01; **p<0.05; *p<0.1. Standard deviations (clustered by town) in parenthesis. Adjusted p-values using the Romano-Wolf (2005) procedure (2,000 iterations, clustered by town) are included in the last column. All variables in the table are considered as one group of hypotheses. Underweight: weight-age < -2 SD; risk of underweight: weight-age between -1 and -2 SD; wasting: weight for height < -2 SD; risk of wasting: weight for height between -1 and -2 SD; stunting: height-age < -2 SD; risk of stunting: height-age between -1 and -2 SD; overweight: weight-height between 2 and 3 SD; obesity: weight-height > 3 SD.
In Table 2, we show averages for the baseline nutritional status of children. In particular,
we report weight-for-age, height-for-age and height-for-weight z-scores. In addition, we report a
variety of nutritional indicators by deficit or excess by international standards. Stunting is 12% in
the sample. For comparison, stunting was about 7.6% in urban areas in Colombia in 2013 (as
measured in the Colombian Longitudinal Household Survey ELCA, 2013) and 14% in the lowest
10 Not shown in Table 1 but these correspond to subscales that make part of the FCI home environment.

12
urban socio-economic groups (SES). Bernal et al. (2017) assessed the effects of another ECD
national program using a sample of comparable children in urban areas of Colombia. In their
sample, height for age is -1.03 SD compared with -0.11 SD in our sample, and stunting was 17%
compared with 12% in our sample.
The Table also shows that an additional 15% of children are at risk of stunting, i.e.,
children whose height-for-age is below -1 SD. These results indicate that children in this sample
were not as developmentally vulnerable in terms of nutritional status as we would have expected
for regions and households with considerable levels of poverty. This will be important in the
interpretation of our results. In addition to nutritional status, we would want to characterize the
status of this population in terms of cognitive and socio-emotional outcomes. Unfortunately,
these variables were not measured at baseline, partly because the age of the children makes
some of these measurements difficult to obtain and because of funding limitations. Therefore, in
Table 3, we report some statistics on cognitive, language and socio-emotional skills measured at
follow up, at ages 17 to 33 months, in the control group to characterize the population.
As for the Bayley-III composite scores, we see that the average is 0.6 SD below the
population reference mean in both the cognition and language sales, and 0.4 SD below in the
motor scale. We also observe that 18% of children score between -1 and -2 SD with respect to
the population of reference in cognition, 23% in the case of language and 15% for motor
development. Only about 2-3% would be considered at risk of developmental delay given that
their composite scores are below -2SD.
Table 3. Developmental outcomes of children in the control group at follow-up
Mean N
Bayley III
Cognitive Composite Score 91.98
(13.07) 703
Language Composite Score 91.59
(12.31) 702
Motor Composite Score 93.97
(12.58) 701
ASQ:SE
% of children at socio-emotional risk 0.23 705 Note: ***p<0.01; **p<0.05; *p<0.1. Standard errors clustered by town in parenthesis Bayley III composites computed based on external standardization provided by test developers, the fraction of children at socioemotional risk by ASQ is computed using the thresholds provided by the test developers (Squires et al., 2009b).
For comparison, children between 18 and 36 months of age in Bogotá (Colombia’s
capital) residing in households close to the mean of the income distribution, scored 0.08 SD below
the reference population in cognition, 0.1 SD below in language and 0.06 SD above in motor
development (Rubio-Codina et al., 2015). These results indicate that the children in our sample
are significantly worse in these three dimensions when compared to children in better

13
socioeconomic conditions. Instead, they are similar to children in samples of comparable
socioeconomic conditions.
In terms of socio-emotional development, 23% of the children are at risk of
developmental delay according to thresholds defined by the ASQ:SE using the test norming
sample. For comparison, we know from the ELCA (2013) that 22% of children in low SES urban
households were at risk of developmental delay by the same measure, 26% in high SES urban
households and 19% in rural households in 2013.
Finally, in Appendix 5 we present basic characteristics of FAMI mothers by study group. On
average, they are 42 years of age, have completed 13 years of education, and they have almost
12 years of work experience in the FAMI program. They have an average of 2.5 children of their
own. There are no jointly significant differences between FAMI mothers in treatment and control
towns.
3.3 Implementation and Compliance
During the period considered in the study, a family could have attended a total of 44 weekly
group sessions and received 11 monthly home visits (if age-eligible throughout the period). In
terms of effective attendance, 74% of all children in the treatment group assessed at follow-up
participated in at least one FAMI activity during the intervention, while the rest did not attend at
all; all children were however followed up for data collection, irrespective of their attendance
status.11 In Appendix 6 (Figures a. and b.), we show the distribution of children in the intervention
group by the duration of exposure to the program. Conditional on having attended at least one
session, the median number of pedagogical activities attended was 28 out of a total of 55.
Children with lower program attendance are older, less likely to live with their fathers, and have
younger mothers. On the other hand, they also exhibit better learning environments at home.
The curriculum we introduced was intended to add both structure and content to the child
sessions, progressing in difficulty as the child ages. In the control group, the FAMI mothers were
not constrained or directed in how they should run the sessions. The FAMI mothers in the
treatment group found the intervention to be substantially different to what was going on in the
status quo: 57% report to have found the curriculum very different from their usual practice and
25% found it different. In particular, the issues that seem to be different with respect to how they
had typically worked were: (i) practicing play activities with mothers and their children, (ii)
practicing language activities with babies, (iii) making homemade toys with mothers, (iv)
encouraging parents to play with their children at home, and (v) listening to parents about their
achievements at home. Almost all of them (99%) reported that they would continue to use the
proposed curriculum after the end of the project.
11 This information is available from attendance lists that FAMI providers collected as part of the supervision protocol of this intervention. Thus, the data is only available for participants in the treatment group.
14
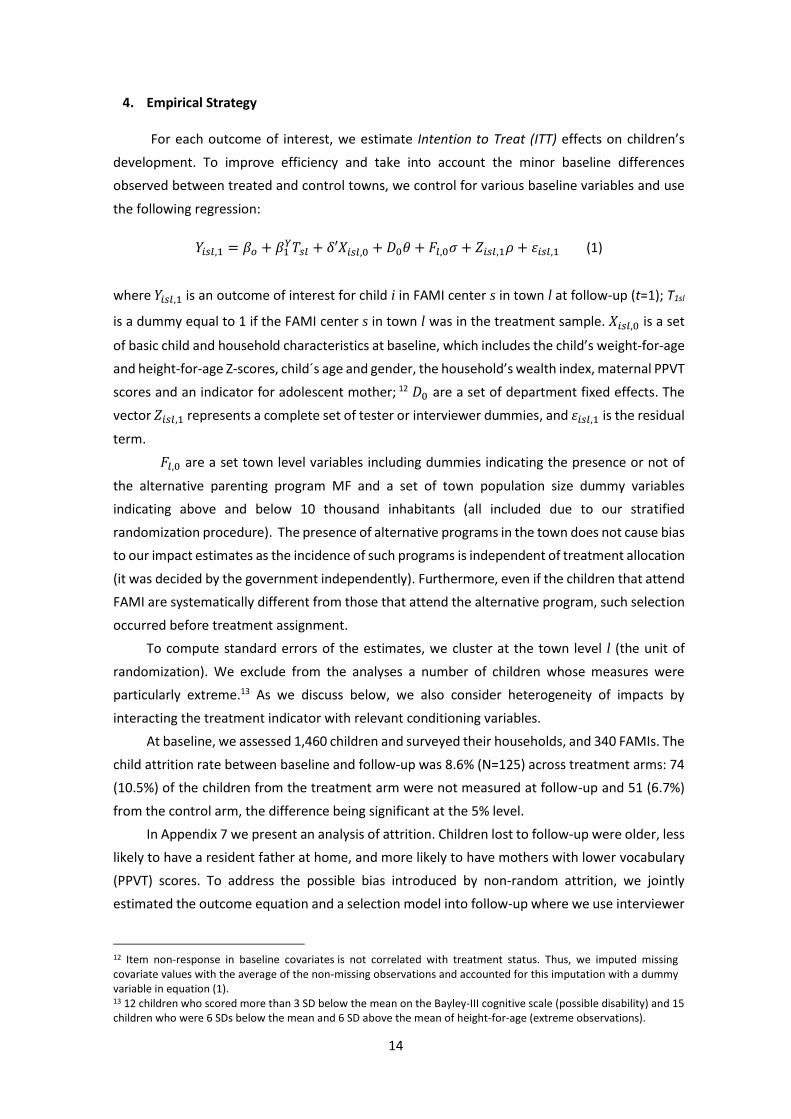
4. Empirical Strategy
For each outcome of interest, we estimate Intention to Treat (ITT) effects on children’s
development. To improve efficiency and take into account the minor baseline differences
observed between treated and control towns, we control for various baseline variables and use
the following regression:
𝑌𝑖𝑠𝑙,1 = 𝛽𝑜 + 𝛽1𝑌𝑇𝑠𝑙 + 𝛿′𝑋𝑖𝑠𝑙,0 + 𝐷0𝜃 + 𝐹𝑙,0𝜎 + 𝑍𝑖𝑠𝑙,1𝜌 + 휀𝑖𝑠𝑙,1 (1)
where 𝑌𝑖𝑠𝑙,1 is an outcome of interest for child i in FAMI center s in town l at follow-up (t=1); T1sl
is a dummy equal to 1 if the FAMI center s in town l was in the treatment sample. 𝑋𝑖𝑠𝑙,0 is a set
of basic child and household characteristics at baseline, which includes the child’s weight-for-age
and height-for-age Z-scores, child´s age and gender, the household’s wealth index, maternal PPVT
scores and an indicator for adolescent mother; 12 𝐷0 are a set of department fixed effects. The
vector 𝑍𝑖𝑠𝑙,1 represents a complete set of tester or interviewer dummies, and 휀𝑖𝑠𝑙,1 is the residual
term.
𝐹𝑙,0 are a set town level variables including dummies indicating the presence or not of
the alternative parenting program MF and a set of town population size dummy variables
indicating above and below 10 thousand inhabitants (all included due to our stratified
randomization procedure). The presence of alternative programs in the town does not cause bias
to our impact estimates as the incidence of such programs is independent of treatment allocation
(it was decided by the government independently). Furthermore, even if the children that attend
FAMI are systematically different from those that attend the alternative program, such selection
occurred before treatment assignment.
To compute standard errors of the estimates, we cluster at the town level l (the unit of
randomization). We exclude from the analyses a number of children whose measures were
particularly extreme.13 As we discuss below, we also consider heterogeneity of impacts by
interacting the treatment indicator with relevant conditioning variables.
At baseline, we assessed 1,460 children and surveyed their households, and 340 FAMIs. The
child attrition rate between baseline and follow-up was 8.6% (N=125) across treatment arms: 74
(10.5%) of the children from the treatment arm were not measured at follow-up and 51 (6.7%)
from the control arm, the difference being significant at the 5% level.
In Appendix 7 we present an analysis of attrition. Children lost to follow-up were older, less
likely to have a resident father at home, and more likely to have mothers with lower vocabulary
(PPVT) scores. To address the possible bias introduced by non-random attrition, we jointly
estimated the outcome equation and a selection model into follow-up where we use interviewer
12 Item non-response in baseline covariates is not correlated with treatment status. Thus, we imputed missing covariate values with the average of the non-missing observations and accounted for this imputation with a dummy variable in equation (1). 13 12 children who scored more than 3 SD below the mean on the Bayley-III cognitive scale (possible disability) and 15 children who were 6 SDs below the mean and 6 SD above the mean of height-for-age (extreme observations).

15
dummies at baseline and interviewers assigned to the household at follow-up as exclusion
restrictions. The identity of the interviews (and presumably their quality) were a good predictor
of attrition and, as they were allocated randomly across towns, they constitute a valid
instrument. As it turns out, the estimates, reported in Appendix 8, are not sensitive to this
correction: attrition does not bias the results. We therefore report estimates that do not correct
for attrition in the main text.
We also use the same specification of equation (1) to assess whether the intervention had
positive effects on intermediate outcomes. All these instruments were also measured at baseline,
so we can control for baseline outcomes in all cases.
In addition to the average impacts, we also analyse the possibility of heterogeneous
impacts. We do this in two ways. First, we consider the entire distribution of the outcomes of
interest in treatment and control sample and test for differences in this distribution using the
Anderson-Darling statistics (Anderson and Darling, 1952). Such a test is considered more
powerful to detect differences in the tails of the distribution than the Kolmogorov-Smirnoff test
(Engmann and Cousineau, 2011). Second, we re-estimate equation (1) for subgroups in the
evaluation sample. In particular, we divide the sample by wealth, as measured by a wealth index,
mother’s education and gender.
Finally, having studied the impacts on certain ‘final’ outcomes and a number of plausible
intermediate outcomes, we perform a mediation analysis similar to Heckman, Pinto and Savalyev
(2013). In particular, we consider a simple model of mediation that relates the outcome of
interest, 𝑌𝑖𝑠𝑙, to an intermediate outcome, 𝐼𝑖𝑠𝑙, in a linear fashion:
𝑌𝑖𝑠𝑙 = 𝛼 + 𝛾𝐼𝑖𝑠𝑙 + 𝑢𝑖𝑠𝑙 (2)
where 𝑢𝑖𝑠𝑙 is a residual term which is crucially assumed to be independent of 𝐼𝑖𝑠𝑙. As we
discussed above, given the random nature of the trial, one can easily estimate the impact of the
intervention on 𝑌𝑖𝑠𝑙 and 𝐼𝑖𝑠𝑙 using regression (1), which we reproduce here omitting some of the
control variables for simplicity:
𝑊𝑖𝑠𝑙 = 𝛽0𝑊 + 𝛽1
𝑊𝑇𝑠𝑙 + 휀𝑊𝑖𝑠𝑙; where 𝑊 = 𝑌, 𝐼; (3)
where 𝑇𝑠𝑙 is equal to 1 if FAMI s in town l is assigned to the treatment sample and 0 otherwise.
We now augment equation (3) for 𝑌𝑖𝑠𝑙 in the following fashion:
𝑌𝑖𝑠𝑙 = 𝛽0𝑌 + �̃�1
𝑌𝑇𝑠𝑙 + 𝛾𝐼𝑖𝑠𝑙 + 휀𝑌𝑖𝑠𝑙; (4)
We can then test the hypothesis that the observed impact in 𝑌𝑖𝑠𝑙 is generated by a change
in 𝐼𝑖𝑠𝑙, by comparing the estimates of �̃�1𝑌 in equation (4) and 𝛽1
𝑌 in equation (3): if the former is
smaller (in absolute value) than the latter, it is an indication that part of the intervention impact
on 𝑌𝑖𝑠𝑙 is generated by the impact on 𝐼𝑖𝑠𝑙. Of course, this procedure assumes the linearity of the
relationship between 𝐼𝑖𝑠𝑙 and 𝑌𝑖𝑠𝑙 and the fact that 𝐼𝑖𝑠𝑙 is exogenous relative to 𝑌𝑖𝑠𝑙.

16
5. Results
For most outcomes, we measure impacts in terms of standard deviations of the variable of
interest in the control group. We also include the 95% confidence interval, the standard p-value
for two-tailed null hypotheses and the Romano-Wolf stepdown p-values adjusted for multiple
hypotheses testing for the specific groups of hypotheses presented in each table.14
5.1 Main Outcomes
In Table 4, we report average effects by intent to treat, regardless of whether children
actually attended the program or how many times they attended, i.e., OLS estimates of equation
(1). The measures we use are the total Bayley-III factor for a summary measure of development,
the ASQ:SE for socio-emotional outcomes and the height-for-age Z-score for nutritional status.
Table 4. Impact on children’s outcomes
VARIABLE Beta (95% CI) P Value RW P Value
Total Bayley (Factor of Z-Scales) 0.152 0.016** 0.048**
(0.030,0.274)
ASQ:SE Total Score (Z) 0.060 0.355 0.346
(-0.067,0.187)
Height for age Z-Score 0.093 0.190 0.330
(-0.045,0.230) Note: ***p<0.01; **p<0.05; *p<0.1; 95% confidence interval in parenthesis for two-tailed tests. Standard errors clustered by town; D = beta /SD (Controls). P values are computed using Romano-Wolf (2005) step-down procedure. We consider 3 hypotheses for children outcomes. Covariates included: gender, household wealth index, maternal PPVT score, teenage mother and BL weight-for-age and height-for-age Z-scores. Total Bayley is the principal factor of the age-standardized Bayley III scales. ASQ:SE total score is the age-standardized ASQ:SE score
The effect of the program on total Bayley-III scores was 0.152 SD and it is statistically
significant at the 5%, even after adjusting for multiple hypotheses testing. We find no significant
impact of the program on socio-emotional development or height-for-age Z-scores. The
intervention thus eliminated 25% of the deficit in the treatment population with respect to the
reference population (the US). This is all the more remarkable if we take into account that the
intervention lasted on average no more than 45 weeks and the attendance rate was quite low
(just 75% attended any sessions). It also compares very favorably to the results obtained in
Attanasio et al. (2014), which was a one-on-one home visiting program that lasted for 18 months
– nearly 75% longer.
We can address the effect of non-compliance by an instrumental variables procedure,
which in this case (where non-compliance is one sided) provides us with the effect of treatment
on the treated. Specifically, we divide the ITT parameter by the effective participation rate in the
intervention. There are many different ways of thinking of the intensity of the program: if we
measure effective participation as the fraction of children who attended at least one pedagogical
activity, which is 77.5%, then the TOT on Bayley is 0.20 SD. If, instead, we measure effective
14 The Romano Wolf procedure was performed using 2,500 iterations and clustering by town.
17
participation as the fraction of children in the treatment group who attended at least the
unconditional median number of sessions (i.e., 21 out of 55 total), which is 53.2%, the TOT on
Bayley is 0.29 SD. Finally, if we define effective participation as the fraction of children who
attended the median number of pedagogical activities conditional on having attended at least
one (i.e., 28 sessions), which is 38.6%, then the TOT effect is 0.39 SD.15 Thus, the potential effects
are much larger than the estimated effects, even for such a short intervention, delivered in
groups. To increase compliance, however, remains an important challenge. We need to
understand to what extent parents perceive the return from the program in terms of child
development and whether the relatively low participation rates reflect low expected returns.
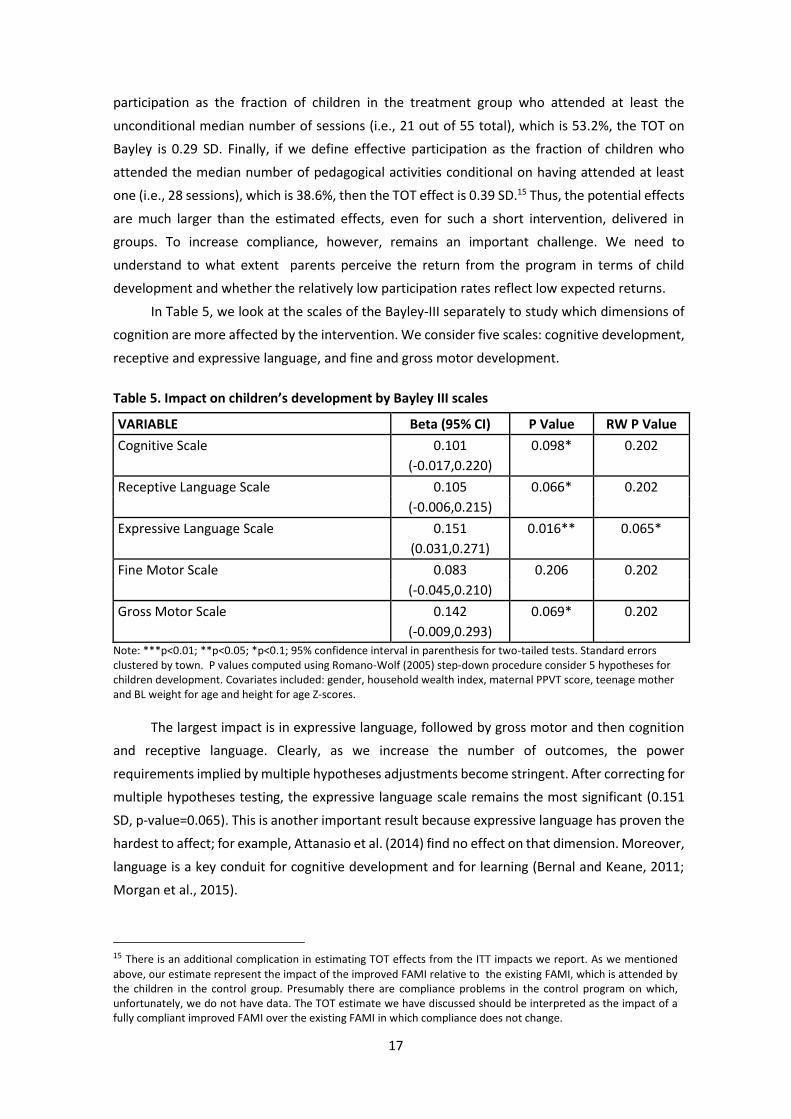
In Table 5, we look at the scales of the Bayley-III separately to study which dimensions of
cognition are more affected by the intervention. We consider five scales: cognitive development,
receptive and expressive language, and fine and gross motor development.
Table 5. Impact on children’s development by Bayley III scales
VARIABLE Beta (95% CI) P Value RW P Value
Cognitive Scale 0.101 0.098* 0.202
(-0.017,0.220)
Receptive Language Scale 0.105 0.066* 0.202
(-0.006,0.215)
Expressive Language Scale 0.151 0.016** 0.065*
(0.031,0.271)
Fine Motor Scale 0.083 0.206 0.202
(-0.045,0.210)
Gross Motor Scale 0.142 0.069* 0.202
(-0.009,0.293) Note: ***p<0.01; **p<0.05; *p<0.1; 95% confidence interval in parenthesis for two-tailed tests. Standard errors clustered by town. P values computed using Romano-Wolf (2005) step-down procedure consider 5 hypotheses for children development. Covariates included: gender, household wealth index, maternal PPVT score, teenage mother and BL weight for age and height for age Z-scores.
The largest impact is in expressive language, followed by gross motor and then cognition
and receptive language. Clearly, as we increase the number of outcomes, the power
requirements implied by multiple hypotheses adjustments become stringent. After correcting for
multiple hypotheses testing, the expressive language scale remains the most significant (0.151
SD, p-value=0.065). This is another important result because expressive language has proven the
hardest to affect; for example, Attanasio et al. (2014) find no effect on that dimension. Moreover,
language is a key conduit for cognitive development and for learning (Bernal and Keane, 2011;
Morgan et al., 2015).
15 There is an additional complication in estimating TOT effects from the ITT impacts we report. As we mentioned
above, our estimate represent the impact of the improved FAMI relative to the existing FAMI, which is attended by the children in the control group. Presumably there are compliance problems in the control program on which, unfortunately, we do not have data. The TOT estimate we have discussed should be interpreted as the impact of a fully compliant improved FAMI over the existing FAMI in which compliance does not change.

18
Figure 2. Distribution of conditional outcomes by treatment status
Note: Plot of the distribution of the residuals resulting from a regression of outcomes on observed characteristics described in equation (1), for the treatment and the control samples separately.
19
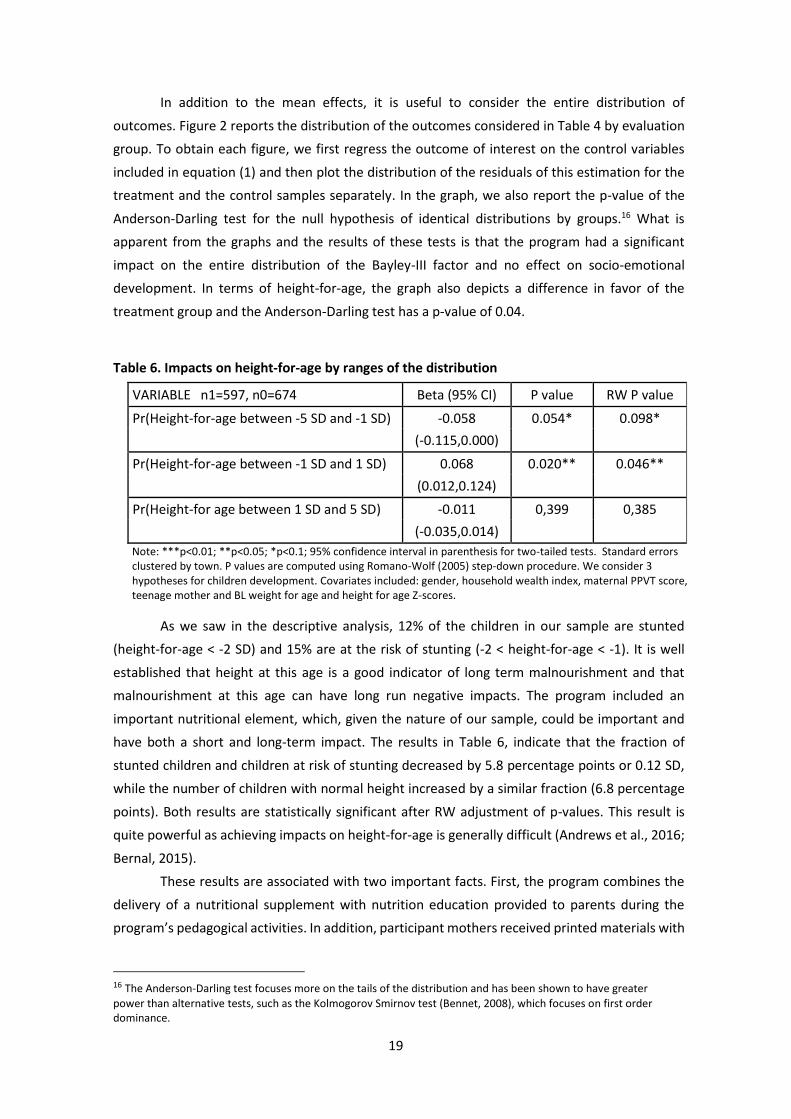
In addition to the mean effects, it is useful to consider the entire distribution of
outcomes. Figure 2 reports the distribution of the outcomes considered in Table 4 by evaluation
group. To obtain each figure, we first regress the outcome of interest on the control variables
included in equation (1) and then plot the distribution of the residuals of this estimation for the
treatment and the control samples separately. In the graph, we also report the p-value of the
Anderson-Darling test for the null hypothesis of identical distributions by groups.16 What is
apparent from the graphs and the results of these tests is that the program had a significant
impact on the entire distribution of the Bayley-III factor and no effect on socio-emotional
development. In terms of height-for-age, the graph also depicts a difference in favor of the
treatment group and the Anderson-Darling test has a p-value of 0.04.
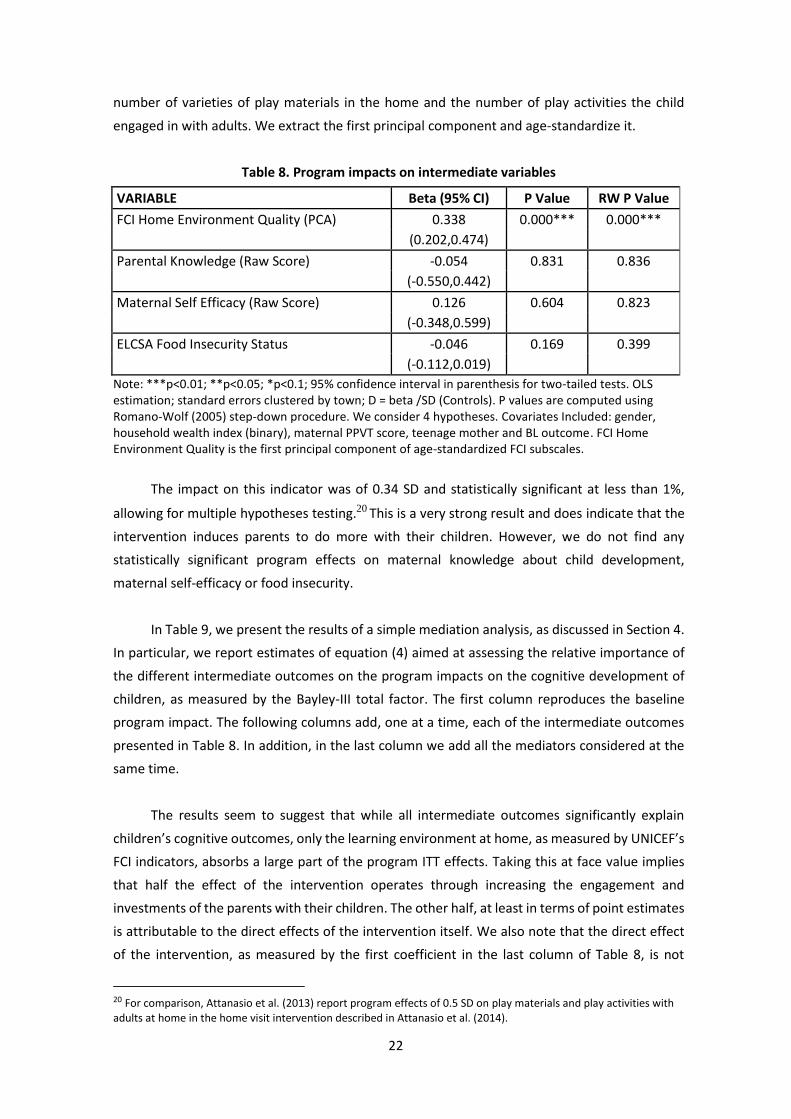
Table 6. Impacts on height-for-age by ranges of the distribution
VARIABLE n1=597, n0=674 Beta (95% CI) P value RW P value
Pr(Height-for-age between -5 SD and -1 SD) -0.058 0.054* 0.098*
(-0.115,0.000)
Pr(Height-for-age between -1 SD and 1 SD) 0.068 0.020** 0.046**
(0.012,0.124)
Pr(Height-for age between 1 SD and 5 SD) -0.011 0,399 0,385
(-0.035,0.014) Note: ***p<0.01; **p<0.05; *p<0.1; 95% confidence interval in parenthesis for two-tailed tests. Standard errors clustered by town. P values are computed using Romano-Wolf (2005) step-down procedure. We consider 3 hypotheses for children development. Covariates included: gender, household wealth index, maternal PPVT score, teenage mother and BL weight for age and height for age Z-scores.
As we saw in the descriptive analysis, 12% of the children in our sample are stunted
(height-for-age < -2 SD) and 15% are at the risk of stunting (-2 < height-for-age < -1). It is well
established that height at this age is a good indicator of long term malnourishment and that
malnourishment at this age can have long run negative impacts. The program included an
important nutritional element, which, given the nature of our sample, could be important and
have both a short and long-term impact. The results in Table 6, indicate that the fraction of
stunted children and children at risk of stunting decreased by 5.8 percentage points or 0.12 SD,
while the number of children with normal height increased by a similar fraction (6.8 percentage
points). Both results are statistically significant after RW adjustment of p-values. This result is
quite powerful as achieving impacts on height-for-age is generally difficult (Andrews et al., 2016;
Bernal, 2015).
These results are associated with two important facts. First, the program combines the
delivery of a nutritional supplement with nutrition education provided to parents during the
program’s pedagogical activities. In addition, participant mothers received printed materials with
16 The Anderson-Darling test focuses more on the tails of the distribution and has been shown to have greater
power than alternative tests, such as the Kolmogorov Smirnov test (Bennet, 2008), which focuses on first order dominance.

20
information regarding good nutritional practices at home, and recipe books specially designed
for children in this age range. Second, the program is delivered during the first thousand days of
life, which is a period of rapid growth and development. The nutritional supplement was
specifically designed to take this fact into consideration. Finally, the results indicate that the
nutritional supplementation was actually used by the parents for the subject children, at least to
a reasonable extent. The typical concern with such programs is that they crowd out parental
inputs (Jacoby, 2002). However, this result is a strong indication that the crowding out is at most
partial and that a substantial part of the supplement “sticks” with the children.
5.2. Heterogeneous impacts
The intervention we are studying had clear impacts on the population in question.
However, it is important to understand whether and how the effects differ across groups. This
can help us understand whether the intervention helps the most vulnerable and from a policy
perspective it helps improve targeting. We investigate whether the effects of the intervention on
children’s development vary by the child’s gender, household wealth and maternal education at
baseline. In looking at heterogeneous impacts, we focus on cognitive development as measured
by the Bayley total factor.17
Table 7. Heterogeneous impacts by child and household characteristics
Group (Number of observations) ITT
(RW-pvalue) Estimated Difference
(pvalue)
Maternal education ≥ complete high school (N=658) 0.18
0.064 (0.078)*
Maternal education < complete high school (N=632) 0.116 (0.568)
(0.439)
Male (N=671) 0.209
0.119 (0.078)*
Female (N=619) 0.09 (0.272)
(0.439)
Wealth index above the median (N=655) 0.011
-0.213 (0.892)
Wealth index below the median (N=635) 0.224 (0.042)**
(0.036)**
***p<0.01; **p<0.05; *p<0.1. Standard errors clustered by town. Heterogeneous effects estimated by subsamples: Difference is a cross-model test for ITT associated parameter. Covariates included: gender, household wealth index (binary), maternal PPVT score, teenage mother and BL weight for age and height for age z-scores. P-values adjusted by Romano Wolf (2005) for 6 multiple hypotheses.
For each of the three baseline variables we consider, we divide the sample in two groups:
level of maternal education (less than high school versus more), gender and wealth (above or
17 No significant heterogeneous effects were found in the case of socio-emotional or nutritional outcomes.

21
below the sample median).18 The results are reported in Table 7. The level of maternal education
does not seem to affect the impact. Although the point estimates are larger for mothers with
complete high school (0.18 SD v 0.12 SD), these estimates are not statistically different. Turning
to gender, the point estimates suggest that the intervention worked better for boys, but the
differences are, again, not significantly different from zero.
However, we do find significant effects of wealth on the impacts, even after correcting for
multiple testing, across the six hypotheses considered jointly. The effects, at 0.22 SD, are
estimated to be much stronger for children originating in poorer households. Moreover, the
difference between the impact on children from poorer households and that on children from
the higher wealth group is significant, with a p-value of 0.042. This result is key and contains both
a positive and a negative message: the intervention can indeed improve the outcomes of the
most deprived group in this already deprived population. However, the better off children from
this group are in no way “well-off” or middle class and neither do they measure up well in their
development against, say even the Bogota middle class, never mind the international standards.
Hence the intervention would need to improve for this group. These results generally highlight
the difficulty with improving ECD service quality for broad populations.
5.3. Effects on intermediate outcomes and mediation analysis
The intervention can be viewed as a transfer in kind. As such, it can affect the behavior of
altruistic parents in other dimensions. Parents may reduce other forms of investment as a
consequence of the transfer, therefore, mitigating or even neutralizing the effects of the
intervention. In our case, the food supplement could be clawed back by reducing other food
inputs to the subject child; and the additional stimulation of the target children could cause
parents to switch attention to other children or to themselves, therefore mitigating the
intervention’s impact. However, although this possibility has to be considered, we also notice
that it may not be salient in our specific context. It is also possible that poor parents are not fully
aware of the returns to investing in their children19 so that the effects of the intervention may
have been generated by an increase in investment induced by a change in these beliefs.
Moreover, the marginal return to parental investment may actually increase when the child is
getting better early childhood programs. Exploring the mediating factors and the mechanisms
underlying the effects we observed is a way of obtaining answers to some of these questions.
Moreover, understanding the mechanisms through which the intervention had its effects is
important to improving its design and targeting.
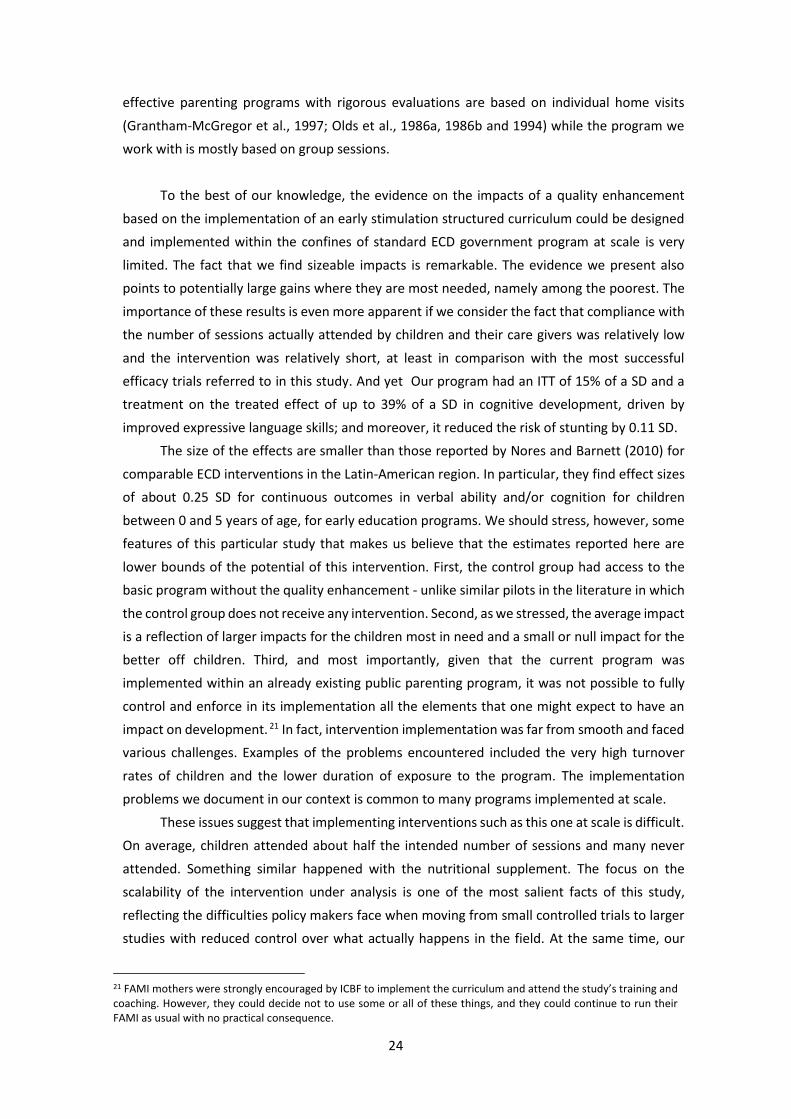
In Table 8, we present the effects of the program on a number of intermediate outcomes
described in detail in Appendix 4. The quality of the home environment is a strong indicator of
how much parents are investing in their children. To measure it, we combine information from
the number of magazines, books or newspapers in the home, the number of toy sources, the
18 The wealth index is computed as the first principal component of a number of dwellings characteristics (such as
walls, floors, roofs, number of bathrooms, rooms, etc.) and durable goods ownership. 19 See Cunha et al. (2013) and Attanasio et al. (2018) for this type of evidence.
22
number of varieties of play materials in the home and the number of play activities the child
engaged in with adults. We extract the first principal component and age-standardize it.
Table 8. Program impacts on intermediate variables
VARIABLE Beta (95% CI) P Value RW P Value
FCI Home Environment Quality (PCA) 0.338 0.000*** 0.000***
(0.202,0.474)
Parental Knowledge (Raw Score) -0.054 0.831 0.836
(-0.550,0.442)
Maternal Self Efficacy (Raw Score) 0.126 0.604 0.823
(-0.348,0.599)
ELCSA Food Insecurity Status -0.046 0.169 0.399
(-0.112,0.019) Note: ***p<0.01; **p<0.05; *p<0.1; 95% confidence interval in parenthesis for two-tailed tests. OLS estimation; standard errors clustered by town; D = beta /SD (Controls). P values are computed using Romano-Wolf (2005) step-down procedure. We consider 4 hypotheses. Covariates Included: gender, household wealth index (binary), maternal PPVT score, teenage mother and BL outcome. FCI Home Environment Quality is the first principal component of age-standardized FCI subscales.
The impact on this indicator was of 0.34 SD and statistically significant at less than 1%,
allowing for multiple hypotheses testing.20 This is a very strong result and does indicate that the
intervention induces parents to do more with their children. However, we do not find any
statistically significant program effects on maternal knowledge about child development,
maternal self-efficacy or food insecurity.
In Table 9, we present the results of a simple mediation analysis, as discussed in Section 4.
In particular, we report estimates of equation (4) aimed at assessing the relative importance of
the different intermediate outcomes on the program impacts on the cognitive development of
children, as measured by the Bayley-III total factor. The first column reproduces the baseline
program impact. The following columns add, one at a time, each of the intermediate outcomes
presented in Table 8. In addition, in the last column we add all the mediators considered at the
same time.
The results seem to suggest that while all intermediate outcomes significantly explain
children’s cognitive outcomes, only the learning environment at home, as measured by UNICEF’s
FCI indicators, absorbs a large part of the program ITT effects. Taking this at face value implies
that half the effect of the intervention operates through increasing the engagement and
investments of the parents with their children. The other half, at least in terms of point estimates
is attributable to the direct effects of the intervention itself. We also note that the direct effect
of the intervention, as measured by the first coefficient in the last column of Table 8, is not
20 For comparison, Attanasio et al. (2013) report program effects of 0.5 SD on play materials and play activities with adults at home in the home visit intervention described in Attanasio et al. (2014).

23
statistically different from zero. Of course, this result needs to be taken with some caution since
parental involvement and all other mediating factors are potentially endogenous; dealing with
this issue would require additional sources of exogenous variation affecting the mediators.
Nevertheless, it is also important to note that the parents did increase their inputs: this together
with the fact that this short intervention had such large impacts imply that, if anything, parents
reinforce the activities and there is no substantial crowding out.
Table 9. Effects of the program and of intermediate outcomes on Bayley-III total scores
VARIABLES
Treatment effect
regression add FCI add
Knowledge add Self-Efficacy
add Food-Insecurity
add all
ITT 0.1520** 0.0860 0.1545** 0.1504** 0.1433** 0.0837
(0.0621) (0.0626) (0.0608) (0.0616) (0.0620) (0.0617)
FCI Home Environment 0.1967*** 0.1834***
(0.0343) (0.0338)
Parental Knowledge 0.0337*** 0.0262***
(0.0085) (0.0083)
Maternal Self Efficacy 0.0213** 0.0157
(0.0098) (0.0096)
ELCSA Food Insecurity -0.1673** -0.1461**
(0.0654) (0.0648)
Observations 1,290 1,290 1,290 1,290 1,290 1,290
R-squared 0.2227 0.2461 0.2320 0.2259 0.2273 0.2582
F-test 21.14 17.38 21.05 22.88 23.27 16.26
Prob > F 0 0 0 0 0 0
Robust standard errors in parentheses. *** p<0.01, ** p<0.05, * p<0.1. Covariates included: gender, household wealth index (binary), maternal PPVT score, teenage mother and BL weight for age and height for age z-scores.
6. Discussion and conclusions
Interventions that promote early childhood development, starting from birth, may well
be the key to successful human capital policies, particularly in poor environments. However the
characteristics of such programs and its effectiveness at scale is not well understood. It is
precisely in this field where the inputs from both economics and child development can prove
crucial for our understanding.
In this study, we present results from an experiment where we designed a group-based
parenting support and early stimulation program, and implemented it within the infrastructure
of an existing parenting program targeted to the poorest in Colombia. Our intervention is based
on a curriculum shown to be effective in altering the long run cognitive trajectory of children
from deprived environments (Walker et al., 2011, Gertler et al., 2014). Most of the well-known
24
effective parenting programs with rigorous evaluations are based on individual home visits
(Grantham-McGregor et al., 1997; Olds et al., 1986a, 1986b and 1994) while the program we
work with is mostly based on group sessions.
To the best of our knowledge, the evidence on the impacts of a quality enhancement
based on the implementation of an early stimulation structured curriculum could be designed
and implemented within the confines of standard ECD government program at scale is very
limited. The fact that we find sizeable impacts is remarkable. The evidence we present also
points to potentially large gains where they are most needed, namely among the poorest. The
importance of these results is even more apparent if we consider the fact that compliance with
the number of sessions actually attended by children and their care givers was relatively low
and the intervention was relatively short, at least in comparison with the most successful
efficacy trials referred to in this study. And yet Our program had an ITT of 15% of a SD and a
treatment on the treated effect of up to 39% of a SD in cognitive development, driven by
improved expressive language skills; and moreover, it reduced the risk of stunting by 0.11 SD.
The size of the effects are smaller than those reported by Nores and Barnett (2010) for
comparable ECD interventions in the Latin-American region. In particular, they find effect sizes
of about 0.25 SD for continuous outcomes in verbal ability and/or cognition for children
between 0 and 5 years of age, for early education programs. We should stress, however, some
features of this particular study that makes us believe that the estimates reported here are
lower bounds of the potential of this intervention. First, the control group had access to the
basic program without the quality enhancement - unlike similar pilots in the literature in which
the control group does not receive any intervention. Second, as we stressed, the average impact
is a reflection of larger impacts for the children most in need and a small or null impact for the
better off children. Third, and most importantly, given that the current program was
implemented within an already existing public parenting program, it was not possible to fully
control and enforce in its implementation all the elements that one might expect to have an
impact on development. 21 In fact, intervention implementation was far from smooth and faced
various challenges. Examples of the problems encountered included the very high turnover
rates of children and the lower duration of exposure to the program. The implementation
problems we document in our context is common to many programs implemented at scale.
These issues suggest that implementing interventions such as this one at scale is difficult.
On average, children attended about half the intended number of sessions and many never
attended. Something similar happened with the nutritional supplement. The focus on the
scalability of the intervention under analysis is one of the most salient facts of this study,
reflecting the difficulties policy makers face when moving from small controlled trials to larger
studies with reduced control over what actually happens in the field. At the same time, our
21 FAMI mothers were strongly encouraged by ICBF to implement the curriculum and attend the study’s training and coaching. However, they could decide not to use some or all of these things, and they could continue to run their FAMI as usual with no practical consequence.

25
results indicate that, despite the implementation and scalability problems, the intervention had
a sizeable effect on the children most in need. The key issue is whether those at most risk of
low development are likely to drop out from the intervention.
Attanasio et al. (2014) study a home visiting intervention in Colombia targeted to a very
similar population and in similar regions in central Colombia. Their estimated impact on total
Bayley-III scores was 0.21 SD. The intervention studied in that paper lasted about 60% more
time than the current one (18 months vs 10.4 months), can be considered more intensive since
it consisted of weekly 1-hour home visits designed for the age of the specific child and the
attendance by program participants was higher (effective home visits delivered were, on
average, 81% of those intended). Moreover, the control of the research team over
implementation fidelity was significantly higher than for the program studied in this paper,
given that home visitors were hired and paid directly by the study. The intervention studied
here continued to be ran and funded by the government throughout the duration of the study.
Finally, the control group in Attanasio et al. (2014) was not active, while in the current study
received the ‘unimproved’ FAMI. So, in some sense it is remarkable that a comparable effect
was achieved with an intervention that was designed to strengthen an on-going program,
whose duration was shorter than that based on home visits, that did not achieve a perfect level
of compliance and that was considerable cheaper that home visits.
This study offers important new evidence that quality low-cost enhancements of already
existing programs, which leverage local low-skilled human resources, can be effective at scale.
The intervention we have studied, which consists in improving an existing intervention,
program costs about $320 per year per child ($28 in pedagogical materials, $82 in supervision
and $212 in additional nutritional supplementation) plus $12 one-off cost per child for FAMI
pre-service training. The cost of the unenhanced FAMI program is about $310 per child per year.
That means that the pedagogical enhancement (excluding the nutritional supplement)
corresponds to approximately 40% of the total cost. This is equivalent to 1.7 monthly minimum
wages per child per year, or 2.5 monthly minimum wages per year including the nutritional
supplement. For comparison, the cost per child per year in center-based child care in Colombia
is approximately $1,100 or 4.4 monthly minimum wages per child per year. In sum, the evidence
we have presented shows that it is possible to gradually improve the quality of nationwide
programs at scale in a way that is affordable, while maintaining quality and with a reasonably
sized impact on children’s developmental outcomes.
These considerations make it clear that one of the most important findings of the current
study is the characterization of the impacts of an intervention that can be developed at scale.
For this reason, it is worth comparing its impacts and its cost to other interventions recently
implemented in Colombia, which is what we do in Table 10.
All the quality enhancements considered in the Table are reasonably scalable and were
implemented directly by the government in a context very similar to the one we consider.
Bernal (2015) studies the impact of vocational training of the women running the family

26
nurseries considered. She reports a sizeable impact at a low cost per child. Bernal et al (2017)
consider the migration of children from home-based daycare services offered in the provider’s
own home to large childcare centers and find virtually no impacts at a very large cost.22 Finally,
Andrew et al (2016) study the impacts of (1) targeted pedagogical improvements to center-
based care in large cities and (2) staffing of these centers with nutritionists and psychologists.
The impacts are comparable to ours at a slightly higher cost for the pedagogical component.
Incidentally, the structural component of the intervention, which consisted of hiring of
professional personnel in centers had no effects on children’s cognition.
Table 10. Costs and impacts of alternative quality enhancements of ECD programs in Colombia
Program
Age of
children at
baseline
Cost
child/yr
(USD)
Impact
(SD of std
scores)
Duration of
intervention
(months)
Detailed result
Effect (SE or CI)
Training paraprofessional
care providers (Bernal,
2015)
6 months- 5
years of age 101 0.25 12
+5.2 (2.65) score points for
children 0-3 yrs of age on
ASQ language scores, and
+3.5 (2.0) score points for
children 3+ years on
Woodcock Muñoz
mathematical ability.
Transfer from home-based
to center-based childcare
(Bernal et al., 2017)
6 months- 5
years of age 780 0.05 10-18
+0.05 (0.02) SD on
nutrition factor, and -0.11
(0.05) SD on ASQ cognitive
factor.
Targeted pedagogical
improvements in center-
based care (Andrew,
2016)
18-36 months
of age 373 0.15 18
+0.15 (0.076) SD on
cognition, language &
school readiness factor
(based on TVIP, WM
cognition, Daberon and
pencil tapping test)
Staffing of center-based
care with professionals
(Andrew, 2016)
18-36 months
of age 150 0.1 18
Null effects on cognition.
+0.1 (0.06) SD on height for
age for children older than
30 months of age.
This study 0-12 months of
age 320 0.15 10
+0.15 (p-value 0.048) on
Bayley III factor and -0.06
(p-value 0.09) reduction in
risk of stunting.
This summary highlights the importance of process quality enhancements (such as the
integration of a structured curriculum) with respect to changes in structural quality alone (such
22 The cost reported in the table corresponds to the difference in the cost per child/year in a childcare center and the cost in a family nursery.

27
as infrastructure, like in Bernal et al (2017) or staffing, like in one of the two interventions
considered in Andrew et al. (2016)). In particular, the former seems to have more cost-effective
impacts with respect to the latter.
This study faced some limitations apart from the difficulties associated with offering the
intervention at a large scale. On one hand, we restricted the study sample to a few regions in
central Colombia because of their similarity in terms of cultures, customs and socioeconomic
context. This would make the use of a single curriculum —and associated materials such as
pictures and books—more feasible, which was particularly important given the ethnic and
geographical diversity of Colombia. This implies that it is not clear that the curriculum used to
improve FAMI (as it is currently designed) would be suitable for other regions of Colombia,
specifically, for diverse communities such as those with afro-Colombians and indigenous
populations.
On the other hand, it is possible that some developmental outcomes might have been
collected with significant measurement error (particularly those that that are reported by
parents such as Ages and Stages for socio-emotional development), and that these specific
measures lack enough sensitivity to measure the impacts of an intervention. Similarly, some
intermediate outcomes are difficult to measure. For instance, maternal knowledge was
collected using 10 items—some coming from a much longer instrument to measure knowledge
of child development (McPhee, 1981)—and some developed by us and might have failed to
capture the construct of interest. These second sets of difficulties, points to the importance to
develop and implement richer measures of child development as well as of the drivers of
development.

28
References
Aboud, F.E. and A.K., Yousafzai (2015) Global Health and Development in Early Childhood. Annual
Review of Psychology 66 (January):433-57.
Alderman, H., Behrman, J., Ross, D., and Sabot, R. (1996). The returns to endogenous human
capital in Pakistan’s rural wage labor market. Oxford Bulletin of Economics and Statistics, 58 (1),
29-55.
Andersen E. M., Malmgren J. A., Carter W. B., Patrick D. L. (1994). Screening for depression in well
older adults: Evaluation of a short form of the CES-D (Center for Epidemiologic Studies Depression
Scale). American Journal of Preventive Medicine, 10, 77-84.
Álvarez M, Estrada A, Melgar-Quiñonez H, Fonseca Z. (2008). Adaptación y validación interna y
externa de la Escala Latinoamericana y Caribeña para la medición de seguridad alimentaria en el
hogar - ELCSA- Colombia: Componente adaptación lingüística de ELCSA. Medellín.
Anderson, T. W., Darling, D. A. (1952). “Asymptotic theory of certain goodness-of-fit criteria
based on stochastic processes”. Annals of Mathematical Statistics, 23, 193-212,
Andrew, A., Attanasio, O., Bernal, R., Cardona, L., Krutikova, S., Martínez, D., Medina, C., Peña,
X., Rubio-Codina, M., and Vera-Hernández, M. (2016). Evaluation of centers of infant
development: an early years intervention in Colombia. Unpublished manuscript, Institute for
Fiscal Studies.
Andrew, A., Attanasio, O., Fitzsimons, E., Grantham-McGregor, S., Meghir, C. and Rubio-Codina,
M. (2018). Impacts 2 years after a scalable early childhood development intervention to increase
psychosocial stimulation in the home: A follow-up of a cluster randomised controlled trial in
Colombia. PLOS Medicine. https://doi.org/10.1371/journal.pmed.1002556
Attanasio, O., Cunha F. and Jervis P. (2018) Parental beliefs and investment. Unpublished
manuscript University College London.
Attanasio, O. P., Fernández, C., Fitzsimons, E., Grantham-McGregor, S., Meghir, C., and Rubio-
Codina, M. (2014). Using the infrastructure of a conditional cash transfer program to deliver a
scalable integrated early childhood development program in Colombia: Clustered randomized
controlled trial. British Medical Journal, 349, g5785.
Attanasio O., Fernández C., Fitzsimons E., Grantham-McGregor S., Meghir C. and Rubio-Codina
M. (2013) Enriching the home environment of low-income families in Colombia: a strategy to
promote child development at scale. Early Childhood Matters. Van Leer Foundation.
Bayley N. (2006) Bayley scales of infant and toddler development. 3rd ed. Pearson Education.
Berlinski, S. and N. Schady (2015) The early years: child well-being and the role of public policy.
Inter-American Development Bank. Palgrave Macmillan.
Bennett, C. (2008) Consistent integral-type tests for stochastic dominance. Unpublished
manuscript Vanderbilt University.
Bernal, R. (2016) Todo empieza en casa: el papel de la familia. En: Eds. Berniell, L. and De la Mata,
L. Más habilidades para el trabajo y la vida: los aportes de la familia, la escuela, el entorno y el
mundo laboral. Reporte anual Banco de Desarrollo de América Latina. ISSN: 980-6810-01-5.
Bernal, R. (2015). The impact of a vocational education program for childcare providers on
children’s well-being. Economics of Education Review, 48, 165–183
29
Bernal, R. (2013) The Cost of Early Childhood Policy in Colombia. Unpublished manuscript
Universidad de los Andes.
Bernal, R., O. Attanasio, X. Peña, M. Vera-Hernández (2017) The Effects of the Transition from
Home-based Community Nurseries to Childcare Centers on Children in Colombia. Unpublished
Manuscript Universidad de los Andes.
Bernal, R. and Camacho, A. (2014). Early childhood policy in the context of equity and social
mobility in Colombia. In A. Montenegro and M. Meléndez (Eds.), Equidad y Movilidad Social:
Diagnósticos y Propuestas para la Transformación de Colombia. Editorial Uniandes.
Bernal, R. and Camacho, A. (2011). The importance of early childhood programs in Colombia.
Imprenta Nacional de Colombia.
Bernal, R. and Keane, M.P. (2011). Child care choices and children’s cognitive achievement: the
case of single mothers. Journal of Labor Economics, 29:3, July.
Bernal, R. and Fernández, C. (2013). Subsidized childcare and child development in Colombia:
Effects of Hogares Comunitarios de Bienestar as a function of timing and length of
exposure. Social Science and Medicine, 97, 241–249.
Bernal, R. and Quintero, C. (2014). Characterization of children younger than five in Colombia
based on the Longitudinal Colombia Survey ELCA. Manuscript Universidad de los Andes.
Bitler, M., H. Hoynes , and T. Domina, (2014). “Experimental Evidence on Distributional Effects of
Head Start,” NBER Working Paper No. 20434, 2014.
Black, M., Walker, S., Fernald, L., Andersen, C.T., DiGirolamo, A., Lu, … Grantham-McGregor, S.
(2017). Early child development coming of age: science through the life-course. The Lancet, 389,
77–90.
Britto, P.R., Lye, S., Proulx, K., Yousafzai, A., Matthews, S., Vaivada, T., … and the Early Childhood
Development Interventions Review Group (2017). Nurturing care: promoting early childhood
development. The Lancet, 389, 91-102.
Broadhead, W., Gehlbach, S., De Gruy, F., & Kaplan, B. (1988). The Duke-UNC Functional Social
Support Questionnaire: Measurement of Social Support in Family Medicine Patients. Medical
Care, 26(7), 709-723.
Carneiro, P., and R. Ginja, (2014). “Long-Term Impacts of Compensatory Preschool on Health and
Behavior: Evidence from Head Start,” American Economic Journal: Economic Policy, 6, 135-173.
Chetty, R., J. Friedman, N. Hilger, E., D.Whitmore Schanzen- bach, and D. Yagan, (2011), “How
Does Your Kindergarten Classroom Affect Your Earnings? Evidence From Project STAR,” Quarterly
Journal of Economics, 126, 1593-1660.
Comisión Intersectorial de la Primera Infancia. (2012). Estrategia de Cero a Siempre:
Presentación. Mayo 3, 2015. Consejería Presidencial para la Primera Infancia.
Cunha F, Elo I. and Culhane J. (2013) Eliciting maternal expectations about the technology of
cognitive skill formation. NBER Working paper No. 19144.
Cunha F, Heckman J. (2013) Estimating the technology of cognitive and noncognitive skill
formation: the linear case. In: Molenaar PCM, Lerner RM, Newell KM, eds. Handbook of
developmental systems theory and methodology. Guilford Press, 221-69.
30
Cunha F, Heckman J, Schennach S. (2010) Estimating the technology of cognitive and
noncognitive skill formation. Econometrica; 78:883-93.
Cunha, F., Heckman, J. J., Lochner, L. J., & Masterov. D. V. (2006). Interpreting the evidence on
life cycle skill formation. In E. A. Hanushek and F. Welch (Eds.), Handbook of the Economics of
Education, pp. 697–812. Amsterdam: North-Holland.
ELCSA Scientific Committee (2012). Escala Latinoamericana y Caribeña de Seguridad Alimentaria
(ELCSA). Manual de uso y aplicación. Organización de las Naciones Unidas para la Alimentación y
la Agricultura (FAO). ISBN 978-92-5-307354-2.
Engle, P. L., Black, M. M., Behrman, J. R., Cabral de Mello, M., Gertler, P. J., & Kapiriri, L. (2007).
Strategies to avoid the loss of developmental potential in more than 200 million children in the
developing world. Lancet, 369(9557), 229–242.
Engmann, S. and D. Cousineau, (2011). “Comparing distributions : The Anderson-Darling test as
an Alternative to the Kolmogorov-Smirnoff test”. Journal of Applied Quantitative Methods, Vol
6(3) pp. 1-17.
Fernald, L. C. H., Gertler, P. J., and Neufeld, L. M. (2008). Role of cash in conditional cash transfer
programmes for child health, growth, and development: An analysis of Mexico's Oportunidades.
Lancet, 371(9615), 828–837.
Fernald, L. C. H., Prado, E., Kariger, and Raikes, A. (2017). A toolkit for measuring early childhood
development in low- and middle-income countries. Washington DC: World Bank.
Frongillo EA, Sywulka SM, Kariger P. UNICEF psychosocial care indicators project. Final report to
UNICEF 2003. Cornell University.
Gertler, P., Heckman, J., Pinto, R., Zanolini, A., Vermeersch, C., Walker, S., Chang M. S. y
Grantham-McGregor, S. (2014). Labor market returns to an early childhood stimulation
intervention in Jamaica. Science, 344(6187), 998-1001.
Grantham-McGregor, S. M., Powell, C. A., Walker, S. P., and Himes, J. H. (1991). Nutritional
supplementation, psychosocial stimulation, and mental development of stunted children: the
Jamaican Study. The Lancet, 338(8758), 1-5.
Grantham-McGregor, S. M., Walker, S. P., Chang, S. M., and Powell, C. A. (1997). Effects of early
childhood supplementation with and without stimulation on later development in stunted
Jamaican children. American Journal of Clinical Nutrition 66, 247-253.
Grantham-McGregor, S. and Smith, J. A. (2016). Extending The Jamaican Early Childhood
Development Intervention. Journal of Applied Research on Children: Informing Policy for Children
at Risk, 7(12).
Grantham-McGregor, S. and Walker, S. P. (2015). Extending The Jamaican early childhood home
visiting intervention. Early Childhood Matters, June, 28-34.
Handal, A. J., Lozoff, B., Breilh, J., and Harlow, S. D. (2007). Sociodemographic and nutritional
correlates of neurobehavioral development: A study of young children in a rural region of
Ecuador. Revista Panamericana de Salud Pública, 21, 292–300.
Heckman, J., Pinto, R. and Savelyev, P. (2013) Understanding the mechanisms through which an
influential early childhood program boosted adult outcomes. American Economic Review, Vol.
2013, No. 6, 2052-86.

31
Heckman, J. J. (2006). Skill formation and the economics of investing in disadvantaged children.
Science, 312, 1900–1902.
Heo, K. H., Squires, J., and Yovanoff, P. (2007). Cross-cultural adaptation of a pre-school screening
instrument: Comparison of Korean and US populations. Journal of Intellectual Disability Research,
52(3), 195–206.
Hoynes, Hilary, Diane Whitmore Schanzenbach and Douglas Almond (2016) “Long-Run Impacts of Childhood Access to the Safety Net” American Economic Review 2016, 106(4): 903–934
Jacoby, H. (2002) Is there any intrahousehold ‘Flypaper effect’? Evidence from a school feeding
programme. The Economic Journal, Vol. 112, No. 476, 196-221.
Kariger, Patricia, Edward A. Frongillo, Patrice Engle, Pia M. Rebello Britto, Sara M. Sywulka, and Purnima Menon. 2012. “Indicators of Family Care for Development for Use in Multicountry Surveys.” Journal of Health, Population and Nutrition 30 (4): 472–86.
Lo, S., Das, P. & Horton, R. (2017). Early childhood development: the foundation of sustainable
development. Comment. The Lancet 389, 8-9.
McKay, H., Sinisterra, L., McKay, A., Gomez, H., & Lloreda, P. (1978). Improving cognitive ability
in chronically deprived children. Science, 200, 270-278.
McPhee, D. (1981). Knowledge of infant development inventory. Chapel Hill, NC: University of
North Carolina.
Morgan, P., Farkas, G., Hillemeier, M., Sheffner Hammer, C., and Maczuga, S. (2015) 24-month-
old children with larger oral vocabularies display greater academic and behavioral functioning at
kindergarten entry. Child Development, Vol. 86, Issue 5, 1351-1370.
Nores, M., R. Bernal and S. Barnett (2016) Center-Based Care for Infants and Toddlers: The aeioTU
Randomized Trial. Unpublished manuscript National Institute for Early Education Research.
Nores, M. and R. Bernal (2014) The AeioTu Early Childhood Longitudinal Study Effects of ECD
intervention on family and community. Progress report National Institute for Early Education
Research and Universidad de los Andes.
Nores, M. and Barnett, W. S. (2010). Benefits of early childhood interventions across the world:
(Under)Investing in the very young. Economics of Education Review, 29, 271–328.
Olds, D., Henderson, C., Tatelbaum, R., & Chamberlin, R. (1986a). Improving the delivery of
prenatal care and outcomes of pregnancy: a randomized trial of nurse home visitation. Pediatrics,
77, 16-28.
Olds, D., Henderson, C., Chamberlin, R., & Tatelbaum, R. (1986b). Preventing child abuse and
neglect: a randomized trial of nurse home visitation. Pediatrics, 78, 65-78.
Olds, D., Henderson, C., & Kitzman, H. (1994). Does prenatal and infancy nurse home visitation
have enduring effects on qualities of parental caregiving and child health at 25 to 50 months of
life?. Pediatrics, 93(1):89-98
Padilla, E R, Lugo, D E, Dunn, L M. (1986). Test de Vocabulario en Imágenes Peabody (TVIP) MN:
AGS Circle Pines.
Pedersen, F. A., Bryan, Y., Huffman, L., & Del Carmen, R. (1989, April). Constructions of self and
offspring in the pregnancy and early infancy periods. Paper presented at the Meetings of the
Society for Research in Child Development, Kansas City, Missouri.

32
Porter, C. L., & Hsu, H. (2003). First-time mothers’ perceptions of efficacy during the transition to
motherhood: Links to infant temperament. Journal of Family Psychology, 17, 54-64.
Radloff LS. The CES-D scale: a self-report depression scale for research in the general population.
Appl Psychol Meas 1977;1:385-401.
Romano JP, Wolf M. 2005. Stepwise Multiple Testing as Formalized Data Snooping. Econometrica;
73(4):1237-1282
Rubio-Codina M, Attanasio O, Meghir C, Varela N, Grantham-McGregor S. The socio-economic
gradient of child development: cross-sectional evidence from children 6-42 months in Bogota
(2015) J Human Resources Spring vol. 50 no. 2 464-483.
Squires, J. and Bricker, D. (2009). Ages & Stages Questionnaires, Third Edition (ASQ-3). Baltimore,
MD: Paul H. Brookes Publishing.
Squires, J., Bricker, D., and Twombly, E. (2009a). Technical Report on ASQ:SE. Baltimore, MD: Paul
H. Brookes Publishing.
Squires, J., Bricker, D., and Twombly, E. (2009b). Ages & Stages Questionnaires: A parent-
completed child monitoring system. Baltimore, MD: Paul H. Brooks Publishing.
Squires, J., Bricker, D., Heo, K., and Twombly, E. (2002). Identification of social-emotional
problems in young children using a parent-completed screening measure. Early Childhood
Research Quarterly, 16(4), 405–419.
Super, C. M., Herrera, G., and Mora, J. O. (1990). Long-term effects of food supplementation and
psychosocial intervention on the physical growth of Colombian infants at risk of malnutrition.
Child Development, 61, 29–49.
UNICEF (2010). Child Disciplinary Practices at Home: Evidence from a Range of Low- and Middle-
Income Countries, New York.
Vargas-Baron, E. (2006). Impuestos sobre la Nómina Destinados al Desarrollo Infantil: Lecciones
aportadas por Colombia. UNESCO Notes on the Importance of Early Childhood Policies, p. 35.
Walker SP, Wachs TD, Grantham-McGregor S, Black MM, Nelson CA, Huffman SL, et al. (2011)
Inequality in early childhood: risk and protective factors for early child development. Lancet
2;378:1325-38.
Walker SP, Chang SM, Vera-Hernandez CM, Grantham-McGregor S. (2011) Early childhood
stimulation benefits adult competence and reduces violent behaviour. Pediatrics 127:849-57.
Walker SP, Chang SM, Powell C, Simonoff E, Grantham-McGregor S. (2006) Effects of psychosocial
stimulation and dietary supplementation in early childhood on psychosocial functioning in late
adolescence: follow-up of randomised controlled trial. BMJ 333:472.
Walker, S., Chang, S., Powell, C. y Grantham-McGregor, S. (2005). Effects of early childhood
psychosocial stimulation and nutritional supplementation on cognition and education in growth-
retarded Jamaican children: a prospective cohort study. The Lancet , 366(9499), 1804-1807.
Walker, S., Chang, S., Powell, C. A., and Grantham-McGregor, S. M. (2004). Psychosocial
intervention improves the development of term low-birth-weight infants. American Society for
Nutritional Sciences, 134(6), 1417–1423.

33
WHO Multicentre Growth Study Group (2006) WHO Motor Development Study: Windows of
Achievement for Six Gross Motor Development Milestones. Acta Pediatrica Suppl 450: 86-95.
WHO Multicentre Growth Reference Study Group (2006). WHO Child Growth Standards:
Length/height-for-age, weight-for-age, weight-for-length, weight-for-height and body mass
index-for-age: Methods and development, p. 312. Geneva: World Health Organization.
WHO Multicentre Growth Reference Study Group (2007). WHO Child Growth Standards: Head
circumference-for-age, arm circumference-for-age, triceps skinfold-for-age and subscapular
skinfold-for-age: Methods and development. Geneva: World Health Organization
Yoshikawa, H., Ponguta, L., Nieto, A., van Ravens, J., Portilla, X., Rebello Brito, P., and Leyva, D.
(2014). Evaluating mechanisms for governance, finance and sustainability of Colombia’s
comprehensive early childhood development policy De Cero a Siempre. Unpublished manuscript,
New York University.
Yoshikawa, H., Weiland, C., Brooks-Gunn, J., Burchinal, M., Espinosa, L., Gormley, W., & Zaslow,
M. J. (2013). Investing in our future: The evidence base on preschool education. New York, NY:
Foundation for Child Development and Ann Arbor, MI: Society for Research in Child
Development.
Yousafzai A.K., M.A. Rasheed, A. Rizvi, R. Armstrong, and Z.A. Bhutta ZA.(2014) “Effect of
integrated responsive stimulation and nutrition interventions in the Lady Health Worker
programme in Pakistan on child development, growth, and health outcomes: a cluster-
randomised factorial effectiveness trial”. Lancet. Oct 4;384(9950):1282-93.. Epub 2014 Jun 16.

34
Supplemental Materials.
Appendix 1. Detailed Description of the Interventions
The curriculum aims at assisting mothers to provide developmentally appropriate
activities for their children (in particular, activities that promote language, cognitive, and motor
development), as well as reinforcing maternal knowledge and practices about feeding and
nutrition. In doing so, it aims at improving mothers’ knowledge, practices, enjoyment in child up-
bringing, and self-esteem. Given that the program is delivered mostly through group meetings
and home visits, this intervention includes two complementary curricula. In both cases, the
components, actions and activities used to promote better maternal child rearing practices are
similar. These include making the mother the agent of change and empower her to improve her
child’s development, demonstrating the use of age-appropriate play materials and activities and
providing opportunities to practice with them, and provide supportive feedback. The program
also aims at training mothers in sensitive and responsive parenting and appropriate behavior
management, and encouraging positive mother-child interactions and preventing child
maltreatment.
Most of the program content was delivered through the group meetings as they were
held on a weekly basis. In addition to being spaces where to demonstrate and practice the use of
age-appropriate play materials and language activities, the groups provided opportunities for
discussing and practicing effective child rearing skills and positive interactions with children with
other caregivers, sharing experiences, group problem-solving, as well as opportunities for social
support. Group meetings also provided the opportunity for mothers to discuss how play activities
promoted children’s development, and show them how to make simple toys so that each family
could set up a toy library for home use. Group meetings were 1 hour long. An average of 5
mothers attend each session (min=1, max=15, SD=2.6).
The home visits were delivered monthly and provided the opportunity to introduce
activities that were more difficult in the context of the group (such as puzzles and matching
activities), additional language activities and specific ideas on how to use routine home activities
to promote child development and identify materials in the home that could be used to promote
child development. Home visits were, on average, one hour long.
Mothers were asked to attend one group meeting according to the age of their children.
Separate group meetings were offered for pregnant and lactating women with children up to 6
months, mothers with children 6 to 11 months, and mothers with children aged 1-2 years. We
expected mothers of children 6 to 24 months of age to attend four meetings per month and
pregnant and lactating with children up to 6 months to attend two meetings per month. However,
in practice, this did not always occur, and, in anticipation, the curriculum had been designed so
that it could be delivered to groups with children over the entire age range. Each group session
is structured in six different moments: arrival and free play; feedback from the previous group
session (10 minutes); song (5 minutes); demonstration and practice of age-appropriate play
activity and language activity for the week with material that will be taken home (30 minutes);

35
discussion around a parenting theme or activity (15 minutes); review of the session to ensure
that mothers understand the activities and commitment to practice with children at home (10
minutes), and finally, they share a snack. If mothers cannot attend their group according to their
children’s age, then play and language activities are divided into age bands (birth-5 months, 6-11
months and 1-2 years). The themes for discussion during the group meetings include issues such
as the importance of spending time playing with the child, praising the child, talking to the child,
things to do at bath time or mealtimes, learning to trust, understanding the child’s feelings,
teaching the baby about her environment, and child behavior.
Similarly, each home visit consisted of i) greeting and discussion of any issues, ii) feedback
from the previous home visiting session, iii) song, iv) introduction of new play and language
activities (including how to integrate into everyday routines, v) nutrition message, and vi) a
review of activities to be conducted over the next month.
The curriculum involves simple play materials to be used during home visits and in the
group meeting, including books, pictures to talk about, home-made toys, puzzles and building
blocks. The curriculum includes discussion topics or key parenting messages, age-appropriate
activities to promote child development using the play materials, as well as everyday activities to
encourage adult-child interactions. The curriculum also includes a set of nutrition cards relevant
to the children’s ages that are discussed with the mother during each home visit. The complete
kit of materials has a cost of USD 2723 per child per year.
In addition to the set of activities and materials, the qualification of the FAMI program
also included a training and coaching component (pre- and in-service training) to support and
maintain the quality of home visits and group meetings. Shifting away from a supervision model,
the new approach consists of a team of tutors with degrees in psychology and social work, who
provided the initial pre-service training and then continued to provide in-service training and
support during the implementation period. Tutors trained and supervised by the research team,
were in charge of training FAMI mothers. Training was provided sequentially by town. All FAMI
mothers were trained simultaneously in a given town for an average of 3.5 weeks and 85 hours.24
Towns with a larger number of FAMI units spent up to 170 hours of training in cases with more
than 10 FAMI units per town. More specifically, towns with less than 5 FAMI units received 75
hours of training in 3 weeks, towns with 6 to 9 FAMI units were trained for 100-125 hours in 5-6
weeks and towns with more than 10 FAMI units received training during 150-175 hours offered
during 6-7 weeks. The training involved demonstration, practice and feedback in running the
group sessions and conducting the play and language activities with mothers and children, and
training in how to make the toys. The one-time cost of pre-service training per FAMI provider was
of about USD 113 or USD 11 per child. 25
After training was finalized, tutors coached FAMI mothers continuously throughout the
duration of the intervention. Tutors observed one group session and one home visit, and
23 Computed at the average exchange rate 2015-2016. 24 This was done in two stages: an initial stage of 2 weeks and a second stage of 1.5 on average two months later. 25 Both computed at the average exchange rate 2015-2016 ($2,800 COP/USD).

36
provided feedback to the FAMI, in each supervision round which took place approximately every
6 weeks. Each tutor was in charge of 5 towns and 19 FAMI mothers, on average. Whenever
possible, they also facilitated a group meeting of FAMI mothers in each town to discuss and share
positive experiences and challenges and engage in problem-solving. The tutors were supervised
by an intervention supervisor (a member of the research team) who conducted visits with each
tutor every 2 months. The cost of coaching was around USD 82 per month per FAMI provider or
USD 8 per child per month.
In addition to the introduction of the early stimulation curriculum, the intervention also
includes a nutritional component. It is comprised of the delivery of a monthly nutritional
supplement to FAMI participants, and psychoeducation around feeding and nutrition during
group meetings and home visits. The nutritional supplement corresponds to 35% of daily calorie
intake requirements for pregnant women, breastfeeding mothers and children younger than 2
years of age (for 30 days). The cost of the package is USD 26 per month including shipping costs.
It contains tuna, sardines, canola oil, and whole milk with iron supplement, beans and lentils. In
terms of educational contents, we developed a cooking book that takes into account the
socioeconomic characteristics of households in our sample, brochures used to handle and classify
foods and 19 nutrition cards that are discussed with the mother during each home visit. Mothers
receive a nutrition card relevant to their child’s age at these monthly home visits. The topics
covered include things like breastfeeding, bottle-feeding, breastmilk extraction and storage,
weaning, hygiene, finger foods, menu ideas, mealtimes, and chatting while feeding.

37
Appendix 2. Geographic location of the sample
Note: Treated towns depicted in black and control towns depicted in white.
Appendix 3. The study’s flow chart
Source: Consort Flow Chart. Own Elaboration a Once in the field for data collection, we realized some towns did not have any FAMI units as they had made the transition to other public parenting programs (MF) b Towns in the list of 39 towns excluded initially form the sample, were randomly ranked and used as replacements. However we did not have enough replacement towns in all randomization strata.

38
Appendix 4. Data and Measurements
The primary outcomes included in this study are the following.
Nutrition. In line with similar international studies (Walker et al., 2004; Fernald, Gertler,
and Neufeld, 2008), we collected information on height and weight and computed externally
standardized Z-scores following World Health Organization (WHO) standards (WHO Multicentre
Growth Reference Study Group, 2006, 2007) for all children in our sample, both at baseline and
follow-up.
Cognitive, language, and motor development. We used the Bayley Scales of Infant and
Toddler Development, third edition –Bayley III– (Bayley, 2006) at follow-up only. We
administered the cognitive, receptive language, expressive language, fine motor, and gross motor
scales, following standard procedures, in local community centers, and in the presence of the
children’s mother.
The Bayley-III scales were translated into Spanish, back translated to English to ensure
accuracy, and piloted by testers.26 Testers held degrees in psychology and had six weeks’ training,
including practice sessions with children of the target age groups. Inter-rater reliability (intra-
cluster correlation) was above 0.9 on each scale of the test.
In the analysis, we use internally age-standardized scores, where raw scores have been
standardized using the sample mean and SD calculated from weighted local
smoothing regressions. Using internally standardized raw scores also allows us to examine each
scale separately. We also constructed a total Bayley score by factor analyzing the internally age-
standardized scores of the five scales.
Socio-emotional development. To measure the socio-emotional domain, we used the
Ages and Stages Questionnaire (ASQ:SE) (Squires, Bricker, and Twombly, 2009a) for all children
at follow-up only. The ASQ:SE is a parent-completed assessment system for children ages 6–60
months completed through culturally sensitive questionnaires focusing on socio-emotional
development and the identification of children at risk of social-emotional difficulties. It includes
self-regulation, compliance, communication, adaptive functioning, autonomy, affect, and
interactions with others. The ASQ:SE shows high levels of consistency, reliability, validity, and
specificity (Squires et al., 2002; Squires, Bricker, and Twombly, 2009b), and has been used for
early development assessments in low and middle low-income countries (Handal et al., 2007;
Heo, Squires and Yovanoff, 2007). Given the relatively low education levels of the mothers, we
administered as an interview to the mother (caregiver). We report internally age-standardized
total scores. It is important to note that the ASQ:SE is an instrument that screens for
developmental risk and is traditionally not the best measure for assessing changes in children’s
behavior.
26 The Institute for Fiscal Studies had already translated the Bayley-III record forms and administration manual to Colombian Spanish in the context of a prior research study entitled “Early Childhood Development: Identifying Successful Interventions and the Mechanisms behind Them”. Translation activities were carried out under the research translation license agreement between Pearson and the IFS, dated August 2009.

39
We did not collect any measures of child cognitive, language, motor or socio-emotional
development at baseline.
In addition to primary outcomes, we consider intermediate outcomes that could have
mediated the effect of the intervention on children’s developmental outcomes. In particular, we
focus on variables that measure the home environment, maternal self-efficacy, maternal
knowledge about child development, and food insecurity. All these measures were collected by
maternal report in the home (19%), in the FAMI (43%) or in a different community center, such
as, the town’s school, town hall or library (38%), both at baseline and at follow-up. We assessed
the quality of the home environment using four age-standardized variables constructed from
items in UNICEF’s Family Care Indicators (Kariger et al, 2012): the number of magazines, books or
newspapers in the home; the number of toy sources; the number of varieties of play materials in
the home; and the number of varieties of play activities the child engaged in with an adult over
the three days before the interview. These four indicators were then summarized in an individual
factor using standard factor analysis.
We assessed maternal self-efficacy using the Self-efficacy in the Caregiver Role Test –
Modified (Pedersen et al., 1989; Porter and Hsu, 2003), which evaluates feelings mothers could
have while taking care of their children. To measure maternal knowledge about child
development, we used 10-items, some selected from the Knowledge of Infant Development
Inventory –KIDI- (MacPhee, 1981), a much longer tool, and some developed by us. In the
statistical analysis, we used raw total scores for both variables.
Finally, we measured food insecurity by using the ELCSA scale –Latin American Scale for
the Measurement of Food Insecurity - which was validated in Colombia (ELCSA Scientific
Committee, 2012) at baseline and follow-up. Total scores allow classification of households in
four different levels of food insecurity: secure, mild insecurity, moderate insecurity and severe
insecurity (Álvarez et. al, 2008). In the statistical analysis, we use an indicator for food insecurity
which equals 1 if the household is food insecure (mild, moderate or severe) and 0 otherwise.
We collected household demographic and socio-economic status data both at baseline
and follow-up. These included data on dwelling characteristics such as type of property, type of
floors, roofs, and walls, number and type of bathrooms, access to public utilities, availability of
durable goods, characteristics of members of the household such as educational attainment,
employment status and wages, ethnicity, participation in social programs, and household income
by source. The socio-economic status score was computed as the principal component of a set of
dichotomous variables that describe characteristics of the household, ownership of durable
goods, and access to public utilities. A lower socio-economic status score is denoted by a negative
factor and a higher status by a positive factor (Vyas and Kumaranayake, 2006).
Background information on FAMI mothers was collected directly from them in both
rounds. Apart from basic sociodemographic characteristics, we also collected verbal ability by the
Peabody Picture Vocabulary Test and knowledge on ECD based on the same 10-item inventory
used for mothers.
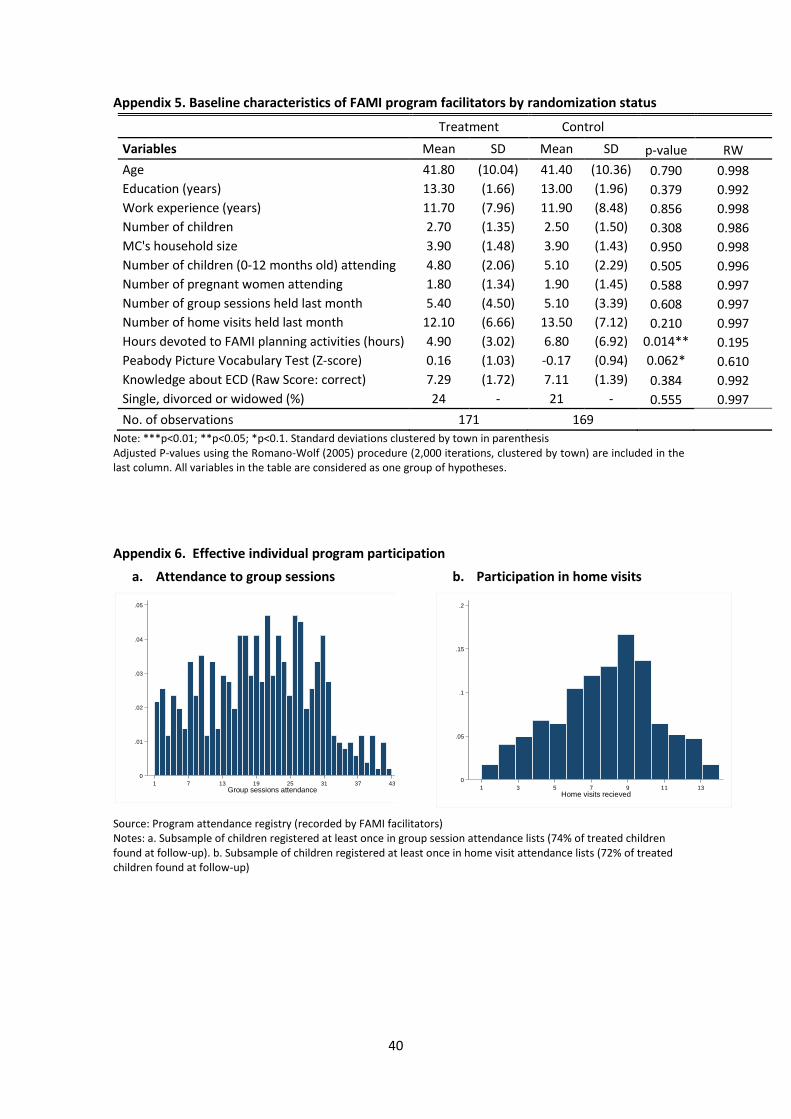
40
Appendix 5. Baseline characteristics of FAMI program facilitators by randomization status
Treatment Control
Variables Mean SD Mean SD p-value RW
Age 41.80 (10.04) 41.40 (10.36) 0.790 0.998
Education (years) 13.30 (1.66) 13.00 (1.96) 0.379 0.992
Work experience (years) 11.70 (7.96) 11.90 (8.48) 0.856 0.998
Number of children 2.70 (1.35) 2.50 (1.50) 0.308 0.986
MC's household size 3.90 (1.48) 3.90 (1.43) 0.950 0.998
Number of children (0-12 months old) attending 4.80 (2.06) 5.10 (2.29) 0.505 0.996
Number of pregnant women attending 1.80 (1.34) 1.90 (1.45) 0.588 0.997
Number of group sessions held last month 5.40 (4.50) 5.10 (3.39) 0.608 0.997
Number of home visits held last month 12.10 (6.66) 13.50 (7.12) 0.210 0.997
Hours devoted to FAMI planning activities (hours) 4.90 (3.02) 6.80 (6.92) 0.014** 0.195
Peabody Picture Vocabulary Test (Z-score) 0.16 (1.03) -0.17 (0.94) 0.062* 0.610
Knowledge about ECD (Raw Score: correct) 7.29 (1.72) 7.11 (1.39) 0.384 0.992
Single, divorced or widowed (%) 24 - 21 - 0.555 0.997
No. of observations 171 169 Note: ***p<0.01; **p<0.05; *p<0.1. Standard deviations clustered by town in parenthesis Adjusted P-values using the Romano-Wolf (2005) procedure (2,000 iterations, clustered by town) are included in the last column. All variables in the table are considered as one group of hypotheses.
Appendix 6. Effective individual program participation
a. Attendance to group sessions
b. Participation in home visits
Source: Program attendance registry (recorded by FAMI facilitators) Notes: a. Subsample of children registered at least once in group session attendance lists (74% of treated children found at follow-up). b. Subsample of children registered at least once in home visit attendance lists (72% of treated children found at follow-up)
0
.01
.02
.03
.04
.05
Den
sity
1 7 13 19 25 31 37 43
Group sessions attendance
0
.05
.1
.15
.2
Den
sity
1 3 5 7 9 11 13
Home visits recieved
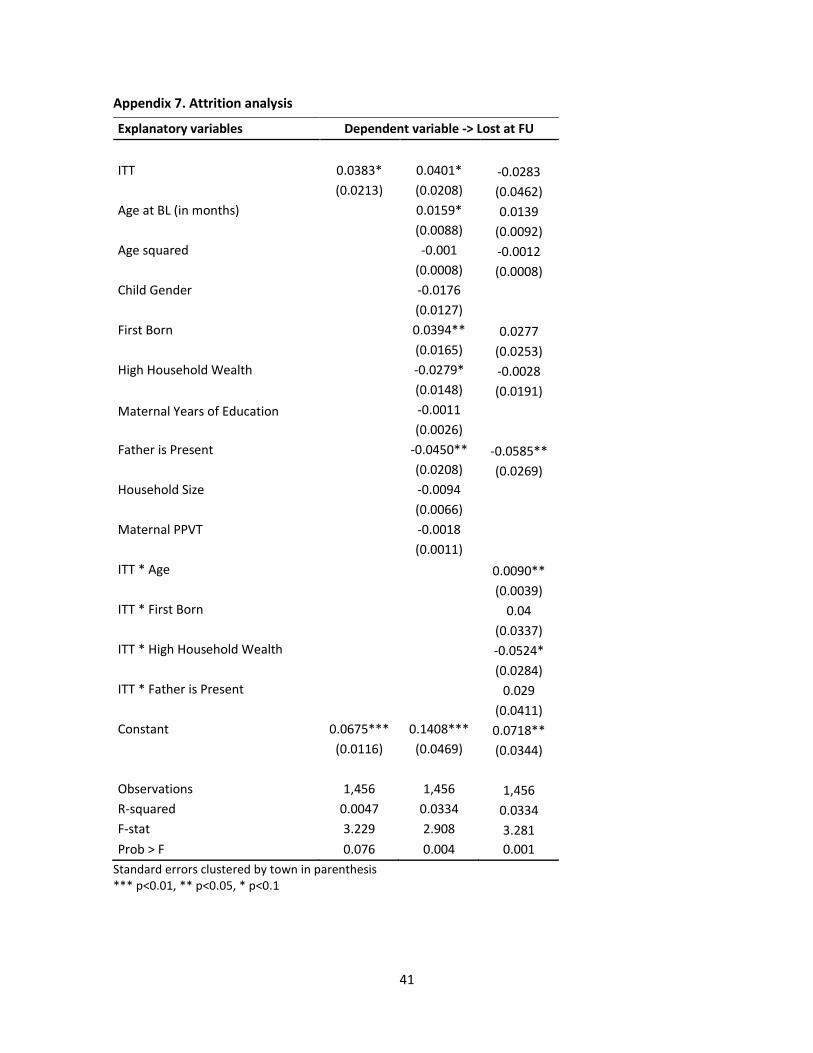
41
Appendix 7. Attrition analysis
Explanatory variables Dependent variable -> Lost at FU
ITT 0.0383* 0.0401* -0.0283
(0.0213) (0.0208) (0.0462)
Age at BL (in months) 0.0159* 0.0139 (0.0088) (0.0092)
Age squared -0.001 -0.0012 (0.0008) (0.0008)
Child Gender -0.0176 (0.0127)
First Born 0.0394** 0.0277 (0.0165) (0.0253)
High Household Wealth -0.0279* -0.0028
(0.0148) (0.0191)
Maternal Years of Education -0.0011
(0.0026)
Father is Present -0.0450** -0.0585** (0.0208) (0.0269)
Household Size -0.0094 (0.0066)
Maternal PPVT -0.0018 (0.0011)
ITT * Age 0.0090** (0.0039)
ITT * First Born 0.04 (0.0337)
ITT * High Household Wealth -0.0524* (0.0284)
ITT * Father is Present 0.029 (0.0411)
Constant 0.0675*** 0.1408*** 0.0718** (0.0116) (0.0469) (0.0344)
Observations 1,456 1,456 1,456
R-squared 0.0047 0.0334 0.0334
F-stat 3.229 2.908 3.281
Prob > F 0.076 0.004 0.001
Standard errors clustered by town in parenthesis *** p<0.01, ** p<0.05, * p<0.1
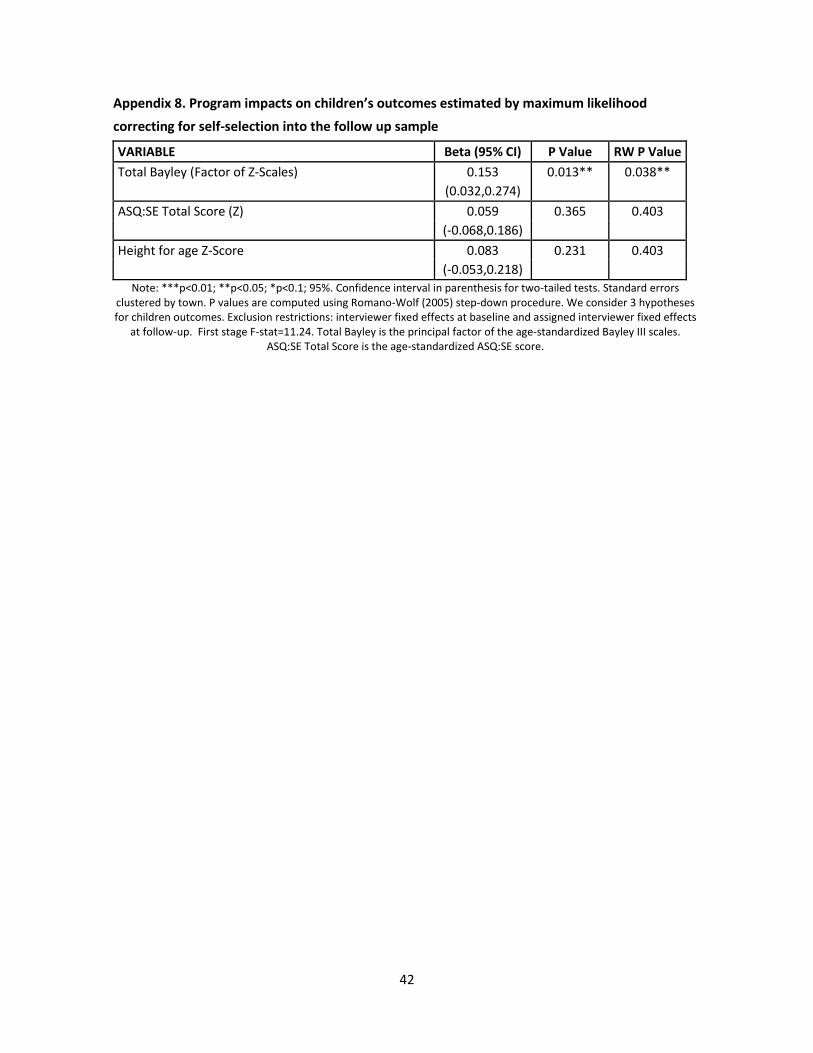
42
Appendix 8. Program impacts on children’s outcomes estimated by maximum likelihood
correcting for self-selection into the follow up sample
VARIABLE Beta (95% CI) P Value RW P Value
Total Bayley (Factor of Z-Scales) 0.153 0.013** 0.038**
(0.032,0.274)
ASQ:SE Total Score (Z) 0.059 0.365 0.403
(-0.068,0.186)
Height for age Z-Score 0.083 0.231 0.403
(-0.053,0.218)
Note: ***p<0.01; **p<0.05; *p<0.1; 95%. Confidence interval in parenthesis for two-tailed tests. Standard errors clustered by town. P values are computed using Romano-Wolf (2005) step-down procedure. We consider 3 hypotheses for children outcomes. Exclusion restrictions: interviewer fixed effects at baseline and assigned interviewer fixed effects
at follow-up. First stage F-stat=11.24. Total Bayley is the principal factor of the age-standardized Bayley III scales. ASQ:SE Total Score is the age-standardized ASQ:SE score.