Embed Size (px)
Citation preview

Edinburgh Research Explorer
ENSO Drives interannual variation of forest woody growth acrossthe tropicsCitation for published version:Rifai, SW, Girardin, CAJ, Berenguer, E, Del Aguila-pasquel, J, Dahlsjö, CAL, Doughty, CE, Jeffery, KJ,Moore, S, Oliveras, I, Riutta, T, Rowland, LM, Murakami, AA, Addo-danso, SD, Brando, P, Burton, C, Ondo,FE, Duah-gyamfi, A, Amézquita, FF, Freitag, R, Pacha, FH, Huasco, WH, Ibrahim, F, Mbou, AT, Mihindou,VM, Peixoto, KS, Rocha, W, Rossi, LC, Seixas, M, Silva-espejo, JE, Abernethy, KA, Adu-bredu, S, Barlow,J, Da Costa, ACL, Marimon, BS, Marimon-junior, BH, Meir, P, Metcalfe, DB, Phillips, OL, White, LJT &Malhi, Y 2018, 'ENSO Drives interannual variation of forest woody growth across the tropics', PhilosophicalTransactions of the Royal Society B: Biological Sciences, vol. 373, no. 1760, pp. 20170410.https://doi.org/10.1098/rstb.2017.0410
Digital Object Identifier (DOI):10.1098/rstb.2017.0410
Link:Link to publication record in Edinburgh Research Explorer
Document Version:Peer reviewed version
Published In:Philosophical Transactions of the Royal Society B: Biological Sciences
General rightsCopyright for the publications made accessible via the Edinburgh Research Explorer is retained by the author(s)and / or other copyright owners and it is a condition of accessing these publications that users recognise andabide by the legal requirements associated with these rights.
Take down policyThe University of Edinburgh has made every reasonable effort to ensure that Edinburgh Research Explorercontent complies with UK legislation. If you believe that the public display of this file breaches copyright pleasecontact [email protected] providing details, and we will remove access to the work immediately andinvestigate your claim.
Download date: 25. Mar. 2020
For Review Only
ENSO drives interannual variation of forest woody growth
across the tropics
Journal: Philosophical Transactions B
Manuscript ID RSTB-2017-0410.R1
Article Type: Research
Date Submitted by the Author: n/a
Complete List of Authors: Rifai, Sami; University of Oxford Environmental Change Institute, School of Geography and the Environment Girardin, Cécile; University of Oxford, Environmental Change Institute, School of Geography and the Environment Berenguer, Erika; University of Oxford, Environmental Change Institute; Lancaster University, Lancaster Environment Centre del Aguila-Pasquel, Jhon; Instituto de Investigaciones de la Amazonia Peruana Dahlsjö, Cecilia A.L.; University of Oxford Environmental Change Institute, School of Geography and the Environment Doughty, Christopher; Northern Arizona University, School of Informatics, Computing, and Cyber Systems Jeffery, Kathryn J.; Faculty of Natural Sciences, University of Stirling; Institut de Recherche en Écologie Tropicale, CENAREST, BP 842; Agence Nationale des Parcs Nationaux Moore, Sam; University of Oxford Environmental Change Institute, School of Geography and the Environment Oliveras, Imma; University of Oxford, School of Geography and the Environment Riutta, Terhi; University of Oxford, School of Geography and the Environment Rowland, Lucy; University of Exeter College of Life and Environmental Sciences, Geography Araujo Murakami, Alejandro; Museo de Historia Natural Noel Kempff Mercado Universidad Autónoma Gabriel Rene Moreno Addo-Danso, Shalom D.; Forestry Research Institute of Ghana Burton, Chad; University of Oxford, School of Geography; Evouna Ondo, Fidèle ; Agence Nationale des Parcs Nationaux Duah-Gyamfi, Akwasi; Forestry Research Institute of Ghana Farfán Amézquita, Filio; Universidad Nacional de San Antonio Abad Freitag, Renata; Universidade do Estado de Mato Grosso Hancco Pacha, Fernando; Universidad Nacional de San Antonio Abad del Cusco Facultad de Medicina Humana Huaraca Huasco, Walter; University of Oxford Environmental Change Institute, School of Geography and the Environment Ibrahim, Forzia; The Forestry Research Institute of Ghana Mbou, Armel; Centro Euro-Mediterraneo sui Cambiamente Climatici Mihindou Mihindou, Vianet; Ministère de la Forêt, de la Mer et de
http://mc.manuscriptcentral.com/issue-ptrsb
Submitted to Phil. Trans. R. Soc. B - Issue
For Review Only
l’Environnement Peixoto, Karine; Universidade do Estado de Mato Grosso, BIONORTE Network Postgraduate Program in Biodiversity and Biotechnology Rocha, Wanderley; Instituto de Pesquisa Ambiental da Amazônia Rossi, Liana; Universidade Estadual Paulista, Departamento de Ecologia Seixas, Marina; Embrapa Amazônia Oriental Silva Espejo, Javier Eduardo; Universidad de La Serena, Departamento de Biología Abernethy, Kate; University of Stirling, School of Natural Sciences; CENAREST, Institut de Recherche en Ecologie Tropicale Adu-Bredu, Stephen; Forest Research Institute of Ghana, Barlow, Jos; Lancaster University, Lancaster Environment Centre Brando, Paulo; Amazon Institute for Environmental Research (IPAM), Costa, Antonio; Universidade Federal do Pará, Centro de Geociências, Departamento de Meteorologia Gardner, Toby; Stockholm Environment Institute Marimon, Beatriz S.; Universidade do Estado de Mato Grosso Marimon-Junior, Ben Hur; Universidade do Estado de Mato Grosso, Meir, Patrick; Australian National University, Research School of Biology; University of Edinburgh School of GeoSciences, School of Geosciences Metcalfe, Dan; Lund University Phillips, Oliver; University of Leeds, Leeds White, Lee; Agence nationale des parcs nationaux, Malhi, Yadvinder; University of Oxford, Environmental Change Institute;
Issue Code (this should have already been entered but
please contact the Editorial Office if it is not present):
NINO
Subject: Ecology < BIOLOGY, Environmental Science < BIOLOGY, Plant Science < BIOLOGY
Keywords: El Niño, vapour pressure deficit, tropical forests, woody net primary production, drought, meteorological anomalies
Page 1 of 21
http://mc.manuscriptcentral.com/issue-ptrsb
Submitted to Phil. Trans. R. Soc. B - Issue
123456789101112131415161718192021222324252627282930313233343536373839404142434445464748495051525354555657585960
For Review Only
Phil. Trans. R. Soc. B. article template
Phil. Trans. R. Soc. B.
doi:10.1098/not yet assigned
1
ENSO drives interannual variation of forest woody growth across the tropics
Sami W. Rifai1*, Cécile A.J. Girardin
1, Erika Berenguer
1,18, Jhon del Aguila-
Pasquel2, Cecilia A.L. Dahlsjö
1, Christopher E. Doughty
3, Kathryn J.
Jeffery4,5,6, Sam Moore
1, Imma Oliveras
1, Terhi Riutta
1, Lucy M.
Rowland7, Alejandro Araujo Murakami
8, Shalom D. Addo-Danso
9, Paulo
Brando10,15
, Chad Burton1, Fidèle Evouna Ondo
6, Akwasi Duah-Gyamfi
9,
Filio Farfán Amézquita11, Renata Freitag
12, Fernando Hancco Pacha
11,
Walter Huaraca Huasco1, Forzia Ibrahim
9, Armel T. Mbou
13, Vianet
Mihindou Mihindou6,14, Karine S. Peixoto
12, Wanderley Rocha
15, Liana C.
Rossi16, Marina Seixas
17, Javier E. Silva-Espejo
18, Katharine A.
Abernethy4,5, Stephen Adu-Bredu
9, Jos Barlow
19, Antonio C.L. da Costa
20,
Toby Gardner21, Beatriz S. Marimon
12, Ben H. Marimon-Junior
12, Patrick
Meir22,23
, Daniel B. Metcalfe24, Oliver Phillips
25, Lee J.T. White
4,5 and
Yadvinder Malhi1
Environmental Change Institute, School of Geography and the Environment, University of Oxford, South
Parks Road, Oxford OX1 3QY, UK
Keywords: El Niño, tropical forests, woody net primary production, drought, meteorological anomalies, climatic water deficit, vapour pressure deficit
*Author for correspondence ([email protected]). †Present address: 1 [Rifai, Berenguer, Dahlsjö, Girardin; Moore; Oliveras; Riutta; Burton; Huaraca Huasco; Malhi] Environmental Change Institute, School of Geography and the Environment, University of Oxford, South Parks Road, Oxford OX1 3QY, UK
2 [del Aguila Pasquel] Instituto de Investigaciones de la Amazonia Peruana (IIAP), Iquitos, Perú
3 [Doughty] School of Informatics, Computing and Cyber systems, Northern Arizona University, Flagstaff, AZ 86011 USA
4 [Abernethy; Jeffery; White] Faculty of Natural Sciences, University of Stirling, Stirling, FK9 4LA, Scotland, UK
5 [Abernethy; Jeffery; White] Institut de Recherche en Écologie Tropicale, CENAREST, BP 842, Libreville, Gabon
6 [Jeffery; Mihindou; White] Agence Nationale des Parcs Nationaux (ANPN), BP 20379, Libreville, Gabon
7 [Rowland] Geography, College of Life and Environmental Sciences, University of Exeter, Amory Building, Exeter, EX4 4RJ, UK;
8 [Araujo Murakami] Museo de Historia Natural Noel Kempff Mercado Universidad Autónoma Gabriel Rene Moreno, Avenida Irala 565 Casilla Postal 2489, Santa Cruz, Santa Cruz, Bolivia
9 [Adu-Bredu ; Addo-Danso; Forzia Ibrahim] The Forestry Research Institute of Ghana, Kumasi, Ghana
10[Brando] Woods Hole Research Center, Falmouth, MA, USA.
11 [Farfán Amézquita; Hancco Pacha] Universidad Nacional San Antonio Abad del Cusco, Cusco, Perú
12 [Freitag; Peixoto; Marimon-Junior; Marimon] Programa de Pós-graduação em Ecologia e Conservação, Universidade do Estado de Mato Grosso, CEP 78690-000, Nova Xavantina, MT, Brazil
13 [Mbou] Centro Euro-Mediterraneo sui Cambiamente Climatici, Leece, Italy
14 [Mihindou] Ministère de la Forêt et de l'Environnement, BP199, Libreville, Gabon
15 [Brando & Wanderley Rocha] Amazon Environmental Research Institute (IPAM), Canarana, Mato Grosso, Brazil
16 [Rossi] Departamento de Ecologia, Universidade Estadual Paulista, 13506-900, Rio Claro, SP, Brazil
17[Seixas] Embrapa Amazônia Oriental, Trav. Dr. Enéas Pinheiro, s/n, CP 48, 66095-100, Belém, PA, Brazil
18 [Silva-Espejo] Departamento de Biologıa, Universidad de La Serena, , La Serena, Chile
19[Barlow] Lancaster Environment Centre, Lancaster University, Lancaster, UK
20[ACL da Costa] Instituto de Geosciências, Universidade Federal do Pará, Belém, Brazil
Page 2 of 21
http://mc.manuscriptcentral.com/issue-ptrsb
Submitted to Phil. Trans. R. Soc. B - Issue
123456789101112131415161718192021222324252627282930313233343536373839404142434445464748495051525354555657585960
For Review Only
21[Gardner] Stockholm Environment Institute, Linnégatan 87D, Box 24218, Stockholm 104 51, Sweden
22[Meir] Research School of Biology, Australian National University, Canberra, ACT 2601, Australia
23[Meir] School of Geosciences, University of Edinburgh, Edinburgh EH93FF UK
24[Metcalfe] Physical Geography and Ecosystem Science, Lund University, Lund, Sweden
25[Phillips] School of Geography, University of Leeds, UK
Summary
Meteorological extreme events such as El Niño events are expected to affect tropical forest net primary production (NPP) and woody growth, but there has been no large scale empirical validation of this expectation. We collected a large high temporal resolution dataset (for 1-13 years depending upon location) of more than 172,000 stem growth measurements using dendrometer bands from across 14 regions spanning Amazonia, Africa and Borneo in order to test how much month-to-month variation in stand-level woody growth of adult tree stems (NPPstem) can be explained by seasonal variation and interannual meteorological anomalies. A key finding is that woody growth responds differently to meteorological variation between tropical forests with a dry season (where monthly rainfall is < 100 mm), and aseasonal wet forests lacking a consistent dry season. In seasonal tropical forests a high degree of variation in woody growth can be predicted from seasonal variation in temperature, vapour pressure deficit, in addition to anomalies of soil water deficit, and shortwave radiation. The variation of aseasonal wet forest woody growth is best predicted by the anomalies of vapor pressure deficit, water deficit, and shortwave radiation. In total, we predict the total live woody production of the global tropical forest biome to be 2.16 Pg C year-1, with an interannual range 1.96-2.26 Pg C year-1 between 1996-2016, and with the sharpest declines during the strong El Niño events of 1997/8 and 2015/6. There is high geographical variation in hotspots of El Niño-associated impacts, with weak impacts in Africa, and strongly negative impacts in parts of SE Asia and extensive regions across central and eastern Amazonia. Overall, there is high correlation (r = -0.75) between the annual anomaly of tropical forest woody growth and the annual mean of the El Niño 3.4 index, driven mainly by strong correlations with anomalies of soil water deficit, vapor pressure deficit, and shortwave radiation.
1. Introduction Tropical forest productivity is amongst the highest of terrestrial ecosystems [1,2], but the amount of carbon allocated to woody stems (NPP
stem) within tropical forests is highly variable [3–6]. We here define NPP
stem as
the productivity of above-ground woody tissue including trunks and branches, but excluding fine woody material such as twigs, and woody coarse roots. NPP
stem is not the largest component of carbon allocation,
typically accounting for only 20-30% of NPP and 5-10% of gross primary productivity (GPP) [7], but, because woody material is long-lived, it is a major determinant of forest biomass and carbon residence time. In this paper we examine the seasonal and interannual variation of woody growth (NPPstem) across the tropical forest biome. Meteorological variation is likely to be an important control on seasonal changes in NPP
stem and has only rarely been tested [8–11], but never so at a pantropical scale. Examination of NPP
stem
variation has largely been limited to coarse temporal variation at interannual or multi-year time scales. NPP
stem is usually estimated by repeat census of tree diameters coupled with the use of allometric equations
to translate changes into above-ground biomass. However forest census intervals typically span multiple years, and this obscures the relation of NPP
stem to seasonal meteorological variation and meteorological
extreme events. Dendrometers enable much higher resolution tracking of tree growth (typically monthly resolution for manual dendrometers, daily for automatic dendrometers), but have not previously been employed in a consistent multi-site and multi-regional analysis. Here we present and analyse a uniquely extensive pantropical dataset of tree growth comprising more the 8,725 trees. The standardized protocol for measuring NPP
stem from the Global Ecosystem Monitoring network (www.gem.tropicalforests.ox.ac.uk)
is unique for its use of manual dendrometers to provide high temporal resolution (~ 1-3 months), enabling examination of seasonal and interannual variation in NPP
stem.
At an individual level, carbon allocation to NPP
stem is thought to be affected by several biological processes,
including photosynthetic uptake [7], its balance with respiration [12–14], tradeoffs in carbon allocation between woody parts, canopies and roots[7,15–17], source vs. sink driven biological cues[18,19], and most especially the crown exposure to light[20,21]. However when aggregated to the stand level, many of these individual-level biological drivers of growth are marginalized. After all, the amount of light and rainfall a forest receives and utilises is not so much a function of its stand structure, but of seasonality in weather and its geographic location. Here we do not specifically address the non-climatic components of spatial
Page 3 of 21
http://mc.manuscriptcentral.com/issue-ptrsb
Submitted to Phil. Trans. R. Soc. B - Issue
123456789101112131415161718192021222324252627282930313233343536373839404142434445464748495051525354555657585960
For Review Only
variation in NPPstem
, because this is an inherently more complicated question where the allocation of carbon to NPP
stem is dependent upon a number of interacting factors and processes such as soil fertility, species
composition, and carbon use efficiency [12,20]. In this study, we purposely do not aim to explain the biological, disturbance related (e.g. catastrophic tree mortality events), or other spatially varying abiotic controls (e.g. soil fertility) upon NPP
stem, but rather how month-to-month meteorological variation can
explain seasonal changes in NPPstem
. Seasonal differences in NPP
stem (or xylogenesis) are likely to be concentrated towards the transition
between the dry to the wet seasons because xylogenesis is inhibited when cell turgor is low [18], and trees recovering from extreme drought stress may improve their hydraulic conductivity by replacing xylem that have cavitated over the dry season [22]. This pattern may be stronger in highly seasonal forests that experience annual drought stress, whereas differences in the temporal allocation of carbon to woody growth may be non-existent in aseasonal forests where few droughts occur to impair stem hydraulic conductivity. The extent to which a seasonal increase in woody stem growth reflects an increase in overall productivity, or simply a shift in carbon allocation among roots, wood, the canopy, and non-structural carbohydrate storage pools remains uncertain. In lowland Amazonia, allocation shifts were found to be more important than overall changes in carbon assimilation in explaining interannual variability in canopy, wood, and fine root growth rates [16,17]. Here, we utilize the anomalous drought conditions produced by El Niño events to examine how much spatial and temporal variation in in NPP
stem can be explained by purely meteorological variation. El Niño
events tend to increase temperatures and atmospheric water vapour deficit (VPD) across the tropics, and cause strong declines in precipitation in some regions, most notably Amazonia and insular SE Asia [23]. These meteorological factors are likely to affect NPP
stem through underlying ecophysiological mechanisms.
We focus on relating temperature, VPD, cloudiness, and precipitation metrics to NPPstem
. First, negative precipitation anomalies and soil water deficits are likely to impede growth by increasing soil-root hydraulic resistance [24] and reducing stem conductance through cavitation [25]. Precipitation deficits from drought can eventually lead to declines in NPP ([26]; but see [11]). Relating precipitation to forest growth can be challenging because monthly precipitation can be decomposed into numerous metrics with greater ecophysiological relevance, but here we focus on four aspects: a one dimensional Thornthwaite-Mather water balance model from a high resolution climate product [27], climatic water deficit (CWD) which is a simpler proxy for sub annually varying soil water deficit, the maximum climatic water deficit (MCWD) which represents that maximum CWD for the preceding 12-months [28], and lagged differences in monthly precipitation which can serve as a proxy for the transition between dry and wet seasons. Second, temperature, even in the tropics, can control or act as a cue for much of the seasonality of growth and carbon allocation [29,30], yet reductions in photosynthesis occur when trees are exposed to temperatures beyond their optimum for photosynthesis [31–33]. A recent comparison of an evergreen and semi-deciduous forest in Panama found that the community temperature optimum closely mirrored the mean maximum daytime temperature [33]. Thus positive temperature anomalies during drought events may push leaves over their optimum temperature for photosynthesis, increase respiration costs [34], and by extension reduce the amount of plant expendable carbon that can be allocated to NPP
stem. Alternatively,
higher temperatures may push forest canopies into or beyond their optimal temperature range and either leading to an increase or saturation of gross primary productivity [35]. Third, high temperatures with invariant or reduced atmospheric humidity lead to high VPD, which can induce stomata to close [36–38] even when soil moisture is non-limiting [39]. Of course stomatal conductance does not work independent of leaf energy balance, so positive VPD anomalies may result in a reduction of leaf conductance which may induce higher leaf surface temperatures and VPDs, and perhaps further reduce photosynthesis. Finally, shortwave radiation is highly correlated with photosynthetic assimilation of CO
2. El Niño events can
reduce cloudiness in the same regions where it reduces precipitation, which results in increased shortwave irradiance. A positive shortwave anomaly could increase photosynthesis in tropical regions with weak dry seasons, such as northwest Amazonia, and Borneo [30], although prior evidence suggests an increase in carbon assimilation may not necessarily manifest in higher NPP
stem [5,7,40].
Specifically we address the following questions: (1) How much variation in tropical NPPstem can be explained by meteorological variation? (2) What meteorological drivers most affect NPPstem during El Niño associated drought events? (3) What is the total annual woody production of the tropical forest biome, how much does it decline during El Niño events, and which regions contribute most strongly to these declines? 2. Methods 2.1 Scaling from individuals to forest stand
Page 4 of 21
http://mc.manuscriptcentral.com/issue-ptrsb
Submitted to Phil. Trans. R. Soc. B - Issue
123456789101112131415161718192021222324252627282930313233343536373839404142434445464748495051525354555657585960
For Review Only
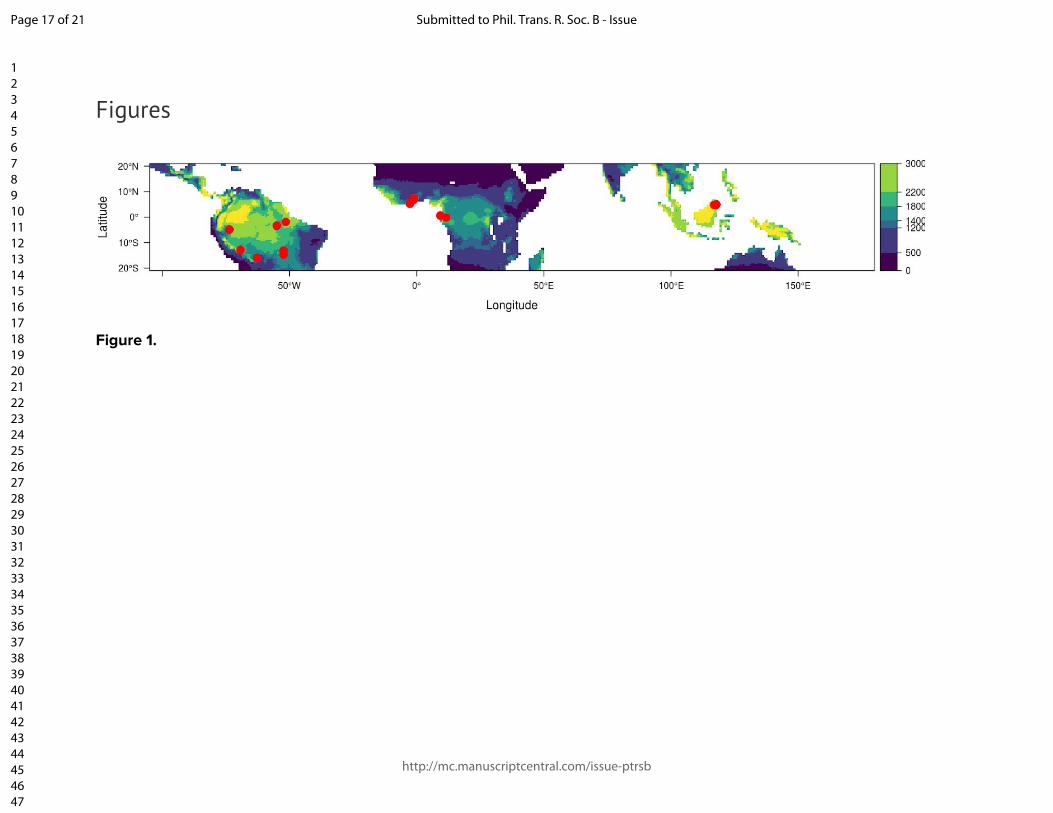
We employed the standard protocols of the Global Ecosystems Monitoring (GEM) network, described at gem.tropicalforests.ox.ac.uk). Simply, constructed manual dendrometer bands were installed on trees and measured at intervals typically ranging from 1-3 months across 14 geographic regions encompassing a large rainfall gradient ranging from highly seasonal dry tropical forests to aseasonal wet tropical forests (Fig. 1 & SM Fig. 1), encompassing 50 individual plots. In total 8,725 trees were attached with dendrometers, and more than 187,000 readings were taken over 65 plot-years of data. The duration of measurement and number of observations varied across plots (See Table 1). Dendrometers were installed on a subset of adult trees (•10 cm DBH). The sample coverage and size distribution of trees with dendrometer bands varied across plots, and rarely matched the corresponding size distribution from the full plot census of all adult trees. A nonlinear height allometry was derived for each site, and used to update tree height with every dendrometer measurement (detailed in SM section 1). The biomass was estimated for each tree using allometric equation 4 from Chave et al. (2014)[41], with wood density derived from the Global Wood Density Database [42,43] for each species or regional-genus mean. The mean individual growth rate in Mg C was calculated using a dry-biomass carbon content of 47.8%. This growth rate was multiplied by the number of individuals (•10 cm DBH) in each plot when the number of trees with dendrometers was > 50% of the number of trees in the plot. We also applied the mean growth rate to all trees in the plot when 30-50% of the trees had dendrometer bands and the median DBH of trees with dendrometer bands matched the median DBH of all trees in the plot to within 5%. When measurements did not meet these criteria, but still had at least 60 individuals with dendrometer measurements - size, wood density, and estimated height were used to construct non-linear generalized additive models to predict growth for each date, which where were then used to predict total carbon accumulation for each tree in the plot that did not have a dendrometer. The resulting NPP
stem observation is the scaled forest-level
woody growth (in carbon units Mg C month-1 ha-1) estimated by summing the observed growth rates from trees with dendrometer bands, and the sum of tree level growth predictions over trees in the plot lacking dendrometer bands. The effects of stochastic tree mortality events are large upon month-to-month changes in forest biomass. Our goal was to isolate the climatic signal upon only live woody tree growth so we removed the demographic responses of carbon entering the plot from tree recruitment, and carbon leaving the plot from tree mortality. To do so, the regression growth models of each date were applied to a single fixed date census corresponding to each forest plot. Finally it is worth noting that the error from scaling the individual growth to plot-level NPP
stem are not propagated throughout subsequent analyses on the plot-
level estimates of NPPstem
. 2.2 Deriving meteorological predictors Temperature and VPD data time series for each site were derived from a gridded climate product (TerraClimate) [27]. The TerraClimate product is a statistically downscaled (~4 km) merge between the CRU TSv4.01 empirical climate interpolation [44] and the JRA-55 climate reanalysis product [45]. Meteorological time series from TerraClimate were compared with downscaled site-level meteorological predictions from local automatic weather stations and the ERA-Interim climate reanalysis product (detailed in SM section 2) [46]. The monthly meteorological estimates from TerraClimate corresponded well with the downscaled site level meteorological records for most sites (SM Section 2; SM Figs. 2 & 3) with the exception of shortwave radiation at the Borneo sites. Surface level shortwave radiation over wet tropical forest regions is not well estimated by most climate reanalysis products, so we calculated the 3-month moving mean cloud fraction using the satellite derived NOAA CDR PATMOS-X v5.3 cloud properties product [47] and the 3-month moving surface level shortwave radiation estimates from the Clouds and the Earth's Radiant Energy Budget product [48]. 2.3 Estimating the effects of meteorological drivers upon NPP
stem
We calculated the long-term monthly means (•) of monthly diurnal min/mean/max were calculated for air temperature, VPD, and shortwave radiation. We also calculated metrics of precipitation (monthly precipitation), water deficit (CWD and MCWD), a metric of the wet-dry season transition (detailed in SM Section 2). The monthly anomalies of each meteorological variable were calculated, and divided by their location specific interannual monthly standard deviation. The resulting anomaly terms are expressed in units of standard deviation (σ) from their long-term monthly mean. It is important to note that both the • and σ terms vary by month and the corresponding forest plot's location. For example, a 1 C˚ increase above the mean temperature in the month of August would be less than one unit σ at the Kenia site in the (highly seasonal) Bolivian Amazon, whereas it would be more than three units σ across all of the (relatively aseasonal) Borneo sites. Therefore both the • and σ terms have an inherent spatial context. We fit generalized linear mixed models (GLMMs) and Generalized Additive Models (GAMs) to examine how NPPstem is affected by seasonal meteorological variables and their corresponding anomalies. Several of the meteorological covariates used in the model comparison process were highly correlated, so we
Page 5 of 21
http://mc.manuscriptcentral.com/issue-ptrsb
Submitted to Phil. Trans. R. Soc. B - Issue
123456789101112131415161718192021222324252627282930313233343536373839404142434445464748495051525354555657585960
For Review Only
restricted the inclusion of terms with pairwise correlations to be <0.6 (SM Fig. 4) for the final models. GLMMs and GAMs for nonlinear effects were examined with the MGCV and rstanarm packages for R [49,50]. We found that most non-linear terms could be sufficiently represented by piecewise linear terms by separation of the monthly anomaly term into a positive or negative anomaly (e.g. see the dry and wet anomaly terms in Fig. 2). The exception to this is the shortwave anomaly term in the seasonal forest model, which most improved model performance with the usage of a penalized spline function (Fig. 2e). The intercept of each observation was allowed to vary by corresponding plot (i.e. a random intercept model). Some amount of stem shrinkage was apparent in the dendrometer band data in the dry season, but it is not straightforward to determine the amount of dendrometer band movement from negative change due to stem desiccation and positive change due to growth. Thus we opted to allow the stand-level estimates of woody NPP to be < 0. In these negative instances, carbon is not actually lost from the plot but the stems shrink due to desiccation in the dry season. The posterior predictions of NPP
stem were best modeled by a
shifted Gamma distribution (to account for negative NPPstem
) with a log link function. The final GLMMs were fit within a Bayesian framework using the rstanarm package for R [50]. Regularizing priors centered over 0 with a standard deviation of 1 were used in the model in an effort to reduce overfitting. The final models presented here were selected by comparing and joining the monthly mean and anomaly terms of each meteorological variable. The median R
2 from the posterior predictive distribution was calculated for
each site with and without the random intercept term (Table 1; SM Tables 1 & 2). We found that no single model could predict NPPstem well across all sites: a model that performed well over seasonal sites had no predictive ability over aseasonal wet forest sites that lack a discernible dry season (by convention, when rainfall < 100 mm month-1). Therefore we split the data by a precipitation seasonality metric (S) where higher values indicate greater seasonality of precipitation [51] (Table 1). We developed and tested separate candidate models for seasonal sites (S > 0.05) with a distinct dry season (SM Table 1), and aseasonal wet forest sites (S < 0.05) with no consistent dry season (SM Table 2). 2.4 Scaling to the Pantropics Our final aim was to use the wealth of GEM NPP
stem observations to develop estimates of total wood
production across the tropics and its interannual variability. The final two seasonal and aseasonal statistical models were used with the TerraClimate product and the CERES shortwave radiation product to generate spatially, time varying predictions at 0.5 degrees spatial resolution across grid cells with at least 50 km2 of tropical forest (detailed in SM Section 3). The time series of meteorological variables in the gridded TerraClimate product were truncated at the ranges from the meteorological conditions estimated across the GEM sites NPP
stem data used in the model fitting process. Because the GLMMs were constructed
in a Bayesian framework, they are inherently generative in the sense that they can be used to generate a predictive distribution of outcomes, conditional upon the observed data used to fit the models. We extracted 1000 draws from the predictive posterior distribution to propagate the uncertainty of meteorologically driven impacts upon NPPstem, and projected them onto a 0.5 degree grid, corresponding with the CRU TSv.4.01 product [44]. The 1996-2016 predictions were deseasonalized and linearly detrended to calculate the temporally moving mean anomaly of interannual NPPstem. The magnitude of the predictions were scaled downward to correspond with the near current (2016) existing amount of forest cover as determined by the Global Forest Cover product v1.4 [52]. Because we used a fixed canopy cover through time, earlier in time estimates of NPP
stem are slightly negatively biased due to the decline in
tropical forest cover over the prediction period (1996-2016). The median of the detrended predictions was projected spatially over two strong El Niño events to show the spatial distribution of meteorologically produced anomalies in NPP
stem. We compared the detrended and deseasonalized predictions of the annual
mean of tropical forest NPPstem
with the El Niño 3.4 Index [53]. 3. Results 3.1 Quantifying the individual meteorological components of drought that affect NPP
stem
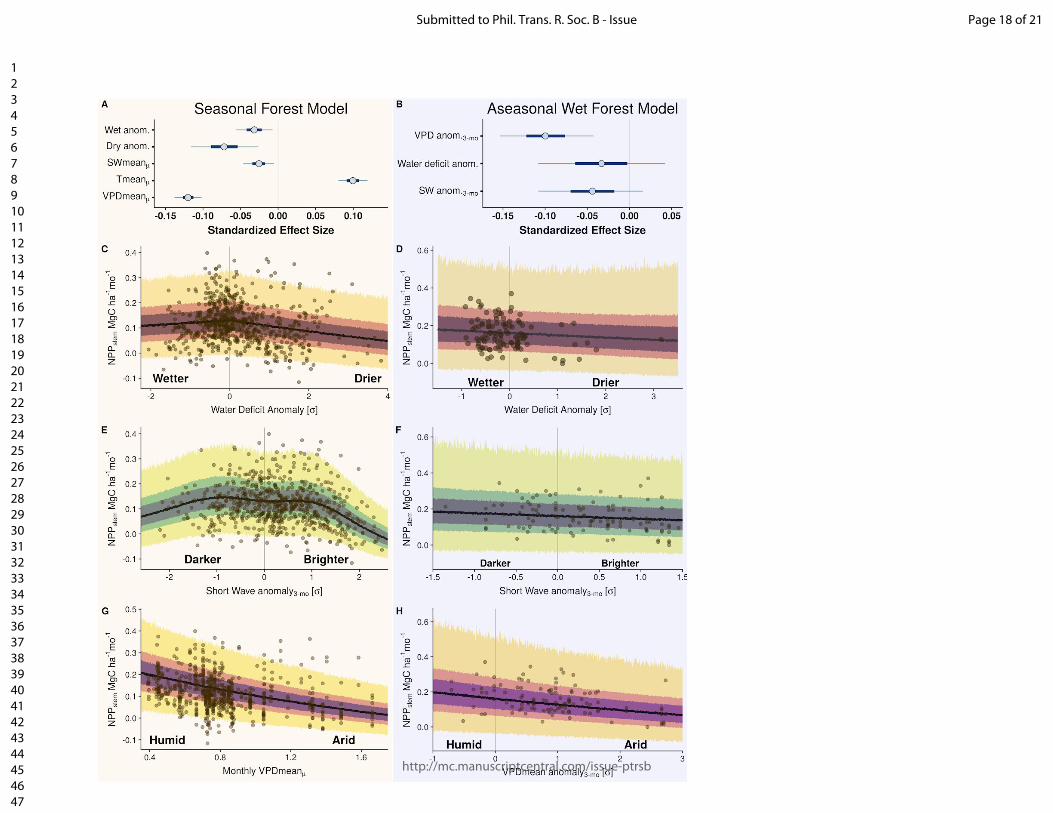
Overall, in the seasonal tropical forests the seasonal (monthly) means of vapour pressure deficit (VPDmean
•), temperature (Tmean
•), and shortwave radiation (SWmean
•) structured the seasonal variation
of NPPstem
(Fig. 2a,g). The interannual anomalies of the water deficit anomalies (Wet and Dry anom•) and
the 3-month shortwave anomaly (SW•) best explained the interannual variation of NPP
stem (Fig. 2a,c,e &
SM Table 1). In the aseasonal wet forests, by contrast, none of the mean seasonal (monthly) varying meteorological terms could predict any seasonal variation in NPP
stem (SM Table 2). Variation in NPP
stem was
better explained, with the 3-month VPDmean anomaly, and to a lesser extent the water deficit anomaly and the shortwave anomaly being the most influential factors (Fig. 2a,b,f,h & SM Table 2). Other terms such as CWD
•, CWD
•, MCWD
•, MCWD
•, and the 3-month Tmean
• were useful as individual predictors,
yet their effect size was reduced when combined with the other terms in the final models (SM Tables 1 & 2). 3.2 Overall explanatory power of the meteorologically driven model
Page 6 of 21
http://mc.manuscriptcentral.com/issue-ptrsb
Submitted to Phil. Trans. R. Soc. B - Issue
123456789101112131415161718192021222324252627282930313233343536373839404142434445464748495051525354555657585960

For Review Only
Our meteorologically driven final statistical models explained approximately 52% (35% excluding random effects) and 41% (20% excluding random effects) of NPP
stem seasonal variation for tropical seasonal forests
and aseasonal wet forests, respectively. The range in the amount of variation explained (R2) was large across sites (Table 1), but the predictive distribution of the models generally covered the observed range of NPP
stem (Fig. 2). The R2 of aseasonal wet forest sites improved the most when allowing random effects (i.e.
variation in plot-specific mean values of NPPstem
) which is due to the general lack of seasonal variation in NPP
stem. Despite the improved performance, the plot specific intercept (random effect) acts as a categorical
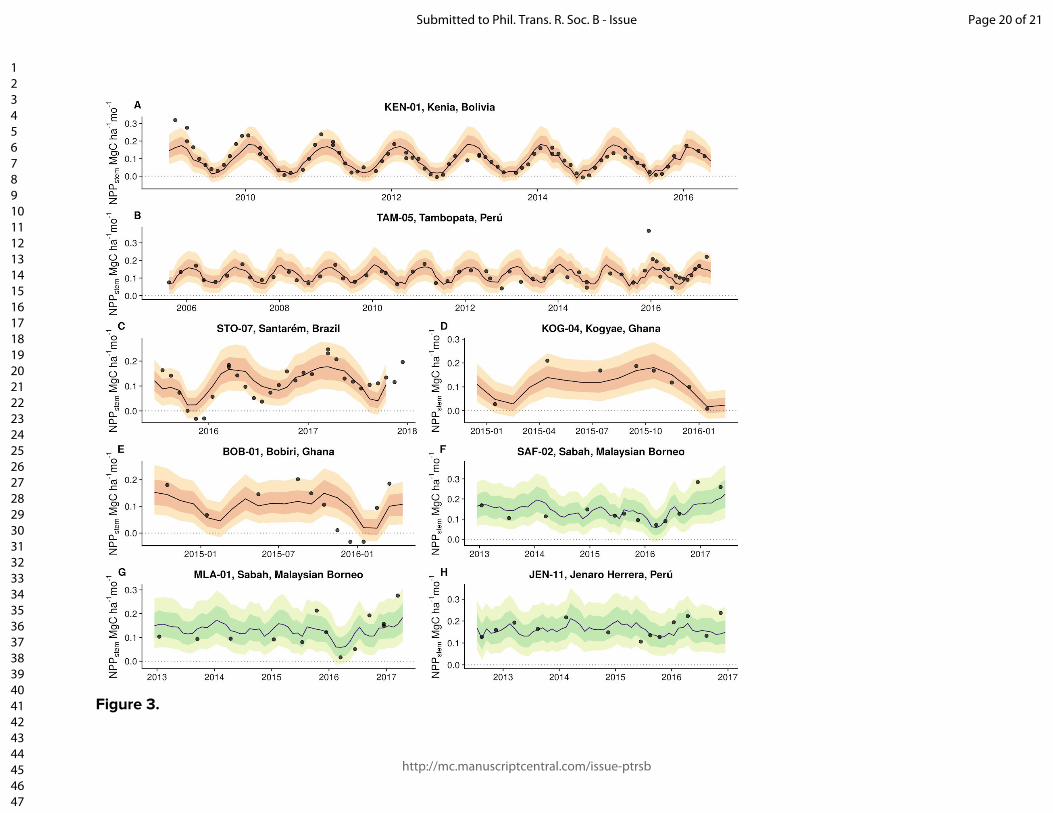
variable that cannot be applied for up-scaling the model across the tropics so we present conditional model predictions without random effects (Fig. 2c-h). A higher degree of predictive ability was found for sites with strongly pronounced dry seasons (e.g. the Kenia plots in Bolivia and the Santarém region plots in eastern Amazonia; Fig. 3a,c) while the R
2 was poorest for the more aseasonal sites (e.g. in Borneo) where
there was less seasonal variation in woody growth to explain (e.g. MLA, SAF; Table 1; Fig. 3f,g & SM Fig. 5). Despite this apparent increase in explained variation with increasing precipitation seasonality, this may be because the aseasonal wet forest model was estimated using far fewer observations (N = 110) than the seasonal forest model (N = 674). 3.3 Tropical NPPstem and its response to El Niño events Overall, our pantropical scaling estimates that the mean total annual above-ground woody production of the tropical forest biome is 2.16 Pg C yr
-1, and this varied interannually in the range 1.96-2.26 Pg C (i.e.
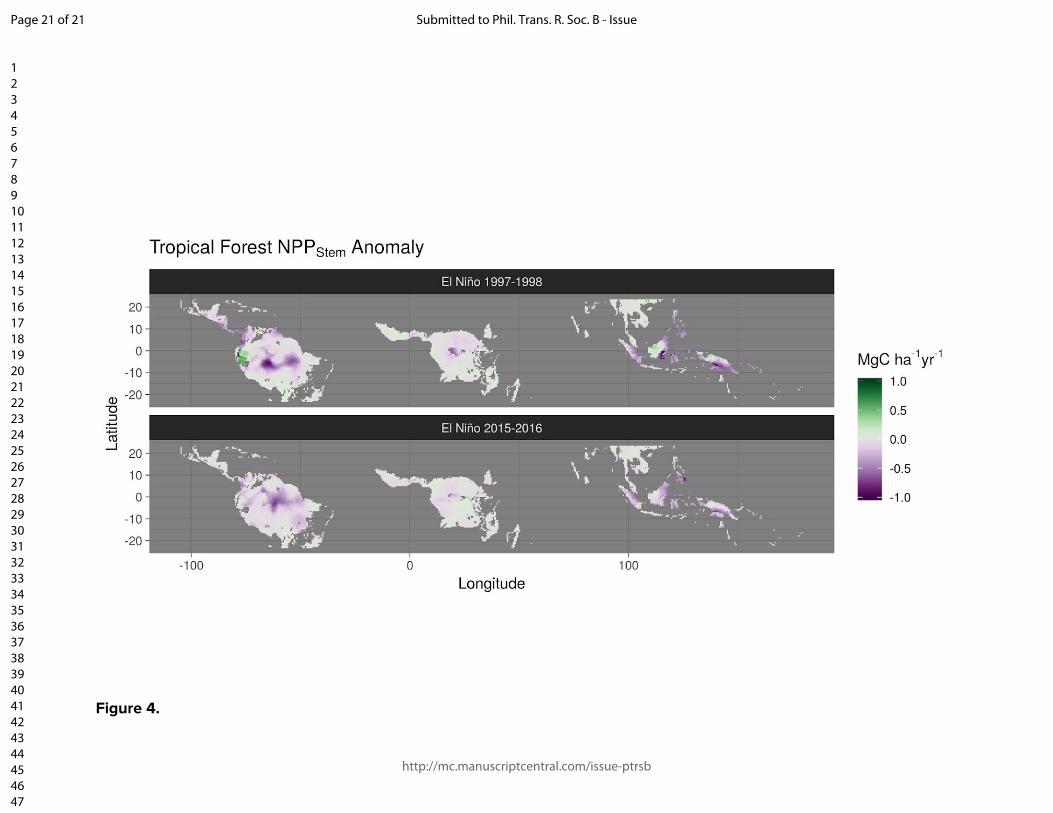
12 %) between years 1996-2016. Global minima occur during El Niño events, with Amazonia and insular Southeast Asia being the most impacted (Figs. 4 & 5). The spatial anomalies of NPP
stem are not consistent
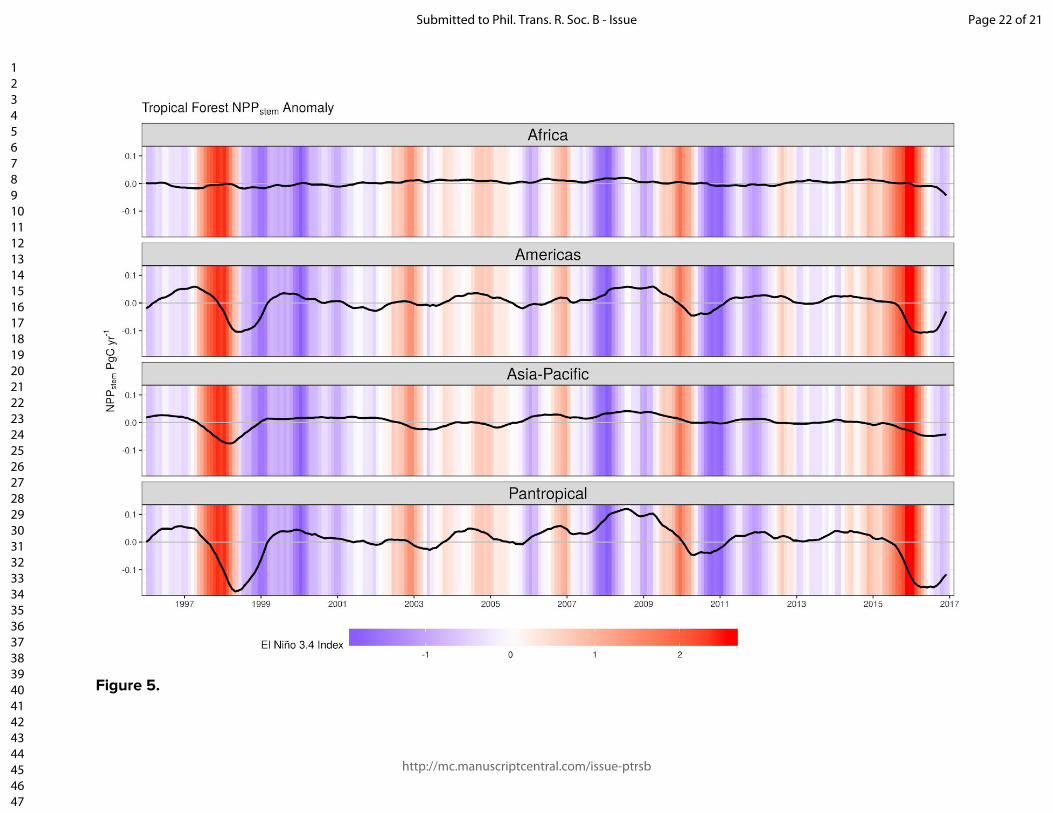
across El Niño events (Fig. 4). For example different parts of Amazonia were most strongly affected by the El Niño events in 1997/1998 and 2015/2016. Conversely the pronounced negative impact seems spatially consistent across eastern Borneo, whereas equatorial Africa may have been moderately negatively affected by the 1997/1998 El Niño but less so during the 2015/2016 event (with an important caveat that climatological products for this data-poor region are particularly unreliable). The detrended long-term prediction of the anomaly in NPP
stem is highly correlated with the moving annual
average of the El Niño 3.4 Index (r = -0.7; Fig. 5). Hence interannual variation of the total woody growth of the tropical forest biome can be at least partially predicted from the El Niño 3.4 Index. The interannual anomaly of NPP
stem is most highly correlated with the annual anomalies of VPD (r = -0.59), but also
correlates with water deficit (r = -0.51), temperature (r = -0.49) and shortwave radiation (r = -0.38). This finding is consistent with inversion modelling results that show that the carbon cycle of the terrestrial tropics is strongly correlated with tropical land surface temperatures; however, our analysis suggests that the local mechanistic drivers are more linked to water deficits, VPD and shortwave radiation than to temperature (Fig. 2a, b). 4. Discussion 4.1 How much variation in tropical NPPstem can be explained by meteorological variation? Using our statistical models, as much as 55% of monthly woody growth can be predicted for seasonal tropical forests, and 45% for aseasonal wet forests. This amount of explained variation on high temporal resolution changes in NPP
stem is not so dissimilar from the variation in forest biomass changed explained
over much longer periods of time by considerably more sophisticated forest simulation models (e.g. [54,55]). However the GLMMs presented here should not be viewed as authoritative, but rather as an initial attempt to understand and separate the effect of the long-term mean of month-to-month meteorological seasonality from interannual meteorological variation upon tropical forest woody growth. These statistical models are simplistic representations of complex biological responses. Tropical forests have to mitigate several forms of ecophysiological stress from meteorological variation and in many cases the underlying ecophysiological mechanisms of tropical forests response to drought are still not well understood [56]. So it is noteworthy that the models presented here do have predictive ability across all sites, and that this predictive ability is greater across the vast majority of tropical forest regions with rainfall seasonality (Figs. 1, 2 & 3; Table 1). There are many opportunities to improve the model. The data used to fit the model are imbalanced across sites (Table 1), with notable data limitations for the aseasonal wet tropics. By extension the uncertainty and poorer predictive performance in the aseasonal wet forest regions is likely due to data deficiency, which will in many cases improve over time. The meteorological variables used in this study are often highly correlated, which precludes the incorporation of all relevant variables into a linear predictor because standard statistical methods cannot identify effects that are highly collinear. The environmental drivers used to model here also fail to capture temporal directionality. For example, the water deficit anomaly makes no distinction whether a soil is on a trend towards drying or wetting. The representation of temperature in the model also makes no distinction between short temporal pulses, versus longer
Page 7 of 21
http://mc.manuscriptcentral.com/issue-ptrsb
Submitted to Phil. Trans. R. Soc. B - Issue
123456789101112131415161718192021222324252627282930313233343536373839404142434445464748495051525354555657585960
For Review Only
sustained warming trends where acclimation may be more likely to occur. Next, non-linear relationships are ubiquitous in plant ecophysiology. Stomatal conductance [37,38,57], photosynthesis [58], plant tissue respiration [34], hydraulic impairment [25], and soil water conductance [59] are best described by strongly non-linear relationships with their corresponding environmental drivers. Yet here we attempt to model an emergent property of tropical forests (stand level NPP
stem) with two GLMMs, which are more effective at
capturing the mean field relationships than they are at predicting the extremes. We acknowledge that modeling NPP
stem from a linear set of meteorological predictors may be biologically unrealistic and
limiting. Future attempts to model the impact of environmental extremes on NPPstem
may be much improved by joining mathematical models of plant ecophysiological components into a more process based statistical hybrid model. 4.2 What meteorological drivers most affect NPP
stem during El Niño associated drought events?
We can only make cautiously qualified statements about the most important meteorological drivers affecting growth because this question is hindered by both uncertainty in the true meteorological conditions, and by insufficient data at both ends of the extremes of a meteorological variable (e.g. where observations are needed during both anomalously wet and anomalously dry conditions). The effects of VPD are consistent and large across both the seasonal and aseasonal wet tropics, but in different ways. In the seasonal forest model, the effect of VPD only has explanatory power in the seasonal component, while the interannual anomaly does not appear to be important. Conversely in the aseasonal wet tropics, VPD has no effect upon the seasonal component (as variation is low in the aseasonal tropics; SM Fig. 6), but has a large effect in the interannual anomaly term (Fig. 2b & 2h). The impediment of VPD upon NPP
stem is
consistent with stomatal conductance models where VPD incurs a non-linear stomatal limitation which restricts CO
2 assimilation rates [36,38]. The inability of the seasonal forest model to isolate a consistent VPD
anomaly effect could be due to the fact that the monthly range of VPD is far larger in seasonal forest sites (SM Fig. 6), and that the dry season anomalies would have to be very large in absolute units of kPa to significantly impact stomatal conductance, because the VPD reduction on stomata closure may have largely already been exerted (a visual diagram is shown in SM Fig. 7). Both the seasonal forest and aseasonal wet forest models indicate that the effect of VPD (either seasonal or anomaly) is especially compounded with anomalies in short wave radiation. Although the effect of a short wave anomaly effect seems important across tropical forests, it appears to reduce NPP
stem far more in
seasonal forests than it does for aseasonal wet forests. Some caution is warranted with respect to ranking of the effects of the VPD, water deficit, and shortwave anomalies because these are correlated, and their relative importance could change with prediction error from the gridded climate products. Also despite not presenting an effect of temperature anomalies, the long-term increase in air temperature is increasing VPD and may also be pushing tree communities above their normal acclimated optimum temperatures for photosynthesis [31–33]. In combination, an El Niño event that reduces rainfall and increases VPD, temperature and shortwave radiation will likely work in conjunction to limit transpiration, increase leaf temperatures, and by extension reduce photosynthesis [33]. It is noteworthy that there is little evidence that positive shortwave anomalies increase NPP
stem, as would perhaps been expected in aseasonal forests
[60,61]. The effect of soil water deficit is negative upon woody growth, but this effect is less identifiable in the aseasonal wet tropics where soil water deficit seldom deviates from zero. CWD and MCWD have been highly effective metrics of water deficit in previous studies [11,62], but here we found TerraClimate's water deficit estimates to offer greater predictive ability than (M)CWD. The Thornthwaite-Mather water balance model used to produce the water deficit estimates in the TerraClimate product may be more effective than our calculation of (M)CWD because its calculation of water deficit includes information on soil water holding capacity and infiltration, and calculates a runoff term. However all metrics of water deficit are likely hindered by both uncertainty in rainfall estimates, and the current state of high uncertainty around how tropical forest vary their rates of evapotranspiration both seasonally and interannually [63]. 4.3 How much do El Niño events suppress tropical woody growth and what can this tell us about how tropical forests are likely to respond to climate change? The pantropical model predicts pronounced declines in global tropical forest NPP
stem over two strong El
Niño events (8.3% in 1997/1998, and 9% in 2015/2016). The impacts were largest in the Americas (Fig. 5) highlighting the importance of Amazonia in dominating the global signal because it accounts for around half of total tropical forest area and is adjacent to the eastern Pacific warm anomaly during El Niño events. Insular SE Asia also has a substantial influence on the global anomaly, but Africa appears to have a negligible role as El Niño signals are weaker and less consistent there. The meteorological teleconnections caused by El Niño events are not spatially consistent across events [64]. Similar to other findings that have correlated tropical air temperatures and El Niño indices to atmospheric CO
2 growth rates [65,66], we have
Page 8 of 21
http://mc.manuscriptcentral.com/issue-ptrsb
Submitted to Phil. Trans. R. Soc. B - Issue
123456789101112131415161718192021222324252627282930313233343536373839404142434445464748495051525354555657585960
For Review Only
demonstrated that the variability of total woody production of the tropics can be well-predicted from the ENSO 3.4 index. We should note that our study period does not include a major stratospheric aerosol volcanic eruption, the last major one of which being that of Mt. Pinatubo in 1991, and some models suggest that such eruptions alter vegetation productivity through increasing diffuse light [67] (not tested as meteorological predictor in our analysis) which could weaken the correlation with ENSO. While NPP
stem is
not necessarily a good proxy for overall gross primary productivity or net ecosystem exchange, as there are likely to be concurrent shifts in plant respiration and carbon allocation [7], a depression in NPP
stem still
probably indicates ecophysiological stress imposed upon the ecosystem [11]. Our analysis is driven by growth responses to seasonal variation and interannual anomalies, whereas growth responses to short term variation in VPD and temperature may not be the same as long-term growth responses to secular shifts in these meteorological variables. It is possible that ecosystems acclimate to longer term shifts (either through within-individual acclimation within limits, or on longer timescales through turnover in community dominance). Our analysis also does not consider changes in demography, so shifts in either recruitment or mortality could either act to counterbalance or exacerbate the magnitude of our predictions. Finally additional environmental variables come into play, in particular the secular increase in atmospheric CO2, which may boost productivity and increase water use efficiency. Nevertheless, our analysis does highlight the potentially important role of increasing temperatures and VPD. Changes in atmospheric water demand may be more important than changes in seasonal water supply in driving ecosystem water stress in the aseasonal wet tropics, and deserve more analytical attention. It is worth noting that the peak temperatures and VPDs experienced during the 2015/6 El Niño were higher than for the 1997/8 El Niño (SM Fig. 8), because of the long-term warming trend between these events. The baseline upon which each anomaly sits is consistently shifting towards a hotter, higher VPD atmosphere, pushing ecosystems into new climate space. Moving forward, the predictions here need to be challenged so we encourage collection and development of similar seasonally monitored dendrometer band datasets that can be applied to the same stem-to-stand scaling techniques used here. It should also be possible to draw on a wide set of dendrometer data collected by unconnected studies (some in the grey literature) to improve the span of the dataset. Because these predictions deal with a specific component of ecosystem carbon, few empirical measures are available to test our model predictions. Ecosystem models still struggle to simulate realistic ecophysiological impacts from drought [68], while they also have vastly different approaches to carbon allocation that may produce unrealistic predictions [3,69–71]. Earth System Models typically represent the entirety of the tropical forest biome with a very few plant functional types. Our analysis highlights a key difference between seasonal and aseasonal wet forests in the underlying meteorological drivers that suppress woody growth during drought events. This message is consistent with Guan et al., (2015) [72] who highlighted different phenological and photosynthetic responses between tropical forests receiving more or less than 2000 mm yr
-1 in precipitation, suggesting an important functional ecotone in the tropical
forest biomes. The "empirical upscaling" spatiotemporal products developed from applying ensembles of machine learning models to global FluxNet data [73] have served as a benchmark of sorts to ecosystem models in recent years. However comparison to our NPP
stem predictions may not be straightforward
because NPPstem
is a poor proxy for both GPP and total NPP in the wet tropics [3,7,16], and there are very few eddy covariance time series in the tropics outside of Brazil. Thus we reiterate the need for more collection of seasonally monitored tropical forest NPP
stem data, because the causal attribution of what drives
variability in carbon allocation is still an emerging science. A logical next step is also to expand this analysis to other components of NPP and respiration, and thereby to total NPP and carbon balance. This will be the focus of our forthcoming analyses.
Additional Information
Acknowledgments
This paper is a product of the Global Ecosystems Monitoring (GEM) network (gem.tropicalforests.ox.ac.uk). We are grateful to the many individuals who contributed and collected measurements to make this work possible. We acknowledge Paulo Brando for dendrometer data from Tanguro. In Gabon we acknowledge Natacha N’ssi Bengone, Josue Edzang Ndong, Carl Ditoughou, Edmond Dimoto, Leandre Oyeni Amoni, JT Dikangadissi, Joachim Dibakou, Napo Heiddy Milamizokou, Amede Pacome Dimbonda, Arthur Dibambou. We are grateful to the Gabonese Government (Agence Nationale des Parcs Nationaux (ANPN) and Centre National de la Recherche Scientifique et Technologique) for research authorisations and to ANPN for hosting the study. Establishment and monitoring of plots in Gabon was supported by core funding from the University of Stirling and the Gabon National Parks Agency (ANPN) and work on the GEM plots project was authorised under research permit XXX. In Malaysia we acknowledge Rostin Jantan, Rohid Kailoh, Suhaini Patik, SAFE Project staff. Dr. Noreen Majalap, Professor Charles Vairappan, the Maliau Basin and Danum Valley Management Committees, Sabah Foundation, Sabah Biodiversity Centre, Sabah
Page 9 of 21
http://mc.manuscriptcentral.com/issue-ptrsb
Submitted to Phil. Trans. R. Soc. B - Issue
123456789101112131415161718192021222324252627282930313233343536373839404142434445464748495051525354555657585960
For Review Only
Forestry Department and Forest Research Centre, Benta Wawasan and the Royal Society South East Asia Rainforest Research Partnership for logistical support and permission to carry out research in the sites. In Ghana we acknowledge Emmanuel Amponsah Manu, Gloria D. Djagbletey, Akwasi Duah-Gyamfi, Emmanuel Amponsah Manu, Gloria D. Djagbletey. We would like to thank the Large Scale Biosphere-Atmosphere Program (LBA) for logistical and infrastructure support during field measurements. We are deeply grateful to our parabotanists Nelson Rosa and Jair Freitas, as well as our field and laboratory assistants: Gilson Oliveira, Josué Oliveira, Renílson Freitas, Marcos Oliveira and Josiane Oliveira. We are also grateful for the methodological advice of Sihan Li and Christopher Wilson.
Data Accessibility
Stand-level NPPstem
used in this study will be uploaded as supplemental material. Authors' Contributions
S.W. Rifai, C.A.J, Girardin, and Y. Malhi designed the study. S.W.R. conducted the analyses, and wrote the manuscript with input from Y.M, and C.A.J.G. C.A.J. Girardin, E. Berenguer, J. del Aguila Pasquel, C.A.L. Dahlsjö, C.E. Doughty, K.J. Jeffery, S. Moore, I. Oliveras, T. Riutta, L.M. Rowland, C. Burton, and D.B. Metcalfe contributed to the conception and design, implementation of the plots, and acquisition of data for this study. A. Araujo Murakami, P. Brando, S.D. Addo-Danso, F. Evouna Ondo, A. Duah-Gyamfi, F. Farfán Amézquita, R. Freitag, F. Hancco Pacha, W. Huaraca Huasco, F. Ibrahim, A.T. Mbou, V. Mihindou Mihindou, K.S. Peixoto, W. Rocha, L.C. Rossi, M. Seixas, J.E. Silva-Espejo, S. Adu-Bredu are researchers in Peru, Brazil, Ghana, and Gabon provided substantial contribution to the acquisition of data. K.A. Abernethy, J. Barlow, A.C.L. da Costa, J. Ferreira, T. Gardner, B.S. Marimon, B.H. Marion-Junior, P. Meir, and L.J.T. White are Co-Investigators who helped establish the long-term forestry inventory plots used in our study. These authors provided substantial contribution to the acquisition of data. Y. Malhi founded the Global Ecosystems Monitoring network that is the basis for this study, and is the Principal Investigator of this study. Competing Interests
S.W.R., C.A.J.G, C.B., C.A.L.D., E.B., I.O., T.R., and W.H.H. have either ongoing professional relationships or collaborations with L.E.O.C.A., L.R and Y.M., who are guest editors of this issue. Funding
This work was primarily supported by UK Natural Environment Research Council Grant NE/P001092/1 and a European Research Council Advanced Investigator Award (GEM-TRAIT, # 321131) to Y.M, and a grant from The Nature Conservancy-Oxford Martin School Climate Partnership supporting S.W.R. It also heavily utilizes previous data collection funded by NERC (NE/I014705/1 for African sites, NE/K016369/1 for Asian sites, NE/F005776/1, NE/K016385/1, NE/J011002/1 for Amazonian sites), by CNPq (CNPQ grant 457914/2013-0/MCTI/ CNPq/FNDCT/LBA/ESECAFLOR) and support for the Amazonian sites from the Gordon and Betty Moore Foundation, and for the Asian sites from the Sime Darby Foundation. The site in Nova Xavantina, Brazil was funded by grants from Project PELD-CNPq (403725/2012-7; 441244/2016-5); CNPq/PPBio (457602/2012-0); productivity grants (PQ-2) to B. H. Marimon-Junior and B. S. Marimon; Project USA-NAS/PEER (#PGA-2000005316) and Project ReFlor FAPEMAT 0589267/2016. The sites in Santarém, Brazil have been supported by Instituto Nacional de Ciência e Tecnologia – Biodiversidade e Uso da Terra na Amazônia (CNPq 574008/2008-0), Empresa Brasileira de Pesquisa Agropecuária – Embrapa (SEG: 02.08.06.005.00), the European Research Council (H2020-MSCA-RISE-2015 - Project 691053-ODYSSEA), the UK government Darwin Initiative (17-023), The Nature Conservancy, and the UK Natural Environment Research Council (NERC; NE/F01614X/1, NE/G000816/1, NE/K016431/1, and NE/P004512/1). Y.M is also supported by the Jackson Foundation.
References 1. Field CB, Behrenfeld MJ, Randerson JT, Falkowski P. 1998 Primary Production of the Biosphere: Integrating Terrestrial and Oceanic Components. Science 281, 237–240. (doi:10.1126/science.281.5374.237) 2. Anderson-Teixeira KJ, Wang MMH, McGarvey JC, LeBauer DS. 2016 Carbon dynamics of mature and regrowth tropical forests derived from a pantropical database (TropForC-db). Glob Change Biol , n/a-n/a. (doi:10.1111/gcb.13226) 3. Malhi Y, Doughty C, Galbraith D. 2011 The allocation of ecosystem net primary productivity in tropical forests. Phil. Trans. R. Soc. B 366, 3225–3245. (doi:10.1098/rstb.2011.0062) 4. Kho Lip Khoon, Malhi Yadvinder, Tan Sylvester Kheng San. 2013 Annual budget and seasonal variation of aboveground and belowground net primary productivity in a lowland dipterocarp forest in Borneo. Journal of Geophysical Research: Biogeosciences 118, 1282–1296. (doi:10.1002/jgrg.20109)
Page 10 of 21
http://mc.manuscriptcentral.com/issue-ptrsb
Submitted to Phil. Trans. R. Soc. B - Issue
123456789101112131415161718192021222324252627282930313233343536373839404142434445464748495051525354555657585960
For Review Only
5. Moore S et al. 2018 Forest biomass, productivity and carbon cycling along a rainfall gradient in West Africa. Global Change Biology 24, e496–e510. (doi:10.1111/gcb.13907) 6. Riutta T et al. In press. Logging disturbance shifts net primary productivity and its allocation in Bornean tropical forests. Global Change Biology 0. (doi:10.1111/gcb.14068) 7. Malhi Y et al. 2015 The linkages between photosynthesis, productivity, growth and biomass in lowland Amazonian forests. Global Change Biology 21, 2283–2295. (doi:10.1111/gcb.12859) 8. Clark DB, Clark DA, Oberbauer SF. 2010 Annual wood production in a tropical rain forest in NE Costa Rica linked to climatic variation but not to increasing CO2. Global Change Biology 16, 747–759. (doi:10.1111/j.1365-2486.2009.02004.x) 9. Clark DA, Clark DB, Oberbauer SF. 2013 Field-quantified responses of tropical rainforest aboveground productivity to increasing CO 2 and climatic stress, 1997-2009: TROPICAL RAINFOREST PRODUCTIVITY RESPONSES. Journal of Geophysical Research: Biogeosciences 118, 783–794. (doi:10.1002/jgrg.20067) 10. Rowland L, Malhi Y, Silva-Espejo JE, Farfán-Amézquita F, Halladay K, Doughty CE, Meir P, Phillips OL. 2014 The sensitivity of wood production to seasonal and interannual variations in climate in a lowland Amazonian rainforest. Oecologia 174, 295–306. (doi:10.1007/s00442-013-2766-9) 11. Doughty CE et al. 2015 Drought impact on forest carbon dynamics and fluxes in Amazonia. Nature 519, 78–82. (doi:10.1038/nature14213) 12. Chambers Jeffrey Q. et al. 2004 Respiration from a tropical forest ecosystem: partitioning of sources and low carbon use efficiency. Ecological Applications 14, 72–88. (doi:10.1890/01-6012) 13. Meir P, Metcalfe DB, Costa ACL, Fisher RA. 2008 The fate of assimilated carbon during drought: impacts on respiration in Amazon rainforests. Philosophical Transactions of the Royal Society B: Biological Sciences 363, 1849–1855. (doi:10.1098/rstb.2007.0021) 14. Doughty CE et al. 2018 What controls variation in carbon use efficiency among Amazonian tropical forests? Biotropica 50, 16–25. (doi:10.1111/btp.12504) 15. Farrior CE, Dybzinski R, Levin SA, Pacala SW. 2013 Competition for Water and Light in Closed-Canopy Forests: A Tractable Model of Carbon Allocation with Implications for Carbon Sinks. The American Naturalist 181, 314–330. (doi:10.1086/669153) 16. Doughty Christopher E. et al. 2014 Allocation trade‐offs dominate the response of tropical forest growth to seasonal and interannual drought. Ecology 95, 2192–2201. (doi:10.1890/13-1507.1) 17. Girardin Cécile A. J. et al. 2016 Seasonal trends of Amazonian rainforest phenology, net primary productivity, and carbon allocation. Global Biogeochemical Cycles 30, 700–715. (doi:10.1002/2015GB005270) 18. Körner C. 2015 Paradigm shift in plant growth control. Current Opinion in Plant Biology 25, 107–114. (doi:10.1016/j.pbi.2015.05.003) 19. Doughty Christopher E. et al. 2015 Source and sink carbon dynamics and carbon allocation in the Amazon basin. Global Biogeochemical Cycles 29, 645–655. (doi:10.1002/2014GB005028) 20. Purves D, Pacala S. 2008 Predictive Models of Forest Dynamics. Science 320, 1452–1453. (doi:10.1126/science.1155359) 21. Shenkin A, Bolker B, Peña-Claros M, Licona JC, Ascarrunz N, Putz FE. In press. Interactive Effects of Tree Size, Crown Exposure, and Logging on Drought-induced Mortality. PHILOSOPHICAL TRANSACTIONS OF THE ROYAL SOCIETY B-BIOLOGICAL SCIENCES in review. 22. Brodribb Tim J., Bowman David J. M. S., Nichols Scott, Delzon Sylvain, Burlett Regis. 2010 Xylem function and growth rate interact to determine recovery rates after exposure to extreme water deficit. New Phytologist 188, 533–542. (doi:10.1111/j.1469-8137.2010.03393.x) 23. Malhi Y, Wright J. 2004 Spatial patterns and recent trends in the climate of tropical rainforest regions. Philosophical Transactions of the Royal Society B: Biological Sciences 359, 311–329. (doi:10.1098/rstb.2003.1433)
Page 11 of 21
http://mc.manuscriptcentral.com/issue-ptrsb
Submitted to Phil. Trans. R. Soc. B - Issue
123456789101112131415161718192021222324252627282930313233343536373839404142434445464748495051525354555657585960
For Review Only
24. Markewitz Daniel, Devine Scott, Davidson Eric A., Brando Paulo, Nepstad Daniel C. 2010 Soil moisture depletion under simulated drought in the Amazon: impacts on deep root uptake. New Phytologist 187, 592–607. (doi:10.1111/j.1469-8137.2010.03391.x) 25. M T Tyree, Sperry and JS. 1989 Vulnerability of Xylem to Cavitation and Embolism. Annual Review of Plant Physiology and Plant Molecular Biology 40, 19–36. (doi:10.1146/annurev.pp.40.060189.000315) 26. Brando PM, Nepstad DC, Davidson EA, Trumbore SE, Ray D, Camargo P. 2008 Drought effects on litterfall, wood production and belowground carbon cycling in an Amazon forest: results of a throughfall reduction experiment. Philosophical Transactions of the Royal Society B: Biological Sciences 363, 1839–1848. (doi:10.1098/rstb.2007.0031) 27. Abatzoglou JT, Dobrowski SZ, Parks SA, Hegewisch KC. 2018 TerraClimate, a high-resolution global dataset of monthly climate and climatic water balance from 1958–2015. Scientific Data 5, 170191. (doi:10.1038/sdata.2017.191) 28. Aragão LEOC, Malhi Y, Roman-Cuesta RM, Saatchi S, Anderson LO, Shimabukuro YE. 2007 Spatial patterns and fire response of recent Amazonian droughts. Geophys. Res. Lett. 34, L07701. (doi:10.1029/2006GL028946) 29. Malhi Yadvinder et al. 2016 The variation of productivity and its allocation along a tropical elevation gradient: a whole carbon budget perspective. New Phytologist 214, 1019–1032. (doi:10.1111/nph.14189) 30. Wright SJ, Calderón O. 2006 Seasonal, El Niño and longer term changes in flower and seed production in a moist tropical forest. Ecology Letters 9, 35–44. (doi:10.1111/j.1461-0248.2005.00851.x) 31. Doughty CE, Goulden ML. 2008 Are tropical forests near a high temperature threshold?: TEMPERATURE EFFECTS ON TROPICAL FORESTS. Journal of Geophysical Research: Biogeosciences 113, n/a-n/a. (doi:10.1029/2007JG000632) 32. Clark DA. 2004 Sources or sinks? The responses of tropical forests to current and future climate and atmospheric composition. Philosophical Transactions of the Royal Society B: Biological Sciences 359, 477–491. (doi:10.1098/rstb.2003.1426) 33. Slot Martijn, Winter Klaus. 2017 In situ temperature response of photosynthesis of 42 tree and liana species in the canopy of two Panamanian lowland tropical forests with contrasting rainfall regimes. New Phytologist 214, 1103–1117. (doi:10.1111/nph.14469) 34. Tjoelker MG, Oleksyn J, Reich PB. 2001 Modelling respiration of vegetation: evidence for a general temperature-dependent Q10. Global Change Biology 7, 223–230. (doi:10.1046/j.1365-2486.2001.00397.x) 35. Pau S, Detto M, Kim Y, Still CJ. 2018 Tropical forest temperature thresholds for gross primary productivity. Ecosphere 9, e02311. (doi:10.1002/ecs2.2311) 36. Jarvis PG. 1976 The interpretation of the variations in leaf water potential and stomatal conductance found in canopies in the field. Phil. Trans. R. Soc. Lond. B 273, 593–610. (doi:10.1098/rstb.1976.0035) 37. Leuning R. 1995 A critical appraisal of a combined stomatal-photosynthesis model for C3 plants. Plant, Cell and Environment 18, 339–355. (doi:10.1111/j.1365-3040.1995.tb00370.x) 38. Medlyn BE et al. 2011 Reconciling the optimal and empirical approaches to modelling stomatal conductance. Global Change Biology 17, 2134–2144. (doi:10.1111/j.1365-2486.2010.02375.x) 39. Sulman BN, Roman DT, Yi K, Wang L, Phillips RP, Novick KA. 2016 High atmospheric demand for water can limit forest carbon uptake and transpiration as severely as dry soil. Geophysical Research Letters 43, 9686–9695. (doi:10.1002/2016GL069416) 40. Aragão LEOC et al. 2009 Above- and below-ground net primary productivity across ten Amazonian forests on contrasting soils. Biogeosciences 6, 2759–2778. (doi:10.5194/bg-6-2759-2009) 41. Chave J et al. 2014 Improved allometric models to estimate the aboveground biomass of tropical trees. Glob Change Biol 20, 3177–3190. (doi:10.1111/gcb.12629) 42. Zanne AE et al. 2009 Data from: Towards a worldwide wood economics spectrum. (doi:10.5061/dryad.234)
Page 12 of 21
http://mc.manuscriptcentral.com/issue-ptrsb
Submitted to Phil. Trans. R. Soc. B - Issue
123456789101112131415161718192021222324252627282930313233343536373839404142434445464748495051525354555657585960
For Review Only
43. Chave J, Coomes D, Jansen S, Lewis SL, Swenson NG, Zanne AE. 2009 Towards a worldwide wood economics spectrum. Ecology Letters 12, 351–366. (doi:10.1111/j.1461-0248.2009.01285.x) 44. Harris I, Jones PD, Osborn TJ, Lister DH. 2014 Updated high-resolution grids of monthly climatic observations - the CRU TS3.10 Dataset: UPDATED HIGH-RESOLUTION GRIDS OF MONTHLY CLIMATIC OBSERVATIONS. International Journal of Climatology 34, 623–642. (doi:10.1002/joc.3711) 45. Kobayashi S et al. 2015 The JRA-55 Reanalysis: General Specifications and Basic Characteristics. Journal of the Meteorological Society of Japan. Ser. II 93, 5–48. (doi:10.2151/jmsj.2015-001) 46. Dee D. P. et al. 2011 The ERA‐Interim reanalysis: configuration and performance of the data assimilation system. Quarterly Journal of the Royal Meteorological Society 137, 553–597. (doi:10.1002/qj.828) 47. Heidinger AK, Foster MJ, Walther A, Zhao X, NOAA CDR Program. 2014 NOAA Climate Data Record (CDR) of Cloud Properties from AVHRR Pathfinder Atmospheres - Extended (PATMOS-x), Version 5.3. (doi:10.7289/V5348HCK) 48. Loeb N. 2017 CERES Level 3B EBAF-Surface Terra+Aqua netCDF file - Edition 4.0. (doi:10.5067/Terra+Aqua/CERES/EBAF-SURFACE_L3B004.0) 49. Wood SN. 2011 Fast stable restricted maximum likelihood and marginal likelihood estimation of semiparametric generalized linear models. Journal of the Royal Statistical Society (B) 73, 3–36. 50. Stan Development Team. 2017 RStanArm: Bayesian applied regression modeling via Stan. See http://mc-stan.org. 51. Feng X, Porporato A, Rodriguez-Iturbe I. 2013 Changes in rainfall seasonality in the tropics. Nature Climate Change 3, 811–815. (doi:10.1038/nclimate1907) 52. Hansen MC et al. 2013 High-Resolution Global Maps of 21st-Century Forest Cover Change. Science 342, 850–853. (doi:10.1126/science.1244693) 53. Rayner NA. 2003 Global analyses of sea surface temperature, sea ice, and night marine air temperature since the late nineteenth century. Journal of Geophysical Research 108. (doi:10.1029/2002JD002670) 54. Fyllas NM et al. 2014 Analysing Amazonian forest productivity using a new individual and trait-based model (TFS v.1). Geoscientific Model Development 7, 1251–1269. (doi:10.5194/gmd-7-1251-2014) 55. Holm JA, Van Bloem SJ, Larocque GR, Shugart HH. 2017 Shifts in biomass and productivity for a subtropical dry forest in response to simulated elevated hurricane disturbances. Environmental Research Letters 12, 025007. (doi:10.1088/1748-9326/aa583c) 56. McDowell NG. 2018 Deriving pattern from complexity in the processes underlying tropical forest drought impacts. New Phytologist 219, 841–844. (doi:10.1111/nph.15341) 57. Wolf A, Anderegg WRL, Pacala SW. 2016 Optimal stomatal behavior with competition for water and risk of hydraulic impairment. PNAS 113, E7222–E7230. (doi:10.1073/pnas.1615144113) 58. Farquhar GD, Caemmerer S von, Berry JA. 1980 A biochemical model of photosynthetic CO<Subscript>2</Subscript> assimilation in leaves of C<Subscript>3</Subscript> species. Planta 149, 78–90. (doi:10.1007/BF00386231) 59. van Genuchten MT. 1980 A Closed-form Equation for Predicting the Hydraulic Conductivity of Unsaturated Soils1. Soil Science Society of America Journal 44, 892. (doi:10.2136/sssaj1980.03615995004400050002x) 60. Nemani RR. 2003 Climate-Driven Increases in Global Terrestrial Net Primary Production from 1982 to 1999. Science 300, 1560–1563. (doi:10.1126/science.1082750) 61. Graham EA, Mulkey SS, Kitajima K, Phillips NG, Wright SJ. 2003 Cloud cover limits net CO2 uptake and growth of a rainforest tree during tropical rainy seasons. Proceedings of the National Academy of Sciences 100, 572–576. (doi:10.1073/pnas.0133045100) 62. Phillips OL et al. 2009 Drought Sensitivity of the Amazon Rainforest. Science 323, 1344–1347. (doi:10.1126/science.1164033)
Page 13 of 21
http://mc.manuscriptcentral.com/issue-ptrsb
Submitted to Phil. Trans. R. Soc. B - Issue
123456789101112131415161718192021222324252627282930313233343536373839404142434445464748495051525354555657585960
For Review Only
63. Fisher JB et al. 2009 The land–atmosphere water flux in the tropics: THE LAND–ATMOSPHERE WATER FLUX IN THE TROPICS. Global Change Biology 15, 2694–2714. (doi:10.1111/j.1365-2486.2008.01813.x) 64. Diaz Henry F., Hoerling Martin P., Eischeid Jon K. 2002 ENSO variability, teleconnections and climate change. International Journal of Climatology 21, 1845–1862. (doi:10.1002/joc.631) 65. Wang W et al. 2013 Variations in atmospheric CO2 growth rates coupled with tropical temperature. PNAS 110, 13061–13066. (doi:10.1073/pnas.1219683110) 66. Betts RA, Jones CD, Knight JR, Keeling RF, Kennedy JJ. 2016 El Niño and a record CO2 rise. Nature Climate Change 6, 806–810. (doi:10.1038/nclimate3063) 67. Mercado LM, Bellouin N, Sitch S, Boucher O, Huntingford C, Wild M, Cox PM. 2009 Impact of changes in diffuse radiation on the global land carbon sink. Nature 458, 1014–1017. (doi:10.1038/nature07949) 68. Powell Thomas L. et al. 2013 Confronting model predictions of carbon fluxes with measurements of Amazon forests subjected to experimental drought. New Phytologist 200, 350–365. (doi:10.1111/nph.12390) 69. Galbraith D et al. 2013 Residence times of woody biomass in tropical forests. Plant Ecology & Diversity 6, 139–157. (doi:10.1080/17550874.2013.770578) 70. Franklin O, Johansson J, Dewar RC, Dieckmann U, McMurtrie RE, Brännström Å, Dybzinski R. 2012 Modeling carbon allocation in trees: a search for principles. Tree Physiol 32, 648–666. (doi:10.1093/treephys/tpr138) 71. De Kauwe MG et al. 2014 Where does the carbon go? A model-data intercomparison of vegetation carbon allocation and turnover processes at two temperate forest free-air CO 2 enrichment sites. New Phytologist 203, 883–899. (doi:10.1111/nph.12847) 72. Guan K et al. 2015 Photosynthetic seasonality of global tropical forests constrained by hydroclimate. Nature Geoscience 8, 284–289. (doi:10.1038/ngeo2382) 73. Jung M, Reichstein M, Bondeau A. 2009 Towards global empirical upscaling of FLUXNET eddy covariance observations: validation of a model tree ensemble approach using a biosphere model. Biogeosciences 6, 2001–2013. (doi:10.5194/bg-6-2001-2009)
Page 14 of 21
http://mc.manuscriptcentral.com/issue-ptrsb
Submitted to Phil. Trans. R. Soc. B - Issue
123456789101112131415161718192021222324252627282930313233343536373839404142434445464748495051525354555657585960
For Review Only
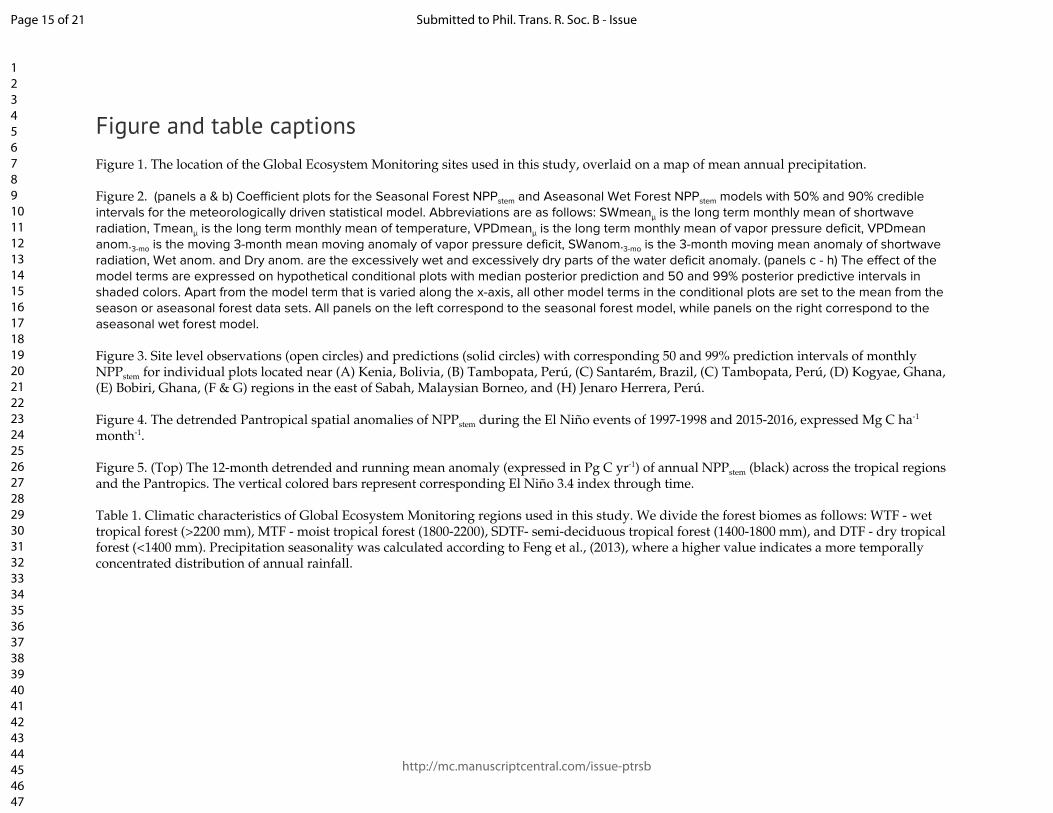
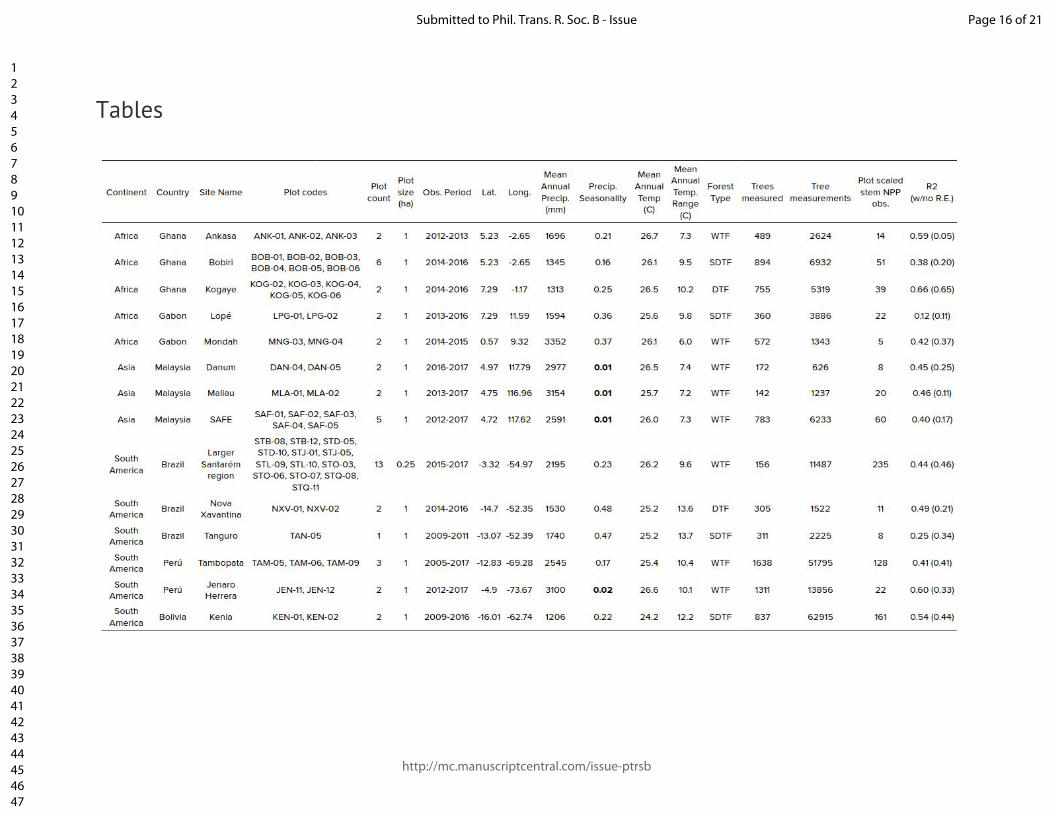
Figure and table captions Figure 1. The location of the Global Ecosystem Monitoring sites used in this study, overlaid on a map of mean annual precipitation. Figure 2. (panels a & b) Coefficient plots for the Seasonal Forest NPPstem and Aseasonal Wet Forest NPPstem models with 50% and 90% credible intervals for the meteorologically driven statistical model. Abbreviations are as follows: SWmeanμ is the long term monthly mean of shortwave radiation, Tmeanμ is the long term monthly mean of temperature, VPDmeanμ is the long term monthly mean of vapor pressure deficit, VPDmean anom.3-mo is the moving 3-month mean moving anomaly of vapor pressure deficit, SWanom.3-mo is the 3-month moving mean anomaly of shortwave radiation, Wet anom. and Dry anom. are the excessively wet and excessively dry parts of the water deficit anomaly. (panels c - h) The effect of the model terms are expressed on hypothetical conditional plots with median posterior prediction and 50 and 99% posterior predictive intervals in shaded colors. Apart from the model term that is varied along the x-axis, all other model terms in the conditional plots are set to the mean from the season or aseasonal forest data sets. All panels on the left correspond to the seasonal forest model, while panels on the right correspond to the aseasonal wet forest model. Figure 3. Site level observations (open circles) and predictions (solid circles) with corresponding 50 and 99% prediction intervals of monthly NPPstem for individual plots located near (A) Kenia, Bolivia, (B) Tambopata, Perú, (C) Santarém, Brazil, (C) Tambopata, Perú, (D) Kogyae, Ghana, (E) Bobiri, Ghana, (F & G) regions in the east of Sabah, Malaysian Borneo, and (H) Jenaro Herrera, Perú. Figure 4. The detrended Pantropical spatial anomalies of NPPstem during the El Niño events of 1997-1998 and 2015-2016, expressed Mg C ha-1 month-1. Figure 5. (Top) The 12-month detrended and running mean anomaly (expressed in Pg C yr-1) of annual NPPstem (black) across the tropical regions and the Pantropics. The vertical colored bars represent corresponding El Niño 3.4 index through time. Table 1. Climatic characteristics of Global Ecosystem Monitoring regions used in this study. We divide the forest biomes as follows: WTF - wet tropical forest (>2200 mm), MTF - moist tropical forest (1800-2200), SDTF- semi-deciduous tropical forest (1400-1800 mm), and DTF - dry tropical forest (<1400 mm). Precipitation seasonality was calculated according to Feng et al., (2013), where a higher value indicates a more temporally concentrated distribution of annual rainfall.
Page 15 of 21
http://mc.manuscriptcentral.com/issue-ptrsb
Submitted to Phil. Trans. R. Soc. B - Issue
123456789101112131415161718192021222324252627282930313233343536373839404142434445464748495051525354555657585960
For Review Only
Tables
Page 16 of 21
http://mc.manuscriptcentral.com/issue-ptrsb
Submitted to Phil. Trans. R. Soc. B - Issue
123456789101112131415161718192021222324252627282930313233343536373839404142434445464748495051525354555657585960
For Review Only
Figures
Figure 1.
Page 17 of 21
http://mc.manuscriptcentral.com/issue-ptrsb
Submitted to Phil. Trans. R. Soc. B - Issue
123456789101112131415161718192021222324252627282930313233343536373839404142434445464748495051525354555657585960
For Review Only
Page 18 of 21
http://mc.manuscriptcentral.com/issue-ptrsb
Submitted to Phil. Trans. R. Soc. B - Issue
123456789101112131415161718192021222324252627282930313233343536373839404142434445464748495051525354555657585960

For Review Only
Figure 2.
Page 19 of 21
http://mc.manuscriptcentral.com/issue-ptrsb
Submitted to Phil. Trans. R. Soc. B - Issue
123456789101112131415161718192021222324252627282930313233343536373839404142434445464748495051525354555657585960
For Review Only
Figure 3.
Page 20 of 21
http://mc.manuscriptcentral.com/issue-ptrsb
Submitted to Phil. Trans. R. Soc. B - Issue
123456789101112131415161718192021222324252627282930313233343536373839404142434445464748495051525354555657585960
For Review Only
Figure 4.
Page 21 of 21
http://mc.manuscriptcentral.com/issue-ptrsb
Submitted to Phil. Trans. R. Soc. B - Issue
123456789101112131415161718192021222324252627282930313233343536373839404142434445464748495051525354555657585960
For Review Only
Figure 5.
Page 22 of 21
http://mc.manuscriptcentral.com/issue-ptrsb
Submitted to Phil. Trans. R. Soc. B - Issue
123456789101112131415161718192021222324252627282930313233343536373839404142434445464748495051525354555657585960