Embed Size (px)
Citation preview
originalni naučni rad
22Bankarstvo, 2017, vol. 46, br. 4
doi: 10.5937/bankarstvo1704022K
EKONOMETRIJSKO MODELIRANJE
DEVIZNIH KURSEVA EVRA, BRITANSKE
FUNTE I JENA PREMA DOLARU -
MULTIVARIJANTNI GARCH PRISTUP
Prevod obezbedio
autor
Rezime
U ovom radu se istražuje uporedna volatilnost vodećih svetskih valuta (evro, britanska funta i japanski jen) prema američkom dolaru. U istraživanju je primenjen dijagonalni multivarijantni GARCH BEKK model. Pomoću ovog modela ocenjena je uslovna korelacija, kao i uslovna varijansa i kovarijansa u sistemu od ove tri valute. Rezultati empirijske analize pokazuju značajno slaganje u kretanju deviznih kurseva, posebno između evra i britanske funte. To zapravo znači da postoji i međusobno prenošenje volatilnosti deviznih kurseva između valuta sa većim stepenom korelacije. Veća stabilnost ili nestabilnost jedne valute prenosi se i na volatilnost druge valute. Ovi nalazi utiču na valutnu diversifikaciju portfolija i upravljanje rizikom.
Ključne reči: Volatilnost deviznog kursa, zajednička volatilnost, multivarijantni dijagonalni BEKK GARCH model, uslovna varijansa, prinos deviznog kursa
JEL: E42, F47
Primljen: 09.06.2017. Prihvaćen: 19.06.2017.
Radovan KovačevićEkonomski fakultet
Univerziteta u [email protected]
23 Bankarstvo, 2017, Vol. 46, Issue 4
original scientific paper
ECONOMETRIC MODELLING OF EURO,
BRITISH POUND AND JAPANESE YEN EXCHANGE RATES AGAINST DOLLAR - MULTIVARIATE
GARCH APPROACH
Translation provided by the author
Summary
This paper examines the comparative volatility of major world currencies (the euro, British pound and Japanese yen) against the US dollar. The multivariate diagonal GARCH BEKK model was applied in the study. The conditional correlation was estimated by this model, as well as the conditional variance and covariance of the system of these three currencies. The results of the empirical analysis show significant agreement in the movement of foreign exchange rates, particularly between the euro and the British Pound. This means that there is a mutual transfer of volatility in exchange rates between currencies with a higher degree of correlation. Greater stability or instability of a currency is transferred to the volatility of other currencies. These findings influence the currency portfolio diversification and risk management.
Keywords: Exchange rate volatility, volatility comovements, multivariate diagonal BEKK GARCH model, conditional variance, exchange rate returns.
JEL: E42, F47
Received: 09.06.2017 Accepted: 19.06.2017
doi: 10.5937/bankarstvo1704022K
Radovan KovačevićFaculty of EconomicsUniversity of [email protected]
Uvod
Evro kao druga po značaju svetska valuta, posle američkog dolara, u deviznoj trgovini na svetskom deviznom tržištu, potpao je pod uticaj krize javnih dugova evrozone. Prema podacima BIS Triennial Central Bank Survey on Foreign Exchange Trade u aprilu 2016. prosečan dnevni promet evra činio je 31,3% svih deviznih transakcija, dok je učešće dolara 87,6% (Svaku deviznu transakciju čine dve valute, pa je ukupan zbir, prema BIS report-u, 200%). Učešće britanske funte i japanskog jena znatno je manje. Mada se posle uvođenja evra 1999. godine očekivalo da će on postati ozbiljan takmac dolaru u ulozi svetske rezervne valute, to se do danas ipak nije obistinilo. Pod naletom svetske ekonomske i finansijske krize iz 2008. godine evro je izgubio jedan deo ranijeg udela u međunarodnoj deviznoj trgovini. Kriza javnog duga članica evrozone dodatno je uzdrmala pozicije evra u svetskoj deviznoj trgovini i pojačala poslovnu neizvesnost na svetskom tržištu. U ovom okruženju predviđanje deviznog kursa je otežano, što obeshrabruje investitore. S obzirom na značaj evra u međunarodnom monetarnom sistemu, značajno je da se ispita njegova volatilnost i usklađenost sa volatilnošću ostalih posmatranih valuta. Uostalom, u brojnim modelima upravljanja rizikom, volatilnost deviznog kursa predstavlja vodeći indikator rizika deviznog kursa. To olakšava donošenje odluka u vezi sa diversifikacijom portfolija, utvrđivanjem cena aktiva i opcija, a služi i za sprovođenje hedžinga. Primeri valutnih kriza u međunarodnom monetarnom sistemu pokazuju da se zaraza u jednoj valuti može brzo preneti na globalno finansijsko tržište. To zapravo znači da kretanja jedne valute mogu u značajnoj meri uticati na vrednost druge valute, pored uticaja fundamentalnih faktora. Ovaj rad doprinosi literaturi koja proučava zajedničku volatilnost deviznih kurseva na nekoliko načina. Prvo, tako što ispituje kakav je uticaj finansijske krize iz 2008. na zajedničko kretanje deviznih kurseva ključnih valuta u svetskoj privredi: evro, britanska funta i japanski jen, u odnosu na američki dolar. Drugo, u radu se primenjuje fleksibilniji višedimenzioni (multivarijantni) GARCH model u odnosu na konvencionalne modele. U literaturi postoji više različitih
višedimenzionih GARCH modela. Među ovim modelima su: VECH, dijagonalni VECH, DCC i BEKK model (za detaljnije razmatranje videti Kroner and Ng (1998) ). U ovom radu se, primenom dijagonalnog BEKK modela (Baba-Engle-Kraft-Kroner reprezentacija) (Engle and Kroner, 1995) na vremenske serije deviznog kursa evra, japanskog jena i britanske funte prema američkom dolaru, modelira uslovna varijansa (uslovna heteroskedastičnost) prinosa. Promena deviznog kursa prema dolaru u vremenskom nizu se posmatra kao prinos date valute. S obzirom da varijansa prinosa vremenskih serija deviznih kurseva navedenih valuta u osnovi izražava stepen rizika njihovog posedovanja, cilj modela je da se utvrdi mera volatilnosti i time indirektno stepen rizika ovih valuta. Uslovnu varijansu ćemo modelirati pomoću dijagonalnog BEKK modela. Treći doprinos ovog rada je uključivanje u ocenu modela podataka o deviznim kursevima do kraja 2016. godine, što dozvoljava rigoroznije ocenjivanje i potpuniju analizu dinamike volatilnosti posmatranih valuta. Preostali deo rada je organizovan na sledeći način. U drugom delu se daje pregled literature. Treće poglavlje opisuje metodologiju i korišćene podatke, dok se u četvrtom delu izlažu nalazi empirijskih istraživanja. U petom delu se iznose zaključne ocene.
Pregled literature
Pérez-Rodrìguez (2006) je primenio Dinamic Conditional Correlation (DCC) - GARCH model da bi ispitao međuzavisnost dnevne uslovne volatilnosti evra, funte i jena prema dolaru u periodu 1999-2004. U radu su izloženi dokazi o značajnom prelivanju volatilnosti između ovih valuta, uz postojanje značajne korelacije između evra i funte. Sličnu analizu je sproveo Kitamura (2010) koristeći podatke za period od 2. aprila do 31. avgusta 2006. i utvrdio postojanje značajnog prelivanja volatilnosti evra na funtu i franak. Takođe je zaključio da su funta i franak visoko integrisani na evro tržište. Antonakakis (2012) je ispitivao zajedničko kretanje i prelivanje volatilnosti prinosa evra, britanske funte, švajcarskog franka i japanskog jena u odnosu na dolar u periodu pre i posle uvođenja evra. Na osnovu dobijenih rezultata dinamičkih korelacija, dekompozicije varijanse,
Kovačević R.Ekonometrijsko modeliranje deviznih kurseva evra, britanske
funte i jena prema dolaru - multivarijantni GARCH pristupBankarstvo, 2017, vol. 46, br. 4 24
Introduction
The euro as the second global currency, after the US dollar, came under the pressure of the public debt crisis of the Eurozone. According to the data from the BIS Triennial Central Bank Survey of Foreign Exchange on Trade, in April 2016 the average daily turnover of the euro accounted for 31.3% of all foreign exchange transactions, whereas the dollar accounted for 87.6% (any foreign currency transaction consisting of the two currencies, so the total sum, according to the BIS report, is 200%). The share of the British pound and the Japanese yen is considerably lower. Although after the introduction of the euro in 1999 it was expected to become a serious rival to the dollar in the role of the leading world’s reserve currency, this has not yet become true. With the outbreak of the global economic and financial crisis in 2008, the euro has lost a part of its former share in the international foreign exchange trade. The European sovereign debt crisis has shaken the position of the euro in global foreign exchange trading and amplified the business uncertainty in the global market. In this environment, forecasting exchange rates can be more difficult, which discourages investors. Given the significance of the euro in the international monetary system, it is important to examine its volatility and compliance with the volatility of other currencies. After all, the various models of risk management show that the exchange rate volatility is a leading indicator of the exchange rate risk. It facilitates decision-making with regard to portfolio diversification, determining asset prices and options, and serves the purposes of hedging implementation. The currency crises in the international monetary system show that the contagion of one currency can be quickly transferred to the global financial market. This means that the movement in one currency can significantly affect the value of other currencies, despite the impact of fundamental factors. This paper contributes to the literature that studies the exchange rate volatility comovements in several ways. First, by examining the impact of the 2008 financial crisis on the joint movement of the exchange rates of the key currencies in the world economy: the euro, British pound and Japanese yen against the US dollar. Secondly,
the paper applies the multivariate GARCH model, which is more flexible compared to the conventional models. The reference literature recognizes several different multivariate GARCH models. These models include: VECH, diagonal VECH, DCC and BEKK model (for a more detailed discussion, see Kroner and Ng (1998)). In this paper, the diagonal BEKK model (Baba-Engle-Kraft-Kroner representation) (Engle and Kroner, 1995) is applied for a time series of the exchange rate of the euro, the Japanese yen and the British pound against the US dollar, in order to model the conditional variance (conditional heteroskedasticity) of yields. Changes in the exchange rates against the dollar are seen as returns of that currency. Since the variance in the time series of exchange rates basically expresses the level of currency risk, the goal of the model is to determine the rate of volatility and thereby indirectly the level of risk incurred by these currencies. Conditional variance will be modelled using the diagonal BEKK model. The third contribution of this paper relates to the estimation of the model based on the data on exchange rates until the end of 2016, which allows for a more rigorous evaluation and a more complete analysis of the dynamics of the exchange rate volatility among the observed currencies. The remainder of the paper is organized as follows: the second part provides an overview of the reference literature. The third section describes the methodology and data, while the fourth part presents the results of the empirical research. The fifth section presents the final estimates.
Literature Review
Pérez-Rodríguez (2006) applied the Dynamic Conditional Correlation (DCC) - GARCH model to examine the interdependence of daily conditional volatility of the euro, the pound and the yen against the dollar in the period 1999-2004. The paper presents evidence of significant volatility spillovers between these currencies, with the existence of a significant correlation between the euro and the pound. A similar analysis was conducted by Kitamura (2010) which used the data for the period from 2 April to 31 August 2006 and established the existence of significant
Kovačević R.Econometric Modelling of Euro, British Pound and Japanese Yen Exchange Rates Against Dollar - Multivariate GARCH Approach
25 Bankarstvo, 2017, Vol. 46, Issue 4
uopštenog VAR-a i novouvedenog indeksa prelivanja, Antonakakis je utvrdio da postoji signifikantno zajedničko kretanje i prelivanje volatilnosti između prinosa četiri posmatrane valute. Ovaj autor je koristio novu uopštenu verziju indeksa prelivanja koju su razvili Diebold and Yilmaz (2012).
Kühl (2009) je istraživao slaganje u kretanju deviznih kurseva evro/dolar i britanska funta/dolar i došao do zaključka o njihovom većem slaganju nego što to sugerišu fundamentalni faktori. Iz toga je zaključio da nefundamentalni faktori imaju važnu ulogu u modeliranju deviznog kursa. Boero, Silvapulle and Tursunalieva (2011) su otkrili postojanje asimetrije u dinamici zajedničkog kretanja deviznih kurseva evra, funte i jena za vreme apresijacije i depresijacije prema dolaru u periodu 1994-2007. Asimetrična volatilnost deviznih kurseva australijskog dolara, britanske funte i japanskog jena prema američkom dolaru takođe je identifikovana kod Wang and Yang (2009). Koristeći devizne kurseve američkog dolara, japanskog jena i britanske funte u odnosu na evro u periodu 2002-2006. godine, McMillan and Speight (2010) su utvrdili da kurs dolar/evro dominira u odnosu na druga dva kursa, kako u pogledu prinosa tako i u prelivanju volatilnosti. Uvećanje evrozone povećava ulogu evra na deviznom tržištu. Morales and O’Donnel (2007) su istraživali prelivanje volatilnosti prinosa akcija i deviznog kursa u Italiji, Španiji i Portugaliji u periodu 1996-1998. (period pre uvođenja evra) i u periodu 1999-2001. i 2002-2006. (period posle uvođenja evra). Utvrdili su da u svim zemljama nije bilo signifikantnog prelivanja volatilnosti prinosa akcija na devizne kurseve pre uvođenja evra. Međutim, za period posle uvođenja evra utvrđeno je signifikantno prelivanje volatilnosti prinosa akcija na devizne kurseve u svim zemljama za sve valute, izuzev za Portugaliju u periodu 2002-2006. godine. Tamakoshi and Shigeyuki (2014) su primenili multivarijantni asimetrični DCC GARCH model u istraživanju međuzavisnosti deviznih kurseva evra, britanske funte i švajcarskog franka u odnosu na američki dolar. Cilj istraživanja je da se ocene efekti finansijskih poremećaja na dinamičke međuodnose navedenih valuta. Nalazi ukazuju na pojačanu međuzavisnost u zajedničkom
kretanju deviznih kurseva posmatranih valuta u fazi apresijacije upoređeno sa fazom depresijacije. Rezultati su takođe potvrdili da je kriza dovela do preusmeravanja sredstava u švajcarski franak, koji se pokazao kao pouzdana (sigurna) valuta u vreme krize.
Caporale, Ali and Spagnolo (2015) su ispitivali uticaj neizvesnosti deviznog kursa na različite komponente portfolio tokova, pre svega tržište obveznica i akcija, kao i dinamičke veze između volatilnosti deviznog kursa i dinamike ova dva vida kretanja kapitala. Ocenili su Bivariate GARCH-BEKK-in-mean model koristeći bilateralne podatke za odnose između SAD na jednoj strani, i Australije, Velike Britanije, Japana, Kanade, Švedske i evrozone, na drugoj strani. Period posmatranja je 1988: 01- 2011: 12. Rezultati pokazuju da je efekat neizvesnosti deviznog kursa na akcionarske tokove kapitala negativan u evrozoni, Velikoj Britaniji i Švedskoj, a pozitivan u Australiji, dok je u slučaju obveznica negativan u svim zemljama, izuzev Kanade.
BEKK model prvo su predložili Baba, Engle, Kraft i Kroner (1989), a ideju su ponovo detaljno obrazložili Engle i Kroner (1995). Mondal (2013) je ispitivao efikasnost intervencija centralne banke Indije na deviznom tržištu i primenom BEKK modela pokazao da intervencije podstiču volatilnost deviznog kursa.
Podaci i metodologija istraživanja
Podaci korišćeni u ovom radu su dnevni devizni kursevi evra, britanske funte i japanskog jena prema dolaru u periodu od 03. 01. 2000. do 30. 12. 2016. godine (ukupno 4353 podatka za svaku vremensku seriju). Podaci su preuzeti sa internet adrese MMF-a: https://www.imf.org/external/np/fin/ert/GUI/Pages/CountryDataBase.aspx. U analizi smo koristili tri vremenske serije podataka o dnevnom promptnom deviznom kursu. Sve tri vremenske serije promptnog deviznog kursa pokazuju koliko vredi jedan evro, britanska funta i japanski jen u dolarima. Dakle, nominalni porast deviznog kursa znači apresijaciju odgovarajuće valute prema dolaru. Polazni podaci su logaritmovani. Dnevna stopa prinosa deviznog kursa je izračunata kao rt = log (yt) - log (yt-1) x 100, gde yt je nivo promptnog
Kovačević R.Ekonometrijsko modeliranje deviznih kurseva evra, britanske
funte i jena prema dolaru - multivarijantni GARCH pristupBankarstvo, 2017, vol. 46, br. 4 26
volatility spillover of the euro to the pound and the franc. It was also concluded that the pound and the franc are highly integrated in the euro market. Antonakakis (2012) examined the co-movements and volatility spillovers of the euro, British pound, Swiss franc and Japanese yen against the dollar in the period before and after the introduction of the euro. Based on the results of the dynamic correlation, variance decomposition, generalized VAR and the newly introduced index of spillovers, Antonakakis found that there are significant comovements and volatility spillovers between the yields observed from the four currencies. This author used a new version of the generalized spillover index developed by Diebold and Yilmaz (2012).
Kühl (2009) examined the agreement in the movement of foreign exchange rates in the euro/dollar and the British pound/dollar and came to the conclusion about their greater agreement than suggested by the fundamental factors. From this he concluded that non-fundamental factors play an important role in modeling the exchange rate. Boero, Silvapulle and Tursunalieva (2011) revealed the existence of asymmetry in the dynamics of joint movements in the exchange rates of the euro, pound and yen during the appreciation and depreciation of the dollar in the period 1994-2007. Asymmetric volatility of the exchange rates of the Australian dollar, British pound and Japanese yen against the US dollar was also identified in Wang and Yang (2009). Using the exchange rates of the US dollar, Japanese yen and British pound against the euro in 2002-2006, McMillan and Speight (2010) found that the exchange rate dollar/euro dominates over the other two exchange rates, both in terms of yields and volatility spillovers. Enlarging the Eurozone increases the role of the euro in the foreign exchange market. Morales and O'Donnell (2007) investigated the spillover volatility of stocks and exchange rates in Italy, Spain and Portugal in the period 1996-1998 (the period before the introduction of the euro) and in the period 1999-2001 and 2002-2006 (the period after the introduction of the euro). They found that in all countries there was no significant spillover volatility of shares on the exchange rates before the introduction of the euro. However, in the period after the introduction of the euro they found a significant
spillover volatility of shares on the exchange rates in all countries, for all currencies, except for Portugal in 2002-2006. Tamakoshi and Shigeyuki (2014) applied the multivariate asymmetrical DCC GARCH model to study the interdependence of the exchange rates of the euro, British pound and Swiss franc against the US dollar. The aim of this research was to evaluate the effects of financial disturbances on the dynamic interrelationships between these currencies. The findings indicate the increased interdependence in the case of common movements in the exchange rates observed in the phase of currency appreciation compared with the phase of depreciation. The results also confirm that the crisis has led to the redirection of funds into the Swiss franc, which proved to be a safe currency in the times of crisis.
Caporale, Ali and Spagnolo (2015) examined the influence of the exchange rates uncertainty on the different components of portfolio flows, primarily bond and equity markets, as well as the dynamic link between the exchange rate volatility and the dynamics of these two types of capital movements. They estimated the Bivariate GARCH-BEKK-in-mean model using the data on the bilateral relations between the US on one side, and Australia, Great Britain, Japan, Canada, Sweden and the euro zone, on the other side. The observation period is 1988: 01- 2011: 12. The results show that the effect of exchange rate uncertainty on equity flows is negative in the euro area, the UK and Sweden, and positive in Australia, while in the case of bonds it is negative in all countries, except Canada.
BEKK model was first suggested by Baba, Engle, Kraft and Kroner (1989), and the idea was again thoroughly explained by Engle and Kroner (1995). Mondal (2013) examined the effectiveness of central bank interventions in the foreign exchange market of India, and applying the BEKK model demonstrated that the interventions encouraged the exchange rate volatility.
Data and Research Methodology
The data used in this paper are the daily exchange rates of the euro, British pound and Japanese yen against the dollar in the period from 03.01.2000 to 30.12.2016 (a total of 4353
Kovačević R.Econometric Modelling of Euro, British Pound and Japanese Yen Exchange Rates Against Dollar - Multivariate GARCH Approach
27 Bankarstvo, 2017, Vol. 46, Issue 4
deviznog kursa u vreme t, pri čemu je t=1, 2, ..., T. Dakle, dnevna apresijacija ili depresijacija deviznog kursa evra, jena i britanske funte prema dolaru dobijena je kao prva diferenca logaritmovanog nivoa deviznog kursa. Model je ocenjen primenom programskog paketa Eviews, uz korišćenje Marquart algoritma optimizacije i Bolerslev - Vuldridžove (Bollerslev - Wooldrige) korekcije standardnih grešaka ocena. Ove vremenske serije su korišćene u sličnim empirijskim istraživanjima. Na primer, Pérez-Rodrìguez (2006) je koristio DCC model istražujući međuzavisnost dnevne uslovne volatilnosti evra, funte i jena prema dolaru u periodu 1999-2004. godine, dok je Antonakakis (2012) analizirao zajedničko kretanje i međusobno prelivanje volatilnosti prinosa evra, britanske funte, švajcarskog franka i japanskog jena u odnosu na dolar u periodu pre i posle uvođenja evra. Naše istraživanje pokriva vremenski period u kome je došlo do značajnog jačanja dolara prema ostalim valutama od druge polovine 2014. godine, a uzorak je širi i uključuje novije podatke. Usled toga rezultati našeg istraživanja delimično su uporedivi sa ranijim nalazima.
Da bismo ispitali karakteristike zajedničkog kretanja deviznih kurseva, koristićemo dijagonalni BEKK model. Ukratko ćemo opisati BEKK model u formatu od dve aktive, a zatim ćemo ga primeniti na podatke za tri devizna kursa. BEKK model (Engle and Kroner, 1995) rešava teškoće VECH modela i obezbeđuje da je H matrica uvek pozitivno definitna. Za razliku od VECH modela, čija je manjkavost u tome što nije izvesno da će semi-definitna kovarijansna matrica biti pozitivna, BEKK model garantuje pozitivnu definitnu strukturu.
U razvijenoj formi, model sa dve serije podataka, se može prikazati kao kod (Rosi, 2010):
Ht je matrica uslovnih varijansi zavisnih varijabli, A, B, and C su NxN matrice parametara. U ovom modelu, matrica konstante
je razdvojena na dve matrice C i C', gde je C gornja triangularna matrica. Dekompozicija konstante na dve triangularne matrice učinjena je da bi se obezbedila pozitivna semidefinitna Ht. A i B su dijagonalne matrice. Matrica A obuhvata ARCH efekte. Parametri aij matrice A mere stepen šokova na tržištima i i j. Matrica B je usredsređena na GARCH efekte, a parametri bij reprezentuju uslovnu volatilnost između tržišta, odnosno brzinu kojom opadaju šokovi na svakom tržištu. Dakle, primenom BEKK modela ocenjuju se koeficijenti koji kvantifikuju uticaj vesti sa deviznog tržišta jedne valute na njenu uslovnu varijansu. Uvođenjem ograničenja dobijene su dijagonalne matrice A i B, tako da se smanjio broj parametara u modelu.
Ako je A1=diag (a11, a22) a B1 = diag (b11, b22), model se svodi na:
Kad se dijagonalni BEKK model razloži u svoje jednodimenzione jednačine, one se mogu prikazati kao:
Model se, u redukovanom iskazu (matrična forma), može prikazati kao (Brooks, 2008, str. 435):
gde su A i B 2 x 2 simetrične matrice parametara, a W je gornja triangularna matrica parametara. Pozitivna definitnost matrične kovarijanse je osigurana. Ako su matrice A i B dijagonalne, radi se o dijagonalnom BEKK modelu. Parametri gornjeg modela mogu se oceniti tako što će se maksimizirati LLF (log-likelihood)
Kovačević R.Ekonometrijsko modeliranje deviznih kurseva evra, britanske
funte i jena prema dolaru - multivarijantni GARCH pristupBankarstvo, 2017, vol. 46, br. 4 28
pieces of data for each time series). The data was downloaded from the internet address of the IMF: https://www.imf.org/external/np/fin/ert/GUI/Pages/CountryDataBase.aspx. In the analysis we used three time series of data on the daily spot exchange rate. All three time series of the prompt exchange rate show what the value of one euro, British pound and Japanese yen is expressed in dollars. Thus, the nominal increase in the exchange rate implies the appreciation of the respective currencies against the dollar. The baseline data were logarithmically transformed. The daily return of foreign exchange rate is calculated as rt = log (yt) - log (yt-1) x 100 where yt is the level of a prompt exchange rate at the time t, where t = 1, 2, ..., T. Thus, the daily appreciation or depreciation of the exchange rate of the euro, yen and British pound against the dollar was obtained as the first difference log exchange rate level. The model is estimated by the software package Eviews, using Marquart algorithm optimization and Bollerslev-Wooldrige correction of estimate standard errors. These time series are used in similar empirical studies. For example, Pérez-Rodríguez (2006) used a DCC model for investigating the interdependence of the daily conditional volatility of the euro, pounds and yen against the dollar in the period 1999-2004. while Antonakakis (2012) analyzed the joint movement and mutual spillover of the yield volatility of the euro, the British pound, the Swiss franc and the Japanese yen against the dollar in the period before and after the introduction of the euro. Our research covers the time period in which there has been a significant strengthening of the dollar against other currencies since the second half of 2014, and the sample is broader and includes more recent data. Therefore, the results of our research are partially comparable to previous findings.
To examine the characteristics of the comovements of foreign exchange rates, we employed the diagonal BEKK model. We will briefly describe the BEKK model in the format of the two assets, and then we apply it to the data for three foreign exchange rates. The BEKK model (Engle and Kroner, 1995) solves the VECH model problems and ensures that the matrix H is always a positive definite. Unlike the VECH model, whose deficiency is that it is not certain
whether the semi-definite covariance matrix will be positive, the BEKK model guarantees the positive definite structure.
In a developed form, a model with two data series, can be expressed as (Rosi, 2010):
where Ht is the matrix of conditional variance of dependent variables, A, B, and C are NxN parameter matrices. In this model, the constant matrix is divided into two matrices C and C', where C is the upper triangular matrix. Decomposition of the constant in two triangular matrices is made to ensure positive semi-definiteness of Ht. A and B matrices are diagonal. The matrix A includes ARCH effects. Parameters aij of the matrix A measures the degree of innovation in markets i and j. Matrix B is focused on GARCH effects and parameters bij represents the conditional volatility between the markets, or persistence of the news. So, the coefficients that quantify the impact of news from the foreign exchange market of one currency on its conditional variance are estimated by the BEEK model. The diagonal matrices A and B were obtained by imposing the restrictions, so that the number of parameters in the model is reduced.
If A1=diag(a11, a22) a B1 = diag(b11, b22), the model is reduced to:
When the diagonal BEEK model decomposes into its one-dimensional equations, they can be represented as:
Kovačević R.Econometric Modelling of Euro, British Pound and Japanese Yen Exchange Rates Against Dollar - Multivariate GARCH Approach
29 Bankarstvo, 2017, Vol. 46, Issue 4
gde je Θ vektor koji označava sve nepoznate parametre koje treba oceniti, N je broj serija u sistemu (pretpostavljeno 2 u gornjem primeru), a T je broj posmatranja (Brooks, 2008. str. 435). H matrica je uvek pozitivno definitna. Ocenili smo MGARCH BEKK model prema Engle and Kroner (1995). Parametri modela su ocenjeni metodom maksimalne verodostojnosti.
Empirijski rezultati i diskusija
Dnevna stopa prinosa evro/dolarU originalnoj seriji prinosa evra postoji
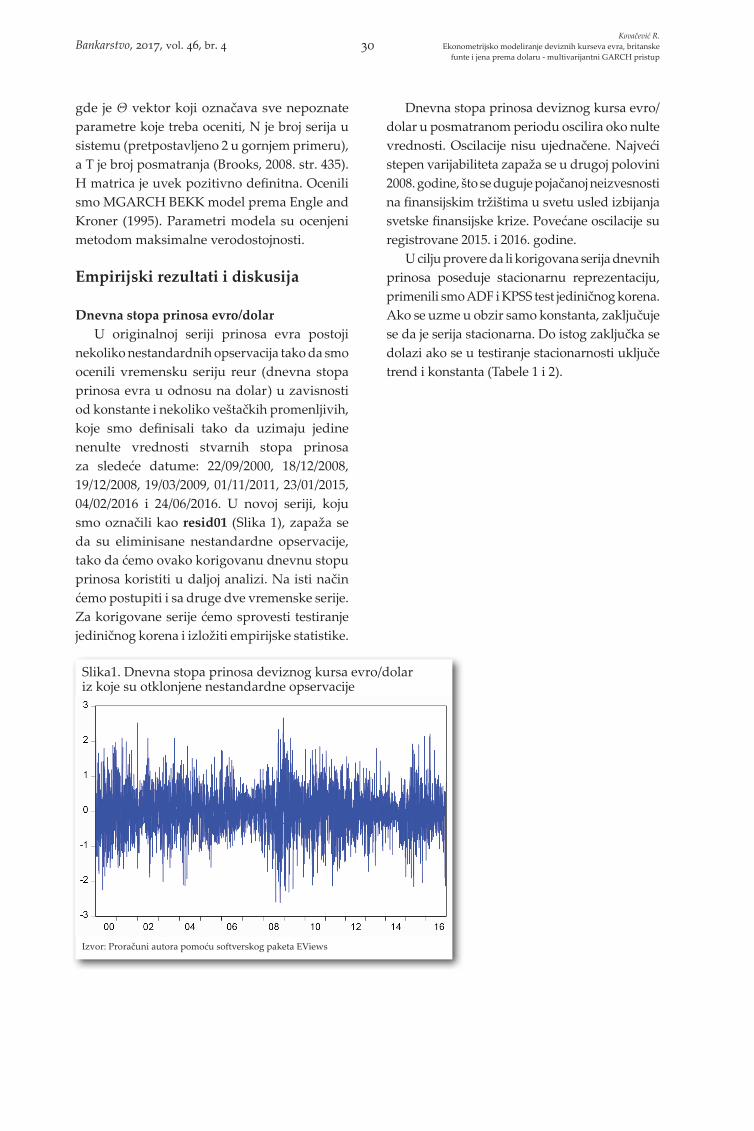
nekoliko nestandardnih opservacija tako da smo ocenili vremensku seriju reur (dnevna stopa prinosa evra u odnosu na dolar) u zavisnosti od konstante i nekoliko veštačkih promenljivih, koje smo definisali tako da uzimaju jedine nenulte vrednosti stvarnih stopa prinosa za sledeće datume: 22/09/2000, 18/12/2008, 19/12/2008, 19/03/2009, 01/11/2011, 23/01/2015, 04/02/2016 i 24/06/2016. U novoj seriji, koju smo označili kao resid01 (Slika 1), zapaža se da su eliminisane nestandardne opservacije, tako da ćemo ovako korigovanu dnevnu stopu prinosa koristiti u daljoj analizi. Na isti način ćemo postupiti i sa druge dve vremenske serije. Za korigovane serije ćemo sprovesti testiranje jediničnog korena i izložiti empirijske statistike.
Dnevna stopa prinosa deviznog kursa evro/dolar u posmatranom periodu oscilira oko nulte vrednosti. Oscilacije nisu ujednačene. Najveći stepen varijabiliteta zapaža se u drugoj polovini 2008. godine, što se duguje pojačanoj neizvesnosti na finansijskim tržištima u svetu usled izbijanja svetske finansijske krize. Povećane oscilacije su registrovane 2015. i 2016. godine.
U cilju provere da li korigovana serija dnevnih prinosa poseduje stacionarnu reprezentaciju, primenili smo ADF i KPSS test jediničnog korena. Ako se uzme u obzir samo konstanta, zaključuje se da je serija stacionarna. Do istog zaključka se dolazi ako se u testiranje stacionarnosti uključe trend i konstanta (Tabele 1 i 2).
Slika1. Dnevna stopa prinosa deviznog kursa evro/dolar iz koje su otklonjene nestandardne opservacije
Izvor: Proračuni autora pomoću softverskog paketa EViews
Kovačević R.Ekonometrijsko modeliranje deviznih kurseva evra, britanske
funte i jena prema dolaru - multivarijantni GARCH pristupBankarstvo, 2017, vol. 46, br. 4 30
The model, in a reduced form (matrix form) can be represented as (Brooks, 2008, pp. 435):
where A and B are 2 x 2 parameters symmetrical matrices, and W is the upper triangular parameters matrix. Positive definiteness of covariance matrix is provided. If the matrices A and B are diagonal, it is the diagonal BEKK model. The parameters of the above model can be assessed by the maximum log-likelihood function (LLF):
where Θ is a vector which indicates all the unknown parameters should be assessed, N is the number of series in the system (preferably 2 in the above example), and T is the number of observations (Brooks, 2008, pp. 435). H matrix is always a positive definite. We estimated the
MGARCH BEKK model of Engle and Kroner (1995). The model parameters were estimated through the maximum likelihood.
Empirical Results and Discussion
The daily rate of euro/dollar exchange rate returns
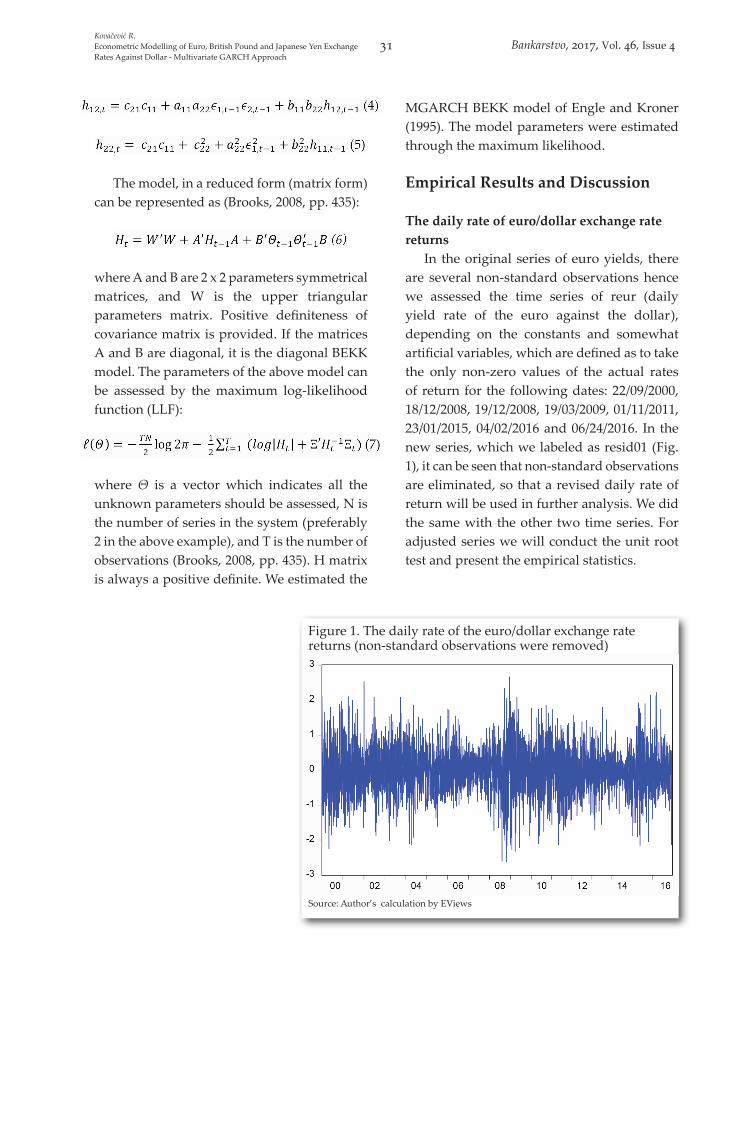
In the original series of euro yields, there are several non-standard observations hence we assessed the time series of reur (daily yield rate of the euro against the dollar), depending on the constants and somewhat artificial variables, which are defined as to take the only non-zero values of the actual rates of return for the following dates: 22/09/2000, 18/12/2008, 19/12/2008, 19/03/2009, 01/11/2011, 23/01/2015, 04/02/2016 and 06/24/2016. In the new series, which we labeled as resid01 (Fig. 1), it can be seen that non-standard observations are eliminated, so that a revised daily rate of return will be used in further analysis. We did the same with the other two time series. For adjusted series we will conduct the unit root test and present the empirical statistics.
Figure 1. The daily rate of the euro/dollar exchange rate returns (non-standard observations were removed)
Source: Author’s calculation by EViews
Kovačević R.Econometric Modelling of Euro, British Pound and Japanese Yen Exchange Rates Against Dollar - Multivariate GARCH Approach
31 Bankarstvo, 2017, Vol. 46, Issue 4
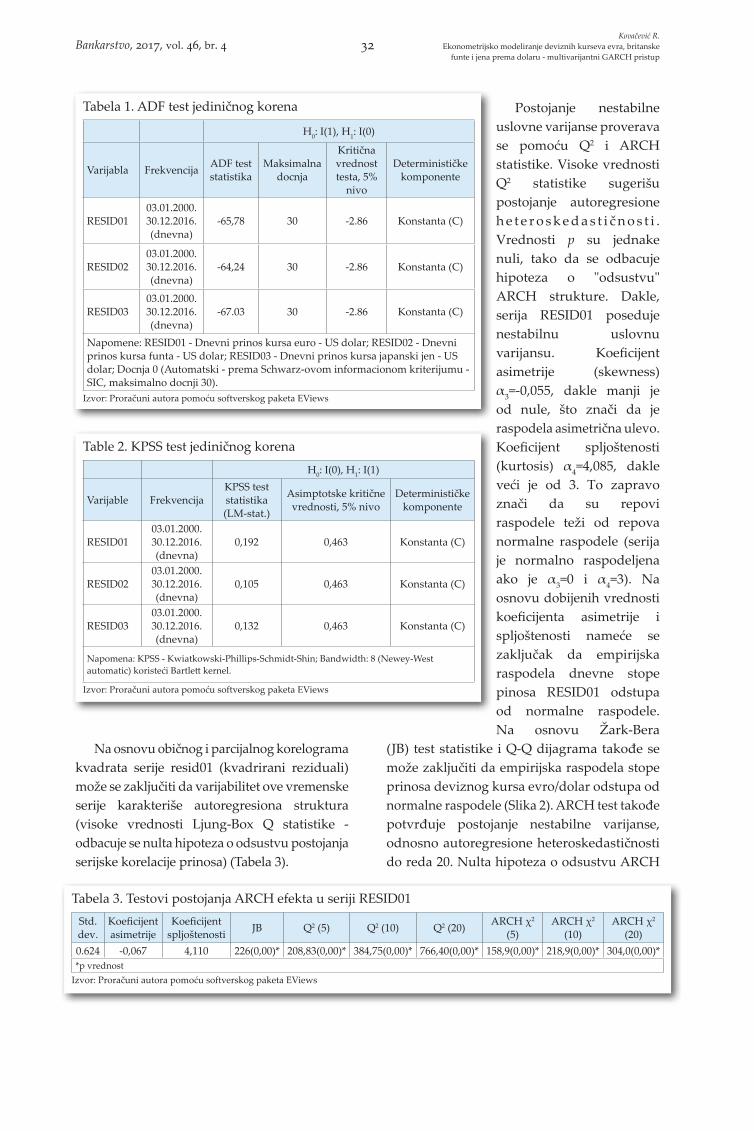
Na osnovu običnog i parcijalnog korelograma kvadrata serije resid01 (kvadrirani reziduali) može se zaključiti da varijabilitet ove vremenske serije karakteriše autoregresiona struktura (visoke vrednosti Ljung-Box Q statistike - odbacuje se nulta hipoteza o odsustvu postojanja serijske korelacije prinosa) (Tabela 3).
Postojanje nestabilne uslovne varijanse proverava se pomoću Q2 i ARCH statistike. Visoke vrednosti Q2 statistike sugerišu postojanje autoregresione h e t e r o s k e d a s t i č n o s t i . Vrednosti p su jednake nuli, tako da se odbacuje hipoteza o "odsustvu" ARCH strukture. Dakle, serija RESID01 poseduje nestabilnu uslovnu varijansu. Koeficijent asimetrije (skewness) α3=-0,055, dakle manji je od nule, što znači da je raspodela asimetrična ulevo. Koeficijent spljoštenosti (kurtosis) α4=4,085, dakle veći je od 3. To zapravo znači da su repovi raspodele teži od repova normalne raspodele (serija je normalno raspodeljena ako je α3=0 i α4=3). Na osnovu dobijenih vrednosti koeficijenta asimetrije i spljoštenosti nameće se zaključak da empirijska raspodela dnevne stope pinosa RESID01 odstupa od normalne raspodele. Na osnovu Žark-Bera
(JB) test statistike i Q-Q dijagrama takođe se može zaključiti da empirijska raspodela stope prinosa deviznog kursa evro/dolar odstupa od normalne raspodele (Slika 2). ARCH test takođe potvrđuje postojanje nestabilne varijanse, odnosno autoregresione heteroskedastičnosti do reda 20. Nulta hipoteza o odsustvu ARCH
Tabela 1. ADF test jediničnog korena
H0: I(1), H1: I(0)
Varijabla Frekvencija ADF test statistika
Maksimalna docnja
Kritična vrednost testa, 5%
nivo
Determinističke komponente
RESID0103.01.2000. 30.12.2016. (dnevna)
-65,78 30 -2.86 Konstanta (C)
RESID0203.01.2000. 30.12.2016. (dnevna)
-64,24 30 -2.86 Konstanta (C)
RESID0303.01.2000. 30.12.2016. (dnevna)
-67.03 30 -2.86 Konstanta (C)
Napomene: RESID01 - Dnevni prinos kursa euro - US dolar; RESID02 - Dnevni prinos kursa funta - US dolar; RESID03 - Dnevni prinos kursa japanski jen - US dolar; Docnja 0 (Automatski - prema Schwarz-ovom informacionom kriterijumu - SIC, maksimalno docnji 30).
Izvor: Proračuni autora pomoću softverskog paketa EViews
Table 2. KPSS test jediničnog korena
H0: I(0), H1: I(1)
Varijable FrekvencijaKPSS test statistika (LM-stat.)
Asimptotske kritične vrednosti, 5% nivo
Determinističke komponente
RESID0103.01.2000. 30.12.2016. (dnevna)
0,192 0,463 Konstanta (C)
RESID0203.01.2000. 30.12.2016. (dnevna)
0,105 0,463 Konstanta (C)
RESID0303.01.2000. 30.12.2016. (dnevna)
0,132 0,463 Konstanta (C)
Napomena: KPSS - Kwiatkowski-Phillips-Schmidt-Shin; Bandwidth: 8 (Newey-West automatic) koristeći Bartlett kernel.
Izvor: Proračuni autora pomoću softverskog paketa EViews
Tabela 3. Testovi postojanja ARCH efekta u seriji RESID01Std. dev.
Koeficijent asimetrije
Koeficijent spljoštenosti JB Q2 (5) Q2 (10) Q2 (20) ARCH χ2
(5)ARCH χ2
(10)ARCH χ2
(20)0.624 -0,067 4,110 226(0,00)* 208,83(0,00)* 384,75(0,00)* 766,40(0,00)* 158,9(0,00)* 218,9(0,00)* 304,0(0,00)**p vrednost
Izvor: Proračuni autora pomoću softverskog paketa EViews
Kovačević R.Ekonometrijsko modeliranje deviznih kurseva evra, britanske
funte i jena prema dolaru - multivarijantni GARCH pristupBankarstvo, 2017, vol. 46, br. 4 32
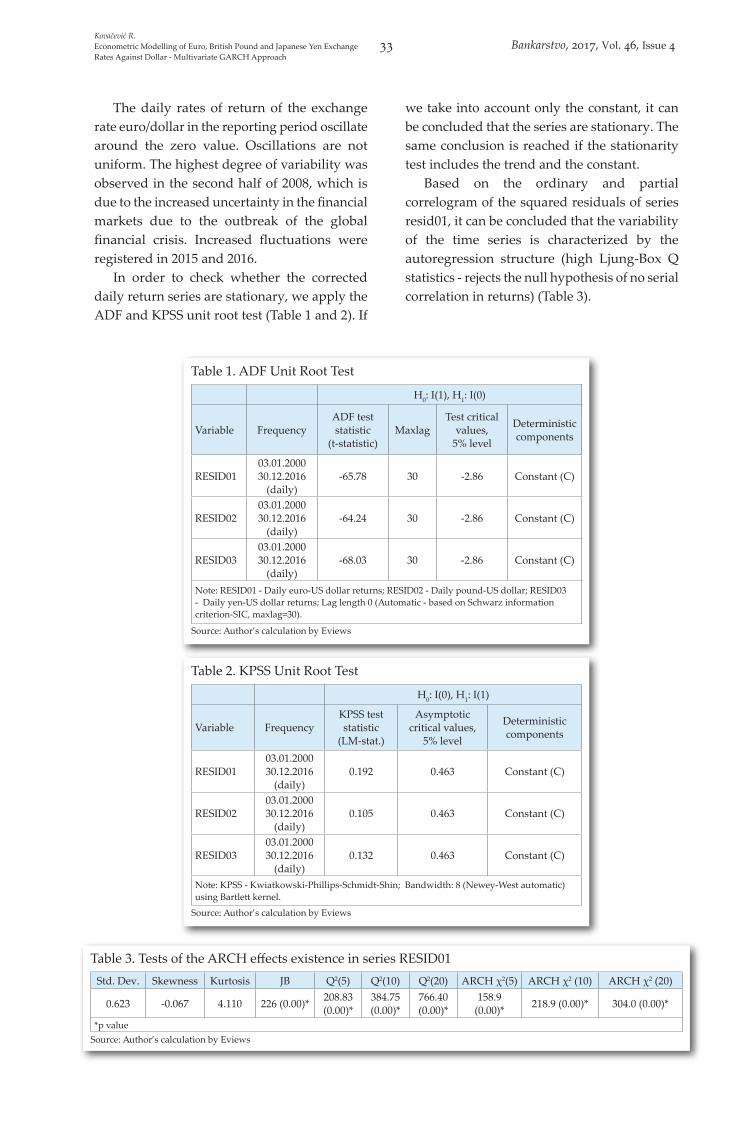
The daily rates of return of the exchange rate euro/dollar in the reporting period oscillate around the zero value. Oscillations are not uniform. The highest degree of variability was observed in the second half of 2008, which is due to the increased uncertainty in the financial markets due to the outbreak of the global financial crisis. Increased fluctuations were registered in 2015 and 2016.
In order to check whether the corrected daily return series are stationary, we apply the ADF and KPSS unit root test (Table 1 and 2). If
we take into account only the constant, it can be concluded that the series are stationary. The same conclusion is reached if the stationarity test includes the trend and the constant.
Based on the ordinary and partial correlogram of the squared residuals of series resid01, it can be concluded that the variability of the time series is characterized by the autoregression structure (high Ljung-Box Q statistics - rejects the null hypothesis of no serial correlation in returns) (Table 3).
Table 1. ADF Unit Root Test
H0: I(1), H1: I(0)
Variable FrequencyADF test statistic
(t-statistic)Maxlag
Test critical values,
5% level
Deterministic components
RESID0103.01.2000 30.12.2016
(daily)-65.78 30 -2.86 Constant (C)
RESID0203.01.2000 30.12.2016
(daily)-64.24 30 -2.86 Constant (C)
RESID0303.01.2000 30.12.2016
(daily)-68.03 30 -2.86 Constant (C)
Note: RESID01 - Daily euro-US dollar returns; RESID02 - Daily pound-US dollar; RESID03 - Daily yen-US dollar returns; Lag length 0 (Automatic - based on Schwarz information criterion-SIC, maxlag=30).
Source: Author’s calculation by Eviews
Table 2. KPSS Unit Root Test
H0: I(0), H1: I(1)
Variable FrequencyKPSS test statistic
(LM-stat.)
Asymptotic critical values,
5% level
Deterministic components
RESID0103.01.2000 30.12.2016
(daily)0.192 0.463 Constant (C)
RESID0203.01.2000 30.12.2016
(daily)0.105 0.463 Constant (C)
RESID0303.01.2000 30.12.2016
(daily)0.132 0.463 Constant (C)
Note: KPSS - Kwiatkowski-Phillips-Schmidt-Shin; Bandwidth: 8 (Newey-West automatic) using Bartlett kernel.
Source: Author’s calculation by Eviews
Table 3. Tests of the ARCH effects existence in series RESID01Std. Dev. Skewness Kurtosis JB Q2(5) Q2(10) Q2(20) ARCH χ2(5) ARCH χ2 (10) ARCH χ2 (20)
0.623 -0.067 4.110 226 (0.00)* 208.83 (0.00)*
384.75 (0.00)*
766.40 (0.00)*
158.9 (0.00)* 218.9 (0.00)* 304.0 (0.00)*
*p valueSource: Author’s calculation by Eviews
Kovačević R.Econometric Modelling of Euro, British Pound and Japanese Yen Exchange Rates Against Dollar - Multivariate GARCH Approach
33 Bankarstvo, 2017, Vol. 46, Issue 4
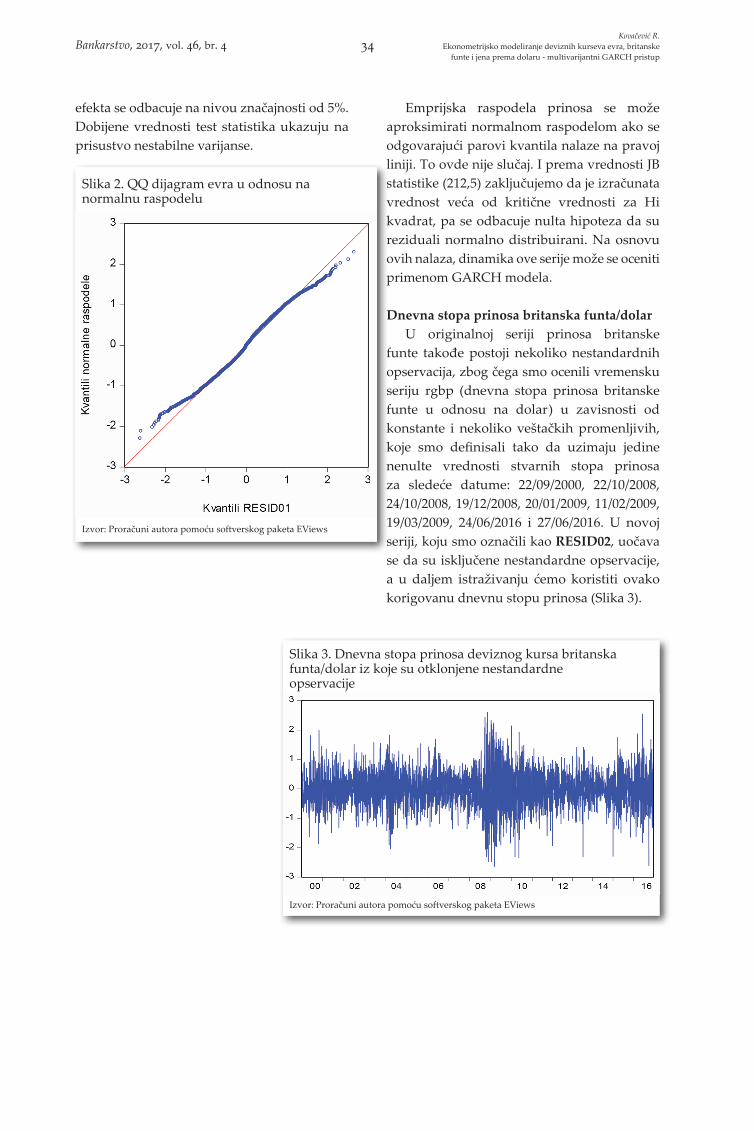
efekta se odbacuje na nivou značajnosti od 5%. Dobijene vrednosti test statistika ukazuju na prisustvo nestabilne varijanse.
Emprijska raspodela prinosa se može aproksimirati normalnom raspodelom ako se odgovarajući parovi kvantila nalaze na pravoj liniji. To ovde nije slučaj. I prema vrednosti JB statistike (212,5) zaključujemo da je izračunata vrednost veća od kritične vrednosti za Hi kvadrat, pa se odbacuje nulta hipoteza da su reziduali normalno distribuirani. Na osnovu ovih nalaza, dinamika ove serije može se oceniti primenom GARCH modela.
Dnevna stopa prinosa britanska funta/dolarU originalnoj seriji prinosa britanske
funte takođe postoji nekoliko nestandardnih opservacija, zbog čega smo ocenili vremensku seriju rgbp (dnevna stopa prinosa britanske funte u odnosu na dolar) u zavisnosti od konstante i nekoliko veštačkih promenljivih, koje smo definisali tako da uzimaju jedine nenulte vrednosti stvarnih stopa prinosa za sledeće datume: 22/09/2000, 22/10/2008, 24/10/2008, 19/12/2008, 20/01/2009, 11/02/2009, 19/03/2009, 24/06/2016 i 27/06/2016. U novoj seriji, koju smo označili kao RESID02, uočava se da su isključene nestandardne opservacije, a u daljem istraživanju ćemo koristiti ovako korigovanu dnevnu stopu prinosa (Slika 3).
Slika 3. Dnevna stopa prinosa deviznog kursa britanska funta/dolar iz koje su otklonjene nestandardne opservacije
Izvor: Proračuni autora pomoću softverskog paketa EViews
Slika 2. QQ dijagram evra u odnosu na normalnu raspodelu
Izvor: Proračuni autora pomoću softverskog paketa EViews
Kovačević R.Ekonometrijsko modeliranje deviznih kurseva evra, britanske
funte i jena prema dolaru - multivarijantni GARCH pristupBankarstvo, 2017, vol. 46, br. 4 34
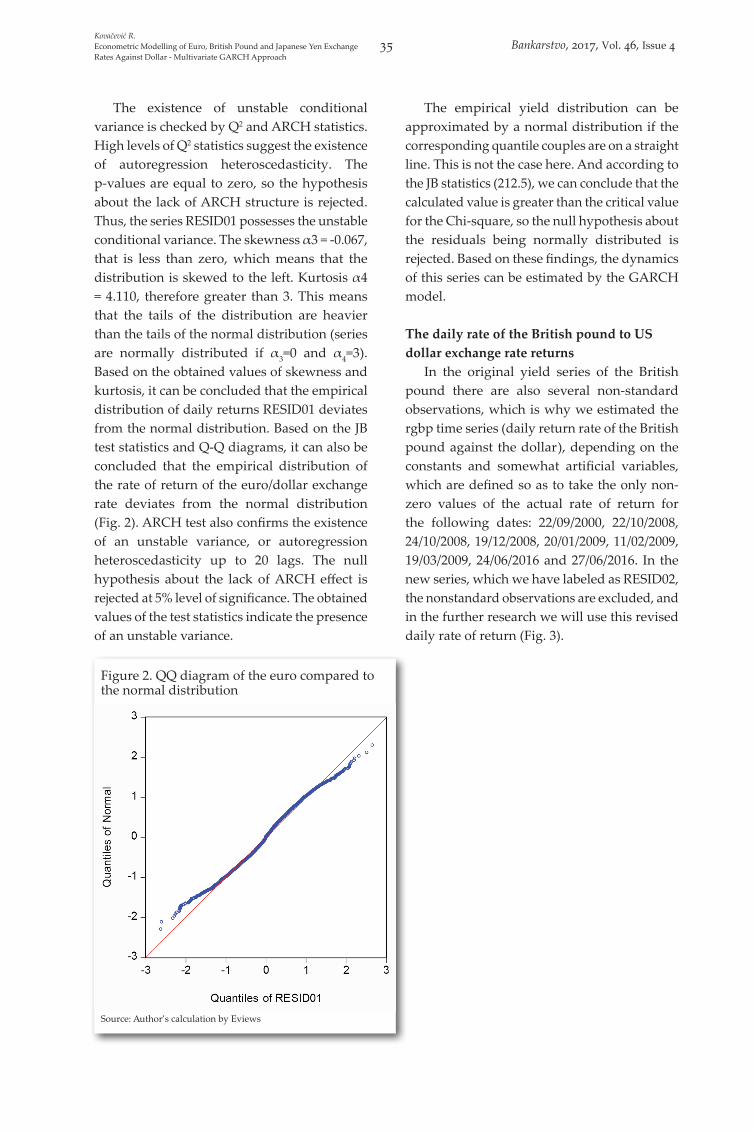
The existence of unstable conditional variance is checked by Q2 and ARCH statistics. High levels of Q2 statistics suggest the existence of autoregression heteroscedasticity. The p-values are equal to zero, so the hypothesis about the lack of ARCH structure is rejected. Thus, the series RESID01 possesses the unstable conditional variance. The skewness α3 = -0.067, that is less than zero, which means that the distribution is skewed to the left. Kurtosis α4 = 4.110, therefore greater than 3. This means that the tails of the distribution are heavier than the tails of the normal distribution (series are normally distributed if α3=0 and α4=3). Based on the obtained values of skewness and kurtosis, it can be concluded that the empirical distribution of daily returns RESID01 deviates from the normal distribution. Based on the JB test statistics and Q-Q diagrams, it can also be concluded that the empirical distribution of the rate of return of the euro/dollar exchange rate deviates from the normal distribution (Fig. 2). ARCH test also confirms the existence of an unstable variance, or autoregression heteroscedasticity up to 20 lags. The null hypothesis about the lack of ARCH effect is rejected at 5% level of significance. The obtained values of the test statistics indicate the presence of an unstable variance.
The empirical yield distribution can be approximated by a normal distribution if the corresponding quantile couples are on a straight line. This is not the case here. And according to the JB statistics (212.5), we can conclude that the calculated value is greater than the critical value for the Chi-square, so the null hypothesis about the residuals being normally distributed is rejected. Based on these findings, the dynamics of this series can be estimated by the GARCH model.
The daily rate of the British pound to US dollar exchange rate returns
In the original yield series of the British pound there are also several non-standard observations, which is why we estimated the rgbp time series (daily return rate of the British pound against the dollar), depending on the constants and somewhat artificial variables, which are defined so as to take the only non-zero values of the actual rate of return for the following dates: 22/09/2000, 22/10/2008, 24/10/2008, 19/12/2008, 20/01/2009, 11/02/2009, 19/03/2009, 24/06/2016 and 27/06/2016. In the new series, which we have labeled as RESID02, the nonstandard observations are excluded, and in the further research we will use this revised daily rate of return (Fig. 3).
Figure 2. QQ diagram of the euro compared to the normal distribution
Source: Author’s calculation by Eviews
Kovačević R.Econometric Modelling of Euro, British Pound and Japanese Yen Exchange Rates Against Dollar - Multivariate GARCH Approach
35 Bankarstvo, 2017, Vol. 46, Issue 4
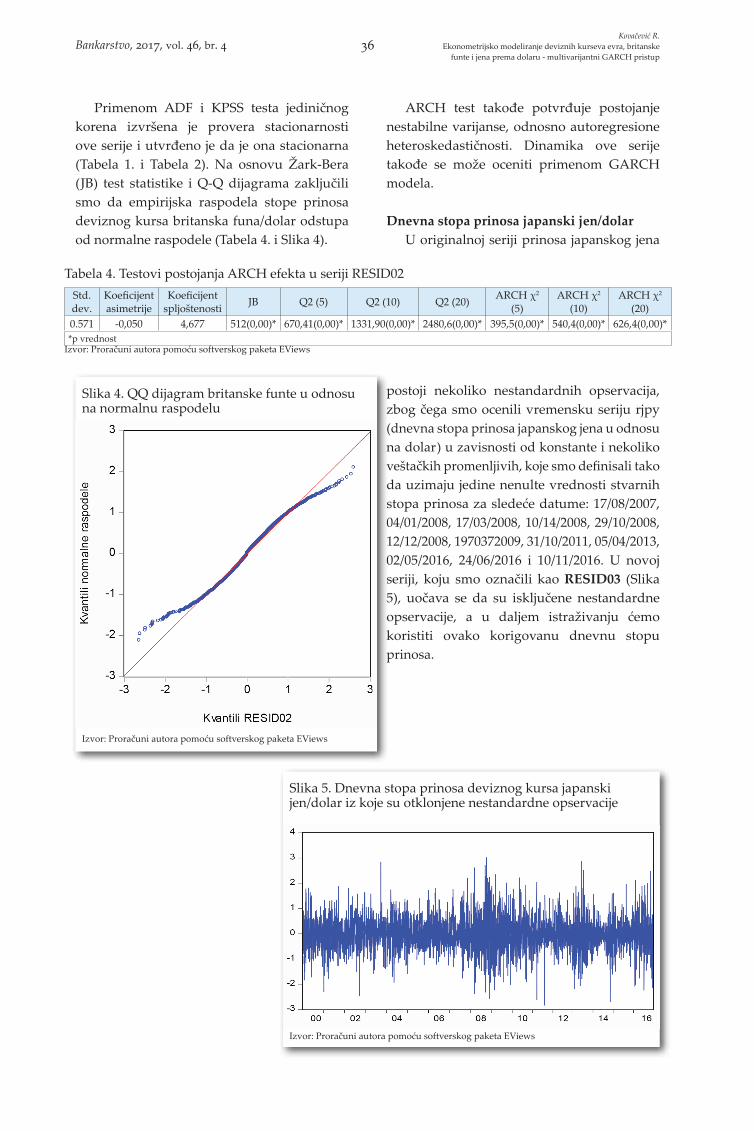
Primenom ADF i KPSS testa jediničnog korena izvršena je provera stacionarnosti ove serije i utvrđeno je da je ona stacionarna (Tabela 1. i Tabela 2). Na osnovu Žark-Bera (JB) test statistike i Q-Q dijagrama zaključili smo da empirijska raspodela stope prinosa deviznog kursa britanska funa/dolar odstupa od normalne raspodele (Tabela 4. i Slika 4).
ARCH test takođe potvrđuje postojanje nestabilne varijanse, odnosno autoregresione heteroskedastičnosti. Dinamika ove serije takođe se može oceniti primenom GARCH modela.
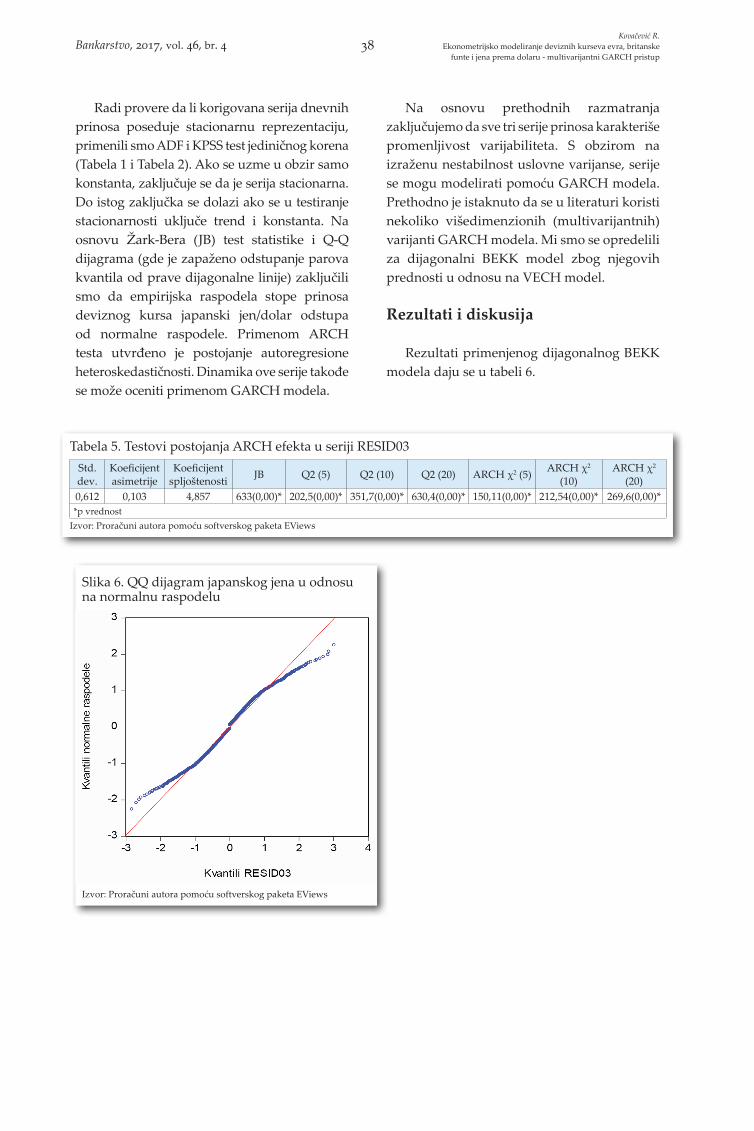
Dnevna stopa prinosa japanski jen/dolarU originalnoj seriji prinosa japanskog jena
postoji nekoliko nestandardnih opservacija, zbog čega smo ocenili vremensku seriju rjpy (dnevna stopa prinosa japanskog jena u odnosu na dolar) u zavisnosti od konstante i nekoliko veštačkih promenljivih, koje smo definisali tako da uzimaju jedine nenulte vrednosti stvarnih stopa prinosa za sledeće datume: 17/08/2007, 04/01/2008, 17/03/2008, 10/14/2008, 29/10/2008, 12/12/2008, 1970372009, 31/10/2011, 05/04/2013, 02/05/2016, 24/06/2016 i 10/11/2016. U novoj seriji, koju smo označili kao RESID03 (Slika 5), uočava se da su isključene nestandardne opservacije, a u daljem istraživanju ćemo koristiti ovako korigovanu dnevnu stopu prinosa.
Slika 4. QQ dijagram britanske funte u odnosu na normalnu raspodelu
Izvor: Proračuni autora pomoću softverskog paketa EViews
Tabela 4. Testovi postojanja ARCH efekta u seriji RESID02Std. dev.
Koeficijent asimetrije
Koeficijent spljoštenosti JB Q2 (5) Q2 (10) Q2 (20) ARCH χ2
(5)ARCH χ2
(10)ARCH χ2
(20)0.571 -0,050 4,677 512(0,00)* 670,41(0,00)* 1331,90(0,00)* 2480,6(0,00)* 395,5(0,00)* 540,4(0,00)* 626,4(0,00)**p vrednost
Izvor: Proračuni autora pomoću softverskog paketa EViews
Slika 5. Dnevna stopa prinosa deviznog kursa japanski jen/dolar iz koje su otklonjene nestandardne opservacije
Izvor: Proračuni autora pomoću softverskog paketa EViews
Kovačević R.Ekonometrijsko modeliranje deviznih kurseva evra, britanske
funte i jena prema dolaru - multivarijantni GARCH pristupBankarstvo, 2017, vol. 46, br. 4 36
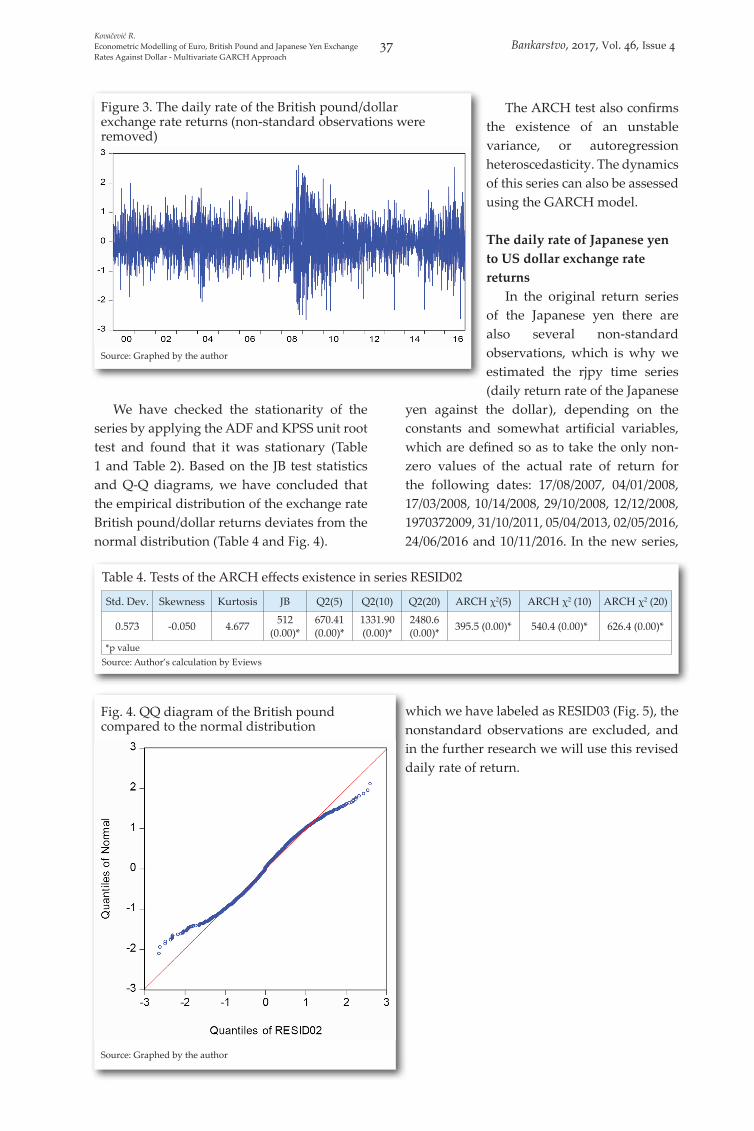
We have checked the stationarity of the series by applying the ADF and KPSS unit root test and found that it was stationary (Table 1 and Table 2). Based on the JB test statistics and Q-Q diagrams, we have concluded that the empirical distribution of the exchange rate British pound/dollar returns deviates from the normal distribution (Table 4 and Fig. 4).
The ARCH test also confirms the existence of an unstable variance, or autoregression heteroscedasticity. The dynamics of this series can also be assessed using the GARCH model.
The daily rate of Japanese yen to US dollar exchange rate returns
In the original return series of the Japanese yen there are also several non-standard observations, which is why we estimated the rjpy time series (daily return rate of the Japanese
yen against the dollar), depending on the constants and somewhat artificial variables, which are defined so as to take the only non-zero values of the actual rate of return for the following dates: 17/08/2007, 04/01/2008, 17/03/2008, 10/14/2008, 29/10/2008, 12/12/2008, 1970372009, 31/10/2011, 05/04/2013, 02/05/2016, 24/06/2016 and 10/11/2016. In the new series,
which we have labeled as RESID03 (Fig. 5), the nonstandard observations are excluded, and in the further research we will use this revised daily rate of return.
Figure 3. The daily rate of the British pound/dollar exchange rate returns (non-standard observations were removed)
Source: Graphed by the author
Fig. 4. QQ diagram of the British pound compared to the normal distribution
Source: Graphed by the author
Table 4. Tests of the ARCH effects existence in series RESID02
Std. Dev. Skewness Kurtosis JB Q2(5) Q2(10) Q2(20) ARCH χ2(5) ARCH χ2 (10) ARCH χ2 (20)
0.573 -0.050 4.677 512 (0.00)*
670.41 (0.00)*
1331.90 (0.00)*
2480.6 (0.00)* 395.5 (0.00)* 540.4 (0.00)* 626.4 (0.00)*
*p valueSource: Author’s calculation by Eviews
Kovačević R.Econometric Modelling of Euro, British Pound and Japanese Yen Exchange Rates Against Dollar - Multivariate GARCH Approach
37 Bankarstvo, 2017, Vol. 46, Issue 4
Radi provere da li korigovana serija dnevnih prinosa poseduje stacionarnu reprezentaciju, primenili smo ADF i KPSS test jediničnog korena (Tabela 1 i Tabela 2). Ako se uzme u obzir samo konstanta, zaključuje se da je serija stacionarna. Do istog zaključka se dolazi ako se u testiranje stacionarnosti uključe trend i konstanta. Na osnovu Žark-Bera (JB) test statistike i Q-Q dijagrama (gde je zapaženo odstupanje parova kvantila od prave dijagonalne linije) zaključili smo da empirijska raspodela stope prinosa deviznog kursa japanski jen/dolar odstupa od normalne raspodele. Primenom ARCH testa utvrđeno je postojanje autoregresione heteroskedastičnosti. Dinamika ove serije takođe se može oceniti primenom GARCH modela.
Na osnovu prethodnih razmatranja zaključujemo da sve tri serije prinosa karakteriše promenljivost varijabiliteta. S obzirom na izraženu nestabilnost uslovne varijanse, serije se mogu modelirati pomoću GARCH modela. Prethodno je istaknuto da se u literaturi koristi nekoliko višedimenzionih (multivarijantnih) varijanti GARCH modela. Mi smo se opredelili za dijagonalni BEKK model zbog njegovih prednosti u odnosu na VECH model.
Rezultati i diskusija
Rezultati primenjenog dijagonalnog BEKK modela daju se u tabeli 6.
Slika 6. QQ dijagram japanskog jena u odnosu na normalnu raspodelu
Izvor: Proračuni autora pomoću softverskog paketa EViews
Tabela 5. Testovi postojanja ARCH efekta u seriji RESID03Std. dev.
Koeficijent asimetrije
Koeficijent spljoštenosti JB Q2 (5) Q2 (10) Q2 (20) ARCH χ2 (5) ARCH χ2
(10)ARCH χ2
(20)0,612 0,103 4,857 633(0,00)* 202,5(0,00)* 351,7(0,00)* 630,4(0,00)* 150,11(0,00)* 212,54(0,00)* 269,6(0,00)**p vrednost
Izvor: Proračuni autora pomoću softverskog paketa EViews
Kovačević R.Ekonometrijsko modeliranje deviznih kurseva evra, britanske
funte i jena prema dolaru - multivarijantni GARCH pristupBankarstvo, 2017, vol. 46, br. 4 38
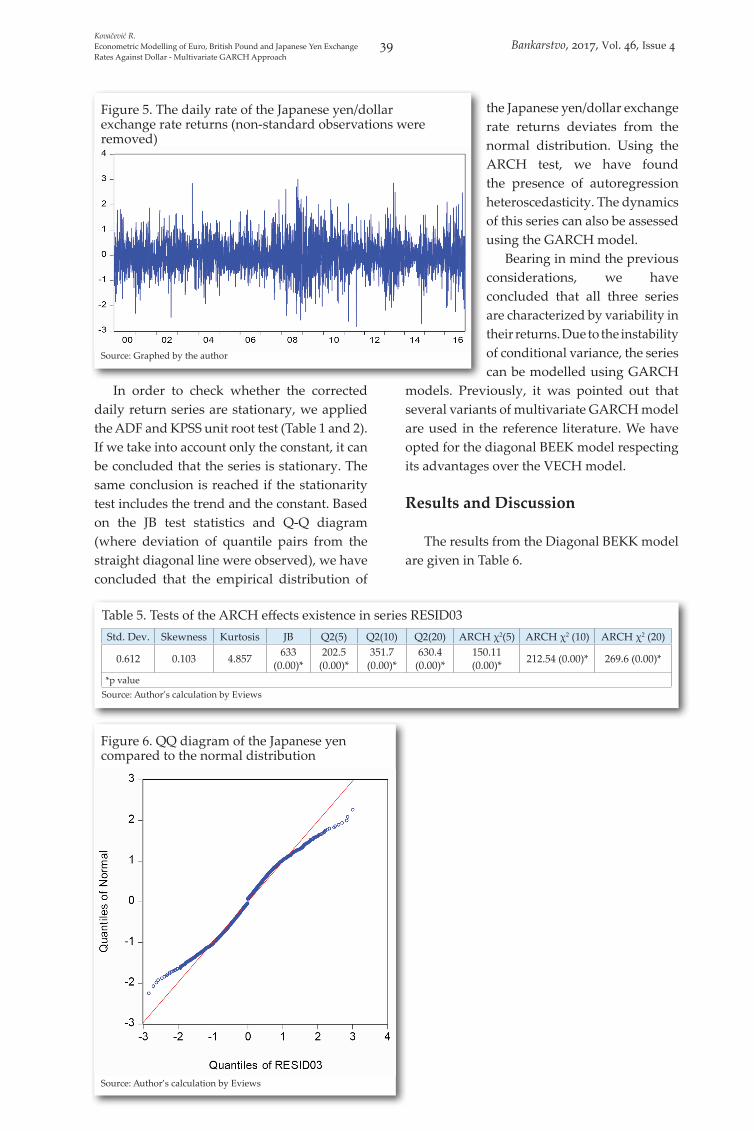
In order to check whether the corrected daily return series are stationary, we applied the ADF and KPSS unit root test (Table 1 and 2). If we take into account only the constant, it can be concluded that the series is stationary. The same conclusion is reached if the stationarity test includes the trend and the constant. Based on the JB test statistics and Q-Q diagram (where deviation of quantile pairs from the straight diagonal line were observed), we have concluded that the empirical distribution of
the Japanese yen/dollar exchange rate returns deviates from the normal distribution. Using the ARCH test, we have found the presence of autoregression heteroscedasticity. The dynamics of this series can also be assessed using the GARCH model.
Bearing in mind the previous considerations, we have concluded that all three series are characterized by variability in their returns. Due to the instability of conditional variance, the series can be modelled using GARCH
models. Previously, it was pointed out that several variants of multivariate GARCH model are used in the reference literature. We have opted for the diagonal BEEK model respecting its advantages over the VECH model.
Results and Discussion
The results from the Diagonal BEKK model are given in Table 6.
Figure 5. The daily rate of the Japanese yen/dollar exchange rate returns (non-standard observations were removed)
Source: Graphed by the author
Figure 6. QQ diagram of the Japanese yen compared to the normal distribution
Source: Author’s calculation by Eviews
Table 5. Tests of the ARCH effects existence in series RESID03Std. Dev. Skewness Kurtosis JB Q2(5) Q2(10) Q2(20) ARCH χ2(5) ARCH χ2 (10) ARCH χ2 (20)
0.612 0.103 4.857 633 (0.00)*
202.5 (0.00)*
351.7 (0.00)*
630.4 (0.00)*
150.11 (0.00)* 212.54 (0.00)* 269.6 (0.00)*
*p valueSource: Author’s calculation by Eviews
Kovačević R.Econometric Modelling of Euro, British Pound and Japanese Yen Exchange Rates Against Dollar - Multivariate GARCH Approach
39 Bankarstvo, 2017, Vol. 46, Issue 4
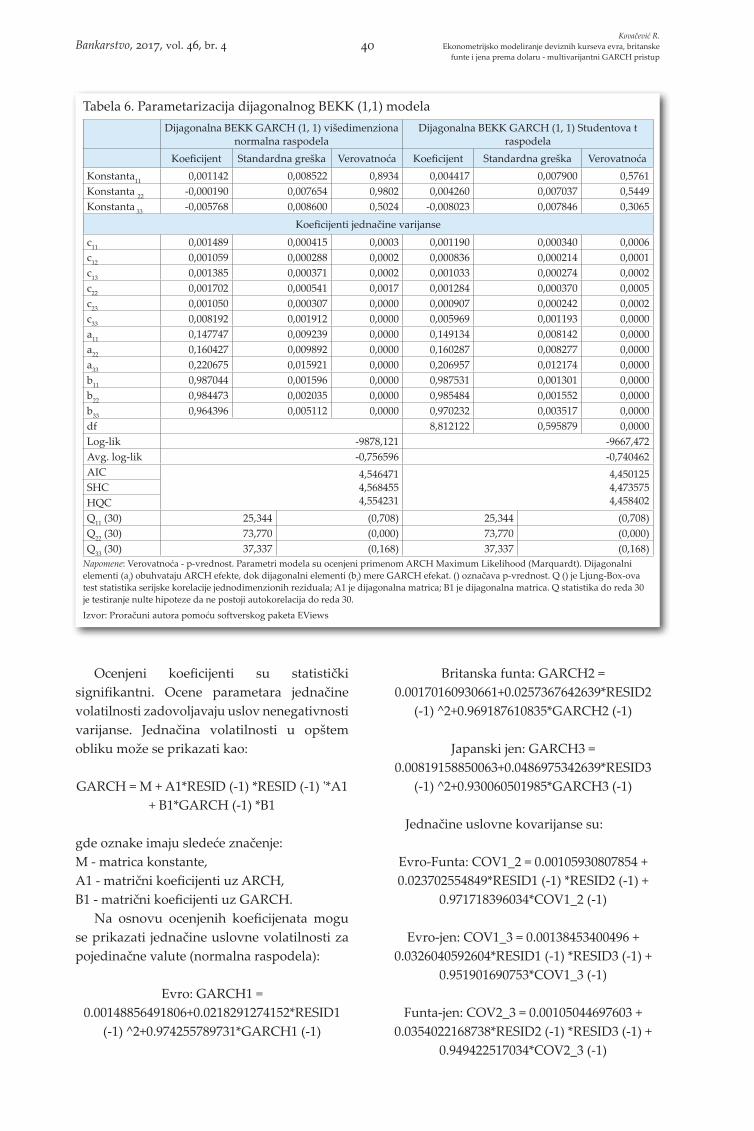
Ocenjeni koeficijenti su statistički signifikantni. Ocene parametara jednačine volatilnosti zadovoljavaju uslov nenegativnosti varijanse. Jednačina volatilnosti u opštem obliku može se prikazati kao:
GARCH = M + A1*RESID (-1) *RESID (-1) '*A1 + B1*GARCH (-1) *B1
gde oznake imaju sledeće značenje:M - matrica konstante,A1 - matrični koeficijenti uz ARCH,B1 - matrični koeficijenti uz GARCH.
Na osnovu ocenjenih koeficijenata mogu se prikazati jednačine uslovne volatilnosti za pojedinačne valute (normalna raspodela):
Evro: GARCH1 = 0.00148856491806+0.0218291274152*RESID1
(-1) ^2+0.974255789731*GARCH1 (-1)
Britanska funta: GARCH2 = 0.00170160930661+0.0257367642639*RESID2
(-1) ^2+0.969187610835*GARCH2 (-1)
Japanski jen: GARCH3 = 0.00819158850063+0.0486975342639*RESID3
(-1) ^2+0.930060501985*GARCH3 (-1)
Jednačine uslovne kovarijanse su:
Evro-Funta: COV1_2 = 0.00105930807854 + 0.023702554849*RESID1 (-1) *RESID2 (-1) +
0.971718396034*COV1_2 (-1)
Evro-jen: COV1_3 = 0.00138453400496 + 0.0326040592604*RESID1 (-1) *RESID3 (-1) +
0.951901690753*COV1_3 (-1)
Funta-jen: COV2_3 = 0.00105044697603 + 0.0354022168738*RESID2 (-1) *RESID3 (-1) +
0.949422517034*COV2_3 (-1)
Tabela 6. Parametarizacija dijagonalnog BEKK (1,1) modelaDijagonalna BEKK GARCH (1, 1) višedimenziona
normalna raspodelaDijagonalna BEKK GARCH (1, 1) Studentova t
raspodelaKoeficijent Standardna greška Verovatnoća Koeficijent Standardna greška Verovatnoća
Konstanta11 0,001142 0,008522 0,8934 0,004417 0,007900 0,5761Konstanta 22 -0,000190 0,007654 0,9802 0,004260 0,007037 0,5449Konstanta 33 -0,005768 0,008600 0,5024 -0,008023 0,007846 0,3065
Koeficijenti jednačine varijansec11 0,001489 0,000415 0,0003 0,001190 0,000340 0,0006c12 0,001059 0,000288 0,0002 0,000836 0,000214 0,0001c13 0,001385 0,000371 0,0002 0,001033 0,000274 0,0002c22 0,001702 0,000541 0,0017 0,001284 0,000370 0,0005c23 0,001050 0,000307 0,0000 0,000907 0,000242 0,0002c33 0,008192 0,001912 0,0000 0,005969 0,001193 0,0000a11 0,147747 0,009239 0,0000 0,149134 0,008142 0,0000a22 0,160427 0,009892 0,0000 0,160287 0,008277 0,0000a33 0,220675 0,015921 0,0000 0,206957 0,012174 0,0000b11 0,987044 0,001596 0,0000 0,987531 0,001301 0,0000b22 0,984473 0,002035 0,0000 0,985484 0,001552 0,0000b33 0,964396 0,005112 0,0000 0,970232 0,003517 0,0000df 8,812122 0,595879 0,0000Log-lik -9878,121 -9667,472Avg. log-lik -0,756596 -0,740462AIC 4,546471
4,5684554,554231
4,4501254,4735754,458402
SHCHQCQ11 (30) 25,344 (0,708) 25,344 (0,708)Q22 (30) 73,770 (0,000) 73,770 (0,000)Q33 (30) 37,337 (0,168) 37,337 (0,168)
Napomene: Verovatnoća - p-vrednost. Parametri modela su ocenjeni primenom ARCH Maximum Likelihood (Marquardt). Dijagonalni elementi (ai) obuhvataju ARCH efekte, dok dijagonalni elementi (bi) mere GARCH efekat. () označava p-vrednost. Q () je Ljung-Box-ova test statistika serijske korelacije jednodimenzionih reziduala; A1 je dijagonalna matrica; B1 je dijagonalna matrica. Q statistika do reda 30 je testiranje nulte hipoteze da ne postoji autokorelacija do reda 30.
Izvor: Proračuni autora pomoću softverskog paketa EViews
Kovačević R.Ekonometrijsko modeliranje deviznih kurseva evra, britanske
funte i jena prema dolaru - multivarijantni GARCH pristupBankarstvo, 2017, vol. 46, br. 4 40
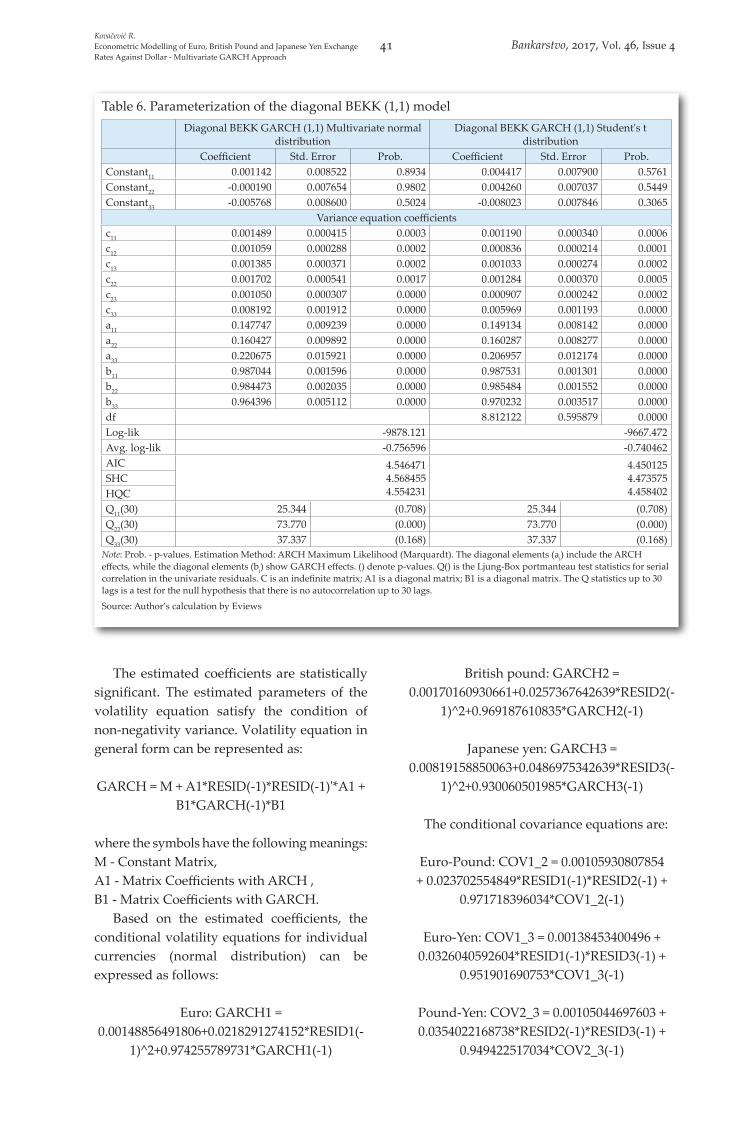
The estimated coefficients are statistically significant. The estimated parameters of the volatility equation satisfy the condition of non-negativity variance. Volatility equation in general form can be represented as:
GARCH = M + A1*RESID(-1)*RESID(-1)'*A1 + B1*GARCH(-1)*B1
where the symbols have the following meanings:M - Constant Matrix,A1 - Matrix Coefficients with ARCH ,B1 - Matrix Coefficients with GARCH.
Based on the estimated coefficients, the conditional volatility equations for individual currencies (normal distribution) can be expressed as follows:
Euro: GARCH1 = 0.00148856491806+0.0218291274152*RESID1(-
1)^2+0.974255789731*GARCH1(-1)
British pound: GARCH2 = 0.00170160930661+0.0257367642639*RESID2(-
1)^2+0.969187610835*GARCH2(-1)
Japanese yen: GARCH3 = 0.00819158850063+0.0486975342639*RESID3(-
1)^2+0.930060501985*GARCH3(-1)
The conditional covariance equations are:
Euro-Pound: COV1_2 = 0.00105930807854 + 0.023702554849*RESID1(-1)*RESID2(-1) +
0.971718396034*COV1_2(-1)
Euro-Yen: COV1_3 = 0.00138453400496 + 0.0326040592604*RESID1(-1)*RESID3(-1) +
0.951901690753*COV1_3(-1)
Pound-Yen: COV2_3 = 0.00105044697603 + 0.0354022168738*RESID2(-1)*RESID3(-1) +
0.949422517034*COV2_3(-1)
Table 6. Parameterization of the diagonal BEKK (1,1) modelDiagonal BEKK GARCH (1,1) Multivariate normal
distributionDiagonal BEKK GARCH (1,1) Student's t
distributionCoefficient Std. Error Prob. Coefficient Std. Error Prob.
Constant11 0.001142 0.008522 0.8934 0.004417 0.007900 0.5761Constant22 -0.000190 0.007654 0.9802 0.004260 0.007037 0.5449Constant33 -0.005768 0.008600 0.5024 -0.008023 0.007846 0.3065
Variance equation coefficientsc11 0.001489 0.000415 0.0003 0.001190 0.000340 0.0006c12 0.001059 0.000288 0.0002 0.000836 0.000214 0.0001c13 0.001385 0.000371 0.0002 0.001033 0.000274 0.0002c22 0.001702 0.000541 0.0017 0.001284 0.000370 0.0005c23 0.001050 0.000307 0.0000 0.000907 0.000242 0.0002c33 0.008192 0.001912 0.0000 0.005969 0.001193 0.0000a11 0.147747 0.009239 0.0000 0.149134 0.008142 0.0000a22 0.160427 0.009892 0.0000 0.160287 0.008277 0.0000a33 0.220675 0.015921 0.0000 0.206957 0.012174 0.0000b11 0.987044 0.001596 0.0000 0.987531 0.001301 0.0000b22 0.984473 0.002035 0.0000 0.985484 0.001552 0.0000b33 0.964396 0.005112 0.0000 0.970232 0.003517 0.0000df 8.812122 0.595879 0.0000Log-lik -9878.121 -9667.472Avg. log-lik -0.756596 -0.740462AIC 4.546471
4.5684554.554231
4.4501254.4735754.458402
SHCHQCQ11(30) 25.344 (0.708) 25.344 (0.708)Q22(30) 73.770 (0.000) 73.770 (0.000)Q33(30) 37.337 (0.168) 37.337 (0.168)
Note: Prob. - p-values. Estimation Method: ARCH Maximum Likelihood (Marquardt). The diagonal elements (ai) include the ARCH effects, while the diagonal elements (bi) show GARCH effects. () denote p-values. Q() is the Ljung-Box portmanteau test statistics for serial correlation in the univariate residuals. C is an indefinite matrix; A1 is a diagonal matrix; B1 is a diagonal matrix. The Q statistics up to 30 lags is a test for the null hypothesis that there is no autocorrelation up to 30 lags.
Source: Author’s calculation by Eviews
Kovačević R.Econometric Modelling of Euro, British Pound and Japanese Yen Exchange Rates Against Dollar - Multivariate GARCH Approach
41 Bankarstvo, 2017, Vol. 46, Issue 4
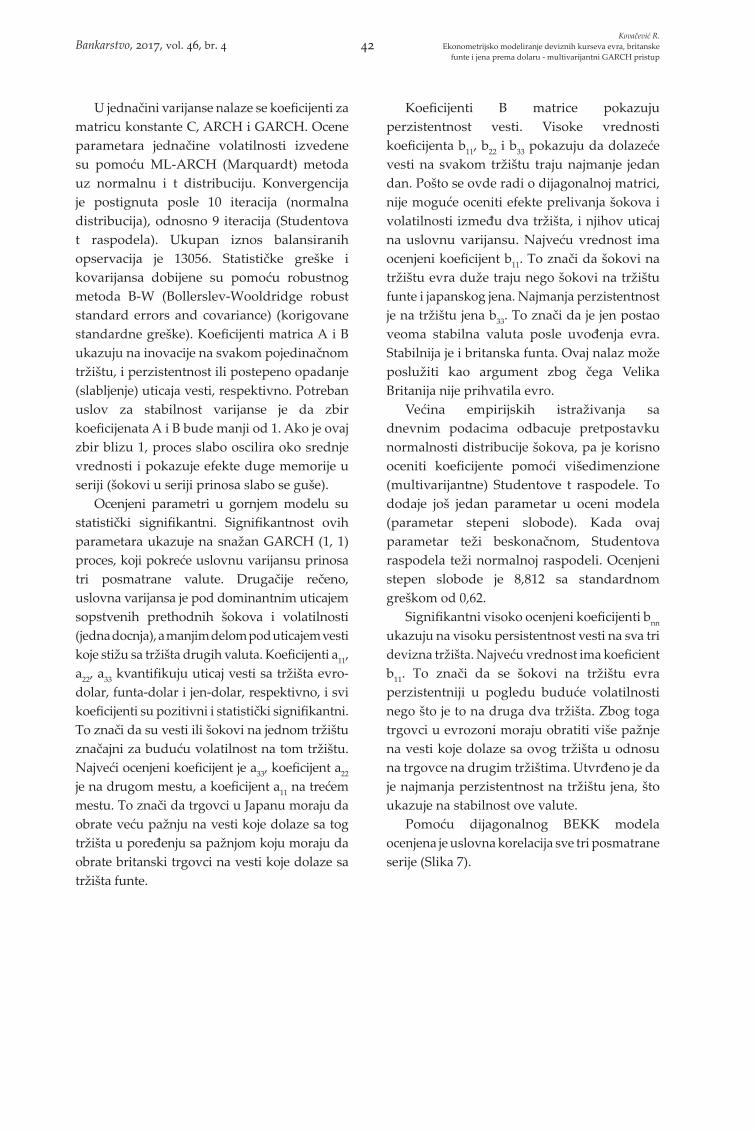
U jednačini varijanse nalaze se koeficijenti za matricu konstante C, ARCH i GARCH. Ocene parametara jednačine volatilnosti izvedene su pomoću ML-ARCH (Marquardt) metoda uz normalnu i t distribuciju. Konvergencija je postignuta posle 10 iteracija (normalna distribucija), odnosno 9 iteracija (Studentova t raspodela). Ukupan iznos balansiranih opservacija je 13056. Statističke greške i kovarijansa dobijene su pomoću robustnog metoda B-W (Bollerslev-Wooldridge robust standard errors and covariance) (korigovane standardne greške). Koeficijenti matrica A i B ukazuju na inovacije na svakom pojedinačnom tržištu, i perzistentnost ili postepeno opadanje (slabljenje) uticaja vesti, respektivno. Potreban uslov za stabilnost varijanse je da zbir koeficijenata A i B bude manji od 1. Ako je ovaj zbir blizu 1, proces slabo oscilira oko srednje vrednosti i pokazuje efekte duge memorije u seriji (šokovi u seriji prinosa slabo se guše).
Ocenjeni parametri u gornjem modelu su statistički signifikantni. Signifikantnost ovih parametara ukazuje na snažan GARCH (1, 1) proces, koji pokreće uslovnu varijansu prinosa tri posmatrane valute. Drugačije rečeno, uslovna varijansa je pod dominantnim uticajem sopstvenih prethodnih šokova i volatilnosti (jedna docnja), a manjim delom pod uticajem vesti koje stižu sa tržišta drugih valuta. Koeficijenti a11, a22, a33 kvantifikuju uticaj vesti sa tržišta evro-dolar, funta-dolar i jen-dolar, respektivno, i svi koeficijenti su pozitivni i statistički signifikantni. To znači da su vesti ili šokovi na jednom tržištu značajni za buduću volatilnost na tom tržištu. Najveći ocenjeni koeficijent je a33, koeficijent a22 je na drugom mestu, a koeficijent a11 na trećem mestu. To znači da trgovci u Japanu moraju da obrate veću pažnju na vesti koje dolaze sa tog tržišta u poređenju sa pažnjom koju moraju da obrate britanski trgovci na vesti koje dolaze sa tržišta funte.
Koeficijenti B matrice pokazuju perzistentnost vesti. Visoke vrednosti koeficijenta b11, b22 i b33 pokazuju da dolazeće vesti na svakom tržištu traju najmanje jedan dan. Pošto se ovde radi o dijagonalnoj matrici, nije moguće oceniti efekte prelivanja šokova i volatilnosti između dva tržišta, i njihov uticaj na uslovnu varijansu. Najveću vrednost ima ocenjeni koeficijent b11. To znači da šokovi na tržištu evra duže traju nego šokovi na tržištu funte i japanskog jena. Najmanja perzistentnost je na tržištu jena b33. To znači da je jen postao veoma stabilna valuta posle uvođenja evra. Stabilnija je i britanska funta. Ovaj nalaz može poslužiti kao argument zbog čega Velika Britanija nije prihvatila evro.
Većina empirijskih istraživanja sa dnevnim podacima odbacuje pretpostavku normalnosti distribucije šokova, pa je korisno oceniti koeficijente pomoći višedimenzione (multivarijantne) Studentove t raspodele. To dodaje još jedan parametar u oceni modela (parametar stepeni slobode). Kada ovaj parametar teži beskonačnom, Studentova raspodela teži normalnoj raspodeli. Ocenjeni stepen slobode je 8,812 sa standardnom greškom od 0,62.
Signifikantni visoko ocenjeni koeficijenti bnn ukazuju na visoku persistentnost vesti na sva tri devizna tržišta. Najveću vrednost ima koeficient b11. To znači da se šokovi na tržištu evra perzistentniji u pogledu buduće volatilnosti nego što je to na druga dva tržišta. Zbog toga trgovci u evrozoni moraju obratiti više pažnje na vesti koje dolaze sa ovog tržišta u odnosu na trgovce na drugim tržištima. Utvrđeno je da je najmanja perzistentnost na tržištu jena, što ukazuje na stabilnost ove valute.
Pomoću dijagonalnog BEKK modela ocenjena je uslovna korelacija sve tri posmatrane serije (Slika 7).
Kovačević R.Ekonometrijsko modeliranje deviznih kurseva evra, britanske
funte i jena prema dolaru - multivarijantni GARCH pristupBankarstvo, 2017, vol. 46, br. 4 42
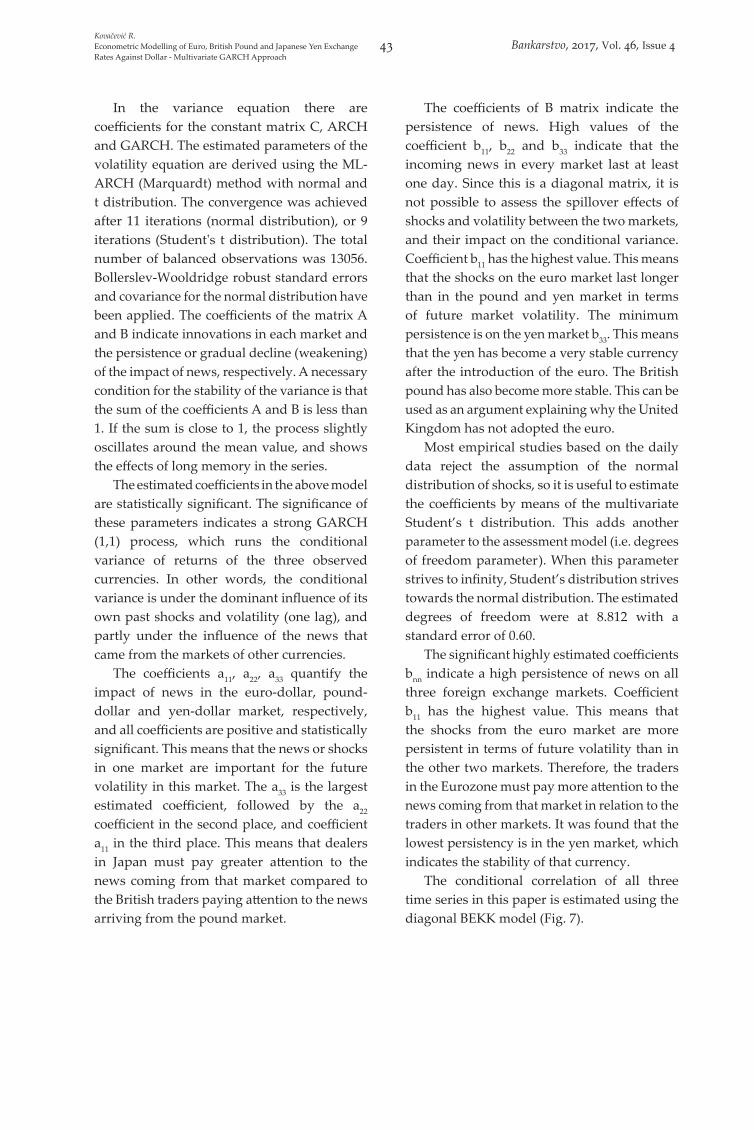
In the variance equation there are coefficients for the constant matrix C, ARCH and GARCH. The estimated parameters of the volatility equation are derived using the ML-ARCH (Marquardt) method with normal and t distribution. The convergence was achieved after 11 iterations (normal distribution), or 9 iterations (Student's t distribution). The total number of balanced observations was 13056. Bollerslev-Wooldridge robust standard errors and covariance for the normal distribution have been applied. The coefficients of the matrix A and B indicate innovations in each market and the persistence or gradual decline (weakening) of the impact of news, respectively. A necessary condition for the stability of the variance is that the sum of the coefficients A and B is less than 1. If the sum is close to 1, the process slightly oscillates around the mean value, and shows the effects of long memory in the series.
The estimated coefficients in the above model are statistically significant. The significance of these parameters indicates a strong GARCH (1,1) process, which runs the conditional variance of returns of the three observed currencies. In other words, the conditional variance is under the dominant influence of its own past shocks and volatility (one lag), and partly under the influence of the news that came from the markets of other currencies.
The coefficients a11, a22, a33 quantify the impact of news in the euro-dollar, pound-dollar and yen-dollar market, respectively, and all coefficients are positive and statistically significant. This means that the news or shocks in one market are important for the future volatility in this market. The a33 is the largest estimated coefficient, followed by the a22 coefficient in the second place, and coefficient a11 in the third place. This means that dealers in Japan must pay greater attention to the news coming from that market compared to the British traders paying attention to the news arriving from the pound market.
The coefficients of B matrix indicate the persistence of news. High values of the coefficient b11, b22 and b33 indicate that the incoming news in every market last at least one day. Since this is a diagonal matrix, it is not possible to assess the spillover effects of shocks and volatility between the two markets, and their impact on the conditional variance. Coefficient b11 has the highest value. This means that the shocks on the euro market last longer than in the pound and yen market in terms of future market volatility. The minimum persistence is on the yen market b33. This means that the yen has become a very stable currency after the introduction of the euro. The British pound has also become more stable. This can be used as an argument explaining why the United Kingdom has not adopted the euro.
Most empirical studies based on the daily data reject the assumption of the normal distribution of shocks, so it is useful to estimate the coefficients by means of the multivariate Student’s t distribution. This adds another parameter to the assessment model (i.e. degrees of freedom parameter). When this parameter strives to infinity, Student’s distribution strives towards the normal distribution. The estimated degrees of freedom were at 8.812 with a standard error of 0.60.
The significant highly estimated coefficients bnn indicate a high persistence of news on all three foreign exchange markets. Coefficient b11 has the highest value. This means that the shocks from the euro market are more persistent in terms of future volatility than in the other two markets. Therefore, the traders in the Eurozone must pay more attention to the news coming from that market in relation to the traders in other markets. It was found that the lowest persistency is in the yen market, which indicates the stability of that currency.
The conditional correlation of all three time series in this paper is estimated using the diagonal BEKK model (Fig. 7).
Kovačević R.Econometric Modelling of Euro, British Pound and Japanese Yen Exchange Rates Against Dollar - Multivariate GARCH Approach
43 Bankarstvo, 2017, Vol. 46, Issue 4
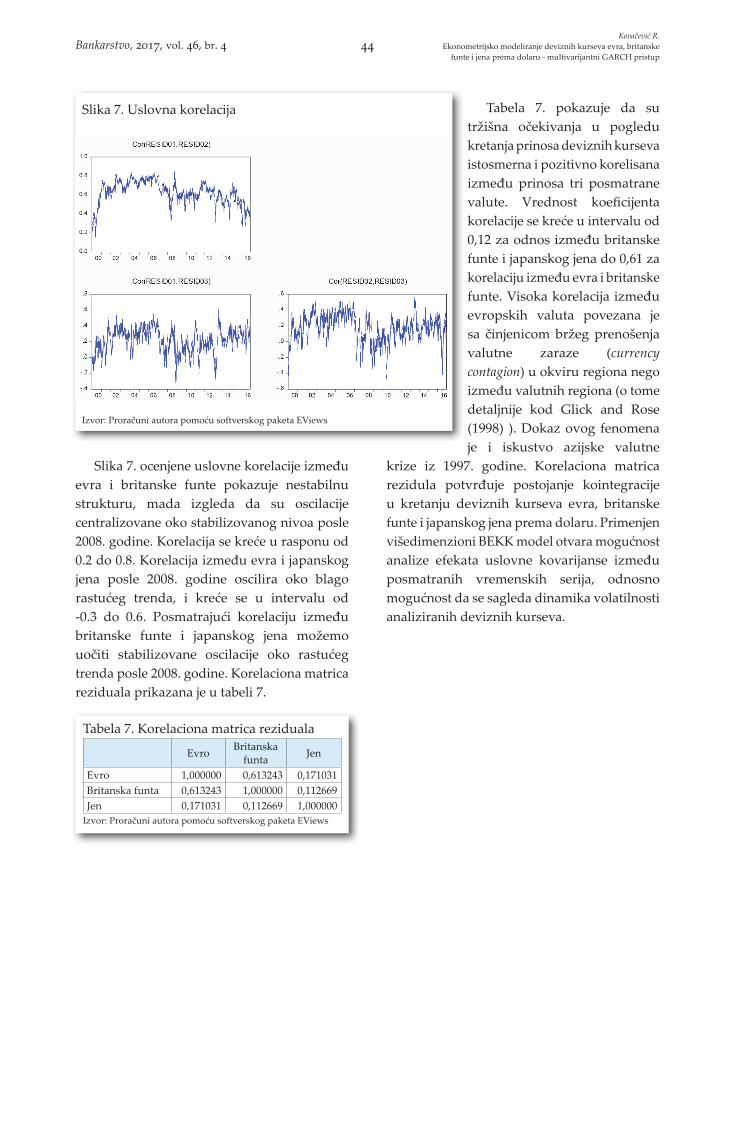
Slika 7. ocenjene uslovne korelacije između evra i britanske funte pokazuje nestabilnu strukturu, mada izgleda da su oscilacije centralizovane oko stabilizovanog nivoa posle 2008. godine. Korelacija se kreće u rasponu od 0.2 do 0.8. Korelacija između evra i japanskog jena posle 2008. godine oscilira oko blago rastućeg trenda, i kreće se u intervalu od -0.3 do 0.6. Posmatrajući korelaciju između britanske funte i japanskog jena možemo uočiti stabilizovane oscilacije oko rastućeg trenda posle 2008. godine. Korelaciona matrica reziduala prikazana je u tabeli 7.
Tabela 7. pokazuje da su tržišna očekivanja u pogledu kretanja prinosa deviznih kurseva istosmerna i pozitivno korelisana između prinosa tri posmatrane valute. Vrednost koeficijenta korelacije se kreće u intervalu od 0,12 za odnos između britanske funte i japanskog jena do 0,61 za korelaciju između evra i britanske funte. Visoka korelacija između evropskih valuta povezana je sa činjenicom bržeg prenošenja valutne zaraze (currency contagion) u okviru regiona nego između valutnih regiona (o tome detaljnije kod Glick and Rose (1998) ). Dokaz ovog fenomena je i iskustvo azijske valutne
krize iz 1997. godine. Korelaciona matrica rezidula potvrđuje postojanje kointegracije u kretanju deviznih kurseva evra, britanske funte i japanskog jena prema dolaru. Primenjen višedimenzioni BEKK model otvara mogućnost analize efekata uslovne kovarijanse između posmatranih vremenskih serija, odnosno mogućnost da se sagleda dinamika volatilnosti analiziranih deviznih kurseva.
Slika 7. Uslovna korelacija
Izvor: Proračuni autora pomoću softverskog paketa EViews
Tabela 7. Korelaciona matrica reziduala
Evro Britanska funta Jen
Evro 1,000000 0,613243 0,171031Britanska funta 0,613243 1,000000 0,112669Jen 0,171031 0,112669 1,000000
Izvor: Proračuni autora pomoću softverskog paketa EViews
Kovačević R.Ekonometrijsko modeliranje deviznih kurseva evra, britanske
funte i jena prema dolaru - multivarijantni GARCH pristupBankarstvo, 2017, vol. 46, br. 4 44
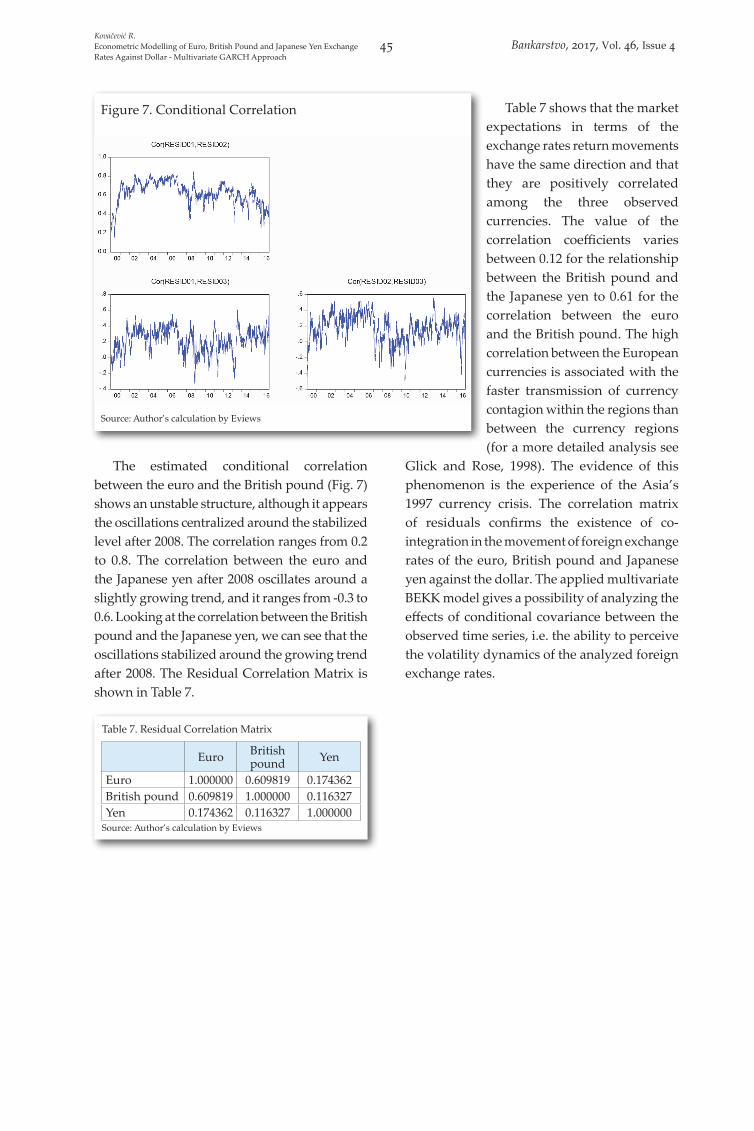
The estimated conditional correlation between the euro and the British pound (Fig. 7) shows an unstable structure, although it appears the oscillations centralized around the stabilized level after 2008. The correlation ranges from 0.2 to 0.8. The correlation between the euro and the Japanese yen after 2008 oscillates around a slightly growing trend, and it ranges from -0.3 to 0.6. Looking at the correlation between the British pound and the Japanese yen, we can see that the oscillations stabilized around the growing trend after 2008. The Residual Correlation Matrix is shown in Table 7.
Table 7 shows that the market expectations in terms of the exchange rates return movements have the same direction and that they are positively correlated among the three observed currencies. The value of the correlation coefficients varies between 0.12 for the relationship between the British pound and the Japanese yen to 0.61 for the correlation between the euro and the British pound. The high correlation between the European currencies is associated with the faster transmission of currency contagion within the regions than between the currency regions (for a more detailed analysis see
Glick and Rose, 1998). The evidence of this phenomenon is the experience of the Asia’s 1997 currency crisis. The correlation matrix of residuals confirms the existence of co-integration in the movement of foreign exchange rates of the euro, British pound and Japanese yen against the dollar. The applied multivariate BEKK model gives a possibility of analyzing the effects of conditional covariance between the observed time series, i.e. the ability to perceive the volatility dynamics of the analyzed foreign exchange rates.
Figure 7. Conditional Correlation
Source: Author’s calculation by Eviews
Table 7. Residual Correlation Matrix
Euro British pound Yen
Euro 1.000000 0.609819 0.174362British pound 0.609819 1.000000 0.116327Yen 0.174362 0.116327 1.000000
Source: Author’s calculation by Eviews
Kovačević R.Econometric Modelling of Euro, British Pound and Japanese Yen Exchange Rates Against Dollar - Multivariate GARCH Approach
45 Bankarstvo, 2017, Vol. 46, Issue 4
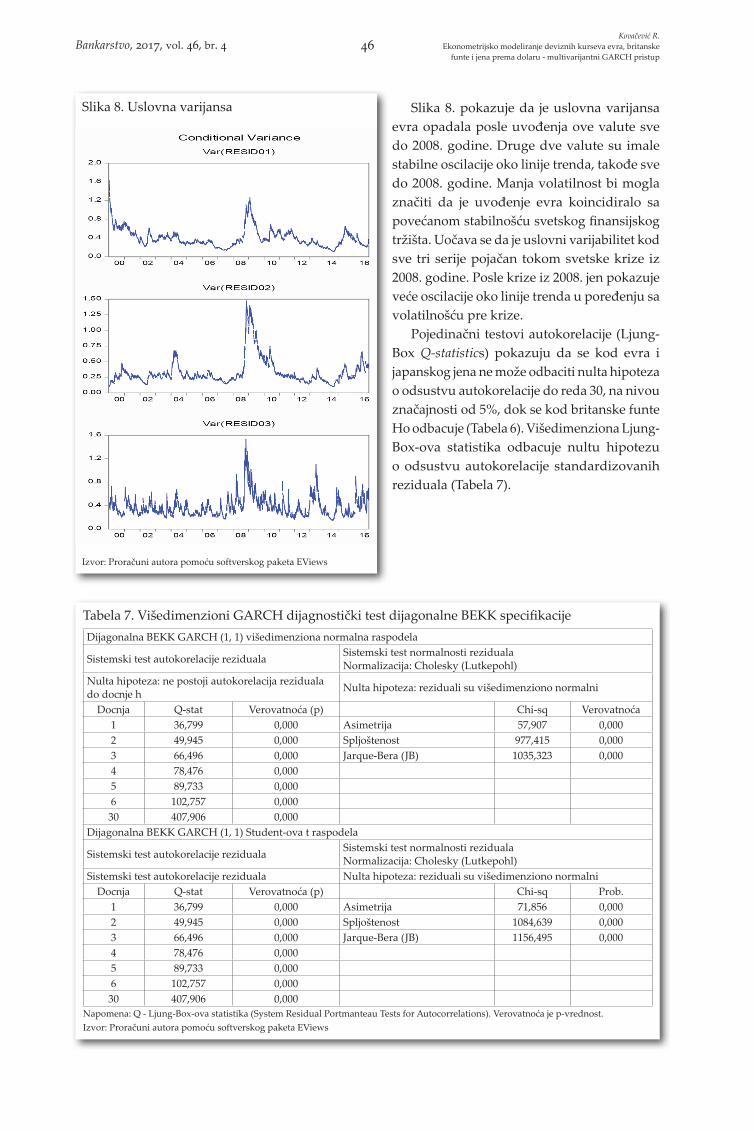
Slika 8. pokazuje da je uslovna varijansa evra opadala posle uvođenja ove valute sve do 2008. godine. Druge dve valute su imale stabilne oscilacije oko linije trenda, takođe sve do 2008. godine. Manja volatilnost bi mogla značiti da je uvođenje evra koincidiralo sa povećanom stabilnošću svetskog finansijskog tržišta. Uočava se da je uslovni varijabilitet kod sve tri serije pojačan tokom svetske krize iz 2008. godine. Posle krize iz 2008. jen pokazuje veće oscilacije oko linije trenda u poređenju sa volatilnošću pre krize.
Pojedinačni testovi autokorelacije (Ljung-Box Q-statistics) pokazuju da se kod evra i japanskog jena ne može odbaciti nulta hipoteza o odsustvu autokorelacije do reda 30, na nivou značajnosti od 5%, dok se kod britanske funte Ho odbacuje (Tabela 6). Višedimenziona Ljung-Box-ova statistika odbacuje nultu hipotezu o odsustvu autokorelacije standardizovanih reziduala (Tabela 7).
Slika 8. Uslovna varijansa
Izvor: Proračuni autora pomoću softverskog paketa EViews
Tabela 7. Višedimenzioni GARCH dijagnostički test dijagonalne BEKK specifikacijeDijagonalna BEKK GARCH (1, 1) višedimenziona normalna raspodela
Sistemski test autokorelacije reziduala Sistemski test normalnosti rezidualaNormalizacija: Cholesky (Lutkepohl)
Nulta hipoteza: ne postoji autokorelacija reziduala do docnje h Nulta hipoteza: reziduali su višedimenziono normalni
Docnja Q-stat Verovatnoća (p) Chi-sq Verovatnoća1 36,799 0,000 Asimetrija 57,907 0,0002 49,945 0,000 Spljoštenost 977,415 0,0003 66,496 0,000 Jarque-Bera (JB) 1035,323 0,0004 78,476 0,0005 89,733 0,0006 102,757 0,00030 407,906 0,000
Dijagonalna BEKK GARCH (1, 1) Student-ova t raspodela
Sistemski test autokorelacije reziduala Sistemski test normalnosti rezidualaNormalizacija: Cholesky (Lutkepohl)
Sistemski test autokorelacije reziduala Nulta hipoteza: reziduali su višedimenziono normalniDocnja Q-stat Verovatnoća (p) Chi-sq Prob.
1 36,799 0,000 Asimetrija 71,856 0,0002 49,945 0,000 Spljoštenost 1084,639 0,0003 66,496 0,000 Jarque-Bera (JB) 1156,495 0,0004 78,476 0,0005 89,733 0,0006 102,757 0,00030 407,906 0,000
Napomena: Q - Ljung-Box-ova statistika (System Residual Portmanteau Tests for Autocorrelations). Verovatnoća je p-vrednost.Izvor: Proračuni autora pomoću softverskog paketa EViews
Kovačević R.Ekonometrijsko modeliranje deviznih kurseva evra, britanske
funte i jena prema dolaru - multivarijantni GARCH pristupBankarstvo, 2017, vol. 46, br. 4 46
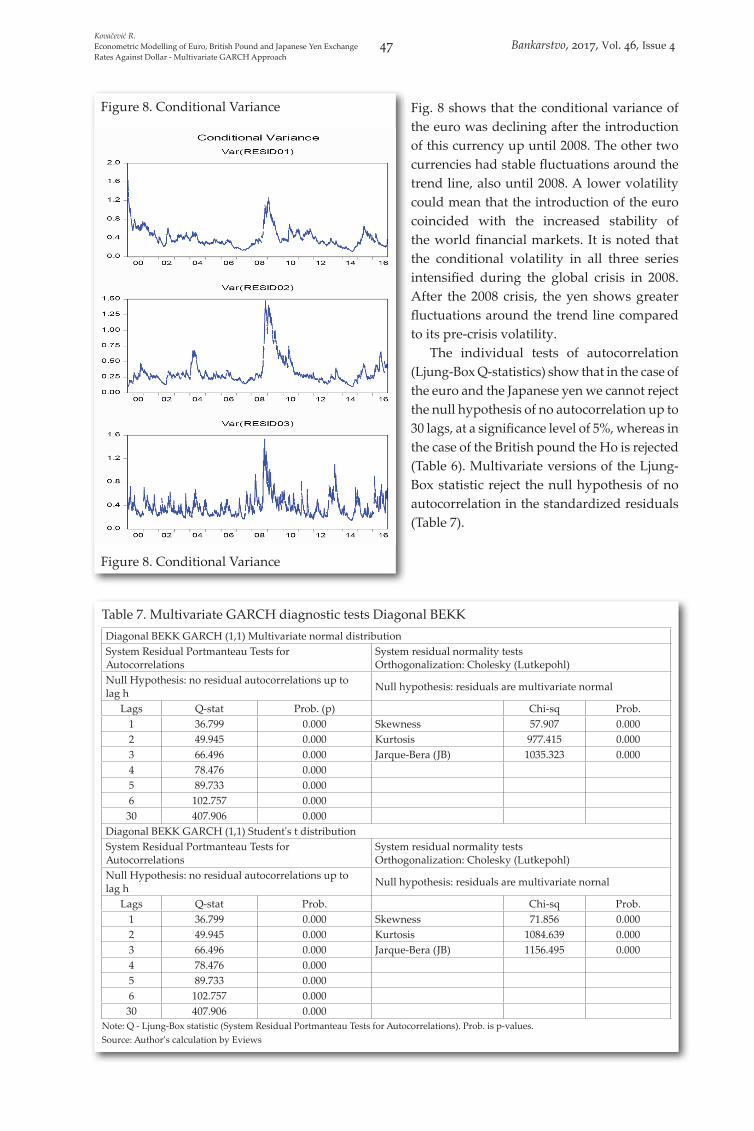
Fig. 8 shows that the conditional variance of the euro was declining after the introduction of this currency up until 2008. The other two currencies had stable fluctuations around the trend line, also until 2008. A lower volatility could mean that the introduction of the euro coincided with the increased stability of the world financial markets. It is noted that the conditional volatility in all three series intensified during the global crisis in 2008. After the 2008 crisis, the yen shows greater fluctuations around the trend line compared to its pre-crisis volatility.
The individual tests of autocorrelation (Ljung-Box Q-statistics) show that in the case of the euro and the Japanese yen we cannot reject the null hypothesis of no autocorrelation up to 30 lags, at a significance level of 5%, whereas in the case of the British pound the Ho is rejected (Table 6). Multivariate versions of the Ljung-Box statistic reject the null hypothesis of no autocorrelation in the standardized residuals (Table 7).
Figure 8. Conditional Variance
Figure 8. Conditional Variance
Table 7. Multivariate GARCH diagnostic tests Diagonal BEKKDiagonal BEKK GARCH (1,1) Multivariate normal distributionSystem Residual Portmanteau Tests for Autocorrelations
System residual normality testsOrthogonalization: Cholesky (Lutkepohl)
Null Hypothesis: no residual autocorrelations up to lag h Null hypothesis: residuals are multivariate normal
Lags Q-stat Prob. (p) Chi-sq Prob.1 36.799 0.000 Skewness 57.907 0.0002 49.945 0.000 Kurtosis 977.415 0.0003 66.496 0.000 Jarque-Bera (JB) 1035.323 0.0004 78.476 0.0005 89.733 0.0006 102.757 0.00030 407.906 0.000
Diagonal BEKK GARCH (1,1) Student's t distributionSystem Residual Portmanteau Tests for Autocorrelations
System residual normality testsOrthogonalization: Cholesky (Lutkepohl)
Null Hypothesis: no residual autocorrelations up to lag h Null hypothesis: residuals are multivariate nornal
Lags Q-stat Prob. Chi-sq Prob.1 36.799 0.000 Skewness 71.856 0.0002 49.945 0.000 Kurtosis 1084.639 0.0003 66.496 0.000 Jarque-Bera (JB) 1156.495 0.0004 78.476 0.0005 89.733 0.0006 102.757 0.00030 407.906 0.000
Note: Q - Ljung-Box statistic (System Residual Portmanteau Tests for Autocorrelations). Prob. is p-values.Source: Author’s calculation by Eviews
Kovačević R.Econometric Modelling of Euro, British Pound and Japanese Yen Exchange Rates Against Dollar - Multivariate GARCH Approach
47 Bankarstvo, 2017, Vol. 46, Issue 4
Dobijeni koeficijenti za sistemski test autokorelacije reziduala (višedimenziona normalna raspodela) su statistički značajni. Pošto su sve p vrednosti Q statistike jednake 0, nulta hipoteza se odbacuje kao neistinita na nivou značajnosti od 5%. Nije realno očekivati da model u celini otkloni serijsku korelaciju standardizovanih reziduala jer su dnevni prinosi visoko leptokurtic.
Koeficijenti asimetrije (skewness-α3) pojedinačno za evro i britansku funtu su manji od nule, što znači da je raspodela asimetrična ulevo. Koeficijent spljoštenosti (Kurtosis-α4) za sva tri koeficijenta pojedinačno je veći od 3. To znači da su repovi raspodele teži od repova normalne raspodele. Dakle, empirijska raspodela odstupa od normalne raspodele. Na osnovu JB statistike odbacuje se nulta hipoteza. Odsustvo normale distribucije još uvek predstavlja teškoću, mada je korišćen Bollerslev-Wooldridge robust standard errors & covariance metod, jer je estimator konzistentan ali ne i asimptotski efikasan. Isti zaključci se odnose na t distribuciju.
Zaključak
U ovom radu je ispitivana zajednička volatilnost evra, funte i japanskog jena prema američkom dolaru u periodu 03.01.2000. do 30.12.2016. (ukupno 4353 podatka za svaku vremensku seriju). Ovaj rad doprinosi literaturi koja proučava zajedničku volatilnost
deviznih kurseva na nekoliko načina. Prvo, tako što ispituje kakav je uticaj finansijske krize iz 2008. na zajedničko kretanje deviznih kurseva ključnih valuta u svetskoj privredi: evro, britanska funta i japanski jen, u odnosu na američki dolar. Drugo, u radu je primenjen višedimenzioni dijagonalni BEKK GARCH model, kao fleksibilnija varijanta GARCH modela. Pomoću ovog modela modelirana je uslovna varijansa (uslovna heteroskedastičnost) prinosa vremenskih serija deviznog kursa evra, japanskog jena i britanske funte prema američkom dolaru. Promena deviznog kursa prema dolaru u vremenskom nizu posmatra se kao prinos date valute. U radu je ocenjena dinamika volatilnosti deviznih kurseva i utvrđeno je da je uslovni varijabilitet kod sve tri serije pojačan tokom svetske finansijske krize iz 2008. godine. Na osnovu ocenjene uslovne korelacije uočen je najveći stepen korelacije između evra i britanske funte, što se uklapa u činjenicu po kojoj je valutna zaraza više intra-regionalni nego inter-regionalni fenomen. Dokaz ovog fenomena je i iskustvo azijske valutne krize iz 1997. godine. Korelaciona matrica rezidula potvrđuje postojanje kointegracije u kretanju deviznih kurseva evra, britanske funte i japanskog jena prema dolaru. Primenjen višedimenzioni BEKK model otvara mogućnost analize efekata uslovne kovarijanse između posmatranih vremenskih serija, odnosno mogućnost da se sagleda dinamika volatilnosti analiziranih deviznih kurseva.
Kovačević R.Ekonometrijsko modeliranje deviznih kurseva evra, britanske
funte i jena prema dolaru - multivarijantni GARCH pristupBankarstvo, 2017, vol. 46, br. 4 48
The coefficients of the System Residual Portmanteau Autocorrelation Tests (multivariate normal distribution) are statistically significant. Since all p values of Q statistic equal 0, the Null Hypotheses is dismissed at the level of significance of 5%. It is not realistic to expect the model on the whole to eliminate the serial correlation of standardized residuals because the high daily returns are leptokurtic.
The estimated coefficients of asymmetry (skewness-α3) individually for the euro and the British pound are less than zero, which means that the distribution is skewed to the left. The estimates of kurtosis α4 for all three currencies individually are higher than 3. This means that the tails of the distribution are heavier than the tails of the normal distribution. Thus, the empirical distribution deviates from the normal distribution. Based on the statistics of JB, the system residual normality tests (normal distribution) rejects the null hypothesis. The absence of normal distribution is still a difficulty, although we used the Bollerslev-Wooldridge robust standard errors and covariance method because the estimator is consistent but not asymptotically efficient. The same conclusions apply to t-distribution.
Conclusion
In this paper we examined the exchange rate volatility comovements of the euro, the pound and the yen against the dollar in the period 03.01.2000 to 30.12.2016 (a total of 4353 pieces of data for each time series). This paper contributes to the literature that studies the volatility comovements of exchange rates in
several ways. First, we examined the impact of the financial crisis of 2008 on the joint movement of the exchange rates of key currencies in the world economy: the euro, British pound and Japanese yen versus the US dollar. Secondly, the methodological framework we used included the multivariate diagonal BEKK GARCH model as a more flexible variant of GARCH models. Using this model, the conditional variance of the exchange rate returns of the euro, the Japanese yen and the British pound versus the US dollar is modelled in this paper. The changes in exchange rates versus the dollar in the time series are seen as returns of that currency. The paper estimated the dynamics of volatility in exchange rates, and we found that the conditional volatility in all three series was reinforced during the global financial crisis of 2008. According to the estimated conditional correlations, the highest degree of correlation between the euro and the British pound was observed in the paper, which is in line with the fact that the currency contagion is more of an intra-regional than an inter-regional phenomenon. The experience of the 1997 Asian currency crisis can be seen as the evidence of this phenomenon. The correlation matrix of residuals confirms the existence of co-integration in the movement of foreign exchange rates of the euro, British pound and Japanese yen versus the dollar. The conclusion can be drawn that the applied multivariate BEKK model opens up the possibility of analyzing the effects of conditional covariance between the observed time series, i.e. the ability to perceive the volatility dynamics of the analyzed foreign exchange rates.
Kovačević R.Econometric Modelling of Euro, British Pound and Japanese Yen Exchange Rates Against Dollar - Multivariate GARCH Approach
49 Bankarstvo, 2017, Vol. 46, Issue 4
Literatura / References
1. Antonakakis, N. 2012. Exchange return co-movements and volatility spillovers before and after the introduction of Euro. MPRA Paper No. 37869, http://mpra.ub.uni-muenchen.de/37869. Accessed 18.10.2016.
2. Baba, Y., Engle, R. F., Kraft, D. and K. F. Kroner, K. F. 1989. Multivariate Simultaneous Generalized ARCH, University of California, San Diego (UCSD), Department of Economics.
3. Boero, G., Silvapulle, P., Tursunalieva, A. 2011. Modelling the Bivariate Dependence Structure of Exchange Rates Before and After the Introduction of the Euro: a Semi-parametric Approach. International Journal of Finance &Economics 16 (4), 357-374.
4. Brooks, Ch. 2008. Introductory Econometrics for Finance, Second Edition, Cambrigde: Cambridge University Press.
5. Caporale, G. M., . Ali, F. M. and Spagnolo, N. 2015. Exchange rate uncertainty and international portfolio flows: A multivariate GARCH-in-mean approach. Journal of International Money and Finance, 59, 70-92.
6. Diebold, F. X., Yilmaz, K. 2012. Better to Give than to Receive: Predictive Directional Measurement of Volatility Spillovers. International Journal of Forecasting 28 (1), 57-66.
7. Engle, R. F. and Kroner, K. F. 1995. Multivariate Simultaneous Generalized ARCH. Econometric Theory, 11, 122-150.
8. Glick, R. and Rose, A. K. 1998. Contagion and Trade: Why are Currency Crises Regional. CEPR Discussion Papers 1947.
9. Kitamura, Y. 2010. Testing for Intraday Interdependence and Volatility Spillover among the Euro, the Pound and the Swiss Franc Markets. Research in International Business and Finance 24 (2), 158-171.
10. Kroner, K. F. and Ng, V. K. 1998. Modelling Asymmetric Co-movements of Asset Returns. Review of Financial Studies 11, 817-844. DOI: 10.1093/rfs/11.4.817.
11. Kühl, M. 2009. Excess Comovements between the Euro/US dollar and British pound/US dollar exchange rates. Discussion Papers No. 89, Center for European, Governance and Economic Development Research, http://www.user.gwdg.de/~cege/Diskussionspapiere/89.pdf, accessd 04.11.2015.
12. McMillan, D. G., Speight, A. E. 2010. Return and Volatility Spillovers in Three Euro Exchange Rates. Journal of Economics and Business 62 (2), 79-93.
Kovačević R.Ekonometrijsko modeliranje deviznih kurseva evra, britanske
funte i jena prema dolaru - multivarijantni GARCH pristupBankarstvo, 2017, vol. 46, br. 4 50
13. Mondal, L. 2013. The Foreign Exchange Market Intervention and Exchange Rate Volatility, Lap Lambert Academic Publishing GmbH KG.
14. Morales, L. and O’Donnel, M. 2007. Volatility spillovers between exchange rates and equity markets: evidence from Spain, Portugal and Italy. Conference papers 6, Dublin Institute of Technology, http://arrow.dit.ie/buschaccon/6. Pristupljeno 04.11.2015.
15. Perez-Rodrguez, J. 2006. The Euro and Other Major Currencies Floating Against the U. S. Dollar, Atlantic Economic Journal 34 (4), 367-384.
16. Rosi, E. 2010. http://economia.unipv.it/pagp/pagine_personali/erossi/rossi_multivariate_garch_Ecnmtra_Fin_2010.pdf Accessed 19.09.2016.
17. Silvenoinen, A. and Teräsvirta T. 2009. "Multivariate GARCH Models", in: T. G. Andersen et al. Eds., Handbook of Financial Time Series, Springer, Berlin.
18. Tamakoshi, G. and Shigeyuki, H. 2014. Co-movements among major European exchange rates: A multivariate time-varying asymmetric approach. International Review of Economics & Finance (May), 31, 105-113. DOI: 10.1016/j.iref.2014.01.016
19. Wang, J., Yang, M. 2009. Asymmetric Volatility in the Foreign Exchange Markets. Journal of International Financial Markets, Institutions and Money 19 (4), 597-615.
Kovačević R.Econometric Modelling of Euro, British Pound and Japanese Yen Exchange Rates Against Dollar - Multivariate GARCH Approach
51 Bankarstvo, 2017, Vol. 46, Issue 4