Embed Size (px)
Citation preview


Ekonomia MiędzynarodowaNr 12, 2015
Redakcja: Piotr Gabrielczak – Redaktor naczelny Jakub Kronenberg Tomasz Serwach Kinga Dudzik – Redaktor językowyMark Muirhead – Redaktor językowy Mariusz Plich – Redaktor statystyczny
Rada naukowa:prof. zw. dr hab. Janusz Świerkocki (UŁ) – Przewodniczącyprof. dr Costea Munteanu (ASE Bucuresti)prof. dr hab. Rafał Matera (UŁ)dr Lilianna Jodkowska (HTW Berlin)
Szczegółowe informacje o czasopiśmie i archiwum na stronie www.ekonomia-m.pl
Wydawca: Uniwersytet ŁódzkiProjekt okładki: Michał Stanowski, Agata Wodzińska-ZającKorekta: Kinga Dudzik, Mark MuirheadSkład: Kinga Dudzik
ISSN: 2082-4440 – wydanie papierowe
ISSN: 2300-6005 – wydanie elektroniczne
Wersja elektroniczna czasopisma jest wersją referencyjną

97
Spis treści
Wpływ porozumień handlowych na synchronizację gospodarki meksykańskiej z gospodarką światową (Wojciech Grabowski, Ewa Stawasz, Justyna Wieloch) ...................................205
Product placement as a way of promoting on an international scale based on a series of films about James Bond (Karolina Anielak) .....................217
Efficiency frontier on Japanese banking system (Ivan Ionuț Cristian) .............235


205
Wpływ porozumień handlowych na synchronizację gospodarki meksykańskiej z gospodarką światową
Wojciech Grabowski*,1Ewa Stawasz**,2Justyna Wieloch***3
Wprowadzenie
Synchronizacja cykli koniunkturalnych to ważna kwestia w teorii optymalnych obszarów walutowych (OOW). Była ona przedmiotem szczególnego zaintereso-wania w analizie kosztów i korzyści prowadzonej przed utworzeniem Europej-skiej Unii Gospodarczej i Walutowej. Jak wskazywali A. Rose i J. Frankel, auto-rzy tezy o endogeniczności kryteriów OOW, wspólna waluta istotnie przyczynia się do wzrostu wymiany handlowej w krajach, które się nią posługują. W dalszej kolejności powinno to prowadzić do synchronizacji ich cykli koniunkturalnych. Zgodnie z klasyczną teorią OOW efekt zbieżności powinien nastąpić przed utwo-rzeniem wspólnego obszaru walutowego, natomiast zgodnie z tezą o endogenicz-ności będzie on wynikiem wprowadzenia wspólnej waluty (por. Tchorek 2010).
Meksyk nie należy do żadnego ugrupowania walutowego. Od 1994 r. obo-wiązuje w nim mechanizm płynnego kursu walutowego. Nie ma też oficjalnych planów w zakresie integracji walutowej na kontynencie północnoamerykańskim. W związku z tym rozważania nad zbieżnością cyklu koniunkturalnego Meksyku z cyklami innych krajów nie będą prowadzone w kontekście jego uczestnictwa w jakimkolwiek ugrupowaniu walutowym. Meksyk jest jednak sygnatariuszem wielu porozumień handlowych, zawartych głównie z krajami obu Ameryk, ale także z krajami europejskimi. Najważniejszym z nich jest utworzone w 1994 r. Północnoamerykańskie Porozumienie o Wolnym Handlu (North American Free
* Wojciech Grabowski – dr nauk ekonomicznych, Uniwersytet Łódzki, Wydział Ekonomiczno-So-cjologiczny, Katedra Modeli i Prognoz Ekonometrycznych.** Ewa Stawasz – mgr, Uniwersytet Łódzki, Wydział Ekonomiczno-Socjologiczny, Katedra Mię-dzynarodowych Stosunków Gospodarczych.*** Justyna Wieloch – mgr, Uniwersytet Łódzki, Wydział Ekonomiczno-Socjologiczny, Katedra Wy-miany Międzynarodowej.
206
Trade Agreement – NAFTA). Dlatego też oczekuje się silnego zsynchronizowa-nia cyklu koniunkturalnego Meksyku z cyklem Stanów Zjednoczonych, a także – w mniejszym stopniu – Kanady.
Celem artykułu jest sprawdzenie, czy zawarcie przez Meksyk porozumień handlowych z poszczególnymi krajami amerykańskimi i europejskimi doprowa-dziło do zwiększenia synchronizacji ich cykli koniunkturalnych. Wyniki badania ułatwią ocenienie, czy gospodarka meksykańska jest podatna na szoki zewnętrz-ne, a także prognozowanie wzrostu PKB Meksyku na podstawie informacji do-starczanych przez gospodarkę światową.
Porozumienia handlowe Meksyku z innymi krajami
Światowa Organizacja Handlu (World Trade Organization – WTO) wyróżnia for-my integracji, które tylko częściowo pokrywają się z przedstawioną przez Béla Balassę klasyfikacją, powszechnie wykorzystywaną w rozważaniach teoretycz-nych (por. Balassa 1961)1.4.
Najmniej zaawansowaną formą integracji jest przyjęta na mocy Układu Ogólnego w sprawie Taryf Celnych i Handlu w 1979 r. Partial Scope Agreeement (PSA). Zgodnie z wprowadzoną tzw. klauzulą przyzwolenia, kraje rozwijające się są bardziej uprzywilejowane i uczestniczą w PSA w większym stopniu. Analizo-wana klauzula określa wyjątki, na mocy których strony umowy mogą przyznać korzystniejsze warunki handlu z krajami rozwijającymi się zarówno w zakresie ograniczeń taryfowych, jak i pozataryfowych (por. Śledziewska 2012). Preferen-cyjne traktowanie krajów rozwijających się ma na celu ułatwienie handlu z nimi i promowanie go (por. WTO Legal Text 1979).
Następne w kolejności – według stopnia integracji – są strefa wolnego handlu oraz unia celna (por. GATT 1994 art. XXIV). Zgodnie z art. XXIV GATT, jeśli partnerzy zdecydują się na utworzenie strefy wolnego handlu, zewnętrzne stawki celne nie mogą zostać podniesione, natomiast w przypadku powołania unii celnej wysokość wspólnej, zewnętrznej taryfy celnej nie może być wyższa od stawek obowiązujących w poszczególnych krajach przed utworzeniem unii. Kluczowym założeniem integracji na mocy przepisów WTO jest pełna wymiana preferencji, a więc taka, która odnosi się do całego handlu (substantially all the trade) wszyst-kimi produktami pochodzącymi z krajów członkowskich.
Najwyższą formą integracji wyróżnianą przez WTO jest integracja ekono-miczna (Economic Integration Agreement – EIA) poszerzająca zakres liberali-zacji współpracy o wolny handel usługami. Zgodnie z art. V Układu Ogólnego w sprawie Handlu Usługami integracja ekonomiczna zakłada całkowity brak
1 Wyróżnił on następujące formy integracji: strefę wolnego handlu, unię celną, wspólny rynek, unię go-spodarczą oraz integrację całkowitą (por. B. Balassa, The Theory of Economic Integration, R.D. Irwin, Homewood, Illinois 1961, s. 1).

207
dyskryminacji w odniesieniu do znaczącego zakresu sektorowego. Gdy stroną umowy są kraje rozwijające się, zgodnie z klauzulą przyzwolenia, możliwa jest asymetryczna liberalizacja handlu usługami.
Podstawą funkcjonowania NAFTA jest powołana w 1986 r. strefa wolnego handlu pomiędzy Stanami Zjednoczonymi a Kanadą (CUSFTA – Canada United States Free Trade Agreement). Główne cele umowy to m.in. rozwiązanie obu-stronnych problemów w handlu samochodami oraz korzystanie z subsydiów i ceł wyrównawczych, a także prowadzenie inwestycji oraz stosunków handlowych. Ponadto utworzenie CUSFTA miało na celu ustanowienie przejrzystych zasad do-tyczących wymiany usług oraz liberalizacji rynku finansowego (por. Czerewasz 2003). Inne kwestie regulowane przez CUSFTA dotyczyły liberalizacji wymiany usług, również usług sektora bankowego, a także lokowania inwestycji (por. La-toszek, Proczek 2006).
W tym samym okresie w Meksyku panował kryzys gospodarczy, któremu towarzyszyło zadłużenie na poziomie 92 mld USD. Sytuacja kraju nie sprzyjała kontaktom handlowym z innymi państwami kontynentu. W ramach przeprowa-dzanych reform m.in. restrukturyzowano spłatę rat kapitałowych oraz refinanso-wano płatności odsetek, zaciągając nowe kredyty. Reformy strukturalne zostały sfinansowane ze środków Banku Światowego; zamiast licencjonowania impor-tu wprowadzono powszechny system celny, znacznie obcięto wydatki budżetu, podjęto także walkę z hiperinflacją i zdecydowano o prywatyzacji wybranych sektorów gospodarki, np. sektora bankowego, przemysłowego czy telekomuni-kacyjnego (por. Liberska 1991). Istotnym elementem mającym się przyczynić do wyjścia gospodarki Meksyku z kryzysu był programa maquilladora, w ramach którego meksykański rząd oferował ulgi podatkowe oraz pomoc prawną i uprosz-czone procedury tworzenia przedsiębiorstw montujących w Meksyku produkty z importowanych części. Dzięki programowi Stany Zjednoczone mogły czerpać korzyści z różnicy w kosztach pracy, a Meksyk otrzymywał jedną trzecią wol-nodewizowych wpływów do budżetu państwa (Latoszek, Proczek 2006, s. 455). Dzięki zawartemu porozumieniu rozwijały się również przygraniczne regiony obu krajów.
Polepszenie sytuacji gospodarczej zwiększyło atrakcyjność Meksyku oraz jego wiarygodność jako partnera w międzynarodowej wymianie handlowej. Pozytywne zmiany zachodzące w tamtym okresie zwiększyły zainteresowanie Meksyku umową podobną do CUSFTA. W latach 1985–1989 przedstawiciele ad-ministracji Meksyku i Stanów Zjednoczonych podpisali trzy najistotniejsze poro-zumienia, do których należało Porozumienie Dotyczące Subsydiów i Ceł Neutra-lizujących Subsydia, Porozumienie Dotyczące Zasad i Procedur Konsultacyjnych w Stosunkach Handlowych i Inwestycyjnych, Porozumienie Dotyczące Rozmów Ułatwiających Handel i Inwestycje (por. Gwiazda 1998).
W czerwcu 1990 r. podjęto decyzję o rozpoczęciu negocjacji amerykańsko--meksykańskich w sprawie porozumienia o wolnym handlu. Dokładnie rok

208
później rozpoczęły się rozmowy z trzecią stroną porozumienia, czyli Kanadą. Proces ratyfikacji przebiegał w różnym tempie w każdym z państw członkow-skich, jednak ostatecznie NAFTA weszło w życie 1 stycznia 1994 r. (por. Rymar-czyk, Wróblewski 2006).
Meksyk jest stroną wielu porozumień handlowych, głównie o charakterze PSA lub strefy wolnego handlu. Najważniejszym z nich, głównie ze względu na potencjał gospodarczy krajów członkowskich, jest NAFTA, dlatego też autorzy poświęcili najwięcej uwagi właśnie temu ugrupowaniu. Podstawą funkcjonowa-nia NAFTA jest umowa North American Free Trade Agreement. W jej pierw-szej części, zgodnie z Artykułem XXIV GATT, powołano strefę wolnego handlu. W umowie nie sprecyzowano zakresu podmiotowego strefy, co oznacza, że pozo-staje ona otwarta dla nowych uczestników. Cele ugrupowania zostały zdefiniowa-ne w art. 102 umowy; należą do nich:
1. przyznanie sygnatariuszom klauzuli najwyższego uprzywilejowania;2. eliminacja barier w handlu oraz ułatwienie transgranicznego przepływu
towarów i usług;3. promocja uczciwej konkurencji;4. zwiększenie możliwości inwestycyjnych;5. zapewnienie ochrony i egzekwowania praw własności intelektualnej;6. tworzenie procedur rozstrzygania sporów handlowych;7. ustanowienie ram dla dalszej trójstronnej, regionalnej i wielostronnej
współpracy w celu zwiększania korzyści z NAFTA.Tabela 1 zawiera daty podpisania poszczególnych porozumień handlowych
między Meksykiem a kolejnymi krajami. Warto zauważyć, że większość porozu-mień ma charakter strefy wolnego handlu, co jest zgodne z ogólnoświatowymi trendami. Wynika to z łatwych – w porównaniu z wyższymi formami integracji – formalnych procedur powołania takiego ugrupowania i jednocześnie dużych korzyści dyskontowanych w wyniku zniesienia ceł wewnętrznych.
Tabela 1. Porozumienia handlowe Meksyku z poszczególnymi krajami (por. Villareal 2012)
Partner Porozumienie Rok wejścia w życie porozumienia
Argentyna Latin American Integration Association (LAIA) 1981
Boliwia Latin American Integration Association (LAIA) 1981
Brazylia Latin American Integration Association (LAIA) 1981
Chile Chile-Mexico Free Trade Agreement 1999
Gwatemala Mexico-Northern Triangle Free Trade Agreement 2000
Honduras Mexico-Northern Triangle Free Trade Agreement 2000
Islandia Mexico-European Free Trade Association 2004

209
Izrael Israel-Mexico Free Trade Agreement 2000
Japonia Japan – Mexico 2004
Kolumbia Trójstronne porozumienie o wolnym handlu między Kolumbią, Meksykiem a Wenezuelą 1995
Kostaryka Mexico-Costa Rica Free Trade Agreement 1995
Lichtenstein Mexico-European Free Trade Association 2004
Nikaragua Mexico-Nicaragua Free Trade Agreement 1998
Norwegia Mexico-European Free Trade Association 2004
Peru Peru-Mexico Free Trade Agreement 1987 (rozszerzenie 2005)
Szwajcaria Mexico-European Free Trade Association 2004
Unia Europejska EU – Mexico 2000
Urugwaj Mexico-Uruguay Free Trade Agreement 2004
Wenezuela Trójstronne porozumienie o wolnym handlu między Kolumbią, Meksykiem a Wenezuelą 1995
Źródło: opracowanie własne na podstawie informacji ze strony Światowej Organizacji Handlu.
Metodologia oraz wyniki estymacji
Wraz z rozwojem światowej gospodarki, liberalizacją przepływów handlowych i finansowych oraz powstawaniem kolejnych porozumień handlowych oraz wspólnych obszarów walutowych problem synchronizacji cykli koniunktural-nych budził coraz większe zainteresowanie ekonomistów. Powstawały zatem róż-ne metody mierzenia stopnia synchronizacji.
Wiele badań poświęconych synchronizacji cykli koniunkturalnych opierało się na tradycyjnych współczynnikach korelacji liniowej Pearsona dla oczyszczo-nych z trendu szeregów wzrostu PKB obliczanych w ruchomych oknach; por. m.in. Imbs (2006), Artis i in. (2009), Dees, Zorell (2011). Abiad i in. (2013) za-proponowali mierzenie stopnia synchronizacji cykli koniunkturalnych za pomocą następującej miary natychmiastowej quasi-korelacji:
( )( )gj
gi
jjtiitijt
ggggQCORR
σσ
** −−= , (1)
gdzie itg oraz jtg oznaczają odpowiednio stopę wzrostu dochodu w kraju i oraz j w okresie t , natomiast *
ig oraz giσ (odpowiednio *
jg oraz gjσ ) oznaczają
odpowiednio średnią i odchylenie standardowe z próby dla stopy wzrostu PKB w danym kraju. Za główną zaletę omawianego miernika autorzy uznali możli-wość pomiaru stopnia synchronizacji w każdym okresie.

210
W niniejszym artykule proponujemy dodatkowo badanie odporności mek-sykańskiej gospodarki na szoki zewnętrzne. Dwuwymiarowy model VAR(S) jest punktem wyjścia sprawdzenia, czy wzrost PKB w Meksyku jest wrażliwy na szo-ki wzrostu pochodzące z innych krajów:
+
+
=
−
−
=∑
jt
it
sjt
sitS
ssjj
sij
sji
sii
j
i
jt
it
gg
gg
εε
ππππ
µµ
1, (2)
Model (2) zapisany w reprezentacji wektorowego modelu średniej ruchomej VMA przyjmuje postać:
+
=
−
−∞
=∑
sjt
sit
ssii
sij
sji
sii
jt
it
jt
it
gg
εε
λλλλ
κκ
0, (3)
gdzie 100 == jjii λλ oraz 000 == jiij λλ . Parametr sjiλ należy interpretować jako
reakcję wzrostu PKB dla i -tego kraju na skutek jednostkowego szoku wzrostu PKB dla j -tego kraju, który miał miejsce s okresów temu (por. Lutkepohl 1993; Staszewska-Bystrova 2009; Welfe 2009). W badaniu ograniczamy się do dwuwymia-rowych modeli VAR, ponieważ najwyższą dostępną (jeśli chodzi o możliwość zgro-madzenia danych) częstotliwością dla stóp wzrostu PKB jest częstotliwość kwartalna.
Dla par obejmujących Meksyk i inny kraj obliczono wartość miernika (1) oraz przeprowadzono badania analizy reakcji na impuls. Badaniem objęto grupę składająca się na ogół z krajów rozwiniętych, które uczestniczą w porozumieniu handlowym z Meksykiem. Jeśli chodzi o kraje, w przypadku których porozumie-nie handlowe weszło w życie w 2000 r. lub później, rozważane są trzy podokresy:
1. podokres poprzedzający podpisanie porozumienia handlowego przez dany kraj z Meksykiem;
2. podokres następujący po podpisaniu porozumienia handlowego a po-przedzający globalny kryzys finansowy;
3. podokres następujący po upadku banku Lehman Brothers.W odniesieniu do krajów, w przypadku których porozumienie handlowe we-
szło w życie w połowie lat 90., rozważanie podokresu poprzedzającego podpisanie porozumienia nie wchodziło w grę ze względu na niewielką liczbę dostępnych ob-serwacji. Współczynniki natychmiastowej quasi-korelacji obliczono dla każdego kwartału, a następnie zostały obliczone średnie w poszczególnych podokresach. Odnośnie do estymacji parametrów modeli VAR i analizy odpowiedzi na impuls konieczne było połączenie podokresów 2. i 3. w przypadku krajów podpisujących porozumienie po 1999 r. oraz badanie dla całego okresu w przypadku takich kra-jów jak Kanada czy Stany Zjednoczone. Tabela 2 prezentuje wyniki obliczania mierników natychmiastowej quasi-korelacji oraz analizy odpowiedzi na impuls.

Tabe
la 2
. Oce
na st
opni
a sy
nchr
oniz
acji
cykl
i kon
iunk
tura
lnyc
h go
spod
arki
Mek
syku
z g
ospo
dark
ą św
iato
wą
na p
odst
awie
dw
óch
mie
rnik
ów
Kra
jM
iern
ik n
atyc
hmia
stow
ej q
uasi
-kor
elac
ji
(śre
dnia
dla
pod
okre
su)
Odp
owie
dź z
mia
n PK
B na
skum
ulow
any
(po
czte
rech
ok
resa
ch) i
mpu
ls po
lega
jący
na
zabu
rzen
iu sz
oku
zw
iąza
nego
z d
anym
kra
jem
o je
dno
odch
ylen
ie st
anda
rdow
ePo
dokr
es 1
.Po
dokr
es 2
.Po
dokr
es 3
.Po
dokr
es 1
.Po
dokr
esy
2.–3
.A
ustri
a0,
130,
580,
74–0
,009
40,
0448
*B
elgi
a0,
250,
560,
520,
0070
*0,
0445
*C
zech
y–0
,17
–0,0
10,
370,
0079
0,00
85D
ania
0,13
0,69
0,69
0,00
470,
0002
Esto
nia
–0,6
6–0
,16
0,76
–0,0
403*
0,05
00*
Finl
andi
a–0
,10
0,37
0,82
–0,0
416
0,02
92*
Fran
cja
0,21
0,32
0,68
–0,0
294
0,03
31*
His
zpan
ia0,
13–0
,08
0,06
–0,0
031
0,01
89*
Hol
andi
a0,
290,
540,
630,
0094
0,02
17Ir
land
ia0,
22–0
,02
0,37
–0,0
012
0,01
81Is
land
ia–0
,05
–0,0
30,
35–0
,013
10,
0267
Izra
el0,
010,
650,
23–0
,011
30,
0230
*Ja
poni
a–0
,18
–0,1
30,
580,
0054
0,04
09*
Kan
ada
–0,
740,
85–
0,00
56Ło
twa
0,10
–0,1
20,
67–0
,018
2*0,
0021
Nie
mcy
–0,1
90,
180,
79–0
,058
2*0,
0239
*N
orw
egia
0,34
0,27
0,79
–0,0
100
0,01
85Po
lska
0,16
–0,1
40,
300,
0247
0,02
07Po
rtuga
lia0,
240,
20–0
,18
–0,0
014
0,01
95Sł
owac
ja–0
,15
–0,4
00,
75–0
,011
70,
0277
*St
any
Zjed
nocz
one
–0,
430,
48–
0,02
55*
Szw
ajca
ria0,
34–0
,16
0,74
0,02
53*
0,03
49*
Szw
ecja
–0,2
10,
650,
53–0
,049
10,
0209
Wie
lka
Bry
tani
a0,
100,
260,
570,
0206
0,03
95*
Źród
ło: o
blic
zeni
a w
łasn
e.

212
Uzyskane wyniki wskazują na wzrost skali synchronizacji meksykańskiego cyklu koniunkturalnego z cyklami koniunkturalnymi w innych krajach po wejściu w życie porozumień handlowych. Dotyczy to przede wszystkim wielu tzw. sta-rych członków UE (np. Austrii, Belgii, Szwecji, Holandii), w przypadku których między pierwszym a drugim podokresem nastąpił gwałtowny wzrost miernika natychmiastowej quasi-korelacji. Znaczący wzrost synchronizacji cyklu koniunk-turalnego Meksyku z cyklem koniunkturalnym tzw. nowych państw członkow-skich UE (np. Estonii, Łotwy, Słowacji, Czech, Polski) nastąpił dopiero w trzecim podokresie. Może to wynikać z faktu, że wejście w życie porozumienia handlowe-go między krajami Europy Środkowo-Wschodniej a Meksykiem nastąpiło wraz z wejściem tych pierwszych do UE, czyli w połowie 2004 r. Okres między ak-cesem krajów byłego bloku komunistycznego a wybuchem globalnego kryzysu finansowego był tak krótki, że w jego czasie nie nastąpiła intensyfikacja wymiany handlowej między Meksykiem a analizowaną grupą krajów, dlatego synchroniza-cja cykli koniunkturalnych nastąpiła później.
Należy również zauważyć, że w trzecim podokresie cykl koniunkturalny Meksyku był szczególnie silnie zsynchronizowany z cyklem takich krajów jak Estonia, Łotwa, Słowacja, podczas gdy wartości miernika natychmiastowej quasi--korelacji dla Polski i Czech okazały się zdecydowanie niższe. Może to wynikać z tego, że podpisywanie kontraktów handlowych między firmami meksykańskimi a odpowiednimi korporacjami krajów bałtyckich czy Słowacji było łatwiejsze ze względu na usztywnienie kursu walutowego tych ostatnich krajów w stosunku do euro. Oprócz tego należy zauważyć, że Polska i Czechy relatywnie słabo odczu-ły negatywne skutki globalnego kryzysu finansowego, podczas gdy (ze względu na silne powiązanie z gospodarką amerykańską) Meksyk w 2009 r. przechodził głęboką recesję. Podokres obejmujący globalny kryzys finansowy cechuje się najwyższą wartością miernika natychmiastowej quasi-korelacji. Rezultat ten jest zgodny z oczekiwaniami ze względu na wysoką skalę powiązań między rynkami finansowymi w Stanach Zjednoczonych a rynkami finansowymi innych krajów rozwiniętych oraz jednoczesny transfer kryzysu finansowego do realnej sfery go-spodarki. Miernik natychmiastowej quasi-korelacji przyjmuje jednak niskie war-tości w trzecim podokresie, jeśli chodzi o takie kraje jak Hiszpania, Irlandia czy Portugalia. Wynika to zapewne z faktu, że peryferyjne kraje strefy euro, w odróż-nieniu od innych gospodarek rozwiniętych, w latach 2010–2013 doświadczyły głębokiej recesji będącej następstwem kryzysu zadłużeniowego.
Bardzo wysoką wartość miernika natychmiastowej quasi-korelacji obser-wujemy w przypadku Kanady w podokresach drugim i trzecim. Oznacza to, że porozumienie handlowe NAFTA odegrało znaczącą rolę w synchronizacji cykli koniunkturalnych krajów sygnatariuszy. Istotną rolę w synchronizacji cykli ko-niunkturalnych odegrało także porozumienie Economic Partnership Political Co-ordination and Cooperation Agreement. W przypadku pięciu krajów UE wartość miernika natychmiastowej quasi-korelacji przekroczyła 0,7 w trzecim podokresie.
213
Jeśli zaś chodzi o Mexico-European Free Trade Association, to należy zauważyć gwałtowny wzrost synchronizacji cyklu koniunkturalnego Meksyku z cyklami Norwegii czy Szwajcarii w okresie globalnego kryzysu zadłużeniowego. W przy-padku Izraela czy Islandii nie nastąpił jednak gwałtowny wzrost miernika natych-miastowej quasi-korelacji.
Podpisanie porozumień handlowych między Meksykiem a poszczególnymi krajami doprowadziło także do gwałtownego wzrostu wrażliwości PKB Meksyku na szoki pochodzące z innych krajów będących sygnatariuszami tych układów. Porównując rezultaty okresu poprzedzającego zawarcie porozumień handlowych z wynikami obejmującymi kilka (kilkanaście) ostatnich lat, można zauważyć gwałtowny wzrost podatności gospodarki meksykańskiej na szoki zewnętrzne. O ile w pierwszym podokresie istotnie dodatnią odpowiedź na impuls można było zaobserwować tylko w przypadku Belgii i Szwajcarii, o tyle zaburzenie szoku związanego z 13 krajami o jedno odchylenie standardowe dla danego kraju do-prowadziło do istotnej zmiany stopy wzrostu PKB Meksyku. Oznacza to, że stopa wzrostu PKB Meksyku stała się bardziej przewidywalna (na podstawie informacji z gospodarki światowej) wraz z wejściem w życie umów liberalizujących han-del. Dobra koniunktura w gospodarce światowej coraz bardziej przyczynia się do poprawy sytuacji w Meksyku, natomiast globalna recesja przyczynia się do spowolnienia wzrostu gospodarczego w tym kraju. Główną rolę w zwiększaniu synchronizacji cyklu koniunkturalnego Meksyku z cyklami krajów rozwiniętych odgrywa kanał handlowy, o czym świadczy wzrost powiązań po podpisaniu po-rozumień handlowych.
Podsumowanie
W niniejszym artykule przedstawiono informacje o porozumieniach handlowych zawieranych między Meksykiem a krajami Ameryki Północnej, Ameryki Połu-dniowej oraz Europy. Wzrost kooperacji między Meksykiem a innymi partnerami był szczególnie silny w latach 90. XX w., w których kraj ten stał się członkiem NAFTA, a z krajami Unii Europejskiej podpisał Economic Partnership Political Coordination and Cooperation Agreement. W pierwszej dekadzie XXI w. nastąpi-ła dalsza intensyfikacja kooperacji w zakresie handlu – Meksyk podpisał Mexico--European Free Trade Association z Islandią, Norwegią oraz Szwajcarią, a także zwiększył współpracę w ramach Economic Partnership Political Coordination and Cooperation Agreement m.in. z krajami Europy Środkowo-Wschodniej.
Dzięki porozumieniom handlowym zwiększyła się skala wymiany towarów między sygnatariuszami umów. Nastąpił wzrost udziału handlu z krajami rozwi-jającymi się w całkowitej wymianie Meksyku. Sytuacja gospodarcza głównych partnerów handlowych Meksyku zaczęła odgrywać coraz większą rolę w wyja-śnianiu zmian PKB tego kraju. Doszło do wzrostu synchronizacji meksykańskie-
214
go cyklu koniunkturalnego z cyklami krajów rozwiniętych, a także wrażliwości na szoki pochodzące m.in. z Unii Europejskiej, Szwajcarii i Norwegii. Prognozo-wanie PKB w Meksyku na podstawie danych pochodzących z gospodarki świato-wej stało się łatwiejsze.
Wyniki wskazują na różnice między krajami związane z momentem oraz ska-lą wzrostu stopnia synchronizacji. O ile synchronizacja cykli koniunkturalnych tzw. starych członków Unii Europejskiej z cyklem meksykańskim nastąpiła tuż po 2000 r., o tyle w przypadku krajów Europy Środkowo-Wschodniej wzrost mier-nika natychmiastowej quasi-korelacji nastąpił dopiero po 2007 r. Uzyskane wy-niki wskazują, że w okresie globalnego kryzysu finansowego nastąpił gwałtowny wzrost synchronizacji cyklu koniunkturalnego Meksyku z cyklami krajów rozwi-niętych. Skala wzrostu wewnątrz Unii Europejskiej była jednak zróżnicowana. W przypadku tzw. starych krajów członkowskich zależała ona od sytuacji w okre-sie kryzysu zadłużeniowego, a w przypadku krajów Europy Środkowo-Wschod-niej dominującą rolę odgrywał stopień powiązania waluty krajowej z euro.
Uzyskane wyniki mogą być rekomendacją dla innych krajów rozwijających się, których gospodarki są słabo powiązane z gospodarką światową. Przykład Meksyku pokazuje, że podpisanie porozumień handlowych oraz zwiększenie wy-miany handlowej z krajami rozwiniętymi zwiększa prawdopodobieństwo dużej synchronizacji cyklu koniunkturalnego kraju rozwijającego się z krajami rozwi-niętymi. W odniesieniu do konwergencji oraz skuteczności procesu doganiania gospodarek rozwiniętych przez gospodarki rozwijające się synchronizacja cykli koniunkturalnych odgrywa ważną rolę.
Bibliografia
Abiad A., Furceri D., Kalemli-Ozcan S., Pescatori A. (2013), Dancing Together? Spillovers, Common Shocks and The Role of Financial and Trade Linkages [w:] World Economic Outlook (Washington: International Monetary Fund, October), s. 81–111.
Artis M., Chouliarakis G., Harischandra P.K.G. (2009), Business Cycle Synchro-nization since 1880, Paper presented at the International Symposium on Busi-ness Cycle Behaviour in Historical Perspective, University of Manchester, June 2009.
Czerewasz, K. (2003), Procesy integracyjne w Ameryce Północnej, Wydawnictwo Politechniki Białostockiej.
Dees S., Zorell N. (2011) Business cycle synchronization. Disentangling trade and financial linkages, ECB Working Paper, No. 1322.
General Agreement on Tariffs and Trade (1994).Gwiazda A. (1998), Globalizacja i regionalizacja gospodarki światowej,
Wydawnictwo Adam Marszałek, Toruń.
215
Imbs J. (2006) The real effects of financial integration, Journal of International Economics, nr 68, s. 296–324.
Latoszek E., Proczek M. (2006), Organizacje międzynarodowe we współczesnym świecie, Dom Wydawniczy Elipsa, Warszawa.
Liberska B. (1991), Strategia rozwiązywania kryzysu zadłużenia w Ameryce Łacińskiej, Uniwersytet Jagielloński, Kraków.
Lutkepohl H. (1993), Introduction to Multiple Time Series Analysis, Springer-Verlag.North American Free Trade Agreement Legal Text (1994).Rymarczyk J., Wróblewski M. (2006), Pozaeuropejskie ugrupowania integra-
cyjne, Wydawnictwo Arboretum, Wrocław.Staszewska-Bystrova A. (2009), Wektorowe modele autoregresyjne w analizie
makroekonomicznych szeregów czasowych, Towarzystwo Naukowe Orga-nizacji i Kierownictwa „Dom Organizatora”, Toruń.
Śledziewska K. (2012), Znaczenie trzeciej fali regionalizmu w regulowaniu współpracy międzynarodowej, Studia Ekonomiczne – Zeszyty Naukowe, Uniwersytet Ekonomiczny w Katowicach, zeszyt nr 123, Katowice 2012.
Tchorek G. (2010), Teoretyczne podstawy integracji walutowej [w:] Kowalewski P., Tchorek G. (red.), Mechanizmy funkcjonowania strefy euro, Wydawnictwo NBP, Warszawa.
The General Agreement on Tariffs and Trade (1947).Villarreal M.A. (2012), Mexico’s Free Trade Agreements, Congressional Re-
search Service.Welfe A. (2009), Ekonometria. Metody i ich zastosowanie, Polskie Wydawnictwo
Ekonomiczne, Warszawa.WTO Legal Text, Differential and more favourable treatment reciprocity and
fuller participation of developing countries, Decision of 28 November 1979 (L/4903).
WTO Legal Text, Uruguay Round Agreement (1986).
Streszczenie
W artykule omówiono porozumienia handlowe zawarte między Meksykiem a innymi krajami. Wyniki analizy odpowiedzi na impuls oraz współczynników natychmiastowej quasi-korelacji wskazują na znaczący wzrost synchronizacji meksykańskiego cyklu koniunkturalnego z cyklami krajów rozwiniętych oraz na istotny wzrost wrażliwości gospodarki meksykańskiej na szoki w gospodarce światowej.
Słowa kluczowe: porozumienia handlowe, synchronizacja cykli koniunktural-nych, analiza odpowiedzi na impuls
216
Summary
Impact of the Mexican trade agreements on its business cycle synchronization with the world economy
In this paper we evaluate the role of trading channels in the transmission of shocks on the basis of the business cycle synchronization between the Mexican and the world economy. In order to evaluate business cycle synchronization, parameters of 2-variate VAR models for GDP growths are estimated. Measures of instantane-ous quasi-correlation coefficients are calculated for the period preceding the sign-ing of an agreement and the period of validity of the agreement.
Key words: trade agreements, business cycle synchronization, impulse response analysis
JEL: F15, C53, E32

217
Product placement as a way of promoting on an international scale based on a series of films about James Bond
Karolina Anielak*1
Introduction
Nowadays, traditional forms of advertising are increasingly being replaced by innovative marketing solutions. A company that wants to become a leader in the international market must focus an attention on how to promote the offered pro-duct. Customers no longer attach so much importance to traditional methods of promotion and they are not uncritical advertising audiences; dry information on brands or services is no longer suffice. Mental stimulation becomes essential for them. The solution was to use product placement, because it gave the opportunity to show the product as reliable and used by people who are well known and popu-lar – actors, models, celebrities.
The purpose of this article is to show the use of product placement as a form of promotion on an international scale through the series of films about James Bond. The films about 007 show a widespread product placement pattern, which shows the development of this form of promotion over nearly 50 years. A parti-cular topic of interest, the undying interest of manufacturers using product place-ment in each subsequent film, and its influence on viewers’ purchasing decisions, has become a phenomenon.
The article is divided into three parts. The first focuses on the presentation of the concept of “product placement”. It also shows the origins, history of the development of the phenomenon of product placement, and its types, media, and legal regulations. The second part is devoted to the characteristics of cinematic works featuring 007 and a presentation of the involvement the manufacturers in the process of product placement in the series of films about James Bond, the cost of placing products in these films and the benefits of this. The article ends with an * Karolina Anielak – student at the University of Lodz, Faculty of Economics and Sociology, field of studies: Finance and Accounting.

218
analysis of the author’s survey on the effectiveness of product placement in the series of productions of 007.
Product placement – the essence of the issue, a definitional view
Product placement is a phenomenon constantly evolving the advertising and mar-keting market around the world. Currently, from the point of view of the company, product placement is focused on a larger group of recipients than traditional tools of marketing communication. This is due to the internationalization of cultural in-dustries and the development of new forms of distributing films and other works, because now each of them can be shared on the Internet.
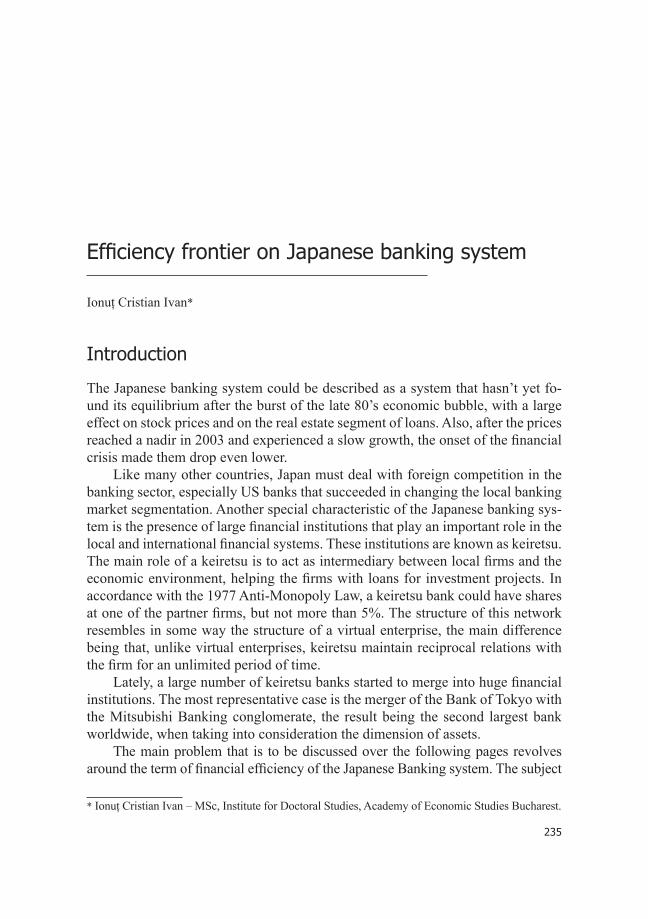
Global spending on this means of promotion since 2006 increased by nearly 400 percent (see chart 1). Based on data from the PQ Media report from 2013, the international use of product placement highlighted the United States ($4 bil-lion), Brazil ($500 million), Mexico ($500 million), France ($100 million), the United Kingdom ($100 million), Japan ($100 million), Australia ($100 million), China ($81 million), and Poland ($72 million). Manufacturers, due to changes in consumer perceptions of traditional advertising as “misguided” or “incredible”, are more likely to emphasize the role of product placement in their marketing strategies (Adamska 2010).
Chart 1. Global spending on product placement in the years 2006–2016 in millions of dollars
*Projection.Source: own study based on the PQ Media Report 2014.
0 200 400 600 800 1000 1200 1400
2006
2007
2008
2009
2010
2011
2012
2013
2014
2015*
2016*

219
All the definitions associated with the phenomenon that is product placement differ from each other in terms of content. Czarnecki explains that, for a long time, the concept of product placement did not have a precise definition, as in publica-tions, especially until 2007, this type of promotion was omitted. The author defines product placement as: (…) method of promotion by placing on a commercial ba-sis in film, art, theater, television program or other audiovisual media or printed product a situation that presents a specific pattern of behavior (mostly consumer) (Czarnecki 2003, p. 14).
In 2007, product placement took on a new meaning, through the adoption of Directive 2007/65/WC of the European Parliament and the Council. Product pla-cement, previously functioning as “sponsorship in kind” or “advertorial”, which in European legislation is prohibited, finally had a clear definition. The 2007 EU Audiovisual Directive assumes that product placement is: any form of audiovisual commercial communication consisting of the inclusion of or reference to a pro-duct, a service or the trade mark thereof so that it is featured within a programme, in return for payment or for similar consideration. On the basis of the Directive, it can be concluded that product placement is characterized by embedding the presentation of the product in the action of a program (Directive of the European Parliament and Council 2007).
Due to continuous development and growing interest in product placement, Entertainment Resources Marketing Associations was founded in 1991, bringing together American and British companies that deal with the organization of promo-tional activities using product placement. Since 2002, there has also been a prize, the Product Placement Awards, awarded for the most glamorous promotion of brands through a specific medium. The winner of this award in 2013, was the movie Skyfall (Czarnecki 2003, p. 68)
In the literature, one can come across all kinds ways of categorizing product placement. Most often made by researchers for product placement, divisions include (Czarnecki 2003, p. 88):
1. media support used in the promotion phase;2. methods of presenting the product or brand – visual, verbal and mixed;3. subject of promotion – brand placement and placement of product ca-
tegory;4. identify the role of a promoted product – product placement in the fore-
ground and in the background;5. emotional response to product – positive, negative and neutral.Product placement allows the product to be presented verbally, visually, or
through a combination of methods. Most often, when the medium of the product placement is a movie, series, or entertainment program, the visual presentation of the brand can be seen (Pazio 2007, p. 11–12). It involves exposing a logo or packa-ging in its total form. The same specific packaging component, color or charac-teristic of the brand can also be shown with a juxtaposition of colors (Mas 2010).

220
Pros and cons of product placement
The use of product placement as a form of brand promotion brings with it many benefits for different groups: film and television producers, and advertisers around the world. The first group treat product placement as a means of reducing pro-duction costs, and the ability to partially fund it (Drozdowska 2013). Advertisers find in this form of promotion alternatives to traditional advertising which often turn out to be insufficiently effective. While making an analysis of its positive and negative effects, product placement will be compared to the traditional marketing tool (see table 1) (Felix 2012).
Table1. Product placement and advertising
Product placement Advertising
The influence period of media is related to the number of channels used for distribution of films (e.g. DVD’s, television) and internation-alization of film production
The influence period of the advertising de-pends on the frequency of the planned broad-casts in the media within the specified time
There is a high dependence on the script to which the company investing in the film prod-uct does not have much impact; Moreover, due to the relatively small number of films produced in countries other than the United States, there is a limited choice of locating the product to ensure reach to the target audience
The screenplay of the advertisement depends on the client
Product placement in a film produced for cinema audience is an inflexible instrument
There is a possibility to use different adver-tising messages for the same product due to some cultural differences between countries
Viewers focus more on the content and action of the film, thus on the promoted products
Recipients often focus little on advertising messages
Product presentation can last a fraction of a second
The presentation of the product from 10 to 60 seconds
Reaches the recipient once and for a certain period of time Reaches the recipient several times a week
Source: own elaboration based on Sobocińska 2002, p. 10.
Product placement gives the opportunity to discreetly and subtly promote products by incorporating it into the plot of the film, or other work. Actors using a specific item do not advertise it overtly, they can only use it or it is in the shot close by. People watching a movie usually do not build critical attitudes towards such the construction of the company’s marketing communication tool. This in-creases the credibility of the medium (Czarnecki 2003, p. 72–73).
Product placement is more effective if the product is used by one of the top Hollywood stars as opposed an actor of lesser standing. Thanks to product place-ment, the phenomenon of product ennoblement may therefore occur – the viewer feels that the product presented in the film is more upscale and upper-class. This

221
is caused by the mechanism of the transfer of the image, or brand image fixation, presented in a work of cinema as a world primarily characterized by high quality (Strużycki, Hieryszek 2007, p. 123–126). In addition, the film as a medium of product placement is characterized by a long life cycle, because after the cinema release, it can be viewed on DVD or on the Internet.
It should be noted that product placement used in film is just a tool limited to communicating the product brand. This method allows the creation of an image associated with the brand or specific product, forming positive associations on the part of the viewers based on the credibility and emotional impact. Using the pro-duct in typical situations, the characters show the basic functional characteristics of the products. Despite the obviously fictional nature of the message, which was created for the film, it affects the viewer’s subconscious (Kwapisz 2012, p. 12). Someone watching a film has the impression that the attitude of the hero, using a certain product, is the actor’s personal attitude to the product in his private life (Stand 2011). In the English specialist literature, this effect is called “celebrity en-dorsement” – that is, to encourage the purchase and use of the product by a person who is well known to, and who enjoys the sympathy of the public, and especially the cinema audience. It often happens that the use of a brand or product by the hero reflects his character and lifestyle. An effective method is also “implied en-dorsement”, involving the creation of such matters in the same scene film so that the viewer’s attention is drawn primarily to the brand. The name may appear on screen for a few seconds, or a particular good may be shown close up (Choliński 2010, p. 69). An especially valuable advantage for companies is that product pla-cement has no restrictions as to the scope of promoted products that may seem controversial, which is why manufacturers of cigarettes or alcoholic beverages increasingly opt for such a tool of promotion (Wyrwisz 2013, p. 46–47).
The advantage is the fact that most of the products may be positioned in films that have premiered in theaters around the world. Cooperation with the enterta-inment industry in foreign countries enables the promotion of the brand in those markets without incurring huge costs related to the preparation of a worldwide advertising campaign. Product placement is characterized by low cost of reaching customers, which due to the lack of production costs and the one-time fee incur-red for the discussed form of promotion, regardless of the number of distribution channels. Effective use of product placement can contribute to reducing produc-tion costs from a few to several percent of the budget (Wiktor 2001, p. 287–288).
Apart from the fact that product placement is an innovative solution for the enterprise trying to promote its product, it is also connected with a few restric-tions. The manufacturer, when weighing up product placement, must reckon with the fact that they will not be able to accurately determine the popularity of a film and how many people it will reach. The filming process is sometimes very long. There may, therefore, be a risk of a situation in which the brand will be promoted in the wrong context, underscoring a particular product defect, or it will not be

222
complementary to the current marketing communication strategy of the company (Sobocińska 2009, p. 8).
In addition, the audience often focuses more on the content of the film rather than the promoted product. The brand owner does not have full control over the final version of the film. There are situations where scenes which were significant for the manufacturer are shortened, and the product was displayed for a short time. The advantages of the product and its attractiveness, through the form of promotion which is product placement, are noticed by a potential viewer once within a given time frame – when watching a certain movie or show. Through such means, a company is unable to promote or diversify methods of presenting its products on international markets. It remains without the possibility of trans-ferring complete information about the price of the product and of the conditions of sale, and a further disadvantage is that not every film genre is adapted for use product placement. Some of them, like horror, are able to work negatively on the image of the brand (Gębarowski 2007, p. 33–38).
Summing up, the impact of product placement on consumers is not fixed. Using this marketing tool to its fullest extent can bring success to companies at very little expense or risk of the exact opposite effect. All this depends on the professional work of the filmmakers and experts, marketers and their attention to detail, but the most important success factor for product placement remains inte-rests of viewers (Choliński 2010, p. 81–83).
The popularity of series of films about James Bond and product placement
James Bond is a fictional character who is regarded as one of the world’s most fa-mous intelligence agents. There have already been 23 movies featuring 007, with decades between the first part and the most recent film, captivating the attention of the fans. Evidence of this is the increasing revenue flowing from the movies, their global reach and the number of people who appeared at the premiere (see table 2).
Table 2. Films about James Bond – key figures
Title of the movie Year of prod.
Income – world
($million)Budget
($million)
The number of cinema viewers(thous.)
The number of countries – premiere
Dr. No 1962 59,6 10 1500 1
From Russia with Love 1963 78,9 25 2780 2
Goldfinger 1964 124,9 35 5260 2
Thunderball 1965 141,2 11 5900 2

223
You Only Live Twice 1967 111,6 95 3700 2
On Her Majesty’s Secret Service 1969 87,4 70 5321 2
Diamonds Are Forever 1971 116,0 72 5642 2
Live and Let Die 1973 161,8 70 4798 2
The Man with the Golden Gun 1974 97,6 70 3870 2
The Spy who Loved Me 1977 185,4 14 3269 –
Moonraker 1979 210,3 34 5890 3
For Your Eyes Only 1981 195,3 28 6321 4
Octopussy 1983 187,5 27,5 7821 6
A View to a Kill 1985 152,4 30 9220 10
The Living Daylights 1987 191,2 40 9600 14
Licence to kill 1989 156,2 42 9300 17
Golden Eye 1995 353,4 60 10600 22
Tomorrow Never Dies 1997 346,6 110 11000 22
The World is Not Enough 1999 390,0 135 10300 22
Die Another Day 2002 456,0 142 13200 29
Casino Royale 2006 594,0 150 29000 36
Quantum of Solace 2008 586,0 200 46000 60
Skyfall 2012 1108,56 200 63000 82
Own study based on: www.imdb.com (accessed: 22.03.2013).
The image of 007 is no longer confined to the cinema and it is perceived as a symbol of pop culture. James Bond has become a controversial icon that draws the attention of both sexes and a big group of researchers, sociologists and en-trepreneurs. Over the decades, he has always been associated with success, good taste, a sophisticated sense of humor and charm (Herschel 2004).
The James Bond films popularized and perfected the idea of action films. Tracking his opponents, pursuing them at all costs and using all available means, 007 always crushes the enemy. For cinema lovers, the producers have created a canon which is an alternative to everyday life. Fans follow each subsequent film, not only to see Bond facing masters of evil, but also to continue the tradition of participating in the global phenomenon (Tanya 2011, p. 75).
It could be argued that 007 is not only a hero of one of the longest series of films in the history of cinema, but he is a walking ambassador of different brands, providing international businesses with enormous profits. Companies associated

224
with the franchise treat the James Bond films as the ideal medium for product pla-cement due to the reach of the films creating the international phenomenon of 007. The list of brands presented in the films bearing his name is constantly growing. Bond presents not only computers, telephones, cars and watches, but, in addition to the famous Martini, shaken and not stirred, there is beer, which does not fit the image created by the character so well (Grzesiek 2013, p. 62–66).
The films about 007 are unabated in popularity, with people following every trend started by James Bond. Proof of this is the immense interest from businesses investing a huge number of products in each film (Lalik 2012).
Table 3. Products used by agent 007
Title of the movie Year of production Brands used in the film
Dr. No 1962 Rolex Submariner, Walther PPK, Sunbeam Alpine
From Russia with Love 1963 Rolex Submariner, Sony Ericsson T68i, Walther PPK, Bentley Mark IV
Goldfinger 1964 Rolex Submariner, Walther PPK, Aston Martin DB5
Thunderball 1965Rolex Submariner / Breitling Top Time, Walther PPK, Aston Martin DB5, Bentley Mark II, Continental, Cadillac De Ville, Lincoln Continental
You Only Live Twice 1967 Rolex Submariner, Walther PPK, Toyota 2000GT
On Her Majesty’s Secret Service 1969 Rolex Submariner, Rolex Chronograph, Walther PPK,
Aston Martin DB5
Diamonds Are Forever 1971 Rolex Submariner, Walther PPK, Ford Galaxie 500, Ford Mustang
Live and Let Die 1973 Rolex Submariner, Walther PPK, Chevrolet Impala
The Man with the Gold-en Gun 1974 Rolex Submariner, Walther PPK, AMC Coupe
The Spy Who Loved Me 1977 Seiko 0674 LC, Walther PPK, Lotus Esprit
Moonraker 1979 Seiko M354 Memory-Bank Calendar, Walther PPK,
For Your Eyes Only 1981 Seiko H357 Duo Display / Seiko 7549-7009, Citroën 2CV, Lotus Esprit Turbo, Lotus Esprit, Walther PPK
Octopussy 1983Seiko TV Watch / G757 Sports 100,Walther PPK, Alfa Romeo GTV6, Mercedes-Benz W111, Range Rover Classic convertible Conversion
A View to a Kill 1985 Seiko, Walther PPK, Ford LTD, Renault 25
The Living Daylights 1987 Rolex Submariner 16800,Walther PPK, Aston Martin DB5, Aston Martin V8 Vantage, Audi 200
Licence to Kill 1989 Rolex Submariner 16800, Walther PPK, Lincoln Mark VII LSC, Rolls-Royce Silver Shadow
Golden Eye 1995 Omega Seamaster 2541,Walther PPK, Aston Martin DB5, BMW Z3

225
Tomorrow Never Dies 1997 Omega Seamaster 2541, Ericsson JB988, Walther P99, BMW R 1200 C, BMW 750 Li
The World is Not Enough 1999 Omega Seamaster 2541, Walther P99, BMW Z8
Die Another Day 2002 Omega Seamaster 2541, Sony Ericsson T68i, Walther P99, Aston Martin Vanquish V12, Ford Fairlane
Casino Royale 2006Omega Seamaster ,Planet Ocean 600m, Sony Erics-son K800i, Walther P99, AEK-971 rifle, Aston Martin DBS, Ford Mondeo MKIV, Aston Martin DB5
Quantum of Solace 2008Omega Seamaster Planet Ocean 600m, Sony Erics-son C902, AEK-971 rifle, Walther PPK Aston Martin DBS, Range Rover Sport, Volvo S40
Skyfall 2012Omega Seamaster Aqua Terra 150M, Sony Xperia T, Walther PPK, Honda CRF 250R, Aston Martin DB5, Jaguar XJ, Mercedes-Benz W221
Source: own elaboration based on Tanya 2011, pp.12–35.
The James Bond franchise has grown over the past 50 years. The changing intensity and role of product placement in the marketing strategy allows the films to be divided into four periods: 1962–1971, 1973–1989, 1995–2002 and since 2006.
Since 1962, Sony has shown a special interest in product placement in the 007 movies. In the early productions, Sony’s visual receivers were mostly pre-sented. In the movie You Only Live Twice Japanese intelligence uses similar pro-ducts, allowing Bond to communicate immediately with Tiger Tanaka, the head of Japanese intelligence, even while driving. Almost identical monitors were used in The Spy Who Loved Me and Octopussy, where they served mainly to allow the evil masterminds to coordinate attacks against Bond. Studies have shown that the popularity of Sony rose in that period by 19% (Felix 2012).
Creating special effects in the 60s and 70s was very complicated and expen-sive. Therefore, in the first movie, Dr. No, Bond received from his superiors only a Walther PPK and a large, portable Geiger counter. Thus, he needs a few mo-ments on screen to be show the weapons he will be using. The whole film world cannot do without naming weapons which the heroes of movies use, but Bond, through the use of PPK in Dr. No, created in the minds of viewers a reliable product, and one better than the Beretta. The whole world knew the name of the agent’s weapons.
In Goldfinger, 007 promotes flying by Pan Am Boeing 707, for which the com-pany paid $100 000. They hoped to popularize the speed and convenience of air tra-vel. The legendary Aston Martin DB5 also appeared here. The vehicle has machine guns hidden behind the headlights, a catapult, as well as bulletproof glass and the ability to spread motor oil on the surface in order to obstruct the opponent’s path (Radford 2012).
226
In the Roger Moore era, with increasing budgets and the resignation of Harry Saltzman after the withdrawal of his50% stake in the Danjaq production company, the series took the form of a typical thriller, which resulted in the possibility of more necessary gadgets for 007 (Doboska 1998). The first of these was the Bond watch – the Rolex from the film Live And Let Die has not only a rotating frame that functioned as both a saw and also as a magnet, for its ability to change the trajectory of a bullet. Increased interest in watches of this brand doubled among men, according to research conducted two years after the premiere. Men stated their desire to have a watch like007 (Tanya 2011, p. 96).
Given the opportunities and the success of product placement, Japanese Se-iko products have replaced Swiss watches, acting as a telex or a container for explosives. The Bond films have placed not only cars, watches and weapons –Philip Morris paid $350 000 to place Lark cigarettes in the License to Kill film (Segrve 2004).They wanted a less familiar brand of cigarette to be featured, even as a prop. It turned out that the majority of those who had watched the film could cite Lark as a well-known brand (Radford 2012).
When creating the movie The Man with the Golden Gun, American Motors paid $5 million to producers to make sure that the agent drove their cars. In The Spy Who Loved Me, from 1977, again Bond’s car is changed. The Aston Martin was replaced by the Lotus Esprit, which has the ability to transform into a sub-marine equipped with surface-to-air missiles, water mines and torpedoes. For the opportunity to place their product, Lotus paid $450 000 (Anders 2011).
Product placement in Tomorrow Never Dies exceeded $100 million. In the film, 007 surrounded himself with countless gadgets, not only talking on an Erics-son phone but also paying with a VISA credit card, wearing an Omega watch, riding a BMW 750iL, drinking Smirnoff vodka and Bollinger champagne and dressed only in perfectly tailored Brioni suits. The huge investment brought gains, with sales in the case of watches and Ericsson phones rising by 36 and 23 percent. This effect was particularly evident in the first three months after the premiere (Tanya 2011, p. 99–102).
In several films with Pierce Brosnan, 007 drove BMW Z3 and Z8 models, but in 2002 in Die Another Day, he again returned to the use of an Aston Martin. For this change, Ford Motor Company had to pay $3 million. The films about James Bond are usually associated only with male brands. But for Die Another Day, the cosmetics company Revlon paid Halle Berry, cast as Jinx, to use only their ma-keup products (Sancton 2012).
Subsequent premieres highlighted the increased collaboration between the pro-ducers and Sony. Having had the film distribution rights since 1981, the Metro-Gol-dwyn-Mayer studio fell into financial difficulties and was taken over by a con-sortium led by Sony Pictures Entertainment, which was, of course, a subsidiary company of Sony Corporation. It is believed that this is why the 2006 release, Casino Royale, at moments looked like one big ad. The entire plot of the film

227
was based almost exclusively on a quest which consisted in capturing the phone numbers from devices of people who, like clockwork, led to Mr. White. Each of the characters had a Sony Ericsson device, as at the time Sony had a joint venture with the manufacturer. In addition, most of characters used Sony VAIO laptops, and one character took pictures in Venice with a digital camera also produced by the Japanese corporation (Former 2013).
Because of viewers’ comments about being constantly bombarded by pro-ducts, the amount of product placement in Quantum of Solace was reduced. Only certain objects are visible on the screen. Producers paid attention only to VAIO laptops – it was their priority. It may be noted that since 2006, Bond still uses an Omega watch, which not only plays the role of a prop on the hand of the main character, but it be camera topic of conversation between Bond and the beautiful Vesper Lynd (Conlon 2013).
In the latest adventures of 007, the Sunday Times, MGM and Sony paid $49 million to increase the screen time of their products (Conlon 2013). A similar situation concerned the Dutch brewery Heineken, which broke the Martini stereo-type as Bond’s favorite drink. They handed over£28 million to be able to show the audience that a British agent drinks this beer. The sum covered almost 1/3 of the planned budget of the film, £93 million (Tanya 2011, p. 112–113).
The film Skyfall shows almost the entire range of cars that have ever been used. Land Rover Defender and Audi were visible in the chase scene. The cha-racter of Eve drove a Land Rover while her opponents tried to escape in an Audi. During the chase, several Range Rovers were used to transport Bond to MI6’s new location. Bond also enjoyed a moment in a Jaguar XJ. Finally, to the wide range of products place in the film, the classic Aston Martin DB5made a surprising return (Turner 2013).
Analysis of the results of the survey entitled ''The effectiveness of product placement based on a series of films about James Bond''
The aim of the study was to gain information about the popularity of James Bond in Poland and the effectiveness of product placement used in the series on diverse age groups, whose members are familiar with series to varying degrees. Another reason for the study was the lack of empirical research in Poland focused on the analysis of the effectiveness of product placement in blockbuster films.
123 people took part in the survey, including 44 men and 79 women. The re-spondents were divided into five age groups, which was intended to provide a more detailed analysis of the effectiveness of product placement in each of the presented groups. It may be noted that people under 25 formed the largest group (see chart 2).

228
Chart 2. Percentage share of different age groups of respondents
Source: own study based on survey results.
The survey on the effectiveness of product placement based on the Bond films was conducted in April and May 2014 and lasted three weeks. The question-naire (containing 22 questions) was created electronically and published on the portal wBadanie.pl. To reach the widest age range as possible, the link to the su-rvey was posted on the social networking site Facebook, in addition to being sent to respondents by e-mail (asking also for its further distribution). Finally, a link to the survey was posted on online forums for aficionados of such films.
The series of films about James Bond, because of its size, was divided into four categories, taking into account the year of production, lead actor and the utilization of product placement i.e. the first group of films take in the years 1962–1971, the second group 1973–1989, group three included 1995–2002 and the last fourth includes those films made since 2006.
Among the 123 respondents, only 9 indicated that they had not seen any film in the series, while 6 people admitted to being fans of the British agent. Conside-ring the age composition of respondents, those who liked the James Bond series the most are primarily those between 36 and 45. Nevertheless, 24 people over the age of 26 liked the films about 007 and 45 young people aged 26 said that they would watch the movies if they were shown.
Another question asked respondents how familiar they were with specific films (see Table 4). 78% of respondents admitted that they do not know a single film from the years 1962-1971. In comparison, 99.6% of respondents could name a film from 1973–1989, and everyone could name a film from after 2006. It should be noted that films about the adventures of 007 from the 70s are more familiar to respondents in the age group over 56, while Casino Royale, Quantum of Solace and Skyfall had been seen by more than 90% of people in the 18–25 age group.
42%
26%
21%
7%
3%
18-25 years
26-35
36-45
46-55
56 and more

229
Table 4. The number of respondents who are familiar with each film about 007
Age of respondents 18–25 years 26–35 36–45 46–55 56 and more
Group of movies
1962–1971 6 13 16 29 32
1973–1989 24 24 18 23 29
1995–2002 32 21 17 12 32
over 2006 45 34 28 10 6
Source: own study based on survey results.
Other questions concerned the visibility of the presented brands and the man-ner of their presentation (see Chart 3). 74 respondents (42% of 18–25 group) said that a product had been used by the main character and visual product placement is most commonly used. 21% of those studied mentioned that a product usually is placed in the background, while only 6 people noticed the name of a product or brand during a dialogue between characters of the film. 23 people (86% of the 18–25 group) said that it was difficult to say how the products had been shown, perhaps due to the fact that a large number of viewers are, among other things, more focused on the plot.
The respondents also pointed out that they remembered the three brands after watching the films – 58% of people indicated brands such as Aston Martin, Rolex and Martini while 55% of respondents remembered also the watch brand Omega. 45% of women indicated clothes or jewelry brand most of all, while for 56% of men it was cars or phones.
In another question, the respondents were shown brands they consider to be characteristic of James Bond. They were presented with 12 logos of brands such as BMW, Heineken, Nokia, Apple, Nike, Ford, Coca-Cola, Chevrolet, Hugo Boss, Bond Expert, Bentley and Aston Martin. 34% of respondents chose Aston Martin as the most representative, 28% said Heineken, and in third place, with 23%, was Bentley. A surprising fact resulting from the analysis is that as many as 9% of people said that the Bond Expert brand is attributed to James Bond, even though it was not presented in a single movie.
Questions 8 to 16 were designed to investigate the respondents’ knowledge of brands in the series of the film and the frequency in which they were presented. Even though the majority of respondents were familiar with the films about James Bond produced after 1973 (see table 4), not all of them had actually watched any of those movies. 80% percent of people aged 18–25 had not seen the films from 1962–1971 and 1973–1989. 82% percent of people aged 26 to 35 years admitted that they had watched all the movies until 1989. 32% of those in the 36–45 gro-up state that they had not watched the movies from the period since 2006, while almost 90% of those who were 18–25 were actively familiar with the series after

230
2006. People over 36 years old who declared that they watched the films made between 1962 and 1973 perfectly reflect the degree of use of the brand in the films of 007. More than 30% of this age group pointed to the use of the Walther PPK, 60% to the use of an Aston Martin, and approximately 12% to the Sniper Rifle.
45% of people under 25 years of age, declaring that they know the movies from 2006, mentioned brands that had not been used in the series. Their examples show the power of advertising from before the film with as many as 25% of people under 25 saying that Bond had used Coca-Cola. 16% of them said that, in addition to Coca-Cola in the latest films, products such as 7Up or Nike had been used. 48% also indicated “difficult to say” if the brand was invested in the film, but was shown only from time to time.
The aim of the next question was to determine people’s associations with products used in the films, for example, Aston Martin and Sony Vaio (see chart 4). Aston Martin, regardless of the age range, is associated first and foremost as a measure of comfort, high price, prestige and belonging to a higher social status (90% of respondents answered “yes”), but only a few people mentioned the use-fulness of this car. Diversity of age is visible only with the second product – Sony Vaio. It was also associated with prestige by 7% of respondents. People over 36 years of age consider it to be a luxury and original (13% of the survey sample). Conversely, respondents under the age of 35 (35% of the survey sample) state that it is equipment which provides generally available comfort, it is quite popular, and for some it is even ordinary.
Chart 3. Associations with the product placed in the movie.
Source: own study based on survey results.
0 5 10 15 20
Sony Vaio
Aston Martin
usefulnesspopularitylow qualityaffordable priceordinarinessaccessibilityhigh qualityhigh social rangecomforthigh priceluxuryoriginalityprestige

231
It should also be noted that 82% of respondents said that they had not been influenced to buy make any purchase of a product having watch a movie about the adventures of 007 (90% of 35 years old). But in the next question they indicated familiarity with such brands as: Rolex watch, Martini, Sony Ericson, Sony Xpe-ria, Sony Vaio, Omega watch. It can be concluded that product placement has the greatest influence on the purchasing decisions of young people.
Analyzing the results of the study, it can be seen that for 45% of respon-dents, regardless of the age range, the products shown in the Bond films have be-come more attractive and worth buying. Additionally, in another question, more than 44% of respondents indicated that product placement is an appropriate form of promotion. Only 10% of respondents considered product placement to be an annoying form of promotion, but on the other hand, 46% of respondents were indifferent.
In summary, product placement in James Bond films is noticeable by more than 90% of respondents. Respondents in the 18–25 age group said they had a very good knowledge of the latest in the series of films since 2006. Fans over the age of 35 are familiar with all the movies from 1962. They can pinpoint the brands found in the films, in contrast to young people who often confuse the brand promoted in the film with those shown before the cinema screenings. It should be noted that young people under 26 years of age, fascinated by the image of Bond created by the film’s producers from the latest in the series of films, are more likely to follow the trend created by their favorite character. It can be seen through their decisions to buy specific brands, often motivated by the fact that they had been used by the main character. Respondents in the 35–44, 45–55 and 55 and over age groups are not as susceptible to product placement, due to the exclusivity and price of the products found in the films, such as Aston Martin. It can be argued that product placement is the best form of promotion that affects the youngest age group and the producers are trying to use this.
Conclusion
Product placement has become a solution for modern marketing. It forces effec-tive and unconventional communication between the company and the buyer, en-suring a loyal customer.
In recent times, product placement has become a frequently used compo-nent of the marketing strategy of companies. Due to its more refined and sub-tle form, it corresponds to the expectations of potential customers, struggling with constant, irritating and intrusive traditional instruments of promotion such as advertising. Product placement enables the promotion of a product through many different media. Placing products has become more and more popular in movies or TV series, not only because it can build a brand image and strengthen
232
positive emotions, but also because there are bilateral benefits, for the companies involved but also the film’s producers. Companies which intend to place their pro-duct in a film largely cover its costs, but for the company involved, it strengthens its competitive position in the international arena. Product placement can affect the perceptions of viewers about the product, highlight its advantages, as well as change their opinions about the company, considering them to be modern, using non-traditional forms of marketing communication.
A prime example of product placement in the film is the whole cinematic series about 007. Over the year, the style of product placement has not been mo-dified and is still an example of an effective form of promotion acceptable to the audience and perfectly fits the concept of the movies.
Product placement in the international arena has increased by 400% since 2001, measured by the increase in global spending on this type of marketing com-munication. Countries such as the United States, Mexico, France, China, Brazil and the United Kingdom particularly stand out.
Based on the history of the development of product placement in the James Bond movies, it may also be noted that the number of products continually incre-ased. International companies have recognized that this form of promotion is far more effective and reaches a wide range of customers. The last film in the series, Skyfall, was released in 82 countries around the world, and gave businesses the opportunity to promote their brand in new markets.
The advantage and effectiveness of product placement, not only in the Bond films, is its less invasive specificity and distribution, mainly through commercial cinemas, which makes that form of promotion more customer friendly. When tar-geting is considered, product placement allows precise alignment with specific social groups, as investors may choose the nature of the exploited film and its audience. If a company wants to achieve success in this field it must adequately examine the script of the film and its character before placing their product there.
Analysis of the survey results shows that, thanks to product placement, brands and goods which invested in the film were considered attractive and are more re-cognizable. Product placement, in this case thanks to the worldwide medium that is the James Bond films, may become more effective than conventional television advertising.
References
Anders J. (2011), 11 Things You Probably Didn’t Know About James Bond, http://io9.com/5958754/11-things-you-probably-didnt-know-about-james-bond.
Choliński A. (2013), Product placement. Planowanie, kreacja i pomiar skuteczności, ed. Wolters Kluwer Polska, Warszawa.
233
Conlon F. (2013), Skyfall Takes Product Placement to Next Level with Heineken, www.thewrap.com/movies/blog-post/skyfall-takes-product-placement-next-level-heineken-63786/.
Czarnecki A. (2003), Product placement. Niekonwecjonalny sposób promocji, PWE, Warszawa.
Directive 2007/65/WE (2007), European Parliament and of the Council of 11 De-cember 2007, Section 61.
Dobska M. (1998), James Bond sprzedawca, „Businessman Magazine”, 7/1998.Drozdowska P. (2013), Fikcja to za mało! Fenomen Jamesa Bonda, www.e-splot.
pl/?pid=articles&id=2501.Felix S. (2012), The Evolution Of James Bond Movie Product Placement, www.
businessinsider.com/heres-how-james-bonds-relationship-with-product-placement-has-changed-2012-10?op=1.
Former T. (2013), The Skyfall’s the limit on James Bond marketing, www.the-guardian.com/film/filmblog/2012/oct/23/skyfall-marketing-james-bond.
Gębarowski M. (2007), Nowoczesne formy promocji, Oficyna Wydawnicza Po-litechniki Rzeszowskiej, Rzeszów.
Grzesiek M. (2010), James Bond. Szpieg, którego kochamy, Bukowy Las, Warszawa.Kwapisz K. (2012), Czym jest product placement?, Wydawnictwo Dom Prasowy,
Warszawa.Lalik E. (2012), Bond i produkty Sony, www.spidersweb.pl/2012/10/czy-product-
placement-dziala-bond-produkty-sony-razem-na-lata.html.Mas J.S. (2010), Hollywood i marki. Product placement w kinie amerykańskim,
Wydawnictwo SWPS Academica, Warszawa.Niczewski R., Potrzebowski J. (2011), Product placement jako skuteczne narzędzie
komunikacji marketingowej, Agora, Warszawa.Nitins T. (2011), Selling James Bond: product placement in the James Bond films,
Cambridge Scholars Publishing, United Kingdom.Ortega E. (1997), La comunicación publicitaria, Ediciones Pirámide, Madrid.Pazio N.M. (2007), Podstawy Marketingu, Oficyna Wydawnicza Politechniki
Warszawskiej, Warszawa.Radford B. (2012), Branding James Bond: Do Product-Placement Ads Work?,
www.livescience.com/24957-james-bond-product-placement.html.Sancton J. (2012), For Your Ads Only: 50 Years of James Bond Product Placement,
www.businessweek.com/articles/2012-04-05/for-your-ads-only-50-years-of-james-bond-product-placement.
Segrve K. (2004), Product Placement in movies, McFarland & Company Publishers, Jefferson.
Sobocińska M. (2002), Product placement – instrument budowania marki, Wydawnictwo Akademii Ekonomicznej we Wrocławiu, Wrocław.
Wyrwisz J. (2011), Product placement – korzyści i ograniczenia w komunikacji marketingowej produktów i usług, „Przegląd Organizacji”, nr 11.

234
Summary
This article presents the characteristics of product placement as global promotion. The reader may refer to the types of product placement, its regulatory framework and its short genesis and evolution. The paper presents the results of a survey conducted on a group of 123 respondents. The survey results indicate that product placement in James Bond films is noticeable by more than 90% of respondents. The respondents have positive opinions on the use of product placement to pro-mote the products. This may encourage potential investors to make more use of film as a medium of product placement.
Key words: product placement, history of product placement, kinds of product placement, James Bond
JEL: M31, M37
235
Efficiency frontier on Japanese banking system
Ionuț Cristian Ivan*1
Introduction
The Japanese banking system could be described as a system that hasn’t yet fo-und its equilibrium after the burst of the late 80’s economic bubble, with a large effect on stock prices and on the real estate segment of loans. Also, after the prices reached a nadir in 2003 and experienced a slow growth, the onset of the financial crisis made them drop even lower.
Like many other countries, Japan must deal with foreign competition in the banking sector, especially US banks that succeeded in changing the local banking market segmentation. Another special characteristic of the Japanese banking sys-tem is the presence of large financial institutions that play an important role in the local and international financial systems. These institutions are known as keiretsu. The main role of a keiretsu is to act as intermediary between local firms and the economic environment, helping the firms with loans for investment projects. In accordance with the 1977 Anti-Monopoly Law, a keiretsu bank could have shares at one of the partner firms, but not more than 5%. The structure of this network resembles in some way the structure of a virtual enterprise, the main difference being that, unlike virtual enterprises, keiretsu maintain reciprocal relations with the firm for an unlimited period of time.
Lately, a large number of keiretsu banks started to merge into huge financial institutions. The most representative case is the merger of the Bank of Tokyo with the Mitsubishi Banking conglomerate, the result being the second largest bank worldwide, when taking into consideration the dimension of assets.
The main problem that is to be discussed over the following pages revolves around the term of financial efficiency of the Japanese Banking system. The subject
* Ionuț Cristian Ivan – MSc, Institute for Doctoral Studies, Academy of Economic Studies Bucharest.
236
is interesting, mainly because of the Japanese Banking system’s particularities, such as the presence of keiretsu and the effect they have on efficiency scores, inter and intraregional banks and also efficiency analysis in the context of the present financial crisis.
So far, there haven’t been many studies that center on the efficiency of the banks in Japan, with the exception of foreign banks. Some research has been done, using Data Envelopment Analysis (DEA) estimates of efficiency, the most notable article being the one written by Fukuyama in 1993. Nowadays, new data are ava-ilable, also data that include the effect of the financial crisis. This paper will focus on this new data, extracted from the main local banks’ income statement, for the 2012 fiscal year. Also, unlike Fukuyama’s decomposition of efficiency scores into pure technical efficiency and scale efficiency, this paper will relax the convexity restriction of the DEA program and will present the Free Disposal Hull (FDH) scores. At the same time, the banks will be analyzed from the super-efficiency perspective, giving a classification of the efficient banks.
The main findings of this paper revolve around the comparison between effi-ciency scores obtained through DEA and FDH models and also using the terms of super-efficiency and input/output aggregation.
The article is structured as follows. The second section positions this paper within the specialty literature. Section 3 gives the necessary theoretical means for a better understanding of the application. Section 4 presents an application of a DEA and FDH model, the super-efficiency measures for the fully efficient banks and the effect of input and output aggregation over the efficiency scores. Section 5 summarizes our findings.
Literature review
The non-parametric efficiency measurement started from the concept of convex hull proposed by Farrell (1957) in “The measurement of productive efficiency”. Practically speaking, in economic theory, a firm’s inputs and outputs are repre-sented graphically using a production function. The convex hull represents the smallest convex subset in a Euclidian space, which contains the cloud of points (representation of firms). The convex hull envelops the data, and the efficiency measures are calculated relative to this surface.
For almost 20 years, the work of Farrell passed unnoticed, until 1978, when Charnes, Cooper and Rhodes introduced the term of data envelopment analysis in the paper “Measuring the efficiency of decision making unit”. The model propo-sed by Charnes, Cooper and Rhodes was an input orientated one, with constant returns to scale. The model was constructed as a linear programming problem that maximizes the ratio of output to input (with associated weights) following sign restriction of weights and the constraint that seeks to radially contract the input

237
vector, while still remaining in the feasible input set (Coelli, Prasada 2005). The model is suitable when all the analyzed firms are operating at an optimal scale (which is almost impossible, due to microeconomic issues – imperfect compe-tition, tax regulations, government laws). When this model is used and the firms are not operating at an optimal scale, scale efficiency cannot be calculated (it is included in technical efficiency).
Several years later, the DEA methodology moved to a model with variable returns to scale (Färe, Grosskopf and Logan – in 1983; Banker, Cooper and Char-nes – in 1984) by introducing a convexity constraint. Also, this model is capable of finding the scales where a firm is operating.
Other works in this domain include the way the orientation of the model is chosen, environmental variables, input congestion or slacks treatment.
In the case of model orientation, Coelli states in his 1999 work together with Perelman, that the orientation of the model doesn’t have a major influence upon the scores obtained following the DEA implementation.
Over time, a lot of articles have dealt with the DEA method of estimating efficiency scores – Thanassoulis in his paper “Assessing police forces in England and Wales using data envelopment analysis”, or Thrall in “Recent Developments in DEA: The Mathematical Programming Approach to Frontier Analysis”. Today, some authors try to solve the remaining disadvantages of DEA implementations (e.g. Leopold Simar – the way outlier variables affect the obtained results).
As stated in the introduction, the main research article applied on the Japane-se Banking system belongs to Fukuyama (1993). In his article, he applied a DEA model to calculate the scores of technical efficiency, finding an overall score of approximately 0.865, meaning the banks could diminish their inputs by 13,5% and still produce the same output.
Another article focusing on Japanese credit banks – Hosono et al. (2006) – studied the effect of credit banks’ consolidation over the efficiency scores. Drake et al. (2009) made a study on technical efficiency level using more recent data than Fukuyama (1993), obtaining an overall score of efficiency equal with 0,72, thus observing a drop in Japanese efficiency levels.
Methodology
The main purpose of the article is to analyze, from an efficiency point of view, the main banks of Japan, using data envelopment analysis and free disposability hull analysis, non-parametric tools. DEA provides an analysis of technical efficiency using an input orientation approach, since for a bank’s management it is easier to have control over inputs rather than outputs. The technical efficiency measures are calculated relative to a surface that envelops the considered data. FDH relaxes the convexity constraint and provides a biased estimator of efficiency measures.

238
The approach from Farrell’s “The Measurement of Productive Efficiency” (1957) and Charnes et al., considers a constant returns to scale (CRS) methodo-logy, but lacks a scale efficiency measurement. Charnes and Cooper solve this problem by considering a variable returns to scale (VRS) methodology, which focuses on scale efficiency rather than pure technical efficiency.
Firstly, I will define some notations. Considering data on n inputs and m outputs, summarized in an NxB matrix of inputs and an MxB matrix of outputs, where B represents the number of banks taken for analysis, I define the column vectors xi (input values for i-th bank) and qi (output values for the i-th bank).
The data set is described by a production process that defines the data cloud production set Ψ, defined as follows, according to Wilson and Simar (2008):
Ψ = {(x,y) ϵ R+N + M | x can produce y}where x is a strictly positive N-dimen-
sional vector of inputs and y a strictly positive M-dimensional vector of outputs. The production function is described by the following properties:1. is finite, non-negative and real valued;2. weakly essential – to produce one unit of output at least one input must
be used;3. increasing in inputs – first differential positive and equal with the margi-
nal productivity; an increase in input leads to an increase in output (not necessarily equal);
4. everywhere continuous; twice-continuously differentiable;5. concave in inputs – law of diminishing marginal productivity.In Coelli (2005), the next model for CRS DEA is defined:
min θθ λ
– qi + Q λ ≥ 0θxi – X λ ≥ 0
λ ≥ 0
where the following notations are used: θ – scalar, Q – output matrix, X – input matrix and λ – vector of constants. θ represents the efficiency score of the i-th bank. The constraints ensure that, after the radial contraction of inputs, the projected point on the frontier still remains in the feasible region of production (Coelli, 2005).
The LP 1 model is summarized in Wilson and Simar (2008) as follows:∂ Ψ = {(x,y) ϵ Ψ | (θx,y) ϵ Ψ, 0 < θ < 1, (x, λy) ) ϵ Ψ, λ>1}2
This relation defines the production frontier used to calculate the efficiency scores. Basically, the inefficient banks are found in the interior of Ψ, while the efficient ones lies on the frontier defined by ∂Ψ. Wilson and Simar (2008) con-tinue with the definitions of θ as an input measure of efficiency and λ as an output measure of efficiency.
θ(x,y) = inf{θ|(θx,y) ϵ Ψ}λ(x,y) = sup{λ|(x,λy) ϵ Ψ}
A A
(LP 1)

239
The main problem with CRS DEA is the existence of slacks, both in input or output. For example, an input slack can be defined as the radial contraction of an inef-ficient point where a bank produces the same amount of output using more input than is used another efficient point. In practice, after the radial contraction, the inefficient point moves on the CRS frontier in a zone where the frontier is parallel with the axes. In a similar way the output slack is defined as the point where a bank produces less output, using the same amount of input as another bank. The output and input slacks are equal to zero when both the first and second constraints of LP1 are equal to zero.
Later, Charnes et al. found a way to differentiate between pure technical effi-ciency and scale efficiency, by introducing a new constraint to LP1 – I1’ λ = 1 (where I1 is a vector with elements equal to 1). This construct ensures the formation of a convex hull12that envelops better the data than the conical hull from LP1. The new formula-tion of the CRS DEA will be considered in the following pages as VRS DEA or LP2.
Solving both CRS DEA and VRS DEA, the scale efficiency can be easily calculated as the ratio between CRS technical efficiency and VRS technical ef-ficiency. Thus, the following notation represents scale efficiency SE = .
Technical efficiency is measured using the distance concept, proposed by Malmquist and Shepard (1953) in order to calculate the efficiency of a firm. Con-sidering the input vector Ψ(y), Malmquist and Shepard define the input based distance function as a maximal contraction in inputs, given the output vector:
di(x,y) = max [ω, under ϵ Ψ(y)]
For a better understanding of the concept, I considered the representation of the output vector through an isoquant (Figure 1).
The input based distance function calculated for firm A (which uses ×1 and × 2 inputs to produce y output) is equal to d = .
Figure 1. Representation of output vector
1 The convex hull of a set Y of points in a Euclidian space is the smallest convex set that contains Y.
TEcRs
TEvRs
OAOB
Source: own elaboration.

240
The distance function has the following properties:1. increasing in inputs – it can be observed that if an equal increase in inputs
is to be considered, the firm moves to A’ and the new associated distance is bigger d’ = ;
2. decreasing in outputs – at an increase in the output vector, the isoquant will shift upward to y’. The new distance will equal d” = , which is smaller than d;
3. if x ϵΨ(y), than di(x,y) ≥ 1;4. if the firm lies on the isoquant, the associated distance is equal to 1.Based on the distance concept, Farrell (1957) proved that the technical effi-
ciency equals the inverse of the firm’s associated input orientated distance. After calculating the scale efficiency, the presumption whether the studied
banks are situated in the increasing returns to scale or decreasing returns to scale region of the production frontier would be the first thing to question. To find out the answer to this question, a new linear programming model (LP3) is consid-ered, which replaces the VRS constraint with I1’ λ ≤ 1. To find out the region where a bank is situated on the production frontier, technical efficiency is calculated in accordance with LP2 and LP3. If TELP3≠ TEVRS the bank is situated in the increas-ing returns to scale region. In the contrary case, the bank is situated in the decreas-ing returns to scale region.
For the DEA model, Wilson and Simar (2008) define seven assumptions for the data generating process. One of them is the disposability assumption, stating that for any x’ ≥ x and y’ ≤ y, (x’,y’) belongs to Ψ. Generally, this assumption states the possibility of producing less using more input.
Deprins (1984) formulates a model based on this assumption and based on a non-convex production set, formulated by Wilson and Simar (2008) as follows:
ΨFDH = {(x,y) ϵ R+N + M | y ≤ yi, x ≥ xi, (xi, yi) ϵ B}
Analyzing the environment where the banks operate, it is observed that some of them act in a different way than normal commercial banks. This is the case of the “keiretsu banks”. These banks represent the core of a union of companies that operate in different sectors of the Japanese economy. They act as the main financial link of these firms with the economic environment, so they also have a great influence over Japan’s economic and financial environment. For example, the bankruptcy of such a bank could lead to a small financial crisis in Japan.
In this paper I will also use the term super efficiency model defined by Wil-son (1995), as a modified DEA purposed by Petersen and Andersen (1993). The super efficiency scores are calculated based on a reduced set of data, B-1, since in calculating scores for the b-th bank, the b-th bank can’t use itself as a peer. Thus, the super-efficiency score could be greater than 1.
OAOB’
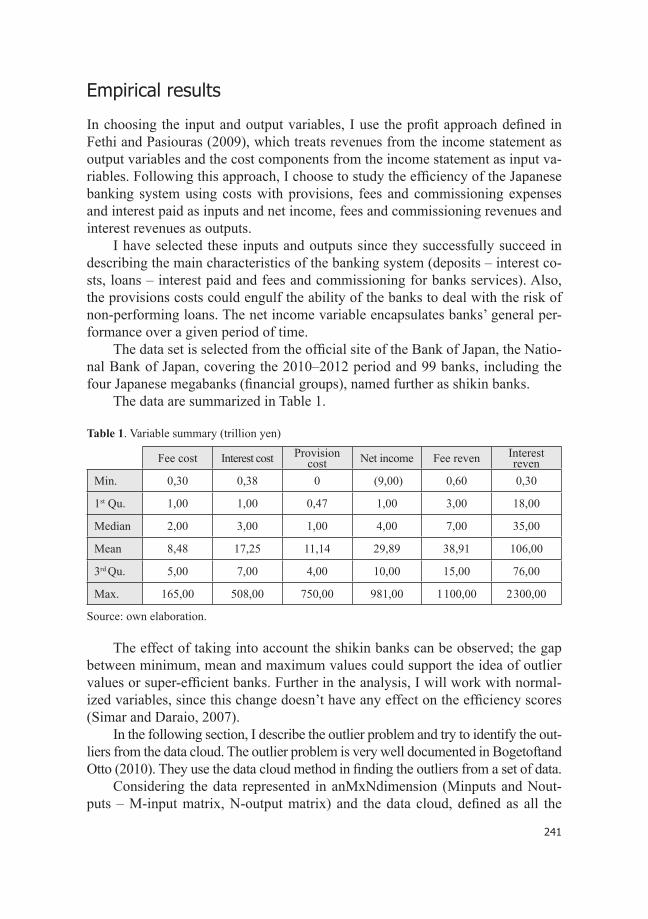
241
Empirical results
In choosing the input and output variables, I use the profit approach defined in Fethi and Pasiouras (2009), which treats revenues from the income statement as output variables and the cost components from the income statement as input va-riables. Following this approach, I choose to study the efficiency of the Japanese banking system using costs with provisions, fees and commissioning expenses and interest paid as inputs and net income, fees and commissioning revenues and interest revenues as outputs.
I have selected these inputs and outputs since they successfully succeed in describing the main characteristics of the banking system (deposits – interest co-sts, loans – interest paid and fees and commissioning for banks services). Also, the provisions costs could engulf the ability of the banks to deal with the risk of non-performing loans. The net income variable encapsulates banks’ general per-formance over a given period of time.
The data set is selected from the official site of the Bank of Japan, the Natio-nal Bank of Japan, covering the 2010–2012 period and 99 banks, including the four Japanese megabanks (financial groups), named further as shikin banks.
The data are summarized in Table 1.
Table 1. Variable summary (trillion yen)
Fee cost Interest cost Provision cost Net income Fee reven Interest
revenMin. 0,30 0,38 0 (9,00) 0,60 0,30
1st Qu. 1,00 1,00 0,47 1,00 3,00 18,00
Median 2,00 3,00 1,00 4,00 7,00 35,00
Mean 8,48 17,25 11,14 29,89 38,91 106,00
3rd Qu. 5,00 7,00 4,00 10,00 15,00 76,00
Max. 165,00 508,00 750,00 981,00 1 100,00 2 300,00
Source: own elaboration.
The effect of taking into account the shikin banks can be observed; the gap between minimum, mean and maximum values could support the idea of outlier values or super-efficient banks. Further in the analysis, I will work with normal-ized variables, since this change doesn’t have any effect on the efficiency scores (Simar and Daraio, 2007).
In the following section, I describe the outlier problem and try to identify the out-liers from the data cloud. The outlier problem is very well documented in Bogetoftand Otto (2010). They use the data cloud method in finding the outliers from a set of data.
Considering the data represented in anMxNdimension (Minputs and Nout-puts – M-input matrix, N-output matrix) and the data cloud, defined as all the

242
observations represented in the MxN dimension, Bogetoft and Otto (2010) define the volume of the data cloud as being approximately equal to the determinant of the [MN]`[MN] matrix. By removing outliers from the analysis, the volume of the data cloud decreases.. If the observations linked to a bank are in the middle of the data cloud, by removing this bank, the volume of the data cloud remains unchanged. Bogetoft and Otto (2010) define the following ratio:
R(i) = where D(i) represents the determinant calculated after the removal of the bank
and D – the determinant before the removal of the bank.The ratio will tend to 1, if the analyzed bank is not an outlier (the volume of
the data cloud doesn’t change much). Similarly, when the ratio tends to 0, clearly the bank being analyzed is an outlier.
Using R software, I performed the outlier analysis. The results are summa-rized in the below table.
Table 2. Outlier detection results
Deleted observations R
1 5.80E-03
97 1 5.50E-04
4 2 1 1.20E-05
4 2 97 1 7.40E-07
5 4 2 97 1 7.40E-08
98 5 4 2 97 1 2.90E-08
98 6 5 4 2 97 1 9.80E-09
98 3 6 5 4 2 97 1 3.40E-09
42 98 3 6 5 4 2 97 1 1.80E-09
42 77 98 3 6 5 4 2 97 1 9.20E-10
99 42 77 98 3 6 5 4 2 97 1 4.60E-10
99 42 77 13 98 3 6 5 4 2 97 1 2.60E-10
Source: own elaboration.
The table presents the minimum values of R ratio when a bank is deleted from the data cloud. The values associated to the ratio tend to zero, so the twelve banks shown in the table above are outliers.
I decided to keep in the analysis those banks detected as outliers by the Bo-getoft and Otto methodology, since these banks are mainly shikin banks and other inter-regional financial institutions. It is interesting to see the results of super-ef-ficiency analysis over the data sets and to check the super-efficiency measures for the banks detected as outliers.
D(i)
D

243
Data envelopment analysis
In accordance with the stated methodology, I applied the linear programming pro-blem that describes DEA on the data. DEA accounts for an input approach with variable returns to scale. The results show a large number of perfectly efficient banks – approximately 25% from the total number of banks. The low efficiency firms, with an efficiency score lower than 0,4, have a percentage of only 6%. The rest of the banks lie in a zone of higher efficiency that can still be improved. The average efficiency score is 0,754, meaning that overall, the banks could decrease input by 24,6% and still obtain the same output level. The obtained level of ave-rage efficiency brings us closer to the results of Drake et al. (2009) results rather than those of Fukuyama (1993).
Of the 24 banks that are perfectly efficient, the majority are represented by banks with inter regional relations and by big financial groups that have a monopoly in a specific area (example – Sapporo Hokuyo Holdings in the Hokkaido area).
The next question begins essentially after the DEA linear program calculates the perfectly efficient banks. Can these banks be ranked? Yes, these banks can be ranked using the super efficiency term.
During the super-efficiency analysis, the bank that is the subject of the ana-lysis has its data eliminated from the analysis. The frontier is calculated using B-1 banks and then the distance from the B-th omitted bank, relative to the new calculated frontier, and represents a super-efficiency score that can be greater than 1. In some cases, the efficiency score tends to infinity. This is the case of hyper efficient firms.
The following table represents a descending review of super and hyper effi-cient banks.
Table 3. Super/hyper efficiency scores
Bank Super efficiency scores
Mitsubishi UFJ Financial Group Inf
Shizuoka Bank Inf
Sumitomo Mitsui Financial Group 122,497
DBJ 30,5792
Fukushima Bank 5,5412
Daitou Bank 4,9221
Shinwa Bank 2,6364
Toyama Bank 2,413
Resona Bank 2,2348
Sumitomo Mitsui Trust Holdings 2,1668

244
Bank Super efficiency scores
Sapporo Hokuyo Holdings 1,8972
Yokohama Bank 1,5993
Shoko Chukin Bank 1,4602
Gunma Bank 1,4211
Yamanashi Chuo Bank 1,3953
Daishi Bank 1,1454
Chugoku Bank 1,1317
Iyo Bank 1,1283
Kagoshima Bank 1,119
Kanagawa Bank 1,0925
Awa Bank 1,0863
Suruga Bank 1,0616
Shimizu Bank 1
Tochigi Bank 1
Source: own elaboration.
The big four shikin banks, which also act as a keiretsu bank for big corporations such as Mitsubishi Motors or Toyota MC, have the greatest super-efficiency scores, relative to all other banks, mainly inter-regional banks. Practically, Mitsubishi UFJ and Shizuoka Bank acts as hyper efficient banks on Japanese Banking market.
Aggregation of inputs and outputs
In their 2007 study, Daraio and Simar question the dimensionality effect over the convergence of the estimators resulting after applying DEA/FDH. As they have observed, the fewer inputs and outputs and the more observation that are conside-red for analysis, the more the probability of convergence increases.
Thus, Simar and Daraio (2007) propose a method of variables aggregation, using an aggregated vector that will retain the maximum information. They suggest data normalization, by dividing by mean or standard deviation, since it doesn’t have an effect on the efficiency scores, due to DEA estimates of being scale-invariant.
They have also observed that the weights which form the vector which reta-ins the maximum total variance are actually the eigenvector corresponding to the biggest eigenvalue of the matrix N`N (for inputs) and M`M (for outputs).
Using the elements of the eigenvector corresponding to the largest eigenva-lue as weights, I aggregated the variables in two aggregated vectors (input/output);

245
thus, the data can be easily represented in a bi-dimensional space. The table below contains the Pearson correlation calculated between the initial variables and the ag-gregated ones; it can be observed that the aggregation was successful. Also, when calculating the principal components related to inputs/outputs, the largest eigenva-lue retains the largest amount of information from the total variance (96%).
Table 5. Correlations between initial inputs and aggregated input
Fees and
commission expenses
Interest paid Provisions expenses
Aggregated input
Fees and commission expenses 1Interest paid 0,91998 1Provisions expenses 0,70651 0,81913 1Aggregated input 0,75779 0,85607 0,98001 1
Source: own elaboration.
Table 6. Correlations between initial outputs and aggregated output
Net incomeCommis-sioning revenue
Interest revenue
Aggregated output
Net income 1Commissioning revenue 0,96551 1Interest revenue 0,97886 0,98813 1Aggregated output 0,98105 0,98190 0,99810 1
Source: own elaboration.
Once I aggregated the input and output matrices in two vectors, using input and output inertia as weights, I resumed the DEA model and I also represented in a bi-dimensional space the efficiency frontier that envelops the analyzed data.
Table 7. Aggregate vs. 3/3 (inputs/outputs) DEA
Bank Dea scores Super efficiency Aggregate scores
Mitsubishi UFJ Financial Group 1 Inf 1
Sumitomo Mitsui Financial Group 1 122,497 1
Sumitomo Mitsui Trust Holdings 1 2,1668 0,99701
Resona Bank 1 2,2348 1
Daitou Bank 1 4,9221 0,15537
Gunma Bank 1 1,4211 0,54854
Sapporo Hokuyo Holdings 1 1,8972 1

246
Bank Dea scores Super efficiency Aggregate scores
Yokohama Bank 1 1,5993 1
Kanagawa Bank 1 1,0925 0,5831
Daishi Bank 1 1,1454 1
Chugoku Bank 1 1,1317 0,12283
Shizuoka Bank 1 Inf 1
Source: own elaboration.
It is interesting to observe banks that seem perfectly efficient through the initial DEA model, but obtain low scores after aggregation e.g., Daitou Bank, Chugoku Bank. The simplest explanation of this phenomenon is that the element that helped the bank to reach a point on the frontier was lost after aggregation; the aggregation is done with minimal informational loss (similar to principal compo-nents analysis).
Figure 2. Aggregate dea plot – left (with shikin banks), right (without shikin banks)
Source: own elaboration.
The hyper efficient banks can still be differentiated from the other analyzed banks, even when the data were normalized. For a better view of the Japanese banks’ efficiency scores, I decided to remove the hyper efficient banks.
If the free disposability constraint is removed, banks that produce the same amo-unt of output with less input than other banks are also considered efficient. This si-tuation is represented graphically in the following figure, where, under the FDH as-sumption, I represented the data in a bi-dimensional space. For example, I took the highlighted points. The banks produce the same output with different input quantities.
The average FDH efficiency estimates is 0,9163, observing thus a higher va-lue than the average of the efficiency estimates obtained by DEA.

247
Considering both methodologies (DEA and FDH), if I were to choose which one to apply during my future research papers, I would choose DEA. The main reason for my choice is the way FDH doesn’t differentiate between banks with observable efficiency (same level of inputs, but different level of output).
Figure 3. FDH representation of aggregated data
Source: own elaboration.
Conclusion
This article intended to describe the current Japanese banking system from an efficiency point of view and to determine the difference between keiretsu banks and the other banks. Also, the effect of the financial crisis is another main point of this analysis. As can be seen from the obtained average score of efficiency, the Japanese banking system remained at a level of efficiency similar to the level where it was during the economic bubble at the beginning of the 1990s, according to the comparison between level obtained in 1993 by Fukuyama and the level obtained in this article. The FDH approach gives a smaller average, reaching 0,5.
The keiretsu banks are the most efficient banks considering the Japanese ban-king system (they rank at the top of the super-efficient banks). It would be intere-sting to see what makes them more efficient than the ordinary banks.
The present analysis can be used to detect banks that have an increased de-fault probability. Also, this research can be considered for different microecono-mic sectors, in order to predict, with a p probability, firms that can declare their insolvency in the following period of time.

248
Also, another main finding is that aggregation tends to have an effect on the efficiency measures, if the information that is lost during the aggregation leads to the increase in efficiency scores.
There are also other points that can be reached to completely analyze the Ja-panese banking system. A main point is the scale efficiency scores that are comple-tely different from the total technical efficiency. This problem was also included in Fukuyama (1993). It would have been interesting to compare the obtained results.
For future work, a different DEA analysis on clusters would be useful in try-ing to separate the big financial institutions and small banks.
References
Barros C., Managi S. (2009), Productivity growth and biased technological change: Credit banks in Japan, Journal of International Financial Markets, Institutions and Money, 924–936.
Bogetoft P., Otto L. (2010), Benchmarking with DEA, SFA and R, Springer, New York.Charnes A., Cooper W.W. (1990), Polyhedral cone-ratio DEA models with an
illustrative application to large commercial banks, Journal of Economet-rics 46, 73–91.
Coelli T., Prasada D.S. (2005), An introduction to efficiency and productivity analysis, Springer.
Drake L., Hall M. (2003), Efficiency in Japanese banking: An empirical analysis, Journal of Banking Finance, 891–917.
Farell M.J. (1957), The Measurement of Productive Efficiency, Journal of the Royal Statistical Society, 253–290.
Fethi M., Pasiouras F. (2010), Assessing bank efficiency and performance with operational research and artificial intelligence techniques: A survey, Euro-pean Journal of Operational Research, 189–198.
Fried H., Lovell K., Schmidt S. (2008), The Measurement of Productive Efficiency and Productivity Growth, Oxford University Press.
Fukuyama H. (1993), Technical and scale efficiency of Japanese commercial banks: A non-parametric approach, Applied Economics 25, 1101–1112.
Greene W. (2005), Reconsidering heterogeneity in panel data estimators of the stochastic frontier model, Journal of Econometrics, 269–303.
Halkos G., Salamouris D. (2004), Efficiency measurement of the Greek commer-cial banks with the use of financial ratios: A data envelopment analysis approach, Management Accounting Research 15, 201–224.
Simar L., Wilson P. (2008), Inferences from Cross-Sectional Stochastic Frontier Models.
Simar L., Cinzia D. (2007), Advanced robust and nonparametric methods in ef-ficiency analysis. Methodology and Applications, Springer Thanassoulis E.,

249
Kortelainen M, Allen R., 2012, Improving envelopment in Data Envelopment Analysis under variable returns to scale, European Journal of Operational Research, 175–185.
Wilson P, Simar L. (2008), Statistical Inference in Nonparametric Frontier Models: Recent Developments and Perspectives.
Summary
Since the emergence of the efficiency frontier techniques, a series of comparisons between the methods that led to the resultant efficiency has been presented. In this paper, data from 99 Japanese banks are used in order to prove the applicability of efficiency frontier analysis on the East-Asian financial system and to reveal the differences between inter and intra-regional banks, showing the effect of the present financial crisis on the efficiency of the studied banks. DEA and FDH are used to determine the technical and scale efficiency of the analyzed banks and also it compares fully efficient banks by ranking them through the super-efficiency notion.
Key words: data envelopment analysis, free disposability hull, efficiency frontier, distance, financial efficiency, super efficiency
JEL: C14, D24
This work was co-financed from the European Social Fund through the Sectoral Opera-tional Programme Human Resources Development 2007–2013, project number POSDRU 159/1.5/S/134197 “Performance and excellence in doctoral and postdoctoral research in Romanian economics science domain”.