Embed Size (px)
Citation preview
Energy Technology Assessments: Engineering, Economics, and
Institutional Perspectives
GCEP Research Symposium 2006Frances C. Arrillaga Alumni Center
Stanford University September 18, 2006
John P. WeyantDepartment of Management Science & Engineering
Stanford University
Outline
• Engineering, Economics, Institutional Perspectives
• Hoffert, et al.• Pacala & Socolow• Global Technology Strategy Project (GTSP)• GCEP Integrated Assessments• Future Directions
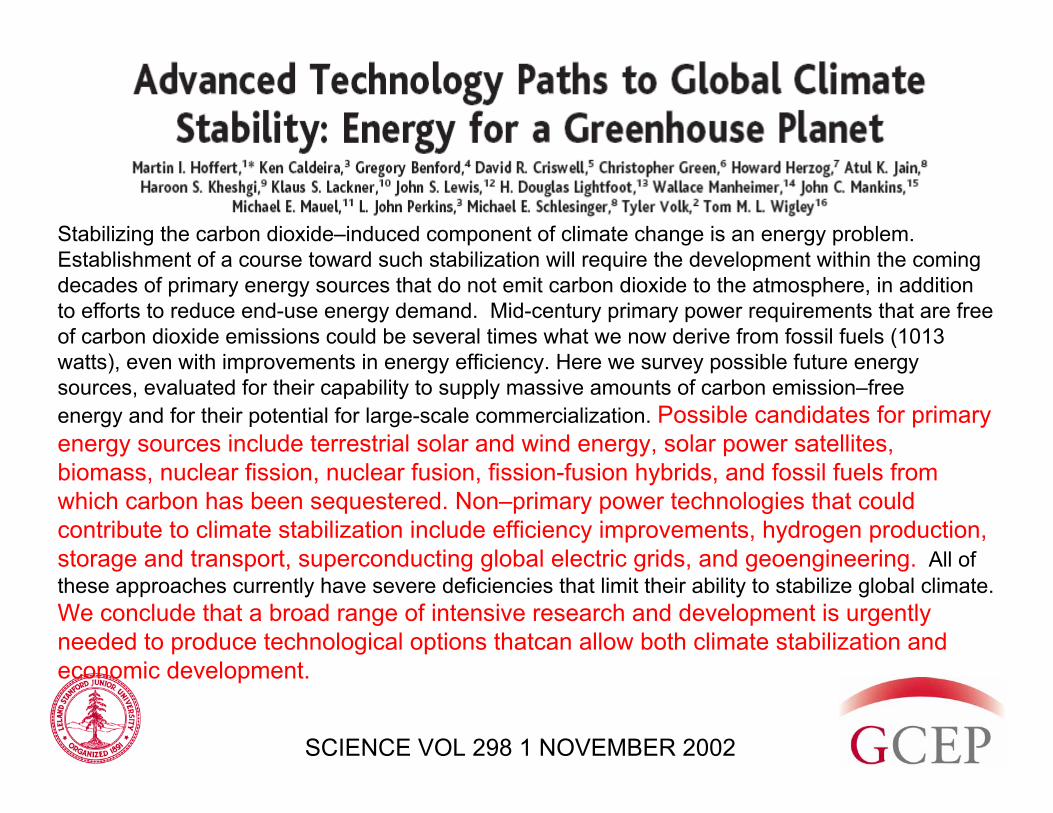
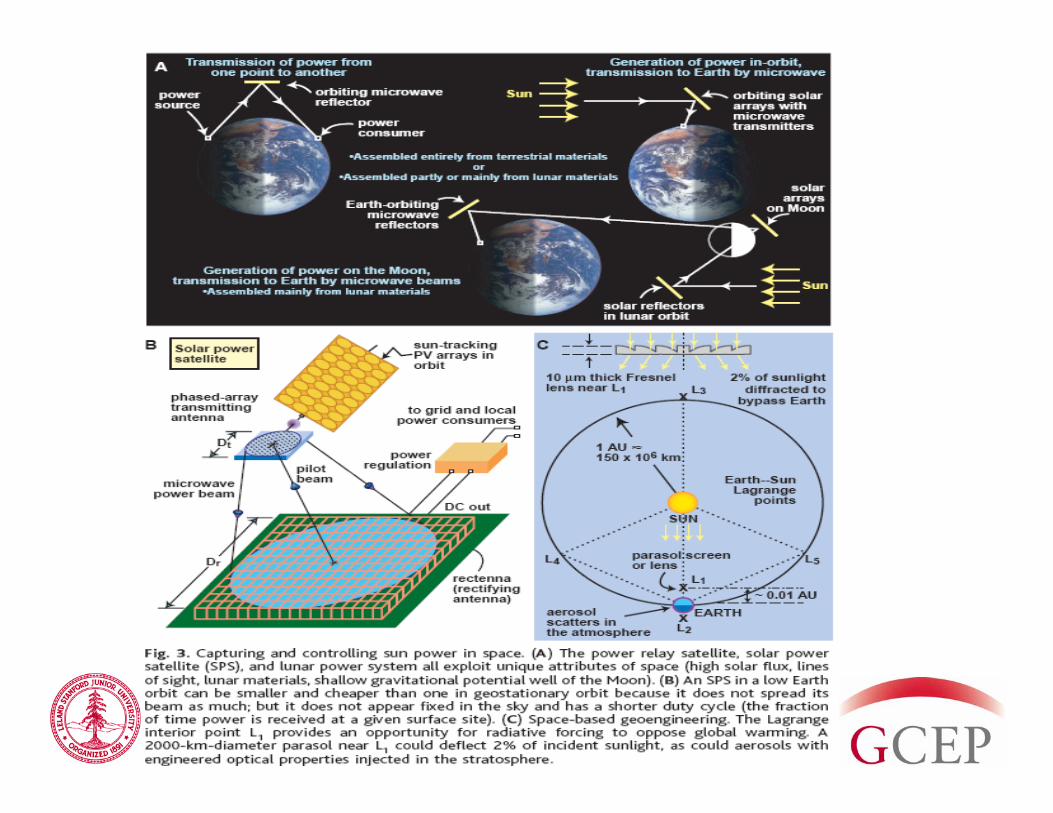
SCIENCE VOL 298 1 NOVEMBER 2002
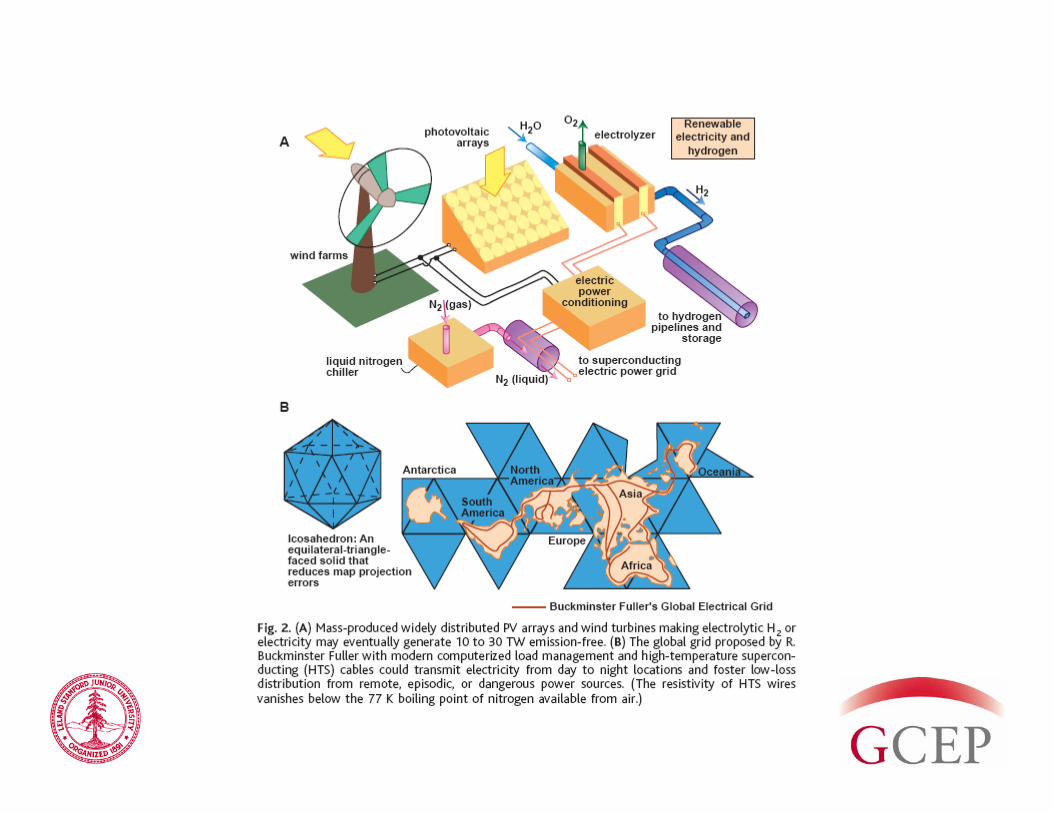
Stabilizing the carbon dioxide–induced component of climate change is an energy problem. Establishment of a course toward such stabilization will require the development within the coming decades of primary energy sources that do not emit carbon dioxide to the atmosphere, in addition to efforts to reduce end-use energy demand. Mid-century primary power requirements that are free of carbon dioxide emissions could be several times what we now derive from fossil fuels (1013 watts), even with improvements in energy efficiency. Here we survey possible future energy sources, evaluated for their capability to supply massive amounts of carbon emission–freeenergy and for their potential for large-scale commercialization. Possible candidates for primary energy sources include terrestrial solar and wind energy, solar power satellites, biomass, nuclear fission, nuclear fusion, fission-fusion hybrids, and fossil fuels from which carbon has been sequestered. Non–primary power technologies that could contribute to climate stabilization include efficiency improvements, hydrogen production, storage and transport, superconducting global electric grids, and geoengineering. All of these approaches currently have severe deficiencies that limit their ability to stabilize global climate. We conclude that a broad range of intensive research and development is urgently needed to produce technological options thatcan allow both climate stabilization and economic development.
Hoffert, et al. • Good
– Highlighted Magnitude of the Problem– Highlighted A Promising Mega Strategy
• Bad– Called for a Moon Shot Program Without Justification– No Economics or Institutional Considerations
• Ugly– No Discussion of Potential of Existing Technologies– No R&D Prioritization
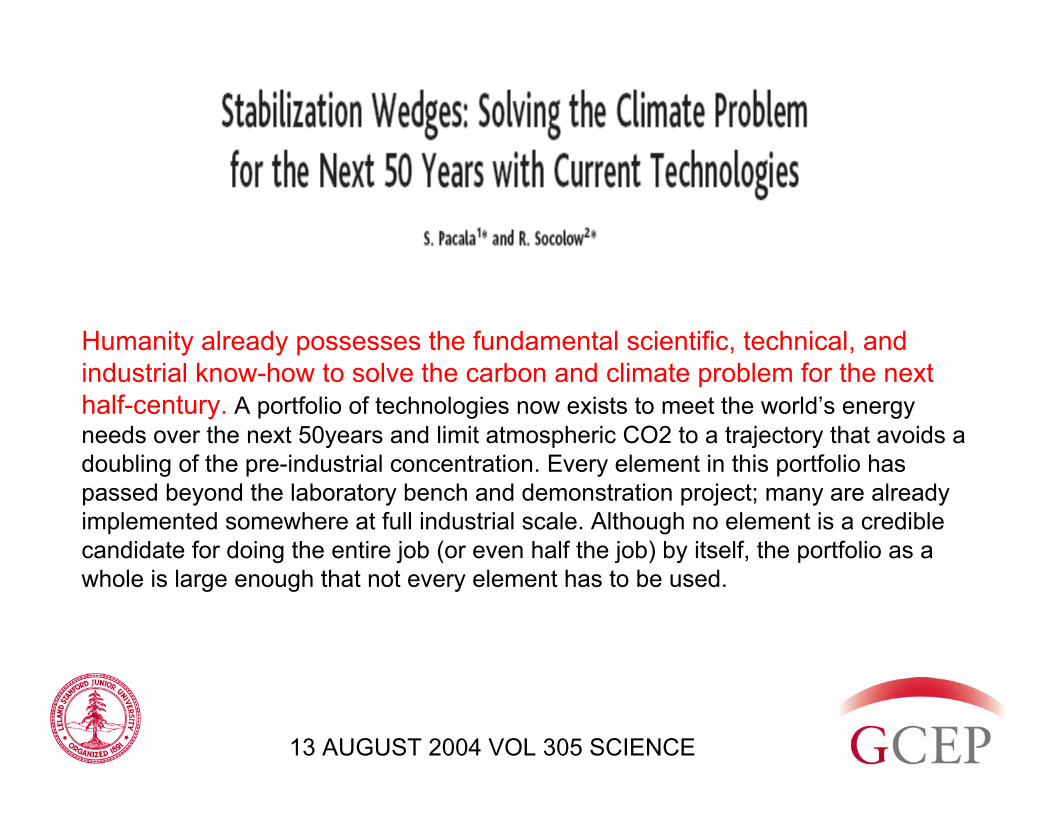
13 AUGUST 2004 VOL 305 SCIENCE
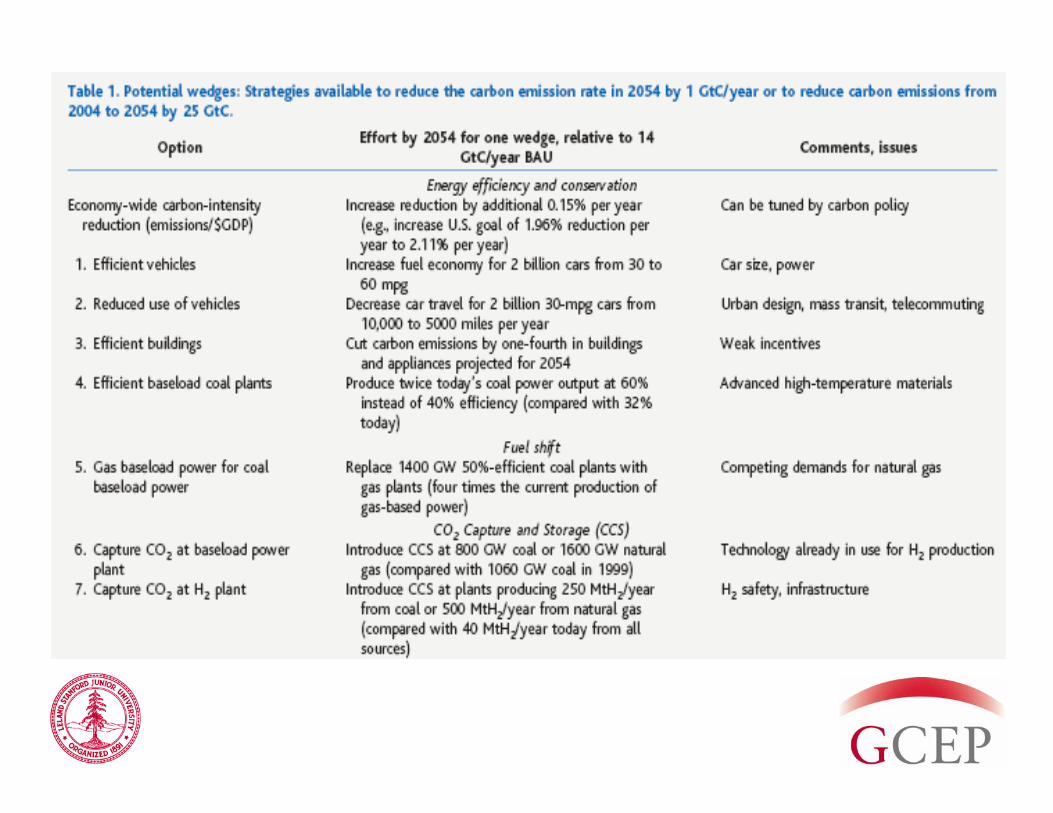
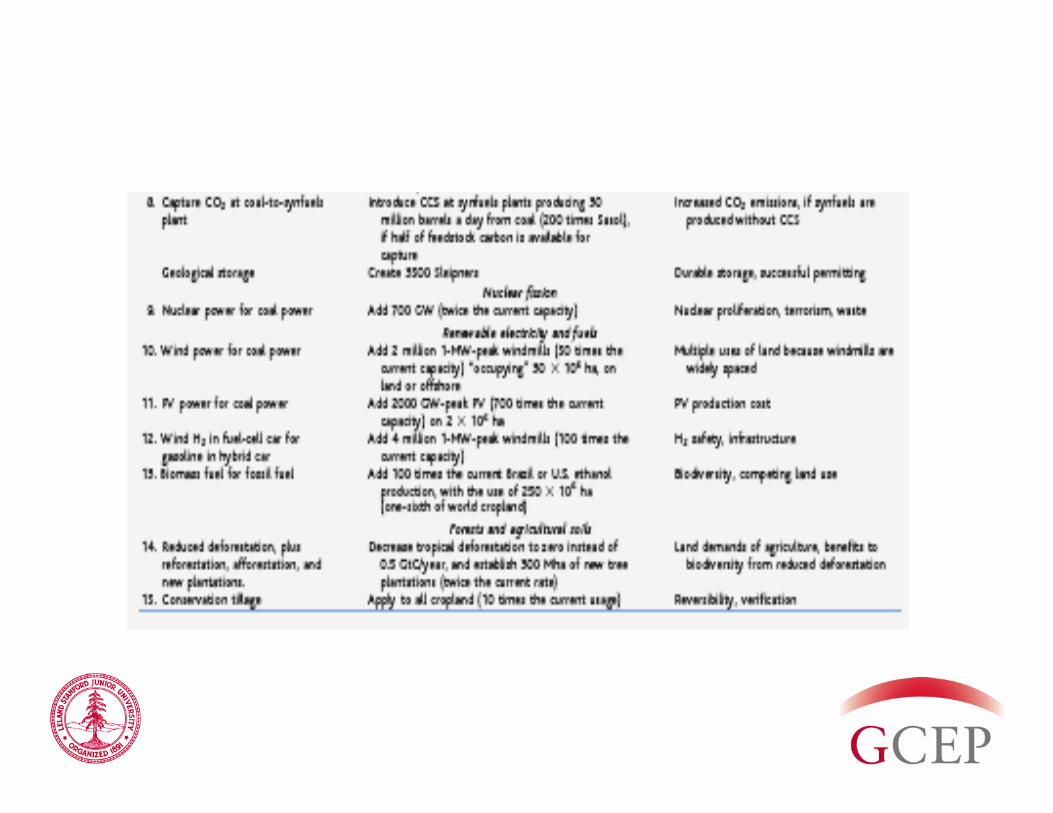
Humanity already possesses the fundamental scientific, technical, and industrial know-how to solve the carbon and climate problem for the next half-century. A portfolio of technologies now exists to meet the world’s energy needs over the next 50years and limit atmospheric CO2 to a trajectory that avoids a doubling of the pre-industrial concentration. Every element in this portfolio has passed beyond the laboratory bench and demonstration project; many are already implemented somewhere at full industrial scale. Although no element is a credible candidate for doing the entire job (or even half the job) by itself, the portfolio as a whole is large enough that not every element has to be used.
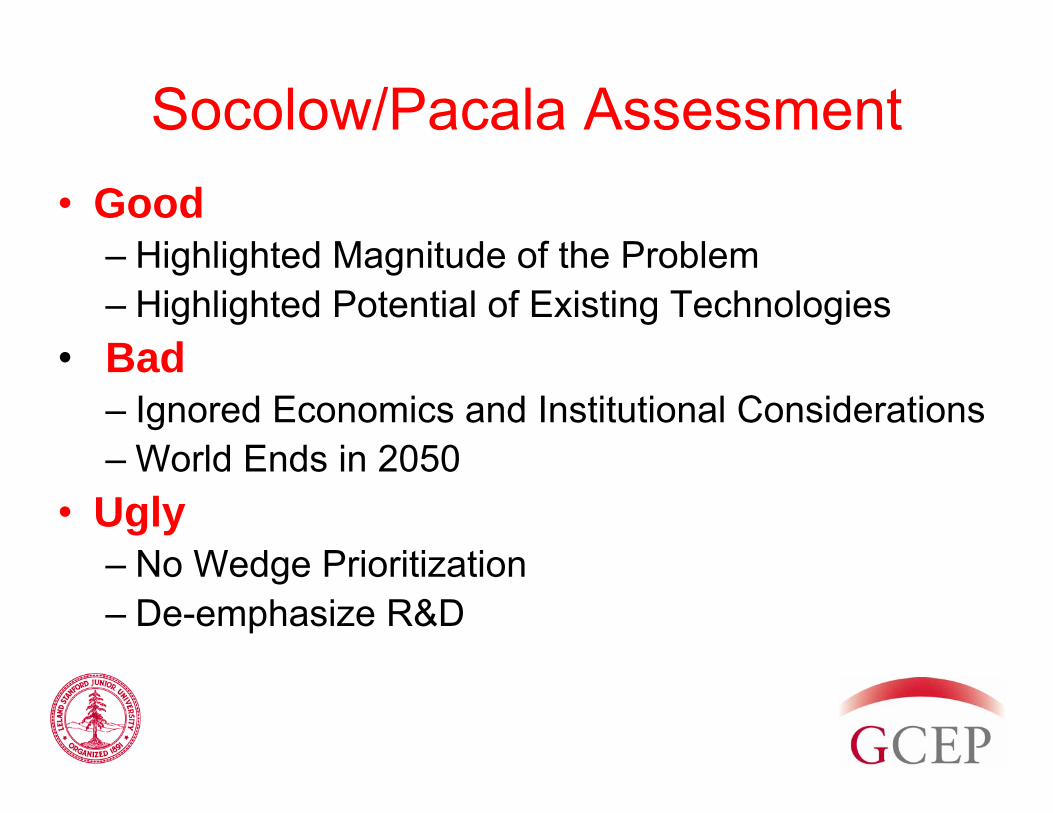
Socolow/Pacala Assessment• Good
– Highlighted Magnitude of the Problem– Highlighted Potential of Existing Technologies
• Bad– Ignored Economics and Institutional Considerations– World Ends in 2050
• Ugly– No Wedge Prioritization– De-emphasize R&D
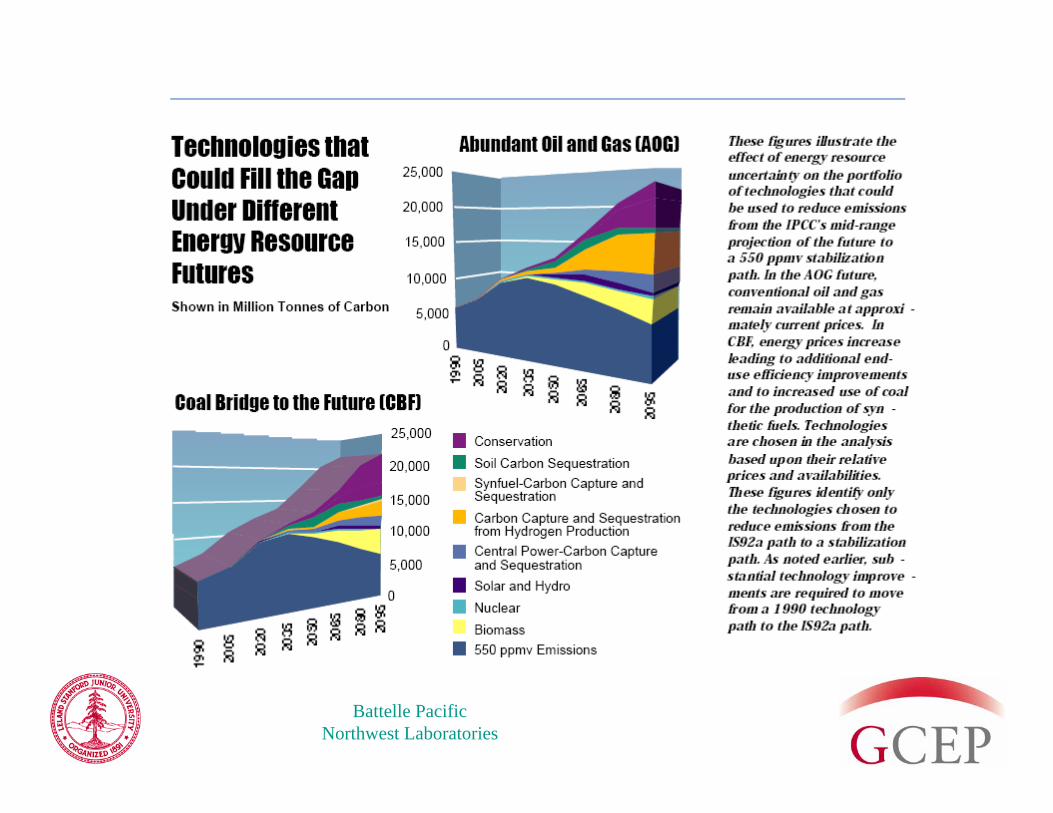
Battelle Pacific Northwest Laboratories
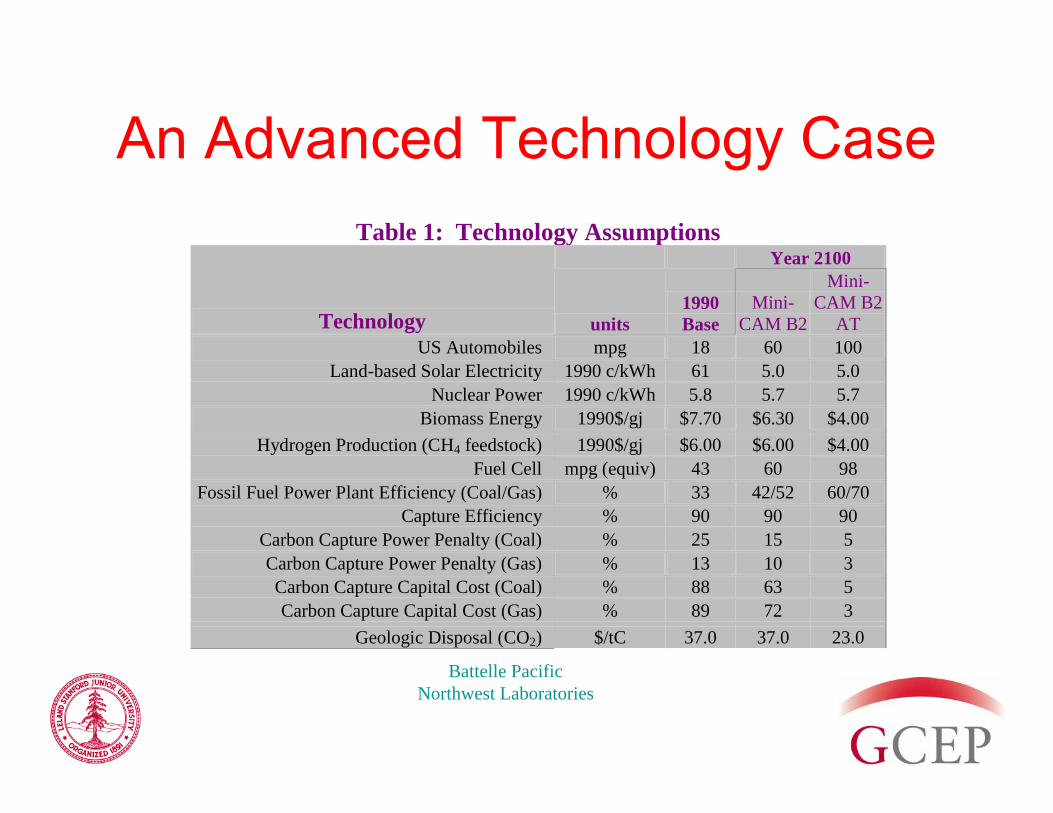
An Advanced Technology Case
Table 1: Technology Assumptions Year 2100
Technology units 1990 Base
Mini-CAM B2
Mini-CAM B2
AT US Automobiles mpg 18 60 100
Land-based Solar Electricity 1990 c/kWh 61 5.0 5.0 Nuclear Power 1990 c/kWh 5.8 5.7 5.7
Biomass Energy 1990$/gj $7.70 $6.30 $4.00 Hydrogen Production (CH4 feedstock) 1990$/gj $6.00 $6.00 $4.00
Fuel Cell mpg (equiv) 43 60 98 Fossil Fuel Power Plant Efficiency (Coal/Gas) % 33 42/52 60/70
Capture Efficiency % 90 90 90 Carbon Capture Power Penalty (Coal) % 25 15 5 Carbon Capture Power Penalty (Gas) % 13 10 3 Carbon Capture Capital Cost (Coal) % 88 63 5 Carbon Capture Capital Cost (Gas) % 89 72 3
Geologic Disposal (CO2) $/tC 37.0 37.0 23.0
Battelle Pacific Northwest Laboratories
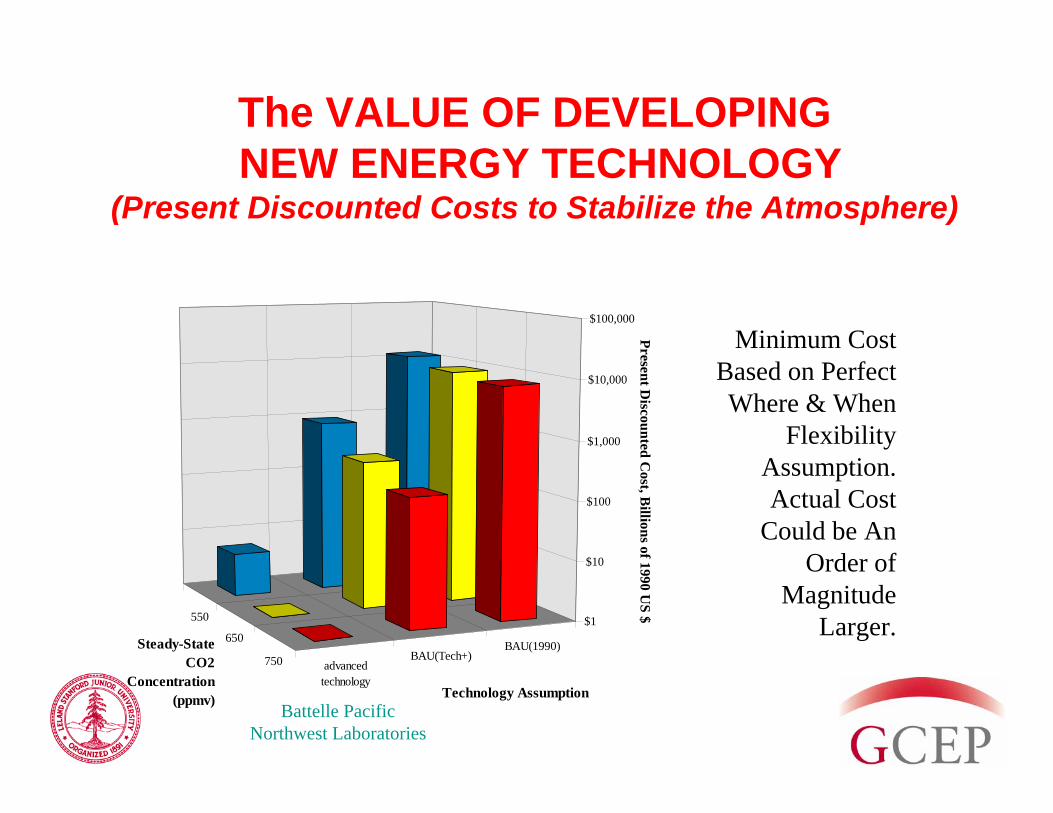
The VALUE OF DEVELOPINGNEW ENERGY TECHNOLOGY
(Present Discounted Costs to Stabilize the Atmosphere)
Minimum Cost Based on Perfect Where & When
Flexibility Assumption. Actual Cost
Could be An Order of
Magnitude Larger.
BAU(1990)BAU(Tech+)
advancedtechnology
550
650
750
$1
$10
$100
$1,000
$10,000
$100,000
Present Discounted C
ost, Billions of 1990 U
S $
Technology Assumption
Steady-State CO2
Concentration (ppmv)
Battelle Pacific Northwest Laboratories
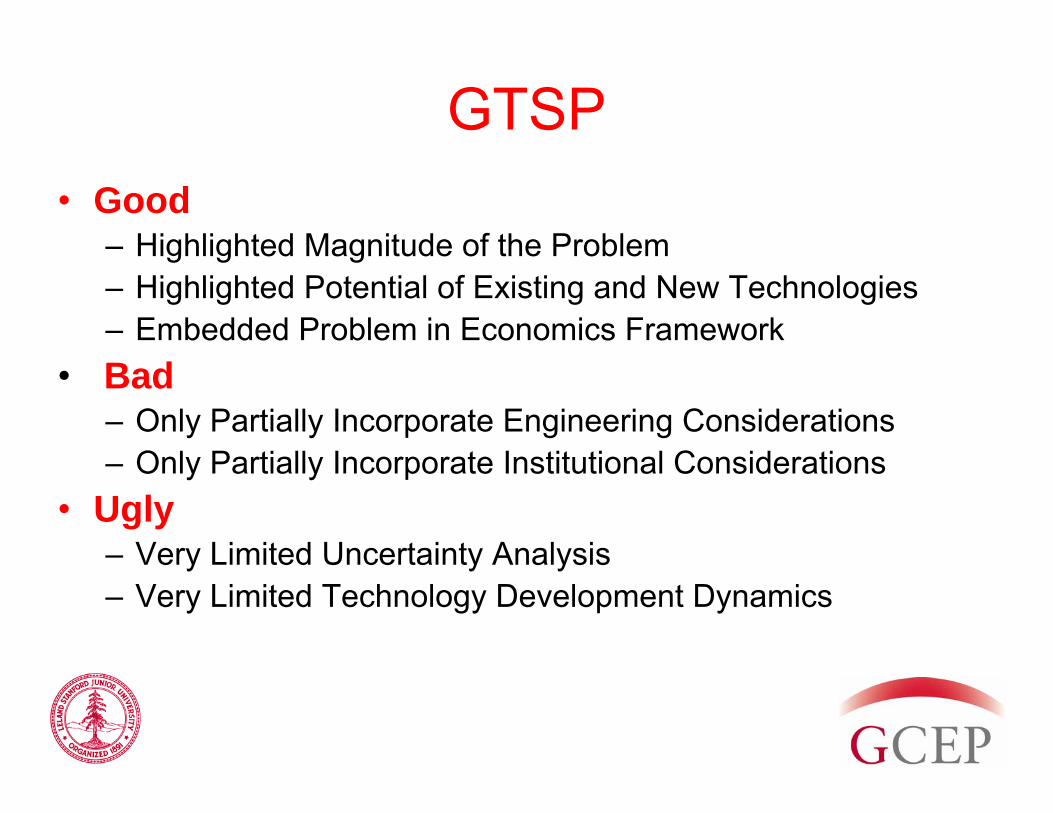
GTSP• Good
– Highlighted Magnitude of the Problem– Highlighted Potential of Existing and New Technologies– Embedded Problem in Economics Framework
• Bad– Only Partially Incorporate Engineering Considerations– Only Partially Incorporate Institutional Considerations
• Ugly– Very Limited Uncertainty Analysis – Very Limited Technology Development Dynamics
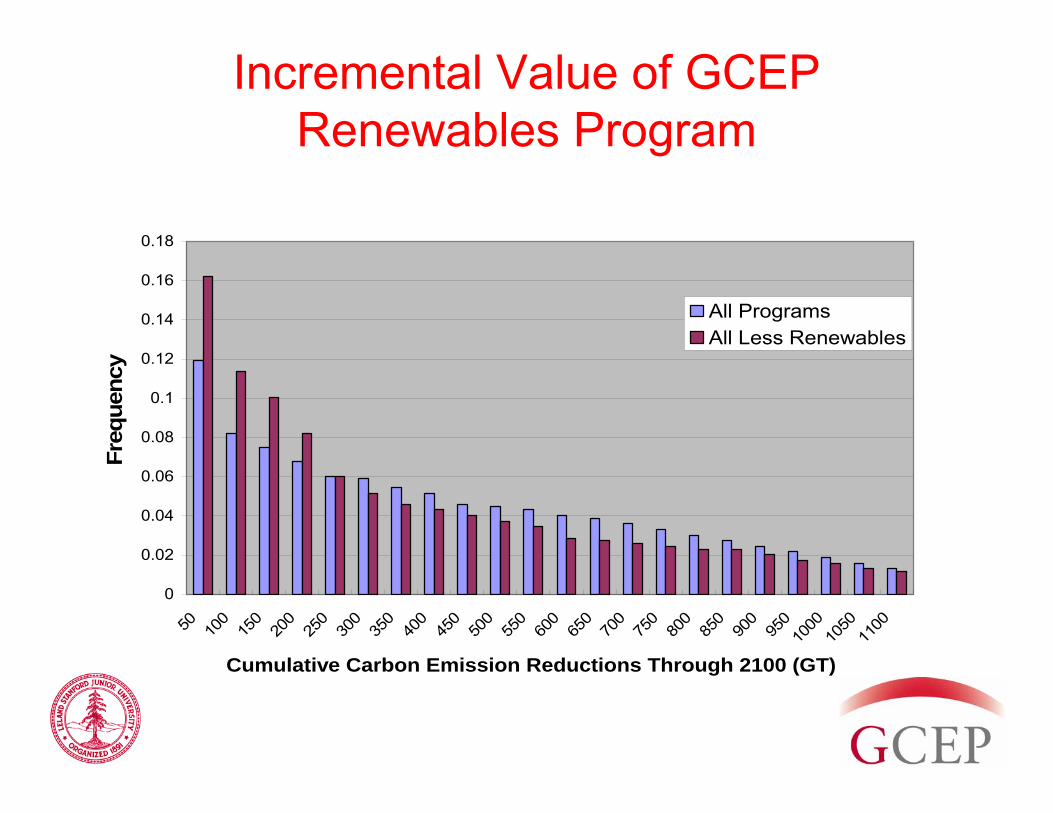
Incremental Value of GCEP Renewables Program
0
0.02
0.04
0.06
0.08
0.1
0.12
0.14
0.16
0.18
50 100
150
200
250
300
350
400
450
500
550
600
650
700
750
800
850
900
950
1000
1050
1100
All ProgramsAll Less Renewables
Cumulative Carbon Emission Reductions Through 2100 (GT)
Freq
uenc
y
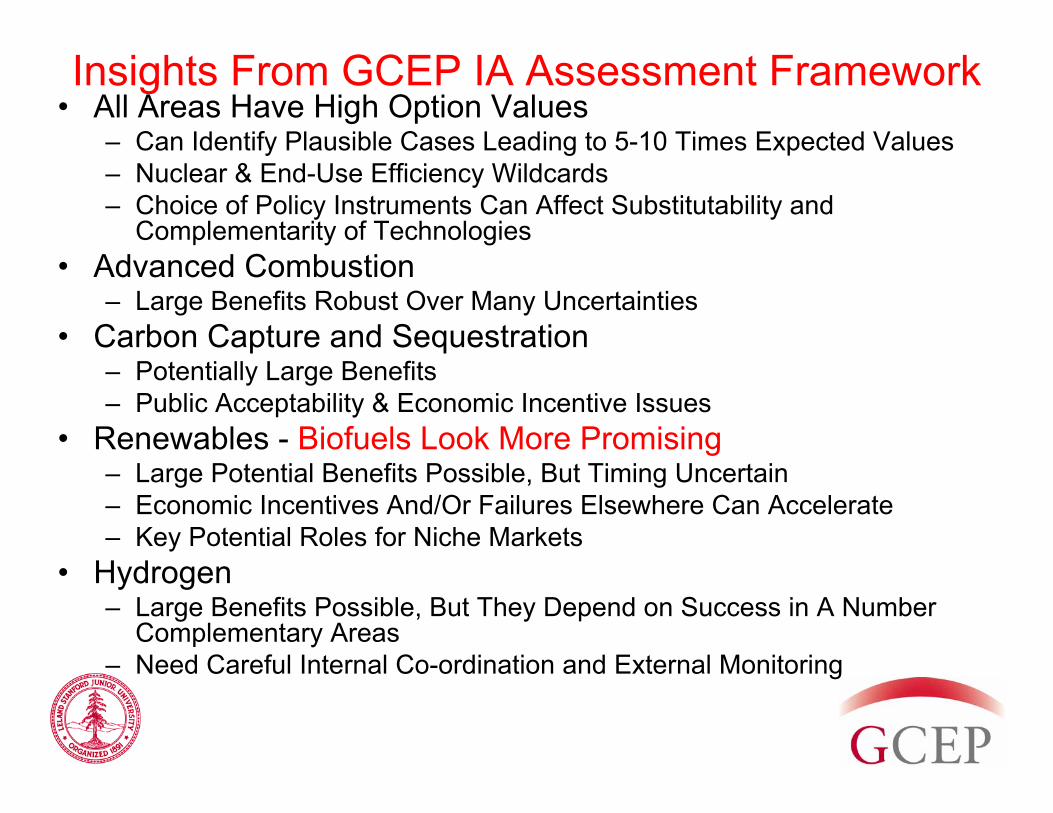
Insights From GCEP IA Assessment Framework• All Areas Have High Option Values
– Can Identify Plausible Cases Leading to 5-10 Times Expected Values– Nuclear & End-Use Efficiency Wildcards– Choice of Policy Instruments Can Affect Substitutability and
Complementarity of Technologies• Advanced Combustion
– Large Benefits Robust Over Many Uncertainties• Carbon Capture and Sequestration
– Potentially Large Benefits– Public Acceptability & Economic Incentive Issues
• Renewables - Biofuels Look More Promising– Large Potential Benefits Possible, But Timing Uncertain– Economic Incentives And/Or Failures Elsewhere Can Accelerate– Key Potential Roles for Niche Markets
• Hydrogen– Large Benefits Possible, But They Depend on Success in A Number
Complementary Areas – Need Careful Internal Co-ordination and External Monitoring
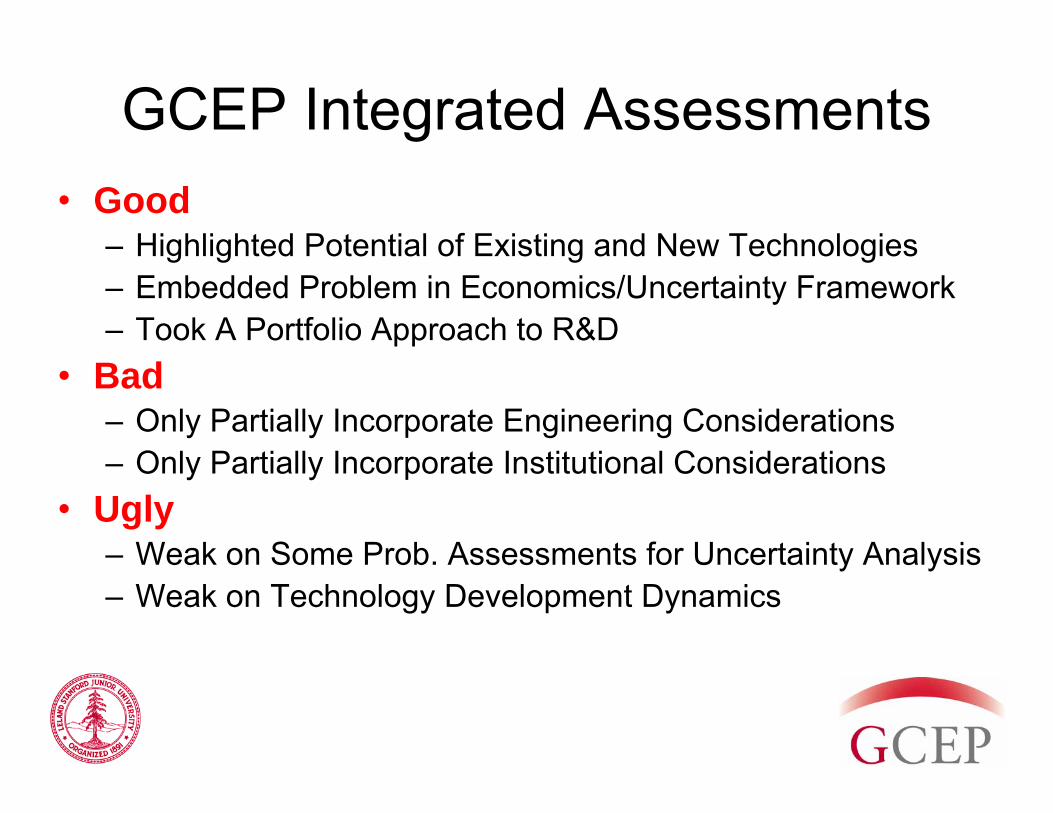
GCEP Integrated Assessments• Good
– Highlighted Potential of Existing and New Technologies– Embedded Problem in Economics/Uncertainty Framework– Took A Portfolio Approach to R&D
• Bad– Only Partially Incorporate Engineering Considerations– Only Partially Incorporate Institutional Considerations
• Ugly– Weak on Some Prob. Assessments for Uncertainty Analysis – Weak on Technology Development Dynamics
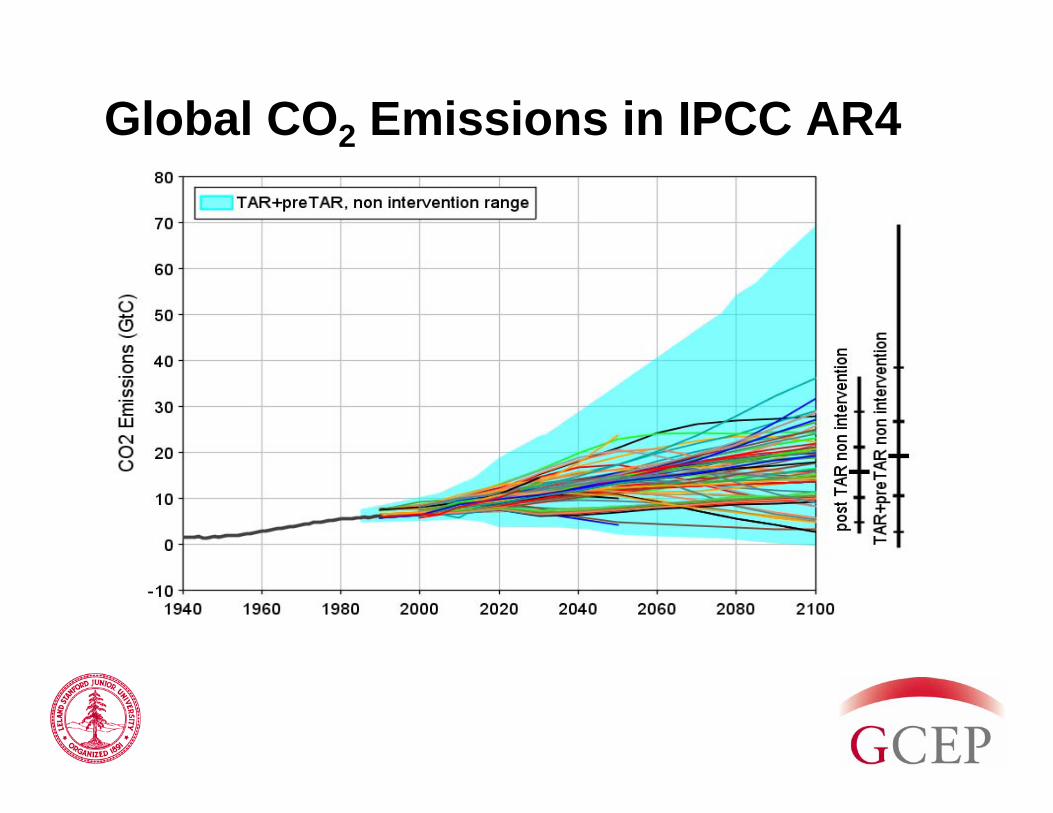
Global CO2 Emissions in IPCC AR4
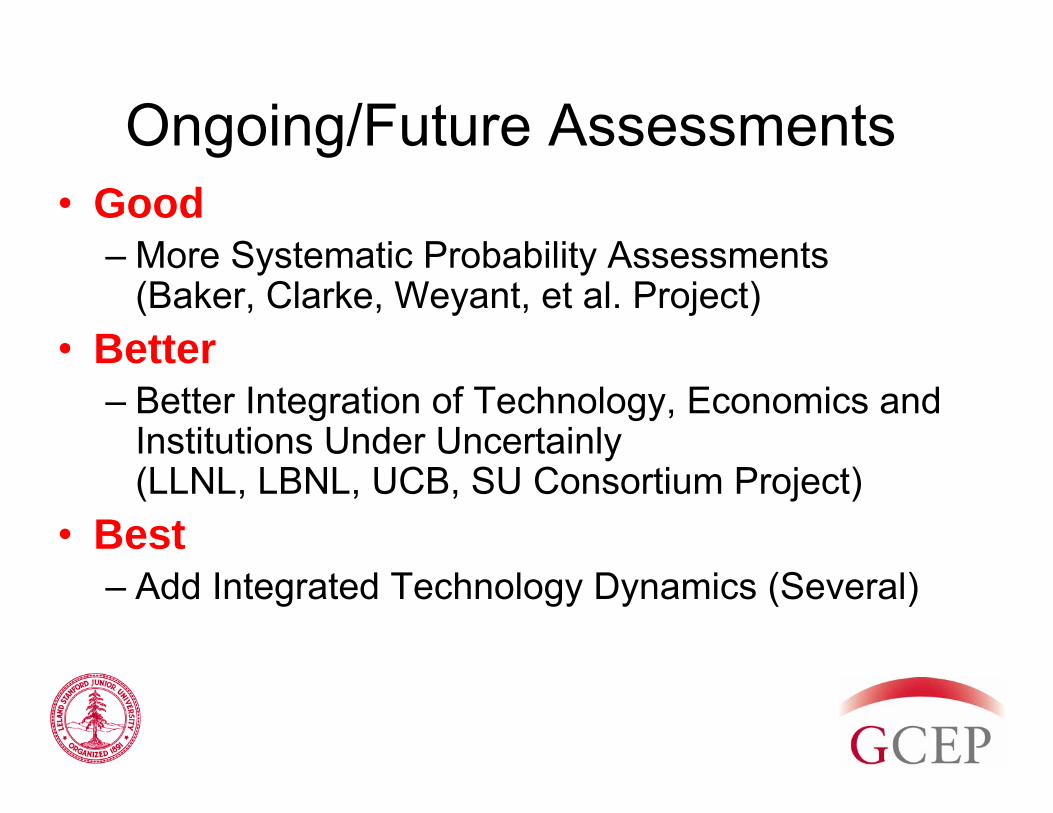
Ongoing/Future Assessments• Good
– More Systematic Probability Assessments (Baker, Clarke, Weyant, et al. Project)
• Better– Better Integration of Technology, Economics and
Institutions Under Uncertainly (LLNL, LBNL, UCB, SU Consortium Project)
• Best– Add Integrated Technology Dynamics (Several)
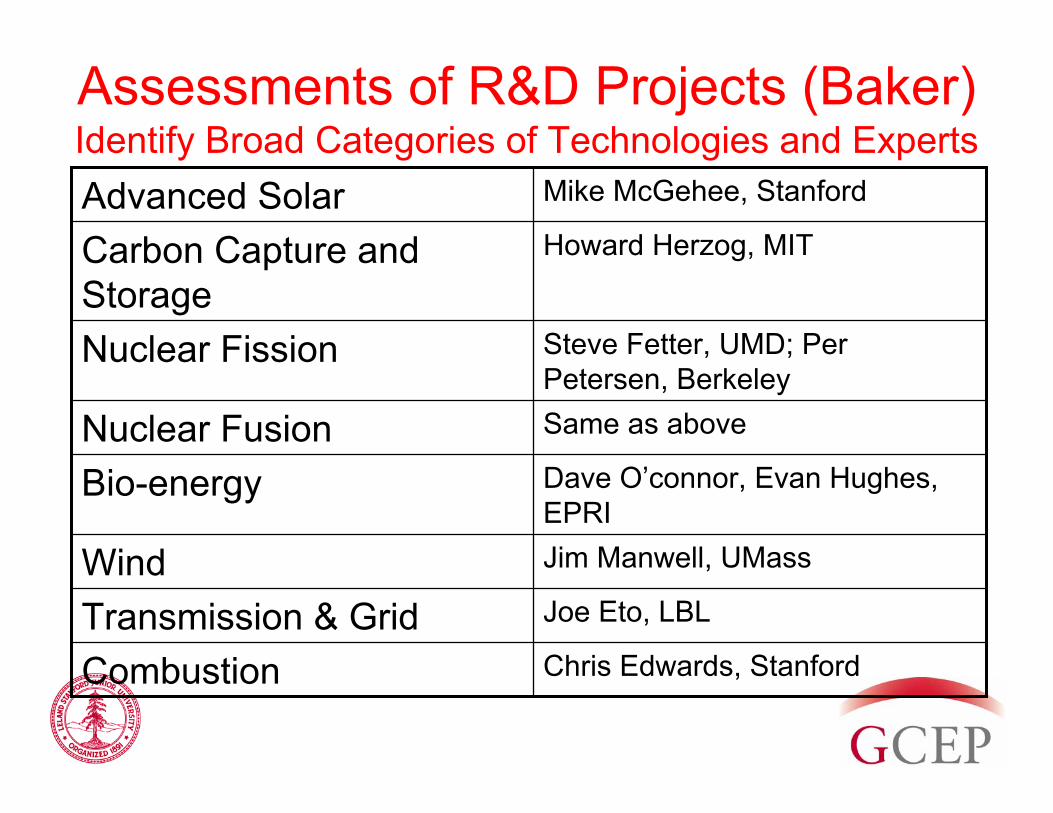
Assessments of R&D Projects (Baker)Identify Broad Categories of Technologies and Experts
Joe Eto, LBLTransmission & Grid
Same as aboveNuclear Fusion
Steve Fetter, UMD; Per Petersen, Berkeley
Nuclear Fission
Howard Herzog, MITCarbon Capture and Storage
Chris Edwards, StanfordCombustion
Jim Manwell, UMassWind
Dave O’connor, Evan Hughes, EPRI
Bio-energy
Mike McGehee, StanfordAdvanced Solar
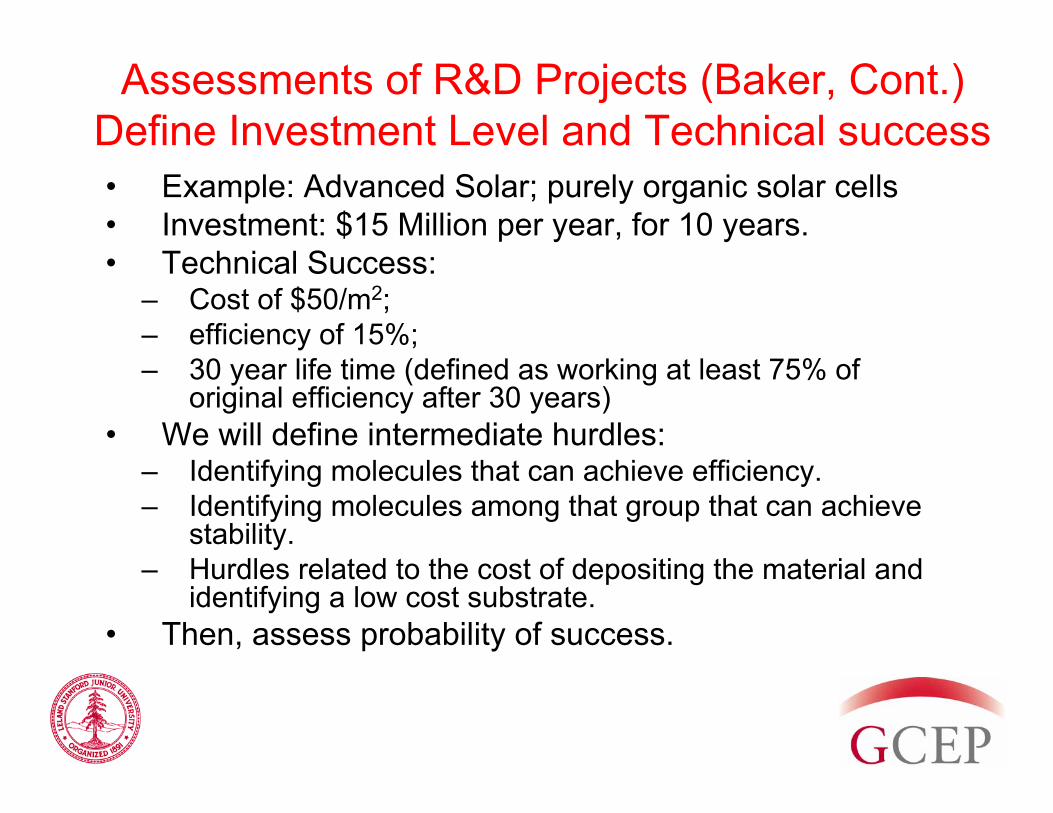
Assessments of R&D Projects (Baker, Cont.)Define Investment Level and Technical success• Example: Advanced Solar; purely organic solar cells• Investment: $15 Million per year, for 10 years.• Technical Success:
– Cost of $50/m2; – efficiency of 15%; – 30 year life time (defined as working at least 75% of
original efficiency after 30 years)• We will define intermediate hurdles:
– Identifying molecules that can achieve efficiency.– Identifying molecules among that group that can achieve
stability.– Hurdles related to the cost of depositing the material and
identifying a low cost substrate.• Then, assess probability of success.
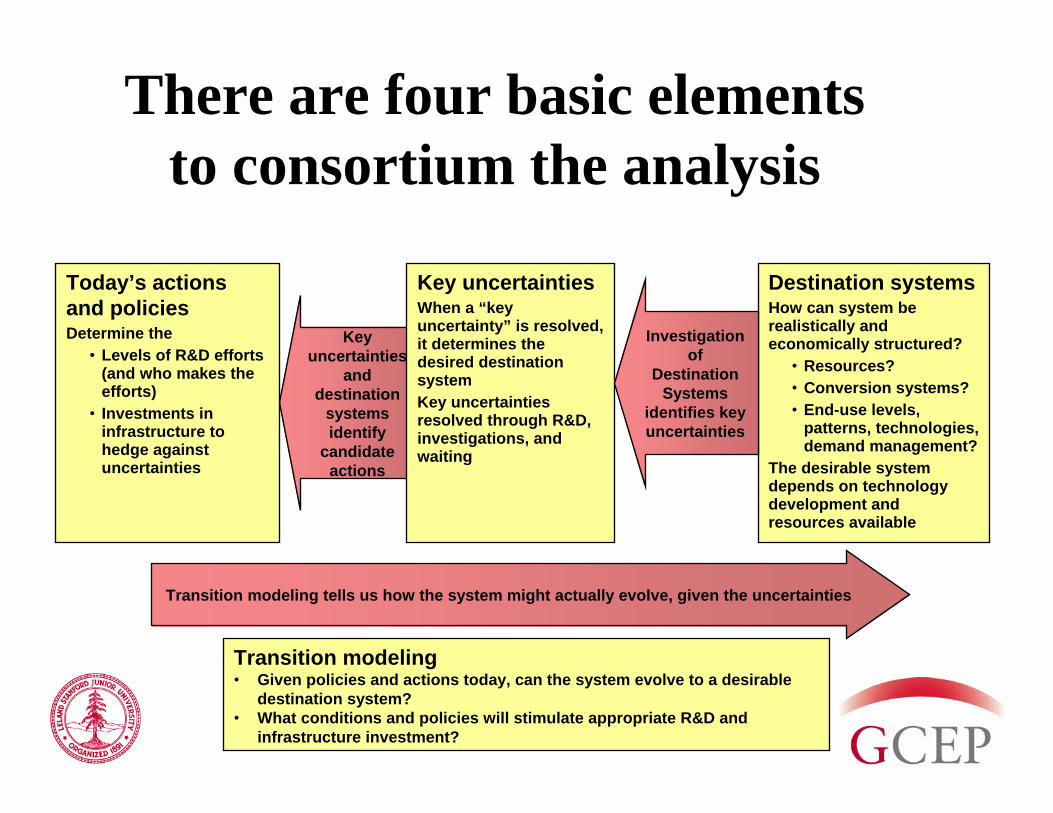
Key uncertainties
and destination
systems identify
candidate actions
Destination systemsHow can system be realistically and economically structured?
• Resources?• Conversion systems?• End-use levels,
patterns, technologies, demand management?
The desirable system depends on technology development and resources available
Key uncertaintiesWhen a “key uncertainty” is resolved, it determines the desired destination systemKey uncertainties resolved through R&D, investigations, and waiting
Today’s actions and policiesDetermine the
• Levels of R&D efforts (and who makes the efforts)
• Investments in infrastructure to hedge against uncertainties
Investigation of
Destination Systems
identifies key uncertainties
Transition modeling tells us how the system might actually evolve, given the uncertainties
Transition modeling• Given policies and actions today, can the system evolve to a desirable
destination system?• What conditions and policies will stimulate appropriate R&D and
infrastructure investment?
There are four basic elements to consortium the analysis
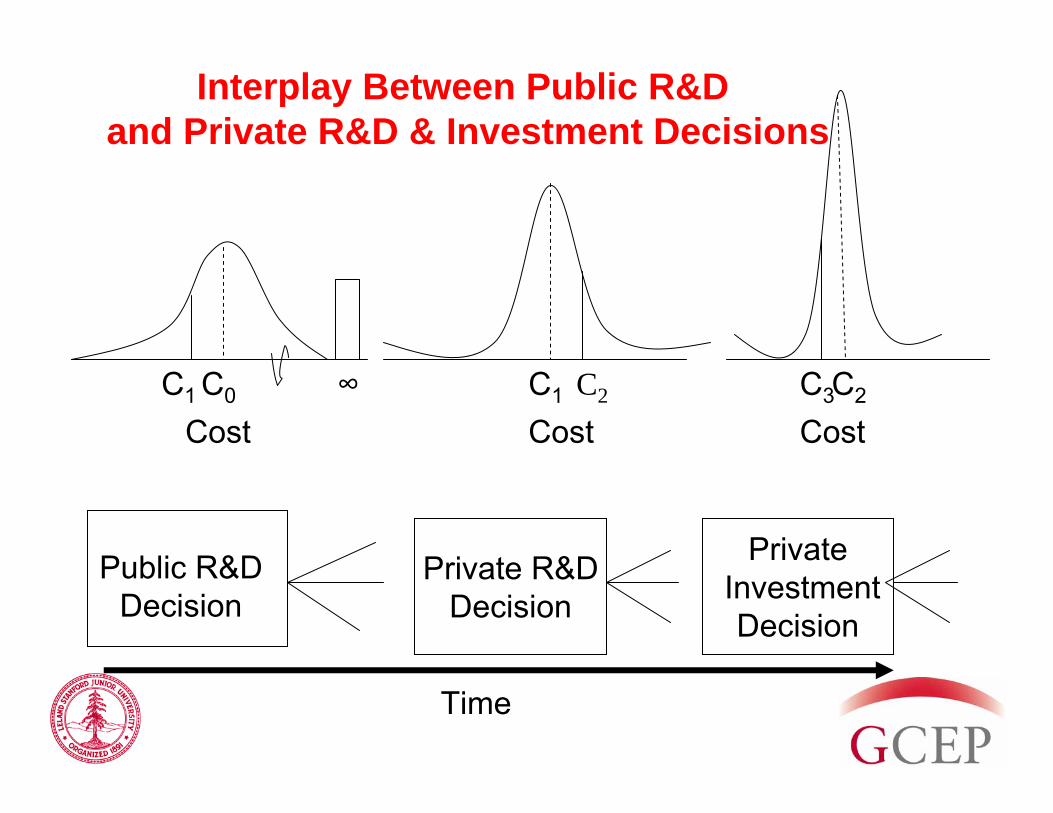
Interplay Between Public R&Dand Private R&D & Investment Decisions
Public R&DDecision
C0
Private R&DDecision
C1C1 C2∞Cost Cost
Time
PrivateInvestmentDecision
C2C3
Cost

Thank You!
The End
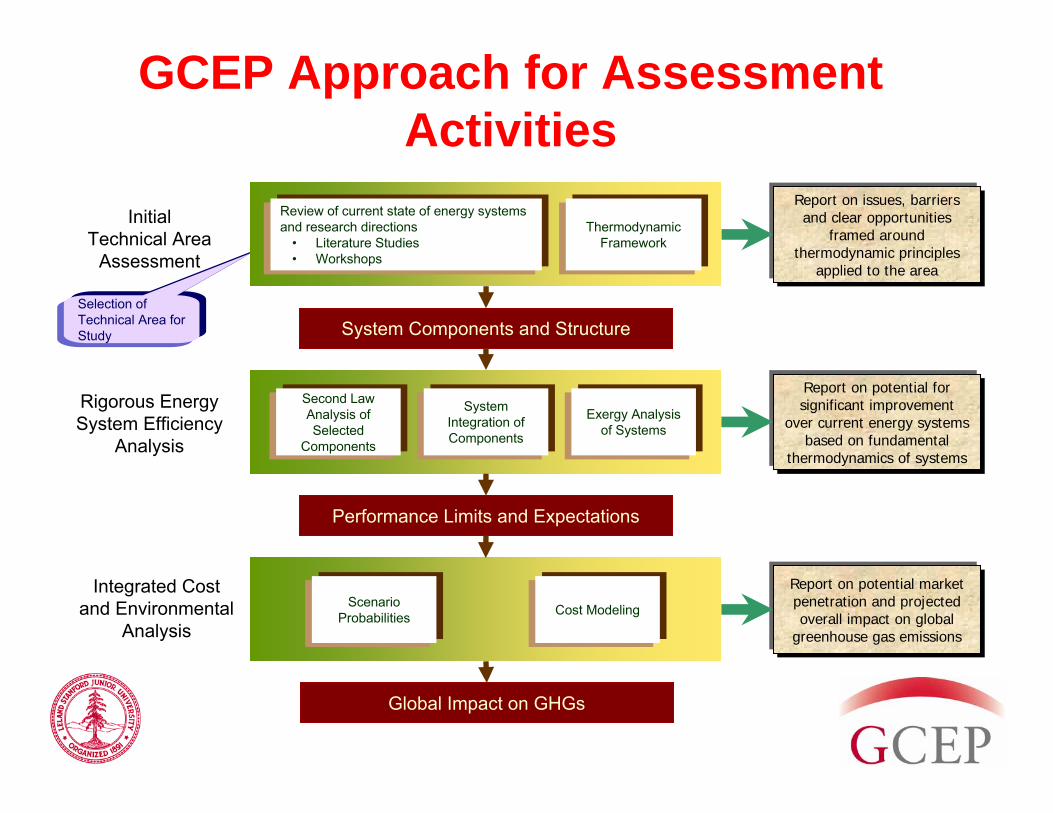
GCEP Approach for Assessment Activities
Initial Technical Area
Assessment
Rigorous Energy System Efficiency
Analysis
Integrated Cost and Environmental
Analysis
Selection of Technical Area for Study
Review of current state of energy systems and research directions
• Literature Studies• Workshops
Thermodynamic Framework
Report on issues, barriers and clear opportunities
framed around thermodynamic principles
applied to the area
Second Law Analysis of Selected
Components
System Integration of Components
Exergy Analysis of Systems
Report on potential for significant improvement
over current energy systems based on fundamental
thermodynamics of systems
System Components and Structure
Performance Limits and Expectations
Report on potential market penetration and projected overall impact on global
greenhouse gas emissions
Scenario Probabilities Cost Modeling
Global Impact on GHGs
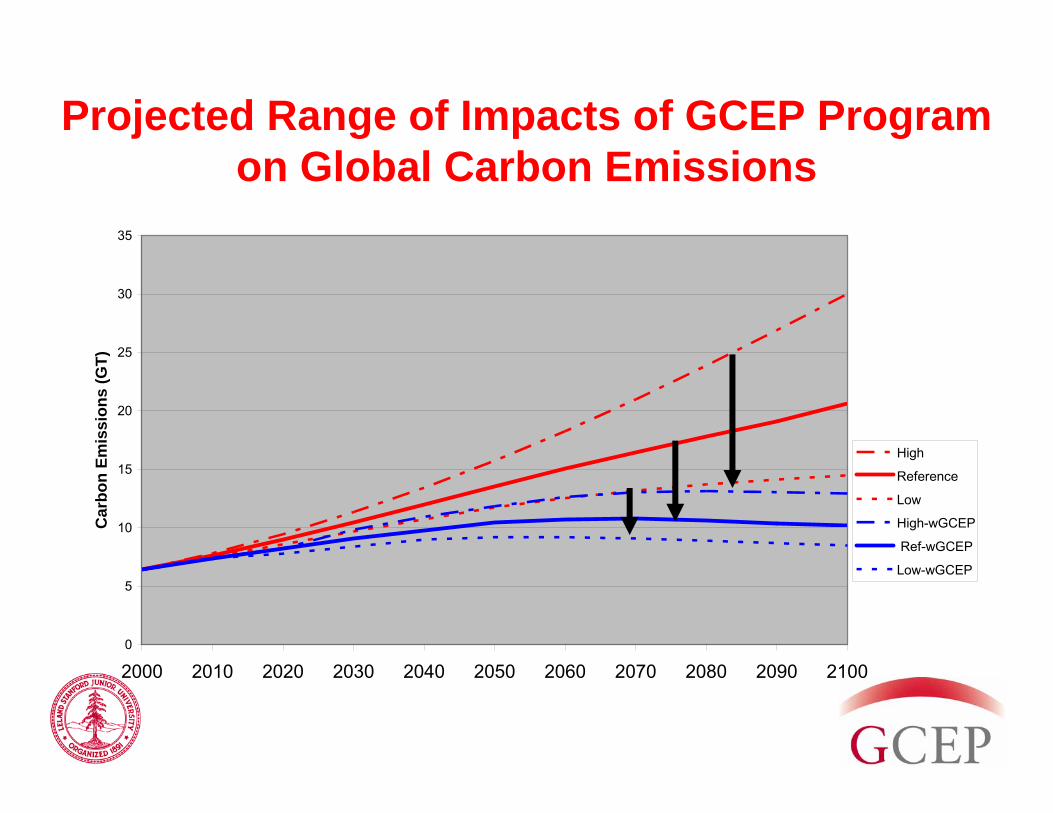
Projected Range of Impacts of GCEP Programon Global Carbon Emissions
0
5
10
15
20
25
30
35
2000 2010 2020 2030 2040 2050 2060 2070 2080 2090 2100
Car
bon
Emis
sion
s (G
T)
High
Reference
Low
High-wGCEP
Ref-wGCEP
Low-wGCEP
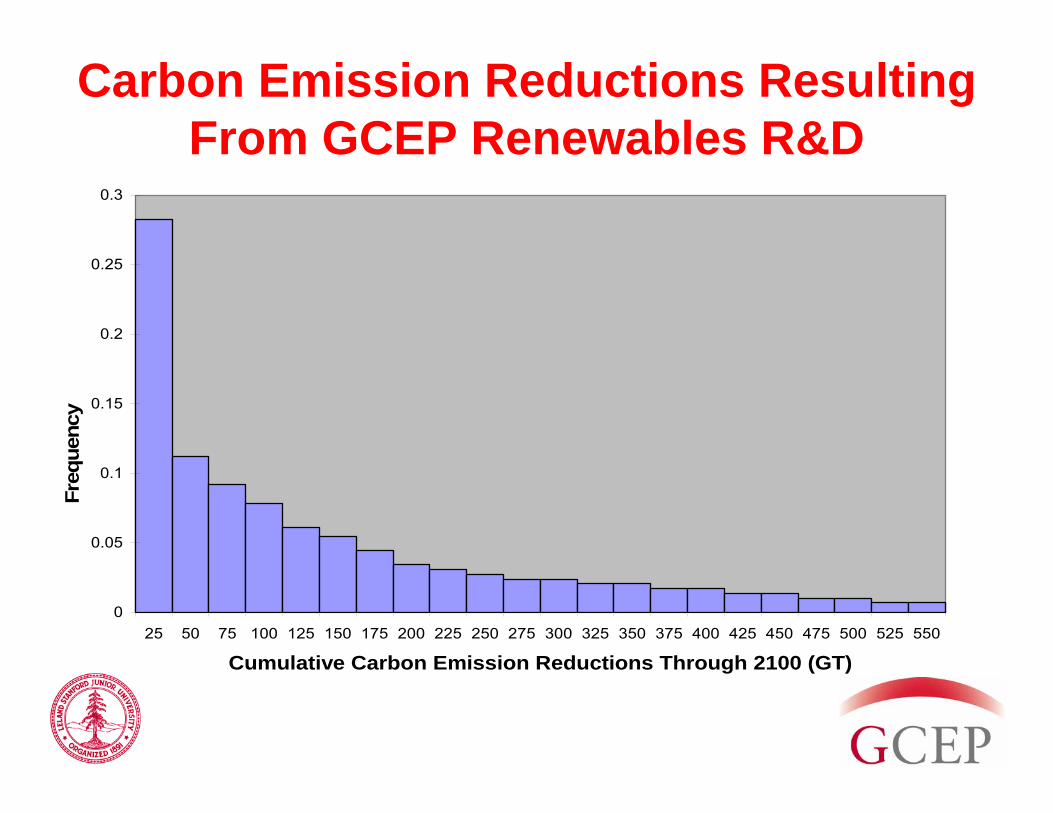
Carbon Emission Reductions Resulting From GCEP Renewables R&D
0
0.05
0.1
0.15
0.2
0.25
0.3
25 50 75 100 125 150 175 200 225 250 275 300 325 350 375 400 425 450 475 500 525 550
Cumulative Carbon Emission Reductions Through 2100 (GT)
Freq
uenc
y
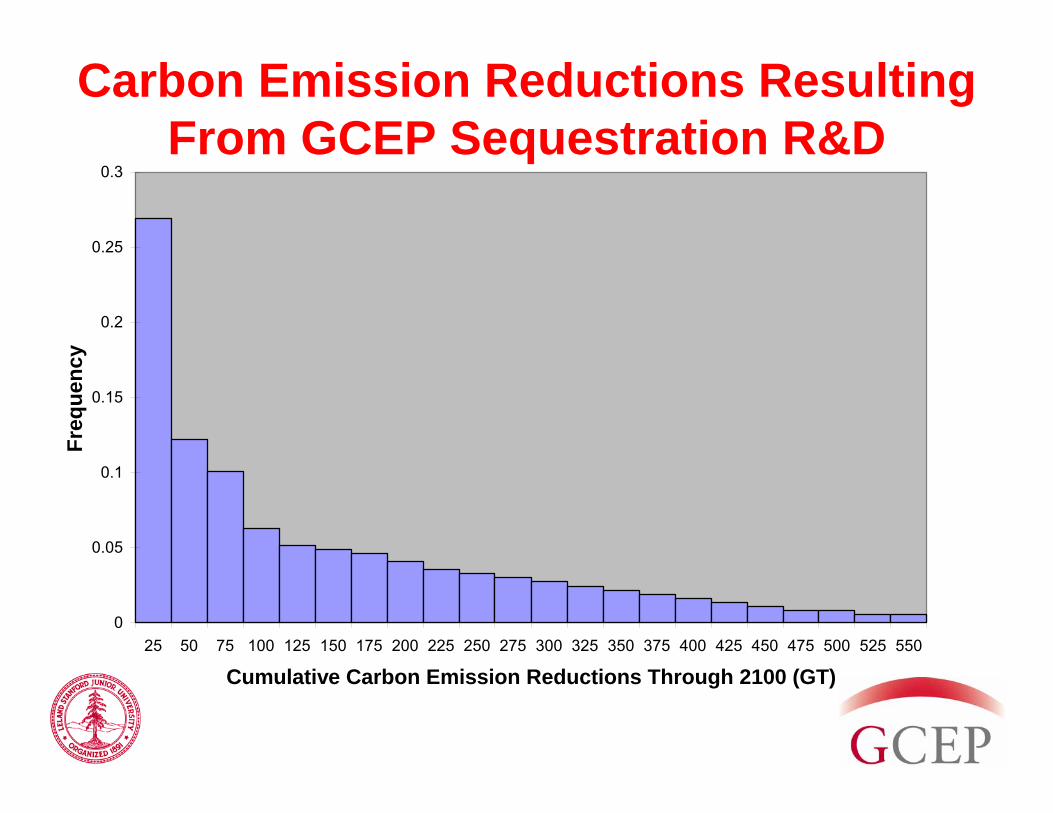
Carbon Emission Reductions Resulting From GCEP Sequestration R&D
0
0.05
0.1
0.15
0.2
0.25
0.3
25 50 75 100 125 150 175 200 225 250 275 300 325 350 375 400 425 450 475 500 525 550
Cumulative Carbon Emission Reductions Through 2100 (GT)
Freq
uenc
y
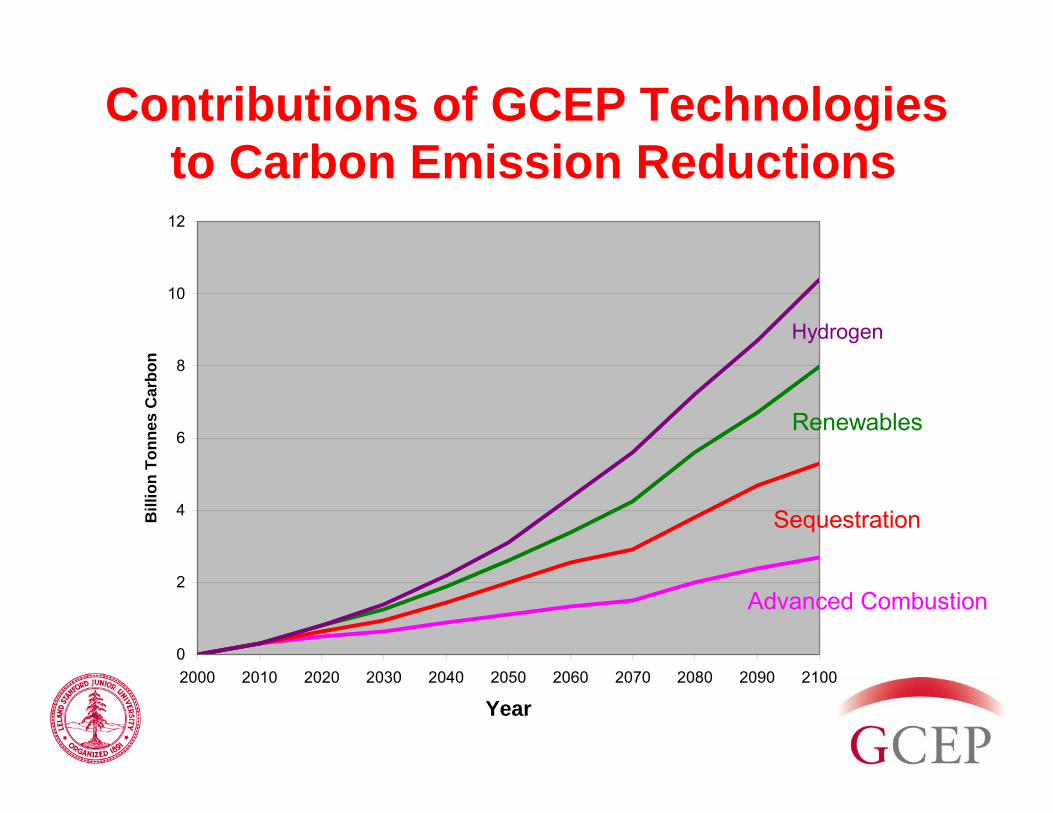
Contributions of GCEP Technologiesto Carbon Emission Reductions
0
2
4
6
8
10
12
2000 2010 2020 2030 2040 2050 2060 2070 2080 2090 2100
Year
Bill
ion
Tonn
es C
arbo
n
Hydrogen
Renewables
Sequestration
Advanced Combustion

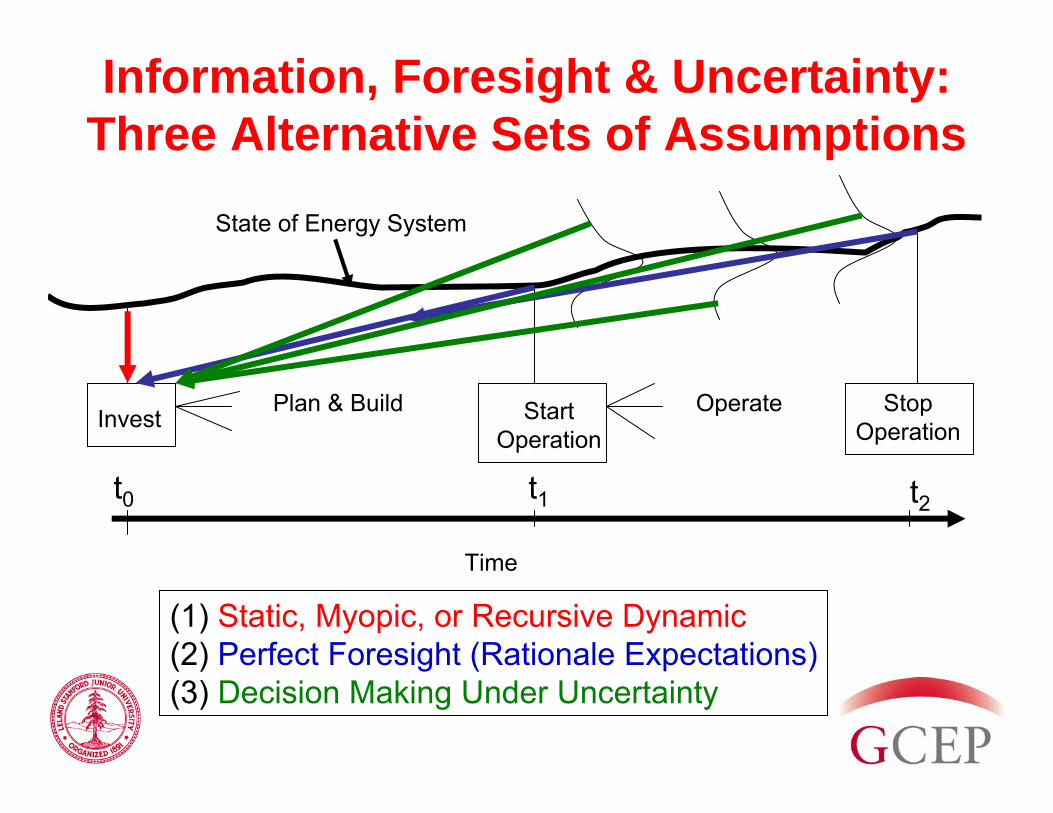
Information, Foresight & Uncertainty:Three Alternative Sets of Assumptions
Invest StartOperation
StopOperation
State of Energy System
Time
Plan & Build Operate
t1 t2t0
(1) Static, Myopic, or Recursive Dynamic(2) Perfect Foresight (Rationale Expectations)(3) Decision Making Under Uncertainty
Information, Foresight & Uncertainty:Three Alternative Sets of Assumptions
Invest StartOperation
StopOperation
State of Energy System
Time
Plan & Build Operate
t1 t2t0
(1) Static, Myopic, or Recursive Dynamic(2) Perfect Foresight (Rationale Expectations)(3) Decision Making Under Uncertainty
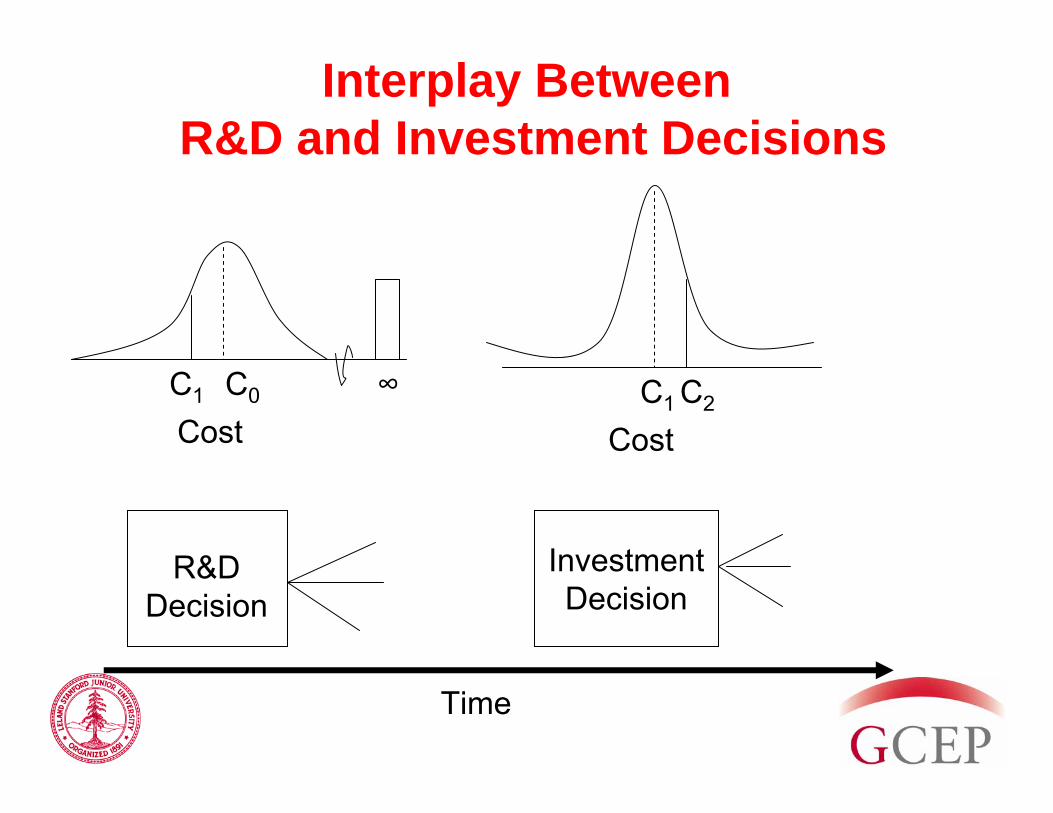
Interplay BetweenR&D and Investment Decisions
R&DDecision
C0
InvestmentDecision
C1C1 C2
∞Cost Cost
Time
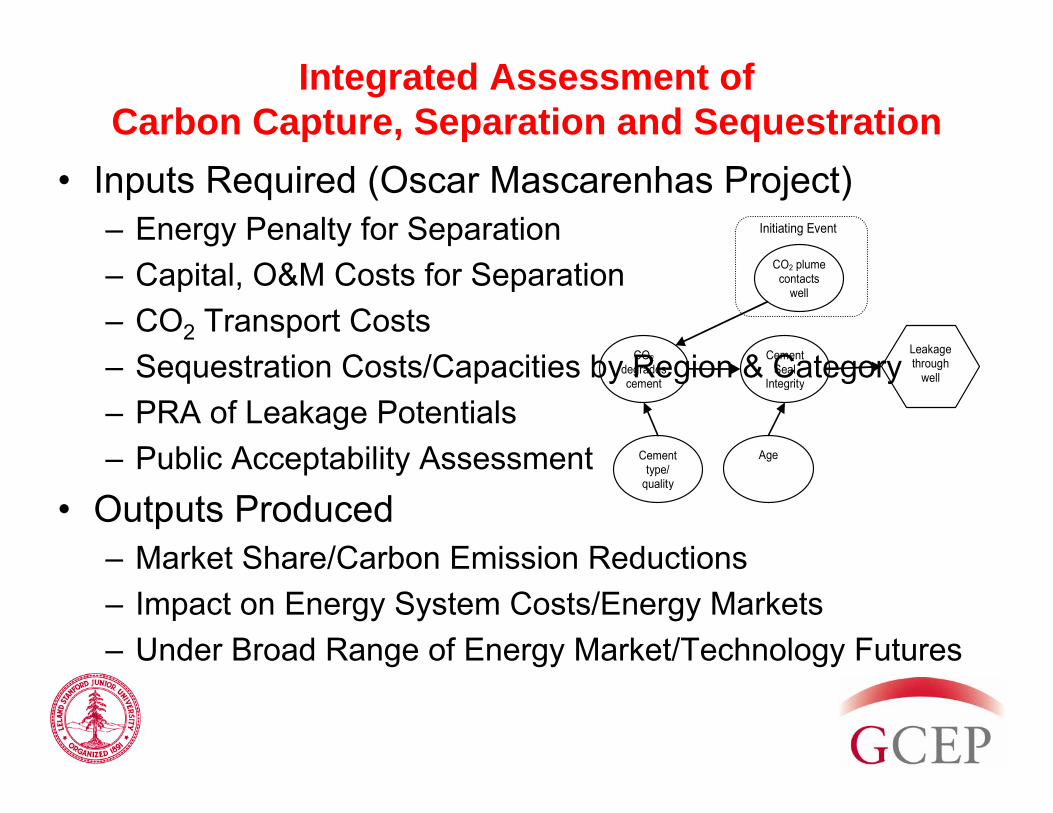
Integrated Assessment ofCarbon Capture, Separation and Sequestration
• Inputs Required (Oscar Mascarenhas Project)– Energy Penalty for Separation– Capital, O&M Costs for Separation– CO2 Transport Costs– Sequestration Costs/Capacities by Region & Category – PRA of Leakage Potentials– Public Acceptability Assessment
• Outputs Produced– Market Share/Carbon Emission Reductions– Impact on Energy System Costs/Energy Markets– Under Broad Range of Energy Market/Technology Futures
Initiating Event
CO2 plume contacts
well
Age
CO2 degrades cement
Cement Seal
Integrity
Cement type/
quality
Leakage through
well
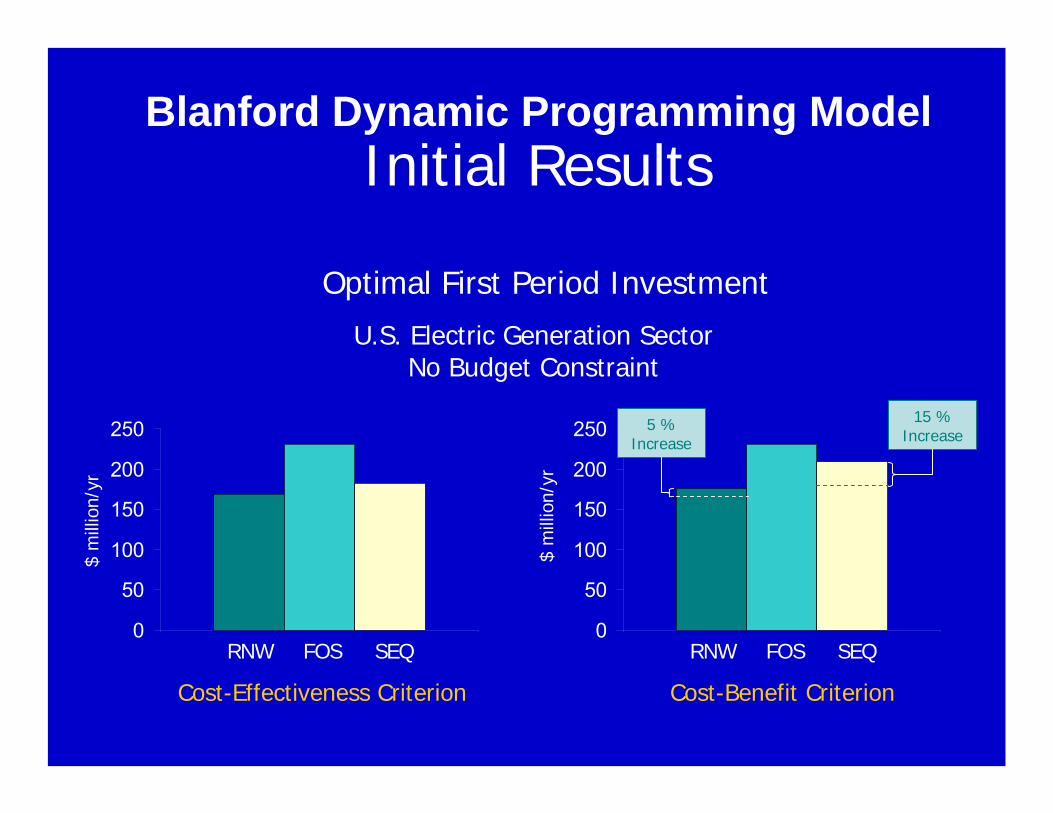
Initial Results
Optimal First Period Investment
RNW FOS SEQ RNW FOS SEQ
$ m
illio
n/yr
$ m
illio
n/yr
U.S. Electric Generation Sector No Budget Constraint
0
50
100
150
200
250
0
50
100
150
200
250
Cost-Benefit CriterionCost-Effectiveness Criterion
5 % Increase
15 % Increase
Blanford Dynamic Programming Model