Embed Size (px)
Citation preview

GOVERNMENT OF INDIA MINISTRY OF WATER RESOURCES
CENTRAL GROUND WATER BOARD
GROUND WATER INFORMATION BOOKLET OF ERNAKULAM DISTRICT KERALA STATE
By
T.S.Anitha Shyam Scientist ‘C’
KERALA REGION BHUJAL BHAVAN KEDARAM, PATTOM PO NH-IV, FARIDABAD TRIVANDRUM – 695 004 HARYANA- 121 001 TEL: 0471-2442175 TEL: 0129-12419075 FAX: 0471-2442191 FAX: 0129-2142524

GROUND WATER INFORMATION BOOKLET OF ERNAKULAM DISTRICT, KERALA STATE
CONTENTS DISTRICT AT A GLANCE 1.0 INTRODUCTION 2.0 RAINFALL AND CLIMATE 3.0 GEOMORPHOLOGY AND SOIL TYPES 4.0 GROUND WATER SCENARIO 5.0 GROUNDWATER MANAGEMENT STRATEGY 6.0 GROUNDWATER RELATED ISSUES & PROBLEMS 7.0 AWARENESS AND TRAINING ACTIVITY 8.0 AREAS NOTIFIED BY CGWA/SGWA 9.0 RECOMMENDATIONS LIST OF FIGURES Figure No. Description 1 Index Map of Ernakulam District, Kerala state. 2 Pre monsoon Depth to Water level map (April, 2006). 3 Post monsoon Depth to Water level map (Nov, 2006). 4 Stage of Groundwater Development – Ernakulam District 5 Hydrogeology of Ernakulam District. 6 Recommended Artificial recharge structures - Ernakulam district.
LIST OF APPENDIX I. Details of wells drilled in Hard rock area, Ernakulam District, Kerala II. Details of wells drilled in Sedimentary area, Ernakulam District, Kerala III. Chemical analysis data of water samples of GWMWS.

DISTRICT AT A GLANCE
Sl No
ITEMS STATISTICS
GENERAL INFORMATION i) Geographical area, sq km 2408.
1.
ii) Administrative Divisions (As on 31-03-2007) Number of Tehsil/Block Number of Panchayat/Villages
Taluks : 6 Blocks : 15 Municipalities : 8 Panchayats : 86
GEOMORPHOLOGY Major physiographic units Coastal Plain , Midland and
High land
2.
Major Drainages Periyar and Muvattupuzha rivers and their tributaries
LAND USE, area in km2 a) Forest area 232.52
3.
b) Net area sown 1996.67 4. MAJOR SOIL TYPES Coastal Alluvium
Riverine alluvium Brown hypdromorphic soil Lateritic soil
5. AREA UNDER PRINCIPAL CROPS, km2
Paddy : 539.88 Coconut : 659.25 Pepper : 58.37 Rubber : 552.78 Other non food Crops :37.00
IRRIGATION BY DIFFERENT SOURCES, Area in km2 Wells 103.34 Tanks 25.32 Canals 215.19 Other Sources 162.14
6.
Net Irrigated area 505.06 7. NUMBER OF GROUNDWATER MONITORING
WELLS OF CGWB (AS ON 31-3-2007) No. of Dug wells No. of Piezometers
49 21

8 PREDOMINANT GEOLOGICAL FORMATIONS Archaean Crystalline formation (Charnockite group& migmatite group), Tertiary sedimentary formation, Sub-Recent laterite and Recent alluvium.
9. HYDROGEOLOGY Major Water bearing formation Depth to water level (Pre-monsoon, 2006) Depth to water level (Post-monsoon, 2006) Long term water level trend in 10 years(1997-2006), m/yr
Weathered, fractured crystalline formations; semi consolidated Tertiary formations, laterites and Recent alluvium. 0.9 to 10.58 mbgl. 0.5 to 10.17 mbgl. No conspicuous change in trend in phreatic aquifers.
GROUND WATER EXPLORATION BY CGWB (As on 31-03-2007)
No. of wells drilled (EW, OW, PZ, SH, Total) EW – 34 OW-3, PZ –21, Total – 58
Depth Range (m) 54 – 295.6 Discharge (litres per minute) 6 – 1320
10.
Transmissivity (m2/day) 4.72 -818 GROUND WATER QUALITY 11. Presence of chemical constituents more than permissible limits
Quality is good. Major chemical constituents lie within the permissible limits..
DYNAMIC GROUNDWATER RESOURCES (2004) – in MCM
Annual Replenishable Ground Water Resources 618.43 Gross Annual Groundwater Draft 293.80 Projected demand for Domestic and Industrial Uses up to 2025
115.54
12.
Stage of Ground Water Development,% 51.8 13. AWARENESS AND TRAINING ACTIVITY
Mass awareness programme organised place Water Management Training Programmes organized Date Place No. of Participants
2002 Ernakulam 2005 Ernakulam 100
GROUND WATER CONTROL AND REGULATION Number of Over Exploited blocks Nil
14.
Number of blocks notified Nil 15. MAJOR GROUND WATER PROBLEMS AND
ISSUES Brackish quality of groundwater along tidal inlets. Anthropogenic pollution.

1.0 INDRODUCTION The district is situated in the northern side of the state, bound by Trichur district on
the north, Idukki on the east, Kottayam and Alappuzha districts on the south and the
Lakshadweep Sea on the west. It has an area of 2408 sq. km. Ernakulam (Cochin) is the
district headquarters. Cochin also known as the Queen of Arabian seas is a major port
city of the west coast of India. The international airport of Cochin at Nedumbassery falls
within the district. All the panchayats of the district are well connected with a good
network of all weathered roads.
For administrative purposes, the district is divided into two revenue divisions and
seven taluks. Muvattupuzha revenue division with Muvattupuzha as its headquarters
comprises of Kunnathunadu, Muvattupuzha and Kothamangalam taluks, while Cochin
division with its headquarters at Cochin consists of Aluva, Paravur, Cochin and
Kanayanur taluks. There are 15 community development blocks, 86 village panchayats
eight municipalities and one corporation in the district. The district has a population of
31,05,798 persons as per 2001 census.
The district is drained by the Periyar and its tributaries on the north and
Muvattupuzha river on the south. Periyar, the longest river in the state originates from the
cardamom hills of the Western Ghats and enters the district at Neriamangalam and near
Bhuthathankettu, it is joined by major tributaries. At Alwaye the river bifurcates into two
branches, which in turn branches into several distributaries before draining into
Lakshadeep Sea.
The Muvattupuzha river is formed by the confluence of Thodupuzha river Kaliyar
and Kothamangalam river at Muvattupuzha. These rivers originate from the Thodupuzha
reserve forest. The Muvattupuzha river takes a rough east-west course up to
Ramamangalam and thereafter it flows towards south leaving the districts south of
Pazhur. In the upstream areas the drainage pattern in both Periyar and Muvattupuzha
basin are trellis to sub-trellis. In the lower reaches dendritic pattern of drainage is
observed.

Previous work
The CGWB has carried out hydrogeological studies and exploration of both
sedimentary and hard rock areas. Exploration for groundwater in the district was taken
up during the FSP 1965 – 66, 74 – 75, 83 – 87, 89 – 90, 98 – 2001 and 02. Systematic
hydrogeological surveys were carried out in different parts of the district by S/Sh.
S.V.N.S Rao (77-78, 82 – 83), GV.V.R.G.S.V. Rao (80 – 81), K.Md. Najeeb (81 – 82, 87
– 88), V. Dhinagaran (95 - 96). Detailed study of the groundwater conditions of the
entire district were carried out by SIDA assisted Coastal Kerala, Ground Water Project
during the period 83 – 88.
Irrigation and cropping pattern
About 83% of the total area of the district is cultivable land and nearly 10% of the
area is under forest cover including reserve forest plantation; and water bodies constitute
5.3% and built up area for dwelling unit etc is nearly 2% of the total area. An area
of 505 sq.km is under irrigation in the district. Periyar valley irrigation project with a
barrage at Bootathankettu which uses the tail race water of Sengulam, Panniyur and
Pallivasasl Hydro-electric projects and Chalakudy diversion project are source for canal
irrigation in the district.
The major crops under irrigation are paddy, coconut, rubber, banana and arecanut.
The gross area under irrigation is higher than the net as more than one crop of paddy is
cultivated under irrigation. The crop wise area under irrigation is presented in Table.1.1
Table 1.1: Crop wise area under irrigation Crop Paddy Cocon
ut
Banana Arecanut Vegetable Spices Other
s
Total
Area,
sq.km
417.25 181.94 812.61 8.88 4.35 8.18 9.15 642.56
(Source: Farm guide 2001)
Coconut is the major single crop in the district followed by paddy and rubber.
Spices and vegetables are also cultivated in the district.

2.0 RAINFALL AND CLIMATE
Ernakulam district has wet monsoon type of climate. The district experiences
heavy rainfall during southwest monsoon season followed by northeast monsoon. During
the other months the rainfall is considerably less. March, April and May months are the
hottest. December to February months are the coldest. The annual rainfall ranges from
3233 to 3456 mm at different places of the district.
The district receive on an average 3359.2 mm (based on 1901-99 data) of rainfall
annually. The district received the maximum rainfall around Neriamangalam area. The
rainfall is less in the western part and increase towards the east. Based on normal annual
rainfall Neriamangalam received around 5883 mm. Cochin in the western part receives
around 3233 mm annually.
Rainfall during South-west monsoon season contributes nearly 67.4% of total
rainfall of the year, followed by the north-east monsoon which contributes nearly 16.6%
and the balance of 16% is received during the month of January to May as summer/pre-
monsoon showers. The mean monthly rainfall distribution for Ernakulam district (2003 to
2006) is given in Table 2.1.
Table 2.1: Mean monthly rainfall distribution for Ernakulam district (2003 to 2006)
Year Jan Feb Mar Apr May Jun Jul Aug Sept Oct Nov Dec Total
2003 0 46 72 144 142 577 551 456 60 415 95 26 2584
2004 9 2 37 65 738 640 377 482 215 539 104 0 3208
2005 52 1 8 240 118 822 873 305 489 284 188 21 3401
2006 13 0 56 45 626 576 569 595 499 466 390 20 3286
The mean monthly maximum temperature ranges from 28.1 to 31.4oC and the
minimum ranges from 23.2 to 26 oC. The maximum temperature occurs during March
and April months and the minimum temperature occurs during December and January
months. The humidity ranges from 68 to 89% during morning hours and 64 to 87%
during evening hours. The maximum humidity is observed during May to October
months.

The wind speed ranges from 6.7 to 10.9 km/hour with mean speed of 9.1 km/hour.
The wind speed is high during the period from March to September. The PET ranges
from 94.5 to 159.2 mm. The maximum PET occurs during March and minimum occurs
during June. The PET is less than the rainfall from May to November indicating water
surplus for recharge into ground water regime.
3.0 GEOMORPHOLOGY AND SOIL
The district can be broadly divided into three physiographical units viz. (1) the
Coastal plains (low lands) (2) the mid lands and (3) the high lands. The general elevation
of the coast is less than 8.0m.amsl and that of the midlands is between 8.0 and 76 m.amsl.
The highlands are having the general elevation above 76 m with the maximum of around
504 m.amsl as in Malayattur Reserve forests. The entire taluks of Kochi and Parur and
major parts of Kanayannur fall under the coastal plain. The municipalities of Paravur and
Tripunithura the township of Kalamasseri and the corporation of Kochi are located in the
coastal plains. All the other taluks except the northeastern parts of Kunnathunad taluk fall
under the mid land area. The only high land belt of the district is the Malayattoor reserve
forest in Koovappady block, which covers about 9% of the area of the district. The
highest point is at Sulu Medu (534 m.amsl.
Pedology
On the basis of morphological features and physico-chemical properties, the soils
of the district are classified as Lateritic, Hydromorphic saline, Brown hydromorphic,
Riverine alluvium and Coastal alluvium.
Lateritic soil is the most predominant soil type of the district. In Muvattupuzha,
Kothamangalam, Kunnathunadu and parts of Aluva taluks lateritic soil is encountered.
These soils are well drained, low in organic matter and plant nutrients. The major crops
grown are coconut, tapioca, rubber, areacanut, pepper, cashew and spices. Small patches
of hydromorphic saline soil are encountered in the coastal tracts of the district in
Kanayannur and Cochin taluk. The tidal backwaters contribute to the salinity of the soil.
Coconut is grown in these soils.

Brown hydromorphic soil is the second most prevalent soil type of the district and
they are encountered in valley bottoms. The soil is enriched in clay content and plant
nutrients. The soil is suited for paddy cultivation.
Riverine alluvium is restricted to the banks of rivers and their tributaries. They
are composed of sandy to clayey loam and are enriched in plant nutrients. It is suited for
a large variety of crops like coconut, paddy arecanut, pepper, vegetables etc. In Cochin
taluk and the western parts of Paravur and Aluva taluk coastal alluvium is encountered
and is composed of sand and clay. Coconut is the major crop in these soils.
4. 0 GROUND WATER SCENARIO
4.1 Hydrogeology
Groundwater generally occurs under phreatic conditions in weathered and
fractured crystalline rocks, laterites and unconsolidated coastal sediments. It occurs under
semi-confined to confined conditions in the deep seated fractured aquifer of the
crystallines rocks and Tertiary sediments. The weathered zone in the crystallines below
acts as good storage for groundwater.
The hydrogeological map of Ernakulam district is shown in Figure 5. Based on
nature of formation, the aquifer can be classified into hard rock aquifers and sedimentary
aquifers.
The hydrogeological map of Ernakulam district is shown in Figure 5. Based on
nature of formation, the aquifer can be classified into hard rock aquifers and sedimentary
aquifers.
Hard Crystalline Formation
Groundwater occurs under phreatic conditions in the shallow weathered
portions whereas it occurs under semi confined to confined condition in the deep-seated
fractures of the crystalline formation. The hard rock formations in general lack primary
porosity. The water is stored in the secondary pores developed as a consequence of
weathering in fractures, fissures and joints etc. The movement of groundwater is
controlled by the extent of the interconnection of the fractures.

In the shallow phreatic zone the depth of dug wells varies from 3.4 to 14.8 mbgl.
The depth to water level in the wells ranges from 1.82 to 12.05 mbgl.
The Central ground water board has drilled nine exploratory wells in the hard
rock areas of the district as a part of its exploration programme to explore the deeper
confined aquifer. The depth of the wells ranged from 131 to 201 mbgl. Most of these
wells were drilled in the Charnockitic area. The details of wells drilled in Hard rock area
of the district is presented in Appendix – I. Fracture zones were encountered at depth
ranging from 5 – 194 mbgl with yield ranging from 1 to 22 lps. The studies by CGWB
have indicated that the wells located at intersections of lineaments are most potential.
Among the lineaments the E-W, NNE – SSW and NE – SW lineaments are potential
whereas the NNW – SSW are least potential lineaments. The deep fractured rock has
transmissivity ranging from 15.64 to 319 m2 /day.
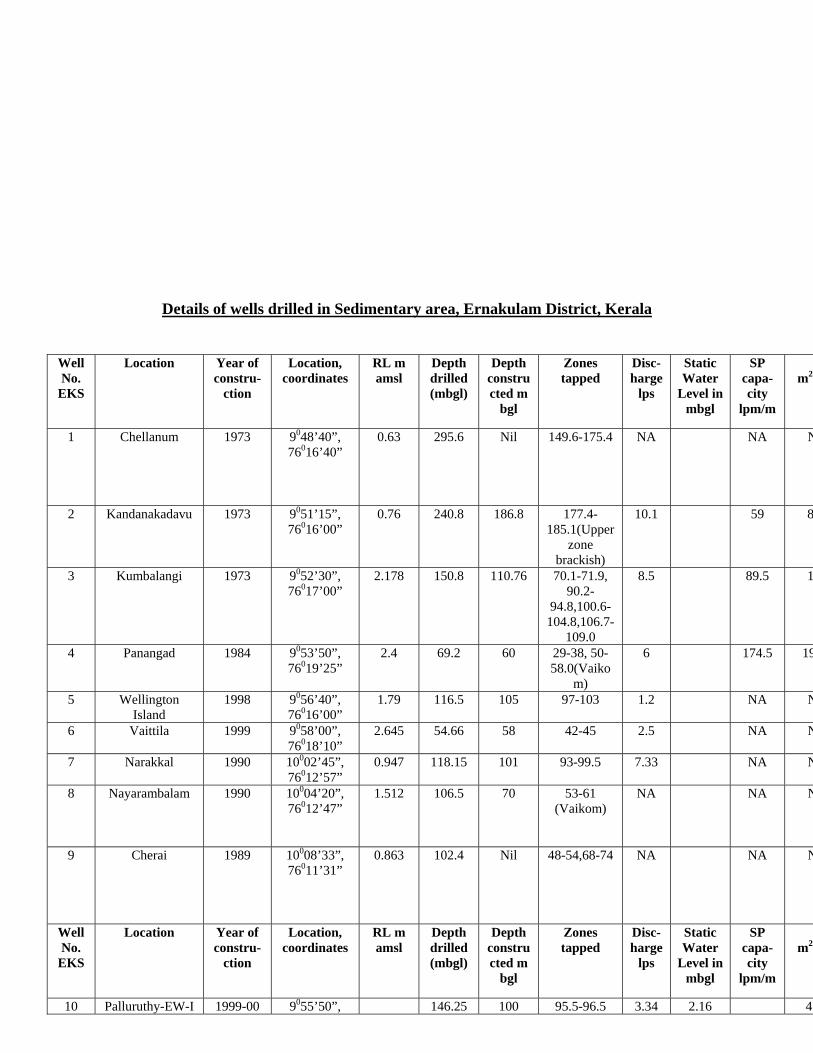
Sedimentary formations
Exploratory drilling was carried out in 25 sites in sedimentary terrain. The depth
of wells drilled ranged from 58 to 296 mbgl. The details of wells drilled in sedimentary
area viz. the zones tapped, discharge, specific capacity, transmissivity and water quality
are presented in Appendix -II . The sedimentary formations are confined to the coastal
belt and the potential aquifers occurring at depth among are the Warkali and Vaikom
beds.
Warkali Beds
The Warkali beds of the Tertiary formation are found to constitute aquifers of
semi-confined to confined aquifers. In Ernakulam district, they are least extensive and
are restricted to the southern coastal belt with thickness thinning out from South to north
from 106.7m at chellanum in south to less than 13 m in north at Panangad. The Warkali
aquifers are essentially composed of fine to medium grained sand. However in the
district the formation water is found to be of brackish nature and not worth to be tapped
except along certain pockets in and around Kumbalangi area. The central ground Water
Board has constructed an exploratory well at Kumbalangi which is tapping the warkalai
aquifer and also the Vaikom aquifer. The total dissolved constituents of the groundwater
are found to be 1379 mg/l.

Vaikom Beds
The Vaikom beds are potential confined aquifers and are generally separated
from the overlying potential Warkali formations by confining Quilon beds except in the
northern portion of the district where the Vaikom beds are underlying the Coastal
alluvium or Laterite. The Vaikom beds are composed of thick sequence of coarse to very
coarse sand, gravel and pebble beds intercalated with ash, grey clay and carbonaceous
clay. They extent North to South in the coastal belt with thickness increasing from 18 m
at Panangad in north to 151 m at Chellanum in south. The wells tapping coarse sand and
gravel aquifers of Vaikom with 6 to 14 m thick granular saturated zones have yield
ranging from 1.2 to 10.1 lps and transmissivity of aquifer ranges from 193.6 to 818
m2/day. Some of the wells were flowing wells at the time of construction.
The beds are coarse grained in nature. The quality of groundwater from these
beds is brackish in nature with EC varying from 4000 to 17,300 µsiemens/cm at 250C. In
small restricted pocket like Narakal, Subash Park, Naval base and Kumbalangi the water
is fresh.
Laterite
The laterite are vastly occurring in the mid land areas of the district by
weathering of the crystalline formation and also at depth in the sedimentary formation in
the coastal belt. Along the coastal belt, they are discontinuous and are found to be eroded
at places and generally they occur as a horizon between the Recent alluvium in top and
Warkali beds or Vaikom beds below at depth ranging from 20 to 56 mbgl.
The laterites are highly porous and permeable. It is extensively developed by
dug wells in the mid land area for domestic and to a limited extent for irrigation. The
depth of wells in laterite ranges from 3.4 to 14.8 mbgl and depth to water level ranges
from 1.55 to 11.06 mbgl. Wells located on slopes and elevated areas go dry or have very
small water column during summer season. The yield of well ranges from 0.5 to 6
m3/day and sustain pumping for 3 to 4 hrs a day.
Alluvial Formations
The alluvial formations occurring in the coastal belt are constituted by sand,
silt, clay of the lagoonal and back water deposits, beach deposits and the river/flood
plain deposits in mid land areas. The thickness ranges from less than 1m to 54 m at

Kandakadavu in south. It forms potential phreatic aquifer extensively developed by dug
wells and filter point wells. They are tapped to meet domestic and other needs. The dug
wells range in depth from 2.14 to 13 m in general and depth to water level range from
0.35 to 7.03 mbgl. The dug wells have an average yield ranging from 15 to 20 m3/day.
Filter point wells are common wherever the average saturated thickness of
alluvial sand exceeds 5 m and have depth ranging from 5 to 15 mbgl. They have yield
ranging from 12 to 18 m3/day.
Water levels
The Central Ground Water Board is maintaining a total of 70 NHS in Ernakulam
district. Of these 49 are dug wells and 21 are piezometers. They are monitored 4 times a
year i.e., during January, April, August and November. Water samples are collected
annually during April (pre monsoon) for analysis and analysed for major elements and
other parameters.
Depth to water level
The depth to water level in the district shows wide variation on account of the
physiographical units in which the wells are located and undulating terrain in the mid
land. Water level is shallower in western coastal part and is less than 2 mbgl in general
although occasionally it is deeper at around 4 to 4.5 mbgl except for a small pocket in and
around Chengamanad where it is more than 11 m.bgl. Fig. 2 and 3 shows the depth to
water table of Ernakulam district for pre monsoon (April 2006) and Post monsoon
(November 2006). In the eastern part of the district also it is observed that the water level
is shallow and is following the riverine alluvial belt of Periyar river. In the midland
region the water table is between 5 and 10 mbgl and at isolated pockets and is found to be
deeper levels of more than 10 m depth.
Compared to the pre monsoon period, in the post monsoon period (November
2006) the water level has risen in general. In the coastal belt, the water level is very
shallow and less than 2 mbgl through out. Besides in most areas of the districts the water
level has risen and is at depth of less than 5 mbgl. However in the isolated pockets in the
northwestern segment of the district it is deeper than 10 m.
Long term trend analysis in water level
The long term behaviour of water level in dug wells is mainly controlled by
the rainfall recharge received and also the return seepage due to canal flow and irrigation.
The pre-monsoon water level trend reflect the trend of groundwater
development, the post monsoon water level trend brings out the actual rise or fall in the
area. Around 12 hydrograph stations consisting of either dug wells or piezometers were
selected for the long term trend of water level. These wells are N. Parur, Elur North,
Mulamthuruthy, Ramamangalam, Veliyanad, Mulamthuruthy, Ramamangalam,
Kuttatukulam, N. Palakuzha (Pz), Chellanum and Puthotta. Analysis of the hydrographs
show that some are showing rising trend of water level while some other are showing
declining trends. Among the wells, those located in the coastal belt are having water level
at shallow depth of 2 or less than that and out of North Parur, Elur north are showing
rising trends while Chellanam, Puthotta, Fort Cochin are showing declining trends.
The other stations are in the mid land areas have deeper water levels. The
Kodusery piezometer and Veliyanad piezometer are showing rising trend and wells at
Mulamthuruthi, Ramamangalam, Kuttatukulam and North Palakuzha piezometer are
showing declining trends. The hydrograph of Chalakka well is showing neither rise nor
fall in water level.
4.2 GROUND WATER RESOURCES
Ground water Recharge
Rainfall is the major source of recharge to ground water in the district. The
average annual rainfall of the districts is about 3400 mm of which 84% is received during
the two monsoons. On average there are about 133 rainy days a year. The potential
evapotranspiration is less than the average rainfall for eight months a year from April to
November. Thus water surplus is available during these period for effecting recharge into
ground water.
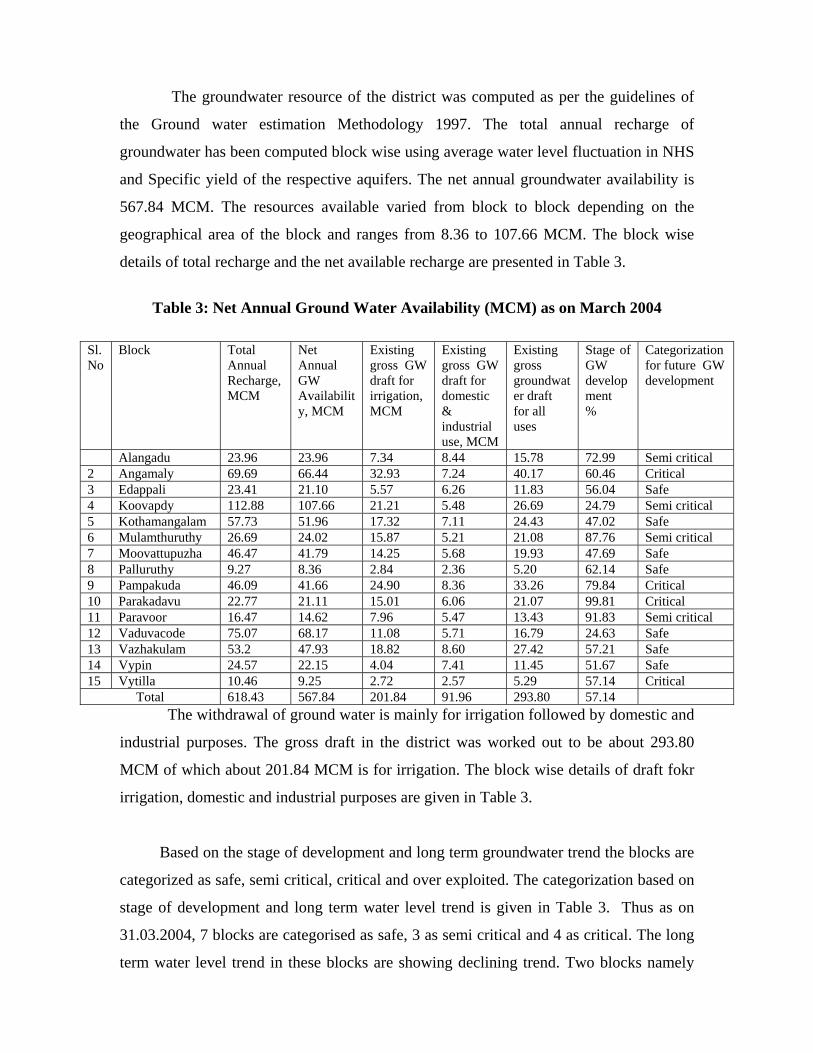
The groundwater resource of the district was computed as per the guidelines of
the Ground water estimation Methodology 1997. The total annual recharge of
groundwater has been computed block wise using average water level fluctuation in NHS
and Specific yield of the respective aquifers. The net annual groundwater availability is
567.84 MCM. The resources available varied from block to block depending on the
geographical area of the block and ranges from 8.36 to 107.66 MCM. The block wise
details of total recharge and the net available recharge are presented in Table 3.
Table 3: Net Annual Ground Water Availability (MCM) as on March 2004
The withdrawal of ground water is mainly for irrigation followed by domestic and
industrial purposes. The gross draft in the district was worked out to be about 293.80
MCM of which about 201.84 MCM is for irrigation. The block wise details of draft fokr
irrigation, domestic and industrial purposes are given in Table 3.
Sl. No
Block Total Annual Recharge, MCM
Net Annual GW Availability, MCM
Existing gross GW draft for irrigation, MCM
Existing gross GW draft for domestic & industrial use, MCM
Existing gross groundwater draft for all uses
Stage of GW development %
Categorization for future GW development
Alangadu 23.96 23.96 7.34 8.44 15.78 72.99 Semi critical 2 Angamaly 69.69 66.44 32.93 7.24 40.17 60.46 Critical 3 Edappali 23.41 21.10 5.57 6.26 11.83 56.04 Safe 4 Koovapdy 112.88 107.66 21.21 5.48 26.69 24.79 Semi critical 5 Kothamangalam 57.73 51.96 17.32 7.11 24.43 47.02 Safe 6 Mulamthuruthy 26.69 24.02 15.87 5.21 21.08 87.76 Semi critical 7 Moovattupuzha 46.47 41.79 14.25 5.68 19.93 47.69 Safe 8 Palluruthy 9.27 8.36 2.84 2.36 5.20 62.14 Safe 9 Pampakuda 46.09 41.66 24.90 8.36 33.26 79.84 Critical 10 Parakadavu 22.77 21.11 15.01 6.06 21.07 99.81 Critical 11 Paravoor 16.47 14.62 7.96 5.47 13.43 91.83 Semi critical 12 Vaduvacode 75.07 68.17 11.08 5.71 16.79 24.63 Safe 13 Vazhakulam 53.2 47.93 18.82 8.60 27.42 57.21 Safe 14 Vypin 24.57 22.15 4.04 7.41 11.45 51.67 Safe 15 Vytilla 10.46 9.25 2.72 2.57 5.29 57.14 Critical
Total 618.43 567.84 201.84 91.96 293.80 57.14
Based on the stage of development and long term groundwater trend the blocks are
categorized as safe, semi critical, critical and over exploited. The categorization based on
stage of development and long term water level trend is given in Table 3. Thus as on
31.03.2004, 7 blocks are categorised as safe, 3 as semi critical and 4 as critical. The long
term water level trend in these blocks are showing declining trend. Two blocks namely

Koovapady and Vytilla are showing significant declining trend in water level due to
which they were classified as semi-critical and critical.
4.3 Ground water Quality
Shallow aquifer
The ground water quality of the shallow aquifers of the district is generally very
good. Samples collected during April 2006 from the groundwater monitoring stations are
analysed. The range of chemical constituents (Major ions) is summarised in Table 4.
Results of analysis is given in appendix – III.
Table 4: The range of chemical constituents
Range in concentration Chemical constituentMinimum Maximum
EC, µ siemens / cm At 250C
27 9370
Total hardness, mg/l as Ca CO3
4 1075
Ca, mg/l 1.6 144 Mg, mg/l trace 174 Cl, mg/ 5.7 3138 F, mg/l 0 0.47
The data indicates that the ground water in the phreatic aquifers of the area is
very low in mineralisation and is fit for all domestic, industrial and agricultural purposes
in general.
On the basis of USSL classification of groundwater, water samples from the
study area have been classified into Good, Marginally saline and Saline. Majority of the
samples (97.8 %) falls in the category of Good water. Marginally saline water is absent in
the study area while the groundwater sample collected from Chellanum is found to be
saline.
Groundwater quality in deeper aquifers
In general the quality in deeper aquifers is good in most of the hard rock areas of
the district. The exploratory drilling data has revealed the quality to be good. However, it
has also revealed the presence of inland salinity in some areas namely Deshom and Sree
moolanagaram where the EC is found to be very high of the order of more than 17,000
micro siemens/cm at 250C.

In the coastal sedimentary aquifers, the quality of the water of Vaikom aquifers is
saline in most part of the district except for small pockets like Narakal and Kumbalangi
where it is fresh. The EC is found to range between 4000 micro siemens/cm to 17,300
micro siemens/cm at 250C. The Warkalai aquifer is completely saline in the district.
Table 5: The range of chemical constituents
Range in concentration Chemical constituentMinimum Maximum
EC, µ siemens / cm At 250C
27 9370
TDS Cl, mg/ 5.7 3138 F, mg/l 0 0.47
5.0 GROUND WATER DEVELOPMENT AND MANAGEMENT Ground water Development
In the district groundwater is developed for irrigation mainly by marginal farmers
from wells used for both domestic and irrigation. The crops irrigated are chiefly coconut,
plantain and vegetables. Groundwater is also developed for water supply schemes in rural
areas by and to a limited extent in urban areas.
Though groundwater development for the district is observed to be only about 52
%, the groundwater development for four blocks viz. Parakadavu, Parur, Pampakuda and
Mulanthuruthy are having a higher stage of development of above 75%. Besides the
above, some blocks like Alangadu, Angamali, Koovapaddi and Vytilla whose stage of
development is even though at lesser rate, the water level are showing declining trend.
Hence in these blocks, further development of ground water should be done with caution
and suitable conservation methods are to be resorted.
In crystalline aquifers dug wells can be constructed wherever sufficient weathered
thickness of the saturated zone is available. Existing low yielding wells can be revitalized
by deepening such wells to tap the entire thickness of weathered zone. Dug wells located
along lineaments and fracture directions can be revitalized by converting them into dug
cum bore wells. Bore-wells are feasible in crystalline areas tapping deep fractures and are
site specific.
Tube wells are feasible in coastal belt in freshwater pockets of Vaikom aquifer.
Tube wells may be constructed tapping 15 to 20 m of aquifer material with slot size of
3.1 mm and gravel pack. In the Laterite terrain dug wells and dug cum bore wells are
feasible with depth of 10 to 16 m and diameter of 2 to 4 m and in the valley areas dug
wells of 6 to 8 m depth and 1.5 to 3.0 m diameter are feasible.
In the coastal alluvium dug-wells with depth of 4 to 7 m and diameter 1.5 to 2.0 m
and filter point wells wherever saturated thickness of 5 m or more are feasible
6.0 GROUND WATER RELATED ISSUES AND PROBLEMS
Vulnerable areas
Even though the district is receiving very good rainfall of about 3400 mm
annually it is paradoxical that acute water scarcity is felt in certain areas. The Vypin
Island along the coastal parts of the district is one such area where the water scarcity is
very acute during summer months. The vypin block with an area of km is highly
populated with total population of 197624 persons. Similar water scarcity is recorded all
along the coastal parts of the district down to Chellanam. The major problem here is the
limited top sand layer and at places its hydraulic continuity with tidal backwater
rendering it saline during summer months. In the southern parts of the district, in the top
layer sand, the quality is brackish. In these areas, rainwater harvesting with modification
of the aquifer will help to improve the aquifer condition and its water quality.
In the midland areas of the district as in Mulanthuruthy, Pampakuda,
Kothamangalam blocks, the dug wells dry up in summer, as the zone of weathering is
very limited and the topography is sloping. In these areas to check the subsurface out
flow of ground water, subsurface dams can be constructed to improve the recharge of
water.
Other problems
The district being the industrial capital, the problems related to industry was
studied. It is observed that the pollution due to industrial effluents is not on an alarming
scale. It is mainly restricted to surface water. The pollution studies conducted by CGWB
indicate that the ground water pollution is highly localized with in 80m of the dumpage
of industrial waste.

Water Conservation and Artificial recharge
The district is having ideal site for implementing ground water conservation
structures and rainwater harvesting structures. The subsurface dam constructed at
Odakkali in the premises of Aromatic and Medicinal Plant Research Station of the Kerala
Agricultural University has improved the ground water conditions of the area and it
ensures sustain water for irrigation for the farm area of the university. The structure was
constructed during 1988 with a cost of Rs. 1.67 lakhs. The length of the dam is 80 m and
the depth is about 6m.
Similar structures can be constructed along the narrow valleys of the district.
In addition to this, gully plugging and check dams will also be of great use in improving
the groundwater resources of the district. In the coastal area, roof top rainwater
harvesting is to be given a thrust. The artificial recharge schemes recommended for
different blocks are given in Fig.6.
7.0 AWARENESS AND TRAINING ACTIVITY
The central ground water board has carried out mass awareness programme and
water management training programmes in the district. Mass awareness programme was
conducted in Ernakulam district during the year 2002 at Ernakulam. Water management
training programme was conducted in Ernakulam district during the year 2005 at
Ernakulam.

8.0 AREAS NOTIFIED BY CGWA/SGWA
In the district no blocks are over-exploited and therefore there are no areas
notified.
9.0 RECOMMENDATIONS
The stage of ground water development in the district is 57.14 % leaving scope
for future development of ground water in the district except in the critical blocks and
semi-critical blocks where groundwater development may be on a cautious scale.
In the coastal blocks of the district particularly the Vypin Island where acute
water scarcity is felt during summer months, rain water harvesting techniques can be
carried out to solve the water problem. Tube wells are feasible in the coastal blocks
where fresh water pockets have been demarcated in the deeper confined aquifer such as at
Narakal and Kumbalangi. Tube wells may be constructed tapping 15 to 20m thickness
aquifer with slot size of 3.1 mm and gravel pack.
The mid land areas are covered by Laterite formations and the ground water can
be developed in these areas by dug wells and dug cum bore wells. The dug wells located
in elevated areas/slope tend to dry up in summer. The porous nature of laterite tends to
this. These areas can be developed by construction of large diameter dug wells in the
valleys and dug cum bore wells in elevated areas. The sub surface dam constructed at
Odakalli, in the premises of Aromatic and Medicinal plant Research station of KAV has
improved the ground water conditions of area and sustain water for irrigation. In
Mulanthuruthy, Pampakada and Kothamangalam blocks sub surface dams can be
constructed in suitable locations for artificial recharge and improve the recharge.
In the eastern blocks with elevated hills and narrow valleys, gully plugging and
contour bunding, check dam etc can be practiced to improve the recharge condition.
The ground water development may be done on water shed basis for better water
management also in conjunctive with surface water management. Mass Awareness
Programme can be organized to make the public aware of the importance of adopting
water conservation techniques.


Appendix – I
Details of wells drilled in Hard rock area, Ernakulam District, Kerala
Well No.
EKH
Location, coordinates
& toposheet
No.
Lineament Direction
Depth drilled/ SWL mbgl
Depth of
casing mbgl
Fracture zones
with yield lpm
Discharge lpm during
drilling recommended
T m2/day
EC micromhom
s/cm at 250C
1 Ilanji, 9049’45”, 76032’30”,
58 C/9
NW-SE 200.53, 0.8
6.6 27- 35.0/260. 111.0 – 114/456
456, 906
319 290
2 Kozhipalli, 9052’15”, 76036’50”,
58 C/9
NW-SE 187.79, 2.12
4.25 12.03/260,65/490,
145.0/610
600, 1158
35.9 9.8*10-4
290
3 Onakkur, 9053’30”, 76031’00”,
58 C/9
Nil 20.53, 2.95
9.10 Nil Nil NA NA
4 Kadalikad, 9055’20”, 76040’45”,
58 C/9
NE-SW 200.53, 1.20
6.46 15.6/180, 38/240, 95/600
600, 1002
69.3, 2.8*10-2
260
Details of wells drilled in Sedimentary area, Ernakulam District, Kerala
Well No.
EKS
Location Year of constru-
ction
Location, coordinates
RL m amsl
Depth drilled (mbgl)
Depth constructed m
bgl
Zones tapped
Disc-harge
lps
Static Water
Level in mbgl
SP capa-city
lpm/m
Tm2/
1 Chellanum 1973 9048’40”, 76016’40”
0.63 295.6 Nil 149.6-175.4 NA NA N
2 Kandanakadavu 1973 9051’15”, 76016’00”
0.76 240.8 186.8 177.4-185.1(Upper
zone brackish)
10.1 59 8
3 Kumbalangi 1973 9052’30”, 76017’00”
2.178 150.8 110.76 70.1-71.9, 90.2-
94.8,100.6-104.8,106.7-
109.0
8.5 89.5 1
4 Panangad 1984 9053’50”, 76019’25”
2.4 69.2 60 29-38, 50-58.0(Vaiko
m)
6 174.5 19
5 Wellington Island
1998 9056’40”, 76016’00”
1.79 116.5 105 97-103 1.2 NA N
6 Vaittila 1999 9058’00”, 76018’10”
2.645 54.66 58 42-45 2.5 NA N
7 Narakkal 1990 10002’45”, 76012’57”
0.947 118.15 101 93-99.5 7.33 NA N
8 Nayarambalam 1990 10004’20”, 76012’47”
1.512 106.5 70 53-61 (Vaikom)
NA NA N
9 Cherai 1989 10008’33”, 76011’31”
0.863 102.4 Nil 48-54,68-74 NA NA N
Well No.
EKS
Location Year of constru-
ction
Location, coordinates
RL m amsl
Depth drilled (mbgl)
Depth constructed m
bgl
Zones tapped
Disc-harge
lps
Static Water
Level in mbgl
SP capa-city
lpm/m
Tm2/
10 Palluruthy-EW-I 1999-00 9055’50”, 146.25 100 95.5-96.5 3.34 2.16 4.

76016’20” 11 Palluruty-EW-II 1999-00 9055’50”,
76016’20” 146.25 143 122.5-140.5 3.34 1.02 16
12 Malipuram-I 1999-00 10001’28”, 76013’30”
174 121 109-118 3.14 0.7 167
13 Malipuram-II 1999-00 10001’28”, 76013’30”
173.67 170 146-167 3 0.7 105
14 Palliport –I 1999-00 10010’05”, 76010’40”
103.5 91 82-86 2.9 0.7
15 Paliport-II 1999-00 10010’05”, 76010’40”
31 30 24-27 0.481 1.16
16 Edavanakkad 2000-01 10005’30”, 76012’30”
116.5 106 97.0-103.0 4.4 1.4
17 Kaitharam 2000-01 10007’40”, 76014’00”
53 51 46.0-49.0 2.11 1.7
18 Wellingdon Port Trust qtrs
2000-01 9056’45”, 76016’45”
133.5 105 96.0-102.0 3.14 1.7
19 Subash Park 2000-01 9058’03”, 76016’55”
100 96 81.0-84.0, 90.0-93
3.14 1.7
20 Thevara 2000-01 9056’07”, 76018’02”
127 99 85.0-97.0 3.7 5.5 28
21 Kannamali-EW1 2001-02 9052’00”, 76016’00”
222 199 181.0-196.0 1.22 0.6
22 Kannamali-EW2 2001-02 9052’00”, 76015’55”
100 100 85.0-97.0 3.7 5.82
23 Mundanveli 2001-02 9055’30”, 76015’30”
207 122 109.0-118.0 3.1 0.79 8
24 INS Dhronacharya
Fort Kochi
2001-02 9057’00”, 76014’45”
198 181 166.0-178.0
25 Fort Kochi - Veli 2002-03 9057’20”, 76014’45”
186