Embed Size (px)
Citation preview
Who Appoints Them, What Do They Do?Evidence on Outside Directors from Japan
YOSHIRO MIWA
Faculty of EconomicsUniversity of Tokyo
7-3-1 Hongo, Bunkyo-ku, [email protected]
J. MARK RAMSEYER
Harvard Law SchoolCambridge, MA 02138
Although reformers often claim Japanese firms appoint inefficiently few outsidedirectors, the logic of market competition suggests otherwise. Given the com-petitive product, service, and capital markets in Japan, the firms that surviveshould disproportionately be firms that tend to appoint boards approaching theirfirm-specifically optimal structure. The resulting debate thus suggests a test: dofirms with more outsiders do better? If Japanese firms do maintain suboptimalnumbers of outsiders, then those with more outsiders should outperform thosewith fewer; if market constraints instead drive them toward their firm-specificoptimum, then firm characteristics may determine board structure, but firmperformance should show no observable relation to that structure. We explorethe issue with data on the 1000 largest exchange-listed Japanese firms from1986 to 1994. We first ask which firms tend to appoint which outsiders totheir boards. We find the appointments decidedly nonrandom. Firms appointdirectors from the banking industry when they borrow heavily, when they havefewer mortgageable assets, or when they are themselves in the service andfinance industry. They appoint retired government bureaucrats when they are
We gratefully acknowledge the helpful comments and suggestions from Stephen Bain-bridge, John de Figueiredo, Jeffrey Gordon, Daniel Ho, John Lott, Toshihiro Matsumura,Johannes Moenius, Randall Morck, Yasuhiro Omori, Robert Pozen, Eric Rasmusen,Roberta Romano, David Sneider, William Stuntz, Joel Trachtman, Mark West, NoriyukiYanagawa, the referees and editorial board, and workshop participants at HarvardUniversity, Indiana University, the Japanese Law & Economics Association, Nagashima,Ohno & Tsunematsu, the National Bureau of Economic Research, New York University,the University of Pennsylvania, the University of Pittsburgh, the University of Tokyo,Vanderbilt University, Waseda University, and Yale University. We received financialassistance from the Center for International Research on the Japanese Economy and theBusiness Law Center at the University of Tokyo, and the John M. Olin Program in Law,Economics & Business at the Harvard Law School.
c© 2005 Blackwell Publishing, 350 Main Street, Malden, MA 02148, USA, and 9600 Garsington Road,Oxford OX4 2DQ, UK.Journal of Economics & Management Strategy, Volume 14, Number 2, Summer 2005, 299–337
300 Journal of Economics & Management Strategy
in construction and sell a large fraction of their output to government agencies,and they appoint other retired business executives when they have a dominantparent corporation or when they are in the construction industry and sell heavilyto the private sector. Coupling OLS regressions with two-stage estimates on asubset of the data, we then ask whether the firms with more outside directorsoutperform those with fewer, and find that they do not. Instead, the regressionssuggest—exactly as the logic of market competition predicts—that firms chooseboards appropriate to them.
1. Introduction
Persistently, reformers claim that firms should increase the outside di-rectors they name to the board. If they will not appoint more outsiders ontheir own, the law should mandate the increase. Occasionally, scholarsecho the refrain. Directors monitor senior managers for shareholders,they explain. Unless independent from those managers, they will notaggressively monitor. Unless they take the job from a career beyondthe firm, they will not be independent. If a firm hopes to protect itsshareholders from its managers, it simply must name more outsiders toits board.
Stated so flatly, of course, the claim misses the tradeoffs. Whatoutsiders offer in independence, they sacrifice in expertise. The moreindependent they are, the less they know about the firm. In turn,the significance of that tradeoff will vary by firm. At some firms,independence will be crucial, and a broad business background may beall the expertise a director needs. At others, no amount of independencewill help a director who does not know the details of the firm’s business.
If boards matter, then the logic of market competition suggeststhat firms should tend to appoint outsiders at levels that approachtheir firm-specific optimum. To this logic, the Berle–Means separationof ownership from control is beside the point. For at root, Berle andMeans simply proposed an empirically testable hypothesis about themagnitude of the agency slack in the owner-controller relationship.Ultimately, it is the Japanese variant of that hypothesis that we testbelow.
Whether in Japan or in the United States, most firms sell theiroutput into competitive industries, buy their supplies from competitivesellers, and raise their funds on competitive capital markets. Facingthe inevitable market constraints, those that adopt more efficient gov-ernance structures should have higher odds of survival. Berle–Meansor no, in equilibrium firms should move toward their firm-specificallyoptimal governance structures or die. In equilibrium, those firms thatsurvive should tend to approach the number and types of outsidedirectors they need, and no more.
Evidence on Outside Directors from Japan 301
Unfortunately for the researcher, the solicitude many Americanlegislators and judges display toward shareholder claims (usuallymeritless claims—as Romano, 1991, shows) obscures this market dy-namic in the United States. A New York Stock Exchange (NYSE)-listedfirm without outside directors is a firm begging for a shareholder suit,bad governance, or good. In this legal environment, outside directorsbuy protection. In the absence of such directors, a US firm can defendagainst self-dealing claims only at enormous expense. By routing itsmajor business decisions past outside directors, however, it can dra-matically lower the costs it incurs in defending against such claims(Bainbridge, 2002, pp. 270–271; Clark, 1986, pp. 166–168). Reasonablyenough, listed firms in the United States have responded to this threat oflitigation by appointing majority-outside boards. As a result, however,they no longer offer the dispersion in the data necessary to study anyother roles outsiders may perform at a firm.
By exploring the place of outside directors in Japan, we examinethe function such directors can play in a world without this litigation-related bias. Japanese courts have never allowed class–action suits,and until the early 1990s maintained filing fees that effectively barredderivative suits as well. By examining the appointment of outsidedirectors there, we thus do two things. First, we explore the determinantsof board composition unrelated to shareholder litigation: In a worldlargely without derivative and shareholder class–action suits, whichfirms find what kind of outside directors attractive? Second, we ask howendogenous board structure is: How forcefully does market competitiondrive firms toward their firm-specific optimum?
We examine the outside directors at the largest exchange-listedJapanese firms—the approximately 1000 firms listed in Section 1 of theTokyo Stock Exchange (TSE) in the late 1980s and early 1990s. We findthat firms do not appoint directors randomly. Instead, they apparentlychoose their boards with considerable care: (a) smaller firms, moreheavily leveraged firms, and firms without a large stock of mortgageableassets tend to appoint more bankers; (b) construction firms specializingin public-sector civil-engineering projects tend to appoint more retiredgovernment bureaucrats; and (c) firms in which another firm owns alarge equity stake and construction firms specializing in large business-sector projects tend to appoint outside business executives.
Consistent with competitive market pressures toward firm-specifically optimal patterns of board composition, we find no ro-bust association between observable indices of board composition andfirm performance. The statement holds whether we use OLS or two-stage least squares (2SLS) specifications. Consistent with the lack ofany tie between optimal board composition and the macro-economicenvironment, we also find that this lack of association holds both for the
302 Journal of Economics & Management Strategy
late 1980s and for the early 1990s, despite the similar fraction of outsidedirectors during the two periods.
Obviously, our results do not generalize to worlds without com-petitive capital, product, or input markets. Provided firms face seriousmarket constraints, however, our logic should apply across nationalboundaries. Obviously, too, the absence of statistically significant resultsnever proves a hypothesis. Nonetheless, that absence follows logicallyfrom many of the most fundamental implications of market competition.If product, service, and capital markets clear, for example, firms willearn only a market return on their investments—but the empiricistwill rarely observe statistically significant results. Similarly, if capitalmarkets impound information rapidly, investors will not outperformthe market, but the empiricist will again obtain no significant results(Fama, 1998). At root, our hypothesis about outside directors claims nomore and no less: markets work effectively.
Although the debate over board composition raises issues com-mon to other debates over corporate governance, details matter. Themarket processes that constrain the board appointments a firm can makeneed not constrain the options it faces on other governance choices (see,e.g., Black, 2001; Black et al., 2003; Gompers et al., 2003). In this paper,we take no position on those other issues.
We begin by reviewing the literature on board composition inSection 2. We explain our data set and variables in Section 3. We thenask which firms appoint what kinds of directors (Section 4.1), and whatobservable effect these directors have on firm performance (Section 4.2).
2. Outside Directors—The Literature
2.1 The Reformist Impulse
Routinely, public intellectuals praise outside directors. Directors workas agents for shareholders, they reason. As agents, they police managers.If themselves “company men,” they lack the independence they needadequately to police. Far better to require that firms appoint men andwomen not subject to the pressures that come from a lifetime at the firm.
Among the activists, several public-sector retirement plans havebeen among the most aggressive. By the late 1990s, CalPERS (1998)claimed a “substantial majority” of board members should be inde-pendent. TIAA-CREF followed (2000), and traditionalist organizations(e.g., Business Roundtable, 1999; NYSE, 2002) increasingly acquiesced.
In fact, most large US firms have already named outsiders tothe board anyway. According to Herman (1981, p. 35), the fraction ofmanufacturing firms with a majority of outsiders “rose from 50% in
Evidence on Outside Directors from Japan 303
1938, to 61% in 1961, to 71% in 1972, to 83% in 1976.” By 1973, themedian large manufacturing firm had only 40% inside directors, and by1988 that figure had fallen to a quarter (id.; Agrawal and Knoeber, 2001,p. 181).
Many prominent Japanese champion the same agenda. Take the“Corporate Governance Forum” headed by a university presidentand well-known legal scholar. Declares the Forum (Japan CorporateGovernance Forum, 1998): “A majority of the board of directors shouldbe composed of outside directors.” Politicians propose legislationthat would require outside directors. And through avenues like theAmerican Chamber of Commerce in Japan, foreign institutions likeCalPERS now routinely list outside directors among the changes theydemand of Japan.
Western observers of Japan tend to repeat these observations. Dore(2000, p. 79), for instance, dismisses Japanese boards as “an ‘insidersystem’ over which shareholders exercise little monitoring control.”Ahmadjian (2001) asserts they “rarely play a supervisory role,” few areoutsiders, and “many outsiders are not independent.” And quoting aUK study, Monks and Minow (1995, p. 272) insist that Japanese boards“represent the interests of the company and its employees” rather than“the interests of shareholders.”
2.2 The Economic Logic
2.2.1 IntroductionIn truth, the reformists raise their own questions. As noted earlier,what outsiders potentially contribute in independence from managers,they sacrifice in camaraderie and knowledge about the firm (Fama andJensen, 1983; Klein, 1998). Although in some firms the former mayoutweigh the latter, in others it will not.
More basically, those firms that survive should disproportionatelyhave boards that work well for them. Most firms in advanced capitalistcountries raise funds, buy labor and supplies, and sell goods andservices in competitive markets. As a result, those that survive shoulddisproportionately be those with reasonably appropriate governancemechanisms—firms whose boards either could not make a difference,or already approach their firm-specific optimum.1
2.2.2 Ownership and PerformanceOwnership concentration patterns in Japan illustrate the potential im-pact of market competition on firm structure. Over the decades since
1. On competition in the postwar Japanese capital market, see Miwa and Ramseyer(2004a); on the pre-war capital market, see Miwa and Ramseyer (2002a).
304 Journal of Economics & Management Strategy
Berle and Means, many scholars had claimed that the dispersed share-holdings at the large US firms let managers ignore shareholder welfare.Demsetz and Lehn (1985) suggested that the claim is implausible. Firmsthat raise their funds on competitive capital markets and sell their outputon competitive product and service markets should choose ownershippatterns close to their firm-specific optimum or disappear. If so, then anyattempt to regress shareholder returns on ownership structure wouldyield insignificant results—and so was found by Demsetz and Lehn.
Elsewhere, we use data on the 1947 American-mandated zaibatsudissolution (Miwa and Ramseyer, 2003a) to illustrate the way competi-tive product, service, and capital markets constrain Japanese ownershipstructures. Initially, those firms subject to the dissolution—the firmsforced by the Americans to adopt ownership structures other than whathad prevailed in the market—earned lower profits than competitors notsubject to the dissolution. By 1958, however, that effect had disappeared.Within a decade, competition in product, input, and capital markets hadforced firms to shift to more firm-specifically appropriate ownershippatterns or disappear. As the firms subject to the American-mandateddissolution restructured their ownership, the earlier observable relationbetween ownership structure and profitability vanished.2
Although scholars continue to dispute Demsetz and Lehn’s claimthat ownership is endogenous to performance (e.g., Morck et al., 1988;Holderness et al., 1999), they introduce their own theoretical puzzle:why? Why, as Jensen and Warner (1988) put it, would “concentration[not be] chosen to maximize firm value”? In any event, even in theirstudies the observable tie between ownership and performance appearsonly haphazardly and usually only in nonlinear specifications. Him-melberg et al. (1999, p. 354) conclude that once one controls for firm-specific differences in contracting environments, the basic endogeneityreappears: “changes in managerial ownership levels have no statisticallysignificant effect on Q.”
2.2.3 Boards and PerformanceThe Demsetz–Lehn logic transfers straightforwardly from ownershipconcentration to board composition. Perhaps at some firms, investorswill want outsiders who protect against insider misbehavior. Per-haps at others they will want the sophistication and cohesion that anall-inside board brings, and use other means to monitor and constrain
2. As an exogenous shock, the American-mandated dissolution of the existing own-ership equilibrium created a natural experiment to study the effect of ownership on per-formance. Unfortunately, we know of no analogous shock to postwar board compositionin Japan, and thus cannot perform a similar experiment regarding board composition.Over time, however, we do predict that the judicial decision in the early 1990s to facilitatederivative litigation (see West, 2001) may (for reasons outlined in the US context) leadmore Japanese firms to adopt majority outsider boards as well.
Evidence on Outside Directors from Japan 305
their managers. Given market pressures, the firms without outsidersshould tend to be those where outsiders would bring few gains. Becausefirms will appoint boards that approach their firm-specific optimum,board composition should bear no observable relation to firm perfor-mance.3
As with ownership concentration, some studies do find the con-trary. Regressing performance on outsider board membership, for ex-ample, some scholars find a positive association, while others, however,find a negative association.4 And most literature reviews (e.g., Hermalinand Weisbach, 2003; Romano, 1996, 2001; Bhagat and Black, 1999) findno relationship between observed performance and board compositionat all (e.g., Dalton et al., 1998, p. 278). “No matter what variable is usedto measure performance,” concludes Romano (1996, p. 287), “virtuallyall studies find that there is no significant relation between performanceand board composition.”
2.3 Misconceptions
Before examining the data, table several common misunderstandingsabout Japanese corporate governance. First, the Japanese equity marketis not inactive. Japanese firms raise not just debt but also equity, andraise the two in about the same proportions as US firms. When observersclaim Japanese firms are more heavily levered, they primarily captureaccounting differences (Myers, 2001, p. 83). Even the widely citedrestrictions on the bond market were porous, and the equity marketstill faced fewer limitations (Miwa and Ramseyer, 2004a).
Second, Japanese managers do not put employee welfare beforeshareholder returns. Instead, Japanese firms maintain incentives struc-tured directly to induce their managers to augment shareholder gains.Abe (1997), Kaplan (1994), and Kaplan and Minton (1994), for instance,all find top executive tenure in Japan tied to firm performance.
Third, Japanese executives cannot ignore the corporate-controlmarket. Although tender offers are rare, they have long been possible—and for managerial incentives, what matters is not the number oftakeovers but the potential for them. Indeed, if potential raiders couldacquire a firm readily enough, in equilibrium they seldom would—formanagers would manage in ways that did not make themselves a target.Moreover, in Japan, mergers and asset sales are common (Kosei, 1994,
3. This endogeneity to board composition is central to such econometric studies asHutchinson (2002); Agrawal and Knoeber (1996); Bathala and Rao (1995); Beatty andZajac (1994).
4. Positive effects: e.g., Black et al. (2003); Baysinger and Butler (1985); Ezzamel andWatson (1993); Brickley and James (1987); Mayers et al. (1997). Negative effects: e.g., Kesner(1987); Agrawal and Knoeber (1996); Klein (1998); Vance (1978).
306 Journal of Economics & Management Strategy
p. 181), and mergers and asset sales move productive assets to highervalued uses as effectively as tender offers.
Finally, the Japanese government has not used regulation to softenthe constraints imposed by the bank debt market. Although for yearsit purported to ration funds, for most of the last half-century firmsraised their money in competitive markets at competitive rates. Theloan restrictions it imposed simply did not bind (Miwa and Ramseyer,2004a).
3. The Data
3.1 Introduction
To study board appointments in Japan, we assemble information onall non-bank firms listed in section 1 of the Tokyo Stock Exchange (thelargest firms). We collect financial data from 1986 to 1994, and boardcomposition data of 1985, 1990, and 1995. We then use these data todetermine which firms appointed what kinds of directors (Section 4.1),and what observable effect those directors had on firm performance(Section 4.2). Both because of the idiosyncratic regulatory structuresinvolved and because bank accounting data differ substantially fromaccounting data in other industries, we exclude banks from this dataset. We then explore the connection between board composition andprofitability among banks in Miwa and Ramseyer (2003b). We ignore afirm’s purported keiretsu affiliation for reasons explained in Miwa andRamseyer (2002b).
3.2 Sources
We take our basic financial data from the Nikkei NEEDS data base. Fromthe Kabushiki toshi shueki ritsu (Nihon shoken), we gather shareholderreturns; from work by Asako et al., 1997, we obtain Tobin’s Q; and fromthe Kigyo keiretsu soran (Toyo keizai) we collect information on boardcomposition and the presence of a dominant shareholder.
3.3 Variables
With these data, we construct the following variables.
3.3.1 Performance VariablesQ: Tobin’s Q for TSE-listed manufacturing firms (not the whole dataset), averaged over 1986–1990 and 1990–1994.5
ROI: Total annual shareholder returns on investment (annual rateof appreciation in stock price plus dividends received) for 1985–1990and 1990–1995.
5. Q is “multiple Q,” given the consideration which the compilers gave to the impactof real estate prices on corporate performance (see Asako et al., 1997).
Evidence on Outside Directors from Japan 307
Operating-Income/TA: The ratio of a firm’s operating income (#95 ofthe Nikkei NEEDS data base) to total assets (#89) for each year, averagedover 1986–1990 and 1990–1994.
Ordinary-Income/Eq: The ratio of a firm’s ordinary income (oper-ating plus non-operating income, less non-operating expenses [such asinterest]; #110) to equity (#78) for each year, averaged over 1986–1990and 1990–1994.
Growth: The annual growth rate, in percentage, of a firm’s totalassets, averaged over 1986–1990 and 1990–1994.
3.3.2 Board Composition Variables—As of 1985, 1990,and 19956
Past Bankers: The number of directors on the board with a past career ata bank.
Past Other Firm: The number of directors on the board with a pastcareer at another firm (other than a bank).
Past Bureaucrat: The number of directors on the board with a pastcareer in government.
Concurrent Banker: The number of directors on the board with aconcurrent position at a bank.
Concurrent Other Firm: The number of directors on the board witha concurrent position at another firm (other than a bank).
Total Outside Directors: The sum of the above directors.Majority Outside Directors: 1 if outside directors constituted 50% or
more of all directors; 0 otherwise.
Although shareholders elect only the members of the board (the torishi-mari yaku), those directors usually select a subset of themselves to handleroutine issues. These executive directors (jomu, senmu, and variouscorporate officers) enjoy no special legal status (Miwa, 1998, pp. 104–111). Because some observers claim that the identity of these executivedirectors matters more than that of the others, we ran separate regres-sions for executive director composition and for board compositionmore generally. As the results were qualitatively very close, we reportonly the results on the full boards.
Obviously, one could define an “outsider” in many ways otherthan the way we defined it here. Definitions inherently contain anarbitrary element, and to our knowledge the literature offers no uniformdefinition. We choose the categories that we did because they reflectthe principal debates over Japanese corporate governance. Bankers lie
6. That is, in most cases, the directors chosen at the first shareholders’ general meetingafter the 1985, 1990, and 1995 fiscal years. Because most firms hold their meetings in Juneand have an April–March fiscal year, the 1985 directors would be those selected in June1986, after the end of fiscal year 1985 (April 1985–March 1986).
308 Journal of Economics & Management Strategy
central to the elaborate economic literature on main bank monitoring(see Miwa and Ramseyer, 2005a, 2005b; though some readers might notcall them “outsiders”). Retired bureaucrats have similarly generateda massive literature. And directors from “other firms” represent themen and women many Americans consider “outside directors” (thoughagain if from a dominant parent corporation not all readers would callthem “outsiders”).
3.3.3 Control VariablesTotal Directors: The number of directors (or executive directors) at a firmin 1985, 1990, and 1995.7
Dominant S/h: 1 if any shareholder held 25% or more of the firm’sstock in 1985, 1990, or 1995; 0 otherwise. Most dominant shareholdersare parent corporations rather than individuals.
Volatility: The variance of the ratio of a firm’s operating income(#95) to total assets (#89) over 1986–1990 and 1990–1994.
Total Assets: The average total assets of a firm (#89) over 1986–1990and 1990–1994, in million yen.
Tangible Assets/TA: The average ratio of a firm’s tangible assets (#21)to total assets (#89) over 1986–1990 and 1990–1994.
Sales/TA: A firm’s average sales (#90) over 1986–1990 and 1990–1994, divided by its average total assets (#89) over 1986–1990 and 1990–1994.
Bank Debt/TA: The sum of a firm’s short-term (#46) and long-term(#47, 63) borrowings divided by its total assets (#89), averaged over1986–1990 and 1990–1994.
Industry Dummies: Dummy variables for affiliation in the construc-tion, trade, service and finance (but excluding banks), transportation(and utilities and real estate), light industry, chemical, machinery, andmetals industries.
We include selected summary statistics in Tables I and II.
3.4 The Regressions
To explore the determinants of outside director appointments, weregress the number of outside directors of each type in 1985 and1990 on firm financials and industry affiliation. Given that the depen-dent variable involves count data, we use Poisson (with Huber–White
7. For this and other director variables, the data cover those directors who, afterserving in management elsewhere, are named to the board within 3–4 years of joininga given firm. The numbers include statutory auditors (kansayaku), on the grounds thatJapanese discussions of “yakuin” (colloquially translated as “directors”) typically includethe kansayaku.
Evidence on Outside Directors from Japan 309
Table I.
Selected Summary Statistics
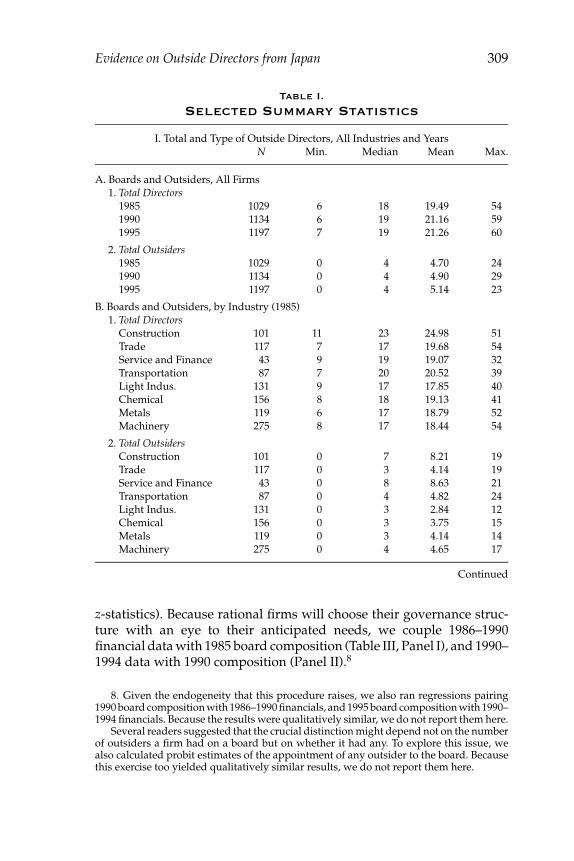
I. Total and Type of Outside Directors, All Industries and YearsN Min. Median Mean Max.
A. Boards and Outsiders, All Firms1. Total Directors
1985 1029 6 18 19.49 541990 1134 6 19 21.16 591995 1197 7 19 21.26 60
2. Total Outsiders1985 1029 0 4 4.70 241990 1134 0 4 4.90 291995 1197 0 4 5.14 23
B. Boards and Outsiders, by Industry (1985)1. Total Directors
Construction 101 11 23 24.98 51Trade 117 7 17 19.68 54Service and Finance 43 9 19 19.07 32Transportation 87 7 20 20.52 39Light Indus. 131 9 17 17.85 40Chemical 156 8 18 19.13 41Metals 119 6 17 18.79 52Machinery 275 8 17 18.44 54
2. Total OutsidersConstruction 101 0 7 8.21 19Trade 117 0 3 4.14 19Service and Finance 43 0 8 8.63 21Transportation 87 0 4 4.82 24Light Indus. 131 0 3 2.84 12Chemical 156 0 3 3.75 15Metals 119 0 3 4.14 14Machinery 275 0 4 4.65 17
Continued
z-statistics). Because rational firms will choose their governance struc-ture with an eye to their anticipated needs, we couple 1986–1990financial data with 1985 board composition (Table III, Panel I), and 1990–1994 data with 1990 composition (Panel II).8
8. Given the endogeneity that this procedure raises, we also ran regressions pairing1990 board composition with 1986–1990 financials, and 1995 board composition with 1990–1994 financials. Because the results were qualitatively similar, we do not report them here.
Several readers suggested that the crucial distinction might depend not on the numberof outsiders a firm had on a board but on whether it had any. To explore this issue, wealso calculated probit estimates of the appointment of any outsider to the board. Becausethis exercise too yielded qualitatively similar results, we do not report them here.
310 Journal of Economics & Management Strategy
Table I.
Continued
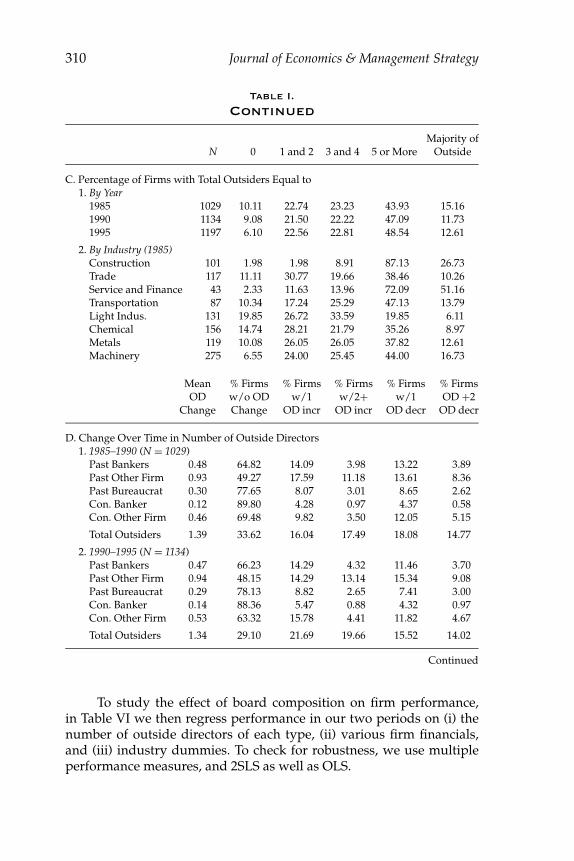
Majority ofN 0 1 and 2 3 and 4 5 or More Outside
C. Percentage of Firms with Total Outsiders Equal to1. By Year
1985 1029 10.11 22.74 23.23 43.93 15.161990 1134 9.08 21.50 22.22 47.09 11.731995 1197 6.10 22.56 22.81 48.54 12.61
2. By Industry (1985)Construction 101 1.98 1.98 8.91 87.13 26.73Trade 117 11.11 30.77 19.66 38.46 10.26Service and Finance 43 2.33 11.63 13.96 72.09 51.16Transportation 87 10.34 17.24 25.29 47.13 13.79Light Indus. 131 19.85 26.72 33.59 19.85 6.11Chemical 156 14.74 28.21 21.79 35.26 8.97Metals 119 10.08 26.05 26.05 37.82 12.61Machinery 275 6.55 24.00 25.45 44.00 16.73
Mean % Firms % Firms % Firms % Firms % FirmsOD w/o OD w/1 w/2+ w/1 OD +2
Change Change OD incr OD incr OD decr OD decr
D. Change Over Time in Number of Outside Directors1. 1985–1990 (N = 1029)
Past Bankers 0.48 64.82 14.09 3.98 13.22 3.89Past Other Firm 0.93 49.27 17.59 11.18 13.61 8.36Past Bureaucrat 0.30 77.65 8.07 3.01 8.65 2.62Con. Banker 0.12 89.80 4.28 0.97 4.37 0.58Con. Other Firm 0.46 69.48 9.82 3.50 12.05 5.15
Total Outsiders 1.39 33.62 16.04 17.49 18.08 14.77
2. 1990–1995 (N = 1134)Past Bankers 0.47 66.23 14.29 4.32 11.46 3.70Past Other Firm 0.94 48.15 14.29 13.14 15.34 9.08Past Bureaucrat 0.29 78.13 8.82 2.65 7.41 3.00Con. Banker 0.14 88.36 5.47 0.88 4.32 0.97Con. Other Firm 0.53 63.32 15.78 4.41 11.82 4.67
Total Outsiders 1.34 29.10 21.69 19.66 15.52 14.02
Continued
To study the effect of board composition on firm performance,in Table VI we then regress performance in our two periods on (i) thenumber of outside directors of each type, (ii) various firm financials,and (iii) industry dummies. To check for robustness, we use multipleperformance measures, and 2SLS as well as OLS.
Evidence on Outside Directors from Japan 311
Table I.
Continued
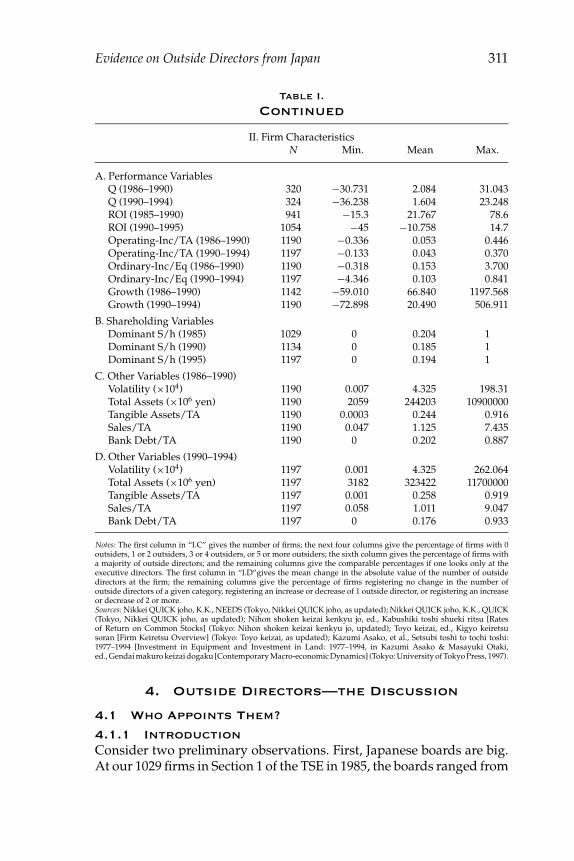
II. Firm CharacteristicsN Min. Mean Max.
A. Performance VariablesQ (1986–1990) 320 −30.731 2.084 31.043Q (1990–1994) 324 −36.238 1.604 23.248ROI (1985–1990) 941 −15.3 21.767 78.6ROI (1990–1995) 1054 −45 −10.758 14.7Operating-Inc/TA (1986–1990) 1190 −0.336 0.053 0.446Operating-Inc/TA (1990–1994) 1197 −0.133 0.043 0.370Ordinary-Inc/Eq (1986–1990) 1190 −0.318 0.153 3.700Ordinary-Inc/Eq (1990–1994) 1197 −4.346 0.103 0.841Growth (1986–1990) 1142 −59.010 66.840 1197.568Growth (1990–1994) 1190 −72.898 20.490 506.911
B. Shareholding VariablesDominant S/h (1985) 1029 0 0.204 1Dominant S/h (1990) 1134 0 0.185 1Dominant S/h (1995) 1197 0 0.194 1
C. Other Variables (1986–1990)Volatility (×104) 1190 0.007 4.325 198.31Total Assets (×106 yen) 1190 2059 244203 10900000Tangible Assets/TA 1190 0.0003 0.244 0.916Sales/TA 1190 0.047 1.125 7.435Bank Debt/TA 1190 0 0.202 0.887
D. Other Variables (1990–1994)Volatility (×104) 1197 0.001 4.325 262.064Total Assets (×106 yen) 1197 3182 323422 11700000Tangible Assets/TA 1197 0.001 0.258 0.919Sales/TA 1197 0.058 1.011 9.047Bank Debt/TA 1197 0 0.176 0.933
Notes: The first column in “I.C” gives the number of firms; the next four columns give the percentage of firms with 0outsiders, 1 or 2 outsiders, 3 or 4 outsiders, or 5 or more outsiders; the sixth column gives the percentage of firms witha majority of outside directors; and the remaining columns give the comparable percentages if one looks only at theexecutive directors. The first column in “I.D”gives the mean change in the absolute value of the number of outsidedirectors at the firm; the remaining columns give the percentage of firms registering no change in the number ofoutside directors of a given category, registering an increase or decrease of 1 outside director, or registering an increaseor decrease of 2 or more.Sources: Nikkei QUICK joho, K.K., NEEDS (Tokyo, Nikkei QUICK joho, as updated); Nikkei QUICK joho, K.K., QUICK(Tokyo, Nikkei QUICK joho, as updated); Nihon shoken keizai kenkyu jo, ed., Kabushiki toshi shueki ritsu [Ratesof Return on Common Stocks] (Tokyo: Nihon shoken keizai kenkyu jo, updated); Toyo keizai, ed., Kigyo keiretsusoran [Firm Keiretsu Overview] (Tokyo: Toyo keizai, as updated); Kazumi Asako, et al., Setsubi toshi to tochi toshi:1977–1994 [Investment in Equipment and Investment in Land: 1977–1994, in Kazumi Asako & Masayuki Otaki,ed., Gendai makuro keizai dogaku [Contemporary Macro-economic Dynamics] (Tokyo: University of Tokyo Press, 1997).
4. Outside Directors—the Discussion
4.1 Who Appoints Them?
4.1.1 IntroductionConsider two preliminary observations. First, Japanese boards are big.At our 1029 firms in Section 1 of the TSE in 1985, the boards ranged from
312 Journal of Economics & Management Strategy
Table II.
Type of Outside Directors by Industry, 1985
N Min. Median Mean Max.
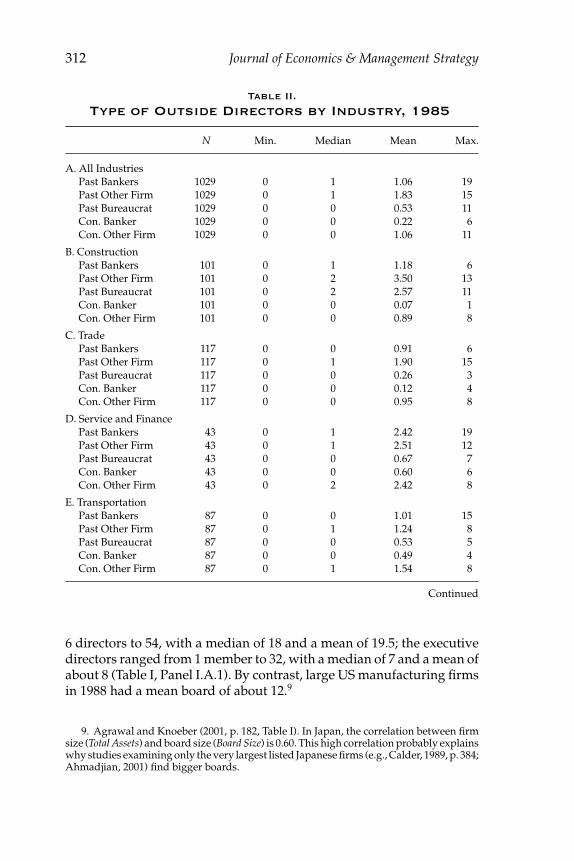
A. All IndustriesPast Bankers 1029 0 1 1.06 19Past Other Firm 1029 0 1 1.83 15Past Bureaucrat 1029 0 0 0.53 11Con. Banker 1029 0 0 0.22 6Con. Other Firm 1029 0 0 1.06 11
B. ConstructionPast Bankers 101 0 1 1.18 6Past Other Firm 101 0 2 3.50 13Past Bureaucrat 101 0 2 2.57 11Con. Banker 101 0 0 0.07 1Con. Other Firm 101 0 0 0.89 8
C. TradePast Bankers 117 0 0 0.91 6Past Other Firm 117 0 1 1.90 15Past Bureaucrat 117 0 0 0.26 3Con. Banker 117 0 0 0.12 4Con. Other Firm 117 0 0 0.95 8
D. Service and FinancePast Bankers 43 0 1 2.42 19Past Other Firm 43 0 1 2.51 12Past Bureaucrat 43 0 0 0.67 7Con. Banker 43 0 0 0.60 6Con. Other Firm 43 0 2 2.42 8
E. TransportationPast Bankers 87 0 0 1.01 15Past Other Firm 87 0 1 1.24 8Past Bureaucrat 87 0 0 0.53 5Con. Banker 87 0 0 0.49 4Con. Other Firm 87 0 1 1.54 8
Continued
6 directors to 54, with a median of 18 and a mean of 19.5; the executivedirectors ranged from 1 member to 32, with a median of 7 and a mean ofabout 8 (Table I, Panel I.A.1). By contrast, large US manufacturing firmsin 1988 had a mean board of about 12.9
9. Agrawal and Knoeber (2001, p. 182, Table I). In Japan, the correlation between firmsize (Total Assets) and board size (Board Size) is 0.60. This high correlation probably explainswhy studies examining only the very largest listed Japanese firms (e.g., Calder, 1989, p. 384;Ahmadjian, 2001) find bigger boards.
Evidence on Outside Directors from Japan 313
Table II.
Continued
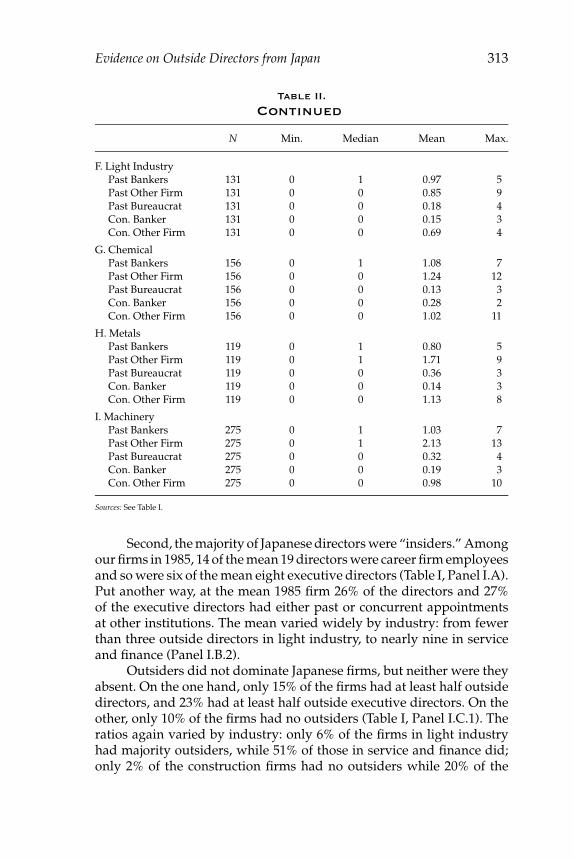
N Min. Median Mean Max.
F. Light IndustryPast Bankers 131 0 1 0.97 5Past Other Firm 131 0 0 0.85 9Past Bureaucrat 131 0 0 0.18 4Con. Banker 131 0 0 0.15 3Con. Other Firm 131 0 0 0.69 4
G. ChemicalPast Bankers 156 0 1 1.08 7Past Other Firm 156 0 0 1.24 12Past Bureaucrat 156 0 0 0.13 3Con. Banker 156 0 0 0.28 2Con. Other Firm 156 0 0 1.02 11
H. MetalsPast Bankers 119 0 1 0.80 5Past Other Firm 119 0 1 1.71 9Past Bureaucrat 119 0 0 0.36 3Con. Banker 119 0 0 0.14 3Con. Other Firm 119 0 0 1.13 8
I. MachineryPast Bankers 275 0 1 1.03 7Past Other Firm 275 0 1 2.13 13Past Bureaucrat 275 0 0 0.32 4Con. Banker 275 0 0 0.19 3Con. Other Firm 275 0 0 0.98 10
Sources: See Table I.
Second, the majority of Japanese directors were “insiders.” Amongour firms in 1985, 14 of the mean 19 directors were career firm employeesand so were six of the mean eight executive directors (Table I, Panel I.A).Put another way, at the mean 1985 firm 26% of the directors and 27%of the executive directors had either past or concurrent appointmentsat other institutions. The mean varied widely by industry: from fewerthan three outside directors in light industry, to nearly nine in serviceand finance (Panel I.B.2).
Outsiders did not dominate Japanese firms, but neither were theyabsent. On the one hand, only 15% of the firms had at least half outsidedirectors, and 23% had at least half outside executive directors. On theother, only 10% of the firms had no outsiders (Table I, Panel I.C.1). Theratios again varied by industry: only 6% of the firms in light industryhad majority outsiders, while 51% of those in service and finance did;only 2% of the construction firms had no outsiders while 20% of the
314 Journal of Economics & Management Strategy
light industry firms had none (Table I, Panel I.C.2). Among large USmanufacturing firms, nearly three-quarters were outsiders (Agrawaland Knoeber, 2001, p. 182 Table I).10
We follow the practice in the literature on Japanese boards (e.g.,Kaplan and Minton, 1994) in defining as outsiders those directorswith either a past career or a concurrent career outside the firm. Theformer predominate. At our mean firm in 1985, 1.8 of the 19.5 directorswere former executives at other firms, and 1.1 currently held suchpositions; 1.1 were former bankers, and 0.2 currently worked at banks;0.5 were former government officials (a practice known as amakudari),and legal restrictions prevented current officials from holding boardposts (Table II, Panel A). Of the 7.9 executive directors at the meanfirm, 1.0 were former executives at firms, and 0.1 currently held suchpositions; 0.5 were former bankers, and 0.01 currently worked at banks;0.3 were former government officials.
4.1.2 Change Over TimeSuppose that the directors a firm needs to lead it during economicbooms do not necessarily lead it well during hard times. Because ofthe radical break in Japanese economic performance in 1990, optimalboard composition would have changed during our years. Where from1986 to 1990 real GDP grew at about 5% a year, from 1991 to 1994 itgrew barely 1% annually. Where the number of firms (with debt over10 million yen) failing dropped from 17,500 in 1986 to 6,500 in 1990,by 1994 it had climbed to 14,000 and by 2001 to 19,200 (BOJ statistics,available at www.boj.or.jp).
If optimal board composition varied by macro-economic environ-ment, then those directors suited to Japanese firms in the late 1980swould have been far less appropriate for the early 1990s. Necessarily,many firms that chose directors to maximize performance would haveappointed different types of men and women during the two periods.Disproportionately, firms that kept their boards unchanged would haveincluded those with inappropriate boards for at least one of the twoperiods.
At least by our observable indices, however, Japanese firms didnot change the types of directors they appointed. In 1985, they choseoutsiders for 25.6% of their directors, in 1990 for 24.9%, and in 1995for 25.8%. Of those outsiders, they consistently chose 6–7% from banks,16–17% from other firms, and 2–3% from the government. From 1985
10. Other studies purport to show that Japanese firms have a much lower fraction ofoutside directors than our data. This is largely because the number of outsiders at a firmis inversely associated with firm size (Table III), and these studies look only at the verylargest listed firms.
Evidence on Outside Directors from Japan 315
to 1990, 34% of the firms kept the number of outsiders they named totheir boards unchanged. Sixteen percent added one outsider and 17%added two or more; 18% cut one outside director and 15% cut two ormore. From 1990 to 1995, 29% made no change in the number of outsidedirectors, 22% added one, and 20% added two or more; 16% cut oneoutsider, and 14% cut two or more (Table I, Panel I.D).
4.1.3 Former BureaucratsSpecialists on Japan routinely argue that the Japanese government usesretired bureaucrats to influence business behavior. Okimoto claimsthat MITI sends its ex-bureaucrats “to the very sectors identified asmost central to the development of Japan’s economy.”11 There, as Aoki(1998, p. 299) puts it, the ex-bureaucrats let the government “extend itsvisible and invisible influence throughout its jurisdiction.” Through theretired bureaucrats, explains Hoshi (1998, p. 862), it can “intervene inmanagement if necessary.” Given the confluence of widespread businessregulation with a “high number of amakudari board members,” con-cludes Schaede (1994, p. 318–319), “ex-government officials constitutean important factor in the Japanese governance structure.”
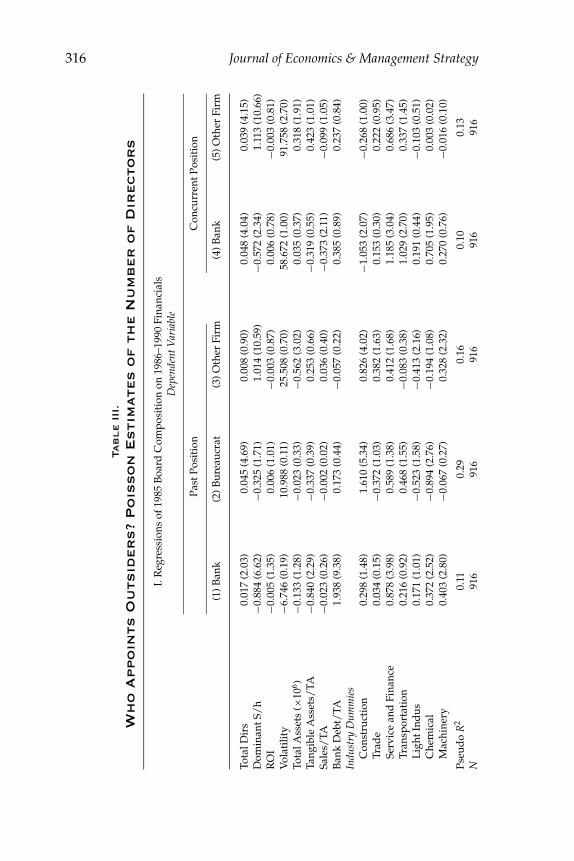
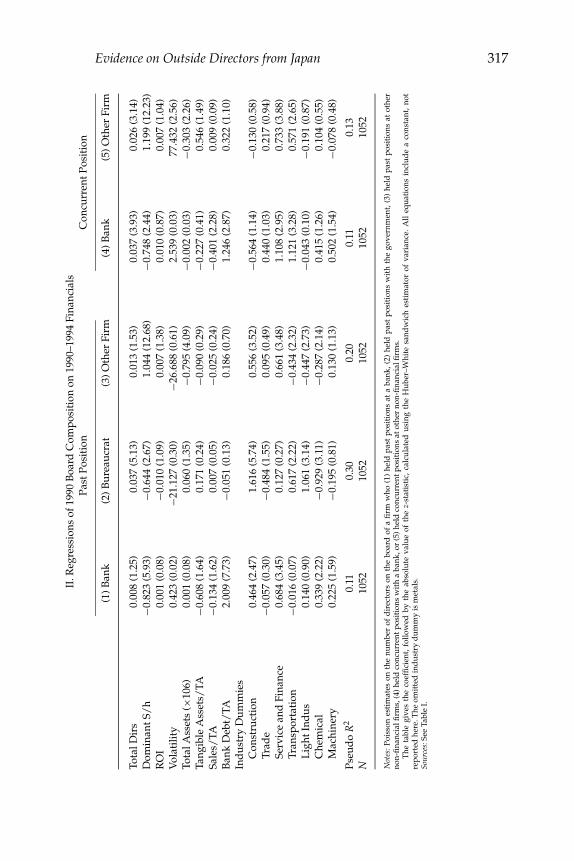
Although we do not purport to test the effect of the ex-bureaucratson the enforcement of government policy, one should wonder. At root,ex-government directors are few and far between (Tables I and II).Our 1029 firms in 1985 had only a mean 0.5 ex-government directorsand 0.3 ex-government executive directors (Table II, Panel A). Seventy-four percent of the firms had no ex-government directors at all, and83% had no executive directors. What is more, few of the firms withex-bureaucrats were in any of the industries that drove the post wareconomic growth. Instead, as our Table III regressions of the number ofex-bureaucrats on firm characteristics show (we discuss the issue morefully in Section 4.1.6), they were primarily in the construction industry.12
4.1.4 Bankers
4.1.4.1 The Literature. Banks play an important role in most analysesof Japanese corporate governance, and “main banks” are central to theaccounts.13 Morck et al. (2000, p. 540; Sheard, 1996, p. 181) declare that
11. Okimoto (1989, p. 162). More ambiguously, Calder (1989, p. 383), claims that ex-government officials are “quite numerous” in “some strategically important sectors ofthe economy”—but then gives the construction industry as an example of a “strategicallyimportant” sector.
12. They were also in the regional banks, as we discuss in Miwa and Ramseyer (2003b).13. In their study of the 119 largest Japanese firms, Kaplan and Minton (1994) examine
the relation between firm performance and executive turnover. They find that the lowest-performing firms tend to increase the number of bankers they appoint to the board. Wediscuss this issue in Miwa and Ramseyer (2005a).
316 Journal of Economics & Management Strategy
Tab
le
III.
Wh
oA
ppo
ints
Ou
tsid
er
s?
Po
isso
nE
sti
mate
so
fth
eN
um
ber
of
Dir
ecto
rs
I.R
egre
ssio
nsof
1985
Boa
rdC
ompo
siti
onon
1986
–199
0Fi
nanc
ials
Dep
ende
ntV
aria
ble
Past
Posi
tion
Con
curr
entP
osit
ion
(1)B
ank
(2)B
urea
ucra
t(3
)Oth
erFi
rm(4
)Ban
k(5
)Oth
erFi
rm
Tota
lDir
s0.
017
(2.0
3)0.
045
(4.6
9)0.
008
(0.9
0)0.
048
(4.0
4)0.
039
(4.1
5)D
omin
antS
/h
−0.8
84(6
.62)
−0.3
25(1
.71)
1.01
4(1
0.59
)−0
.572
(2.3
4)1.
113
(10.
66)
RO
I−0
.005
(1.3
5)0.
006
(1.0
1)−0
.003
(0.8
7)0.
006
(0.7
8)−0
.003
(0.8
1)V
olat
ility
−6.7
46(0
.19)
10.9
88(0
.11)
25.5
08(0
.70)
58.6
72(1
.00)
91.7
58(2
.70)
Tota
lAss
ets
(×10
6 )−0
.133
(1.2
8)−0
.023
(0.3
3)−0
.562
(3.0
2)0.
035
(0.3
7)0.
318
(1.9
1)Ta
ngib
leA
sset
s/TA
−0.8
40(2
.29)
−0.3
37(0
.39)
0.25
3(0
.66)
−0.3
19(0
.55)
0.42
3(1
.01)
Sale
s/TA
−0.0
23(0
.26)
−0.0
02(0
.02)
0.03
6(0
.40)
−0.3
73(2
.11)
−0.0
99(1
.05)
Ban
kD
ebt/
TA1.
938
(9.3
8)0.
173
(0.4
4)−0
.057
(0.2
2)0.
385
(0.8
9)0.
237
(0.8
4)In
dust
ryD
umm
ies
Con
stru
ctio
n0.
298
(1.4
8)1.
610
(5.3
4)0.
826
(4.0
2)−1
.053
(2.0
7)−0
.268
(1.0
0)Tr
ade
0.03
4(0
.15)
−0.3
72(1
.03)
0.38
2(1
.63)
0.15
3(0
.30)
0.22
2(0
.95)
Serv
ice
and
Fina
nce
0.87
8(3
.98)
0.58
9(1
.38)
0.41
2(1
.68)
1.18
5(3
.04)
0.68
6(3
.47)
Tran
spor
tati
on0.
216
(0.9
2)0.
468
(1.5
5)−0
.083
(0.3
8)1.
029
(2.7
0)0.
337
(1.4
5)L
ight
Ind
us0.
171
(1.0
1)−0
.523
(1.5
8)−0
.413
(2.1
6)0.
191
(0.4
4)−0
.103
(0.5
1)C
hem
ical
0.37
2(2
.52)
−0.8
94(2
.76)
−0.1
94(1
.08)
0.70
5(1
.95)
0.00
3(0
.02)
Mac
hine
ry0.
403
(2.8
0)−0
.067
(0.2
7)0.
328
(2.3
2)0.
270
(0.7
6)−0
.016
(0.1
0)
Pseu
do
R2
0.11
0.29
0.16
0.10
0.13
N91
691
691
691
691
6
Evidence on Outside Directors from Japan 317II
.Reg
ress
ions
of19
90B
oard
Com
posi
tion
on19
90–1
994
Fina
ncia
lsPa
stPo
siti
onC
oncu
rren
tPos
itio
n
(1)B
ank
(2)B
urea
ucra
t(3
)Oth
erFi
rm(4
)Ban
k(5
)Oth
erFi
rm
Tota
lDir
s0.
008
(1.2
5)0.
037
(5.1
3)0.
013
(1.5
3)0.
037
(3.9
3)0.
026
(3.1
4)D
omin
antS
/h
−0.8
23(5
.93)
−0.6
44(2
.67)
1.04
4(1
2.68
)−0
.748
(2.4
4)1.
199
(12.
23)
RO
I0.
001
(0.0
8)−0
.010
(1.0
9)0.
007
(1.3
8)0.
010
(0.8
7)0.
007
(1.0
4)V
olat
ility
0.42
3(0
.02)
−21.
127
(0.3
0)−2
6.68
8(0
.61)
2.53
9(0
.03)
77.4
32(2
.56)
Tota
lAss
ets
(×10
6)0.
001
(0.0
8)0.
060
(1.3
5)−0
.795
(4.0
9)−0
.002
(0.0
3)−0
.303
(2.2
6)Ta
ngib
leA
sset
s/TA
−0.6
08(1
.64)
0.17
1(0
.24)
−0.0
90(0
.29)
−0.2
27(0
.41)
0.54
6(1
.49)
Sale
s/TA
−0.1
34(1
.62)
0.00
7(0
.05)
−0.0
25(0
.24)
−0.4
01(2
.28)
0.00
9(0
.09)
Ban
kD
ebt/
TA2.
009
(7.7
3)−0
.051
(0.1
3)0.
186
(0.7
0)1.
246
(2.8
7)0.
322
(1.1
0)In
dus
try
Dum
mie
sC
onst
ruct
ion
0.46
4(2
.47)
1.61
6(5
.74)
0.55
6(3
.52)
−0.5
64(1
.14)
−0.1
30(0
.58)
Trad
e−0
.057
(0.3
0)−0
.484
(1.5
5)0.
095
(0.4
9)0.
440
(1.0
3)0.
217
(0.9
4)Se
rvic
ean
dFi
nanc
e0.
684
(3.4
5)0.
127
(0.2
7)0.
661
(3.4
8)1.
108
(2.9
5)0.
733
(3.8
8)Tr
ansp
orta
tion
−0.0
16(0
.07)
0.61
7(2
.22)
−0.4
34(2
.32)
1.12
1(3
.28)
0.57
1(2
.65)
Lig
htIn
dus
0.14
0(0
.90)
1.06
1(3
.14)
−0.4
47(2
.73)
−0.0
43(0
.10)
−0.1
91(0
.87)
Che
mic
al0.
339
(2.2
2)−0
.929
(3.1
1)−0
.287
(2.1
4)0.
415
(1.2
6)0.
104
(0.5
5)M
achi
nery
0.22
5(1
.59)
−0.1
95(0
.81)
0.13
0(1
.13)
0.50
2(1
.54)
−0.0
78(0
.48)
Pseu
do
R2
0.11
0.30
0.20
0.11
0.13
N10
5210
5210
5210
5210
52
Not
es:P
oiss
ones
tim
ates
onth
enu
mbe
rof
dir
ecto
rson
the
boar
dof
afi
rmw
ho(1
)he
ldpa
stpo
siti
ons
ata
bank
,(2)
held
past
posi
tion
sw
ith
the
gove
rnm
ent,
(3)
held
past
posi
tion
sat
othe
rno
n-fi
nanc
ialfi
rms,
(4)h
eld
conc
urre
ntpo
siti
ons
wit
ha
bank
,or
(5)h
eld
conc
urre
ntpo
siti
ons
atot
her
non-
fina
ncia
lfirm
s.T
heta
ble
give
sth
eco
effi
cien
t,fo
llow
edby
the
abso
lute
valu
eof
the
z-st
atis
tic,
calc
ulat
edus
ing
the
Hub
er–W
hite
sand
wic
hes
tim
ator
ofva
rian
ce.
All
equa
tion
sin
clud
ea
cons
tant
,no
tre
port
edhe
re.T
heom
itte
din
dus
try
dum
my
ism
etal
s.So
urce
s:Se
eTa
ble
I.
318 Journal of Economics & Management Strategy
in Japan “corporate governance rights rest primarily with banks,” andSheard describes the banks and large shareholders as “the principalagents of direct corporate governance in Japan.” Japanese firms borrowheavily from banks, the story goes. Among the banks, one typically actsas the firm’s “main bank.” As such, it lends the firm the largest portionof its funds, agrees to rescue it if times turn bad,14 and plays “a keycorporate governance role” (Morck et al., 2000, p. 540).
According to many accounts, the main bank also implicitly agreesto monitor the firm on behalf of the firm’s other creditors. Typically,big Japanese firms borrow from many banks. Because the banks wouldwaste resources if they each monitored all firms, each implicitly agrees(in these accounts) to monitor those for which it serves as the “mainbank.” In Aoki’s (2000, p. 79) words, the main bank becomes the firm’s“exclusive” monitor. The banks, as Sheard (1994, p. 8) modeled it, are“completely diversified in their lending but . . . spread the burden ofbeing a monitor by having each bank be responsible for monitoring[only a small fraction of] firms.”
Consistent with these narratives, observers claim that the mainbank wields power in the board room. Kester (1993, p. 70), for instance,writes that “one or more members of a typical (21-member) Japaneseboard are frequently former executives of the company’s main bank(s).”According to Monks and Minow (1995, p. 265), at large Japanese firms“outside directors usually represent major lenders.” In Sheard’s (1986,p. 181) account, “main banks directly exercise “voice” by supplyingmanagers to the board.” And according to Hermalin and Weisbach(1998, p. 112), representatives of a Japanese firm’s principal lender“usually serve on the company’s board.”
4.1.4.2 The Results. Our data illustrate a variety of facets to the banker-director phenomenon, and several are uncontroversial. First, directorswith banking bankgrounds tend to serve on the boards of firms withmore bank debt (Bank Debt/TA; Table III). Second, ex-bankers are lesslikely to serve on the boards of firms dominated by a major shareholder(Dominant S/h). Last, ex-bankers are more likely to serve on the boardsof firms without a large stock of mortgageable assets (Tang Ast/TA; TableIII).
More problematic is whether bankers dominate boards. Althoughbankers are more common than some other outside directors, about halfthe firms have none. Of all 1029 firms in 1985, 47% had no ex-bankerdirector, and 63% had no ex-banker executive director. The mean firmhad 4.7 outside directors, but only 1.1 with a background at a bank
14. The claim is false, as we demonstrate in Miwa and Ramseyer (2002c, 2005a, 2005b).See also Hayashi (2000) and Hall and Weinstein (2000).
Evidence on Outside Directors from Japan 319
(Table I, Panel A.2; Table II, Panel A). According to Cable, at the largest100 German companies, banks held 9.8% of all board seats; by contrast,at the largest 100 Japanese firms, ex-bankers held 5.5% of the board seats,and 5.9% of the executive board seats.15
Most of the banker-directors were ex-bankers rather than mencurrently working at banks. If they held their seats as a bank’s agent,one would not expect them to have traded their bank job for a nominallyfull-time position at the firm. Instead, one would expect them to haveretained their bank career. In fact, however, only 15% of the 1985 firmshad a director with a concurrent bank position, and fewer than 1 in 100had an executive director with a concurrent bank post.
Third, banker directors tended to serve at the service and financialfirms rather than the manufacturers (Tables II and III). In the serviceand finance industry, the mean 1985 firm had 2.4 ex-bank directors.By contrast, in the chemical industry the mean firm had 1.2 ex-bankerdirectors; in the machinery industry it had 1.0 ex-bank directors; and inmetals it had 0.8 ex-bank directors (Table II).
Last, although some ex-bank directors came from a firm’s “mainbank,” many did not. More precisely, firms recruited 57% of their ex-bank directors from their main bank (defined as the institution that lentthe firm the greatest amount of debt). Because the main bank is (bydefinition) the bank that has lent the most, if the cost-effective level ofmonitoring rises with the amount of debt outstanding, then a main bankwill necessarily have the greatest incentive to monitor—“delegated”monitor or no. On the other hand, if its directors serve as the exclusivemonitors for all other banks, only bankers from the main bank shouldappear on board. In fact, about half the ex-bank directors are from themain bank.
4.1.5 Non-Bank Outside ExecutivesPeople and firms who invest heavily in a company will demand amechanism by which to influence the company. Consistent with thislogic, the firms that appoint the most outside business executives to theboard (non-bank, non-government outside directors) are those with adominant shareholder. On the Tokyo Stock Exchange, about a fifth ofthe firms have a shareholder with 25% or more of the stock.
Firms with a dominant shareholder are more likely than othersto have at least one retired outside business executive on their board.Among all TSE firms, 57% had such a director (45% had an executivedirector). Among those with a dominant shareholder, however, 81% hadsuch a director (78% had an executive director). Among all TSE firms,
15. Cable (1985, p. 119). Among all the firms in our sample, ex-bankers held 5.9% ofthe directorships and 7.4% of the executive directorships.
320 Journal of Economics & Management Strategy
retired executives constituted 10.4% of the board (14.7% of the executivedirectors). At those with a dominant shareholder, they constituted 24%(36% of the executive directors). The pattern parallels the appointmentsof executives with concurrent appointments at other firms.
Predictably, these outside directors often came from the dominantcorporate shareholder itself. Of the 1884 retired executives from otherfirms serving as directors at the TSE firms, 39.3% were from a dominantshareholder. Of the 403 serving as executive directors, 39.9% were froma dominant shareholder.
Our basic Table III regressions reflect these appointment patterns.When we regress the number of retired outside executives on variousfirm characteristics, the coefficient on Dominant S/h is significantlypositive. The magnitude of the Poisson regression coefficients are hardto interpret, but the OLS equivalents suggest that the presence of adominant shareholder increases the number of such retired directorsby 2.4, and the number of directors with concurrent posts in other firmsby 1.4.
4.1.6 Industry-Specific Effects
4.1.6.1 Appointment Patterns. Outside director appointments varywidely by industry. Disproportionately, both retired bureaucrats andretired executives work in a few industries. Indeed, disproportionatelythey work at the construction firms.16
Bureaucrats. Take the ex-bureaucrats. Where the average TSE firmhad half an ex-bureaucrat on its board in 1985, the average constructionfirm (101 firms) had 2.6 (Table II, Panels A and B). Where a quarter ofthe TSE firms had ex-bureaucrat directors, 71% of the construction firmsdid. Of the 542 ex-bureaucrat directors at all TSE firms, nearly half (260directors) were at the construction firms.
Notwithstanding Okimoto’s claim to the contrary, firms in indus-tries “central to the development of Japan’s economy” did not recruitex-bureaucrat directors. In the machinery industry in 1985, nearly 80%of the 275 firms had no former government officials on their board. In thechemical industry (156 firms), 89% had no government officials on theirboard. Indeed, the average machinery firm had only 0.32 ex-bureaucratson its board, and the average chemical firm only 0.13.
Even financial services firms were no more likely to hire ex-bureaucrats than the construction firms. As noted earlier, we exclude
16. A point noted even by some of those who reach different conclusions about thehiring of ex-government officials (see, e.g., Blumenthal, 1985, p. 315; Calder, 1989, p. 383;Okimoto, 1989, p. 162; Schaede, 1995, p. 309).
A joint test of statistical significance for all industry dummies yields results that aresignificant at the 1% level for all regressions in Table III.
Evidence on Outside Directors from Japan 321
banks from the sample here.17 In fact, however, in 1986 only two of thelarge money center banks had a former Ministry of Finance (MoF) officialas a executive director, and only three had any executive directors fromthe Bank of Japan (BoJ). Schaede’s (1994, pp. 290–291; see Aoki et al.,1994, p. 32) claim that “the CEOs of many major city banks were retiredgovernment ministry officials” is simply untrue.
The regional banks had more ex-bureaucrats than the city banks,but no more than the construction firms. Of the 56 regional banks, 48%had a MoF director and 50% a BoJ director. Seventy-one percent of theregional banks had either a MoF or a BoJ director.18
The Table III Poisson regressions reflect this concentration ofgovernment officials in construction: for both directors and executivedirectors, the coefficient on construction industry membership is a sta-tistically strongly significant predictor of ex-bureaucrat appointments.According to analogous unreported OLS regressions, the coefficient onconstruction industry membership is 1.9. Consistent with the Table IIdata, the average 1985 construction firm had two more ex-bureaucratson its board than the other firms.
Executives. Outside business executives too disproportionatelyworked at the construction firms. Consider again our Table III regres-sions. For both all directors and executive directors, the coefficient onconstruction industry affiliation is larger and statistically more signifi-cant than on any other industry dummy. All told, 18.7% of the retiredbusiness executives served at construction firms in 1985.
4.1.6.2 Revenue Effects. In the construction industry, board appoint-ments reflect expected revenues.19 Among the construction firms, thosethat focused on public-sector projects were most likely to appoint ex-bureaucrats. Those that focused on large private-sector projects mayhave been most likely to appoint retired executives from other firms. Toshow this, we create two new variables:20
Construction Rev: The percentage of a firm’s revenues generated byconstruction projects (other than prefabricated housing) for 1985.
17. Miwa and Ramseyer (2004b). As defined here, the industry includes service firmsnot providing financial services.
18. Elsewhere, Schaede (1995, p. 310) writes (apparently a claim diametrically opposedto that in Schaede, 1994) that “most firms” in the banking, investment banking, andinsurance industries “do not hire OBs [ex-government officials] at all.” In fact, as boththe discussion in the text (for banks) and Tables II and IV (for other financial servicesfirms) show, this claim too is false: firms in these industries are at least as likely to hirethem as the average firm in the sample as a whole.
19. For an analogous phenomenon in the United States (see, Agrawal and Knoeber,2001).
20. The data are from Toyo keizai, Kaisha shikiho.
322 Journal of Economics & Management Strategy
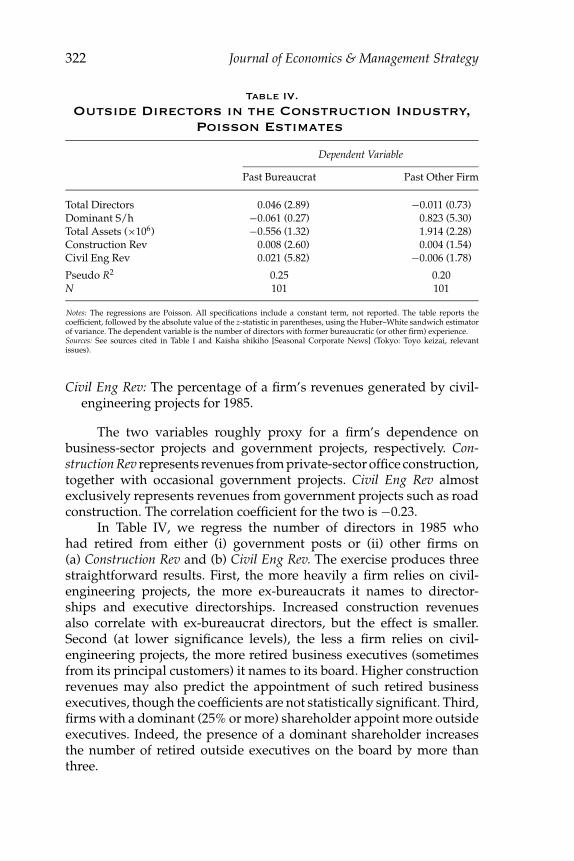
Table IV.
Outside Directors in the Construction Industry,Poisson Estimates
Dependent Variable
Past Bureaucrat Past Other Firm
Total Directors 0.046 (2.89) −0.011 (0.73)Dominant S/h −0.061 (0.27) 0.823 (5.30)Total Assets (×106) −0.556 (1.32) 1.914 (2.28)Construction Rev 0.008 (2.60) 0.004 (1.54)Civil Eng Rev 0.021 (5.82) −0.006 (1.78)
Pseudo R2 0.25 0.20N 101 101
Notes: The regressions are Poisson. All specifications include a constant term, not reported. The table reports thecoefficient, followed by the absolute value of the z-statistic in parentheses, using the Huber–White sandwich estimatorof variance. The dependent variable is the number of directors with former bureaucratic (or other firm) experience.Sources: See sources cited in Table I and Kaisha shikiho [Seasonal Corporate News] (Tokyo: Toyo keizai, relevantissues).
Civil Eng Rev: The percentage of a firm’s revenues generated by civil-engineering projects for 1985.
The two variables roughly proxy for a firm’s dependence onbusiness-sector projects and government projects, respectively. Con-struction Rev represents revenues from private-sector office construction,together with occasional government projects. Civil Eng Rev almostexclusively represents revenues from government projects such as roadconstruction. The correlation coefficient for the two is −0.23.
In Table IV, we regress the number of directors in 1985 whohad retired from either (i) government posts or (ii) other firms on(a) Construction Rev and (b) Civil Eng Rev. The exercise produces threestraightforward results. First, the more heavily a firm relies on civil-engineering projects, the more ex-bureaucrats it names to director-ships and executive directorships. Increased construction revenuesalso correlate with ex-bureaucrat directors, but the effect is smaller.Second (at lower significance levels), the less a firm relies on civil-engineering projects, the more retired business executives (sometimesfrom its principal customers) it names to its board. Higher constructionrevenues may also predict the appointment of such retired businessexecutives, though the coefficients are not statistically significant. Third,firms with a dominant (25% or more) shareholder appoint more outsideexecutives. Indeed, the presence of a dominant shareholder increasesthe number of retired outside executives on the board by more thanthree.
Evidence on Outside Directors from Japan 323
4.1.6.3 The Logic. Confronted with evidence that construction firmshire retired government bureaucrats, observers typically assume cor-ruption. Given the bid-rigging scandals on public-sector projects, the as-sumption is superficially plausible enough. Journalists like van Wolferenseem to argue that firms appoint bureaucrats to the board as a formof deferred compensation for colluding on past bids. Schaede claimsthat they appoint them to facilitate future corruption. A former bu-reaucrat, reasons she “can be invaluable in acquiring prior informationon planned public projects and government price ceilings on theseprojects.”21
Despite its appeal, the argument is problematic. In Japan as in theUnited States, bid-rigging is a serious crime. When in 1976 a mayor’scampaign staffer solicited funds from a contractor in exchange forfavorable treatment on a city housing project bid, he found himselfprosecuted and convicted for bribery.22 When in 1991 a constructionfirm executive director bribed a mayor for a contract for its new sportsfacility, he found himself sentenced to 2 years in prison (suspended),and civilly liable to the firm besides.23 And when a director at a realestate development firm bribed a prefectural governor for regulatoryclearance and favorable treatment on a bid, a court convicted them both:2 years in prison for the governor, and 2 1
2 for the director, neither termsuspended.24
Although heavy penalties may not cut crime rates to 0, usually theywill both reduce it and induce criminals to adopt tactics that are harder todetect. The high Japanese penalties for bid-rigging may not eliminate thecrime, but they ought to induce those firms determined to rig the processto negotiate and pay their bribes covertly. Yet to hire ex-bureaucratseither to negotiate the crime or to compensate co-conspirators is nothingif not flagrantly visible.
Ex-bureaucrats probably would not help rig many bids anyway.Because of the high penalties, most bureaucrats will not rig bids unlessthey know well the person propositioning them. A prefecture B officialwill not likely agree to the crime just because the man approaching himonce worked for the Ministry of Construction (MoC). Even less will hemuch care whether the man once worked for prefecture A. The retiredbureaucrats at the construction firms, however, come from a wide rangeof national and local government offices.
21. See generally Schaede (1995, p. 309); van Wolferen (1989, p. 118). Analogous claimsappear in Woodall (1996, pp. 40–41, 70 and 71). Analogous arguments about the bankingindustry appear in Horiuchi and Shimizu (2001) and van Rixtel and Hassink (2002).
22. Japan v. [No name given], 1199 Hanrei jiho 157 (Sup. Ct. June 27, 1987).23. Matsumaru v. Otsuru, 1518 Hanrei jiho 4 (Tokyo D. Ct. Dec. 22, 1994).24. Japan v. Kono, 1611 Hanrei jiho 36 (Tokyo D. Ct. March 21, 1997).
324 Journal of Economics & Management Strategy
Crucially, the MoC does not auction public sector projects nation-wide, and neither does anyone else. Instead, for any given project thegovernment unit involved solicits its own bids. Cities solicit bids forcity projects, and prefectures solicit those for their own. The nationalgovernment itself solicits less than 12% of all public-sector projects(Kensetsu sho, various years). Prefectural and municipal governmentseach solicit another 30% or so, and assorted public entities solicit therest (id.).
Table IV instead suggests a more mundane explanation for thehiring patterns (one consistent with the data Agrawal and Knoeber, 2001,locate for the United States): construction firms appoint board memberswho will help them to identify the services their principal customerswant to buy. If they sell heavily to the public sector, they appoint menwith experience in government. If they sell heavily to the private sector,they appoint executives with experience in business.25
Manufacturing firms need to learn about customer preferencestoo, of course, but for them it is information they can cheaply obtainelsewhere. If a firm sells large quantities of standardized products(tractors, DVD players) into the general retail market, it can learn buyerpreferences by surveying customers or auditing sales patterns. Kubotaneed not appoint a farmer to its board to learn which plow its customerswant to buy. It can simply watch which plows sell.
By contrast, construction firms sell small numbers of non-standardized service packages (the construction of airports or officetowers) to specific customers. To sell successfully, they need to tailorthe packages they offer to buyer preferences. Yet surveys and salesaudits will only haphazardly enable them to do that. To tailor theirpackages, they instead recruit men with a lifetime of experience at thetypes of organizations to which they sell. Hypothetically, they mighthave hired such men as consultants on specific projects instead. Forwhatever reason, in Japan they apparently appoint them to the board.
4.2 What Do They Do?
4.2.1 IntroductionFor all the reasons Demsetz and Lehn explained, disproportionately thefirms that survive in competitive capital, product, and input marketsshould be firms with governance mechanisms approaching their firm-specific optimum. Given those market constraints, any regression offirm performance on firm governance should yield insignificant results.
25. Obviously, this is consistent with the use of directors to obtain “access.” Ourquarrel with the literature instead concerns the claim that construction firms use boardcomposition to facilitate bid-rigging.
Evidence on Outside Directors from Japan 325
Obviously, insignificant results will not prove that the firms havereached their optimal structure. Insignificant results never do.
Yet what regressing firm performance on governance structureswill do is to check whether firms maintain observably inefficient struc-tures. If the conventional accounts are right, they do: many Japanesefirms maintain inefficiently low levels of outside directors. And if so,then the firms with more outside directors should outperform the firmswith fewer. Given that most firms do appoint at least some outsidedirectors, managers seem not to make outside appointments impossible.If more outsiders would help push the firm to increase shareholderwealth, then those firms that do surmount the hypothesized managerialopposition to outsiders should earn higher returns than those that donot, even under OLS specifications.
Insignificant results are also consistent with boards that simply donot matter, of course. We do not purport to test our claim (a) that firmschoose board composition patterns that approach their firm-specificoptimum against the claim (b) that board composition has no effect at all.We note, however, that the nonrandom character to board appointments(detailed in Section 4.1) does suggest that the firms involved at leastthink boards affect how well they do.
4.2.2 The ExerciseIn Table VI Panel I, we report the results of regressing firm performanceon board composition through OLS, and in Panel II we do the same fora subset of our sample through 2SLS. To check for robustness, we usefive distinct indices of firm performance: Tobin’s Q (Q; available only forthe manufacturing firms), shareholder returns (ROI), two measures ofaccounting profitability (Operating-Inc/TA and Ordinary-Inc/Equity), andthe growth rate of the firm’s asset base (Growth). We include ROI becauseit serves as an obvious metric of firm performance. Given that stockprices should incorporate the anticipated effect of board composition,we caution readers against expecting significant coefficients. We includeGrowth because of the widespread claims that Japanese firms pursuegrowth rather than profits or shareholder returns. Here too, however,we urge caution: the claims about growth-maximizing Japanese firmshave no theoretical rationale, and to date lack any serious empiricalsupport.
With each performance index, we separately study the effect ofboard composition on the performance for 1986–1990 (Table VI, PanelI.A) and 1990–1994 (Panel I.B).26 Within each subpanel, we then examinethe effect (a) of the number of outside directors from each of several
26. Regressions involving the composition of the executive board yield qualitativelysimilar results.
326 Journal of Economics & Management Strategy
categories, (b) of the fraction of outside directors from each category,(c) of dummy variables indicating the presence of any directors fromeach category, (d) of the total number of outside directors, and (e)of a dummy variable indicating the presence of a majority of outsidedirections. In each regression, we add financial variables and industryaffiliation dummies. For expositional economy, we report the coeffi-cients on these additional variables only in Panels I.A.1 and I.B.1.
We break the data in 1990 because of the dramatic economicshift we detailed earlier. If competition does push firms toward theiroptimal board structure, then the 1990 break in Japanese performancelets us ask whether that optimum varies by economic environment. Asnoted above, Japanese firms did not change the types of directors theyappointed from 1985 to 1995. Yet, suppose the optimal board structuredepended on macroeconomic health. Even if board composition hadno observable impact on performance in the 1980s, it might plausiblyhave had such impact in the early 1990s. If good board structure is notenvironment-specific, however, then that structure would not visiblyhave affected performance in either period.
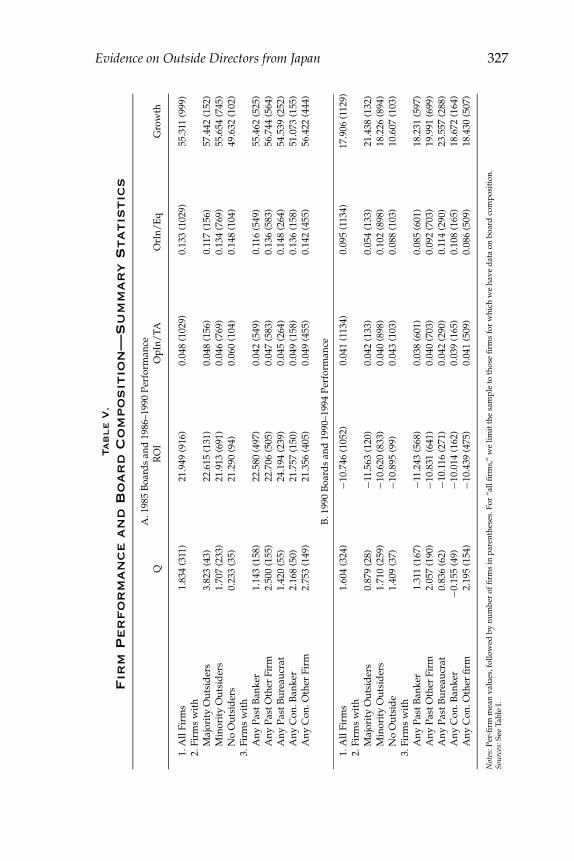
Before turning to the regressions, consider the summary statisticsin Table V. At least by these simple indices, outside directors are notobservably associated with higher performance. In 1986–1990, firmswith Majority Outside Directors had higher Tobin’s Q‘s, shareholder ROI,and asset Growth, but lower Ordinary-Income/Eq and (relative to thosewith no outsiders) lower Operating-Income/TA. By 1990–1994, other thanGrowth and Operating-Income/TA, they underperformed the other firmson every index.27
4.2.3 The FindingsRegression results largely confirm what the logic of market competitionpredicts: 1985 board composition has no observable effect on 1986–1990performance, and neither does 1990 composition observably affect 1990–1994 performance. Even when statistically significant, the results are notrobust to alternative performance measures.
Preliminarily, take the relation between board size and perfor-mance. A few scholars have found that US firms with big boardsoutperform those with small. For that result, they usually propose onlytheoretically dubious explanations. And our own Table VI Panel I.A.1results illustrate the sensitivity such atheoretic inquiries show to quirks
27. At the 5% level, Majority Outside Director firms outperform other firms in terms of1986–1990 Q, 1990–1994 Operating-Income/TA, and 1990–1994 Growth. The other compar-isons between the Majority Outside Director firms and non-Majority Outside Director firmsare not statistically significant. The difference in 1986–1990 Operating-Income/TA betweenthe Majority Outside Director firms and firms with no outside directors is significant at the10 but not 5% level.
Evidence on Outside Directors from Japan 327
Tab
le
V.
Fir
mP
er
fo
rm
an
ce
an
dB
oar
dC
om
po
sit
ion
—S
um
mary
Sta
tisti
cs
A.1
985
Boa
rds
and
1986
–199
0Pe
rfor
man
ceQ
RO
IO
pIn/
TAO
rIn/
Eq
Gro
wth
1.A
llFi
rms
1.83
4(3
11)
21.9
49(9
16)
0.04
8(1
029)
0.13
3(1
029)
55.3
11(9
99)
2.Fi
rms
wit
hM
ajor
ity
Out
sid
ers
3.82
3(4
3)22
.615
(131
)0.
048
(156
)0.
117
(156
)57
.442
(152
)M
inor
ity
Out
sid
ers
1.70
7(2
33)
21.9
13(6
91)
0.04
6(7
69)
0.13
4(7
69)
55.6
54(7
45)
No
Out
sid
ers
0.23
3(3
5)21
.290
(94)
0.06
0(1
04)
0.14
8(1
04)
49.6
32(1
02)
3.Fi
rms
wit
hA
nyPa
stB
anke
r1.
143
(158
)22
.580
(497
)0.
042
(549
)0.
116
(549
)55
.462
(525
)A
nyPa
stO
ther
Firm
2.50
0(1
55)
22.7
06(5
05)
0.04
7(5
83)
0.13
6(5
83)
56.7
44(5
64)
Any
Past
Bur
eauc
rat
1.42
0(5
5)24
.194
(239
)0.
045
(264
)0.
148
(264
)54
.539
(252
)A
nyC
on.B
anke
r2.
168
(50)
21.7
57(1
50)
0.04
9(1
58)
0.13
6(1
58)
51.0
73(1
55)
Any
Con
.Oth
erFi
rm2.
753
(149
)21
.356
(405
)0.
049
(455
)0.
142
(455
)56
.422
(444
)
B.1
990
Boa
rds
and
1990
–199
4Pe
rfor
man
ce
1.A
llFi
rms
1.60
4(3
24)
−10.
746
(105
2)0.
041
(113
4)0.
095
(113
4)17
.906
(112
9)2.
Firm
sw
ith
Maj
orit
yO
utsi
der
s0.
879
(28)
−11.
563
(120
)0.
042
(133
)0.
054
(133
)21
.438
(132
)M
inor
ity
Out
sid
ers
1.71
0(2
59)
−10.
620
(833
)0.
040
(898
)0.
102
(898
)18
.226
(894
)N
oO
utsi
de
1.40
9(3
7)−1
0.89
5(9
9)0.
043
(103
)0.
088
(103
)10
.607
(103
)3.
Firm
sw
ith
Any
Past
Ban
ker
1.31
1(1
67)
−11.
243
(568
)0.
038
(601
)0.
085
(601
)18
.231
(597
)A
nyPa
stO
ther
Firm
2.05
7(1
90)
−10.
831
(641
)0.
040
(703
)0.
092
(703
)19
.991
(699
)A
nyPa
stB
urea
ucra
t0.
836
(62)
−10.
116
(271
)0.
042
(290
)0.
114
(290
)23
.557
(288
)A
nyC
on.B
anke
r−0
.155
(49)
−10.
014
(162
)0.
039
(165
)0.
108
(165
)18
.672
(164
)A
nyC
on.O
ther
firm
2.19
5(1
54)
−10.
439
(475
)0.
041
(509
)0.
086
(509
)18
.430
(507
)
Not
es:P
er-fi
rmm
ean
valu
es,f
ollo
wed
bynu
mbe
rof
firm
sin
pare
nthe
ses.
For
“all
firm
s,”
we
limit
the
sam
ple
toth
ose
firm
sfo
rw
hich
we
have
dat
aon
boar
dco
mpo
siti
on.
Sour
ces:
See
Tabl
eI.
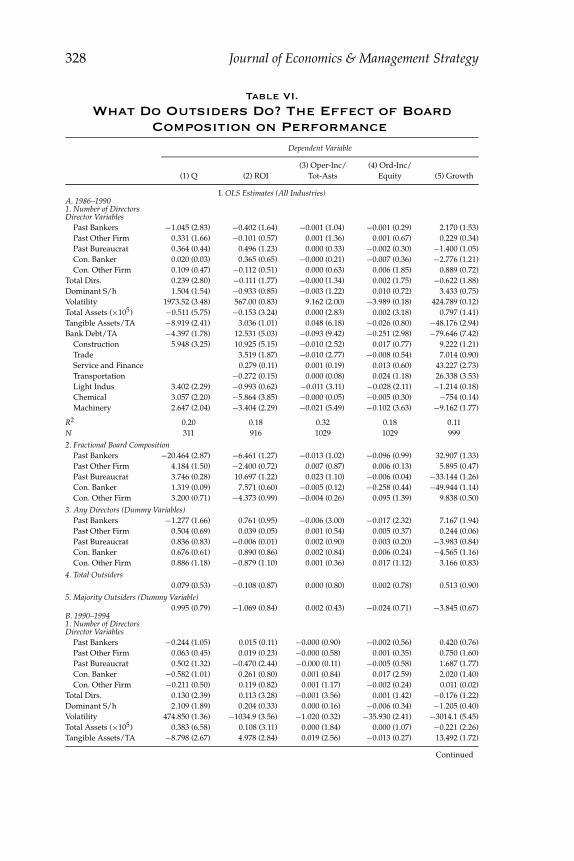
328 Journal of Economics & Management Strategy
Table VI.
What Do Outsiders Do? The Effect of BoardComposition on Performance
Dependent Variable
(3) Oper-Inc/ (4) Ord-Inc/(1) Q (2) ROI Tot-Asts Equity (5) Growth
I. OLS Estimates (All Industries)A. 1986–19901. Number of DirectorsDirector Variables
Past Bankers −1.045 (2.83) −0.402 (1.64) −0.001 (1.04) −0.001 (0.29) 2.170 (1.53)Past Other Firm 0.331 (1.66) −0.101 (0.57) 0.001 (1.36) 0.001 (0.67) 0.229 (0.34)Past Bureaucrat 0.364 (0.44) 0.496 (1.23) 0.000 (0.33) −0.002 (0.30) −1.400 (1.05)Con. Banker 0.020 (0.03) 0.365 (0.65) −0.000 (0.21) −0.007 (0.36) −2.776 (1.21)Con. Other Firm 0.109 (0.47) −0.112 (0.51) 0.000 (0.63) 0.006 (1.85) 0.889 (0.72)
Total Dirs. 0.239 (2.80) −0.111 (1.77) −0.000 (1.34) 0.002 (1.75) −0.622 (1.88)Dominant S/h 1.504 (1.54) −0.933 (0.85) −0.003 (1.22) 0.010 (0.72) 3.433 (0.75)Volatility 1973.52 (3.48) 567.00 (0.83) 9.162 (2.00) −3.989 (0.18) 424.789 (0.12)Total Assets (×105) −0.511 (5.75) −0.153 (3.24) 0.000 (2.83) 0.002 (3.18) 0.797 (1.41)Tangible Assets/TA −8.919 (2.41) 3.036 (1.01) 0.048 (6.18) −0.026 (0.80) −48.176 (2.94)Bank Debt/TA −4.397 (1.78) 12.531 (5.03) −0.093 (9.42) −0.251 (2.98) −79.646 (7.42)
Construction 5.948 (3.25) 10.925 (5.15) −0.010 (2.52) 0.017 (0.77) 9.222 (1.21)Trade 3.519 (1.87) −0.010 (2.77) −0.008 (0.54) 7.014 (0.90)Service and Finance 0.279 (0.11) 0.001 (0.19) 0.013 (0.60) 43.227 (2.73)Transportation −0.272 (0.15) 0.000 (0.08) 0.024 (1.18) 26.338 (3.53)Light Indus 3.402 (2.29) −0.993 (0.62) −0.011 (3.11) −0.028 (2.11) −1.214 (0.18)Chemical 3.057 (2.20) −5.864 (3.85) −0.000 (0.05) −0.005 (0.30) −754 (0.14)Machinery 2.647 (2.04) −3.404 (2.29) −0.021 (5.49) −0.102 (3.63) −9.162 (1.77)
R2 0.20 0.18 0.32 0.18 0.11N 311 916 1029 1029 9992. Fractional Board Composition
Past Bankers −20.464 (2.87) −6.461 (1.27) −0.013 (1.02) −0.096 (0.99) 32.907 (1.33)Past Other Firm 4.184 (1.50) −2.400 (0.72) 0.007 (0.87) 0.006 (0.13) 5.895 (0.47)Past Bureaucrat 3.746 (0.28) 10.697 (1.22) 0.023 (1.10) −0.006 (0.04) −33.144 (1.26)Con. Banker 1.319 (0.09) 7.571 (0.60) −0.005 (0.12) −0.258 (0.44) −49.944 (1.14)Con. Other Firm 3.200 (0.71) −4.373 (0.99) −0.004 (0.26) 0.095 (1.39) 9.838 (0.50)
3. Any Directors (Dummy Variables)Past Bankers −1.277 (1.66) 0.761 (0.95) −0.006 (3.00) −0.017 (2.32) 7.167 (1.94)Past Other Firm 0.504 (0.69) 0.039 (0.05) 0.001 (0.54) 0.005 (0.37) 0.244 (0.06)Past Bureaucrat 0.836 (0.83) −0.006 (0.01) 0.002 (0.90) 0.003 (0.20) −3.983 (0.84)Con. Banker 0.676 (0.61) 0.890 (0.86) 0.002 (0.84) 0.006 (0.24) −4.565 (1.16)Con. Other Firm 0.886 (1.18) −0.879 (1.10) 0.001 (0.36) 0.017 (1.12) 3.166 (0.83)
4. Total Outsiders0.079 (0.53) −0.108 (0.87) 0.000 (0.80) 0.002 (0.78) 0.513 (0.90)
5. Majority Outsiders (Dummy Variable)0.995 (0.79) −1.069 (0.84) 0.002 (0.43) −0.024 (0.71) −3.845 (0.67)
B. 1990–19941. Number of DirectorsDirector Variables
Past Bankers −0.244 (1.05) 0.015 (0.11) −0.000 (0.90) −0.002 (0.56) 0.420 (0.76)Past Other Firm 0.063 (0.45) 0.019 (0.23) −0.000 (0.58) 0.001 (0.35) 0.750 (1.60)Past Bureaucrat 0.502 (1.32) −0.470 (2.44) −0.000 (0.11) −0.005 (0.58) 1.687 (1.77)Con. Banker −0.582 (1.01) 0.261 (0.80) 0.001 (0.84) 0.017 (2.59) 2.020 (1.40)Con. Other Firm −0.211 (0.50) 0.119 (0.82) 0.001 (1.17) −0.002 (0.24) 0.011 (0.02)
Total Dirs. 0.130 (2.39) 0.113 (3.28) −0.001 (3.56) 0.001 (1.42) −0.176 (1.22)Dominant S/h 2.109 (1.89) 0.204 (0.33) 0.000 (0.16) −0.006 (0.34) −1.205 (0.40)Volatility 474.850 (1.36) −1034.9 (3.56) −1.020 (0.32) −35.930 (2.41) −3014.1 (5.45)Total Assets (×105) 0.383 (6.58) 0.108 (3.11) 0.000 (1.84) 0.000 (1.07) −0.221 (2.26)Tangible Assets/TA −8.798 (2.67) 4.978 (2.84) 0.019 (2.56) −0.013 (0.27) 13.492 (1.72)
Continued
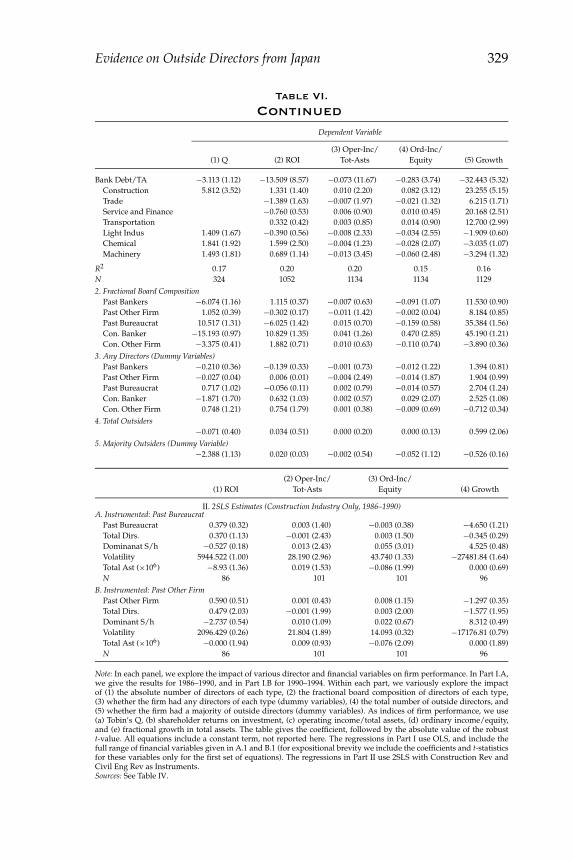
Evidence on Outside Directors from Japan 329
Table VI.
ContinuedDependent Variable
(3) Oper-Inc/ (4) Ord-Inc/(1) Q (2) ROI Tot-Asts Equity (5) Growth
Bank Debt/TA −3.113 (1.12) −13.509 (8.57) −0.073 (11.67) −0.283 (3.74) −32.443 (5.32)Construction 5.812 (3.52) 1.331 (1.40) 0.010 (2.20) 0.082 (3.12) 23.255 (5.15)Trade −1.389 (1.63) −0.007 (1.97) −0.021 (1.32) 6.215 (1.71)Service and Finance −0.760 (0.53) 0.006 (0.90) 0.010 (0.45) 20.168 (2.51)Transportation 0.332 (0.42) 0.003 (0.85) 0.014 (0.90) 12.700 (2.99)Light Indus 1.409 (1.67) −0.390 (0.56) −0.008 (2.33) −0.034 (2.55) −1.909 (0.60)Chemical 1.841 (1.92) 1.599 (2.50) −0.004 (1.23) −0.028 (2.07) −3.035 (1.07)Machinery 1.493 (1.81) 0.689 (1.14) −0.013 (3.45) −0.060 (2.48) −3.294 (1.32)
R2 0.17 0.20 0.20 0.15 0.16N 324 1052 1134 1134 11292. Fractional Board Composition
Past Bankers −6.074 (1.16) 1.115 (0.37) −0.007 (0.63) −0.091 (1.07) 11.530 (0.90)Past Other Firm 1.052 (0.39) −0.302 (0.17) −0.011 (1.42) −0.002 (0.04) 8.184 (0.85)Past Bureaucrat 10.517 (1.31) −6.025 (1.42) 0.015 (0.70) −0.159 (0.58) 35.384 (1.56)Con. Banker −15.193 (0.97) 10.829 (1.35) 0.041 (1.26) 0.470 (2.85) 45.190 (1.21)Con. Other Firm −3.375 (0.41) 1.882 (0.71) 0.010 (0.63) −0.110 (0.74) −3.890 (0.36)
3. Any Directors (Dummy Variables)Past Bankers −0.210 (0.36) −0.139 (0.33) −0.001 (0.73) −0.012 (1.22) 1.394 (0.81)Past Other Firm −0.027 (0.04) 0.006 (0.01) −0.004 (2.49) −0.014 (1.87) 1.904 (0.99)Past Bureaucrat 0.717 (1.02) −0.056 (0.11) 0.002 (0.79) −0.014 (0.57) 2.704 (1.24)Con. Banker −1.871 (1.70) 0.632 (1.03) 0.002 (0.57) 0.029 (2.07) 2.525 (1.08)Con. Other Firm 0.748 (1.21) 0.754 (1.79) 0.001 (0.38) −0.009 (0.69) −0.712 (0.34)
4. Total Outsiders−0.071 (0.40) 0.034 (0.51) 0.000 (0.20) 0.000 (0.13) 0.599 (2.06)
5. Majority Outsiders (Dummy Variable)−2.388 (1.13) 0.020 (0.03) −0.002 (0.54) −0.052 (1.12) −0.526 (0.16)
(2) Oper-Inc/ (3) Ord-Inc/(1) ROI Tot-Asts Equity (4) Growth
II. 2SLS Estimates (Construction Industry Only, 1986–1990)A. Instrumented: Past Bureaucrat
Past Bureaucrat 0.379 (0.32) 0.003 (1.40) −0.003 (0.38) −4.650 (1.21)Total Dirs. 0.370 (1.13) −0.001 (2.43) 0.003 (1.50) −0.345 (0.29)Dominanat S/h −0.527 (0.18) 0.013 (2.43) 0.055 (3.01) 4.525 (0.48)Volatility 5944.522 (1.00) 28.190 (2.96) 43.740 (1.33) −27481.84 (1.64)Total Ast (×106) −8.93 (1.36) 0.019 (1.53) −0.086 (1.99) 0.000 (0.69)N 86 101 101 96
B. Instrumented: Past Other FirmPast Other Firm 0.590 (0.51) 0.001 (0.43) 0.008 (1.15) −1.297 (0.35)Total Dirs. 0.479 (2.03) −0.001 (1.99) 0.003 (2.00) −1.577 (1.95)Dominant S/h −2.737 (0.54) 0.010 (1.09) 0.022 (0.67) 8.312 (0.49)Volatility 2096.429 (0.26) 21.804 (1.89) 14.093 (0.32) −17176.81 (0.79)Total Ast (×106) −0.000 (1.94) 0.009 (0.93) −0.076 (2.09) 0.000 (1.89)N 86 101 101 96
Note: In each panel, we explore the impact of various director and financial variables on firm performance. In Part I.A,we give the results for 1986–1990, and in Part I.B for 1990–1994. Within each part, we variously explore the impactof (1) the absolute number of directors of each type, (2) the fractional board composition of directors of each type,(3) whether the firm had any directors of each type (dummy variables), (4) the total number of outside directors, and(5) whether the firm had a majority of outside directors (dummy variables). As indices of firm performance, we use(a) Tobin’s Q, (b) shareholder returns on investment, (c) operating income/total assets, (d) ordinary income/equity,and (e) fractional growth in total assets. The table gives the coefficient, followed by the absolute value of the robustt-value. All equations include a constant term, not reported here. The regressions in Part I use OLS, and include thefull range of financial variables given in A.1 and B.1 (for expositional brevity we include the coefficients and t-statisticsfor these variables only for the first set of equations). The regressions in Part II use 2SLS with Construction Rev andCivil Eng Rev as Instruments.Sources: See Table IV.
330 Journal of Economics & Management Strategy
in the data: just as large boards are associated with significantly higherTobin’s Q, they seem to be associated with lower Growth rates. In the laterperiod (Panel B.1), large boards are again associated with higher Q, butnow with higher ROI and lower Operating-Income/TA as well.
4.2.4 OLS, 1986–1990The only statistically significant coefficient on a director variable for theentire first set of 1986–1990 regressions (Panel I.A.1) appears in the firstcolumn: ex-bankers are negatively associated with high Tobin’s Q. InPanel I.A.2, we substitute for the actual number of outside directors ofeach type their fractional representation on the board. The results mirrorthose of Panel I.A.1.
When we substitute a dummy variable for whether a firm has anydirector of a given type, the significance of the banker coefficient disap-pears. Instead, bankers now are associated with both lower accountingearnings and higher Growth rates (Panel I.A.3.). When we substitute forthese director-type variables (i) a general variable for the total numberof outside directors (Panel I.A.4.), or (ii) a dummy for the presence ofa majority of outside directors, the results are uniformly insignificant(Panel I.A.5).
4.2.5 OLS, 1990–1994Our regressions on early 1990s data (Panel B) similarly fail to show anyobservable effect of board composition on performance. The numberof Past Bankers is no longer associated with any significant results,but two other results now haphazardly appear: (a) Past Bureaucratsare associated with lower shareholder ROI, and (b) Concurrent (butnot Past) Bankers are associated with higher Ordinary-Inc/Equation. Inregressions using fractional board composition and dummy variables,Concurrent Bankers remain associated with higher Ordinary-Income/Eq,but the observable effect of Past Bureaucrats disappears. In regressionsusing dummy variables indicating the presence of any directors of agiven type, Concurrent Bankers are still associated with higher Ordinary-Income/Eq, but directors from other firms are now associated with lowerOperating-Income/TA.
As with the earlier period, the regressions using either the TotalOutside Directors or a Majority Outside Directors dummy are uniformlyinsignificant.28
28. Regressions on the composition of the executive board appear different, but onlysuperficially so. Although Concurrent Bankers are associated with higher stock-market (andaccounting data) performance, the regressions mislead. Of the firms for which we have Qdata, only one had a current banker on its executive board in 1985, and only two had suchan executive director in 1990. In 1986–1990, all coefficients on executive directors other
Evidence on Outside Directors from Japan 331
4.2.6 ChangesWe also asked whether changes in the number of outside directorswere associated with changes in performance. Given the poor fit of thedirector variables in Table VI, one would not expect changes in suchvariables to be observably associated with performance changes—andso we find. Instead, in these regressions (we do not have change in ROIdata), most calculated coefficients are insignificant, and those that aresignificant are haphazard.
Thus, increases in Past Bankers are associated with higher Qand lower Ordinary-Income/Eq, but only for 1986–1990. Increases inConcurrent Bankers are also associated with lower Ordinary-Income/Eq,but increases in Concurrent Other Firm directors are associated withhigher Ordinary-Income/Eq, and Past Other Firm directors are associatedwith higher Growth. All other coefficients on changes in the specificdirector variables are insignificant. Increases in Total Outside Directorsare associated with higher Growth rates for both periods, but otherwiseyield only insignificant results.
4.2.7 Instrumental VariablesWhen observers argue that Japanese firms maintain a suboptimal num-ber of outside directors, in effect they argue that Japanese firms do notpick their directors with an eye on expected performance. Accordingly,to test their claims we rely on the OLS regressions in Table VI. Mostscholars who test the analogous claims in the United States similarly useOLS, and—in the article that spawned this literature—so do Demsetzand Lehn.
Nonetheless, for a subset of our sample we offer 2SLS estimatesas well. Although we lack suitable instruments for the whole sample,Table IV suggests that revenue data might instrument the constructionfirm directors. Accordingly, we treat Past Bureaucrat and Past Other Firmas endogenous, and instrument them through Construction Rev and CivilEng Rev (Table VI, Panel II). These revenue measures are not themselvesassociated with higher or lower profitability, and as instruments haveacceptable levels of power. According to Stock and Watson (2003, p. 350),we “do not need to worry about weak instruments if the first-stage F-statistic exceeds 10.” In the regressions on Past Bureaucrat the first-stageF-statistic is 16.23, and in those on Past Other Firm is 13.40.
Because Past Bureaucrat and Past Other Firm involve count data, wewould prefer to use Poisson to OLS. Unfortunately, using the Poissonestimates for the first stage of an instrumental variables framework
than Concurrent Bankers are insignificant. In 1990–1994, Past Bureaucrats are associatedwith lower shareholder ROI and Concurrent Other Firm directors are associated with lowerOperating-Income/TA.
332 Journal of Economics & Management Strategy
creates its own econometric problems. As a proxy for the Poissonpredicted values, we thus use OLS. In fact, however, OLS and Poissonregressions of board composition on the two revenue variables generatemuch of the same predicted values: for Past Other Firm, the correlationcoefficient between the OLS and the Poisson predicted values is 0.99,and for Past Bureaucrat is 0.98.
We report our 2SLS results in Table VI Panel II. Uniformly, theyconfirm the endogeneity that economic theory predicts: regressingperformance on board composition yields no significant results. None ofthe coefficients on either Past Bureaucrat or Past Other Firm is statisticallysignificant.
4.2.8 ConclusionConsistent with the logic of market competition, outside directors in ourdatabase are not observably associated with higher performance. Fromthis, we conclude that firms may be appointing outsiders at levels closeto their firm-specific optimum.
We urge readers not to “overinterpret” the “significant” coeffi-cients that we do obtain. According to Table VI Panel I, in one regressionor another retired bankers are “significantly” associated with lower Q,Operating-Income/TA, and Ordinary-Income/Eq, but with higher Growth;bankers who have not yet quit their banking posts are associated withhigher Ordinary-Income/Eq. Directors from other firms are associated withlower Ordinary-Income/TA, and retired bureaucrats with lower ROI.
These effects strike us simply as haphazard. Of the 170 calculatedcoefficients on director variables, we have results that are “statisticallysignificant” at the 5% level in 9—or 5% of our cases. Rather thanexplain the “significant” coefficients as a function of what these directorsaccomplished, we assign the “significance” to random variation.
5. Summary
As in the United States, so too in Japan: reformers urge firms to appointmore outside directors. Yet as in the United States, so too in Japan: thelogic of market competition should make us wonder. Provided boardsmatter, by standard economic theory market competition should drivefirms toward their firm-specifically optimal board structure.
That optimum need not involve many outside directors. After all,some outsiders may trade firm-specific expertise for their independence.If expertise specific to the firm matters, then the optimal fraction ofoutside directors will not equal 1. Instead, it will vary from industry toindustry, firm to firm. Where knowledge specific to the firm mattersmore than independence, firms will appoint more inside directors.
Evidence on Outside Directors from Japan 333
Where independence matters more than such firm-specific expertise,they will appoint more outsiders.
All this suggests testable alternatives. If the reformists are right,then Japanese firms have inefficiently few outsiders. Provided at leastsome substantial minority of the firms have outsiders, then those firmswith more outsiders should observably outperform those with fewer. Bycontrast, if market constraints drive firms toward their firm-specific op-timum, then firm characteristics should determine board structure, butthat structure should show no observable relation to firm performance.
To test these hypotheses, we assemble board composition andfinancial data on the largest Japanese firms—the approximately 1000firms listed in section 1 of the Tokyo Stock Exchange in the 1980s andearly 1990s. We first explore which firms appoint outsiders. We findthat the firms themselves seem to think board composition matters.They most often appoint retired bankers when they borrow heavily,when the firm has fewer mortgageable assets, or when the firm isin the service and finance industry. They appoint retired governmentbureaucrats when they are in construction, and sell a large fraction oftheir output to government agencies. And they appoint other retiredexecutives when they have a dominant parent corporation, or when theyare in the construction industry selling heavily to the private sector.
Firms with more outside directors do not visibly outperform thosewith fewer. When we regress firm performance on board composition,we largely obtain insignificant results. The statement holds whetherwe use OLS or 2SLS and whether we examine the go–go 1980s orthe depressed 1990s, and the few significant results are not robust toalternative specifications. Firms with more outside directors simply donot observably outperform those with fewer. Apparently, board compo-sition may indeed be endogenous: market constraints may indeed pushfirms toward their firm-specifically optimal board structure.
References
Abe, Y., 1997, “Chief Executive Turnover and Firm Performance in Japan,” Journal ofJapanese and International Economies, 11, 2.
Agrawal, A. and C.R. Knoeber, 1996, “Firm Performance and Mechanisms to ControlAgency Problems between Managers and Shareholders,” Journal of Finance and Quan-titative Analysis, 31, 377.
—— and ——, 2001, “Do Some Outside Directors Play a Political Role?,” Journal of Lawand Economics, 44, 179.
Aoki, M., 1988, Information, Incentives, and Bargaining in the Japanese Economy, Cambridge,UK: Cambridge University Press.
——, 2000, Information, Corporate Governance, and Institutional Diversity: Competitiveness inJapan, the USA, and the Transitional Economies, Oxford: Oxford University Press.
334 Journal of Economics & Management Strategy
——, H Patrick, and P. Sheard, 1994, “The Japanese Main Bank System: An IntroductoryOverview,” in M. Aoki and H. Patrick, eds., The Japanese Main Bank System, Vol. 1,Oxford: Oxford University Press.
Asako, K., et al., 1997, “Setsubi Toshi to tochi toshi: 1977–1994 [Investment in Equipment andInvestment in Land: 1977–1994],” in K. Asako and M. Otaki, eds., Gendai makuro keizaidogaku [Contemporary Macro-economic Dynamics], Tokyo: University of TokyoPress, 1997.
Bainbridge, S.M., 2002, Corporation Law and Economics, New York: Foundation.Bathala, C.T. and R.P. Rao, 1995, “The Determinants of Board Composition: An Agency
Theory Perspective,” Managerial and Decision Economics, 16, 59.Baysinger, B.D. and H.N. Butler, 1985, “Corporate Governance and the Board of Directors:
Performance Effects of Changes in Board Composition,” Journal of Law, Economics andOrganization, 1, 101.
Beatty, R. and E.J. Zajac, 1994, “Managerial Incentives, Monitoring, and Risk Bearing: AStudy of Executive Compensation, Ownership, and Board Structure in Initial PublicOfferings,” Administrative Science Quarterly, 39, 313.
Bhagat, S. and B. Black, 1999, “The Uncertain Relationship Between Board Compositionand Firm Performance,” Business Lawyer, 54, 921.
Black, B, 2001, “Does Corporate Governance Matter? A Crude Test Using Russian Data,”University of Pennsylvania Law Review, 149, 2131–2150.
——, H. Jang, and W. Kim, 2003, “Does Corporate Governance Predict Firms’ MarketValues? Evidence from Korea,” Stanford Law School Olin Program Working PaperNo. 237.
Blumenthal, T., 1985, “The Practice of Amakudari within the Japanese EmploymentSystem,” Asian Survey, 25, 310.
Brickley, J.A. and C.M. James, 1987, “The Takeover Market, Corporate Board Composition,and Ownership Structure: The Case of Banking,” Journal of Law and Economics, 30, 161.
Business Roundtable, 1999, Statement on Corporate Governance.Cable, J., 1985, “Capital Market Information and Industrial Performance: The Role of West
German Banks,” Economic Journal, 95, 118.Calder, K.E., 1989, “Elites in an Equalizing Role: Ex-Bureaucrats as Coordinators and In-
termediaries in the Japanese Government-Business Relationship,” Comparative Politics,21, 379.
CalPERS, 1998, Corporate Governance Core Principles and Guidelines: The United States,Available at www.calpers governance.org.
Clark, R.C., 1986, Corporate Law, Boston: Little, Brown.Dalton, D.R., et al., 1998, “Meta-Analytic Reviews of Board Composition, Leadership
Structure, and Financial Performance,” Strategic Management Journal, 19, 269.Demsetz, H. and K. Lehn, 1985, “The Structure of Corporate Ownership,” Journal of Political
Economy, 93, 1155.Dore, R.P., 2000, Stock Market Capitalism: Welfare Capitalism—Japan and Germany versus the
Anglo-Saxons, Oxford: Oxford University Press.Ezzamel, M.A. and R. Watson, 1993, “Organizational Form, Ownership Structure and
Corporate Performance: A Contextual Empirical Analysis of UK Companies,” BritishJournal of Management, 4, 161.
Fama E.F, 1998, “Market Efficiency, Long-term Returns, and Behavioral Finance,” Journalof Financial Economics, 49, 283–306.
—— and M.C. Jensen, 1983, “Separation of Ownership and Control,” Journal of Law andEconomics, 26, 301.
Gompers, P.A., J.L. Ishii, and A. Metrick, 2003, “Corporate Governance and Equity Prices,”Quarterly Journal of Economics, 118, 107–155.
Evidence on Outside Directors from Japan 335
Hall, B.J. and D.E. Weinstein, 2000, “Main Banks, Creditor Concentration, and theResolution of Financial Distress in Japan,” in M. Aoki and G.R. Saxonhouse, Fi-nance, Governance, and Competitiveness in Japan, Vol. 64, Oxford: Oxford UniversityPress.
Hayashi, F., 2000, “The Main Bank System and Corporate Investment: An Empirical Re-assessment,” in M. Aoki and G.R. Saxonhouse, Finance, Governance, and Competitivenessin Japan, Oxford: Oxford University Press.
Hermalin, B.E. and M.S. Weisbach, 1998, “Endogenously Chosen Boards of Directors andTheir Monitoring of the CEO,” American Economic Review, 88, 96–118.
—— and ——, 2003, “Boards of Directors as an Endogenously Determined Institution: ASurvey of the Economic Literature,” Economic Policy Review, 9, 7.
Herman, E.S., 1981, Corporate Control, Corporate Power, Cambridge: Cambridge UniversityPress.
Himmelberg, C.P., R.G. Hubbard, and D. Palia, 1999, “Understanding the Determinants ofManagerial Ownership and the Link Between Ownership and Performance,” Journalof Financial Economics, 53, 353–384.
Holderness, C.G., R.S. Kroszner, and D.P. Sheehan, 1999, “Were the Good Old Days ThatGood? Changes in Managerial Stock Ownership since the Great Depression,” Journalof Finance, 54, 435–469.
Horiuchi, A. and K. Shimizu, 2001, “Did Amakudari Undermine the Effectiveness ofRegulator Monitoring in Japan?,” Journal of Banking and Finance, 25, 573.
Hoshi, T., 1998, “Japanese Corporate Governance as a System,” in K.J. Hopt, et al., eds.,Comparative Corporate Governance: The State of the Art and Emerging Research, Oxford:Oxford University Press.
Hutchinson, M., 2002, “An Analysis of the Association Between Firms’ InvestmentOpportunities, Board Composition, and Firm Performance,” Asia-Pacific Journal ofAccounting and Economics, 9.
Japan Corporate Governance Forum, 1998, Koporeeto gabanansu gensoku [Principles ofCorporate Governance], Available at www.jcgf.org/jp.
Jensen, M. and J. Warner, 1988, “The Distribution of Power Among Corporate Managers,Shareholders, and Directors,” Journal of Financial Economics, 20, 3.
Kaplan, S.N. and B.A. Minton, 1994, “Appointments of Outsiders to Japanese Boards:Determinants and Implications for Managers,” Journal of Financial Economics, 36,225.
——, 1994, “Top Executive Rewards and Firm Performance: A Comparison of Japan andthe United States,” Journal of Political Economy 102, 510.
Kesner, I.F., 1987, “Directors’ Stock Ownership and Organizational Performance: AnInvestigation of Fortune 500 Companies,” Journal of Management, 13, 499.
Kester, W.C., 1993, “Banks in the Board Room: Japan, Germany, and the United States,”in S.L. Hayes III, ed., Financial Services: Perspectives and Challenges, Boston: HarvardBusiness School Press.
Klein, A., 1998, “Firm Performance and Board Committee Structure,” Journal of Law andEconomics, 41, 275.
Kosei torihiki iinkai, ed., 1994, Kosei torihiki iinkai nenji hokoku [Fair Trade CommissionAnnual Report], Tokyo: Kosei torihiki iinkai.
Mayers, D, A. Shivdasani, and C.W. Smith Jr., 1997, “Board Composition and CorporateControl: Evidence from the Insurance Industry,” Journal of Business, 70, 33.
Milhaupt, C.J. and M West, 2003, “Institutional Change and M&A in Japan: Diversitythrough Deals,” in C.J. Milhaupt, ed., Global Markets, Domestic Institutions: CorporateLaw and Governance in a New Era of Cross-Border Deals, New York: Columbia UniversityPress.
336 Journal of Economics & Management Strategy
Miwa, Y. 1998, “Torishimari yaku kai to torishimari yaku [Boards of Directors andDirectors],” in Y. Miwa, et al., eds., Kaisha ho no keizaigaku [The Economics of CorporateLaw], Tokyo: University of Tokyo Press.
—— and J.M. Ramseyer, 2002a, “Banks and Economic Growth: Implications fromJapanese History,” Journal of Law and Economics, 45, 127–164.
—— and ——, 2002b, “The Fable of the Keiretsu,” Journal of Economics and ManagementStrategy, 11, 169–224.
—— and ——, 2002c, “The Myth of the Main Bank: Japan and Comparative CorporateGovernance,” Law and Social Inquiry, 27, 401–424.
—— and ——, 2003a, “Does Ownership Matter? Evidence from the Zaibatsu DissolutionProgram,” Journal of Economics and Management Strategy, 12, 67–89.
—— and ——, 2003b, “Financial Malaise and the Myth of the Misgoverned Bank,” in C.J.Milhaupt, ed., Global Markets, Domestic Institutions: Corporate Law and Governance in aNew Era of Cross-Border Deals, New York: Columbia University Press, pp. 339–372.
—— and ——, 2004, “Directed Credit? The Loan Market in High-Growth Japan,” Journalof Economics and Management Strategy, 13, 171.
—— and ——, 2005a, “Does Relationship Banking Matter? The Myth of the Japanese MainBank,” Journal of Empirical Legal Studies, 2, forthcoming.
—— and ——, 2005b, “Conflicts of Interest in Japanese Insolvencies: The Problem of BankRescues,” Theoretical Inquiries in Law, forthcoming.
Monks, R.A.G. and N. Minow, 1995, Corporate Governance, Oxford: Blackwell.Morck, R., A. Shleifer, and R.W. Vishny, 1988, “Management Ownership and Market
Valuation: An Empirical Analysis,” Journal of Financial Economics, 20, 293–315.——, M. Nakamura, and A. Shivdasani, 2000, “Banks, Ownership Structure, and Firm
Value in Japan,” Journal of Business, 73, 539.Myers, S.C., 2001, “Capital Structure,” Journal of Economic Perspectives, 15(2), 81.Nihon shoken keizai kenkyu jo, ed., as updated, Kabushiki toshi shueki ritsu [Rates of Return
on Common Stocks], Tokyo: Nihon shoken keizai kenkyu jo.Nikkei QUICK joho, K.K., as updated, NEEDS, Tokyo: Nikkei QUICK joho.——, as updated, QUICK, Tokyo: Nikkei QUICK joho.NYSE Corporate Accountability and Listing Standards Committee, Report, June 6, 2002.Okimoto, D.I., 1989, Between MITI and the Market: Japanese Industrial Policy for High
Technology, Stanford, CA: Stanford University Press.Romano, R., 1991, “The Shareholder Suit: Litigation without Foundation?,” Journal of Law,
Economics and Organization, 7, 55.——, 1996, “Corporate Law and Corporate Governance,” Industrial and Corporate Change,
5, 277.——, 2001, “Less is More: Making Institutional Investor Activism a Valuable Mechanism
of Corporate Governance,” Yale Journal of Regulation, 18, 174.Schaede, U., 1994, “Understanding Corporate Governance in Japan: Do Classical Concepts
Apply?,” Industrial and Corporate Change, 3, 285.——, 1995, “The ‘Old Boy’ Network and Government-Business Relationship in Japan,”
Journal of Japanese Studies, 21, 293.Sheard, P., 1994, “Reciprocal Delegated Monitoring in the Japanese Main Bank System,”
Journal of Japanese and International Economies, 8, 1.——, 1996, “Banks, Blockholders and Corporate Governance: The Role of External Ap-
pointees to the Board,” in P. Sheard, ed., Japanese Firms, Finance and Markets, Melbourne:Addison-Wesley.
Stock, J.H. and M.W Watson, 2003, Introduction to Econometrics, Boston: Addison-Wesley.TIAA-CREF, 2000, Policy Statement on Corporate Governance, Available at www.tiaa-
cref.org/libra/governance.
Evidence on Outside Directors from Japan 337
Toyo keizai, ed., as updated, Kigyo keiretsu soran [Firm Keiretsu Overview], Tokyo: Toyokeizai.
Toyo keizai, relevant issues, Kaisha shikiho [Seasonal Corporate News], Tokyo: Toyo keizai.van Rixtel, A.A.R.J.M. and W.H.J. Hassink, “Monitoring the Monitors: Are Old Boys
Networks Being Used to Monitor Japanese Private Banks?,” Journal of Japanese andInternational Economies, 16, 1.
van Wolferen, K., 1989, The Enigma of Japanese Power, New York: Vantage.Vance, S.C., 1978, “Corporate Governance: Assessing Corporate Performance by Board-
room Attributes,” Journal of Business Research, 6, 203.West, M.D., 2001, “Why Shareholders Sue: The Evidence from Japan,” Journal of Legal
Studies, 30, 351.Woodall, B, 1996, Japan Under Construction: Corruption, Politics, and Public Works, Berkeley,
CA: University of California Press, 1996.

![IB+ Outside Sensor Box Outside Sensor Extension Box · animeo IB+ OUTSIDE SENSOR BOX. REF. 5060202F - 7/12 A KUVAT [1] IB+ Outside Sensor Box [2] IB+ Outside Sensor Extension Box](https://img.pdfslide.tips/doc/110x75/5b0805827f8b9ac90f8bf55b/ib-outside-sensor-box-outside-sensor-extension-box-ib-outside-sensor-box-ref.jpg)