Embed Size (px)
Citation preview
FASD 10-‐Year Strategic Plan Year 7 FASD Service Network Evaluation Edmonton and Area Fetal Alcohol Network
July 22, 2014
Hélène Wirzba Christopher Cameron Wirzba Consulting Inc. Objective Research and Evaluation Inc.
Acknowledgements The Year-‐7 FASD Service Network Evaluation would not have been possible without the guidance, support and help of many individuals and organizations. We extend our thanks to Alberta Human Services, Disability Services Division, FASD Unit, and to the Prairie Central FASD Network for their managerial and financial support. We have appreciated the Evaluation Steering Committee’s guidance over the project period. We express our gratitude to each of the twelve Alberta FASD Networks, Network Coordinators, Leadership Team members, and FASD service providers all over Alberta, for taking the time to share their knowledge and insight, to participate in the focus group discussions, and to collect the required evaluation data. The thoughts, quotes and stories shared by children, youth, men and women whose lives were changed because of the Alberta FASD Service Networks are extremely valuable, as they illustrate and corroborate other findings. It is our hope that the evaluation findings and recommendations in this report will contribute to improving FASD services across Alberta. Hélène Wirzba & Christopher Cameron May 2014
Table of Contents
Acknowledgements ...................................................................................................... 2
1. Executive Summary ................................................................................................ i 1.1. Service Network .............................................................................................................................................. i 1.2. Prevention ........................................................................................................................................................ ii 1.3. Assessment and Diagnosis ...................................................................................................................... iii 1.4. Support Services ........................................................................................................................................... iv 1.5. Awareness ........................................................................................................................................................ v 1.6. Conclusion ....................................................................................................................................................... vi
2. Introduction .......................................................................................................... 1 2.1. Alberta FASD 10-‐Year Strategic Plan and FASD Service Networks ......................................... 1 2.2. FASD-‐CMC Strategic and Operational Plan 2013/2014 ............................................................... 1 2.3. Development of Alberta FASD Service Network Evaluation Frameworks ........................... 1 2.4. Year 7 FASD Network Evaluation Team and Steering Committee ........................................... 2 The Evaluation Team ............................................................................................................................................... 2 Role of Evaluation Steering Committee ........................................................................................................... 2
2.5. Evaluation Methodology and Tools ....................................................................................................... 2 Focus Groups and Narrative Reports ................................................................................................................ 2 Online Reporting System (ORS) ........................................................................................................................... 2 Surveys and Templates ............................................................................................................................................ 4
2.6. Limitations ....................................................................................................................................................... 5
3. Service Network Outcomes ................................................................................... 6 3.1. Logic Model – FASD Service Network ................................................................................................... 6 3.2. Outputs ............................................................................................................................................................... 7 3.3. Review of Year 5 Compliance Guideline Recommendations ...................................................... 7 3.4. Outcome #1: Collaboration ....................................................................................................................... 9 Narrative Report and Focus Group Findings ................................................................................................. 9 Survey Findings ......................................................................................................................................................... 10
3.5. Outcome #2: Stakeholder Engagement ............................................................................................ 11 Narrative Report and Focus Group Findings ............................................................................................... 11 Survey Findings ......................................................................................................................................................... 12
3.6. Outcome #3: Training .............................................................................................................................. 13 Narrative Report and Focus Group Findings ............................................................................................... 13 Stakeholder Survey Findings ............................................................................................................................... 14
3.7. Outcome #4: Practice Informed by Research and Evaluation ................................................ 15 Narrative Report and Focus Group Findings ............................................................................................... 15 Stakeholder Survey Findings ............................................................................................................................... 15
3.8. Discussion related to Service Network Outcomes ....................................................................... 16
4. FASD Indicated and Targeted Prevention ............................................................. 18 4.1. Logic Model ................................................................................................................................................... 18 4.2. Outputs ............................................................................................................................................................ 19 4.3. Outcome #1: Reduction in Alcohol and Substance Abuse ........................................................ 19 ORS Findings .............................................................................................................................................................. 19
PCAP Data Outcome Reporting Tool Overview ........................................................................................... 21 4.4. Outcome #2: Increase in Birth Control and Family Planning Methods .............................. 22 ORS Findings .............................................................................................................................................................. 22 PCAP Data Outcome Reporting Tool ............................................................................................................... 22
4.5. Outcome #3: Access to Information and Supports ...................................................................... 23 Advocate-‐Client Relationship Inventory Overview .................................................................................... 23
4.6. Outcome #4: Improvement in Well Being ....................................................................................... 24 Advocate-‐Client Relationship Inventory ........................................................................................................ 24 ORS Findings .............................................................................................................................................................. 25
4.7. Outcome #5: Decrease in Placement Disruption .......................................................................... 26 4.8. Outcome #6: Client Satisfaction, Involvement and Retention ................................................ 26 4.9. Other Prevention Outcomes .................................................................................................................. 27 4.10. Discussion Related to FASD Indicated and Targeted Prevention ....................................... 27
5. FASD Assessment and Diagnosis .......................................................................... 29 5.1. Logic Model ................................................................................................................................................... 29 5.2. Outputs ............................................................................................................................................................ 30 5.3. Outcome #1: Understanding of FASD ................................................................................................ 30 5.4. Outcome #2: Knowledge of Supports and Services in the Community .............................. 32 5.5. Outcome #3: Referral to Recommended Supports ...................................................................... 33 5.6. Outcome #4: Client Satisfaction, Involvement and Retention ................................................ 34 5.7. Other Outcomes: ......................................................................................................................................... 36 5.8. Discussion Related to Assessment and Diagnosis ........................................................................ 36 6. FASD Support Services ......................................................................................... 38 6.1. Logic Model ................................................................................................................................................... 38 6.2. Outputs ............................................................................................................................................................ 39 Focus groups and Narrative Report Findings ............................................................................................. 39 ORS Findings .............................................................................................................................................................. 40
6.3. Outcome #1: Individuals with an FASD’ Services Based on their Needs ........................... 41 6.4. Outcome #2: Individuals with an FASD have Knowledge and Access to Community Resources ................................................................................................................................................................... 41 Survey Findings ......................................................................................................................................................... 41 Discussion / Summary Statement ..................................................................................................................... 43
6.5. Outcome #3: Individuals with an FASD Experience Improvement in Well-‐Being ......... 44 Survey Findings ......................................................................................................................................................... 44 ORS Findings – Support Services to Children, 0-‐12 years old ............................................................... 45 ORS Findings – Support Services for Youth, Ages 13 to 17 .................................................................... 46 ORS Findings -‐ Support Services for Young Adults, Ages 18 to 24 ...................................................... 47 ORS Findings -‐ Support Services to adults, 25+ years old ....................................................................... 48
6.6. Outcome #4: Caregivers of Individuals with an FASD have Knowledge of and Access to Community Resources .......................................................................................................................................... 49 6.7. Outcome #5: Caregivers of Individuals with an FASD have access to respite care, peer and professional supports ................................................................................................................................... 49 6.8. Outcome #6: Caregivers of Individuals with an FASD Improved well-‐Being ................... 50 Survey Findings ......................................................................................................................................................... 50 ORS Findings – Support for caregivers ........................................................................................................... 51
6.9. Outcome #7: Client Satisfaction, Involvement and Retention ................................................ 52 6.10. Other Outcomes ........................................................................................................................................ 53 6.11. Discussion Related to Support Services ......................................................................................... 54
7. FASD Universal Awareness .................................................................................. 56 7.1. Logic Model ................................................................................................................................................... 56 7.2. Outputs ............................................................................................................................................................ 57 7.3. Outcome # 1: Increased Knowledge about the Effects of Alcohol Use ................................ 58 7.4. Outcome # 2: Increased Understanding of FASD ......................................................................... 59 7.5. Outcome # 3: Changes in Attitude about / Stigma Attached to FASD ................................. 60 7.6. Outcome # 4: Knowledge about Caring for / Supporting someone with FASD .............. 60 7.7. Outcome # 5: Client Satisfaction, Involvement and Retention ............................................... 61 7.8. Outcome #8: Staff Training, Supervision and Retention ........................................................... 61 7.9. Other Outcomes .......................................................................................................................................... 62 7.10. Discussion Related to Universal Awareness ................................................................................ 62 8. Appendices ......................................................................................................... 64 8.1. Focus Group Participants ........................................................................................................................ 64 8.2. Documents reviewed ................................................................................................................................ 64
Year 7 FASD Service Network Evaluation EFAN Evaluation Report
July 23, 2014 i
1. Executive Summary The Alberta Year-‐7 FASD Service Network Evaluation took place in 2013-‐14 and was based on the FASD Service Network Evaluation Frameworks developed in 2012-‐13. The deliverables included a Provincial Service Network Evaluation Report as well as Service Network-‐specific evaluation reports. This document summarizes findings and recommendations specific to the Edmonton FASD Service Network (EFAN).
1.1. Service Network Since the Year-‐5 evaluation, EFAN moved from an informal leadership structure to becoming a Society with a Governance Board. There have been few changes in the governance structure as a result of the incorporation, except for the additional responsibilities related to the incorporation. EFAN continued to have an excellent alignment with the non-‐service delivery aspects of the FASD Service Network Program Guidelines. They have addressed all the recommendations made during the year-‐5 evaluation. They have successfully transitioned from their previous informal governance structure to becoming a registered Society. EFAN operates according to four values: collaboration, responsiveness, diversity and accountability. The Network has increased and broadened its membership to over 50 members in the past two years. EFAN funds less than half of all FASD programs offered in Edmonton, and only about 40 percent of EFAN’s current members received funding through EFAN, demonstrating that the Network continued to be successful in promoting collaboration and stakeholder engagements. EFAN hosted monthly half-‐day meetings with its members, which were well attended. Responses to the Stakeholder Survey questions related to collaboration were positive. Respondents demonstrated a belief in their Leadership Team’s ability to govern and lead their Network. Additionally, survey respondents believed that their Network was responsive to regional needs and commitment to offering FASD services across the lifespan. Collaboration with Aboriginal and other cultural communities appeared to be a commitment that the Network was making. Focus group participants gave multiple examples of how EFAN promoted stakeholder engagement. Stakeholder survey respondents confirmed the information, indicating that their Networks fostered collaboration, actively listened to member’s opinions, and valued their input. They said that their Network was responsive to the needs of diverse populations and facilitated the development of new partnerships with others in their region with a stake in the FASD community. Finally, they strongly believed that their Network was proactive increasing awareness of FASD in their region. Information available from focus groups, narrative reports and the stakeholder survey demonstrated that EFAN successfully promoted FASD training in its target area, for persons affected by FASD, professionals and the general public. Survey respondents believed that their Network facilitated meaningful information sharing, that training and educational resources offered by their Network were based on research and other leading practices, and that their participation in training offered through their Network had increased their understanding of FASD and that their ability to provide proper care and support to persons affected by FASD had improved. Findings from the focus groups, the narrative report and the stakeholder survey confirmed that EFAN was aware of community issues relevant to FASD and that community needs assessments, research, and evaluation findings were used to guide their Networks’ work. Some of EFAN’s members were actively engaged in research activities.
Year 7 FASD Service Network Evaluation EFAN Evaluation Report
July 23, 2014 ii
EFAN’s stakeholder responses had higher agreement rates for all questions related to collaboration, stakeholder engagement, training, and evaluation & research than the combined responses of all Networks’ stakeholders. Based on these findings, there is ample evidence that EFAN continues to have a strong governance structure, and is successfully meeting all Service Network outcomes. There is no specific recommendation for EFAN’s Governance Model.
1.2. Prevention In 2012-‐13, 58 women accessed Parent Child Assistance Prevention (PCAP) programming through EFAN funding. A total of 33 new client files were created in ORS for PCAP clients between June 2012 and October 2013. Even though PCAP is a 3-‐Year program, ORS data suggests that only 77% of the original client files remained active in the subsequent reporting period (4-‐6 months), 44% in the 6-‐9 months reporting period, and 36% in the 10-‐12 months reporting period. It is unknown whether clients exited the program early, or whether there were problems with ORS data entry. The PCAP Outcome Reporting Tool developed for the Year-‐7 evaluation had data for 36 PCAP clients, of which 17 were in their first year, 8 in their second and 11 in their 3rd year of the program. Recommendation: EFAN should discuss the apparent low retention rates of PCAP clients with its service providers, and if confirmed, discuss how retention rates could be increased. According to ORS data, EFAN’s pregnant PCAP clients appeared more likely to consume alcohol and/or drugs while pregnant than all Alberta PCAP clients but there was a decrease in alcohol consumption between the first and second reporting period. The percentage of women who decreased or eliminated alcohol use during the first quarter in the program was similar for EFAN as for consolidated results. There was no apparent decrease in the percentage of women using drugs between the first and second reporting period. The percentage of women who decreased or eliminated drug use during the first quarter in the program was similar for EFAN as for all FASD Networks. According to the PCAP Outcome Reporting Tool, EFAN’s PCAP clients were slightly less likely to have abstained from drugs and alcohol for at least one month than all FASD Network PCAP clients. Based on ORS data, the percentage of non-‐pregnant women successfully alcohol-‐exposed pregnancies by having an effective birth control method and/or not drinking alcohol was 89% during their first 3 months in the program, 85% for women who had been in the program for 4 to 6 months, and 100 percent for women in the program for 7 to 12 months. This result is based on a very small number of women and may not be representative of all women ever enrolled with PCAP in EFAN’s target area. Based on the PCAP Outcome Reporting tool, of the known 34 non-‐pregnant women, only 14 in total (41%) were using an effective birth control method. The percentage of non-‐pregnant women who were effectively using a birth control method was very low in the 1st and 2nd year of the program (17% and 33%), but increased to 80% in the 3rd year. Of the 34 non-‐pregnant women not using an effective birth control method, 1 abstained from alcohol for at least month, which suggests that only 15 out of the 34 women were effectively preventing new FASD births when the PCAP Data Outcome Reporting Tool was used. This result is lower than the 71% found when looking at provincial consolidated data.
Year 7 FASD Service Network Evaluation EFAN Evaluation Report
July 23, 2014 iii
There is a discrepancy in the findings between the two evaluation tools on the percentage of PCAP clients, with regards to the percentage of women effectively preventing alcohol-‐exposed pregnancies. Recommendation #1: The low rates in use of birth control in the first two years of the program and the low rate of women effectively preventing FASD births should be investigated further. The most common presenting issues for women in the EFAN PCAP program were similar as for the provincial sample. Housing, addiction, mental health, adaptive life skills and finances were presenting issues for over 45% of the women when their files were first opened in ORS. As with the provincial consolidated data, for many issues, there appears to be an initial increase in the prevalence of issues followed by a decrease over time. 63% of EFAN PCAP clients with a target child had custody of such children, and 63% of the children lived with their mothers. The rates are similar to the provincial consolidated rates. Overall, EFAN’s PCAP programs appear to meet the Service Network Prevention Outcomes. More information is needed to explain lower than provincial retention rates and effective prevention of FASD birth rates.
1.3. Assessment and Diagnosis EFAN funds FASD assessment and diagnosis services in partnership with Alberta Health Services at the Glenrose Children’s FASD Clinic. The Network funding provides one additional assessment per month at the Glenrose clinic, or a total of 12 assessments per year. Only 8 post-‐clinic surveys were completed for EFAN as part of the Year-‐7 Service Network Evaluation, 7 by caregivers, and 1 by a client. Because of the small sample size, the survey findings should be interpreted with caution. Recommendation #2: EFAN should consider offering post-‐clinic surveys on an on-‐going basis, in order to increase the validity of their clinic evaluation findings. Survey results suggest that both parents/caregivers and clients had an improved understanding of FASD after the clinic day; and that the level of understanding in relation to strengths and weaknesses and thinking and learning patterns had improved for both parents/caregivers and clients after the clinic day as well. All parents/caregivers and clients had a positive, favorable impression of the diagnostic process after their assessment clinic experience. The majority of parents/caregivers and clients indicated that they understood FASD better after their clinic experience. The majority of parents/caregivers and all clients indicated that they had received new information about services and supports, and that they planned to connect with the services and supports that were recommended to them by assessment clinic staff. The majority of parents/caregivers and clients were satisfied with their assessment clinic experience and indicated that they received what they wanted from the process. They believed that their diagnosis was easily understood and that they were confident in the assessment process findings. They unanimously stated that they were treated with dignity and respect by assessment clinic staff. Overall, findings suggest that EFAN’s funded FASD assessment and diagnostic services positively contribute towards the provincial outcomes, at a similar level as the consolidated provincial findings. However, EFAN funds only a small number of assessments, and results need to be validated with a larger number of surveys.
Year 7 FASD Service Network Evaluation EFAN Evaluation Report
July 23, 2014 iv
1.4. Support Services In 2012-‐13, EFAN provided funding for support services to 8 different agencies in Edmonton, reaching out to 319 unique clients. As part of the Year-‐7 Service Network evaluation process, EFAN’s support service providers returned 99 client surveys, 30 surveys filled out by caregivers on behalf of services received by their dependents, and 37 surveys filled out by caregivers who received support services. ORS data confirmed that EFAN provided support services to clients of all age groups and to caregivers, that almost all clients received services for at least 2 reporting quarters, and the great majority for longer periods. More data over a longer period of time will confirm the good retention rates. Clients and caregivers reported that agencies helped them in a number of ways: taking care of themselves and their health, dealing with relationship issues, and support with school & employment were the most common areas of help. Clients also reported that agencies helped them deal with addiction and legal issues. EFAN’s responses were similar to provincial responses. The majority of parents/caregivers and clients who participated in support services indicated that they had a better understanding of their strengths and weaknesses and knew what they needed to change about their behavior to take better care of themselves as a result of the support services. Presenting issues and outcomes for individuals receiving support services showed similar patterns for EFAN-‐funded support clients as provincial results. The three most frequent presenting issues for children receiving EFAN-‐funded support services were: behavior (43%), education (50%), and social skills (43%). The four most frequent presenting issues for youth 13-‐17 years old receiving EFAN-‐funded support services were: social skills (66%), adaptive/life skills (50%), education (30%), and behavior (26%). The four most common presenting issues for young adults, ages 18 to 24, were: housing (45%), adaptive skills / live skills (53%), social skills (48%), and behavior (39%). The most common presenting issues for adults, ages 25+ were: mental health (66%), finances (52%), housing (50%), and employment (43%). There were inconsistencies in ORS data entry for the caregiver groups, and data could therefore not be analyzed. For most issues, there appeared to be an initial increase in the percentage of clients experiencing the issue in subsequent periods, with the beginning of a decrease in the 4th or 5th quarter. This pattern was also found in the provincial consolidated sample. The majority of parents/caregivers receiving support from support services indicated that they had increased knowledge of how FASD affects their child and that they had received information that made them feel more capable of caring for their child. Results were similar to the provincial sample. The majority of parents/caregivers receiving support from support services indicated that they had received assistance accessing help in the community for their child, that their support network had increased, and that their access to respite care had increased since accessing support services. Results were similar to the provincial sample, except that EFAN’s caregivers were more likely than all caregivers to have gained new access to respite care. Respite care is an area of service that is not systematically offered by all Networks.
Year 7 FASD Service Network Evaluation EFAN Evaluation Report
July 23, 2014 v
The majority of parents/caregivers receiving support from support services indicated that their family life had improved. Half of the parents/caregivers indicated that their stress levels had decreased as a result of the support that they have received. The majority of parents/caregivers also reported an increased sense of hope for their child. Results were similar to consolidated provincial responses. All parents/caregivers and almost all clients who participated in support services were happy with the services they received and that they received the support that they wanted. All parents/caregivers and clients indicated that they were treated with dignity and respect. Over half of the caregivers had attended at least one FASD training event, a higher percentage than in the provincial sample. Overall, EFAN’s Support Services appear to meet the Support Services outcomes. There is no specific recommendation for EFAN’s funded support services.
1.5. Awareness EFAN made an intentional investment in using social media to connect with stakeholders and disseminate information. EFAN had a website, a blog, a Facebook and a Twitter account. EFAN’s members have learned to use the social medial tools to access a wealth of information about FASD, events and resources. EFAN was responsible for 46% of all resources developed and reported during the Service Network Year-‐7 Evaluation. They developed a variety of resources, including brochures, posters, information sheets, a calendar, key chains and other promotional items. The purpose of their resource development included preventative education (52%), targeted community initiatives (29%) and professional development (24%). Resources were targeted at the general public (100%), individuals affected by FASD ((57%) and professionals (71%). Often the resources had more than one purpose or targeted audience. None of the resources were evaluated (compared to 7% on a provincial level), and 95% were available to other Networks. EFAN was responsible for 7 events of all events (6%) reported during the Service Network Year-‐7 Evaluation. Most of them (86%) were professional development events. Only 29% of the events were evaluated. EFAN was responsible for 7 events of all events (6%) reported during the Service Network Year-‐7 Evaluation. Only 29% of the events were evaluated (compared to 56% on a provincial level), resulting in 40 post-‐event surveys. EFAN members have access to full-‐time educators through one of their members, through another source of funding. This may explain the small number of events reported, and that only 40 post-‐event surveys returned. Recommendation #3: EFAN should consider the feasibility of strengthening their evaluation of events and resources. Survey results were very positive, with generally higher satisfaction rates as consolidated provincial results: 97% of respondents indicated that they learned something new about FASD and that they had a better understanding of the disability after attending an event. All individuals who participated in an FASD event stated that they felt more compassionate and that they intended to be more supportive of individuals affected by FASD. 93% indicated that the information obtained would help them care for or support someone with FASD better. 98% indicated that they were satisfied with the event and that it was a good use of their time. In the Network stakeholder survey, 80% of respondents indicated that the training and education provided by the Network helped them increase their understanding of FASD have
Year 7 FASD Service Network Evaluation EFAN Evaluation Report
July 23, 2014 vi
made them more compassionate and supportive of individuals affected by FASD (14% of respondents did not know). Evaluation results suggest that EFAN is a leader among all Networks in resource development, and that there is a high rate of satisfaction with the FASD training offered through the Network.
1.6. Conclusion The Year-‐7 Evaluation took place after a recent change in governance structure, where EFAN became a Society, and changed its leadership structure. Evaluation results suggest that EFAN’s transition has been successful, and has not affected the Network’s ability to sustain community collaboration and foster stakeholder involvement. Client and system outcomes were most often met at higher levels than the provincial consolidated levels. The report includes several recommendations specific to EFAN.
Year 7 FASD Service Network Evaluation EFAN Evaluation Report
23 July 2014 1
2. Introduction 2.1. Alberta FASD 10-‐Year Strategic Plan and FASD Service Networks In 2003, the Government of Alberta launched a cross-‐ministry initiative to develop a comprehensive coordinated response to FASD, which resulted in the implementation of Alberta’s FASD 10-‐Year Strategic Plan (2007-‐2017). During the first five years of the Plan (2007-‐2012), the foundation was laid for Alberta’s model of FASD prevention and service delivery, the FASD Service Network Program. Eleven FASD Service Networks serve geographical regions throughout the Province and one Network serves Métis Settlements across Alberta. Under the direction of Alberta’s FASD Cross-‐Ministry Committee (FASD-‐CMC), Services Networks developed and implemented an FASD prevention and service delivery model that is client focused and result based, enabling individuals with FASD, their families and caregivers, to access information and services through a single door, the FASD Service Network in their region. The year 5 Evaluation established baseline performance measures against outcomes and targets, providing a foundation for subsequent evaluations.
2.2. FASD-‐CMC Strategic and Operational Plan 2013/2014 The FASD Strategic and Operational Plan is an outcomes-‐based management plan designed to refine the goals under each of the strategic pillars. It presents a life-‐cycle approach that emphasizes results, learning and adaptation. For each of the strategic pillars: awareness, prevention, assessment & diagnosis, supports for individuals & caregivers, FASD learning organization, the plan identifies a related goal, systems and client outcomes, actions and leads. Each outcome in the plan is measurable through key performance indicators related to the provincial FASD goals and the Government of Alberta Results Based Budgeting (RBB) process.
2.3. Development of Alberta FASD Service Network Evaluation Frameworks The Year-‐5 evaluation made seven overall recommendations, some of which were specific to FASD Service Networks. The third recommendation was to clarify outcomes, i.e. to articulate clear, measurable outcomes for individuals affected by FASD (client outcomes) and for the FASD service delivery model (system outcomes) that demonstrate system effectiveness and efficiency. The fourth recommendation was to develop a data collection model, which identifies indicators and develop data collection templates, and provides funding to Service Networks supporting continuous, reliable data collection. This led to the development of five evaluation frameworks, one for each pillar in 2011-‐12. Each of the frameworks include a logic model, client and system outcomes, indicators, measurement tools, output and outcome measurement plans. The frameworks were used to guide the Service Network evaluation of the Service Network Year-‐7 evaluation
Year 7 FASD Service Network Evaluation EFAN Evaluation Report
23 July 2014 2
2.4. Year 7 FASD Network Evaluation Team and Steering Committee
The Evaluation Team
The FASD-‐CMC contracted Wirzba Consulting Inc. (Hélène Wirzba) in partnership with Objective Research and Evaluation Inc. (Christopher Cameron), as the evaluation team. Hélène Wirzba and Christopher Cameron were the consultants contracted for the development of the FASD-‐Service Network evaluation frameworks.
Role of Evaluation Steering Committee
The Year 7 FASD Service Network Evaluation Steering Committee included representatives from FASD Service Network and the FASD-‐CMC. The committee was responsible for the implementation of the Network Year 7 Evaluation and met on a monthly basis, between July 2013 and June 2014. In particular, they: • Provided recommendations regarding policies, standards and any issue that arose
during the evaluation implementation; • Provided feedback on additional evaluation tools and resources that were developed
(such as focus group guidelines, evaluation report templates…); and • Linked with other organizations and committees to share resources, ideas and concerns,
and keep abreast of new information related to the FASD-‐CMC 7-‐Year evaluation.
2.5. Evaluation Methodology and Tools The evaluation methodology is described in each of the five evaluation frameworks. The deliverables included a provincial report with consolidated information from all 12 Service Networks, and Network-‐specific reports. Data sources for the Year-‐7 Service Network evaluation included the following:
Focus Groups and Narrative Reports
The data presented is based on focus groups with each of the 12 Service Network leadership teams, as well as a review of the 2012-‐13 Service Network narrative reports, and other supporting documents, such as by-‐laws, policies and procedures, strategic planning documents, websites... Ten out of 12 focus groups took place over teleconference. The remaining 2 focus groups were face-‐to-‐face meetings. Each group met for 60 to 90 minutes. Focus groups were well attended: 68 leadership representatives had the opportunity to contribute to the focus groups. Each focus group had at least 3 representatives.
Online Reporting System (ORS)
The FASD Online Reporting System (FASD-‐ORS) is an online reporting system that generates reports to describe clients being served by the Alberta FASD Service Network Program. It was first introduced in April 2012 and is managed by the FASD Unit, Disability Services Division, Alberta Human Services. The data elements include client demographic information, presenting issues and outcome statements to measure the difference being made in the lives of individuals accessing services in the categories of prevention, assessment/diagnosis, and support for those affected by FASD across the lifespan. FASD service workers post data in ORS for each of their clients on a quarterly basis (reporting quarters).
Year 7 FASD Service Network Evaluation EFAN Evaluation Report
23 July 2014 3
The data captured and reviewed as part of the Year 7 Service Network Evaluation comes from the 12 FASD Service Networks across the province and only includes information about clients funded directly through the FASD Service Network Program. This was the first time ORS data was analyzed with the purpose of generating outcome data. Several limitations were identified during the process. For example answers to many of the data entry fields are currently optional resulting in many blank field. All of the identified issues have been flagged, and will be addressed in the planned minor and major ORS enhancements. ORS data was mostly analyzed for the provincial report. Service-‐Network specific reports do not include a complete analysis of ORS data specific to their funded clients. It is expected that such analysis will be available in the future.
Demographic information
For each of the service pillars, the demographic information presented in the Year 7 Service Network report is based on the FASD Service Network Program 2012-‐13 data report (v1) produced by the Alberta FASD Unit in October 2013, and is limited to unique clients served between April 1, 2012 and March 31, 2013 (ORS Reporting Quarters Year 1 Quarter 1 to Year 1 Quarter 4).
Assessment and diagnostic services
The information about types of FASD diagnosis, secondary diagnosis, presenting issues, and recommendations, is based on all unique clients for whom the diagnosis process was completed between April 2012 and September 2013 (ORS Reporting Quarter Year 1 Quarter 1 to Year 2 Quarter 2).
Support and prevention services
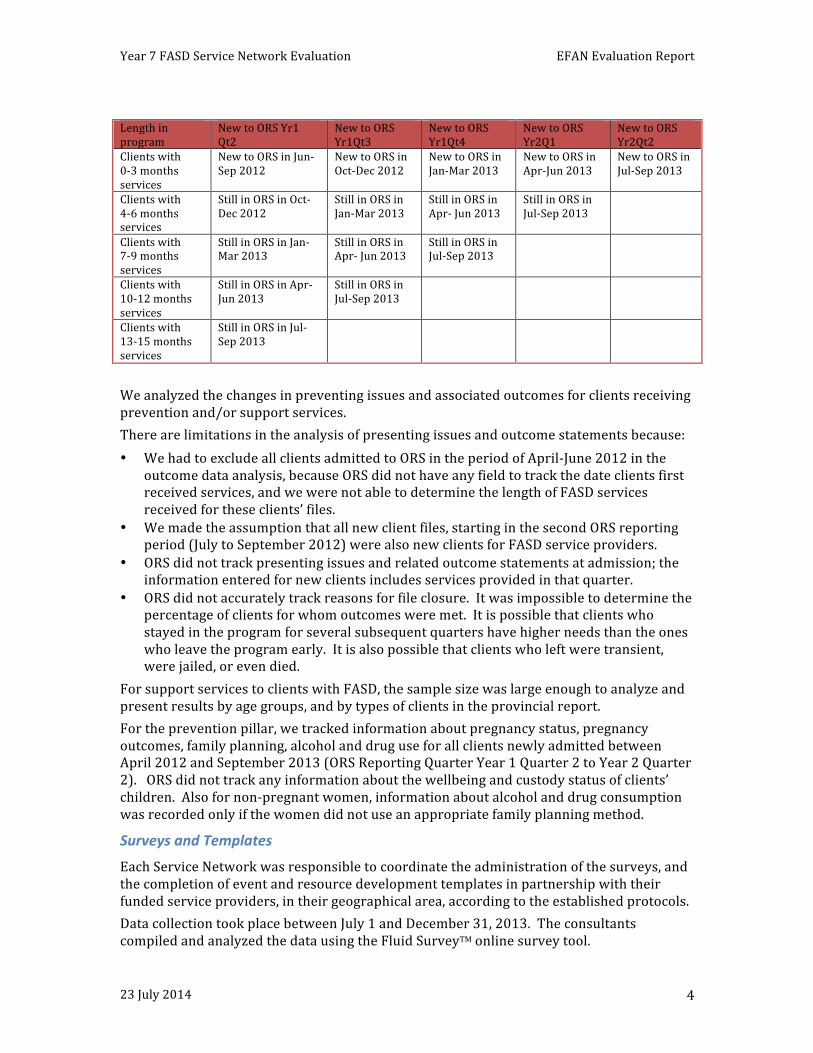
For the purpose of the outcome analysis for support and prevention services, we created cohorts of newly admitted clients in each of the ORS reporting quarters, excluding the first one (April to June 2012) and examined the changes of presenting issues and related outcome statements in subsequent reporting periods for clients for whom there was data in subsequent reporting periods (2nd, 3rd, 4th 5th and 6th quarter of services). Sample sizes were created, as per the following table. The sample size for clients in their first quarter (0-‐3 months of services) is the largest. Subsequent quarters have lower sample sizes because some files were either inactive or closed, and because the ORS system is still very new. (For example, all clients newly admitted in Jul-‐Sep 2013 had only one reporting period, and those admitted in April to June 2013 had only 2 reporting periods.)
Year 7 FASD Service Network Evaluation EFAN Evaluation Report
23 July 2014 4
Length in program
New to ORS Yr1 Qt2
New to ORS Yr1Qt3
New to ORS Yr1Qt4
New to ORS Yr2Q1
New to ORS Yr2Qt2
Clients with 0-‐3 months services
New to ORS in Jun-‐Sep 2012
New to ORS in Oct-‐Dec 2012
New to ORS in Jan-‐Mar 2013
New to ORS in Apr-‐Jun 2013
New to ORS in Jul-‐Sep 2013
Clients with 4-‐6 months services
Still in ORS in Oct-‐Dec 2012
Still in ORS in Jan-‐Mar 2013
Still in ORS in Apr-‐ Jun 2013
Still in ORS in Jul-‐Sep 2013
Clients with 7-‐9 months services
Still in ORS in Jan-‐Mar 2013
Still in ORS in Apr-‐ Jun 2013
Still in ORS in Jul-‐Sep 2013
Clients with 10-‐12 months services
Still in ORS in Apr-‐ Jun 2013
Still in ORS in Jul-‐Sep 2013
Clients with 13-‐15 months services
Still in ORS in Jul-‐Sep 2013
We analyzed the changes in preventing issues and associated outcomes for clients receiving prevention and/or support services. There are limitations in the analysis of presenting issues and outcome statements because: • We had to exclude all clients admitted to ORS in the period of April-‐June 2012 in the
outcome data analysis, because ORS did not have any field to track the date clients first received services, and we were not able to determine the length of FASD services received for these clients’ files.
• We made the assumption that all new client files, starting in the second ORS reporting period (July to September 2012) were also new clients for FASD service providers.
• ORS did not track presenting issues and related outcome statements at admission; the information entered for new clients includes services provided in that quarter.
• ORS did not accurately track reasons for file closure. It was impossible to determine the percentage of clients for whom outcomes were met. It is possible that clients who stayed in the program for several subsequent quarters have higher needs than the ones who leave the program early. It is also possible that clients who left were transient, were jailed, or even died.
For support services to clients with FASD, the sample size was large enough to analyze and present results by age groups, and by types of clients in the provincial report. For the prevention pillar, we tracked information about pregnancy status, pregnancy outcomes, family planning, alcohol and drug use for all clients newly admitted between April 2012 and September 2013 (ORS Reporting Quarter Year 1 Quarter 2 to Year 2 Quarter 2). ORS did not track any information about the wellbeing and custody status of clients’ children. Also for non-‐pregnant women, information about alcohol and drug consumption was recorded only if the women did not use an appropriate family planning method.
Surveys and Templates
Each Service Network was responsible to coordinate the administration of the surveys, and the completion of event and resource development templates in partnership with their funded service providers, in their geographical area, according to the established protocols. Data collection took place between July 1 and December 31, 2013. The consultants compiled and analyzed the data using the Fluid SurveyTM online survey tool.
Year 7 FASD Service Network Evaluation EFAN Evaluation Report
23 July 2014 5
2.6. Limitations Only a portion Alberta’s FASD support services are delivered through funding from Service Networks. At the time of this evaluation, all Networks were aware of other organizations / agencies involved in FASD support: Child and Family Services had FASD supports for children with FASD and their foster parents; School Boards provided FASD supports to students and their families in the schools through the WRAP and TRY program. Several Networks mentioned community funding for FASD supports through Alberta Seniors and Community Supports (now Alberta Senior Services). Data presented in this section was mostly retrieved from narrative reports, as the scope of the evaluation did not include any interaction with front-‐line service providers. Some of the key performance indicators were not measurable through this evaluation, because neither ORS nor narrative reports kept track of information required. The focus group discussion guidelines did not have any specific question related to the delivery of front-‐line FASD services. The qualitative information is based on information included in narrative reports, observations made during the focus group discussions and survey comments.
Year 7 FASD Service Network Evaluation EFAN Evaluation Report
23 July 2014 6
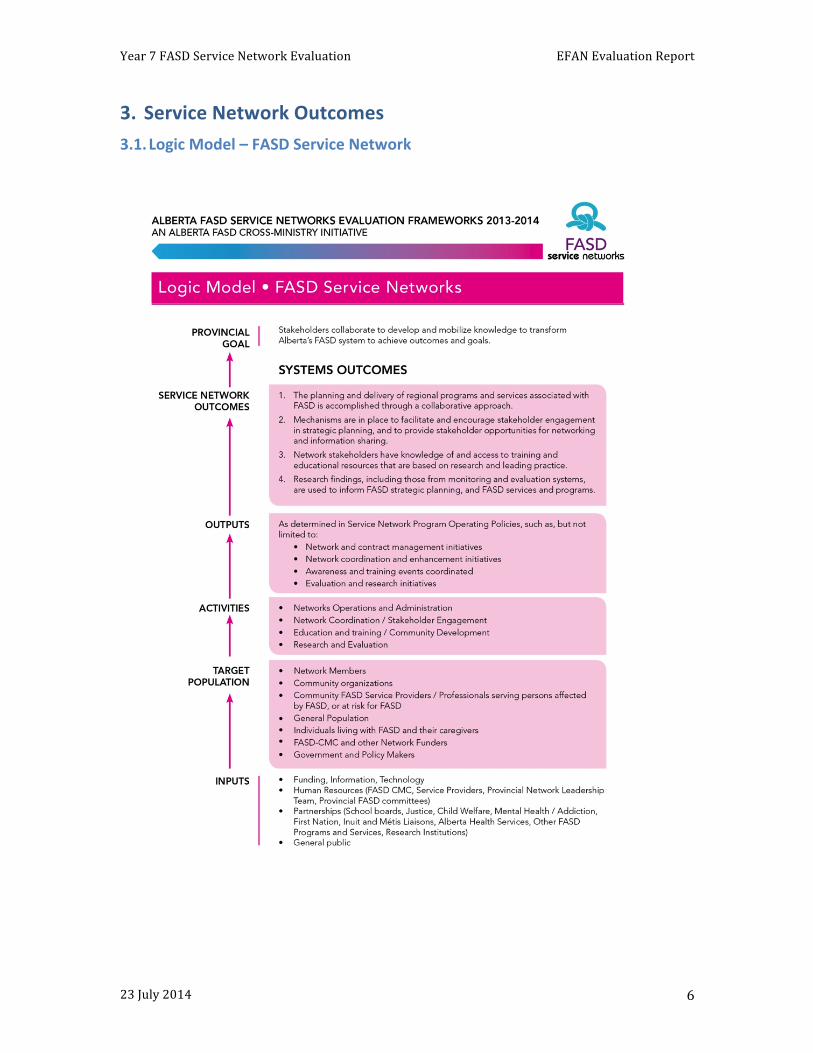
3. Service Network Outcomes 3.1. Logic Model – FASD Service Network
Year 7 FASD Service Network Evaluation EFAN Evaluation Report
23 July 2014 7
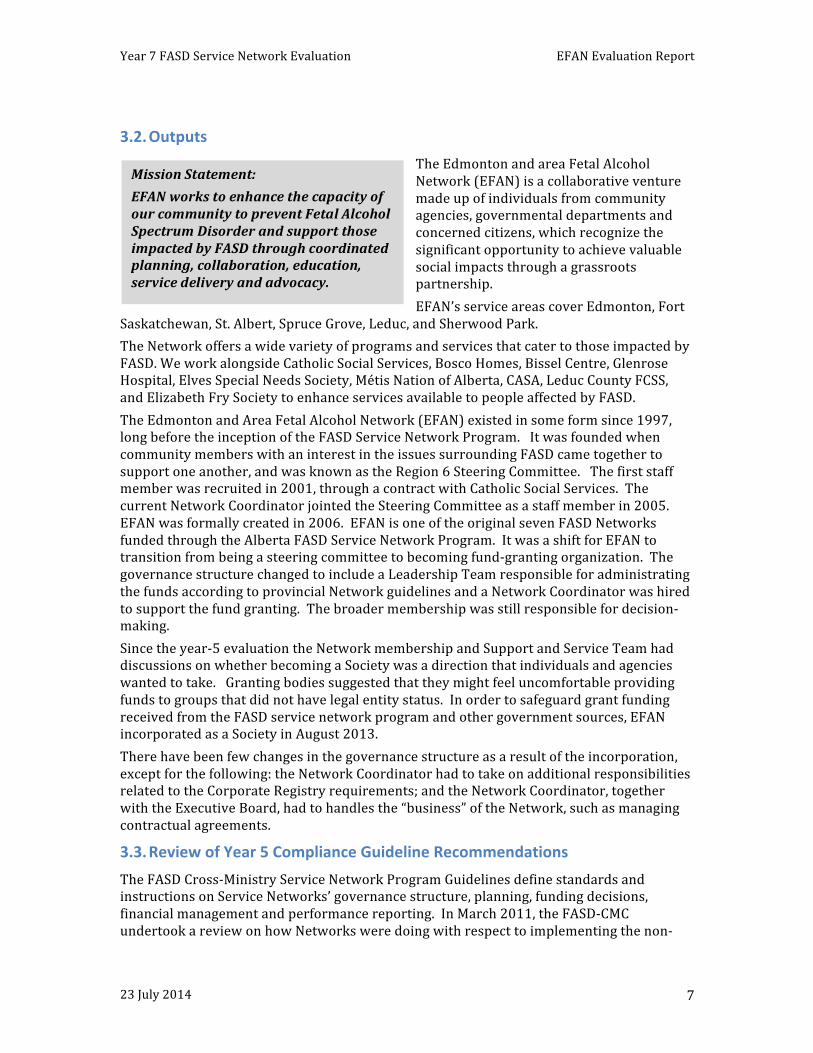
3.2. Outputs The Edmonton and area Fetal Alcohol Network (EFAN) is a collaborative venture made up of individuals from community agencies, governmental departments and concerned citizens, which recognize the significant opportunity to achieve valuable social impacts through a grassroots partnership. EFAN’s service areas cover Edmonton, Fort
Saskatchewan, St. Albert, Spruce Grove, Leduc, and Sherwood Park. The Network offers a wide variety of programs and services that cater to those impacted by FASD. We work alongside Catholic Social Services, Bosco Homes, Bissel Centre, Glenrose Hospital, Elves Special Needs Society, Métis Nation of Alberta, CASA, Leduc County FCSS, and Elizabeth Fry Society to enhance services available to people affected by FASD. The Edmonton and Area Fetal Alcohol Network (EFAN) existed in some form since 1997, long before the inception of the FASD Service Network Program. It was founded when community members with an interest in the issues surrounding FASD came together to support one another, and was known as the Region 6 Steering Committee. The first staff member was recruited in 2001, through a contract with Catholic Social Services. The current Network Coordinator jointed the Steering Committee as a staff member in 2005. EFAN was formally created in 2006. EFAN is one of the original seven FASD Networks funded through the Alberta FASD Service Network Program. It was a shift for EFAN to transition from being a steering committee to becoming fund-‐granting organization. The governance structure changed to include a Leadership Team responsible for administrating the funds according to provincial Network guidelines and a Network Coordinator was hired to support the fund granting. The broader membership was still responsible for decision-‐making. Since the year-‐5 evaluation the Network membership and Support and Service Team had discussions on whether becoming a Society was a direction that individuals and agencies wanted to take. Granting bodies suggested that they might feel uncomfortable providing funds to groups that did not have legal entity status. In order to safeguard grant funding received from the FASD service network program and other government sources, EFAN incorporated as a Society in August 2013. There have been few changes in the governance structure as a result of the incorporation, except for the following: the Network Coordinator had to take on additional responsibilities related to the Corporate Registry requirements; and the Network Coordinator, together with the Executive Board, had to handles the “business” of the Network, such as managing contractual agreements.
3.3. Review of Year 5 Compliance Guideline Recommendations The FASD Cross-‐Ministry Service Network Program Guidelines define standards and instructions on Service Networks’ governance structure, planning, funding decisions, financial management and performance reporting. In March 2011, the FASD-‐CMC undertook a review on how Networks were doing with respect to implementing the non-‐
Mission Statement: EFAN works to enhance the capacity of our community to prevent Fetal Alcohol Spectrum Disorder and support those impacted by FASD through coordinated planning, collaboration, education, service delivery and advocacy.
Year 7 FASD Service Network Evaluation EFAN Evaluation Report
23 July 2014 8
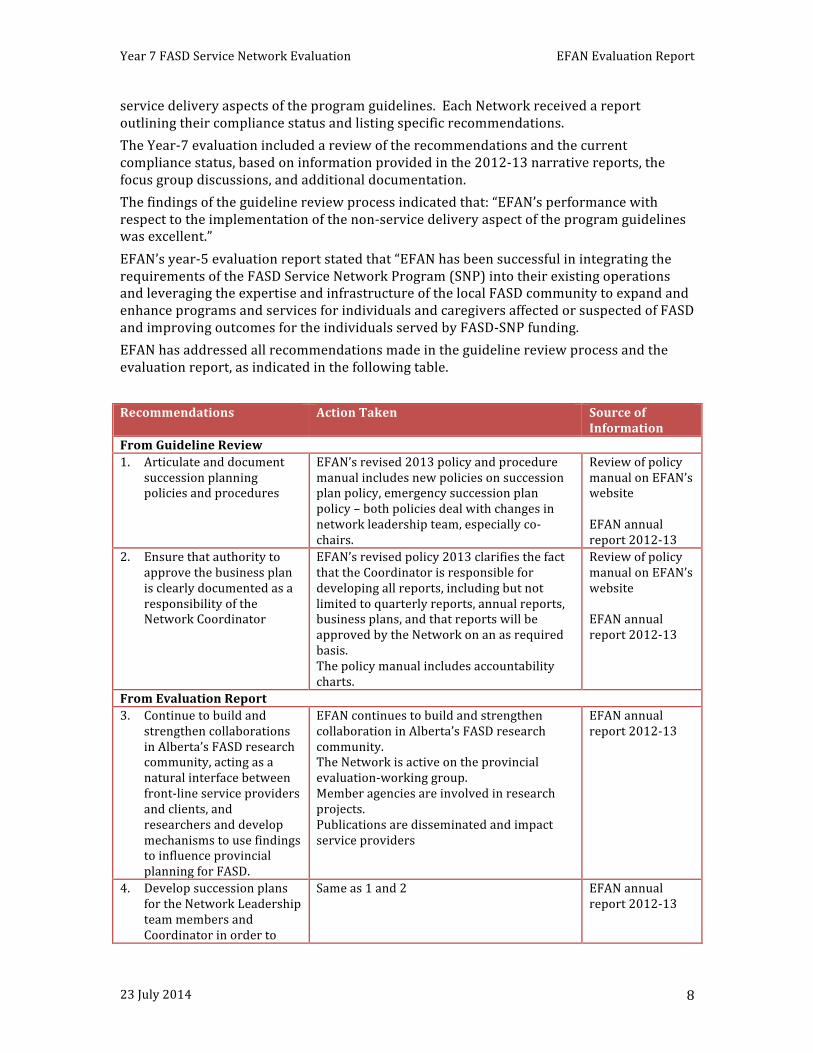
service delivery aspects of the program guidelines. Each Network received a report outlining their compliance status and listing specific recommendations. The Year-‐7 evaluation included a review of the recommendations and the current compliance status, based on information provided in the 2012-‐13 narrative reports, the focus group discussions, and additional documentation. The findings of the guideline review process indicated that: “EFAN’s performance with respect to the implementation of the non-‐service delivery aspect of the program guidelines was excellent.” EFAN’s year-‐5 evaluation report stated that “EFAN has been successful in integrating the requirements of the FASD Service Network Program (SNP) into their existing operations and leveraging the expertise and infrastructure of the local FASD community to expand and enhance programs and services for individuals and caregivers affected or suspected of FASD and improving outcomes for the individuals served by FASD-‐SNP funding. EFAN has addressed all recommendations made in the guideline review process and the evaluation report, as indicated in the following table. Recommendations Action Taken Source of
Information From Guideline Review 1. Articulate and document
succession planning policies and procedures
EFAN’s revised 2013 policy and procedure manual includes new policies on succession plan policy, emergency succession plan policy – both policies deal with changes in network leadership team, especially co-‐chairs.
Review of policy manual on EFAN’s website EFAN annual report 2012-‐13
2. Ensure that authority to approve the business plan is clearly documented as a responsibility of the Network Coordinator
EFAN’s revised policy 2013 clarifies the fact that the Coordinator is responsible for developing all reports, including but not limited to quarterly reports, annual reports, business plans, and that reports will be approved by the Network on an as required basis. The policy manual includes accountability charts.
Review of policy manual on EFAN’s website EFAN annual report 2012-‐13
From Evaluation Report 3. Continue to build and
strengthen collaborations in Alberta’s FASD research community, acting as a natural interface between front-‐line service providers and clients, and researchers and develop mechanisms to use findings to influence provincial planning for FASD.
EFAN continues to build and strengthen collaboration in Alberta’s FASD research community. The Network is active on the provincial evaluation-‐working group. Member agencies are involved in research projects. Publications are disseminated and impact service providers
EFAN annual report 2012-‐13
4. Develop succession plans for the Network Leadership team members and Coordinator in order to
Same as 1 and 2 EFAN annual report 2012-‐13
Year 7 FASD Service Network Evaluation EFAN Evaluation Report
23 July 2014 9
Recommendations Action Taken Source of Information
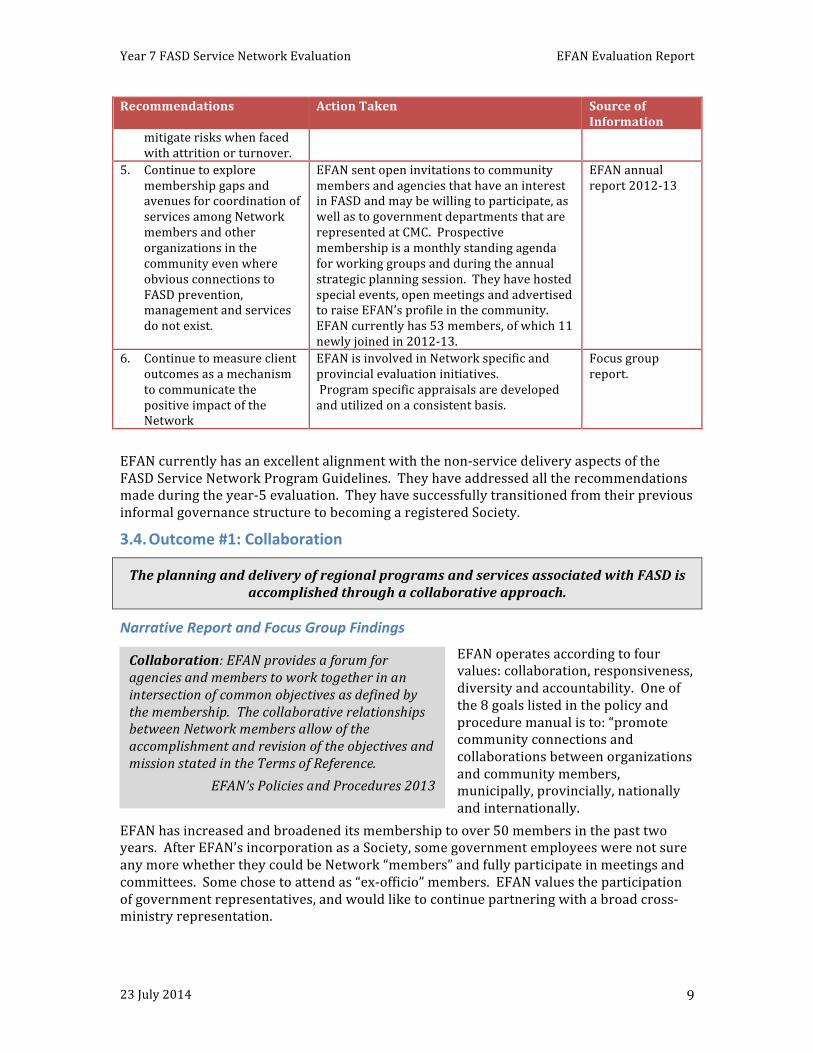
mitigate risks when faced with attrition or turnover.
5. Continue to explore membership gaps and avenues for coordination of services among Network members and other organizations in the community even where obvious connections to FASD prevention, management and services do not exist.
EFAN sent open invitations to community members and agencies that have an interest in FASD and may be willing to participate, as well as to government departments that are represented at CMC. Prospective membership is a monthly standing agenda for working groups and during the annual strategic planning session. They have hosted special events, open meetings and advertised to raise EFAN’s profile in the community. EFAN currently has 53 members, of which 11 newly joined in 2012-‐13.
EFAN annual report 2012-‐13
6. Continue to measure client outcomes as a mechanism to communicate the positive impact of the Network
EFAN is involved in Network specific and provincial evaluation initiatives. Program specific appraisals are developed and utilized on a consistent basis.
Focus group report.
EFAN currently has an excellent alignment with the non-‐service delivery aspects of the FASD Service Network Program Guidelines. They have addressed all the recommendations made during the year-‐5 evaluation. They have successfully transitioned from their previous informal governance structure to becoming a registered Society.
3.4. Outcome #1: Collaboration
The planning and delivery of regional programs and services associated with FASD is accomplished through a collaborative approach.
Narrative Report and Focus Group Findings
EFAN operates according to four values: collaboration, responsiveness, diversity and accountability. One of the 8 goals listed in the policy and procedure manual is to: “promote community connections and collaborations between organizations and community members, municipally, provincially, nationally and internationally.
EFAN has increased and broadened its membership to over 50 members in the past two years. After EFAN’s incorporation as a Society, some government employees were not sure any more whether they could be Network “members” and fully participate in meetings and committees. Some chose to attend as “ex-‐officio” members. EFAN values the participation of government representatives, and would like to continue partnering with a broad cross-‐ministry representation.
Collaboration: EFAN provides a forum for agencies and members to work together in an intersection of common objectives as defined by the membership. The collaborative relationships between Network members allow of the accomplishment and revision of the objectives and mission stated in the Terms of Reference.
EFAN’s Policies and Procedures 2013
Year 7 FASD Service Network Evaluation EFAN Evaluation Report
23 July 2014 10
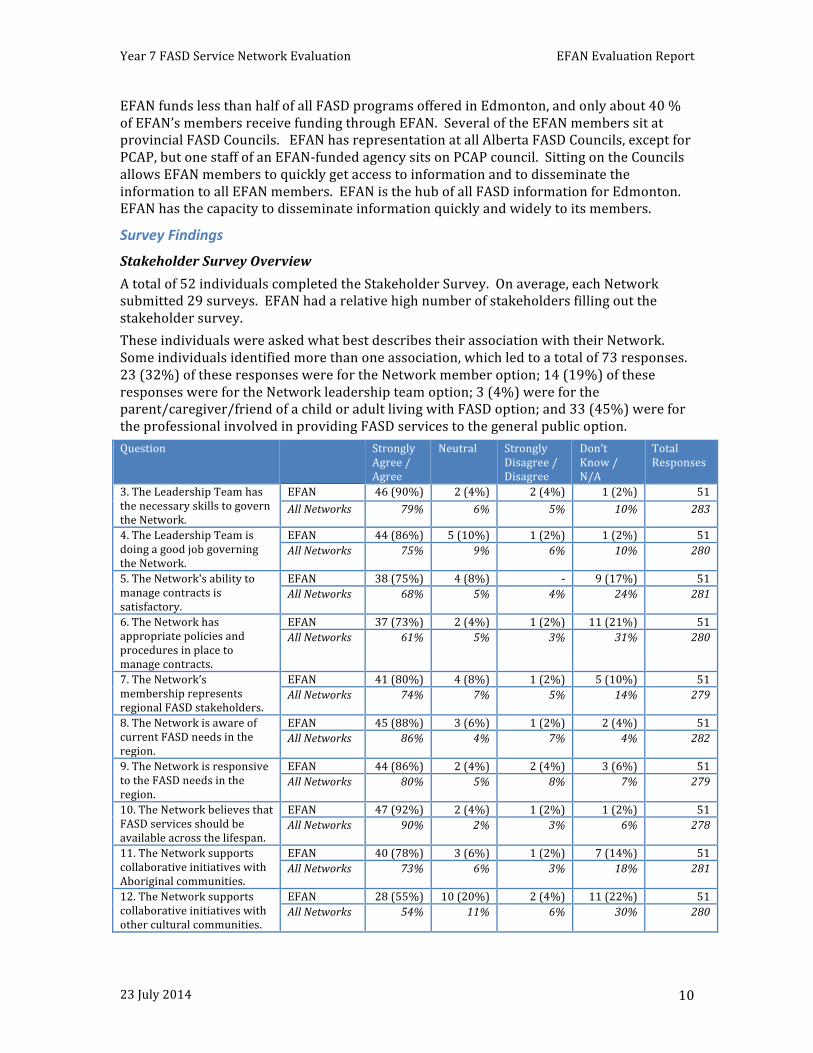
EFAN funds less than half of all FASD programs offered in Edmonton, and only about 40 % of EFAN’s members receive funding through EFAN. Several of the EFAN members sit at provincial FASD Councils. EFAN has representation at all Alberta FASD Councils, except for PCAP, but one staff of an EFAN-‐funded agency sits on PCAP council. Sitting on the Councils allows EFAN members to quickly get access to information and to disseminate the information to all EFAN members. EFAN is the hub of all FASD information for Edmonton. EFAN has the capacity to disseminate information quickly and widely to its members.
Survey Findings
Stakeholder Survey Overview A total of 52 individuals completed the Stakeholder Survey. On average, each Network submitted 29 surveys. EFAN had a relative high number of stakeholders filling out the stakeholder survey. These individuals were asked what best describes their association with their Network. Some individuals identified more than one association, which led to a total of 73 responses. 23 (32%) of these responses were for the Network member option; 14 (19%) of these responses were for the Network leadership team option; 3 (4%) were for the parent/caregiver/friend of a child or adult living with FASD option; and 33 (45%) were for the professional involved in providing FASD services to the general public option. Question Strongly
Agree / Agree
Neutral Strongly Disagree / Disagree
Don’t Know / N/A
Total Responses
3. The Leadership Team has the necessary skills to govern the Network.
EFAN 46 (90%) 2 (4%) 2 (4%) 1 (2%) 51 All Networks 79% 6% 5% 10% 283
4. The Leadership Team is doing a good job governing the Network.
EFAN 44 (86%) 5 (10%) 1 (2%) 1 (2%) 51 All Networks 75% 9% 6% 10% 280
5. The Network's ability to manage contracts is satisfactory.
EFAN 38 (75%) 4 (8%) -‐ 9 (17%) 51 All Networks 68% 5% 4% 24% 281
6. The Network has appropriate policies and procedures in place to manage contracts.
EFAN 37 (73%) 2 (4%) 1 (2%) 11 (21%) 51 All Networks 61% 5% 3% 31% 280
7. The Network’s membership represents regional FASD stakeholders.
EFAN 41 (80%) 4 (8%) 1 (2%) 5 (10%) 51 All Networks 74% 7% 5% 14% 279
8. The Network is aware of current FASD needs in the region.
EFAN 45 (88%) 3 (6%) 1 (2%) 2 (4%) 51 All Networks 86% 4% 7% 4% 282
9. The Network is responsive to the FASD needs in the region.
EFAN 44 (86%) 2 (4%) 2 (4%) 3 (6%) 51 All Networks 80% 5% 8% 7% 279
10. The Network believes that FASD services should be available across the lifespan.
EFAN 47 (92%) 2 (4%) 1 (2%) 1 (2%) 51 All Networks 90% 2% 3% 6% 278
11. The Network supports collaborative initiatives with Aboriginal communities.
EFAN 40 (78%) 3 (6%) 1 (2%) 7 (14%) 51 All Networks 73% 6% 3% 18% 281
12. The Network supports collaborative initiatives with other cultural communities.
EFAN 28 (55%) 10 (20%) 2 (4%) 11 (22%) 51 All Networks 54% 11% 6% 30% 280
Year 7 FASD Service Network Evaluation EFAN Evaluation Report
23 July 2014 11
Responses to the Stakeholder Survey questions related to collaboration were positive, with higher agreement rates than the provincial consolidated statements. Respondents demonstrated a belief in their Leadership Team’s ability to govern and lead their Network. Additionally, survey respondents were favorable in their support of statements related to their Network’s responsiveness to regional needs and commitment to offering FASD services across the lifespan. Collaboration with Aboriginal and other cultural communities appeared to be a commitment that the Network is making.
3.5. Outcome #2: Stakeholder Engagement
Mechanisms are in place to facilitate and encourage stakeholder engagement in strategic planning, and to provide stakeholder opportunities for networking and
information sharing.
Narrative Report and Focus Group Findings
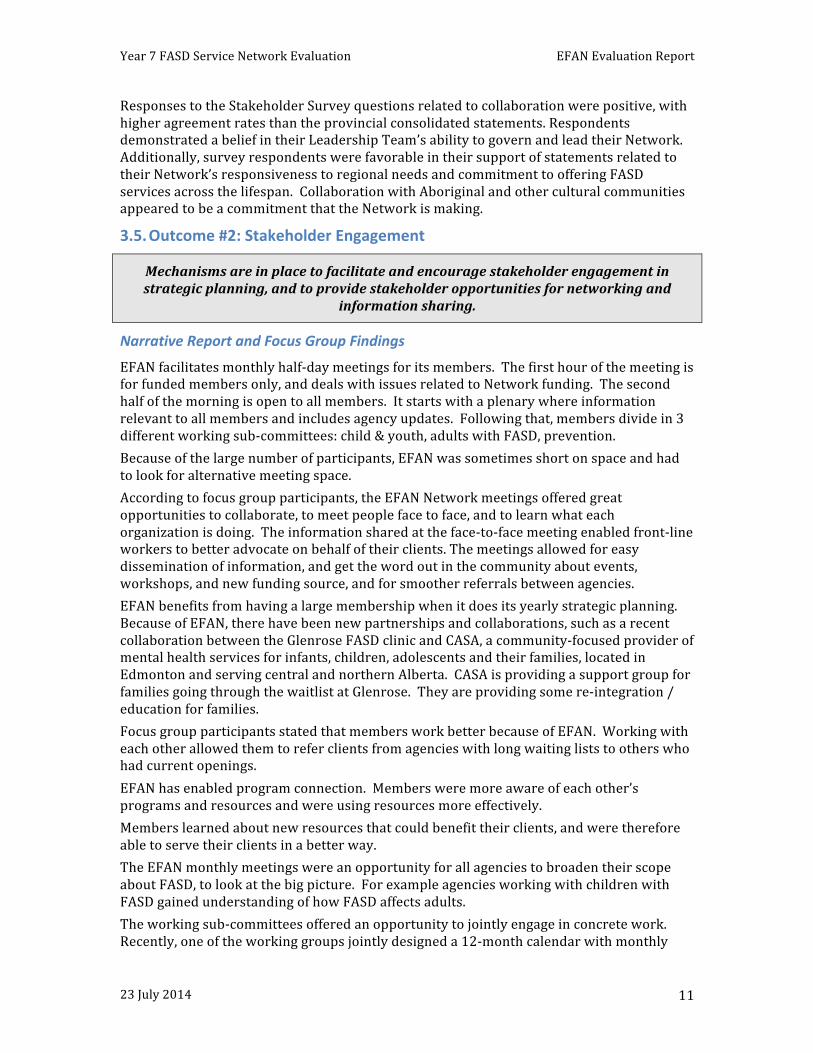
EFAN facilitates monthly half-‐day meetings for its members. The first hour of the meeting is for funded members only, and deals with issues related to Network funding. The second half of the morning is open to all members. It starts with a plenary where information relevant to all members and includes agency updates. Following that, members divide in 3 different working sub-‐committees: child & youth, adults with FASD, prevention. Because of the large number of participants, EFAN was sometimes short on space and had to look for alternative meeting space. According to focus group participants, the EFAN Network meetings offered great opportunities to collaborate, to meet people face to face, and to learn what each organization is doing. The information shared at the face-‐to-‐face meeting enabled front-‐line workers to better advocate on behalf of their clients. The meetings allowed for easy dissemination of information, and get the word out in the community about events, workshops, and new funding source, and for smoother referrals between agencies. EFAN benefits from having a large membership when it does its yearly strategic planning. Because of EFAN, there have been new partnerships and collaborations, such as a recent collaboration between the Glenrose FASD clinic and CASA, a community-‐focused provider of mental health services for infants, children, adolescents and their families, located in Edmonton and serving central and northern Alberta. CASA is providing a support group for families going through the waitlist at Glenrose. They are providing some re-‐integration / education for families. Focus group participants stated that members work better because of EFAN. Working with each other allowed them to refer clients from agencies with long waiting lists to others who had current openings. EFAN has enabled program connection. Members were more aware of each other’s programs and resources and were using resources more effectively. Members learned about new resources that could benefit their clients, and were therefore able to serve their clients in a better way. The EFAN monthly meetings were an opportunity for all agencies to broaden their scope about FASD, to look at the big picture. For example agencies working with children with FASD gained understanding of how FASD affects adults. The working sub-‐committees offered an opportunity to jointly engage in concrete work. Recently, one of the working groups jointly designed a 12-‐month calendar with monthly
Year 7 FASD Service Network Evaluation EFAN Evaluation Report
23 July 2014 12
bytes of information about FASD. It was one way for EFAN to produce a high-‐impact low-‐cost resource. The calendar was launched for the 2013 FASD day. The Bissel Centre obtained funding for a FASD community educator. Through the Network the community educator was able to schedule presentations for EFAN members, agency staff members, and agency clients. EFAN was instrumental in facilitating the developing of resources for adult employment. Members needed to collaborate, be more creative, and innovate in order to impact employment for adult clients with FASD. This included professional development, supports for caregivers, mentoring, sharing of information. EFAN helped members to link all the available resources and information. EFAN’s monthly meetings were also an opportunity to access new resources, such as the Barrier Reduction Fund. The fund is available to individuals, ages 6 to 24 with an FASD clinical diagnosis and another diagnosis. Members are invited to submit one-‐time applications on behalf of their clients. The funding is used to help clients reduce at least one barrier they face; there are accountability measures after 2 and 4 months.
Survey Findings
Stakeholder Survey Question To a Great
Extent / To Some Extent
Very Little / Not at All
Don’t Know / N/A
Total Responses
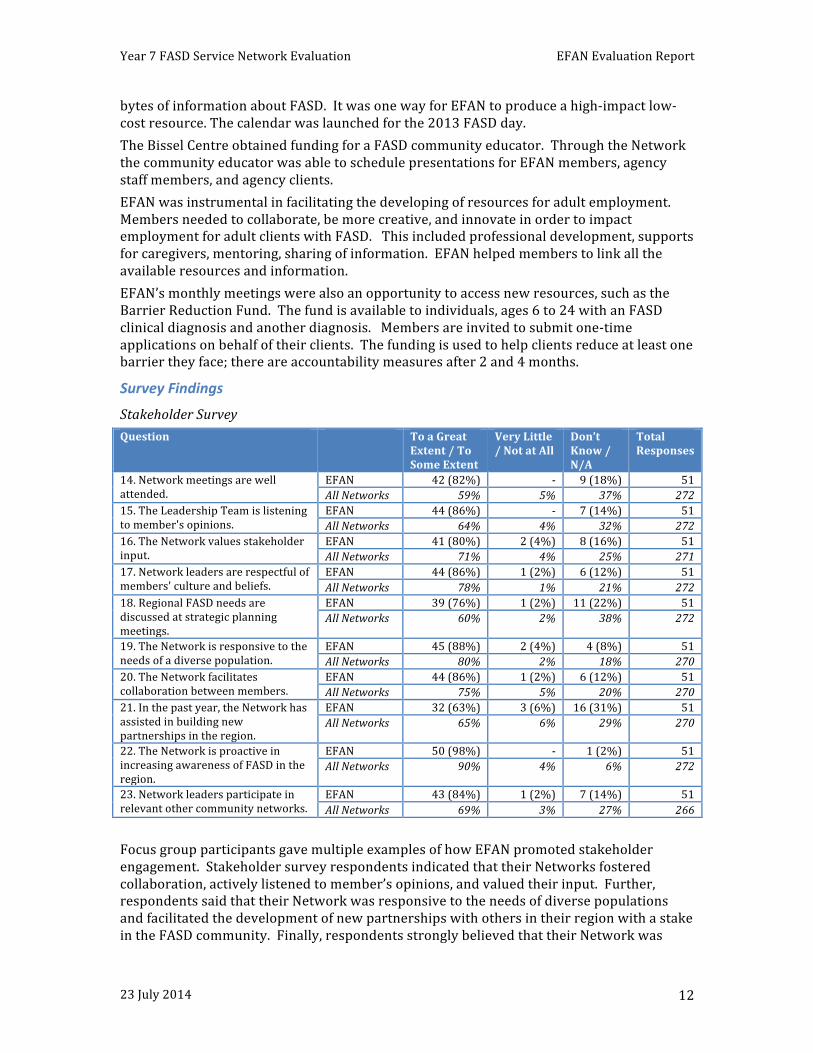
14. Network meetings are well attended.
EFAN 42 (82%) -‐ 9 (18%) 51 All Networks 59% 5% 37% 272
15. The Leadership Team is listening to member's opinions.
EFAN 44 (86%) -‐ 7 (14%) 51 All Networks 64% 4% 32% 272
16. The Network values stakeholder input.
EFAN 41 (80%) 2 (4%) 8 (16%) 51 All Networks 71% 4% 25% 271
17. Network leaders are respectful of members' culture and beliefs.
EFAN 44 (86%) 1 (2%) 6 (12%) 51 All Networks 78% 1% 21% 272
18. Regional FASD needs are discussed at strategic planning meetings.
EFAN 39 (76%) 1 (2%) 11 (22%) 51 All Networks 60% 2% 38% 272
19. The Network is responsive to the needs of a diverse population.
EFAN 45 (88%) 2 (4%) 4 (8%) 51 All Networks 80% 2% 18% 270
20. The Network facilitates collaboration between members.
EFAN 44 (86%) 1 (2%) 6 (12%) 51 All Networks 75% 5% 20% 270
21. In the past year, the Network has assisted in building new partnerships in the region.
EFAN 32 (63%) 3 (6%) 16 (31%) 51 All Networks 65% 6% 29% 270
22. The Network is proactive in increasing awareness of FASD in the region.
EFAN 50 (98%) -‐ 1 (2%) 51 All Networks 90% 4% 6% 272
23. Network leaders participate in relevant other community networks.
EFAN 43 (84%) 1 (2%) 7 (14%) 51 All Networks 69% 3% 27% 266
Focus group participants gave multiple examples of how EFAN promoted stakeholder engagement. Stakeholder survey respondents indicated that their Networks fostered collaboration, actively listened to member’s opinions, and valued their input. Further, respondents said that their Network was responsive to the needs of diverse populations and facilitated the development of new partnerships with others in their region with a stake in the FASD community. Finally, respondents strongly believed that their Network was
Year 7 FASD Service Network Evaluation EFAN Evaluation Report
23 July 2014 13
proactive increasing awareness of FASD in their region. EFAN’s stakeholder responses had higher agreement rates for all questions related to stakeholder engagement than the combined responses of all Networks’ stakeholders.
3.6. Outcome #3: Training
Network stakeholders have knowledge of and access to training and educational resources that are based on research and leading practice.
Narrative Report and Focus Group Findings
EFAN’s first goal, according to its policy and procedure manual was to encourage the development of a wide range of community information and resources related to FASD. According to focus group participants: “the most important thing that EFAN does is disseminating information to everybody”. In addition to circulating resources developed by others, EFAN created its own resources, such as monthly FASD tip sheets that were available on their website. EFAN encouraged members to attend FASD conferences, in Alberta and beyond. EFAN enabled members to increase their professional expertise because of the sharing and collaboration that occurred during meetings. It enabled members to make the best use of available resources in a coordinated and cost-‐effective way. The Network Coordinator was available to offer training on FASD for staff, parents and caregivers, focusing on strategies to work with persons with FASD. Training sessions were opened to the community: extended families, neighbors, and teachers. Clients and caregivers had access to EFAN resources. Training sessions, online FASD resources, and FASD communities of practice helped decrease the sense of isolation families face. Member agencies could see their client families grow, thanks to training resources. The role of EFAN in directly providing training has decreased over the past years, because of an increase in its administrative duties. The Bissel Centre, one of EFAN’s members, trough funding from Child and Family Services, Alberta, was able to hire 1.5 FTE FASD Educators who currently provide education and trainings to the community EFAN would like to provide more training opportunities, for all new staff, for parents and caregivers, and volunteers. Agencies had limited budgets for professional development, and often conferences have prohibitive costs. For example, very few agencies had the funds to register for the recent FASD conferences in Edmonton. It was only because EFAN received a complementary registration through the Solicitor General that one person could attend the FASD Legal Conference. For the First International FASD Prevention Conference, EFAN could send a person because she was a presenter and her registration fee was waived. In 2012, EFAN sponsored a few students of the University of Alberta to participate in an FASD workshop with Dr. Gabor Maté.
Year 7 FASD Service Network Evaluation EFAN Evaluation Report
23 July 2014 14
Stakeholder Survey Findings
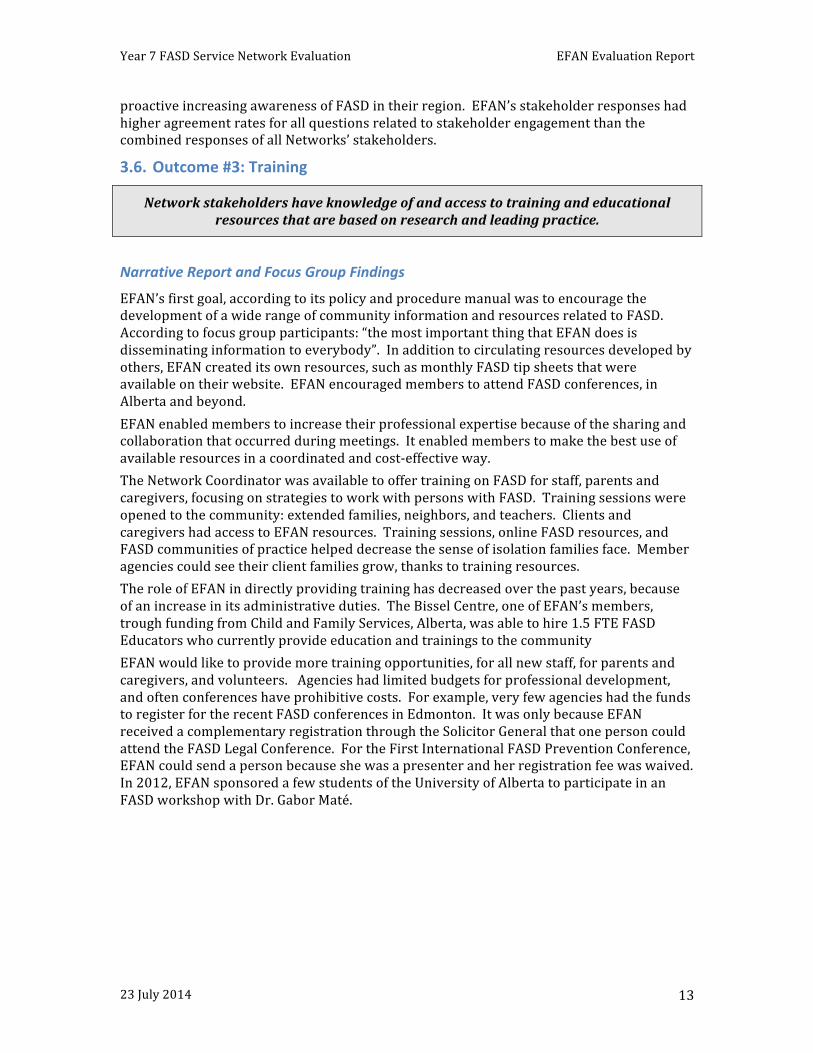
Overall, responses to the Stakeholder Survey questions related to the “training” outcome were positive. Respondents strongly believed that their Network facilitated meaningful information sharing with its members, partners, and the general public. Respondents stated that training and educational resources offered by their Network were based on research and other leading practices. Respondents said that their participation in training offered through their Network had increased their understanding of FASD and that their ability to provide proper care and support to persons affected by FASD had improved. Finally, the knowledge and expertise of Network leadership was rated highly with respondents expressing strong support for their leadership’s capacity in this area.
Question Definitely / Probably
Not Sure Definitely Not / Probably Not
Don’t Know / N/A
Total Responses
25. The Network facilitates sharing of FASD information with members.
EFAN 46 (90%) 1 (2%) 2 (4%) 2 (4%) 51 All Networks 88% 3% 2% 7% 265
26. The Network facilitates sharing of FASD information with partners.
EFAN 46 (90%) 1 (2%) 1 (2%) 3 (6%) 51 All Networks 88% 2% 2% 7% 264
27. The Network facilitates sharing of FASD information with the general public.
EFAN 46 (94%) 2 (4%) 1 (2%) -‐ 49 All Networks 87% 5% 4% 5% 260
28. Training and educational resources offered through the Network are based on research and leading practice.
EFAN 38 (74%) 7 (14%) 1 (2%) 5 (10%) 51 All Networks 83% 5% 1% 10% 265
29. Network leaders are knowledgeable in their area of work.
EFAN 49 (96%) -‐ 1 (2%) 1 (2%) 51 All Networks 91% 3% 1% 5% 266
30. Network leaders are knowledgeable about FASD best practices.
EFAN 49 (96%) -‐ 1 (2%) 1 (2%) 51 All Networks 88% 5% 1% 6% 265
31. As a result of training and educational resources offered through the Network, I have an increased understanding of FASD.
EFAN 42 (82%) 1 (2%) 2 (4%) 6 (12%) 51 All Networks 81% 2% 5% 12% 266
32. Training and educational resources offered through the Network have helped me be more compassionate and understanding towards individuals and families living with FASD.
EFAN 42 (82%) -‐ 3 (6%) 6 (12%) 51 All Networks 79% 3% 6% 12% 265
33. Training and educational resources offered through the Network have helped me improve the way I care for and support persons affected by FASD.
EFAN 41 (80%) -‐ 3 (6%) 7 (14%) 51 All Networks 77% 2% 5% 17% 265
Year 7 FASD Service Network Evaluation EFAN Evaluation Report
23 July 2014 15
3.7. Outcome #4: Practice Informed by Research and Evaluation
Research findings, including those from monitoring and evaluation systems are used to inform FASD strategic planning, and FASD services and programs.
Narrative Report and Focus Group Findings
Because EFAN’s members sat on the provincial FASD Councils, they were made aware of best practices, evaluation findings and new research, and could easily share the information with others on the Network. In recent years, EFAN has increasingly used social media to disseminate FASD information, through a website, a blog, a Facebook and a Twitter account. Agencies appreciated the fact that the FASD Learning Series offered through the government website was available free of charge, and could be viewed from people’s offices or homes at any time. The Learning Series was used as a resource to learn about research and best practice. Occasionally EFAN invited Edmonton researchers to present research findings at their meetings. Smaller member agencies appreciated the fact that by sitting at the EFAN table, they heard first hand about research that happened in larger agencies, and how findings contributed to improving practice. Like other Networks, EFAN contributed to the provincial FASD on-‐line-‐reporting system, with the hope of improving data gathering. There have always been contacts between Edmonton FASD researchers and EFAN members offering FASD services. EFAN itself did not engage in research and did not access any research funding. EFAN was originally getting requests to help connect researchers with agencies. It happened less in later years, because agencies had on-‐going connections with research institutions. Larger agencies, such as Catholic Social Services, were more likely to engage in research than smaller ones, but research findings were shared with everybody. Agencies had learned over time how to screen requests to participate in research projects. They believed that the focus should be on meeting their clients’ needs, not the researcher’s needs. They have also learned to ask for financial resources to cover their costs in participating in research activities. Large agencies, such as Catholic Social Services, who had a long-‐term working relationship with researchers have benefited from having students helping with their own community-‐based research questions, needs assessments, and evaluation.
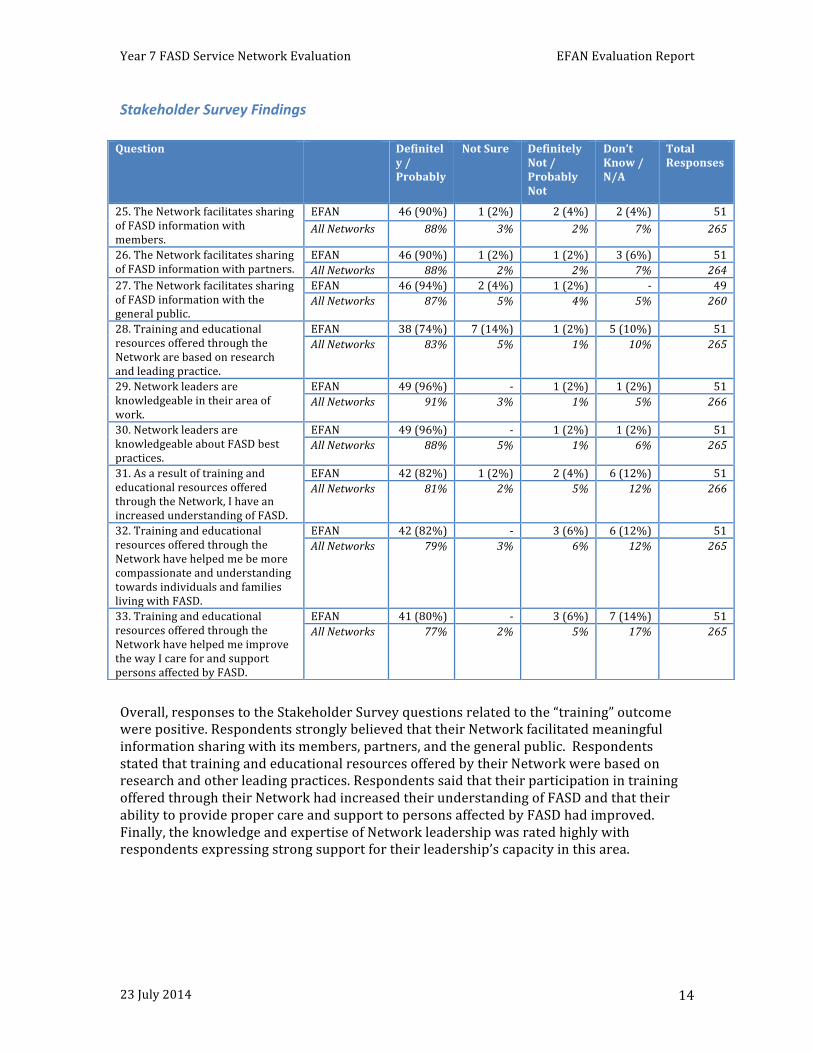
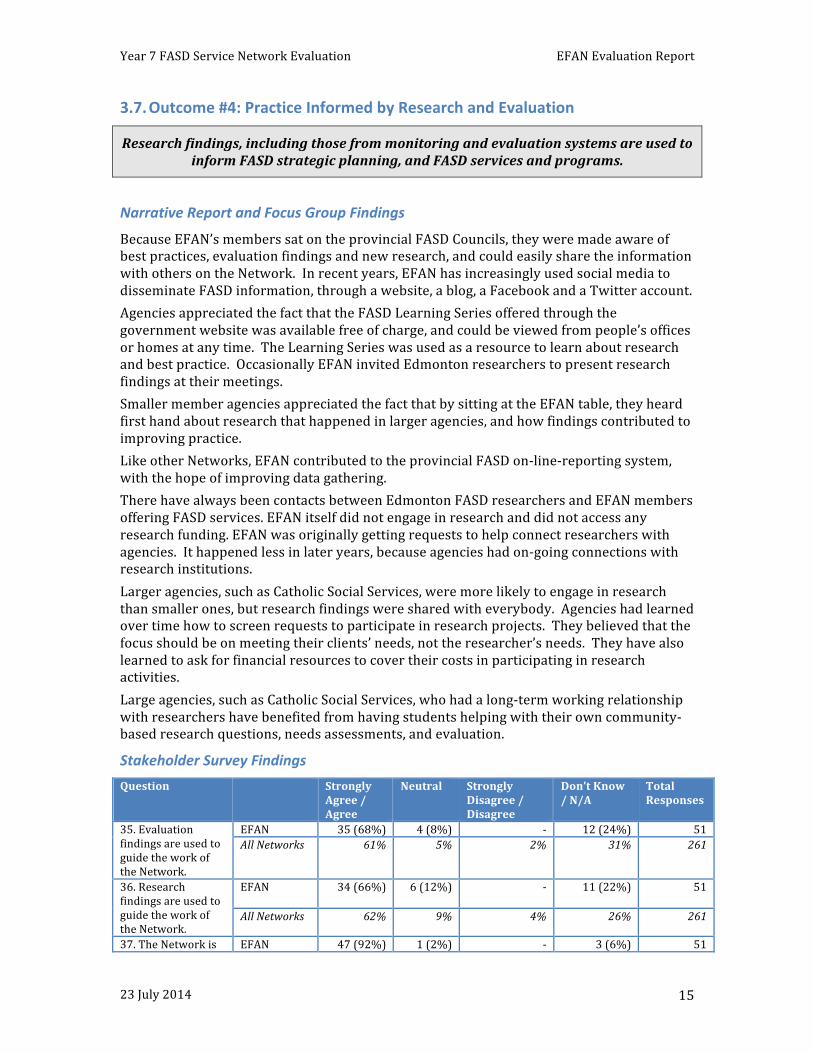
Stakeholder Survey Findings Question Strongly
Agree / Agree
Neutral Strongly Disagree / Disagree
Don’t Know / N/A
Total Responses
35. Evaluation findings are used to guide the work of the Network.
EFAN 35 (68%) 4 (8%) -‐ 12 (24%) 51 All Networks 61% 5% 2% 31% 261
36. Research findings are used to guide the work of the Network.
EFAN 34 (66%)
6 (12%) -‐ 11 (22%)
51
All Networks 62% 9% 4% 26% 261
37. The Network is EFAN 47 (92%) 1 (2%) -‐ 3 (6%) 51
Year 7 FASD Service Network Evaluation EFAN Evaluation Report
23 July 2014 16
Question Strongly Agree / Agree
Neutral Strongly Disagree / Disagree
Don’t Know / N/A
Total Responses
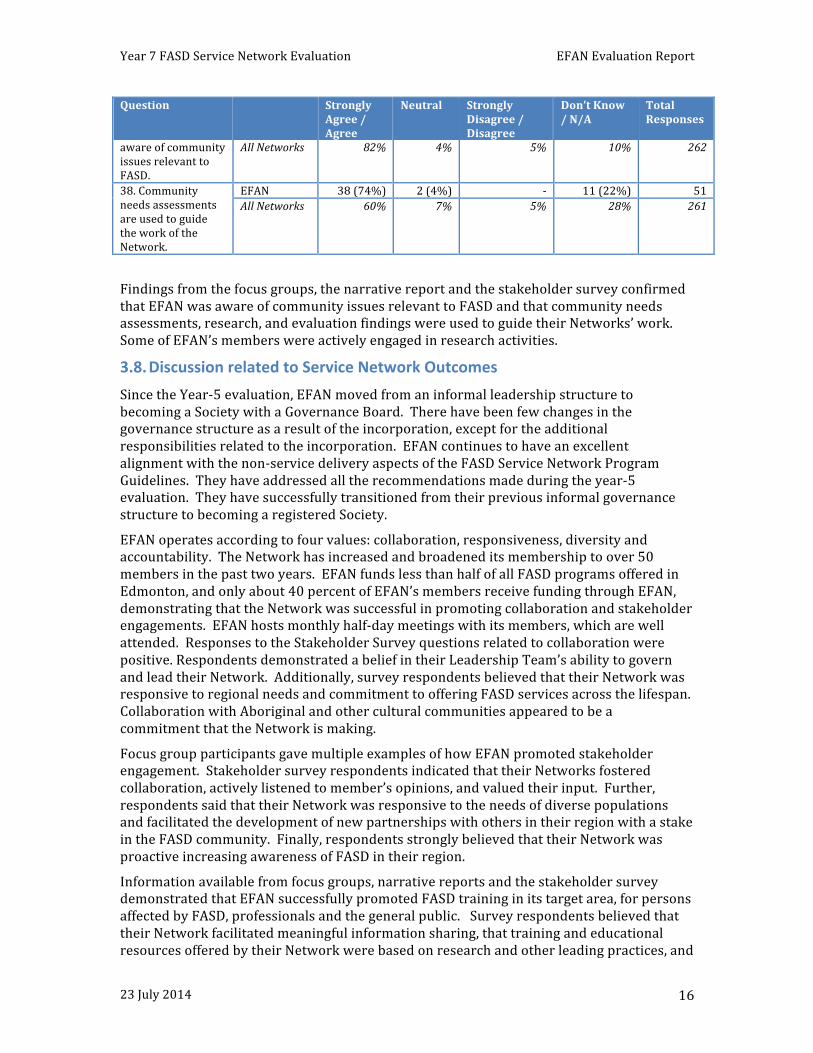
aware of community issues relevant to FASD.
All Networks 82% 4% 5% 10% 262
38. Community needs assessments are used to guide the work of the Network.
EFAN 38 (74%) 2 (4%) -‐ 11 (22%) 51 All Networks 60% 7% 5% 28% 261
Findings from the focus groups, the narrative report and the stakeholder survey confirmed that EFAN was aware of community issues relevant to FASD and that community needs assessments, research, and evaluation findings were used to guide their Networks’ work. Some of EFAN’s members were actively engaged in research activities.
3.8. Discussion related to Service Network Outcomes Since the Year-‐5 evaluation, EFAN moved from an informal leadership structure to becoming a Society with a Governance Board. There have been few changes in the governance structure as a result of the incorporation, except for the additional responsibilities related to the incorporation. EFAN continues to have an excellent alignment with the non-‐service delivery aspects of the FASD Service Network Program Guidelines. They have addressed all the recommendations made during the year-‐5 evaluation. They have successfully transitioned from their previous informal governance structure to becoming a registered Society.
EFAN operates according to four values: collaboration, responsiveness, diversity and accountability. The Network has increased and broadened its membership to over 50 members in the past two years. EFAN funds less than half of all FASD programs offered in Edmonton, and only about 40 percent of EFAN’s members receive funding through EFAN, demonstrating that the Network was successful in promoting collaboration and stakeholder engagements. EFAN hosts monthly half-‐day meetings with its members, which are well attended. Responses to the Stakeholder Survey questions related to collaboration were positive. Respondents demonstrated a belief in their Leadership Team’s ability to govern and lead their Network. Additionally, survey respondents believed that their Network was responsive to regional needs and commitment to offering FASD services across the lifespan. Collaboration with Aboriginal and other cultural communities appeared to be a commitment that the Network is making.
Focus group participants gave multiple examples of how EFAN promoted stakeholder engagement. Stakeholder survey respondents indicated that their Networks fostered collaboration, actively listened to member’s opinions, and valued their input. Further, respondents said that their Network was responsive to the needs of diverse populations and facilitated the development of new partnerships with others in their region with a stake in the FASD community. Finally, respondents strongly believed that their Network was proactive increasing awareness of FASD in their region.
Information available from focus groups, narrative reports and the stakeholder survey demonstrated that EFAN successfully promoted FASD training in its target area, for persons affected by FASD, professionals and the general public. Survey respondents believed that their Network facilitated meaningful information sharing, that training and educational resources offered by their Network were based on research and other leading practices, and
Year 7 FASD Service Network Evaluation EFAN Evaluation Report
23 July 2014 17
that their participation in training offered through their Network had increased their understanding of FASD and that their ability to provide proper care and support to persons affected by FASD had improved.
Findings from the focus groups, the narrative report and the stakeholder survey confirmed that EFAN was aware of community issues relevant to FASD and that community needs assessments, research, and evaluation findings were used to guide their Networks’ work. Some of EFAN’s members were actively engaged in research activities.
EFAN’s stakeholder responses had higher agreement rates for all questions related to collaboration, stakeholder engagement, training, and evaluation & research than the combined responses of all Networks’ stakeholders.
EFAN continues to have a strong governance structure, and is successfully meeting all Service Network outcomes.
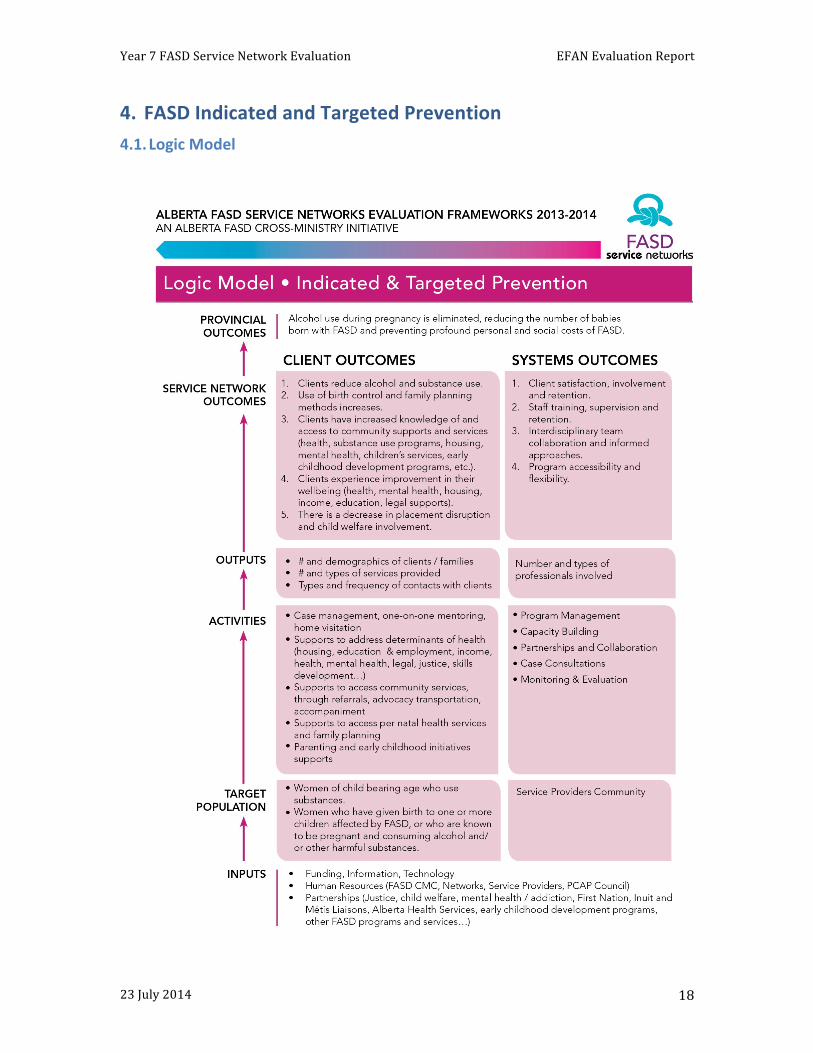
Year 7 FASD Service Network Evaluation EFAN Evaluation Report
23 July 2014 18
4. FASD Indicated and Targeted Prevention 4.1. Logic Model
Year 7 FASD Service Network Evaluation EFAN Evaluation Report
23 July 2014 19
4.2. Outputs EFAN offers FASD prevention services through the Bosco Homes PCAP program for at risk Aboriginal women and the Catholic Social Services First Steps program. The First Steps program served 28 unique clients and Bosco home 30 unique clients in 2012-‐13, through the funding provided by EFAN. The PCAP program funded through Catholic Social Services has multiple funders (EFAN, Edmonton and Area child and family services authority, Signs of Hope fundraising campaign and other provincial FASD funding). Alberta Health Services also provides services to women with substance abuse problems who are or may become pregnant through their “enhanced services for women” program. EFAN’s PCAP program created 33 new client files in ORS (prevention pillar) between July 2012 and September 2013. Of those, 24 files had data for at least two consecutive quarters, 12 for 3 consecutive quarters, 4 for 4 consecutive quarters, and 1 for 5 consecutive quarters. Even though PCAP is a 3-‐year program, ORS data suggests that there were either data entry problems or that a large percentage of clients left the program prior to completing the 3 years.
• 31 PCAP files could be tracked over 2 reporting periods (6 months); only 24 files (77% of original number) still had data in the 2nd reporting period.
• 28 could be tracked over a period of 3 reporting periods (9 months); only 12 files (43% of original number) still had data in the 3rd reporting period.
• 11 could be tracked over 4 reporting periods (12 months); only 4 (36%) still had data in the 4th reporting period.
The Alberta PCAP manual suggests approximately 33% of clients will not complete the PCAP program. EFAN ORS data suggests that a lower retention rate. It is unclear whether clients exited the program early, or whether there were problems with ORS data entry. 13 of the 33 women (39%) were known to be pregnant during the quarter their file was newly created; 55% were not pregnant, and the pregnancy status was unknown or not reported for the remaining 6%. Of the women still enrolled in the program during the following quarter (4-‐6 months in the program), 17% were still pregnant, 54% were not pregnant, and the pregnant status was not reported or unknown for the remaining 29%. The pregnancy outcome was reported for 5 pregnant women only. All of them had a live birth. Three children had a normal birth outcome and 1 had health complications.
4.3. Outcome #1: Reduction in Alcohol and Substance Abuse
Clients reduce alcohol and substance abuse.
ORS Findings
Findings are based on a small sample size: 13 women were pregnant at the time of admission in the PCAP program (0-‐3 months), 4 were pregnant in the 2nd quarter in the program (4-‐6 months) and 1 in the 3rd quarter (7-‐9 months)
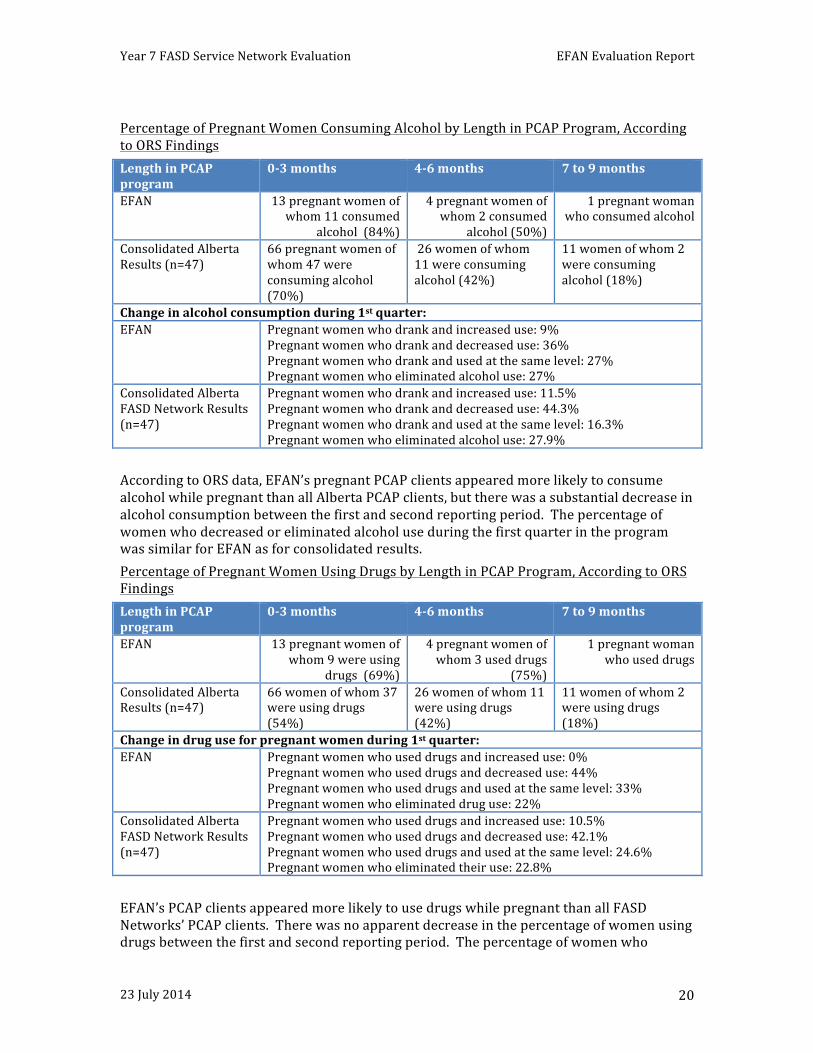
Year 7 FASD Service Network Evaluation EFAN Evaluation Report
23 July 2014 20
Percentage of Pregnant Women Consuming Alcohol by Length in PCAP Program, According to ORS Findings Length in PCAP program
0-‐3 months 4-‐6 months 7 to 9 months
EFAN 13 pregnant women of whom 11 consumed
alcohol (84%)
4 pregnant women of whom 2 consumed
alcohol (50%)
1 pregnant woman who consumed alcohol
Consolidated Alberta Results (n=47)
66 pregnant women of whom 47 were consuming alcohol (70%)
26 women of whom 11 were consuming alcohol (42%)
11 women of whom 2 were consuming alcohol (18%)
Change in alcohol consumption during 1st quarter: EFAN Pregnant women who drank and increased use: 9%
Pregnant women who drank and decreased use: 36% Pregnant women who drank and used at the same level: 27% Pregnant women who eliminated alcohol use: 27%
Consolidated Alberta FASD Network Results (n=47)
Pregnant women who drank and increased use: 11.5% Pregnant women who drank and decreased use: 44.3% Pregnant women who drank and used at the same level: 16.3% Pregnant women who eliminated alcohol use: 27.9%
According to ORS data, EFAN’s pregnant PCAP clients appeared more likely to consume alcohol while pregnant than all Alberta PCAP clients, but there was a substantial decrease in alcohol consumption between the first and second reporting period. The percentage of women who decreased or eliminated alcohol use during the first quarter in the program was similar for EFAN as for consolidated results. Percentage of Pregnant Women Using Drugs by Length in PCAP Program, According to ORS Findings Length in PCAP program
0-‐3 months 4-‐6 months 7 to 9 months
EFAN 13 pregnant women of whom 9 were using
drugs (69%)
4 pregnant women of whom 3 used drugs
(75%)
1 pregnant woman who used drugs
Consolidated Alberta Results (n=47)
66 women of whom 37 were using drugs (54%)
26 women of whom 11 were using drugs (42%)
11 women of whom 2 were using drugs (18%)
Change in drug use for pregnant women during 1st quarter: EFAN Pregnant women who used drugs and increased use: 0%
Pregnant women who used drugs and decreased use: 44% Pregnant women who used drugs and used at the same level: 33% Pregnant women who eliminated drug use: 22%
Consolidated Alberta FASD Network Results (n=47)
Pregnant women who used drugs and increased use: 10.5% Pregnant women who used drugs and decreased use: 42.1% Pregnant women who used drugs and used at the same level: 24.6% Pregnant women who eliminated their use: 22.8%
EFAN’s PCAP clients appeared more likely to use drugs while pregnant than all FASD Networks’ PCAP clients. There was no apparent decrease in the percentage of women using drugs between the first and second reporting period. The percentage of women who
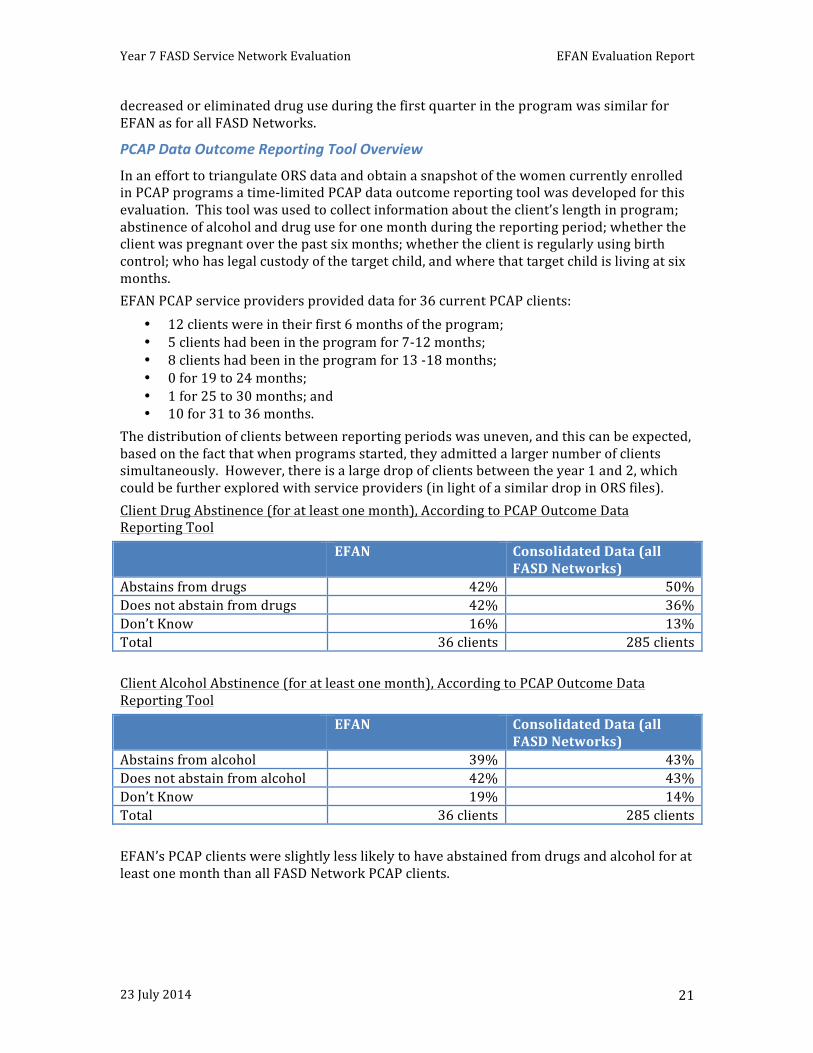
Year 7 FASD Service Network Evaluation EFAN Evaluation Report
23 July 2014 21
decreased or eliminated drug use during the first quarter in the program was similar for EFAN as for all FASD Networks.
PCAP Data Outcome Reporting Tool Overview
In an effort to triangulate ORS data and obtain a snapshot of the women currently enrolled in PCAP programs a time-‐limited PCAP data outcome reporting tool was developed for this evaluation. This tool was used to collect information about the client’s length in program; abstinence of alcohol and drug use for one month during the reporting period; whether the client was pregnant over the past six months; whether the client is regularly using birth control; who has legal custody of the target child, and where that target child is living at six months. EFAN PCAP service providers provided data for 36 current PCAP clients:
• 12 clients were in their first 6 months of the program; • 5 clients had been in the program for 7-‐12 months; • 8 clients had been in the program for 13 -‐18 months; • 0 for 19 to 24 months; • 1 for 25 to 30 months; and • 10 for 31 to 36 months.
The distribution of clients between reporting periods was uneven, and this can be expected, based on the fact that when programs started, they admitted a larger number of clients simultaneously. However, there is a large drop of clients between the year 1 and 2, which could be further explored with service providers (in light of a similar drop in ORS files). Client Drug Abstinence (for at least one month), According to PCAP Outcome Data Reporting Tool EFAN Consolidated Data (all
FASD Networks) Abstains from drugs 42% 50% Does not abstain from drugs 42% 36% Don’t Know 16% 13% Total 36 clients 285 clients Client Alcohol Abstinence (for at least one month), According to PCAP Outcome Data Reporting Tool EFAN Consolidated Data (all
FASD Networks) Abstains from alcohol 39% 43% Does not abstain from alcohol 42% 43% Don’t Know 19% 14% Total 36 clients 285 clients EFAN’s PCAP clients were slightly less likely to have abstained from drugs and alcohol for at least one month than all FASD Network PCAP clients.
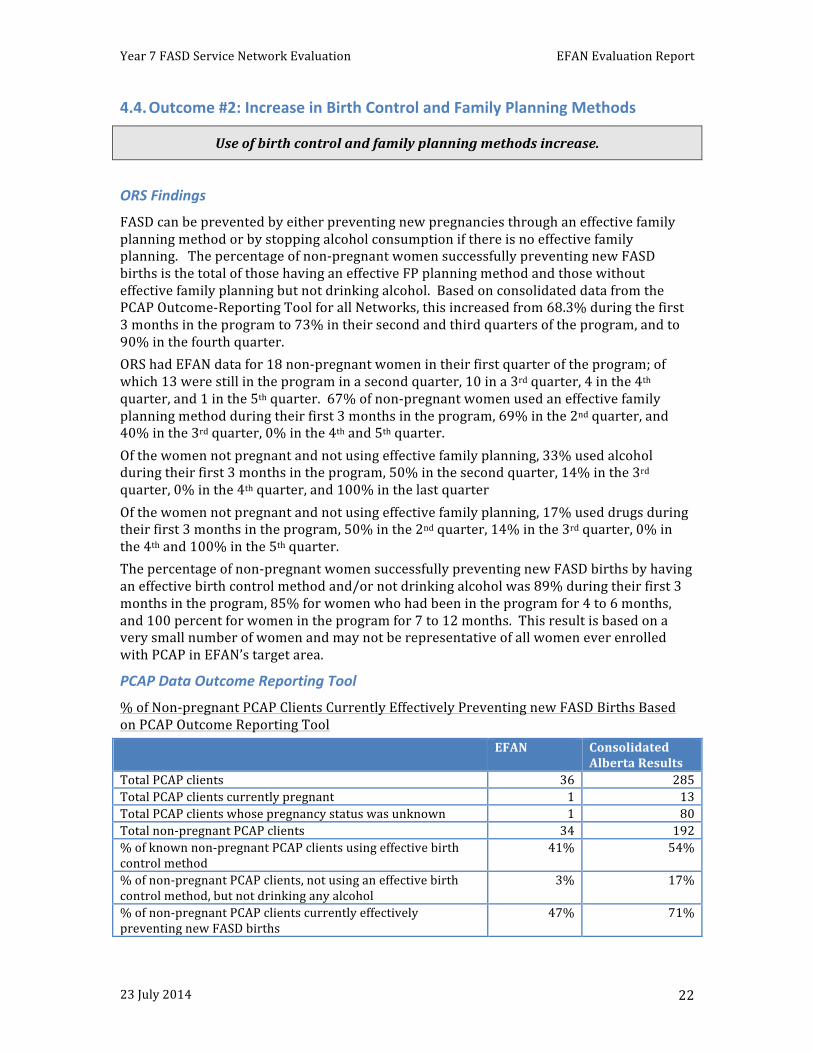
Year 7 FASD Service Network Evaluation EFAN Evaluation Report
23 July 2014 22
4.4. Outcome #2: Increase in Birth Control and Family Planning Methods
Use of birth control and family planning methods increase.
ORS Findings
FASD can be prevented by either preventing new pregnancies through an effective family planning method or by stopping alcohol consumption if there is no effective family planning. The percentage of non-‐pregnant women successfully preventing new FASD births is the total of those having an effective FP planning method and those without effective family planning but not drinking alcohol. Based on consolidated data from the PCAP Outcome-‐Reporting Tool for all Networks, this increased from 68.3% during the first 3 months in the program to 73% in their second and third quarters of the program, and to 90% in the fourth quarter. ORS had EFAN data for 18 non-‐pregnant women in their first quarter of the program; of which 13 were still in the program in a second quarter, 10 in a 3rd quarter, 4 in the 4th quarter, and 1 in the 5th quarter. 67% of non-‐pregnant women used an effective family planning method during their first 3 months in the program, 69% in the 2nd quarter, and 40% in the 3rd quarter, 0% in the 4th and 5th quarter. Of the women not pregnant and not using effective family planning, 33% used alcohol during their first 3 months in the program, 50% in the second quarter, 14% in the 3rd quarter, 0% in the 4th quarter, and 100% in the last quarter Of the women not pregnant and not using effective family planning, 17% used drugs during their first 3 months in the program, 50% in the 2nd quarter, 14% in the 3rd quarter, 0% in the 4th and 100% in the 5th quarter. The percentage of non-‐pregnant women successfully preventing new FASD births by having an effective birth control method and/or not drinking alcohol was 89% during their first 3 months in the program, 85% for women who had been in the program for 4 to 6 months, and 100 percent for women in the program for 7 to 12 months. This result is based on a very small number of women and may not be representative of all women ever enrolled with PCAP in EFAN’s target area.
PCAP Data Outcome Reporting Tool
% of Non-‐pregnant PCAP Clients Currently Effectively Preventing new FASD Births Based on PCAP Outcome Reporting Tool EFAN Consolidated
Alberta Results Total PCAP clients 36 285 Total PCAP clients currently pregnant 1 13 Total PCAP clients whose pregnancy status was unknown 1 80 Total non-‐pregnant PCAP clients 34 192 % of known non-‐pregnant PCAP clients using effective birth control method
41% 54%
% of non-‐pregnant PCAP clients, not using an effective birth control method, but not drinking any alcohol
3% 17%
% of non-‐pregnant PCAP clients currently effectively preventing new FASD births
47% 71%
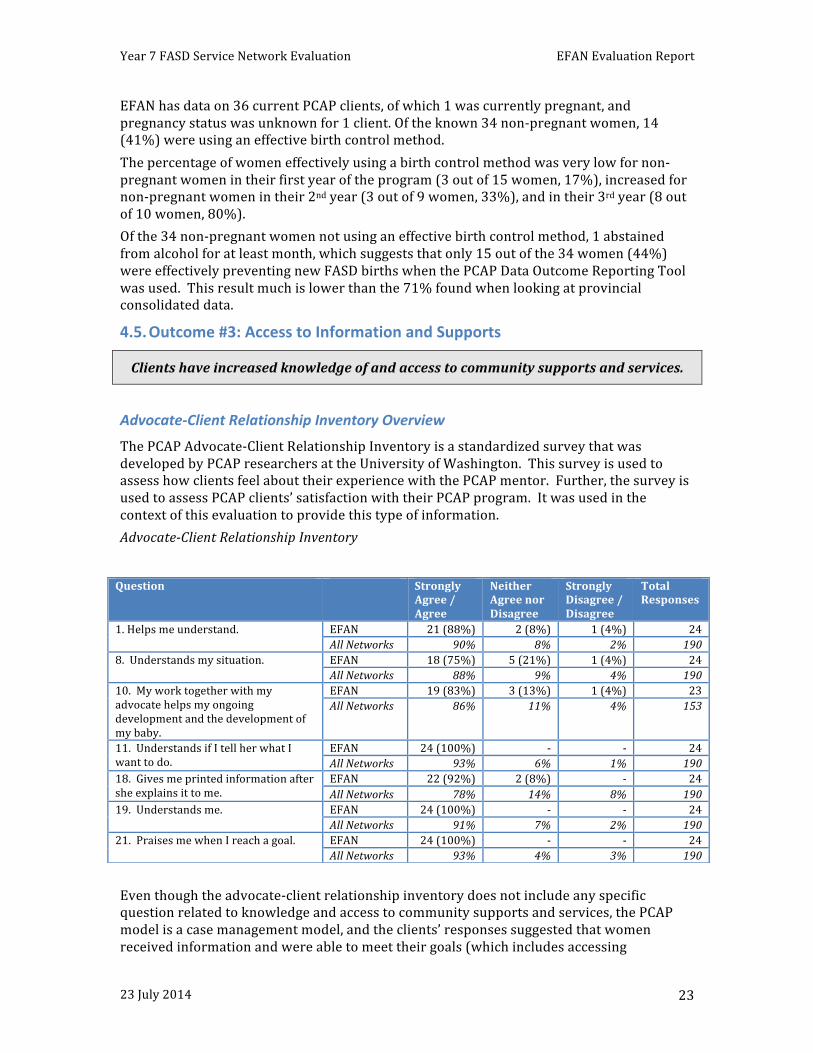
Year 7 FASD Service Network Evaluation EFAN Evaluation Report
23 July 2014 23
EFAN has data on 36 current PCAP clients, of which 1 was currently pregnant, and pregnancy status was unknown for 1 client. Of the known 34 non-‐pregnant women, 14 (41%) were using an effective birth control method. The percentage of women effectively using a birth control method was very low for non-‐pregnant women in their first year of the program (3 out of 15 women, 17%), increased for non-‐pregnant women in their 2nd year (3 out of 9 women, 33%), and in their 3rd year (8 out of 10 women, 80%). Of the 34 non-‐pregnant women not using an effective birth control method, 1 abstained from alcohol for at least month, which suggests that only 15 out of the 34 women (44%) were effectively preventing new FASD births when the PCAP Data Outcome Reporting Tool was used. This result much is lower than the 71% found when looking at provincial consolidated data.
4.5. Outcome #3: Access to Information and Supports
Clients have increased knowledge of and access to community supports and services.
Advocate-‐Client Relationship Inventory Overview
The PCAP Advocate-‐Client Relationship Inventory is a standardized survey that was developed by PCAP researchers at the University of Washington. This survey is used to assess how clients feel about their experience with the PCAP mentor. Further, the survey is used to assess PCAP clients’ satisfaction with their PCAP program. It was used in the context of this evaluation to provide this type of information. Advocate-‐Client Relationship Inventory
Even though the advocate-‐client relationship inventory does not include any specific question related to knowledge and access to community supports and services, the PCAP model is a case management model, and the clients’ responses suggested that women received information and were able to meet their goals (which includes accessing
Question Strongly Agree / Agree
Neither Agree nor Disagree
Strongly Disagree / Disagree
Total Responses
1. Helps me understand. EFAN 21 (88%) 2 (8%) 1 (4%) 24 All Networks 90% 8% 2% 190
8. Understands my situation. EFAN 18 (75%) 5 (21%) 1 (4%) 24 All Networks 88% 9% 4% 190
10. My work together with my advocate helps my ongoing development and the development of my baby.
EFAN 19 (83%) 3 (13%) 1 (4%) 23 All Networks 86% 11% 4% 153
11. Understands if I tell her what I want to do.
EFAN 24 (100%) -‐ -‐ 24 All Networks 93% 6% 1% 190
18. Gives me printed information after she explains it to me.
EFAN 22 (92%) 2 (8%) -‐ 24 All Networks 78% 14% 8% 190
19. Understands me. EFAN 24 (100%) -‐ -‐ 24 All Networks 91% 7% 2% 190
21. Praises me when I reach a goal. EFAN 24 (100%) -‐ -‐ 24 All Networks 93% 4% 3% 190
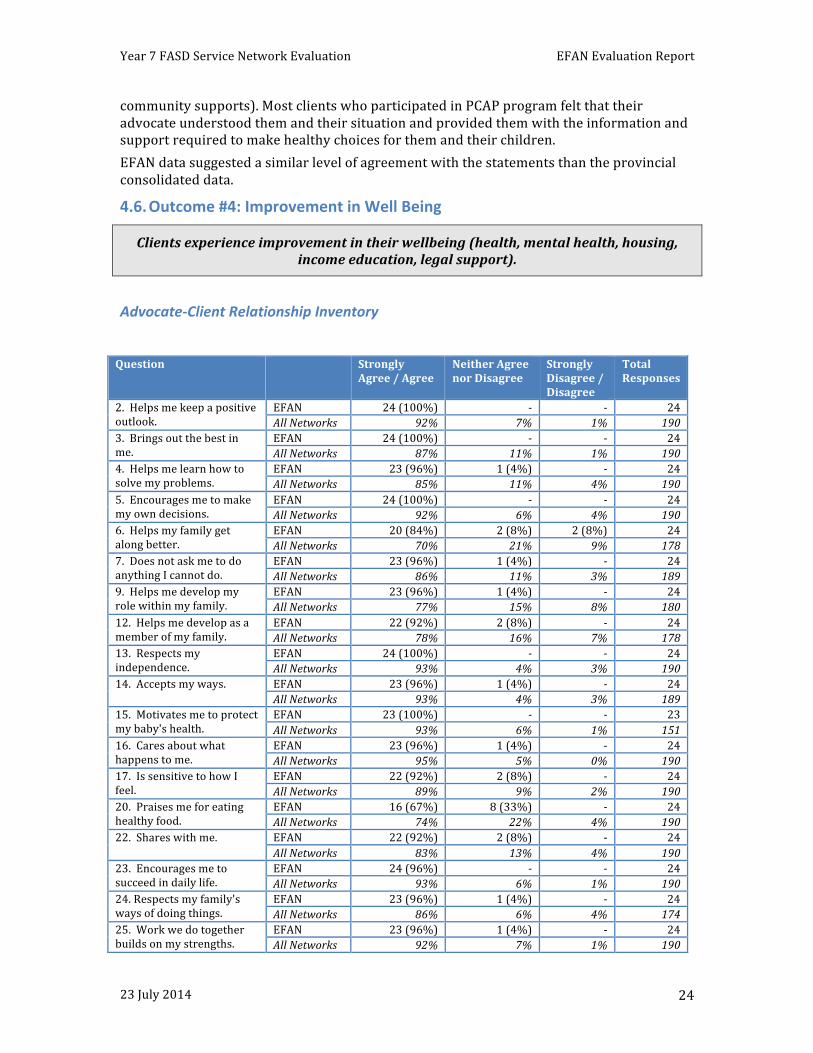
Year 7 FASD Service Network Evaluation EFAN Evaluation Report
23 July 2014 24
community supports). Most clients who participated in PCAP program felt that their advocate understood them and their situation and provided them with the information and support required to make healthy choices for them and their children. EFAN data suggested a similar level of agreement with the statements than the provincial consolidated data.
4.6. Outcome #4: Improvement in Well Being
Clients experience improvement in their wellbeing (health, mental health, housing, income education, legal support).
Advocate-‐Client Relationship Inventory
Question Strongly Agree / Agree
Neither Agree nor Disagree
Strongly Disagree / Disagree
Total Responses
2. Helps me keep a positive outlook.
EFAN 24 (100%) -‐ -‐ 24 All Networks 92% 7% 1% 190
3. Brings out the best in me.
EFAN 24 (100%) -‐ -‐ 24 All Networks 87% 11% 1% 190
4. Helps me learn how to solve my problems.
EFAN 23 (96%) 1 (4%) -‐ 24 All Networks 85% 11% 4% 190
5. Encourages me to make my own decisions.
EFAN 24 (100%) -‐ -‐ 24 All Networks 92% 6% 4% 190
6. Helps my family get along better.
EFAN 20 (84%) 2 (8%) 2 (8%) 24 All Networks 70% 21% 9% 178
7. Does not ask me to do anything I cannot do.
EFAN 23 (96%) 1 (4%) -‐ 24 All Networks 86% 11% 3% 189
9. Helps me develop my role within my family.
EFAN 23 (96%) 1 (4%) -‐ 24 All Networks 77% 15% 8% 180
12. Helps me develop as a member of my family.
EFAN 22 (92%) 2 (8%) -‐ 24 All Networks 78% 16% 7% 178
13. Respects my independence.
EFAN 24 (100%) -‐ -‐ 24 All Networks 93% 4% 3% 190
14. Accepts my ways. EFAN 23 (96%) 1 (4%) -‐ 24 All Networks 93% 4% 3% 189
15. Motivates me to protect my baby's health.
EFAN 23 (100%) -‐ -‐ 23 All Networks 93% 6% 1% 151
16. Cares about what happens to me.
EFAN 23 (96%) 1 (4%) -‐ 24 All Networks 95% 5% 0% 190
17. Is sensitive to how I feel.
EFAN 22 (92%) 2 (8%) -‐ 24 All Networks 89% 9% 2% 190
20. Praises me for eating healthy food.
EFAN 16 (67%) 8 (33%) -‐ 24 All Networks 74% 22% 4% 190
22. Shares with me. EFAN 22 (92%) 2 (8%) -‐ 24 All Networks 83% 13% 4% 190
23. Encourages me to succeed in daily life.
EFAN 24 (96%) -‐ -‐ 24 All Networks 93% 6% 1% 190
24. Respects my family's ways of doing things.
EFAN 23 (96%) 1 (4%) -‐ 24 All Networks 86% 6% 4% 174
25. Work we do together builds on my strengths.
EFAN 23 (96%) 1 (4%) -‐ 24 All Networks 92% 7% 1% 190
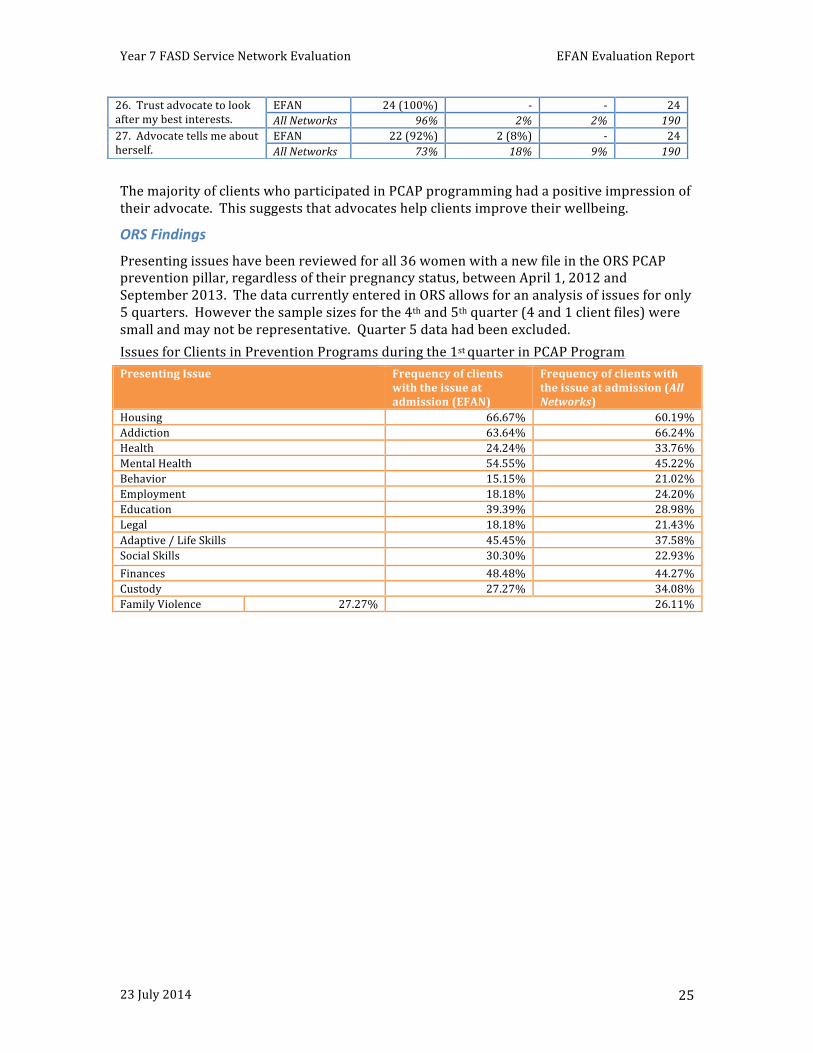
Year 7 FASD Service Network Evaluation EFAN Evaluation Report
23 July 2014 25
The majority of clients who participated in PCAP programming had a positive impression of their advocate. This suggests that advocates help clients improve their wellbeing.
ORS Findings
Presenting issues have been reviewed for all 36 women with a new file in the ORS PCAP prevention pillar, regardless of their pregnancy status, between April 1, 2012 and September 2013. The data currently entered in ORS allows for an analysis of issues for only 5 quarters. However the sample sizes for the 4th and 5th quarter (4 and 1 client files) were small and may not be representative. Quarter 5 data had been excluded. Issues for Clients in Prevention Programs during the 1st quarter in PCAP Program Presenting Issue Frequency of clients
with the issue at admission (EFAN)
Frequency of clients with the issue at admission (All Networks)
Housing 66.67% 60.19% Addiction 63.64% 66.24% Health 24.24% 33.76% Mental Health 54.55% 45.22% Behavior 15.15% 21.02% Employment 18.18% 24.20% Education 39.39% 28.98% Legal 18.18% 21.43% Adaptive / Life Skills 45.45% 37.58% Social Skills 30.30% 22.93% Finances 48.48% 44.27% Custody 27.27% 34.08% Family Violence 27.27% 26.11%
26. Trust advocate to look after my best interests.
EFAN 24 (100%) -‐ -‐ 24 All Networks 96% 2% 2% 190
27. Advocate tells me about herself.
EFAN 22 (92%) 2 (8%) -‐ 24 All Networks 73% 18% 9% 190
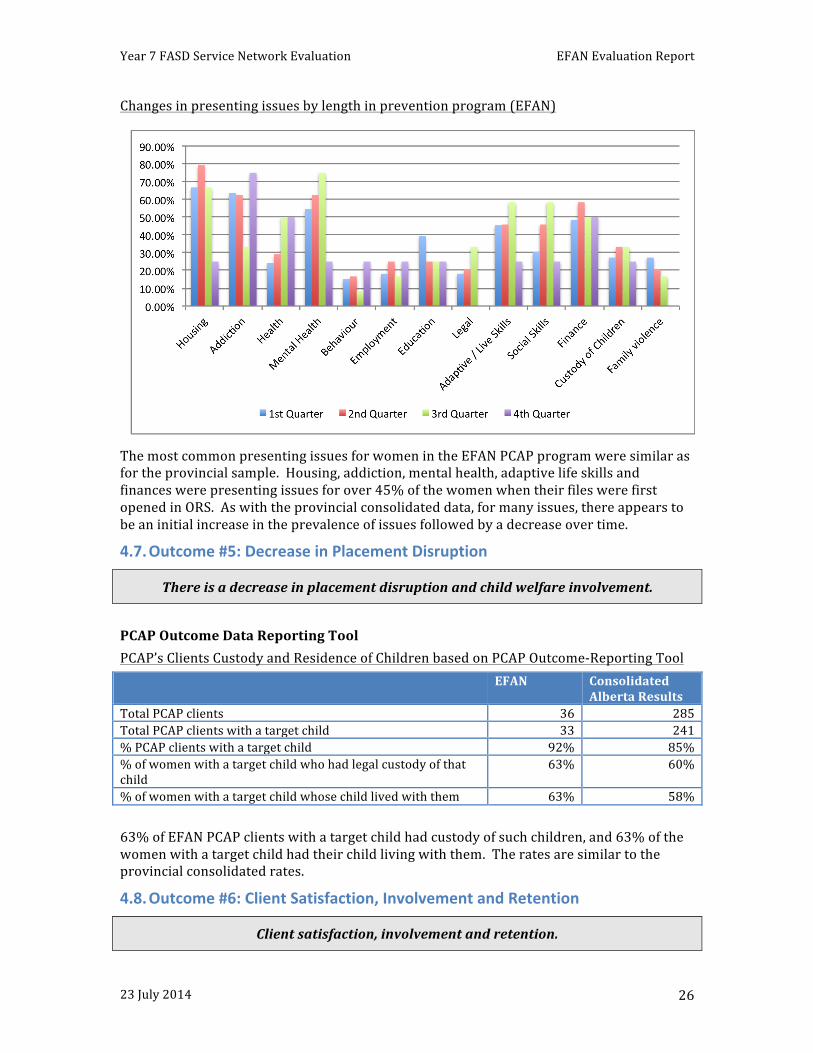
Year 7 FASD Service Network Evaluation EFAN Evaluation Report
23 July 2014 26
Changes in presenting issues by length in prevention program (EFAN)
The most common presenting issues for women in the EFAN PCAP program were similar as for the provincial sample. Housing, addiction, mental health, adaptive life skills and finances were presenting issues for over 45% of the women when their files were first opened in ORS. As with the provincial consolidated data, for many issues, there appears to be an initial increase in the prevalence of issues followed by a decrease over time.
4.7. Outcome #5: Decrease in Placement Disruption
There is a decrease in placement disruption and child welfare involvement.
PCAP Outcome Data Reporting Tool PCAP’s Clients Custody and Residence of Children based on PCAP Outcome-‐Reporting Tool EFAN Consolidated
Alberta Results Total PCAP clients 36 285 Total PCAP clients with a target child 33 241 % PCAP clients with a target child 92% 85% % of women with a target child who had legal custody of that child
63% 60%
% of women with a target child whose child lived with them 63% 58% 63% of EFAN PCAP clients with a target child had custody of such children, and 63% of the women with a target child had their child living with them. The rates are similar to the provincial consolidated rates.
4.8. Outcome #6: Client Satisfaction, Involvement and Retention
Client satisfaction, involvement and retention.
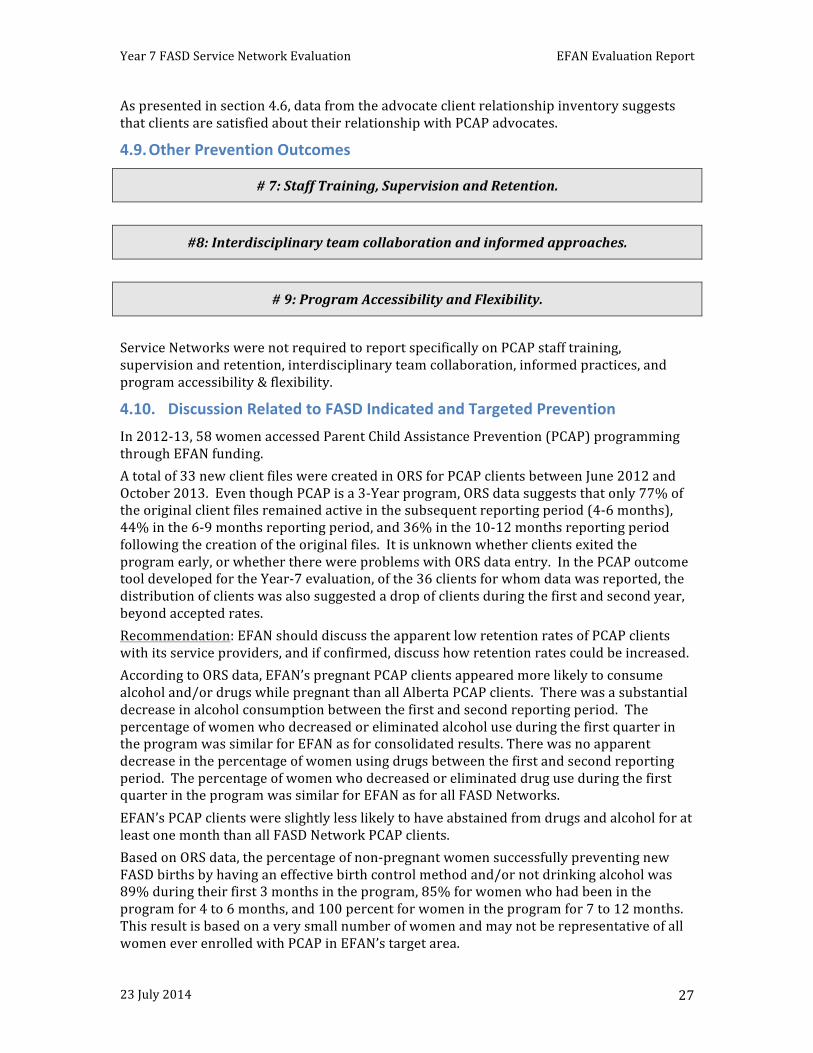
Year 7 FASD Service Network Evaluation EFAN Evaluation Report
23 July 2014 27
As presented in section 4.6, data from the advocate client relationship inventory suggests that clients are satisfied about their relationship with PCAP advocates.
4.9. Other Prevention Outcomes
# 7: Staff Training, Supervision and Retention.
#8: Interdisciplinary team collaboration and informed approaches.
# 9: Program Accessibility and Flexibility.
Service Networks were not required to report specifically on PCAP staff training, supervision and retention, interdisciplinary team collaboration, informed practices, and program accessibility & flexibility.
4.10. Discussion Related to FASD Indicated and Targeted Prevention In 2012-‐13, 58 women accessed Parent Child Assistance Prevention (PCAP) programming through EFAN funding. A total of 33 new client files were created in ORS for PCAP clients between June 2012 and October 2013. Even though PCAP is a 3-‐Year program, ORS data suggests that only 77% of the original client files remained active in the subsequent reporting period (4-‐6 months), 44% in the 6-‐9 months reporting period, and 36% in the 10-‐12 months reporting period following the creation of the original files. It is unknown whether clients exited the program early, or whether there were problems with ORS data entry. In the PCAP outcome tool developed for the Year-‐7 evaluation, of the 36 clients for whom data was reported, the distribution of clients was also suggested a drop of clients during the first and second year, beyond accepted rates. Recommendation: EFAN should discuss the apparent low retention rates of PCAP clients with its service providers, and if confirmed, discuss how retention rates could be increased. According to ORS data, EFAN’s pregnant PCAP clients appeared more likely to consume alcohol and/or drugs while pregnant than all Alberta PCAP clients. There was a substantial decrease in alcohol consumption between the first and second reporting period. The percentage of women who decreased or eliminated alcohol use during the first quarter in the program was similar for EFAN as for consolidated results. There was no apparent decrease in the percentage of women using drugs between the first and second reporting period. The percentage of women who decreased or eliminated drug use during the first quarter in the program was similar for EFAN as for all FASD Networks. EFAN’s PCAP clients were slightly less likely to have abstained from drugs and alcohol for at least one month than all FASD Network PCAP clients. Based on ORS data, the percentage of non-‐pregnant women successfully preventing new FASD births by having an effective birth control method and/or not drinking alcohol was 89% during their first 3 months in the program, 85% for women who had been in the program for 4 to 6 months, and 100 percent for women in the program for 7 to 12 months. This result is based on a very small number of women and may not be representative of all women ever enrolled with PCAP in EFAN’s target area.
Year 7 FASD Service Network Evaluation EFAN Evaluation Report
23 July 2014 28
EFAN submitted data on 36 current PCAP clients through the PCAP Outcome Reporting tool. Of the known 34 non-‐pregnant women, 14 (41%) were using an effective birth control method. The percentage of non-‐pregnant women effectively using a birth control method was very low in the 1st and 2nd year of the program (17% and 33%), but increased to 80% in the 3rd year. Of the 34 non-‐pregnant women not using an effective birth control method, 1 abstained from alcohol for at least month, which suggests that only 15 out of the 34 women were effectively prevention new FASD births when the PCAP Data Outcome Reporting Tool as used. This result much is lower than the 71% found when looking at provincial consolidated data. There is a discrepancy between findings from ORS and the PCAP outcome-‐reporting tool. Recommendation: The low rates in use of birth control in the first two years of the program and the low rate of women effectively preventing FASD births should be investigated further. The most common presenting issues for women in the EFAN PCAP program were similar as for the provincial sample. Housing, addiction, mental health, adaptive life skills and finances were presenting issues for over 45% of the women when their files were first opened in ORS. As with the provincial consolidated data, for many issues, there appears to be an initial increase in the prevalence of issues followed by a decrease over time. 63% of EFAN PCAP clients with a target child had custody of such children, and 63% of the children lived with their mothers. The rates are similar to the provincial consolidated rates. Overall, EFAN’s PCAP programs appear to meet the Service Network Prevention Outcomes. More information is needed to explain lower than provincial retention rates and effective prevention of FASD birth rates.
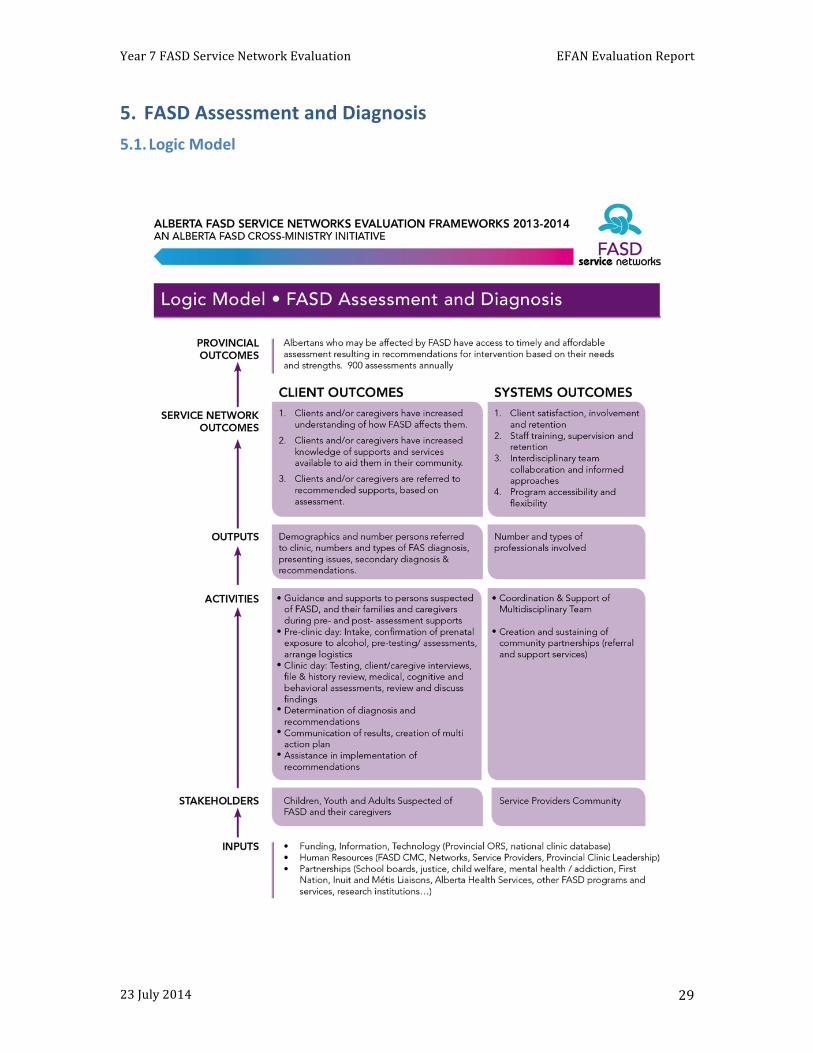
Year 7 FASD Service Network Evaluation EFAN Evaluation Report
23 July 2014 29
5. FASD Assessment and Diagnosis 5.1. Logic Model
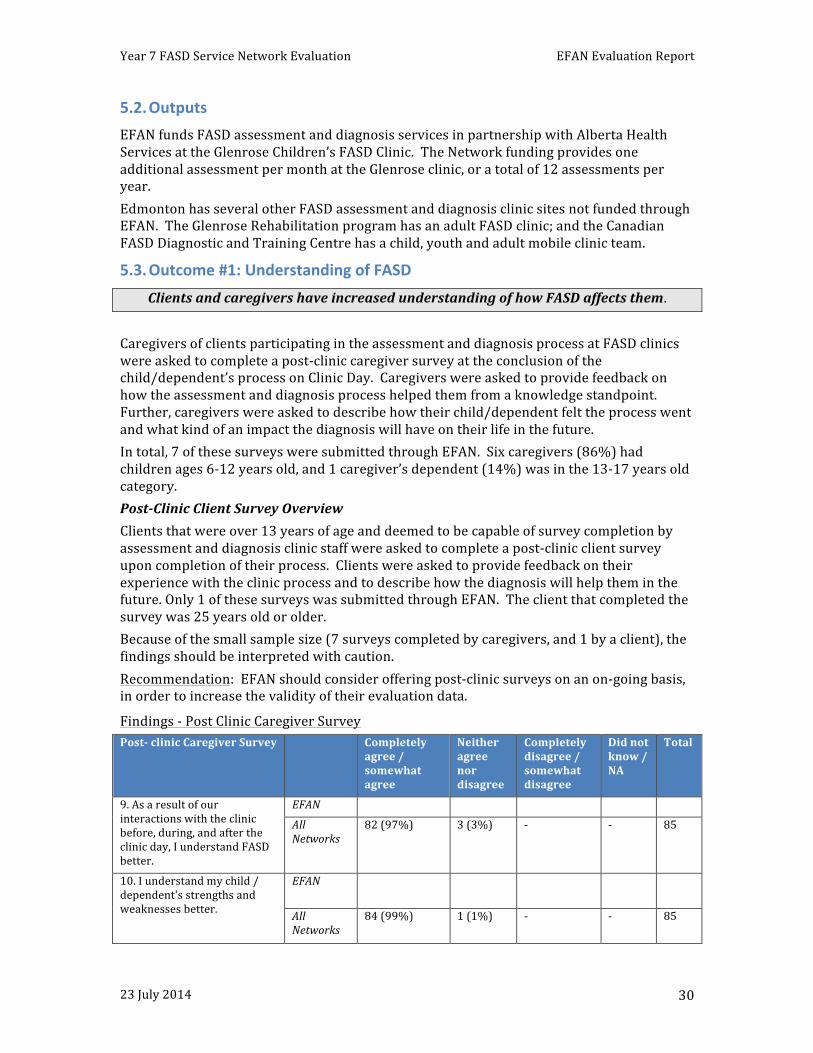
Year 7 FASD Service Network Evaluation EFAN Evaluation Report
23 July 2014 30
5.2. Outputs EFAN funds FASD assessment and diagnosis services in partnership with Alberta Health Services at the Glenrose Children’s FASD Clinic. The Network funding provides one additional assessment per month at the Glenrose clinic, or a total of 12 assessments per year. Edmonton has several other FASD assessment and diagnosis clinic sites not funded through EFAN. The Glenrose Rehabilitation program has an adult FASD clinic; and the Canadian FASD Diagnostic and Training Centre has a child, youth and adult mobile clinic team.
5.3. Outcome #1: Understanding of FASD Clients and caregivers have increased understanding of how FASD affects them.
Caregivers of clients participating in the assessment and diagnosis process at FASD clinics were asked to complete a post-‐clinic caregiver survey at the conclusion of the child/dependent’s process on Clinic Day. Caregivers were asked to provide feedback on how the assessment and diagnosis process helped them from a knowledge standpoint. Further, caregivers were asked to describe how their child/dependent felt the process went and what kind of an impact the diagnosis will have on their life in the future. In total, 7 of these surveys were submitted through EFAN. Six caregivers (86%) had children ages 6-‐12 years old, and 1 caregiver’s dependent (14%) was in the 13-‐17 years old category. Post-‐Clinic Client Survey Overview Clients that were over 13 years of age and deemed to be capable of survey completion by assessment and diagnosis clinic staff were asked to complete a post-‐clinic client survey upon completion of their process. Clients were asked to provide feedback on their experience with the clinic process and to describe how the diagnosis will help them in the future. Only 1 of these surveys was submitted through EFAN. The client that completed the survey was 25 years old or older. Because of the small sample size (7 surveys completed by caregivers, and 1 by a client), the findings should be interpreted with caution. Recommendation: EFAN should consider offering post-‐clinic surveys on an on-‐going basis, in order to increase the validity of their evaluation data.
Findings -‐ Post Clinic Caregiver Survey Post-‐ clinic Caregiver Survey Completely
agree / somewhat agree
Neither agree nor disagree
Completely disagree / somewhat disagree
Did not know / NA
Total
9. As a result of our interactions with the clinic before, during, and after the clinic day, I understand FASD better.
EFAN
All Networks
82 (97%) 3 (3%) -‐ -‐ 85
10. I understand my child / dependent's strengths and weaknesses better.
EFAN
All Networks
84 (99%) 1 (1%) -‐ -‐ 85
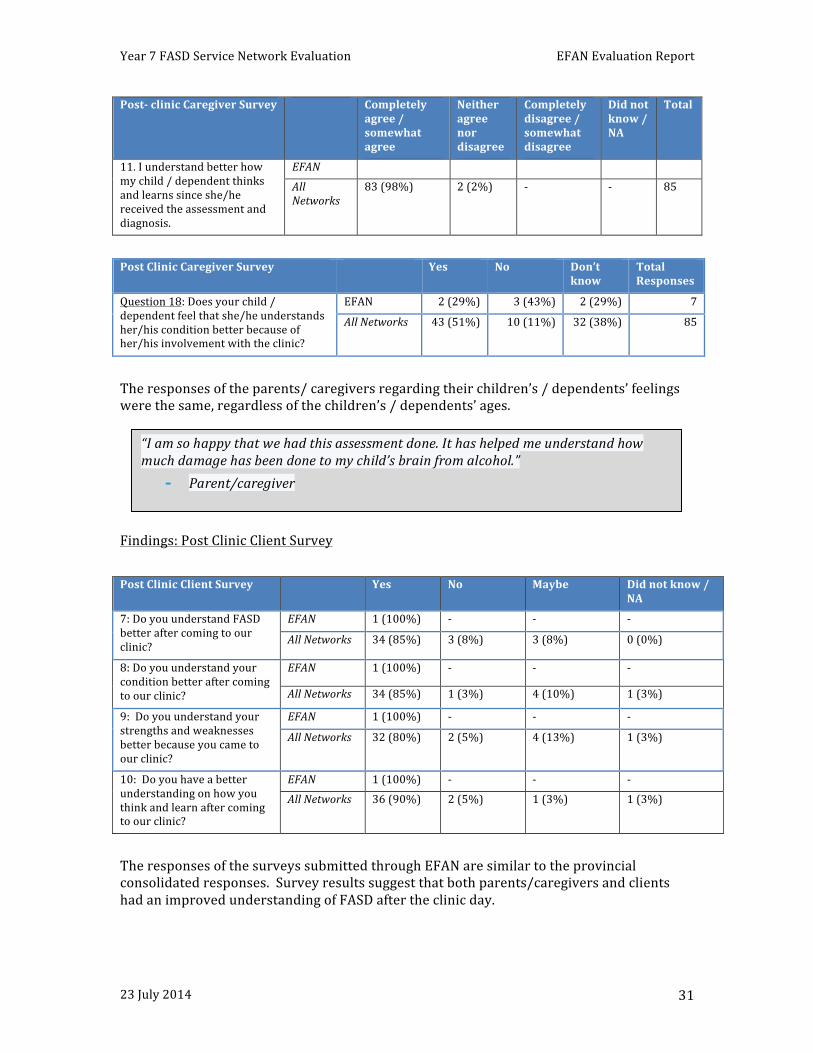
Year 7 FASD Service Network Evaluation EFAN Evaluation Report
23 July 2014 31
Post-‐ clinic Caregiver Survey Completely agree / somewhat agree
Neither agree nor disagree
Completely disagree / somewhat disagree
Did not know / NA
Total
11. I understand better how my child / dependent thinks and learns since she/he received the assessment and diagnosis.
EFAN
All Networks
83 (98%) 2 (2%) -‐ -‐ 85
Post Clinic Caregiver Survey Yes No Don’t
know Total Responses
Question 18: Does your child / dependent feel that she/he understands her/his condition better because of her/his involvement with the clinic?
EFAN 2 (29%) 3 (43%) 2 (29%) 7
All Networks 43 (51%) 10 (11%) 32 (38%) 85
The responses of the parents/ caregivers regarding their children’s / dependents’ feelings were the same, regardless of the children’s / dependents’ ages. Findings: Post Clinic Client Survey Post Clinic Client Survey Yes No Maybe Did not know /
NA
7: Do you understand FASD better after coming to our clinic?
EFAN 1 (100%) -‐ -‐ -‐
All Networks 34 (85%) 3 (8%) 3 (8%) 0 (0%)
8: Do you understand your condition better after coming to our clinic?
EFAN 1 (100%) -‐ -‐ -‐
All Networks 34 (85%) 1 (3%) 4 (10%) 1 (3%)
9: Do you understand your strengths and weaknesses better because you came to our clinic?
EFAN 1 (100%) -‐ -‐ -‐
All Networks 32 (80%) 2 (5%) 4 (13%) 1 (3%)
10: Do you have a better understanding on how you think and learn after coming to our clinic?
EFAN 1 (100%) -‐ -‐ -‐
All Networks 36 (90%) 2 (5%) 1 (3%) 1 (3%)
The responses of the surveys submitted through EFAN are similar to the provincial consolidated responses. Survey results suggest that both parents/caregivers and clients had an improved understanding of FASD after the clinic day.
“I am so happy that we had this assessment done. It has helped me understand how much damage has been done to my child’s brain from alcohol.” - Parent/caregiver
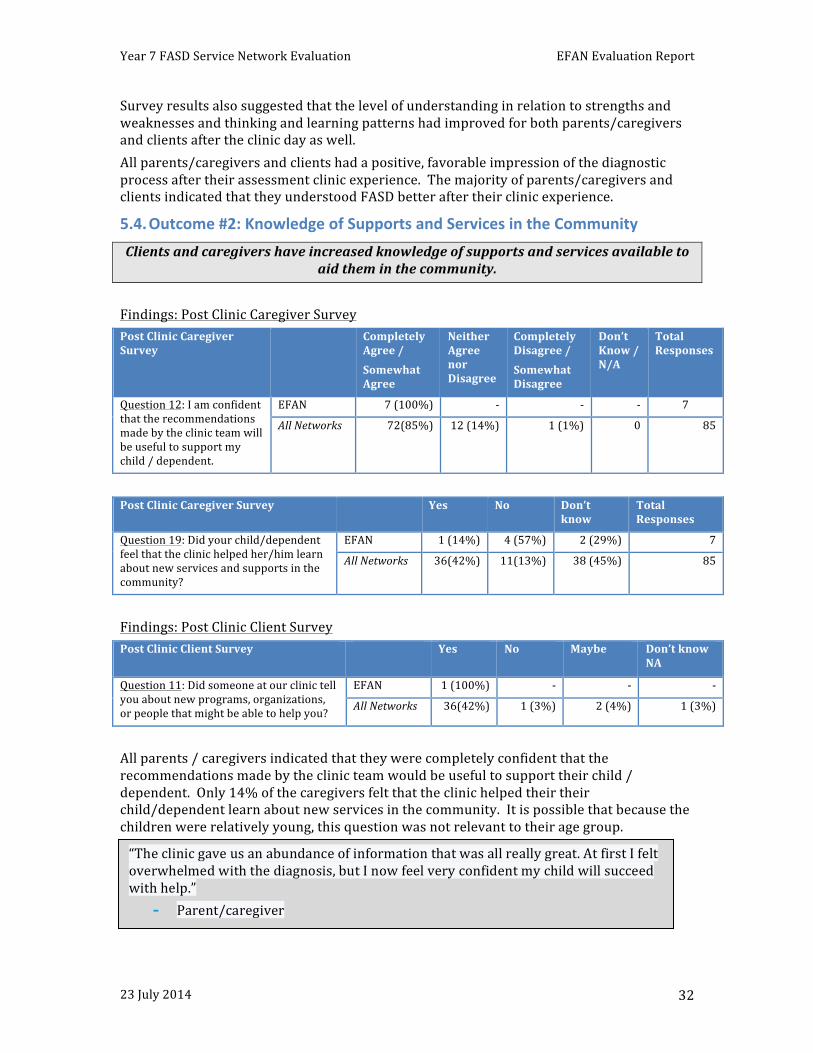
Year 7 FASD Service Network Evaluation EFAN Evaluation Report
23 July 2014 32
Survey results also suggested that the level of understanding in relation to strengths and weaknesses and thinking and learning patterns had improved for both parents/caregivers and clients after the clinic day as well. All parents/caregivers and clients had a positive, favorable impression of the diagnostic process after their assessment clinic experience. The majority of parents/caregivers and clients indicated that they understood FASD better after their clinic experience.
5.4. Outcome #2: Knowledge of Supports and Services in the Community Clients and caregivers have increased knowledge of supports and services available to
aid them in the community. Findings: Post Clinic Caregiver Survey Post Clinic Caregiver Survey
Completely Agree / Somewhat Agree
Neither Agree nor Disagree
Completely Disagree / Somewhat Disagree
Don’t Know / N/A
Total Responses
Question 12: I am confident that the recommendations made by the clinic team will be useful to support my child / dependent.
EFAN 7 (100%) -‐ -‐ -‐ 7
All Networks 72(85%) 12 (14%) 1 (1%) 0 85
Post Clinic Caregiver Survey Yes No Don’t
know Total Responses
Question 19: Did your child/dependent feel that the clinic helped her/him learn about new services and supports in the community?
EFAN 1 (14%) 4 (57%) 2 (29%) 7
All Networks 36(42%) 11(13%) 38 (45%) 85
Findings: Post Clinic Client Survey Post Clinic Client Survey Yes No Maybe Don’t know
NA
Question 11: Did someone at our clinic tell you about new programs, organizations, or people that might be able to help you?
EFAN 1 (100%) -‐ -‐ -‐
All Networks 36(42%) 1 (3%) 2 (4%) 1 (3%)
All parents / caregivers indicated that they were completely confident that the recommendations made by the clinic team would be useful to support their child / dependent. Only 14% of the caregivers felt that the clinic helped their their child/dependent learn about new services in the community. It is possible that because the children were relatively young, this question was not relevant to their age group.
“The clinic gave us an abundance of information that was all really great. At first I felt overwhelmed with the diagnosis, but I now feel very confident my child will succeed with help.” - Parent/caregiver
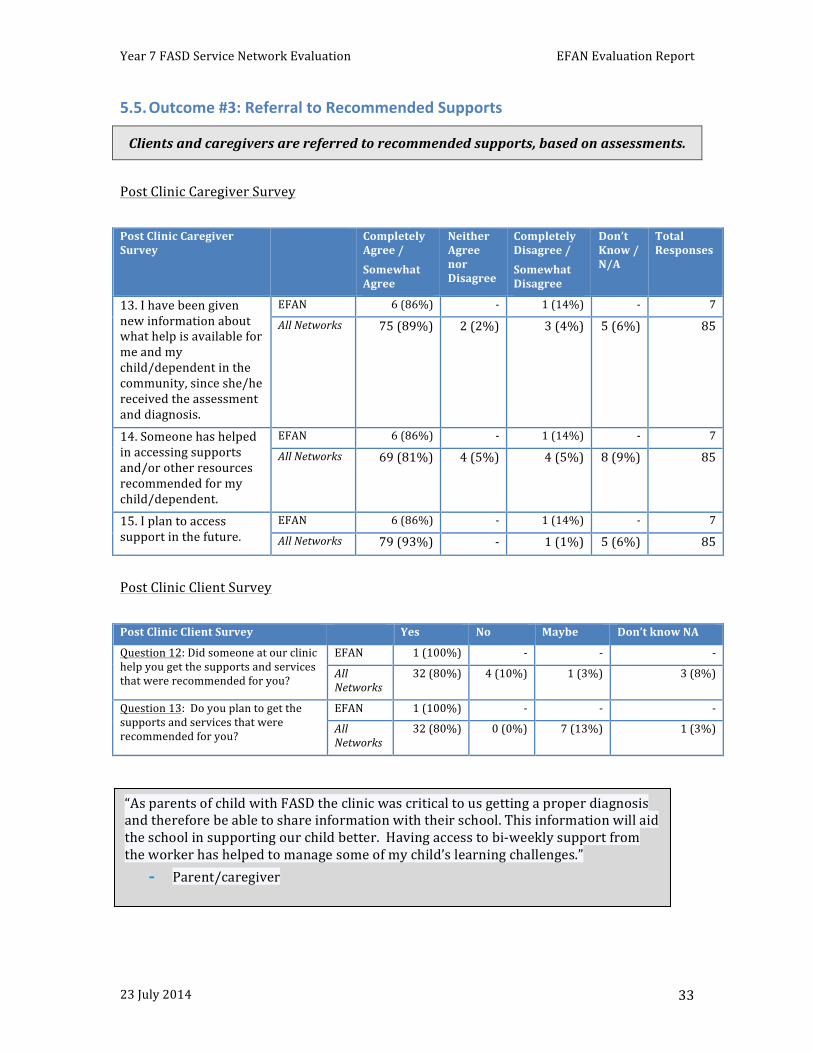
Year 7 FASD Service Network Evaluation EFAN Evaluation Report
23 July 2014 33
5.5. Outcome #3: Referral to Recommended Supports
Clients and caregivers are referred to recommended supports, based on assessments.
Post Clinic Caregiver Survey Post Clinic Caregiver Survey
Completely Agree / Somewhat Agree
Neither Agree nor Disagree
Completely Disagree / Somewhat Disagree
Don’t Know / N/A
Total Responses
13. I have been given new information about what help is available for me and my child/dependent in the community, since she/he received the assessment and diagnosis.
EFAN 6 (86%) -‐ 1 (14%) -‐ 7
All Networks 75 (89%) 2 (2%) 3 (4%) 5 (6%) 85
14. Someone has helped in accessing supports and/or other resources recommended for my child/dependent.
EFAN 6 (86%) -‐ 1 (14%) -‐ 7
All Networks 69 (81%) 4 (5%) 4 (5%) 8 (9%) 85
15. I plan to access support in the future.
EFAN 6 (86%) -‐ 1 (14%) -‐ 7
All Networks 79 (93%) -‐ 1 (1%) 5 (6%) 85
Post Clinic Client Survey Post Clinic Client Survey Yes No Maybe Don’t know NA
Question 12: Did someone at our clinic help you get the supports and services that were recommended for you?
EFAN 1 (100%) -‐ -‐ -‐
All Networks
32 (80%) 4 (10%) 1 (3%) 3 (8%)
Question 13: Do you plan to get the supports and services that were recommended for you?
EFAN 1 (100%) -‐ -‐ -‐
All Networks
32 (80%) 0 (0%) 7 (13%) 1 (3%)
“As parents of child with FASD the clinic was critical to us getting a proper diagnosis and therefore be able to share information with their school. This information will aid the school in supporting our child better. Having access to bi-‐weekly support from the worker has helped to manage some of my child’s learning challenges.” - Parent/caregiver
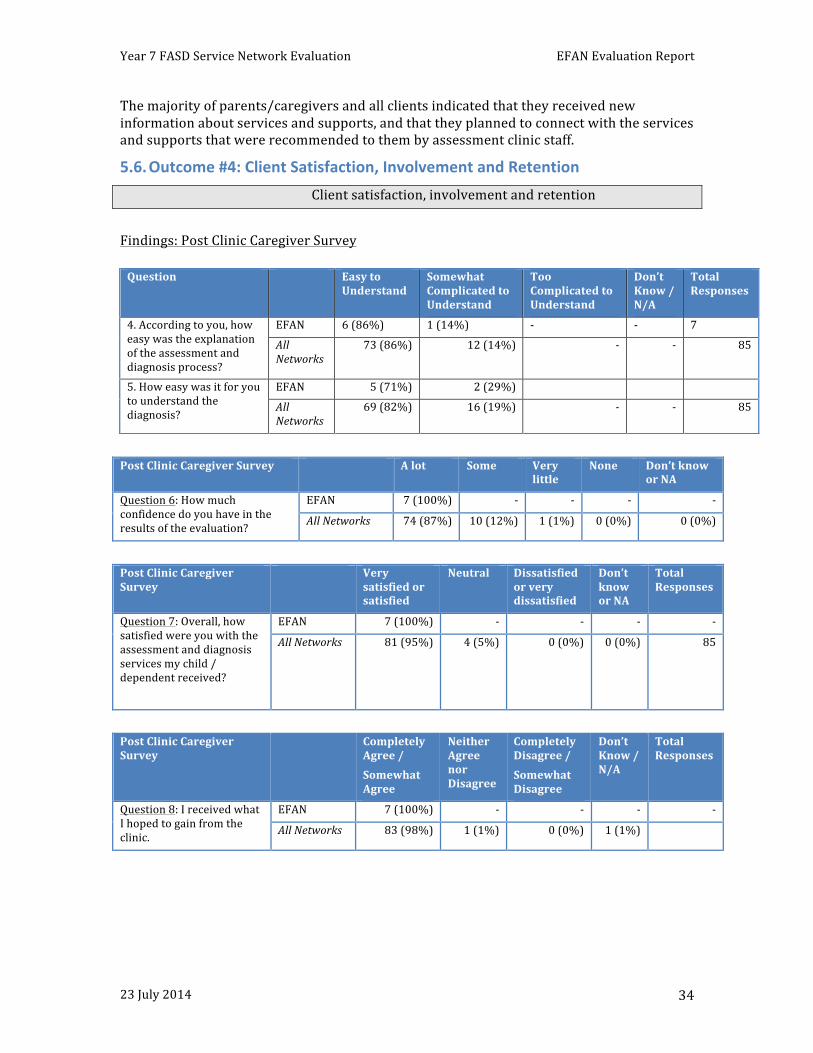
Year 7 FASD Service Network Evaluation EFAN Evaluation Report
23 July 2014 34
The majority of parents/caregivers and all clients indicated that they received new information about services and supports, and that they planned to connect with the services and supports that were recommended to them by assessment clinic staff.
5.6. Outcome #4: Client Satisfaction, Involvement and Retention Client satisfaction, involvement and retention Findings: Post Clinic Caregiver Survey
Post Clinic Caregiver Survey A lot Some Very
little None Don’t know
or NA
Question 6: How much confidence do you have in the results of the evaluation?
EFAN 7 (100%) -‐ -‐ -‐ -‐
All Networks 74 (87%) 10 (12%) 1 (1%) 0 (0%) 0 (0%)
Post Clinic Caregiver Survey
Very satisfied or satisfied
Neutral Dissatisfied or very dissatisfied
Don’t know or NA
Total Responses
Question 7: Overall, how satisfied were you with the assessment and diagnosis services my child / dependent received?
EFAN 7 (100%) -‐ -‐ -‐ -‐
All Networks 81 (95%) 4 (5%) 0 (0%) 0 (0%) 85
Post Clinic Caregiver Survey
Completely Agree / Somewhat Agree
Neither Agree nor Disagree
Completely Disagree / Somewhat Disagree
Don’t Know / N/A
Total Responses
Question 8: I received what I hoped to gain from the clinic.
EFAN 7 (100%) -‐ -‐ -‐ -‐
All Networks 83 (98%) 1 (1%) 0 (0%) 1 (1%)
Question Easy to Understand
Somewhat Complicated to Understand
Too Complicated to Understand
Don’t Know / N/A
Total Responses
4. According to you, how easy was the explanation of the assessment and diagnosis process?
EFAN 6 (86%) 1 (14%) -‐ -‐ 7
All Networks
73 (86%) 12 (14%) -‐ -‐ 85
5. How easy was it for you to understand the diagnosis?
EFAN 5 (71%) 2 (29%)
All Networks
69 (82%) 16 (19%) -‐ -‐ 85
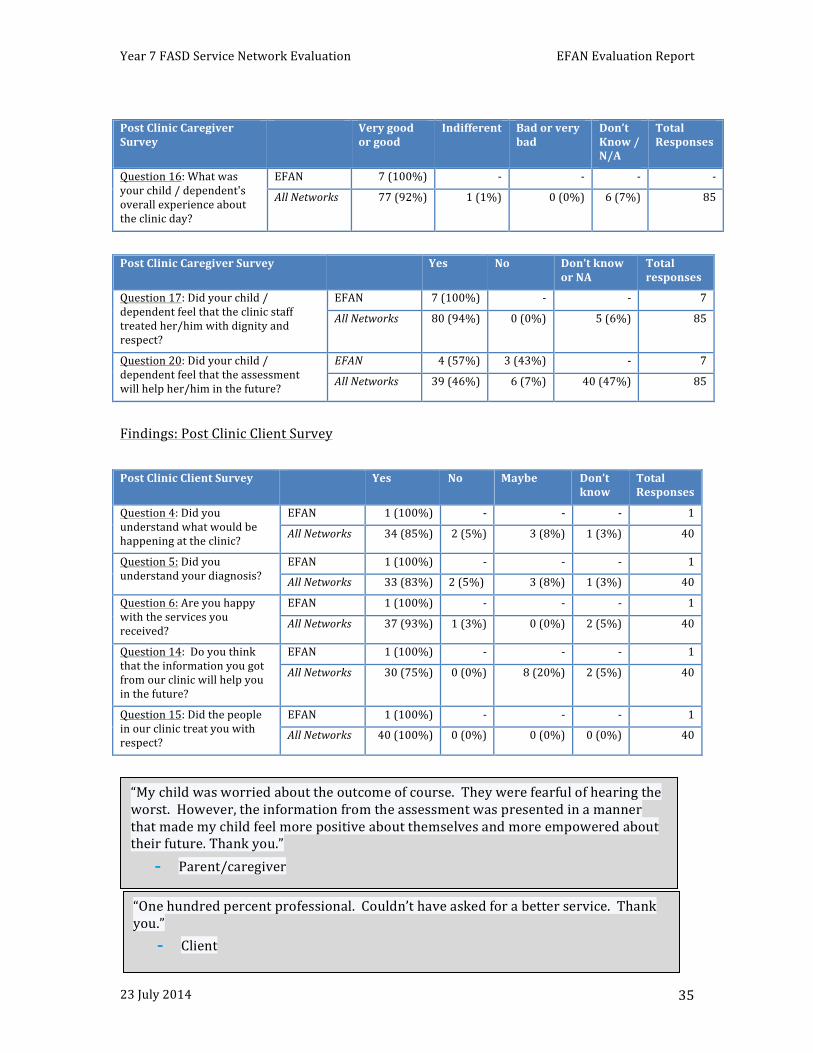
Year 7 FASD Service Network Evaluation EFAN Evaluation Report
23 July 2014 35
Post Clinic Caregiver Survey
Very good or good
Indifferent Bad or very bad
Don’t Know / N/A
Total Responses
Question 16: What was your child / dependent's overall experience about the clinic day?
EFAN 7 (100%) -‐ -‐ -‐ -‐
All Networks 77 (92%) 1 (1%) 0 (0%) 6 (7%) 85
Post Clinic Caregiver Survey Yes No Don’t know
or NA Total responses
Question 17: Did your child / dependent feel that the clinic staff treated her/him with dignity and respect?
EFAN 7 (100%) -‐ -‐ 7
All Networks 80 (94%) 0 (0%) 5 (6%) 85
Question 20: Did your child / dependent feel that the assessment will help her/him in the future?
EFAN 4 (57%) 3 (43%) -‐ 7
All Networks 39 (46%) 6 (7%) 40 (47%) 85
Findings: Post Clinic Client Survey Post Clinic Client Survey Yes No Maybe Don’t
know Total Responses
Question 4: Did you understand what would be happening at the clinic?
EFAN 1 (100%) -‐ -‐ -‐ 1
All Networks 34 (85%) 2 (5%) 3 (8%) 1 (3%) 40
Question 5: Did you understand your diagnosis?
EFAN 1 (100%) -‐ -‐ -‐ 1
All Networks 33 (83%) 2 (5%) 3 (8%) 1 (3%) 40
Question 6: Are you happy with the services you received?
EFAN 1 (100%) -‐ -‐ -‐ 1
All Networks 37 (93%) 1 (3%) 0 (0%) 2 (5%) 40
Question 14: Do you think that the information you got from our clinic will help you in the future?
EFAN 1 (100%) -‐ -‐ -‐ 1
All Networks 30 (75%) 0 (0%) 8 (20%) 2 (5%) 40
Question 15: Did the people in our clinic treat you with respect?
EFAN 1 (100%) -‐ -‐ -‐ 1
All Networks 40 (100%) 0 (0%) 0 (0%) 0 (0%) 40
“My child was worried about the outcome of course. They were fearful of hearing the worst. However, the information from the assessment was presented in a manner that made my child feel more positive about themselves and more empowered about their future. Thank you.” - Parent/caregiver
“One hundred percent professional. Couldn’t have asked for a better service. Thank you.” - Client
Year 7 FASD Service Network Evaluation EFAN Evaluation Report
23 July 2014 36
The majority of parents/caregivers and clients were satisfied with their assessment clinic experience and indicated that they received what they wanted from the process. Parents/caregivers and clients said that their diagnosis was easily understood and that they were confident in the assessment process findings. Finally, parents/caregivers and clients unanimously stated that they felt they were treated with dignity and respect by assessment clinic staff.
5.7. Other Outcomes:
#7: Staff Training, Supervision and Retention.
# 8: Interdisciplinary team collaboration and informed approaches.
# 9: Program Accessibility and Flexibility.
Service Networks were not required to report specifically on PCAP staff training, supervision and retention, interdisciplinary team collaboration, informed practices, and program accessibility & flexibility.
5.8. Discussion Related to Assessment and Diagnosis EFAN funds FASD assessment and diagnosis services in partnership with Alberta Health Services at the Glenrose Children’s FASD Clinic. The Network funding provides one additional assessment per month at the Glenrose clinic, or a total of 12 assessments per year. Only 8 post-‐clinic surveys were completed for EFAN as part of the Year-‐7 Service Network Evaluation, 7 by caregivers, and 1 by a client. Because of the small sample size, the survey findings should be interpreted with caution. Recommendation: EFAN should consider offering post-‐clinic surveys on an on-‐going basis, in order to increase the validity of their clinic evaluation findings. Survey results suggest that both parents/caregivers and clients had an improved understanding of FASD after the clinic day; and that the level of understanding in relation to strengths and weaknesses and thinking and learning patterns had improved for both parents/caregivers and clients after the clinic day as well. All parents/caregivers and clients had a positive, favorable impression of the diagnostic process after their assessment clinic experience. The majority of parents/caregivers and clients indicated that they understood FASD better after their clinic experience. The majority of parents/caregivers and all clients indicated that they received new information about services and supports, and that they planned to connect with the services and supports that were recommended to them by assessment clinic staff. The majority of parents/caregivers and clients were satisfied with their assessment clinic experience and indicated that they received what they wanted from the process. They believed that their diagnosis was easily understood and that they were confident in the

Year 7 FASD Service Network Evaluation EFAN Evaluation Report
23 July 2014 37
assessment process. They unanimously stated that they felt they were treated with dignity and respect by assessment clinic staff. Overall, findings suggest that EFAN’s funded FASD assessment and diagnostic services positively contribute towards the provincial outcomes, at a similar level as the consolidated provincial findings. However, EFAN funds only a small number of assessments, and results need to be validated with a larger number.
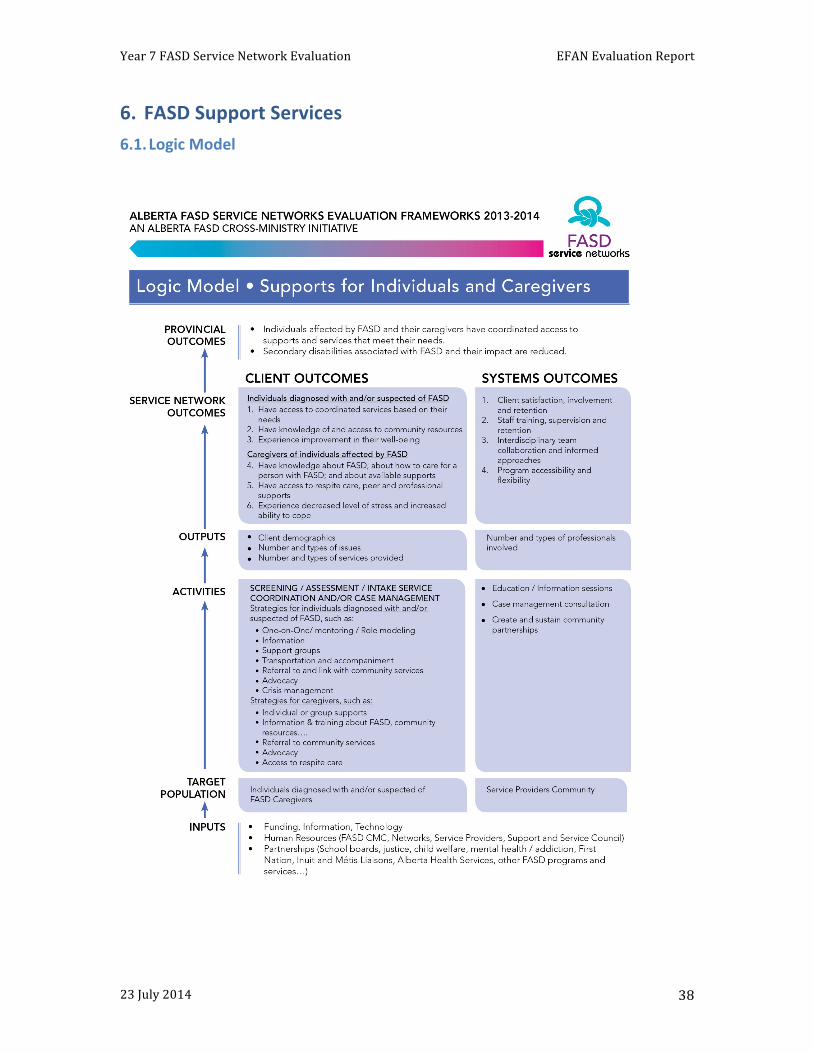
Year 7 FASD Service Network Evaluation EFAN Evaluation Report
23 July 2014 38
6. FASD Support Services 6.1. Logic Model
Year 7 FASD Service Network Evaluation EFAN Evaluation Report
23 July 2014 39
6.2. Outputs Focus groups and Narrative Report Findings
In 2012-‐13, EFAN provided funding for support services to 8 different agencies in Edmonton: • Elizabeth Fry Society: the “Girls Empowered and Strong” program is a support group for
teenage girls, ages 13 to 17, impacted by FASD, who want to address the many issues facing them. The goal of the program is to provide the girls with the skills and knowledge they need in order to make healthy lifestyle choices, thereby preventing further involvement with the legal system. The program offers workshops on various topics and summer programming. In 2012-‐13 the program reached 45 unique clients.
• Catholic Social Services: the “McDaniel Youth Program” is a mentorship program for teenagers ages 14 to 19, impacted by FASD. The program provides one-‐on-‐one mentorship to youth to help them access community supports and make a successful transition into adulthood. It also includes group activities. The program works in partnership with other community agencies, include a mobile addiction counselor. Mentors work with youth for a period of up to 3 years. In 2012-‐13, the program served 41 unique clients.
• Bissel Centre, FASD Services: adult mentorship program. The adult advocate provides one-‐on-‐one long-‐term support to adults who are affected by FASD and male partners of PCAP participants impacted by FASD. The program helps clients access community supports and addresses secondary disabilities associated with FASD. The mentor works with program participants for a period of up to 5 years. In 2012-‐13, the program had 16 unique clients.
• Bosco Homes: the “Open Arms Program” provides culturally sensitive mentorship services to mothers impacted by FASD who are actively parenting children ages 6 to 18. It provides hands on assistance to access services and supports. In 2012-‐13, 38 mothers accessed the services.
• Métis Nation of Alberta: the “Mentorship services to Métis youth and families impacted by FASD” provides support services to Métis children, youth and adults through culturally one-‐to-‐one mentorship. In 2012-‐13, the program reached out to 34 individuals.
• Bridges, Leduc Country: the “Bridges FASD mentor” program is a support program for adults (18 years or older) living within Leduc County who have either strong indicators, or a diagnosis of FASD. It provides support for 3 years to help stabilize the lives of affected individuals and their children, and aims to teach and model appropriate daily life management and skills. In 2012-‐13, the program served 32 unique individuals.
• Kids Kottage / Elves: Elves Special Needs Society and the Kids Kottage Foundation have formed a cooperative association to provide the “FASD Respite care program” which supports families with children ages 3 to 8 years old, affected by FASD. Offering a variety of educational and recreational activities, children are cared for in a safe and structured environment. The program runs from September to June, and provides up to a maximum of 6 hours of respite per week for each child, with a maximum of 20 participants in attendance per session. In 2012-‐13, parents were also invited to participate in a weekly support group / training session. In 2012-‐13, 87 unique clients received respite care.
• CASA: the “Family Reno’s program” provides sensory processing and behavior management strategies to families whose children are impacted by FASD and a mental
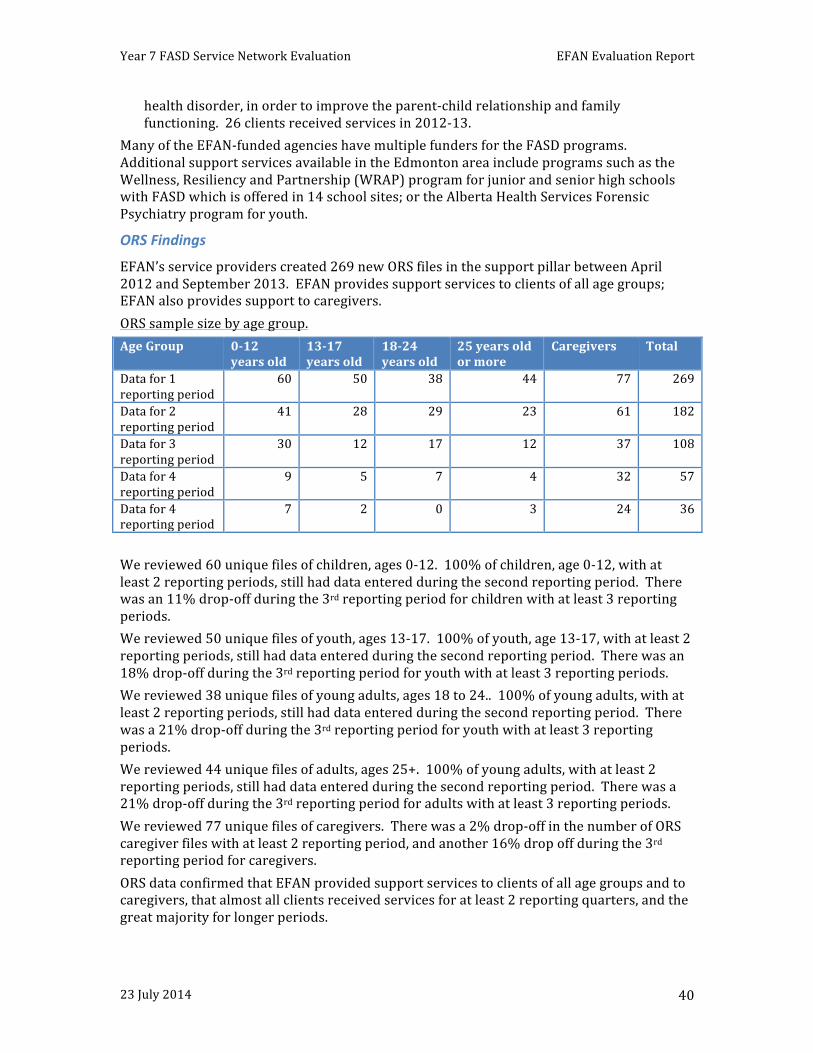
Year 7 FASD Service Network Evaluation EFAN Evaluation Report
23 July 2014 40
health disorder, in order to improve the parent-‐child relationship and family functioning. 26 clients received services in 2012-‐13.
Many of the EFAN-‐funded agencies have multiple funders for the FASD programs. Additional support services available in the Edmonton area include programs such as the Wellness, Resiliency and Partnership (WRAP) program for junior and senior high schools with FASD which is offered in 14 school sites; or the Alberta Health Services Forensic Psychiatry program for youth.
ORS Findings
EFAN’s service providers created 269 new ORS files in the support pillar between April 2012 and September 2013. EFAN provides support services to clients of all age groups; EFAN also provides support to caregivers. ORS sample size by age group. Age Group 0-‐12
years old 13-‐17 years old
18-‐24 years old
25 years old or more
Caregivers Total
Data for 1 reporting period
60 50 38 44 77 269
Data for 2 reporting period
41 28 29 23 61 182
Data for 3 reporting period
30 12 17 12 37 108
Data for 4 reporting period
9 5 7 4 32 57
Data for 4 reporting period
7 2 0 3 24 36
We reviewed 60 unique files of children, ages 0-‐12. 100% of children, age 0-‐12, with at least 2 reporting periods, still had data entered during the second reporting period. There was an 11% drop-‐off during the 3rd reporting period for children with at least 3 reporting periods. We reviewed 50 unique files of youth, ages 13-‐17. 100% of youth, age 13-‐17, with at least 2 reporting periods, still had data entered during the second reporting period. There was an 18% drop-‐off during the 3rd reporting period for youth with at least 3 reporting periods. We reviewed 38 unique files of young adults, ages 18 to 24.. 100% of young adults, with at least 2 reporting periods, still had data entered during the second reporting period. There was a 21% drop-‐off during the 3rd reporting period for youth with at least 3 reporting periods. We reviewed 44 unique files of adults, ages 25+. 100% of young adults, with at least 2 reporting periods, still had data entered during the second reporting period. There was a 21% drop-‐off during the 3rd reporting period for adults with at least 3 reporting periods. We reviewed 77 unique files of caregivers. There was a 2% drop-‐off in the number of ORS caregiver files with at least 2 reporting period, and another 16% drop off during the 3rd reporting period for caregivers. ORS data confirmed that EFAN provided support services to clients of all age groups and to caregivers, that almost all clients received services for at least 2 reporting quarters, and the great majority for longer periods.
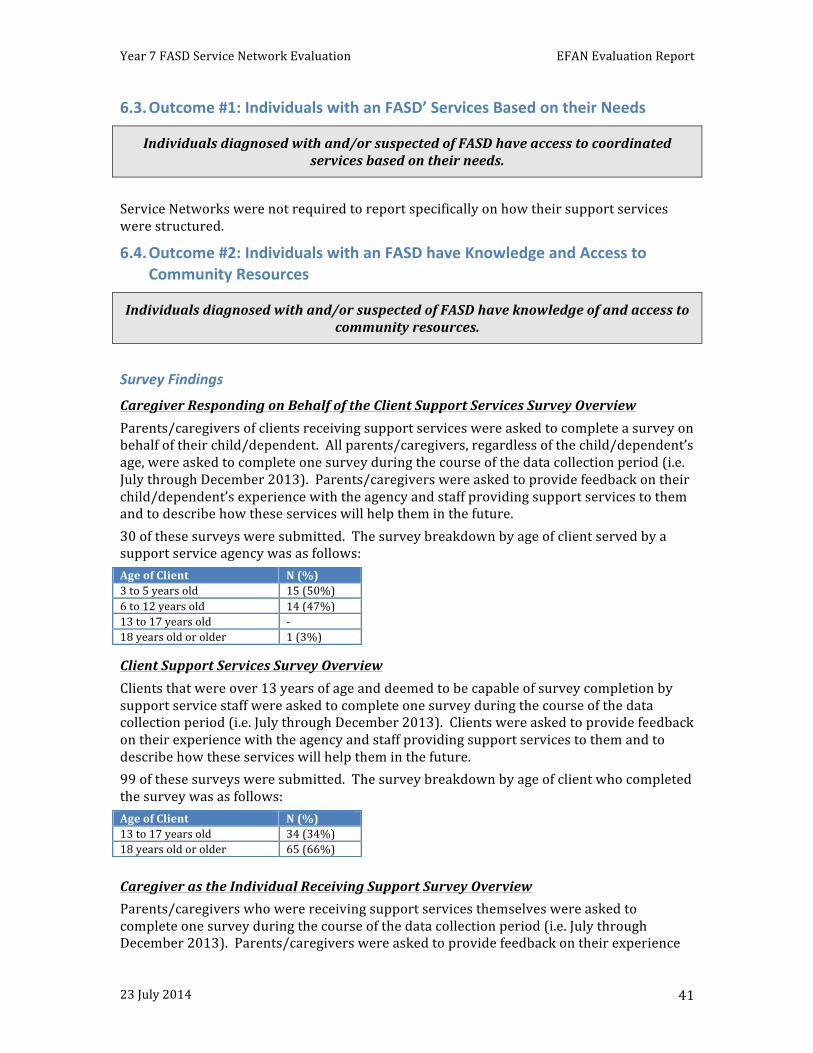
Year 7 FASD Service Network Evaluation EFAN Evaluation Report
23 July 2014 41
6.3. Outcome #1: Individuals with an FASD’ Services Based on their Needs
Individuals diagnosed with and/or suspected of FASD have access to coordinated services based on their needs.
Service Networks were not required to report specifically on how their support services were structured.
6.4. Outcome #2: Individuals with an FASD have Knowledge and Access to Community Resources
Individuals diagnosed with and/or suspected of FASD have knowledge of and access to community resources.
Survey Findings
Caregiver Responding on Behalf of the Client Support Services Survey Overview Parents/caregivers of clients receiving support services were asked to complete a survey on behalf of their child/dependent. All parents/caregivers, regardless of the child/dependent’s age, were asked to complete one survey during the course of the data collection period (i.e. July through December 2013). Parents/caregivers were asked to provide feedback on their child/dependent’s experience with the agency and staff providing support services to them and to describe how these services will help them in the future. 30 of these surveys were submitted. The survey breakdown by age of client served by a support service agency was as follows:
Client Support Services Survey Overview Clients that were over 13 years of age and deemed to be capable of survey completion by support service staff were asked to complete one survey during the course of the data collection period (i.e. July through December 2013). Clients were asked to provide feedback on their experience with the agency and staff providing support services to them and to describe how these services will help them in the future. 99 of these surveys were submitted. The survey breakdown by age of client who completed the survey was as follows:
Caregiver as the Individual Receiving Support Survey Overview Parents/caregivers who were receiving support services themselves were asked to complete one survey during the course of the data collection period (i.e. July through December 2013). Parents/caregivers were asked to provide feedback on their experience
Age of Client N (%) 3 to 5 years old 15 (50%) 6 to 12 years old 14 (47%) 13 to 17 years old -‐ 18 years old or older 1 (3%)
Age of Client N (%) 13 to 17 years old 34 (34%) 18 years old or older 65 (66%)
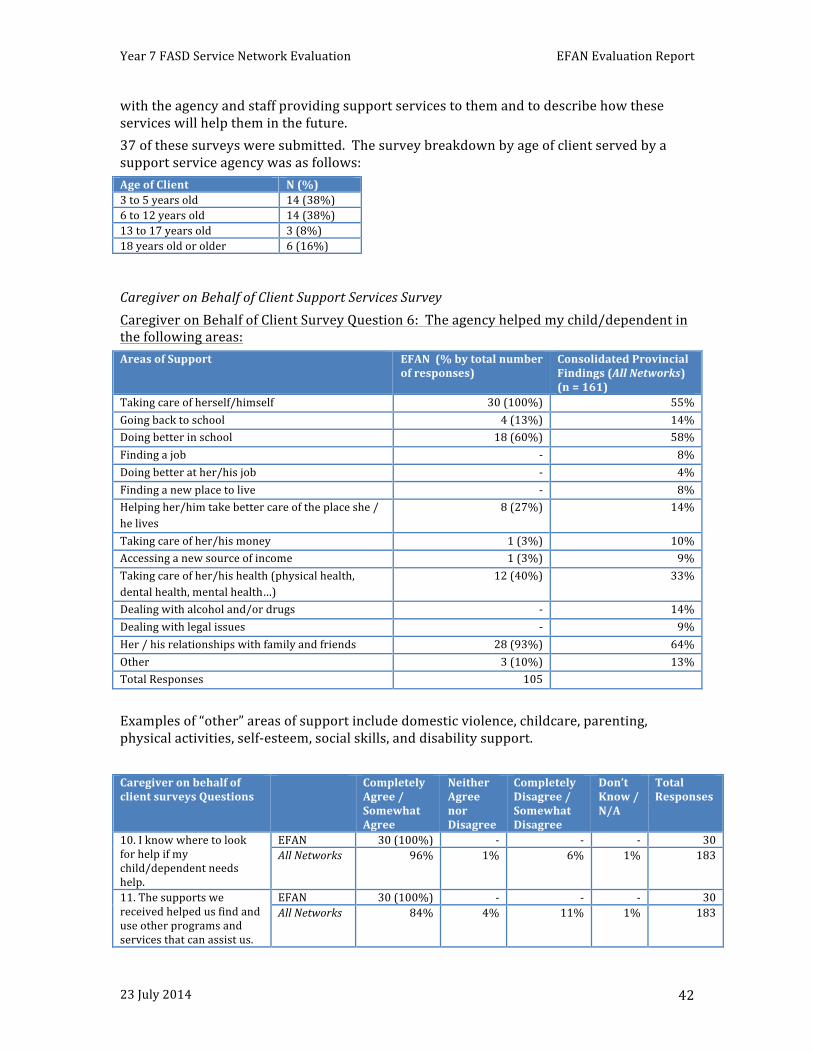
Year 7 FASD Service Network Evaluation EFAN Evaluation Report
23 July 2014 42
with the agency and staff providing support services to them and to describe how these services will help them in the future. 37 of these surveys were submitted. The survey breakdown by age of client served by a support service agency was as follows:
Caregiver on Behalf of Client Support Services Survey Caregiver on Behalf of Client Survey Question 6: The agency helped my child/dependent in the following areas: Areas of Support EFAN (% by total number
of responses) Consolidated Provincial Findings (All Networks) (n = 161)
Taking care of herself/himself 30 (100%) 55% Going back to school 4 (13%) 14% Doing better in school 18 (60%) 58% Finding a job -‐ 8% Doing better at her/his job -‐ 4% Finding a new place to live -‐ 8% Helping her/him take better care of the place she / he lives
8 (27%) 14%
Taking care of her/his money 1 (3%) 10% Accessing a new source of income 1 (3%) 9% Taking care of her/his health (physical health, dental health, mental health…)
12 (40%) 33%
Dealing with alcohol and/or drugs -‐ 14% Dealing with legal issues -‐ 9% Her / his relationships with family and friends 28 (93%) 64% Other 3 (10%) 13% Total Responses 105
Examples of “other” areas of support include domestic violence, childcare, parenting, physical activities, self-‐esteem, social skills, and disability support. Caregiver on behalf of client surveys Questions
Completely Agree / Somewhat Agree
Neither Agree nor Disagree
Completely Disagree / Somewhat Disagree
Don’t Know / N/A
Total Responses
10. I know where to look for help if my child/dependent needs help.
EFAN 30 (100%) -‐ -‐ -‐ 30 All Networks 96% 1% 6% 1% 183
11. The supports we received helped us find and use other programs and services that can assist us.
EFAN 30 (100%) -‐ -‐ -‐ 30 All Networks 84% 4% 11% 1% 183
Age of Client N (%) 3 to 5 years old 14 (38%) 6 to 12 years old 14 (38%) 13 to 17 years old 3 (8%) 18 years old or older 6 (16%)
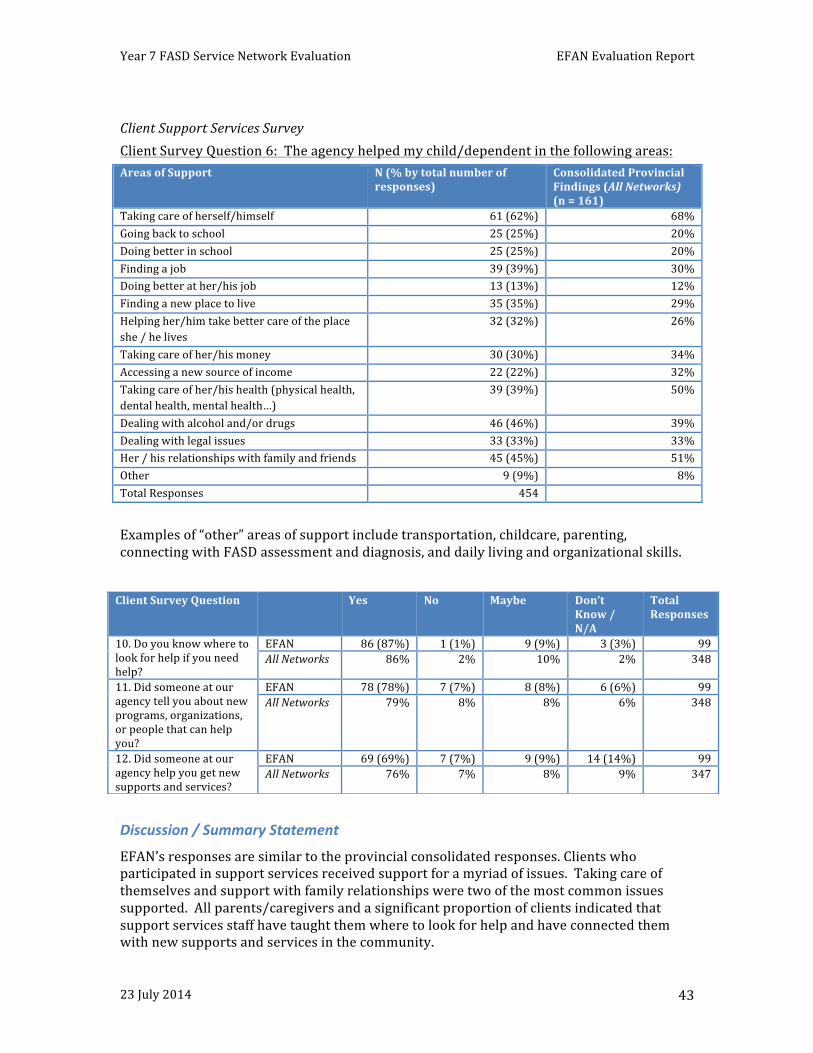
Year 7 FASD Service Network Evaluation EFAN Evaluation Report
23 July 2014 43
Client Support Services Survey Client Survey Question 6: The agency helped my child/dependent in the following areas: Areas of Support N (% by total number of
responses) Consolidated Provincial Findings (All Networks) (n = 161)
Taking care of herself/himself 61 (62%) 68% Going back to school 25 (25%) 20% Doing better in school 25 (25%) 20% Finding a job 39 (39%) 30% Doing better at her/his job 13 (13%) 12% Finding a new place to live 35 (35%) 29% Helping her/him take better care of the place she / he lives
32 (32%) 26%
Taking care of her/his money 30 (30%) 34% Accessing a new source of income 22 (22%) 32% Taking care of her/his health (physical health, dental health, mental health…)
39 (39%) 50%
Dealing with alcohol and/or drugs 46 (46%) 39% Dealing with legal issues 33 (33%) 33% Her / his relationships with family and friends 45 (45%) 51% Other 9 (9%) 8% Total Responses 454
Examples of “other” areas of support include transportation, childcare, parenting, connecting with FASD assessment and diagnosis, and daily living and organizational skills.
Discussion / Summary Statement
EFAN’s responses are similar to the provincial consolidated responses. Clients who participated in support services received support for a myriad of issues. Taking care of themselves and support with family relationships were two of the most common issues supported. All parents/caregivers and a significant proportion of clients indicated that support services staff have taught them where to look for help and have connected them with new supports and services in the community.
Client Survey Question Yes No Maybe Don’t Know / N/A
Total Responses
10. Do you know where to look for help if you need help?
EFAN 86 (87%) 1 (1%) 9 (9%) 3 (3%) 99 All Networks 86% 2% 10% 2% 348
11. Did someone at our agency tell you about new programs, organizations, or people that can help you?
EFAN 78 (78%) 7 (7%) 8 (8%) 6 (6%) 99 All Networks 79% 8% 8% 6% 348
12. Did someone at our agency help you get new supports and services?
EFAN 69 (69%) 7 (7%) 9 (9%) 14 (14%) 99 All Networks 76% 7% 8% 9% 347
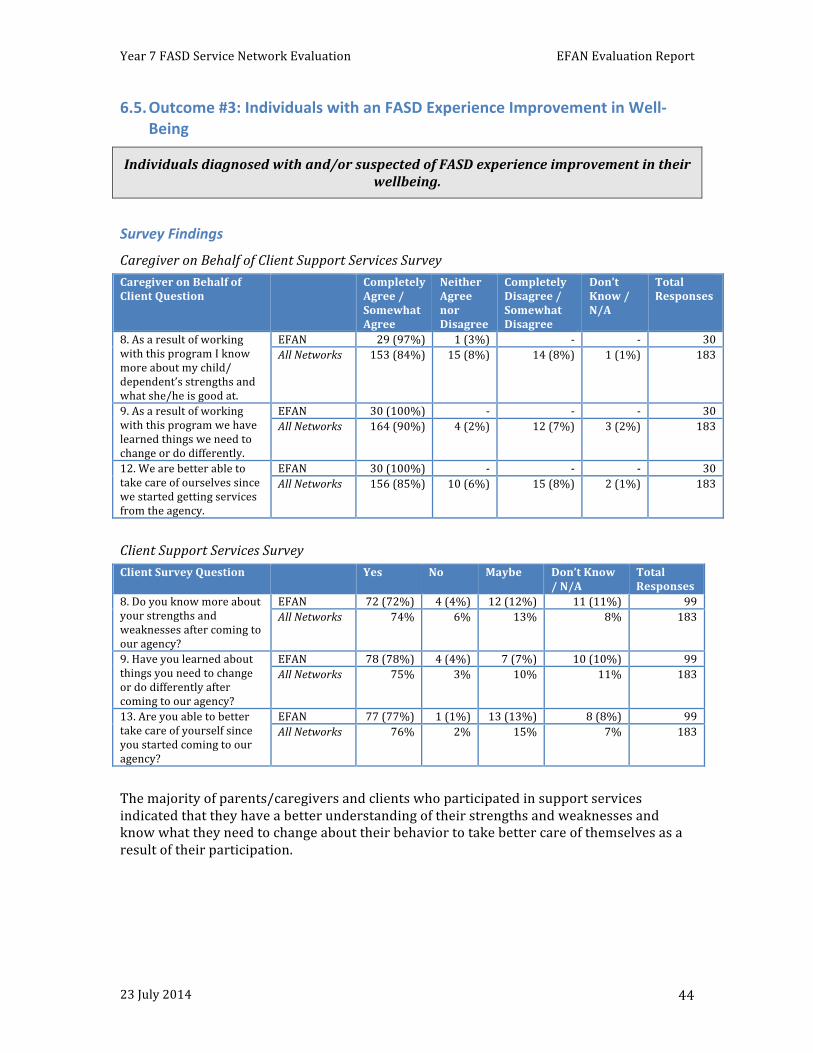
Year 7 FASD Service Network Evaluation EFAN Evaluation Report
23 July 2014 44
6.5. Outcome #3: Individuals with an FASD Experience Improvement in Well-‐Being
Individuals diagnosed with and/or suspected of FASD experience improvement in their wellbeing.
Survey Findings
Caregiver on Behalf of Client Support Services Survey Caregiver on Behalf of Client Question
Completely Agree / Somewhat Agree
Neither Agree nor Disagree
Completely Disagree / Somewhat Disagree
Don’t Know / N/A
Total Responses
8. As a result of working with this program I know more about my child/ dependent’s strengths and what she/he is good at.
EFAN 29 (97%) 1 (3%) -‐ -‐ 30 All Networks 153 (84%) 15 (8%) 14 (8%) 1 (1%) 183
9. As a result of working with this program we have learned things we need to change or do differently.
EFAN 30 (100%) -‐ -‐ -‐ 30 All Networks 164 (90%) 4 (2%) 12 (7%) 3 (2%) 183
12. We are better able to take care of ourselves since we started getting services from the agency.
EFAN 30 (100%) -‐ -‐ -‐ 30 All Networks 156 (85%) 10 (6%) 15 (8%) 2 (1%) 183
Client Support Services Survey Client Survey Question Yes No Maybe Don’t Know
/ N/A Total Responses
8. Do you know more about your strengths and weaknesses after coming to our agency?
EFAN 72 (72%) 4 (4%) 12 (12%) 11 (11%) 99 All Networks 74% 6% 13% 8% 183
9. Have you learned about things you need to change or do differently after coming to our agency?
EFAN 78 (78%) 4 (4%) 7 (7%) 10 (10%) 99 All Networks 75% 3% 10% 11% 183
13. Are you able to better take care of yourself since you started coming to our agency?
EFAN 77 (77%) 1 (1%) 13 (13%) 8 (8%) 99 All Networks 76% 2% 15% 7% 183
The majority of parents/caregivers and clients who participated in support services indicated that they have a better understanding of their strengths and weaknesses and know what they need to change about their behavior to take better care of themselves as a result of their participation.
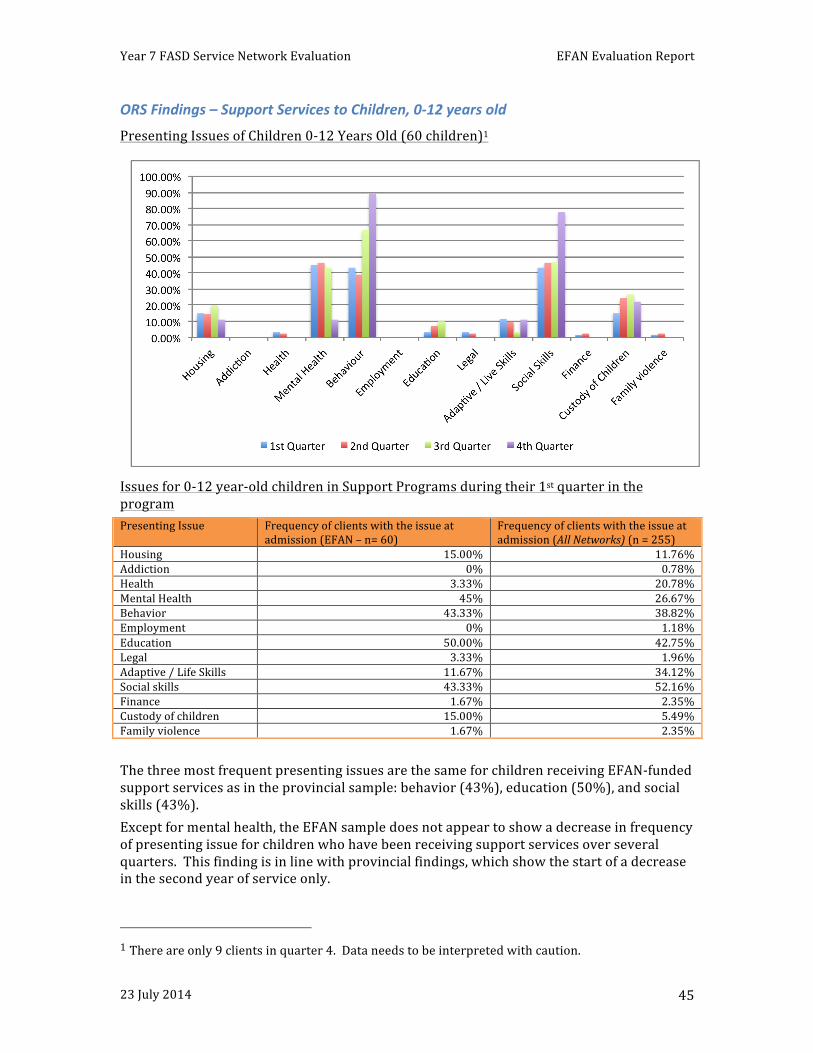
Year 7 FASD Service Network Evaluation EFAN Evaluation Report
23 July 2014 45
ORS Findings – Support Services to Children, 0-‐12 years old
Presenting Issues of Children 0-‐12 Years Old (60 children)1
Issues for 0-‐12 year-‐old children in Support Programs during their 1st quarter in the program Presenting Issue Frequency of clients with the issue at
admission (EFAN – n= 60) Frequency of clients with the issue at admission (All Networks) (n = 255)
Housing 15.00% 11.76% Addiction 0% 0.78% Health 3.33% 20.78% Mental Health 45% 26.67% Behavior 43.33% 38.82% Employment 0% 1.18% Education 50.00% 42.75% Legal 3.33% 1.96% Adaptive / Life Skills 11.67% 34.12% Social skills 43.33% 52.16% Finance 1.67% 2.35% Custody of children 15.00% 5.49% Family violence 1.67% 2.35% The three most frequent presenting issues are the same for children receiving EFAN-‐funded support services as in the provincial sample: behavior (43%), education (50%), and social skills (43%). Except for mental health, the EFAN sample does not appear to show a decrease in frequency of presenting issue for children who have been receiving support services over several quarters. This finding is in line with provincial findings, which show the start of a decrease in the second year of service only.
1 There are only 9 clients in quarter 4. Data needs to be interpreted with caution.
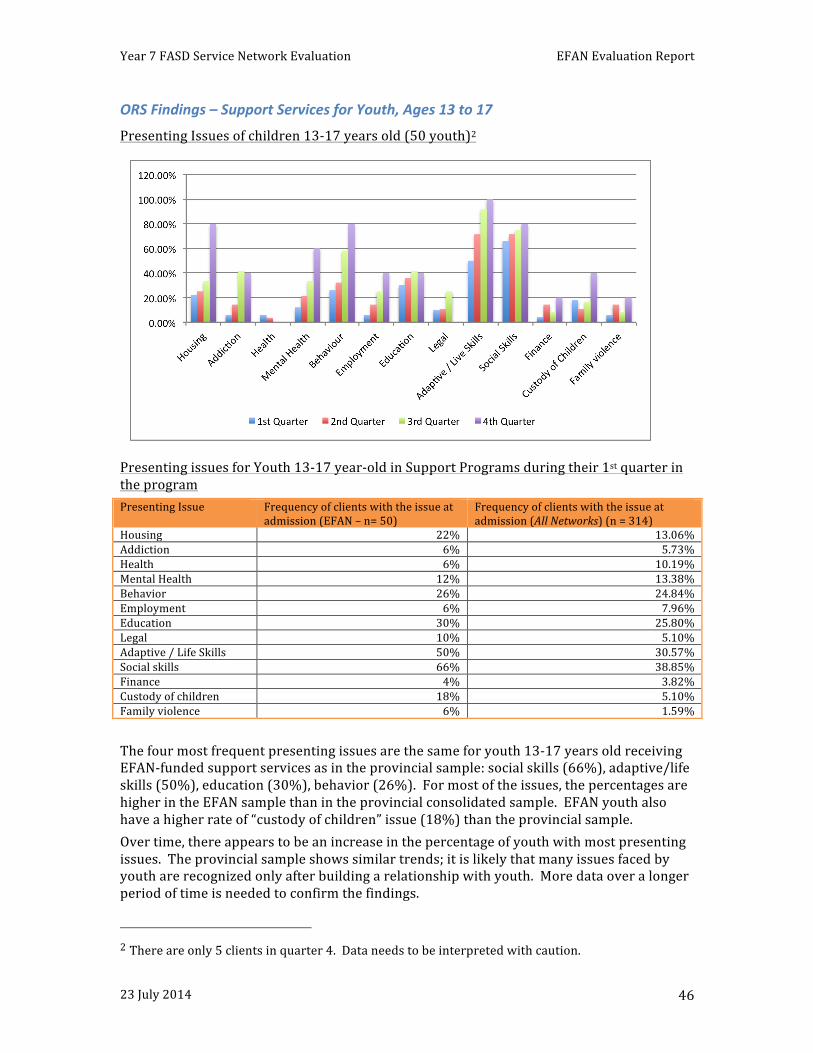
Year 7 FASD Service Network Evaluation EFAN Evaluation Report
23 July 2014 46
ORS Findings – Support Services for Youth, Ages 13 to 17
Presenting Issues of children 13-‐17 years old (50 youth)2
Presenting issues for Youth 13-‐17 year-‐old in Support Programs during their 1st quarter in the program Presenting Issue Frequency of clients with the issue at
admission (EFAN – n= 50) Frequency of clients with the issue at admission (All Networks) (n = 314)
Housing 22% 13.06% Addiction 6% 5.73% Health 6% 10.19% Mental Health 12% 13.38% Behavior 26% 24.84% Employment 6% 7.96% Education 30% 25.80% Legal 10% 5.10% Adaptive / Life Skills 50% 30.57% Social skills 66% 38.85% Finance 4% 3.82% Custody of children 18% 5.10% Family violence 6% 1.59% The four most frequent presenting issues are the same for youth 13-‐17 years old receiving EFAN-‐funded support services as in the provincial sample: social skills (66%), adaptive/life skills (50%), education (30%), behavior (26%). For most of the issues, the percentages are higher in the EFAN sample than in the provincial consolidated sample. EFAN youth also have a higher rate of “custody of children” issue (18%) than the provincial sample. Over time, there appears to be an increase in the percentage of youth with most presenting issues. The provincial sample shows similar trends; it is likely that many issues faced by youth are recognized only after building a relationship with youth. More data over a longer period of time is needed to confirm the findings.
2 There are only 5 clients in quarter 4. Data needs to be interpreted with caution.
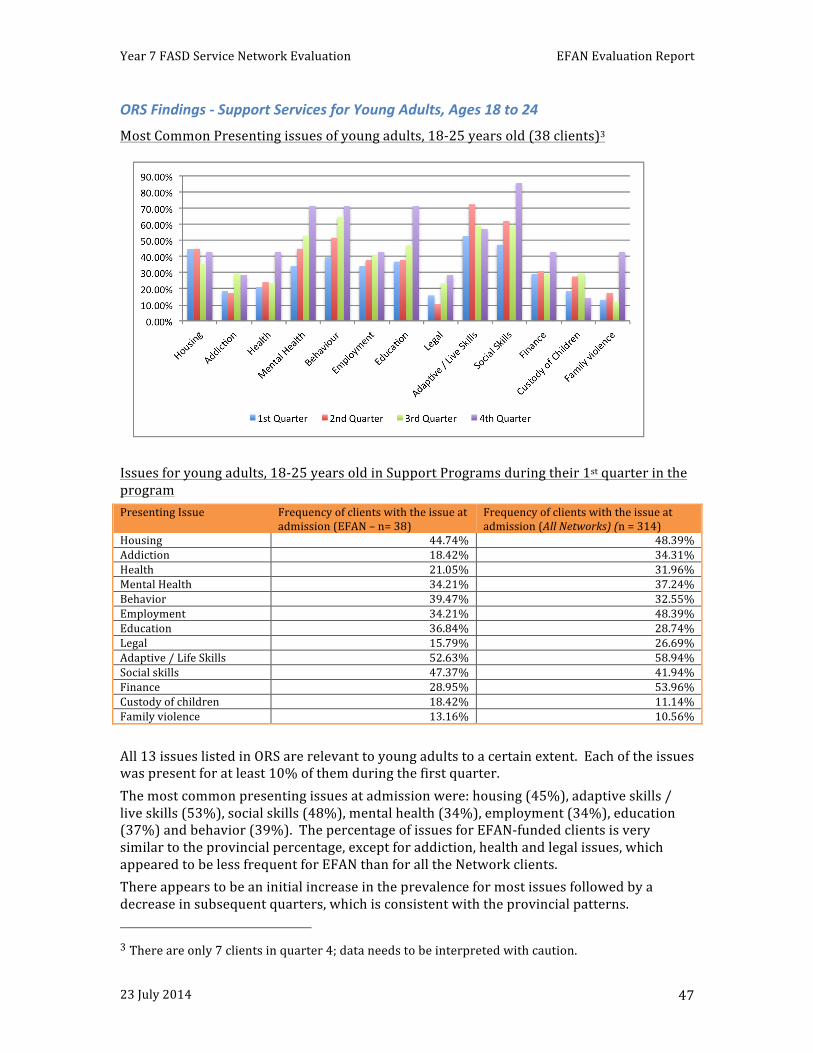
Year 7 FASD Service Network Evaluation EFAN Evaluation Report
23 July 2014 47
ORS Findings -‐ Support Services for Young Adults, Ages 18 to 24
Most Common Presenting issues of young adults, 18-‐25 years old (38 clients)3
Issues for young adults, 18-‐25 years old in Support Programs during their 1st quarter in the program Presenting Issue Frequency of clients with the issue at
admission (EFAN – n= 38) Frequency of clients with the issue at admission (All Networks) (n = 314)
Housing 44.74% 48.39% Addiction 18.42% 34.31% Health 21.05% 31.96% Mental Health 34.21% 37.24% Behavior 39.47% 32.55% Employment 34.21% 48.39% Education 36.84% 28.74% Legal 15.79% 26.69% Adaptive / Life Skills 52.63% 58.94% Social skills 47.37% 41.94% Finance 28.95% 53.96% Custody of children 18.42% 11.14% Family violence 13.16% 10.56% All 13 issues listed in ORS are relevant to young adults to a certain extent. Each of the issues was present for at least 10% of them during the first quarter. The most common presenting issues at admission were: housing (45%), adaptive skills / live skills (53%), social skills (48%), mental health (34%), employment (34%), education (37%) and behavior (39%). The percentage of issues for EFAN-‐funded clients is very similar to the provincial percentage, except for addiction, health and legal issues, which appeared to be less frequent for EFAN than for all the Network clients. There appears to be an initial increase in the prevalence for most issues followed by a decrease in subsequent quarters, which is consistent with the provincial patterns. 3 There are only 7 clients in quarter 4; data needs to be interpreted with caution.
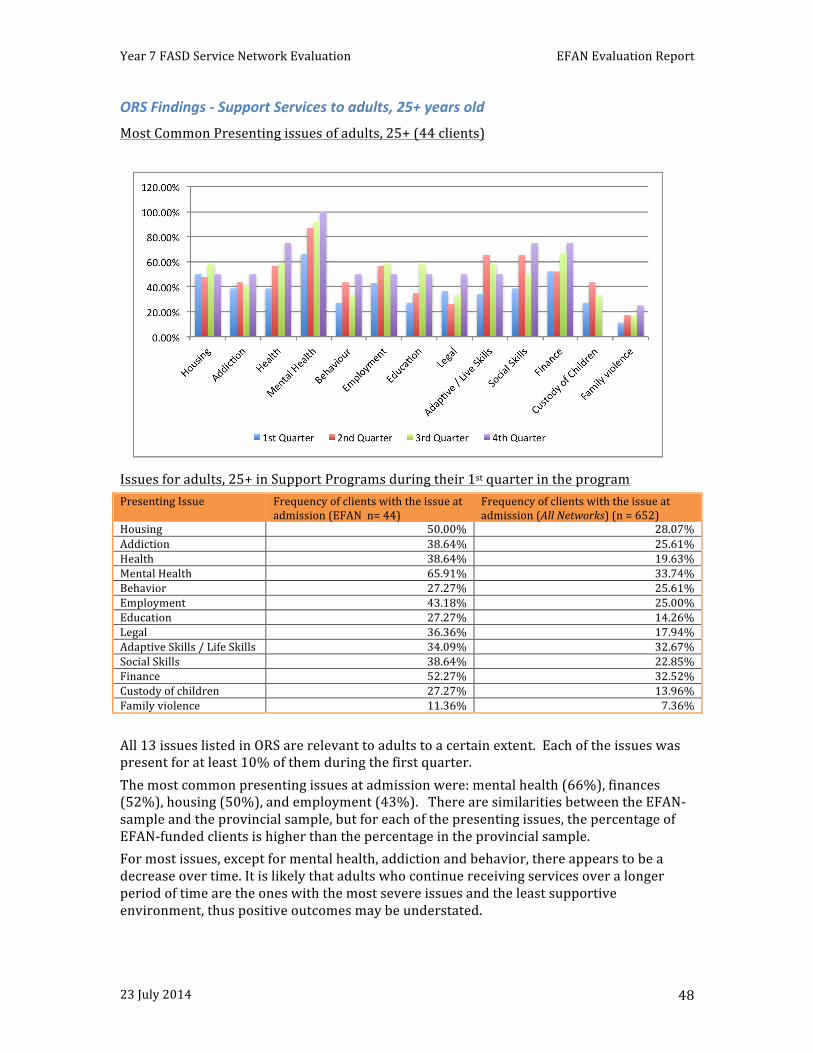
Year 7 FASD Service Network Evaluation EFAN Evaluation Report
23 July 2014 48
ORS Findings -‐ Support Services to adults, 25+ years old
Most Common Presenting issues of adults, 25+ (44 clients)
Issues for adults, 25+ in Support Programs during their 1st quarter in the program Presenting Issue Frequency of clients with the issue at
admission (EFAN n= 44) Frequency of clients with the issue at admission (All Networks) (n = 652)
Housing 50.00% 28.07% Addiction 38.64% 25.61% Health 38.64% 19.63% Mental Health 65.91% 33.74% Behavior 27.27% 25.61% Employment 43.18% 25.00% Education 27.27% 14.26% Legal 36.36% 17.94% Adaptive Skills / Life Skills 34.09% 32.67% Social Skills 38.64% 22.85% Finance 52.27% 32.52% Custody of children 27.27% 13.96% Family violence 11.36% 7.36% All 13 issues listed in ORS are relevant to adults to a certain extent. Each of the issues was present for at least 10% of them during the first quarter. The most common presenting issues at admission were: mental health (66%), finances (52%), housing (50%), and employment (43%). There are similarities between the EFAN-‐sample and the provincial sample, but for each of the presenting issues, the percentage of EFAN-‐funded clients is higher than the percentage in the provincial sample. For most issues, except for mental health, addiction and behavior, there appears to be a decrease over time. It is likely that adults who continue receiving services over a longer period of time are the ones with the most severe issues and the least supportive environment, thus positive outcomes may be understated.
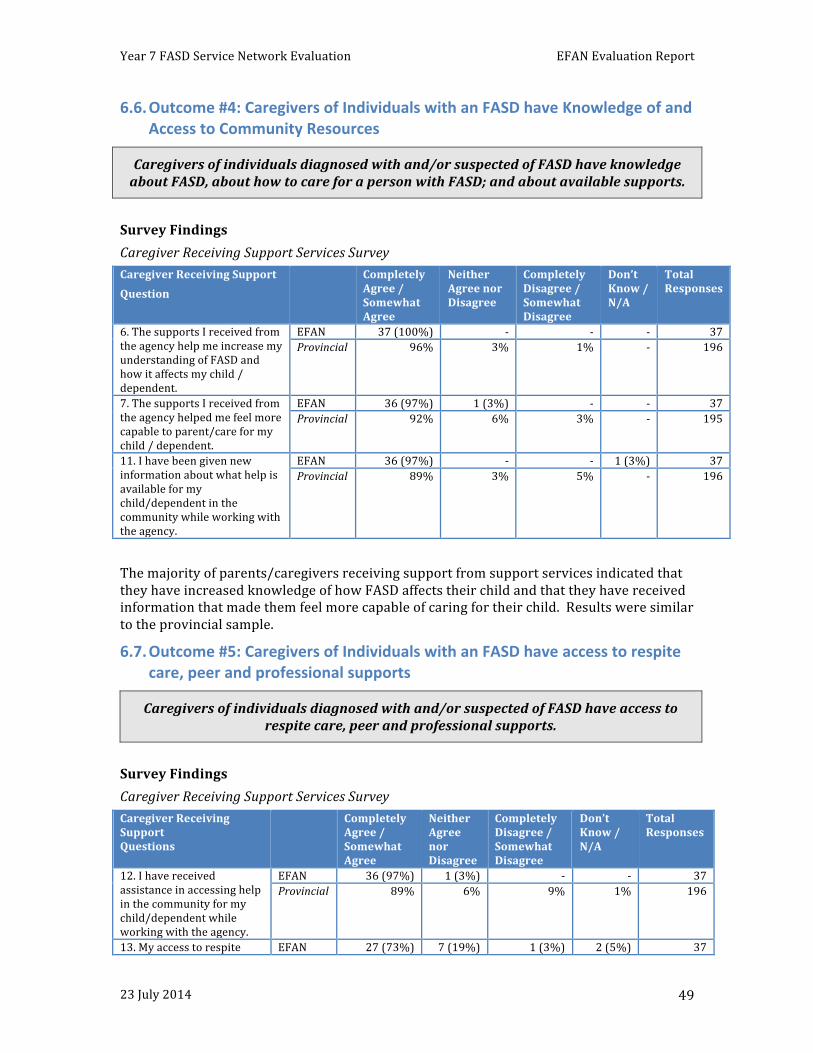
Year 7 FASD Service Network Evaluation EFAN Evaluation Report
23 July 2014 49
6.6. Outcome #4: Caregivers of Individuals with an FASD have Knowledge of and Access to Community Resources
Caregivers of individuals diagnosed with and/or suspected of FASD have knowledge about FASD, about how to care for a person with FASD; and about available supports.
Survey Findings Caregiver Receiving Support Services Survey Caregiver Receiving Support Question
Completely Agree / Somewhat Agree
Neither Agree nor Disagree
Completely Disagree / Somewhat Disagree
Don’t Know / N/A
Total Responses
6. The supports I received from the agency help me increase my understanding of FASD and how it affects my child / dependent.
EFAN 37 (100%) -‐ -‐ -‐ 37 Provincial 96% 3% 1% -‐ 196
7. The supports I received from the agency helped me feel more capable to parent/care for my child / dependent.
EFAN 36 (97%) 1 (3%) -‐ -‐ 37 Provincial 92% 6% 3% -‐ 195
11. I have been given new information about what help is available for my child/dependent in the community while working with the agency.
EFAN 36 (97%) -‐ -‐ 1 (3%) 37 Provincial 89% 3% 5% -‐ 196
The majority of parents/caregivers receiving support from support services indicated that they have increased knowledge of how FASD affects their child and that they have received information that made them feel more capable of caring for their child. Results were similar to the provincial sample.
6.7. Outcome #5: Caregivers of Individuals with an FASD have access to respite care, peer and professional supports
Caregivers of individuals diagnosed with and/or suspected of FASD have access to respite care, peer and professional supports.
Survey Findings Caregiver Receiving Support Services Survey Caregiver Receiving Support Questions
Completely Agree / Somewhat Agree
Neither Agree nor Disagree
Completely Disagree / Somewhat Disagree
Don’t Know / N/A
Total Responses
12. I have received assistance in accessing help in the community for my child/dependent while working with the agency.
EFAN 36 (97%) 1 (3%) -‐ -‐ 37 Provincial 89% 6% 9% 1% 196
13. My access to respite EFAN 27 (73%) 7 (19%) 1 (3%) 2 (5%) 37
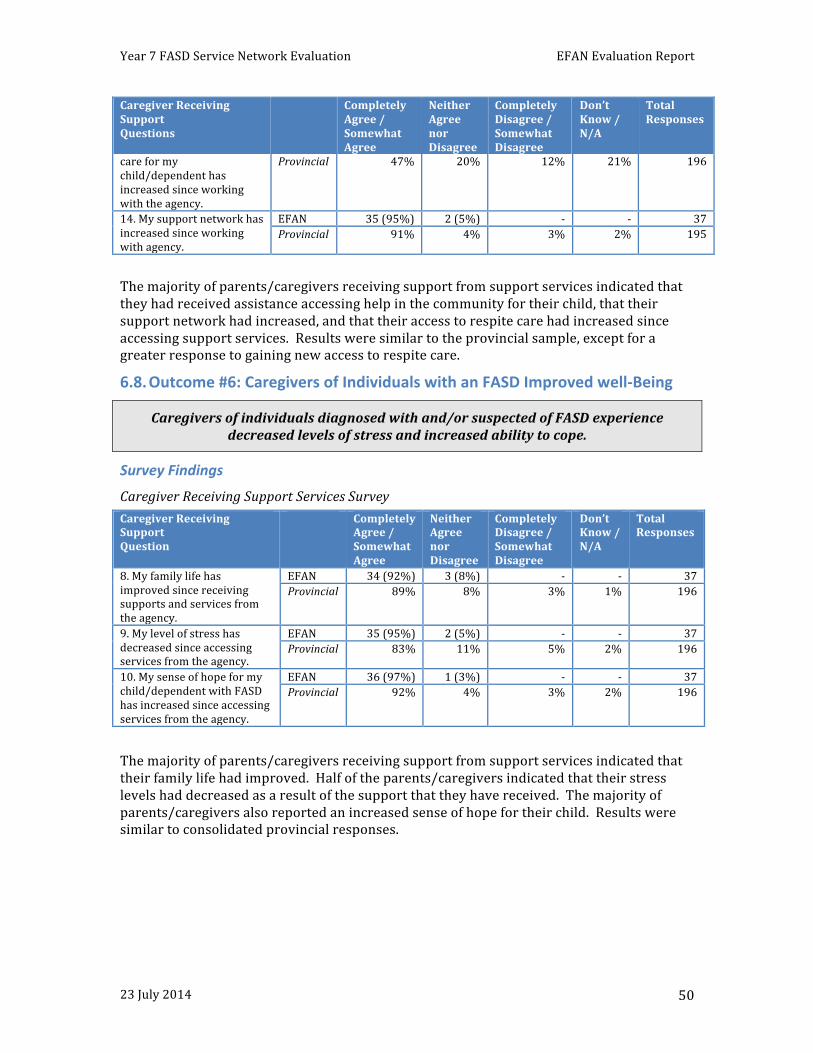
Year 7 FASD Service Network Evaluation EFAN Evaluation Report
23 July 2014 50
Caregiver Receiving Support Questions
Completely Agree / Somewhat Agree
Neither Agree nor Disagree
Completely Disagree / Somewhat Disagree
Don’t Know / N/A
Total Responses
care for my child/dependent has increased since working with the agency.
Provincial 47% 20% 12% 21% 196
14. My support network has increased since working with agency.
EFAN 35 (95%) 2 (5%) -‐ -‐ 37 Provincial 91% 4% 3% 2% 195
The majority of parents/caregivers receiving support from support services indicated that they had received assistance accessing help in the community for their child, that their support network had increased, and that their access to respite care had increased since accessing support services. Results were similar to the provincial sample, except for a greater response to gaining new access to respite care.
6.8. Outcome #6: Caregivers of Individuals with an FASD Improved well-‐Being
Caregivers of individuals diagnosed with and/or suspected of FASD experience decreased levels of stress and increased ability to cope.
Survey Findings
Caregiver Receiving Support Services Survey Caregiver Receiving Support Question
Completely Agree / Somewhat Agree
Neither Agree nor Disagree
Completely Disagree / Somewhat Disagree
Don’t Know / N/A
Total Responses
8. My family life has improved since receiving supports and services from the agency.
EFAN 34 (92%) 3 (8%) -‐ -‐ 37 Provincial 89% 8% 3% 1% 196
9. My level of stress has decreased since accessing services from the agency.
EFAN 35 (95%) 2 (5%) -‐ -‐ 37 Provincial 83% 11% 5% 2% 196
10. My sense of hope for my child/dependent with FASD has increased since accessing services from the agency.
EFAN 36 (97%) 1 (3%) -‐ -‐ 37 Provincial 92% 4% 3% 2% 196
The majority of parents/caregivers receiving support from support services indicated that their family life had improved. Half of the parents/caregivers indicated that their stress levels had decreased as a result of the support that they have received. The majority of parents/caregivers also reported an increased sense of hope for their child. Results were similar to consolidated provincial responses.
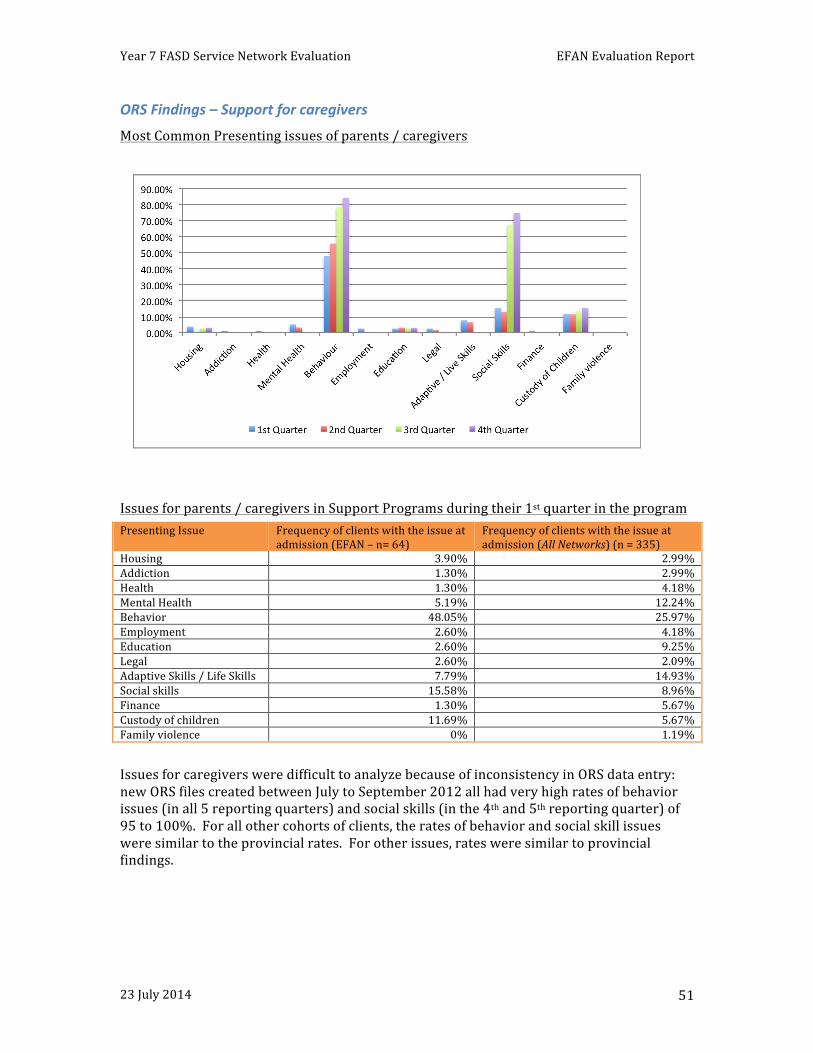
Year 7 FASD Service Network Evaluation EFAN Evaluation Report
23 July 2014 51
ORS Findings – Support for caregivers
Most Common Presenting issues of parents / caregivers
Issues for parents / caregivers in Support Programs during their 1st quarter in the program Presenting Issue Frequency of clients with the issue at
admission (EFAN – n= 64) Frequency of clients with the issue at admission (All Networks) (n = 335)
Housing 3.90% 2.99% Addiction 1.30% 2.99% Health 1.30% 4.18% Mental Health 5.19% 12.24% Behavior 48.05% 25.97% Employment 2.60% 4.18% Education 2.60% 9.25% Legal 2.60% 2.09% Adaptive Skills / Life Skills 7.79% 14.93% Social skills 15.58% 8.96% Finance 1.30% 5.67% Custody of children 11.69% 5.67% Family violence 0% 1.19% Issues for caregivers were difficult to analyze because of inconsistency in ORS data entry: new ORS files created between July to September 2012 all had very high rates of behavior issues (in all 5 reporting quarters) and social skills (in the 4th and 5th reporting quarter) of 95 to 100%. For all other cohorts of clients, the rates of behavior and social skill issues were similar to the provincial rates. For other issues, rates were similar to provincial findings.
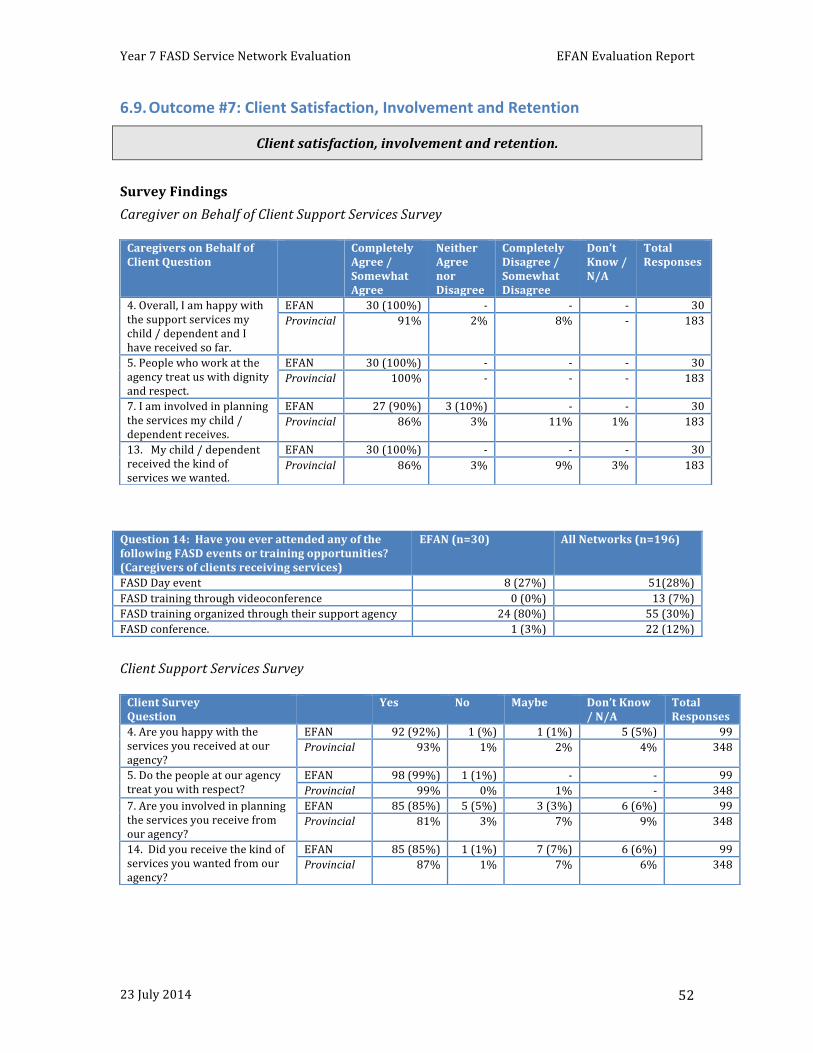
Year 7 FASD Service Network Evaluation EFAN Evaluation Report
23 July 2014 52
6.9. Outcome #7: Client Satisfaction, Involvement and Retention
Client satisfaction, involvement and retention.
Survey Findings Caregiver on Behalf of Client Support Services Survey
Question 14: Have you ever attended any of the following FASD events or training opportunities? (Caregivers of clients receiving services)
EFAN (n=30) All Networks (n=196)
FASD Day event 8 (27%) 51(28%) FASD training through videoconference 0 (0%) 13 (7%) FASD training organized through their support agency 24 (80%) 55 (30%) FASD conference. 1 (3%) 22 (12%) Client Support Services Survey
Caregivers on Behalf of Client Question
Completely Agree / Somewhat Agree
Neither Agree nor Disagree
Completely Disagree / Somewhat Disagree
Don’t Know / N/A
Total Responses
4. Overall, I am happy with the support services my child / dependent and I have received so far.
EFAN 30 (100%) -‐ -‐ -‐ 30 Provincial 91% 2% 8% -‐ 183
5. People who work at the agency treat us with dignity and respect.
EFAN 30 (100%) -‐ -‐ -‐ 30 Provincial 100% -‐ -‐ -‐ 183
7. I am involved in planning the services my child / dependent receives.
EFAN 27 (90%) 3 (10%) -‐ -‐ 30 Provincial 86% 3% 11% 1% 183
13. My child / dependent received the kind of services we wanted.
EFAN 30 (100%) -‐ -‐ -‐ 30 Provincial 86% 3% 9% 3% 183
Client Survey Question
Yes No Maybe Don’t Know / N/A
Total Responses
4. Are you happy with the services you received at our agency?
EFAN 92 (92%) 1 (%) 1 (1%) 5 (5%) 99 Provincial 93% 1% 2% 4% 348
5. Do the people at our agency treat you with respect?
EFAN 98 (99%) 1 (1%) -‐ -‐ 99 Provincial 99% 0% 1% -‐ 348
7. Are you involved in planning the services you receive from our agency?
EFAN 85 (85%) 5 (5%) 3 (3%) 6 (6%) 99 Provincial 81% 3% 7% 9% 348
14. Did you receive the kind of services you wanted from our agency?
EFAN 85 (85%) 1 (1%) 7 (7%) 6 (6%) 99 Provincial 87% 1% 7% 6% 348
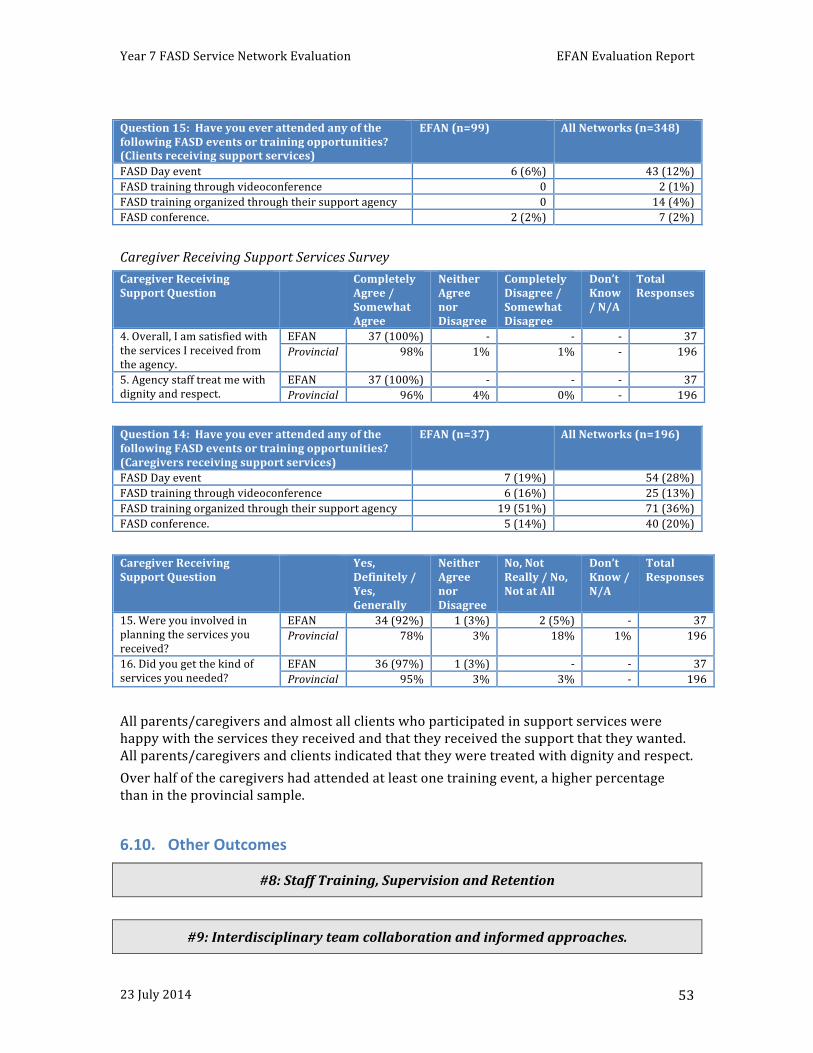
Year 7 FASD Service Network Evaluation EFAN Evaluation Report
23 July 2014 53
Question 15: Have you ever attended any of the following FASD events or training opportunities? (Clients receiving support services)
EFAN (n=99) All Networks (n=348)
FASD Day event 6 (6%) 43 (12%) FASD training through videoconference 0 2 (1%) FASD training organized through their support agency 0 14 (4%) FASD conference. 2 (2%) 7 (2%) Caregiver Receiving Support Services Survey Caregiver Receiving Support Question
Completely Agree / Somewhat Agree
Neither Agree nor Disagree
Completely Disagree / Somewhat Disagree
Don’t Know / N/A
Total Responses
4. Overall, I am satisfied with the services I received from the agency.
EFAN 37 (100%) -‐ -‐ -‐ 37 Provincial 98% 1% 1% -‐ 196
5. Agency staff treat me with dignity and respect.
EFAN 37 (100%) -‐ -‐ -‐ 37 Provincial 96% 4% 0% -‐ 196
Question 14: Have you ever attended any of the following FASD events or training opportunities? (Caregivers receiving support services)
EFAN (n=37) All Networks (n=196)
FASD Day event 7 (19%) 54 (28%) FASD training through videoconference 6 (16%) 25 (13%) FASD training organized through their support agency 19 (51%) 71 (36%) FASD conference. 5 (14%) 40 (20%) Caregiver Receiving Support Question
Yes, Definitely / Yes, Generally
Neither Agree nor Disagree
No, Not Really / No, Not at All
Don’t Know / N/A
Total Responses
15. Were you involved in planning the services you received?
EFAN 34 (92%) 1 (3%) 2 (5%) -‐ 37 Provincial 78% 3% 18% 1% 196
16. Did you get the kind of services you needed?
EFAN 36 (97%) 1 (3%) -‐ -‐ 37 Provincial 95% 3% 3% -‐ 196
All parents/caregivers and almost all clients who participated in support services were happy with the services they received and that they received the support that they wanted. All parents/caregivers and clients indicated that they were treated with dignity and respect. Over half of the caregivers had attended at least one training event, a higher percentage than in the provincial sample.
6.10. Other Outcomes
#8: Staff Training, Supervision and Retention
#9: Interdisciplinary team collaboration and informed approaches.
Year 7 FASD Service Network Evaluation EFAN Evaluation Report
23 July 2014 54
#10: Program Accessibility and Flexibility.
Service Networks were not required to report specifically on Service Providers’ system outcomes.
6.11. Discussion Related to Support Services In 2012-‐13, EFAN provided funding for support services to 8 different agencies in Edmonton, reaching out to 319 unique clients. As part of the Year-‐7 Service Network evaluation process, EFAN’s support service providers returned 99 client surveys, 30 surveys filled out by caregivers on behalf of services received by their dependents, and 37 surveys filled out by caregivers who received support services. ORS data confirmed that EFAN provided support services to clients of all age groups and to caregivers, that almost all clients received services for at least 2 reporting quarters, and the great majority for longer periods. More data over a longer period of time will confirm the good retention rates. Clients and caregivers reported that agencies helped them in a number of ways: taking care of themselves and their health, dealing with relationship issues, and support with school & employment were the most common areas of help. Clients also reported that agencies helped them deal with addiction and legal issues. EFAN’s responses were similar to provincial responses. The majority of parents/caregivers and clients who participated in support services indicated that they had a better understanding of their strengths and weaknesses and knew what they needed to change about their behavior to take better care of themselves as a result of the support services. Presenting issues and outcomes for individuals receiving support services showed similar patterns for EFAN-‐funded support clients as provincial results. The three most frequent presenting issues for children receiving EFAN-‐funded support services were: behavior (43%), education (50%), and social skills (43%). The four most frequent presenting issues for youth 13-‐17 years old receiving EFAN-‐funded support services were: social skills (66%), adaptive/life skills (50%), education (30%), and behavior (26%). The four most common presenting issues for young adults, ages 18 to 24, were: housing (45%), adaptive skills / live skills (53%), social skills (48%), and behavior (39%). The most common presenting issues for adults, ages 25+ were: mental health (66%), finances (52%), housing (50%), and employment (43%). There were inconsistencies in ORS data entry for the caregiver groups, and data could therefore not be analyzed. For most issues, there appeared to be an initial increase in the percentage of clients experiencing the issue in subsequent periods, with the beginning of a decrease in the 4th or 5th quarter. This pattern was also found in the provincial consolidated sample. The majority of parents/caregivers receiving support from support services indicated that they had increased knowledge of how FASD affects their child and that they had received
Year 7 FASD Service Network Evaluation EFAN Evaluation Report
23 July 2014 55
information that made them feel more capable of caring for their child. Results were similar to the provincial sample. The majority of parents/caregivers receiving support from support services indicated that they had received assistance accessing help in the community for their child, that their support network had increased, and that their access to respite care had increased since accessing support services. Results were similar to the provincial sample, except that EFAN’s caregivers were more likely than all caregivers to have gained new access to respite care. Respite care is an area of service that is not systematically offered by all Networks. The majority of parents/caregivers receiving support from support services indicated that their family life had improved. Half of the parents/caregivers indicated that their stress levels had decreased as a result of the support that they have received. The majority of parents/caregivers also reported an increased sense of hope for their child. Results were similar to consolidated provincial responses. All parents/caregivers and almost all clients who participated in support services were happy with the services they received and that they received the support that they wanted. All parents/caregivers and clients indicated that they were treated with dignity and respect. Over half of the caregivers had attended at least one FASD training event, a higher percentage than in the provincial sample. Overall, EFAN’s Support Services appear to meet the Support Services outcomes. There is no specific recommendation for EFAN’s funded support services.
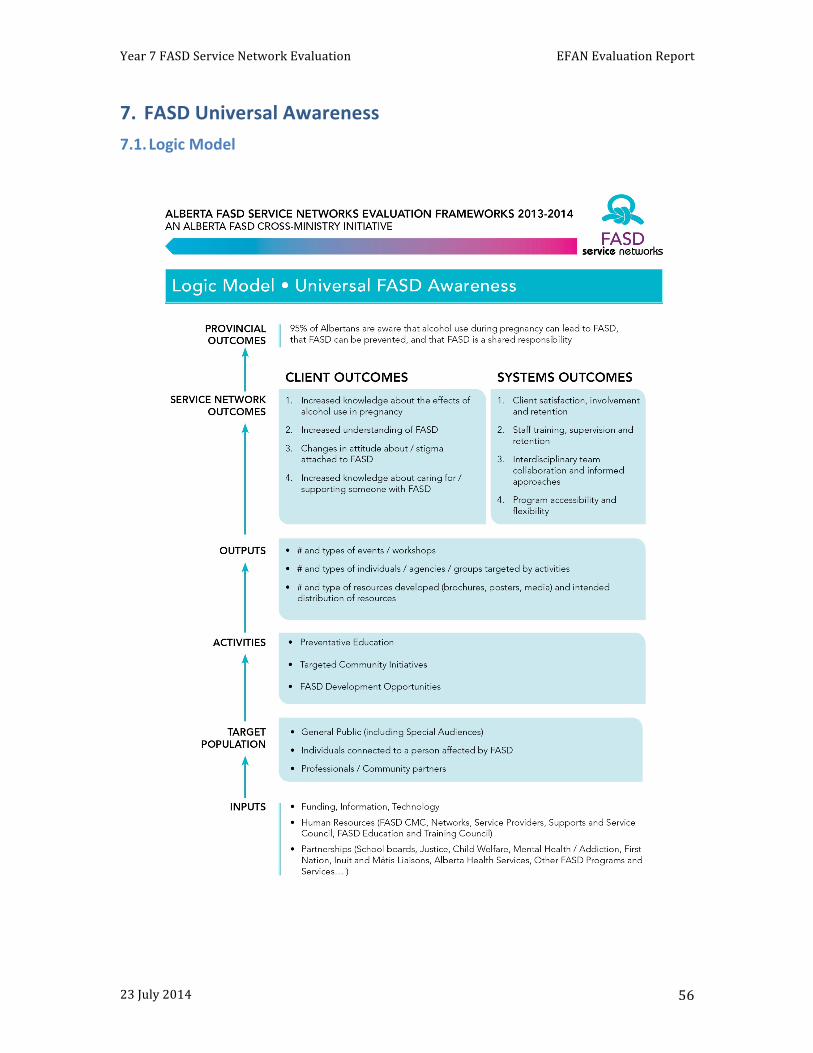
Year 7 FASD Service Network Evaluation EFAN Evaluation Report
23 July 2014 56
7. FASD Universal Awareness 7.1. Logic Model
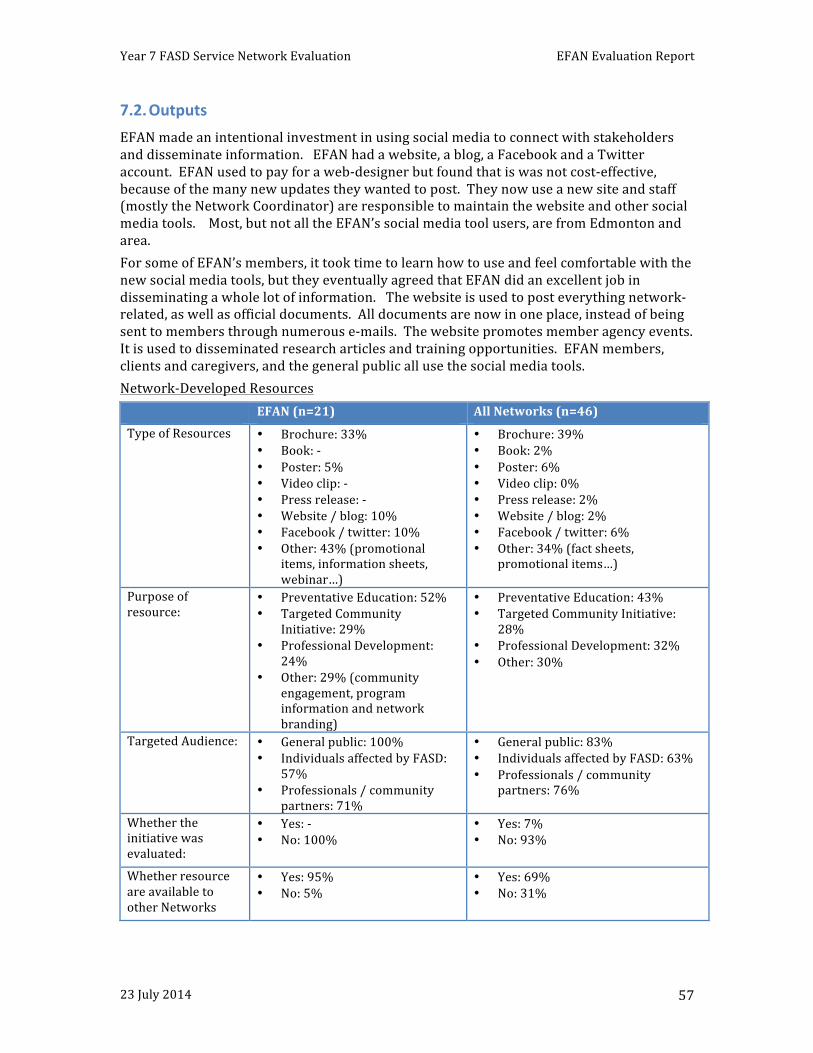
Year 7 FASD Service Network Evaluation EFAN Evaluation Report
23 July 2014 57
7.2. Outputs EFAN made an intentional investment in using social media to connect with stakeholders and disseminate information. EFAN had a website, a blog, a Facebook and a Twitter account. EFAN used to pay for a web-‐designer but found that is was not cost-‐effective, because of the many new updates they wanted to post. They now use a new site and staff (mostly the Network Coordinator) are responsible to maintain the website and other social media tools. Most, but not all the EFAN’s social media tool users, are from Edmonton and area. For some of EFAN’s members, it took time to learn how to use and feel comfortable with the new social media tools, but they eventually agreed that EFAN did an excellent job in disseminating a whole lot of information. The website is used to post everything network-‐related, as well as official documents. All documents are now in one place, instead of being sent to members through numerous e-‐mails. The website promotes member agency events. It is used to disseminated research articles and training opportunities. EFAN members, clients and caregivers, and the general public all use the social media tools. Network-‐Developed Resources EFAN (n=21) All Networks (n=46)
Type of Resources • Brochure: 33% • Book: -‐ • Poster: 5% • Video clip: -‐ • Press release: -‐ • Website / blog: 10% • Facebook / twitter: 10% • Other: 43% (promotional
items, information sheets, webinar…)
• Brochure: 39% • Book: 2% • Poster: 6% • Video clip: 0% • Press release: 2% • Website / blog: 2% • Facebook / twitter: 6% • Other: 34% (fact sheets,
promotional items…)
Purpose of resource:
• Preventative Education: 52% • Targeted Community
Initiative: 29% • Professional Development:
24% • Other: 29% (community
engagement, program information and network branding)
• Preventative Education: 43% • Targeted Community Initiative:
28% • Professional Development: 32% • Other: 30%
Targeted Audience: • General public: 100% • Individuals affected by FASD:
57% • Professionals / community
partners: 71%
• General public: 83% • Individuals affected by FASD: 63% • Professionals / community
partners: 76%
Whether the initiative was evaluated:
• Yes: -‐ • No: 100%
• Yes: 7% • No: 93%
Whether resource are available to other Networks
• Yes: 95% • No: 5%
• Yes: 69% • No: 31%
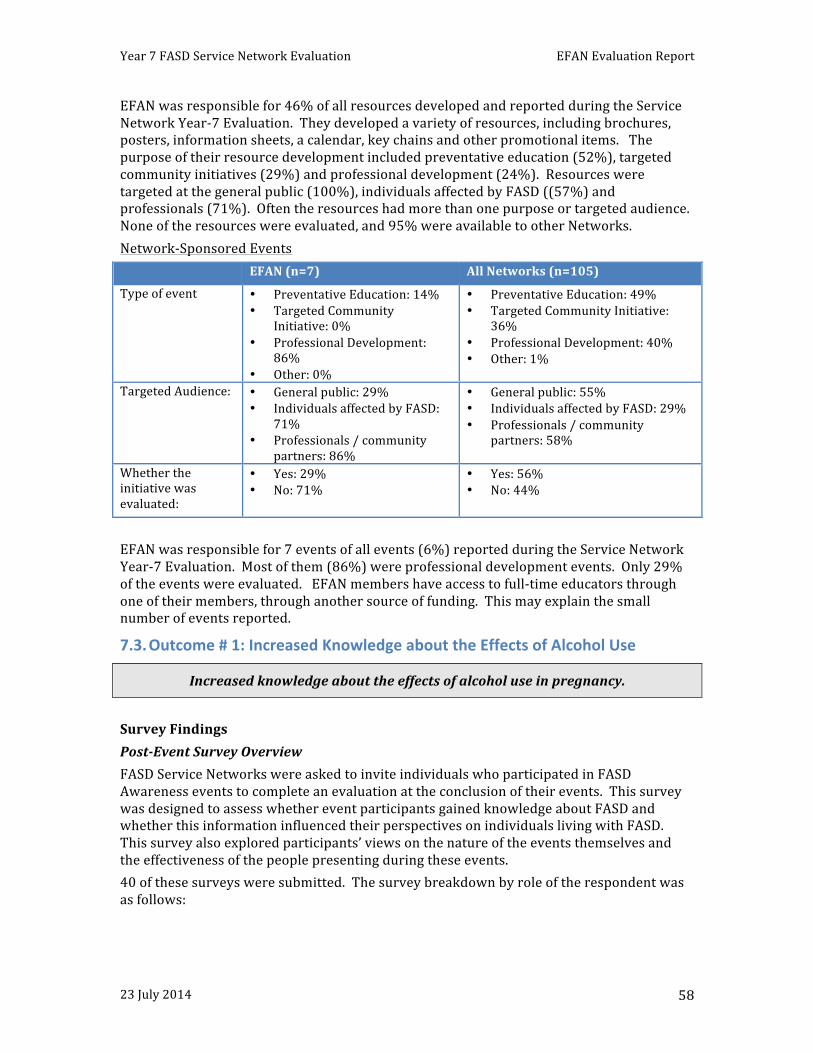
Year 7 FASD Service Network Evaluation EFAN Evaluation Report
23 July 2014 58
EFAN was responsible for 46% of all resources developed and reported during the Service Network Year-‐7 Evaluation. They developed a variety of resources, including brochures, posters, information sheets, a calendar, key chains and other promotional items. The purpose of their resource development included preventative education (52%), targeted community initiatives (29%) and professional development (24%). Resources were targeted at the general public (100%), individuals affected by FASD ((57%) and professionals (71%). Often the resources had more than one purpose or targeted audience. None of the resources were evaluated, and 95% were available to other Networks. Network-‐Sponsored Events EFAN (n=7) All Networks (n=105)
Type of event • Preventative Education: 14% • Targeted Community
Initiative: 0% • Professional Development:
86% • Other: 0%
• Preventative Education: 49% • Targeted Community Initiative:
36% • Professional Development: 40% • Other: 1%
Targeted Audience: • General public: 29% • Individuals affected by FASD:
71% • Professionals / community
partners: 86%
• General public: 55% • Individuals affected by FASD: 29% • Professionals / community
partners: 58%
Whether the initiative was evaluated:
• Yes: 29% • No: 71%
• Yes: 56% • No: 44%
EFAN was responsible for 7 events of all events (6%) reported during the Service Network Year-‐7 Evaluation. Most of them (86%) were professional development events. Only 29% of the events were evaluated. EFAN members have access to full-‐time educators through one of their members, through another source of funding. This may explain the small number of events reported.
7.3. Outcome # 1: Increased Knowledge about the Effects of Alcohol Use
Increased knowledge about the effects of alcohol use in pregnancy.
Survey Findings Post-‐Event Survey Overview FASD Service Networks were asked to invite individuals who participated in FASD Awareness events to complete an evaluation at the conclusion of their events. This survey was designed to assess whether event participants gained knowledge about FASD and whether this information influenced their perspectives on individuals living with FASD. This survey also explored participants’ views on the nature of the events themselves and the effectiveness of the people presenting during these events. 40 of these surveys were submitted. The survey breakdown by role of the respondent was as follows:
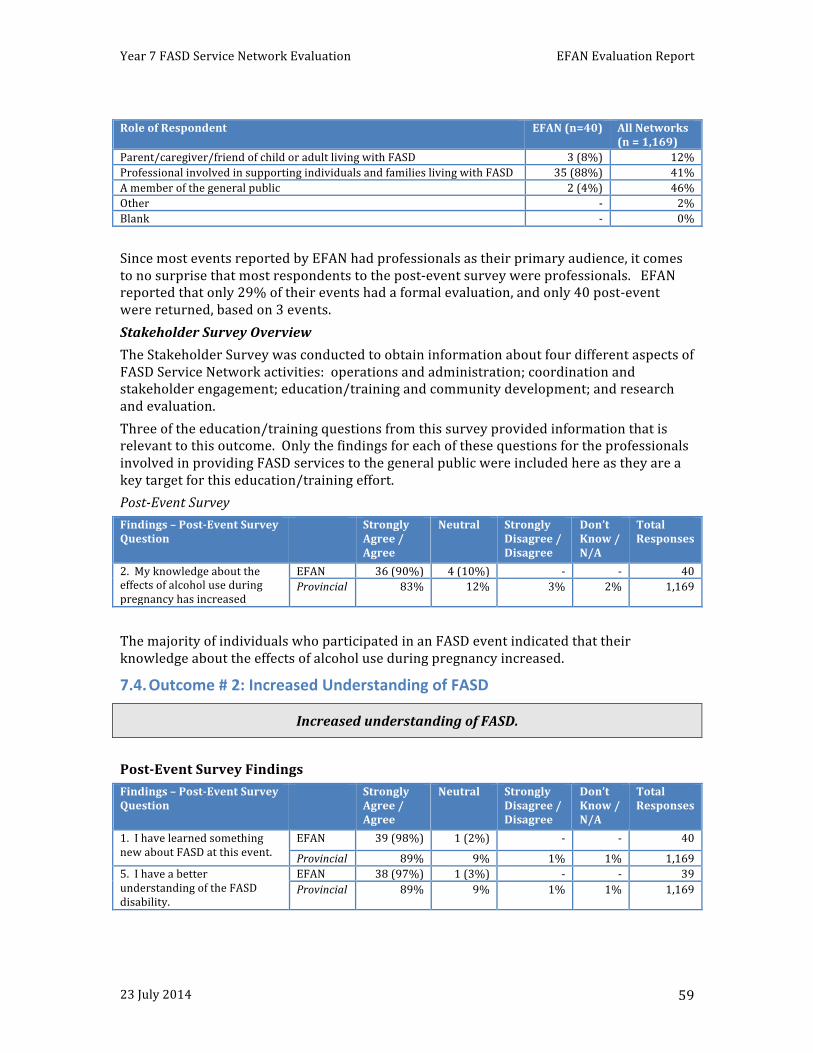
Year 7 FASD Service Network Evaluation EFAN Evaluation Report
23 July 2014 59
Since most events reported by EFAN had professionals as their primary audience, it comes to no surprise that most respondents to the post-‐event survey were professionals. EFAN reported that only 29% of their events had a formal evaluation, and only 40 post-‐event were returned, based on 3 events. Stakeholder Survey Overview The Stakeholder Survey was conducted to obtain information about four different aspects of FASD Service Network activities: operations and administration; coordination and stakeholder engagement; education/training and community development; and research and evaluation. Three of the education/training questions from this survey provided information that is relevant to this outcome. Only the findings for each of these questions for the professionals involved in providing FASD services to the general public were included here as they are a key target for this education/training effort. Post-‐Event Survey Findings – Post-‐Event Survey Question
Strongly Agree / Agree
Neutral Strongly Disagree / Disagree
Don’t Know / N/A
Total Responses
2. My knowledge about the effects of alcohol use during pregnancy has increased
EFAN 36 (90%) 4 (10%) -‐ -‐ 40 Provincial 83% 12% 3% 2% 1,169
The majority of individuals who participated in an FASD event indicated that their knowledge about the effects of alcohol use during pregnancy increased.
7.4. Outcome # 2: Increased Understanding of FASD
Increased understanding of FASD.
Post-‐Event Survey Findings Findings – Post-‐Event Survey Question
Strongly Agree / Agree
Neutral Strongly Disagree / Disagree
Don’t Know / N/A
Total Responses
1. I have learned something new about FASD at this event.
EFAN 39 (98%) 1 (2%) -‐ -‐ 40
Provincial 89% 9% 1% 1% 1,169 5. I have a better understanding of the FASD disability.
EFAN 38 (97%) 1 (3%) -‐ -‐ 39 Provincial 89% 9% 1% 1% 1,169
Role of Respondent EFAN (n=40) All Networks (n = 1,169)
Parent/caregiver/friend of child or adult living with FASD 3 (8%) 12% Professional involved in supporting individuals and families living with FASD 35 (88%) 41% A member of the general public 2 (4%) 46% Other -‐ 2% Blank -‐ 0%
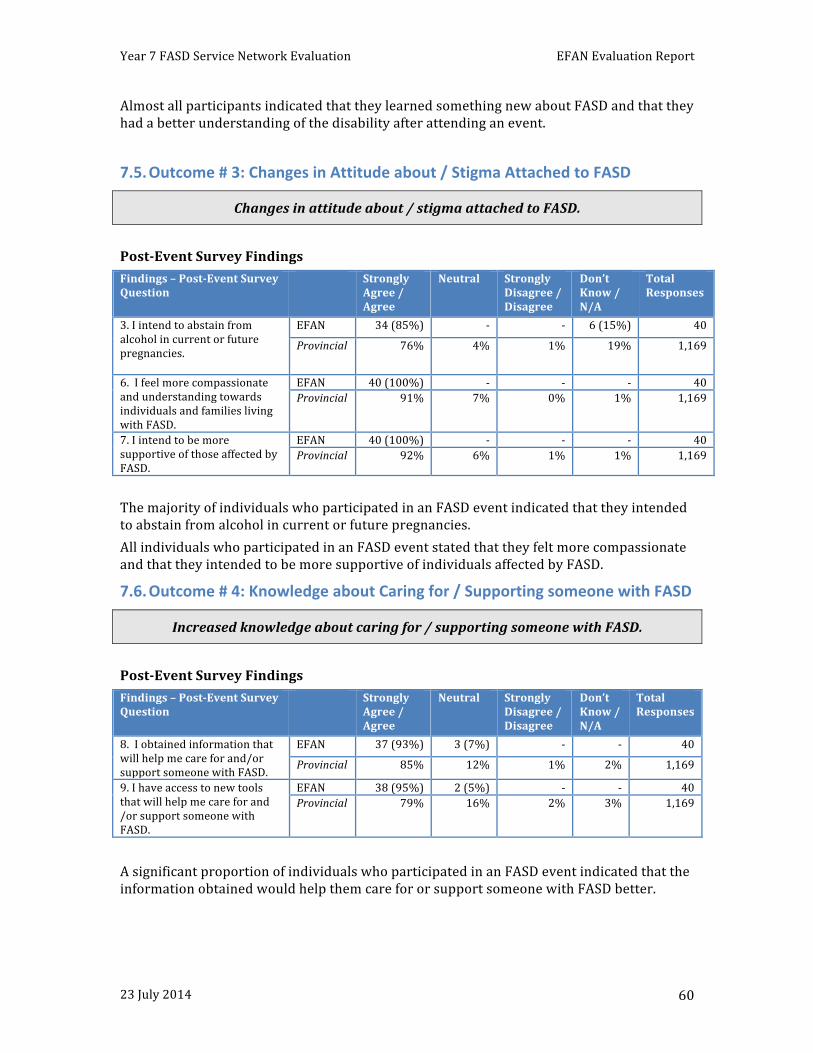
Year 7 FASD Service Network Evaluation EFAN Evaluation Report
23 July 2014 60
Almost all participants indicated that they learned something new about FASD and that they had a better understanding of the disability after attending an event.
7.5. Outcome # 3: Changes in Attitude about / Stigma Attached to FASD
Changes in attitude about / stigma attached to FASD.
Post-‐Event Survey Findings Findings – Post-‐Event Survey Question
Strongly Agree / Agree
Neutral Strongly Disagree / Disagree
Don’t Know / N/A
Total Responses
3. I intend to abstain from alcohol in current or future pregnancies.
EFAN 34 (85%) -‐ -‐ 6 (15%) 40
Provincial 76% 4% 1% 19% 1,169
6. I feel more compassionate and understanding towards individuals and families living with FASD.
EFAN 40 (100%) -‐ -‐ -‐ 40 Provincial 91% 7% 0% 1% 1,169
7. I intend to be more supportive of those affected by FASD.
EFAN 40 (100%) -‐ -‐ -‐ 40 Provincial 92% 6% 1% 1% 1,169
The majority of individuals who participated in an FASD event indicated that they intended to abstain from alcohol in current or future pregnancies. All individuals who participated in an FASD event stated that they felt more compassionate and that they intended to be more supportive of individuals affected by FASD.
7.6. Outcome # 4: Knowledge about Caring for / Supporting someone with FASD
Increased knowledge about caring for / supporting someone with FASD.
Post-‐Event Survey Findings Findings – Post-‐Event Survey Question
Strongly Agree / Agree
Neutral Strongly Disagree / Disagree
Don’t Know / N/A
Total Responses
8. I obtained information that will help me care for and/or support someone with FASD.
EFAN 37 (93%) 3 (7%) -‐ -‐ 40
Provincial 85% 12% 1% 2% 1,169
9. I have access to new tools that will help me care for and /or support someone with FASD.
EFAN 38 (95%) 2 (5%) -‐ -‐ 40 Provincial 79% 16% 2% 3% 1,169
A significant proportion of individuals who participated in an FASD event indicated that the information obtained would help them care for or support someone with FASD better.
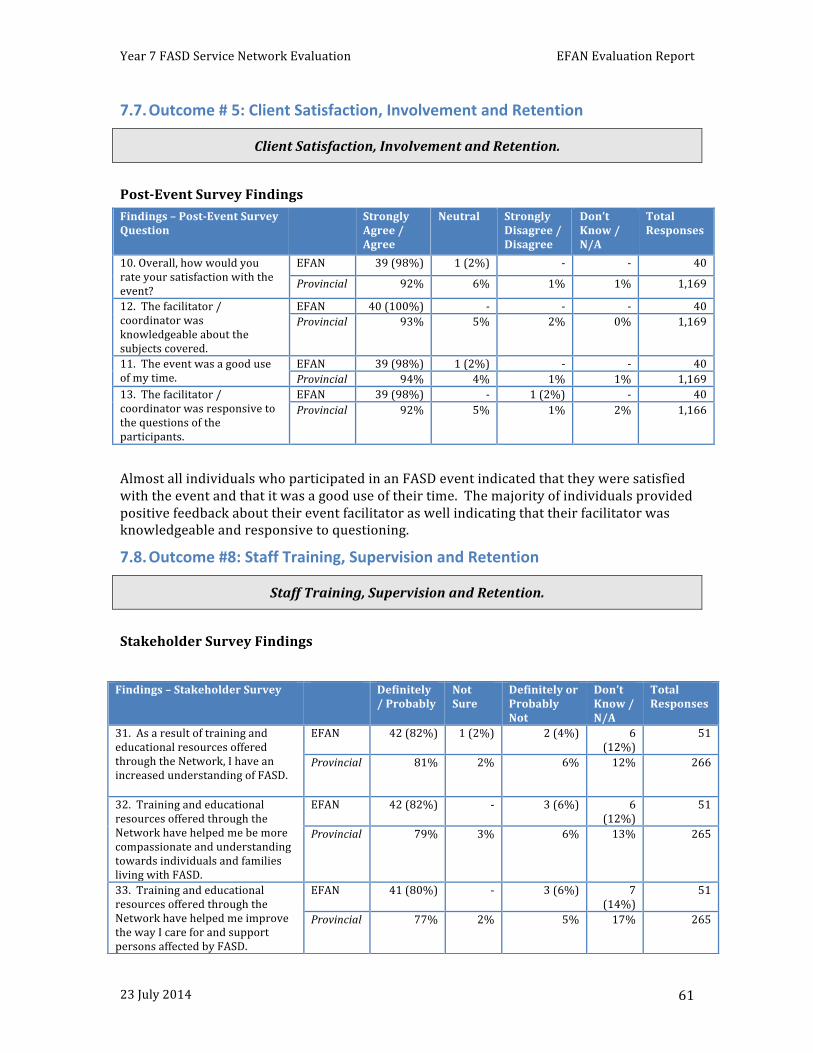
Year 7 FASD Service Network Evaluation EFAN Evaluation Report
23 July 2014 61
7.7. Outcome # 5: Client Satisfaction, Involvement and Retention
Client Satisfaction, Involvement and Retention.
Post-‐Event Survey Findings Findings – Post-‐Event Survey Question
Strongly Agree / Agree
Neutral Strongly Disagree / Disagree
Don’t Know / N/A
Total Responses
10. Overall, how would you rate your satisfaction with the event?
EFAN 39 (98%) 1 (2%) -‐ -‐ 40
Provincial 92% 6% 1% 1% 1,169
12. The facilitator / coordinator was knowledgeable about the subjects covered.
EFAN 40 (100%) -‐ -‐ -‐ 40 Provincial 93% 5% 2% 0% 1,169
11. The event was a good use of my time.
EFAN 39 (98%) 1 (2%) -‐ -‐ 40 Provincial 94% 4% 1% 1% 1,169
13. The facilitator / coordinator was responsive to the questions of the participants.
EFAN 39 (98%) -‐ 1 (2%) -‐ 40 Provincial 92% 5% 1% 2% 1,166
Almost all individuals who participated in an FASD event indicated that they were satisfied with the event and that it was a good use of their time. The majority of individuals provided positive feedback about their event facilitator as well indicating that their facilitator was knowledgeable and responsive to questioning.
7.8. Outcome #8: Staff Training, Supervision and Retention
Staff Training, Supervision and Retention.
Stakeholder Survey Findings
Findings – Stakeholder Survey Definitely / Probably
Not Sure
Definitely or Probably Not
Don’t Know / N/A
Total Responses
31. As a result of training and educational resources offered through the Network, I have an increased understanding of FASD.
EFAN 42 (82%) 1 (2%) 2 (4%) 6 (12%)
51
Provincial 81% 2% 6% 12% 266
32. Training and educational resources offered through the Network have helped me be more compassionate and understanding towards individuals and families living with FASD.
EFAN 42 (82%) -‐ 3 (6%) 6 (12%)
51
Provincial 79% 3% 6% 13% 265
33. Training and educational resources offered through the Network have helped me improve the way I care for and support persons affected by FASD.
EFAN 41 (80%) -‐ 3 (6%) 7 (14%)
51
Provincial 77% 2% 5% 17% 265
Year 7 FASD Service Network Evaluation EFAN Evaluation Report
23 July 2014 62
Overall, responses to the Stakeholder Survey questions were positive. A significant proportion of respondents indicated that the training and education provided by the Network helped them increase their understanding of FASD have made them more compassionate and supportive of individuals affected by FASD.
7.9. Other Outcomes
# 9: Interdisciplinary team collaboration and informed approaches.
#10: Program Accessibility and Flexibility.
Service Networks were not required to report specifically on Service Providers’ system outcomes.
7.10. Discussion Related to Universal Awareness EFAN made an intentional investment in using social media to connect with stakeholders and disseminate information. EFAN had a website, a blog, a Facebook and a Twitter account. EFAN’s members have learned to use the social medial tools to access a wealth of information about FASD, events and resources. EFAN was responsible for 46% of all resources developed and reported during the Service Network Year-‐7 Evaluation. They developed a variety of resources, including brochures, posters, information sheets, a calendar, key chains and other promotional items. The purpose of their resource development included preventative education (52%), targeted community initiatives (29%) and professional development (24%). Resources were targeted at the general public (100%), individuals affected by FASD ((57%) and professionals (71%). Often the resources had more than one purpose or targeted audience. None of the resources were evaluated (compared to 7% on a provincial level), and 95% were available to other Networks. EFAN was responsible for 7 events of all events (6%) reported during the Service Network Year-‐7 Evaluation. Most of them (86%) were professional development events. Only 29% of the events were evaluated. EFAN was responsible for 7 events of all events (6%) reported during the Service Network Year-‐7 Evaluation. Most of them (86%) were professional development events. Only 29% of the events were evaluated (compared to 56% on a provincial level), resulting in 40 post-‐event surveys. EFAN members have access to full-‐time educators through one of their members, through another source of funding. This may explain the small number of events reported, and that only 40 post-‐event surveys returned. Recommendation: EFAN should consider the feasibility of strengthening their evaluation of events and resources. Survey results were very positive, with generally higher satisfaction rates as consolidated provincial results: 97% of respondents indicated that they learned something new about FASD and that they had a better understanding of the disability after attending an event. All individuals who participated in an FASD event stated that they felt more compassionate and that they intended to be more supportive of individuals affected by FASD. 93% indicated that the information obtained would help them care for or support someone with FASD better. 98% indicated that they were satisfied with the event and that it was a good use of their time.

Year 7 FASD Service Network Evaluation EFAN Evaluation Report
23 July 2014 63
In the Network stakeholder survey, 80% of respondents indicated that the training and education provided by the Network helped them increase their understanding of FASD have made them more compassionate and supportive of individuals affected by FASD (14% of respondents did not know).
Evaluation results suggest that EFAN is a leader among all Networks in resource development, and that there is a high rate of satisfaction with the FASD training offered through the Network.
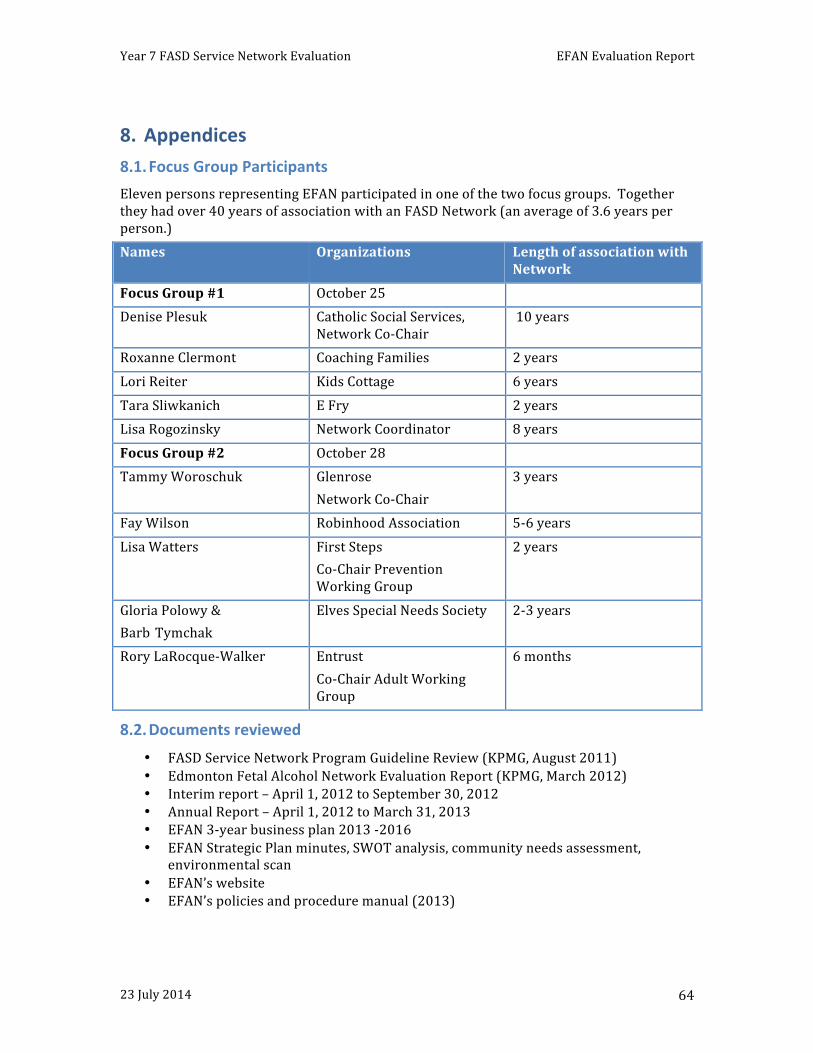
Year 7 FASD Service Network Evaluation EFAN Evaluation Report
23 July 2014 64
8. Appendices 8.1. Focus Group Participants Eleven persons representing EFAN participated in one of the two focus groups. Together they had over 40 years of association with an FASD Network (an average of 3.6 years per person.) Names Organizations Length of association with
Network Focus Group #1 October 25 Denise Plesuk Catholic Social Services,
Network Co-‐Chair 10 years
Roxanne Clermont Coaching Families 2 years Lori Reiter Kids Cottage 6 years Tara Sliwkanich E Fry 2 years Lisa Rogozinsky Network Coordinator 8 years Focus Group #2 October 28 Tammy Woroschuk Glenrose
Network Co-‐Chair 3 years
Fay Wilson Robinhood Association 5-‐6 years Lisa Watters First Steps
Co-‐Chair Prevention Working Group
2 years
Gloria Polowy & Barb Tymchak
Elves Special Needs Society 2-‐3 years
Rory LaRocque-‐Walker Entrust Co-‐Chair Adult Working Group
6 months
8.2. Documents reviewed
• FASD Service Network Program Guideline Review (KPMG, August 2011) • Edmonton Fetal Alcohol Network Evaluation Report (KPMG, March 2012) • Interim report – April 1, 2012 to September 30, 2012 • Annual Report – April 1, 2012 to March 31, 2013 • EFAN 3-‐year business plan 2013 -‐2016 • EFAN Strategic Plan minutes, SWOT analysis, community needs assessment,
environmental scan • EFAN’s website • EFAN’s policies and procedure manual (2013)