Embed Size (px)
Citation preview
7/29/2019 fta_microturbinechp
http://slidepdf.com/reader/full/ftamicroturbinechp 1/24
Federal Technology Alert A New Technology Demonstration Publication
DOE/EE-0316
eading by example,eading by example,aving energy andaving energy andaxpayer dollarsaxpayer dollarsn federal facilitiesn federal facilities
ringing you a prosperousringing you a prosperousuture where energy isuture where energy islean, abundant, reliable,lean, abundant, reliable,nd affordablend affordable
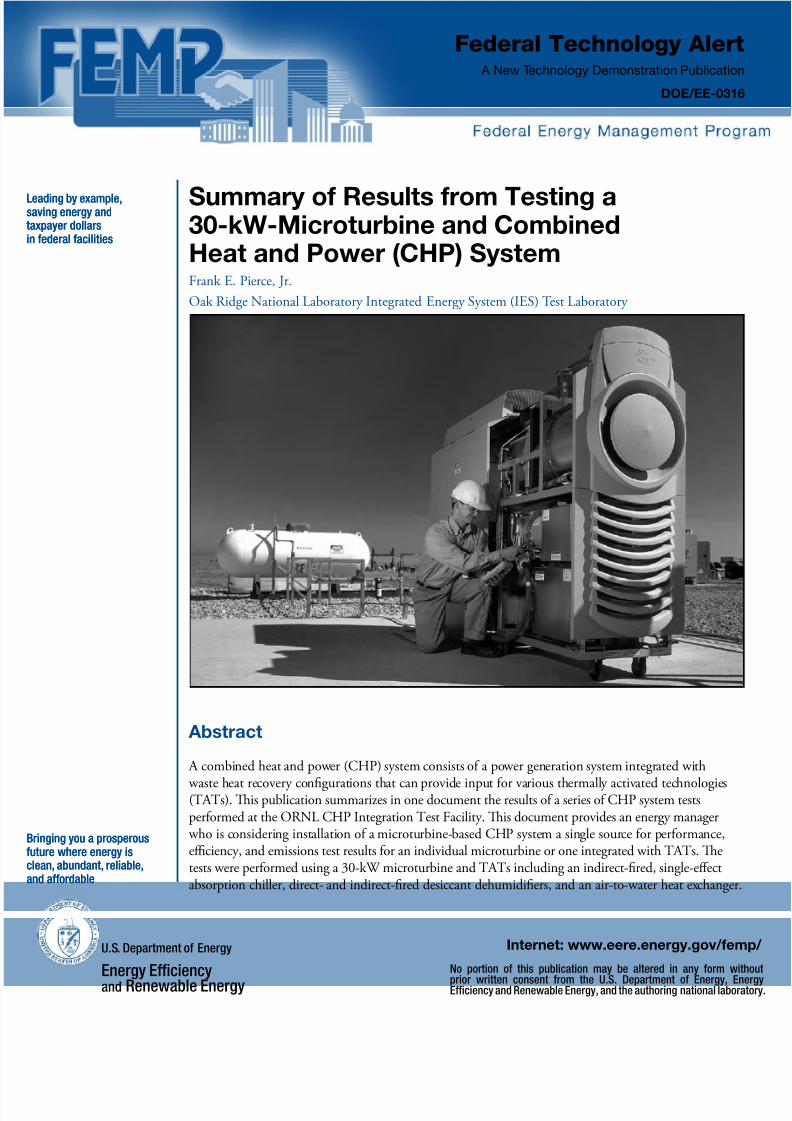
Summary of Results from Testing a30-kW-Microturbine and CombinedHeat and Power (CHP) SystemFrank E. Pierce, Jr.
Oak Ridge National Laboratory Integrated Energy System (IES) est Laboratory
Abstract
A combined heat and power (CHP) system consists o a power generation system integrated with
waste heat recovery congurations that can provide input or various thermally activated technologies(As). Tis publication summarizes in one document the results o a series o CHP system testsperormed at the ORNL CHP Integration est Facility. Tis document provides an energy manager who is considering installation o a microturbine-based CHP system a single source or perormance,eciency, and emissions test results or an individual microturbine or one integrated with As. Tetests were perormed using a 30-kW microturbine and As including an indirect-red, single-eectabsorption chiller, direct- and indirect-red desiccant dehumidiers, and an air-to-water heat exchanger.
Internet: www.eere.energy.gov/fem
No portion of this publication may be altered in any form wi
prior written consent from the U.S. Department of Energy, EnEfficiency and Renewable Energy, and the authoring national labor
U.S. Department of Energy
Energy Efficiencyand Renewable Energy

7/29/2019 fta_microturbinechp
http://slidepdf.com/reader/full/ftamicroturbinechp 2/24
Federal Technology Alert
LIST OF FIGURES
Figure Page1 Schematic o CHP Integrated est Facility at ORNL 42 Schematic o direct-red desiccant dehumidication unit 63 Schematic o indirect-red desiccant dehumidication unit 64 Startup power output and turbine speed 85 Shutdown power output and turbine speed 86 Power dispatching response: power output and turbine speed 97 Microturbine power output variation or 1 h at 30 kW 98 Eciency and exhaust temperature versus power output 119 Eect o ambient temperature on power output 1110 Eect o ambient temperature on exhaust temperature 1111 Experimental setup or baseline testing microturbine 1212 Heat recovery by the HRU at a water fow rate o 4.3 m3/h (19 gpm) 1413 IES system and microturbine: heat recovery eciencies 1414 Eciencies o microturbine (MG) and IES 1715 Eect o power output on latent capacity 18
16 Eect o power output on eciency 1817 Eect o ambient temperature on cooling capacity 1918 Eect o ambient temperature on the COP o the absorption chiller 1919 Eect o ambient temperature on the eciency o IES congurations 2020 Eciencies o IES congurations at various dry-/wet-bulb conditions 2121 Concentration o CO, NOx, and SO2 (ppmV 15) vs microturbine power output 2222 Concentration o CO, NOx, and SO2 (mg/m3) vs power output 2223 CO concentration vs air inlet temperature at 25- and 30-kW power output settings 23
LIST OF TABLES
able Page1 Microturbine perormance characteristics at various power settings 10
2 Capstone 30-kW microturbine with damper ully open 123 Capstone 30-kW microturbine with damper 3/8 open 134 Microturbine perormance at constant speed and varying back-pressure 135 Comparison o manuacturer’s test data and laboratory results 156 Latent capacity test results (IES-based operation) 167 Measured perormance parameters o the IES with the desiccant dehumidier 21
ACRONYMS
ABSC absorption chiller IES integrated energy system
CHP combined heat and power IFDD indirect-red desiccant dehumidiers
DER distributed energy resourceLC latent capacity
DFDD direct-red desiccant dehumidiers LCOP latent coecient o perormance
DG distributed generation LiBr/water lithium-bromide/water
HHV higher heating value MG microturbine generator
HRU heat recovery unit ORNL Oak Ridge National Laboratory
HVAC heating, ventilating, and air-conditioning A thermally activated technologies
.
2 –– FEDERAL ENERGY MANAGEMENT PROGRAM

7/29/2019 fta_microturbinechp
http://slidepdf.com/reader/full/ftamicroturbinechp 3/24
Federal Technology Alert
Contents
Page
LIS OF FIGURES 2
LIS OF ABLES 2
ACRONYMS 2
1. ABOU HE ECHNOLOGY 4
2. ORNL CHP INEGRAION ES FACILIY 4
2.1 ES FACILIY CONFIGURAION 4
2.2 ES FACILIY COMPONENS 5
2.2.1 Microturbine 5
2.2.2 Heat Recovery Unit 5
2.2.3 Desiccant Dehumidiers 5
2.2.4 Absorption Chiller 6
2.3 EMISSIONS MONIORING 73. MICROURBINE BASELINE CHARACERIZAION 7
3.1 SARUP, SHUDOWN, AND DISPACH CHARACERISICS 7
3.2 POWER OUPU VARIAION 7
3.3 PERFORMANCE A VARIOUS POWER SEINGS 7
3.4 EFFEC OF AMBIEN EMPERAURE ON ACHIEVABLE
POWER OUPU AND EXHAUS EMPERAURE 9
4. BACK-PRESSURE ESS 10
4.1 CONSAN POWER OUPU DEMAND 11
4.2 CONSAN ENGINE SPEED 12
5. HEA RECOVERY AND CHP EFFICIENCY 12
5.1 AIR-O-WAER HEA EXCHANGER (e.g., HRU) 13
5.2 DESICCAN DEHUMIDIFICAION 13
5.2.1 Direct Fired Desiccant Dehumidication 14
5.2.2 Indirect Fired Desiccant Dehumidication System 16
5.3 ABSORPION CHILLER 17
5.3.1 Eect o Ambient emperature on Absorption Chiller Capacity and COP 18
5.3.2 Eect o Ambient emperature on IES Conguration Eciency 19
5.4 ABSORPION CHILLER AND DIREC-FIRED
DESICCAN DEHUMIDIFICAION 206. EMISSION ESS 21
6.1 EFFEC OF MICROURBINE POWER OUPU ON EMISSIONS RAE 21
6.2 EFFEC OF MICROURBINE INLE AIR ON EMISSIONS RAE 22
7. HE ECHNOLOGY IN PERSPECIVE 23
8. REFERENCES 24
FEDERAL ENERGY MANAGEMENT PROGRAM –– 3
7/29/2019 fta_microturbinechp
http://slidepdf.com/reader/full/ftamicroturbinechp 4/24
Federal Technology Alert
1. ABOUT THETECHNOLOGY
Te U.S. Department o Energy’sOce o Electricity Delivery and Energy
Reliability studies the integration o electric power generation and thermally activated heating, ventilating, andair-conditioning (HVAC) systems. Tisprogram has sponsored research on a natural-gas-red, microturbine-basedcombined heat and power (CHP) system with thermally activated technologies(A) at Oak Ridge National Laboratory’s (ORNL’s) CHP Integration estFacility in Oak Ridge, ennessee. Tisreport summarizes the results o
perormance and eciency tests on a microturbine distributed energy resource(DER). Te microturbine was operatedindividually as well as integrated withvarious waste heat recovery congurationsover a range o design and o-designconditions in steady-state operating
mode. More detailed descriptions o the tests and results can be ound inthe reerences cited throughout thissummary report.
DERs are small, modular, power-
generation systems such as gas turbines,microturbines, uel cells, and advancedreciprocating engines that are located inthe vicinity o the energy end user. Temajor benets o a DER are (1) localcontrol o power generation, (2) ecientuse o waste heat, (3) increased overalleciency, and (4) a reduction inemissions.1,2
In a CHP system, waste heat rom the
DER generation system, which isnormally discharged to the environment,is used as input power or As. Overalleciencies o 40 to 70% or more can beachieved in well-integrated CHP systems when the waste heat is used. echnologies that can be driven by DER system waste heat include (1) chillers and
desiccant dehumidiers or spacecooling and dehumidication,(2) steam generators or space heating,and (3) heat exchangers or process anddomestic hot water.1 Tese CHP systemscan maximize energy eciency, provide
an option to central power generation,and improve electric power reliability and quality.1,2
2. ORNL CHPINTEGRATIONTEST FACILITY
2.1 TEST FACILITY
CONFIGURATION
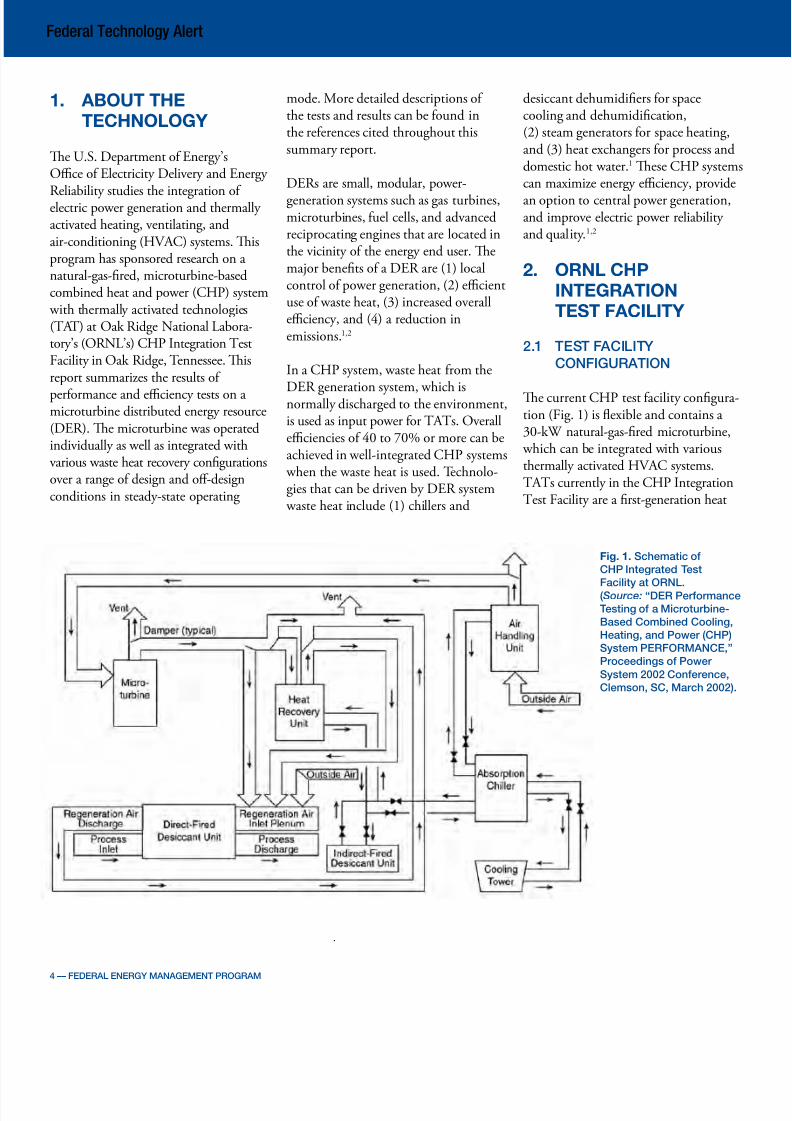
Te current CHP test acility conguration (Fig. 1) is fexible and contains a 30-kW natural-gas-red microturbine, which can be integrated with variousthermally activated HVAC systems.As currently in the CHP Integrationest Facility are a rst-generation heat
Fig. 1. Schematic o
CHP Integrated Test
Facility at ORNL.
( Source: “DER Perormance
Testing o a Microturbine
Based Combined Cooling,
Heating, and Power (CHP)
System PERFORMANCE,”
Proceedings o Power
System 2002 Conerence,
Clemson, SC, March 2002).
.
4 –– FEDERAL ENERGY MANAGEMENT PROGRAM
7/29/2019 fta_microturbinechp
http://slidepdf.com/reader/full/ftamicroturbinechp 5/24
Federal Technology Alert
recovery unit (HRU), an indirect-red,single-eect, 10-ton absorption chiller(ABSC), and direct-red (DFDD)and indirect-red (IFDD) desiccantdehumidiers. Under normal conditions,the heated air or hot water input or
these As is generated by natural gasring. In the CHP conguration, the waste exhaust heat rom the gas-redmicroturbine provides the thermalenergy input.1,2
Te microturbine exhaust gas, at a temperature normally ranging rom250 to 293°C (482 to 560°F), can bedirected through dierent pathsdepending on the conguration to be
tested. Hot water ranging in temperaturerom 85 to 95°C (185 to 203°F) can begenerated by directing the microturbineexhaust gas through an exhaust-gas-toliquid heat exchanger (e.g., an HRU).Te hot water generated in the HRUcan be input to either an indirect-reddesiccant dehumidication system ora 10-ton, indirect-red, single-eectabsorption chiller. Te temperatureo the exhaust gas leaving the HRU is~120°C (~248°F). For testing a direct-
red desiccant system, the exhaust gascan be supplied directly to the desiccantsystem inlet plenum or passed throughthe HRU to generate hot water and thenbe directed to the direct-red desiccantsystem inlet plenum.1,2
2.2 TEST FACILITY
COMPONENTS1,2
2.2.1 Microturbine
Te microturbine, a three-phase 480VAC/30-kW-rated unit, is designed tooperate at a maximum speed o 96,000rpm, generate 50 or 60 Hz power,produce a continuous phase currento 36 A at 480 VAC, and a near unity power actor when the unit is gridconnected. Te unit’s nominal phase-to
neutral voltage is 277 VAC. Tepower-conditioning electronics o theturbine generator recties the high-requency ac power rom the generatorto constant-voltage DC power, which isthen inverted to 50 or 60-Hz constant-
requency ac power.1,2
Te microturbine’s natural gas uel issupplied by the gas distributor at a pressure o only 0.3 atm (5 psig) andthe unit requires natural gas at a pressure o 3.7 atm (55 psig); thereore,a gas compressor is used to increase thepressure beore it enters the microturbine combustion chamber. An exhaust-gas-to-air heat exchanger/recuperator
is used to preheat the air entering thecombustion chamber, improving theelectrical eciency o the microturbineby ~10% rom 13 to 23% based onthe higher heating value (HHV) o thenatural gas.
2.2.2 Heat Recovery Unit3–6
Te HRU, an exhaust-gas-to-liquid heatexchanger, is used to recover a portiono the waste heat in the microturbine
exhaust gas and produce hot water orheating, input to the IFDD system, orinput to the absorption chiller. Althoughthe HRU nominal water fow rate is~4.3 m3/h (~19 gpm), CHP systemconguration tests were perormed with water fow rates as high as ~9 m3/h(~39.8 gpm). At a water fow rate o ~5.8 m3/h (~26 gpm) the maximum water temperature is ~91ºC (~196ºF). Actual water temperature depends onseveral parameters, such as microturbinepower output, ambient temperature,and HRU water fow rate. Te exhaustgas leaving the HRU has sucient wasteheat to potentially provide the thermalinput to additional direct-red As,such as a direct-red desiccantdehumidication unit (DFDD).
2.2.3 Desiccant
Dehumidiers1,2,4,5,7
Desiccant dehumidiers provide analternative to mechanical rerigerationor removing moisture rom air beore
it enters a conditioned space. Tedesiccant material attracts water romthe air as a vapor rather than condensedliquid. Te water vapor pressuredierence between humid air (highvapor pressure) and dry desiccant (low vapor pressure) provides the potentialthat causes water molecule migrationrom the humid air to the desiccant.
Te desiccant dehumidiers use a wheelo desiccant material mounted between
two air streams—a process stream and a reactivation stream. As the wheel rotatesbetween the two air streams, moistureis absorbed rom the process stream tonearly saturate the desiccant, andthe reactivation stream dries out thedesiccant. Moisture released rom thedesiccant wheel is carried by thereactivation stream and dischargedout o the building.
Desiccant units that use heated reactiva
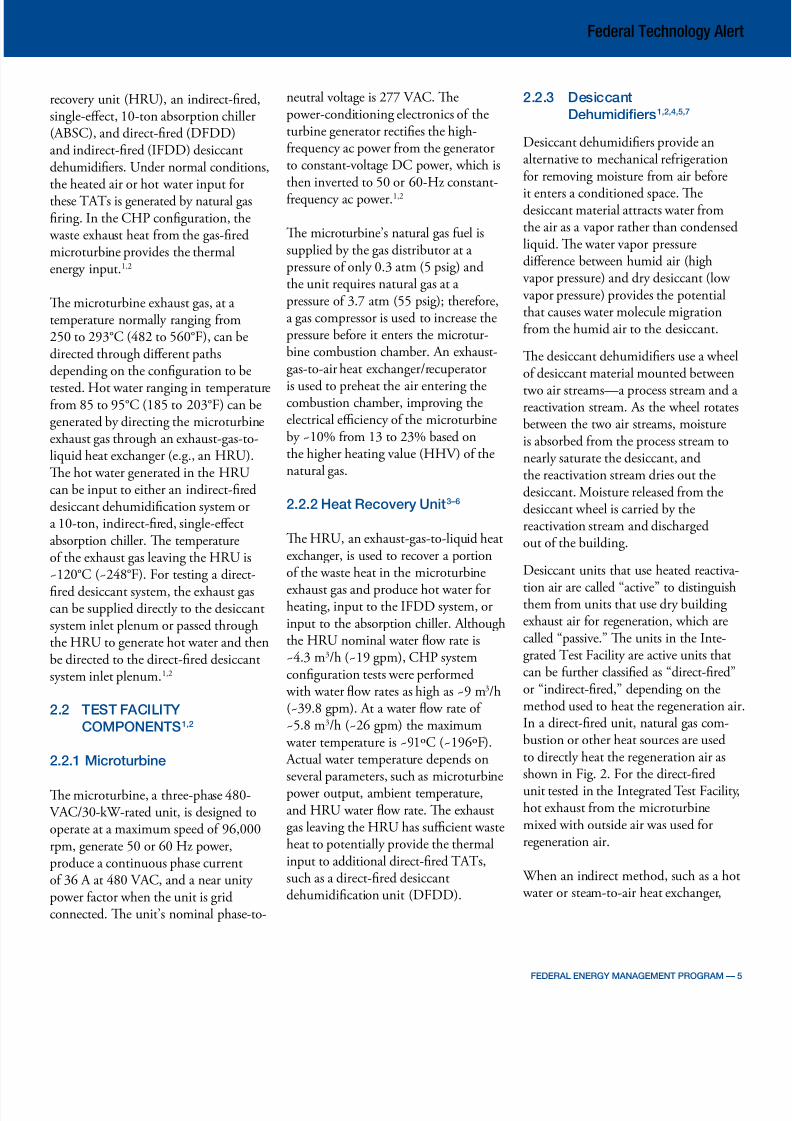
tion air are called “active” to distinguishthem rom units that use dry building exhaust air or regeneration, which arecalled “passive.” Te units in the Integrated est Facility are active units thatcan be urther classied as “direct-red”or “indirect-red,” depending on themethod used to heat the regeneration airIn a direct-red unit, natural gas combustion or other heat sources are usedto directly heat the regeneration air asshown in Fig. 2. For the direct-red
unit tested in the Integrated est Facility,hot exhaust rom the microturbinemixed with outside air was used orregeneration air.
When an indirect method, such as a hot water or steam-to-air heat exchanger,
FEDERAL ENERGY MANAGEMENT PROGRAM –– 5
7/29/2019 fta_microturbinechp
http://slidepdf.com/reader/full/ftamicroturbinechp 6/24
Federal Technology Alert
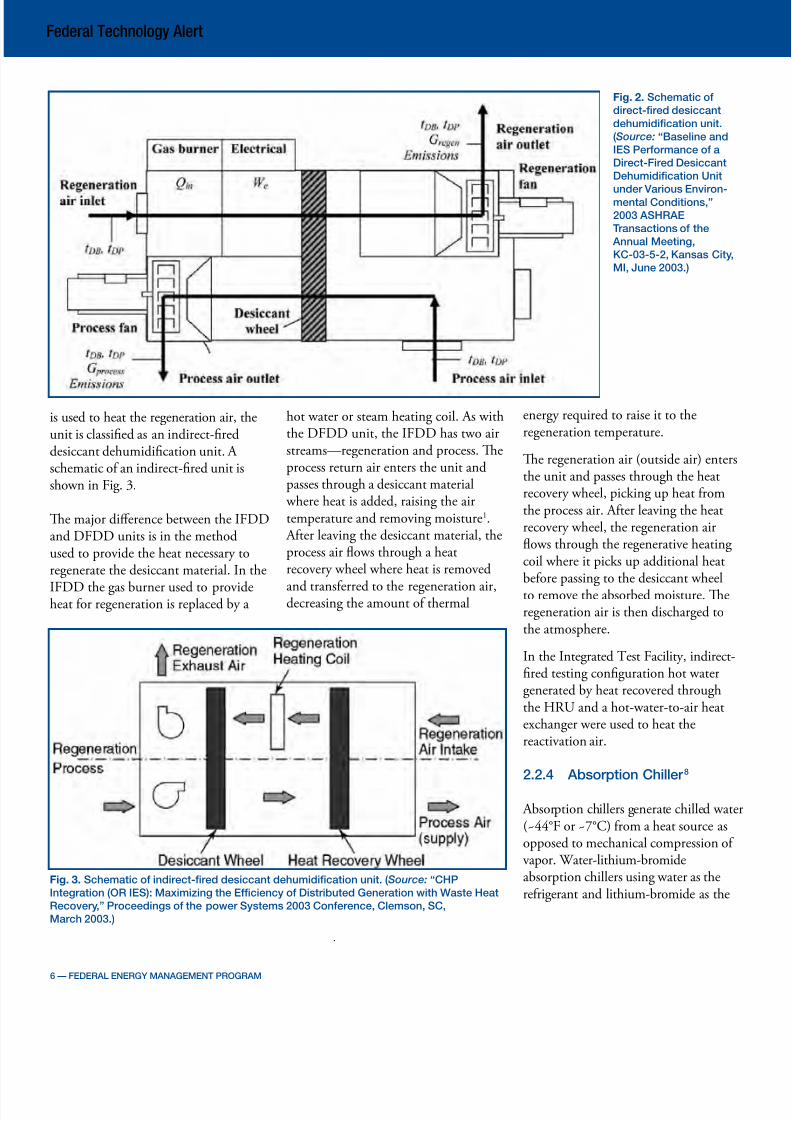
is used to heat the regeneration air, theunit is classied as an indirect-reddesiccant dehumidication unit. A schematic o an indirect-red unit isshown in Fig. 3.
Te major dierence between the IFDDand DFDD units is in the methodused to provide the heat necessary toregenerate the desiccant material. In the
IFDD the gas burner used to provideheat or regeneration is replaced by a
hot water or steam heating coil. As withthe DFDD unit, the IFDD has two airstreams—regeneration and process. Teprocess return air enters the unit andpasses through a desiccant material where heat is added, raising the airtemperature and removing moisture1. Ater leaving the desiccant material, theprocess air fows through a heatrecovery wheel where heat is removed
and transerred to the regeneration air,decreasing the amount o thermal
Fig. 3. Schematic o indirectred desiccant dehumidication unit. ( Source: “CHP
Integration (OR IES): Maximizing the Eciency o Distributed Generation with Waste Heat
Recovery,” Proceedings o the power Systems 2003 Conerence, Clemson, SC,
March 2003.)
Fig. 2. Schematic o
directred desiccant
dehumidication unit.
( Source: “Baseline and
IES Perormance o a
DirectFired Desiccant
Dehumidication Unit
under Various Environ-
mental Conditions,”
2003 ASHRAE
Transactions o the
Annual Meeting,
KC0352, Kansas City,
MI, June 2003.)
energy required to raise it to theregeneration temperature.
Te regeneration air (outside air) entersthe unit and passes through the heatrecovery wheel, picking up heat romthe process air. Ater leaving the heatrecovery wheel, the regeneration airfows through the regenerative heating coil where it picks up additional heatbeore passing to the desiccant wheelto remove the absorbed moisture. Teregeneration air is then discharged tothe atmosphere.
In the Integrated est Facility, indirect-red testing conguration hot watergenerated by heat recovered throughthe HRU and a hot-water-to-air heatexchanger were used to heat thereactivation air.
2.2.4 Absorption Chiller 8
Absorption chillers generate chilled water(~44°F or ~7°C) rom a heat source asopposed to mechanical compression o vapor. Water-lithium-bromideabsorption chillers using water as thererigerant and lithium-bromide as the
.
6 –– FEDERAL ENERGY MANAGEMENT PROGRAM
7/29/2019 fta_microturbinechp
http://slidepdf.com/reader/full/ftamicroturbinechp 7/24
Federal Technology Alert
absorbent are classied by the method o heat input (direct-red or indirect-red)and whether the absorption cycle issingle or multiple eect. Te direct-redabsorption chillers contain ossil uelburners to provide the heat source.
Indirect-red units use hot water orsteam rom a separate heat source toprovide the heat input. Exhaust-redunites use hot exhaust gases directly astheir heat source.
Single-eect absorption chillers generally use water rom 116ºC to132ºC (240ºFto 270ºF) with some smaller machinesor waste heat applications using 190ºF,or low pressure (9 to 12 psig) steam.Double-eect chillers provide increased
eciency but also need higher-pressuresteam (i.e., 100 psig) or high-temperature water (i.e., 188ºC or 370ºF). Tecurrent CHP test acility congurationcontains an indirect-red, single-eect10-ton AC.
2.3 EMISSIONS MONITORING7
Te air pollutants most signicant togas microturbine-based CHP systemoperation are nitrogen dioxide (NO
2),
carbon monoxide (CO), and sulurdioxide (SO
2), all o which can have
a signicant eect on the level o environmental pollution. Tese pollutantsalong with, lead (Pb), ozone (O3), andparticulates are among six criteria airpollutants that have had ambient airlimits set by the U.S. EnvironmentalProtection Agency. Tereore, these threepollutants were o most interest during the emissions studies perormed at theIntegrated est Facility.
An Enerac 3000E fue gas analyzersupported by Enercom 2000 sotwareand electrochemical sensor was usedor emissions monitoring o the micro-turbine fue gas. Te concentrations o NOx, CO, and SO2 were measured in
ppm by volume (i.e., volume o gaseouspollutant per million volumes o ambient air) at the test oxygen concentration, corrected to 15% O2 (typicalrequirement or comparison o variousDG equipment) and then converted
to mg/m3.
3. MICROTURBINE
BASELINE
CHARACTERIZATION1,2
Te rst phase o testing the 30-kW microturbine and CHP consisted o characterizing the baseline perormanceo the microturbine. Te collected electrical data included the microturbine’s
DC voltage, and single- and three-phasepower output, voltage, and current. Tethermal data included the microturbine’sinput temperature, exhaust temperature,internal temperatures at the compressorand turbine, and emissions.
Te baseline characterization tests wereperormed without As connected tothe microturbine exhaust. Even without the presence o any equipment or
thermal recovery, some degree o back-pressure exists (~8.0 × 10⁻⁴ atm or 0.3in wc), although this is quite low. Teeect o exhaust back pressure on themicroturbine’s power and eciency isdiscussed in Sect. 4.0.
3.1 STARTUP, SHUTDOWN,
AND DISPATCH
CHARACTERISTICS1,2
Te startup, shutdown, and power
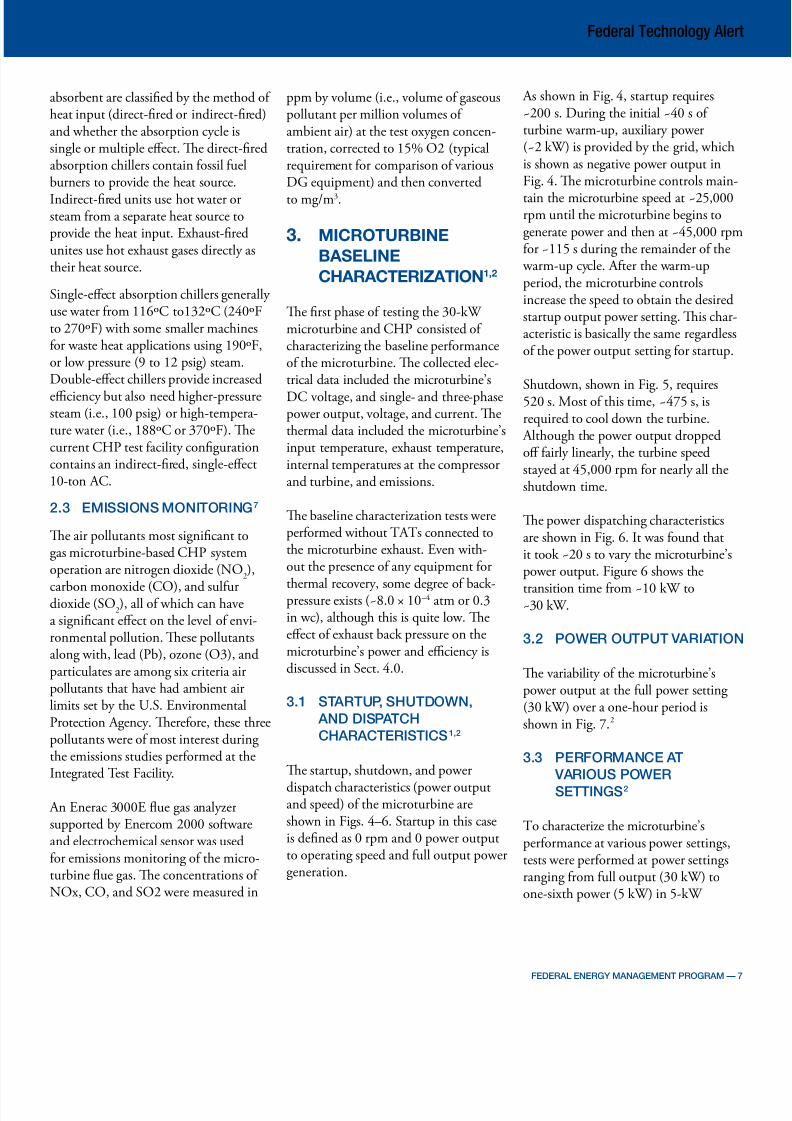
dispatch characteristics (power outputand speed) o the microturbine areshown in Figs. 4–6. Startup in this caseis dened as 0 rpm and 0 power outputto operating speed and ull output powergeneration.
As shown in Fig. 4, startup requires~200 s. During the initial ~40 s o turbine warm-up, auxiliary power(~2 kW) is provided by the grid, whichis shown as negative power output inFig. 4. Te microturbine controls main
tain the microturbine speed at ~25,000rpm until the microturbine begins togenerate power and then at ~45,000 rpmor ~115 s during the remainder o the warm-up cycle. Ater the warm-upperiod, the microturbine controlsincrease the speed to obtain the desiredstartup output power setting. Tis characteristic is basically the same regardlesso the power output setting or startup.
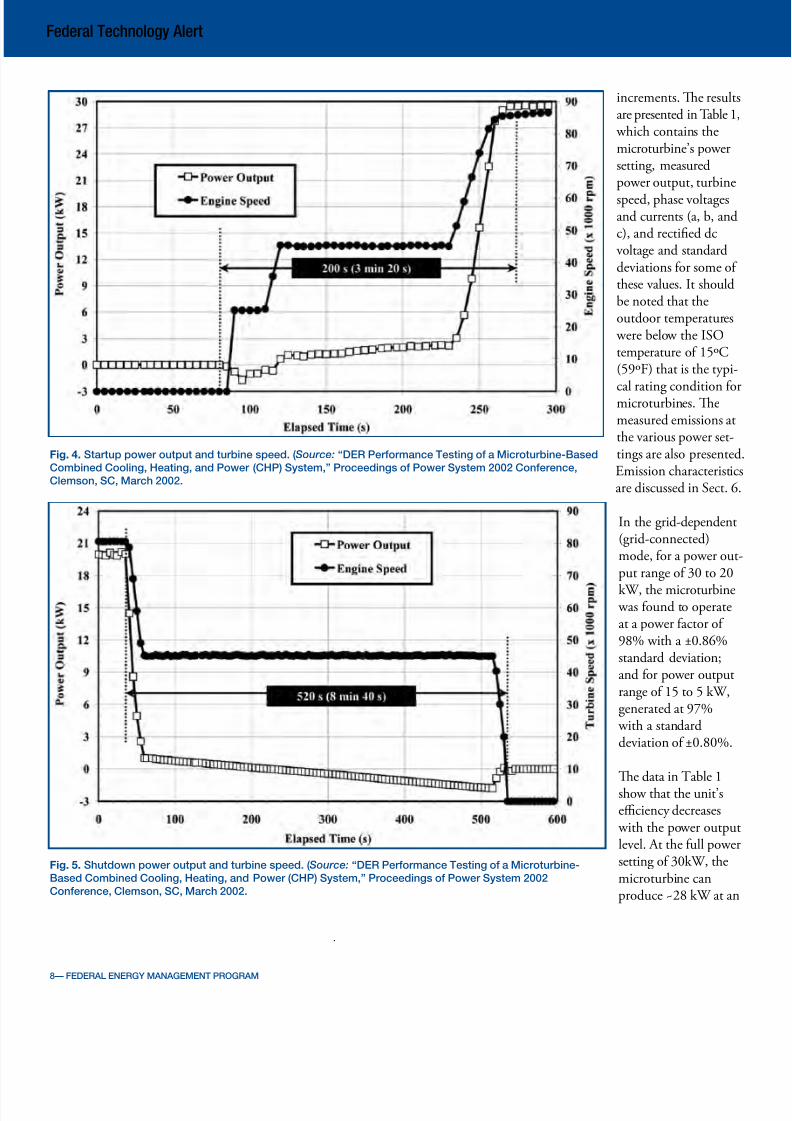
Shutdown, shown in Fig. 5, requires520 s. Most o this time, ~475 s, isrequired to cool down the turbine. Although the power output droppedo airly linearly, the turbine speedstayed at 45,000 rpm or nearly all theshutdown time.
Te power dispatching characteristicsare shown in Fig. 6. It was ound thatit took ~20 s to vary the microturbine’spower output. Figure 6 shows the
transition time rom ~10 kW to~30 kW.
3.2 POWER OUTPUT VARIATION
Te variability o the microturbine’spower output at the ull power setting (30 kW) over a one-hour period isshown in Fig. 7.2
3.3 PERFORMANCE AT
VARIOUS POWER
SETTINGS2
o characterize the microturbine’sperormance at various power settings,tests were perormed at power settingsranging rom ull output (30 kW) toone-sixth power (5 kW) in 5-kW
FEDERAL ENERGY MANAGEMENT PROGRAM –– 7
7/29/2019 fta_microturbinechp
http://slidepdf.com/reader/full/ftamicroturbinechp 8/24
Federal Technology Alert
Fig. 4. Startup power output and turbine speed. ( Source: “DER Perormance Testing o a MicroturbineBased
Combined Cooling, Heating, and Power (CHP) System,” Proceedings o Power System 2002 Conerence,
Clemson, SC, March 2002.
Fig. 5. Shutdown power output and turbine speed. ( Source: “DER Perormance Testing o a Microturbine
Based Combined Cooling, Heating, and Power (CHP) System,” Proceedings o Power System 2002
Conerence, Clemson, SC, March 2002.
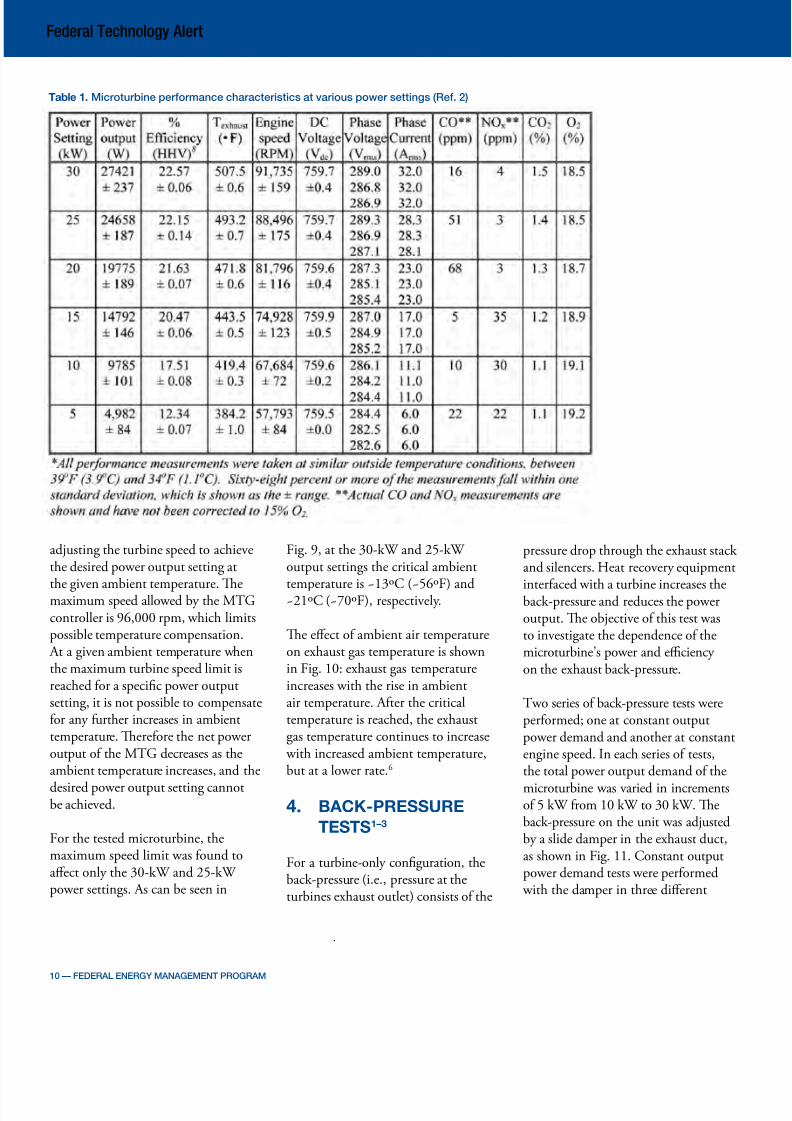
increments. Te resultsare presented in able 1, which contains themicroturbine’s powersetting, measuredpower output, turbine
speed, phase voltagesand currents (a, b, andc), and rectied dcvoltage and standarddeviations or some o these values. It shouldbe noted that theoutdoor temperatures were below the ISOtemperature o 15ºC(59ºF) that is the typi
cal rating condition ormicroturbines. Temeasured emissions atthe various power settings are also presentedEmission characteristicsare discussed in Sect. 6.
In the grid-dependent(grid-connected)mode, or a power output range o 30 to 20
kW, the microturbine was ound to operateat a power actor o 98% with a ±0.86%standard deviation;and or power outputrange o 15 to 5 kW,generated at 97% with a standarddeviation o ±0.80%.
Te data in able 1show that the unit’seciency decreases with the power outputlevel. At the ull powersetting o 30kW, themicroturbine canproduce ~28 kW at an
.
8–– FEDERAL ENERGY MANAGEMENT PROGRAM

7/29/2019 fta_microturbinechp
http://slidepdf.com/reader/full/ftamicroturbinechp 9/24
Federal Technology Alert
eciency o ~23%. At an output powersetting o 5 kW,the microturbine hasan eciency o only ~12%. Te microtur
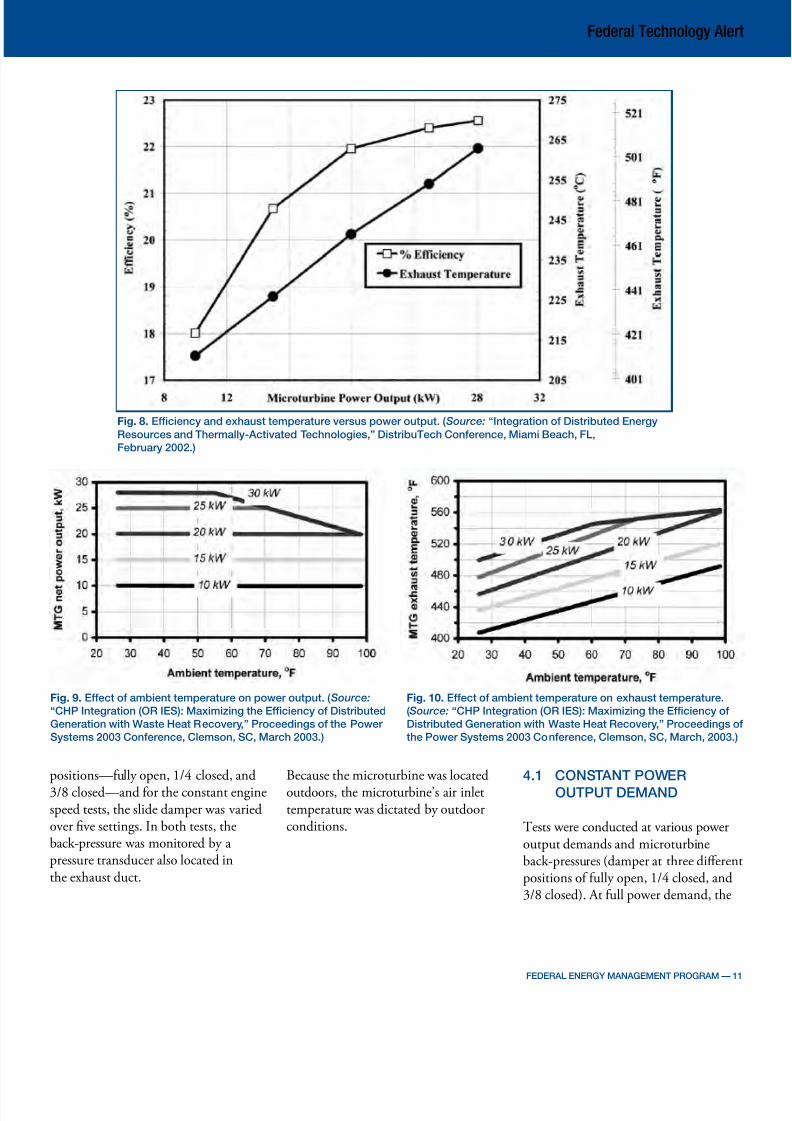
bine’s exhausttemperature variedrom ~264°C (~508°F)at the unit’s maximumpower demand setting (30 kW) to ~196°C(~384°F) at theminimum powersetting o 5 kW. Teenergy eciency andexhaust temperature
o the microturbine asthey vary with poweroutput are shownin Fig. 8.
3.4 EFFECT OF
AMBIENT
TEMPERATURE
ON
ACHIEVABLE
POWER
OUTPUT AND
EXHAUSTTEMPERATURE4
One o the actorsaecting the perormance o the turbineis the ambient air massfow. Since a turbine isa xed-displacementmachine, the air massfow is a direct unctiono the ambient air density, which in turn is a unction o the ambient air temperature andhumidity. Te testedmicroturbine generator(MG) controls thenet power output by
Fig. 6. Power dispatching response: power output and turbine speed. ( Source: “DER Perormance Testing o
a MicroturbineBased Combined Cooling, Heating, and Power (CHP) System,” Proceedings o Power System
2002 Conerence, Clemson, SC, March 2002.
Fig. 7. Microturbine power output variation or 1 h at 30 kW. ( Source: “Integration o Distributed Energy
Resources and ThermallyActivated Technologies,” DistribuTech Conerence, Miami Beach, FL,
February 2002.)
FEDERAL ENERGY MANAGEMENT PROGRAM –– 9
7/29/2019 fta_microturbinechp
http://slidepdf.com/reader/full/ftamicroturbinechp 10/24
Federal Technology Alert
Table 1. Microturbine perormance characteristics at various power settings (Re. 2)
adjusting the turbine speed to achievethe desired power output setting at
the given ambient temperature. Temaximum speed allowed by the MGcontroller is 96,000 rpm, which limitspossible temperature compensation. At a given ambient temperature whenthe maximum turbine speed limit isreached or a specic power outputsetting, it is not possible to compensateor any urther increases in ambienttemperature. Tereore the net poweroutput o the MG decreases as theambient temperature increases, and the
desired power output setting cannotbe achieved.
For the tested microturbine, themaximum speed limit was ound toaect only the 30-kW and 25-kW power settings. As can be seen in
Fig. 9, at the 30-kW and 25-kW output settings the critical ambient
temperature is ~13ºC (~56ºF) and~21ºC (~70ºF), respectively.
Te eect o ambient air temperatureon exhaust gas temperature is shownin Fig. 10: exhaust gas temperatureincreases with the rise in ambientair temperature. Ater the criticaltemperature is reached, the exhaustgas temperature continues to increase with increased ambient temperature,but at a lower rate.6
4. BACK-PRESSURE
TESTS1–3
For a turbine-only conguration, theback-pressure (i.e., pressure at theturbines exhaust outlet) consists o the
pressure drop through the exhaust stack and silencers. Heat recovery equipment
interaced with a turbine increases theback-pressure and reduces the poweroutput. Te objective o this test wasto investigate the dependence o themicroturbine’s power and eciency on the exhaust back-pressure.
wo series o back-pressure tests wereperormed; one at constant outputpower demand and another at constantengine speed. In each series o tests,the total power output demand o the
microturbine was varied in incrementso 5 kW rom 10 kW to 30 kW. Teback-pressure on the unit was adjustedby a slide damper in the exhaust duct,as shown in Fig. 11. Constant outputpower demand tests were perormed with the damper in three dierent
.
10 –– FEDERAL ENERGY MANAGEMENT PROGRAM
7/29/2019 fta_microturbinechp
http://slidepdf.com/reader/full/ftamicroturbinechp 11/24
Federal Technology Alert
Fig. 8. Eciency and exhaust temperature versus power output. ( Source: “Integration o Distributed Energy
Resources and ThermallyActivated Technologies,” DistribuTech Conerence, Miami Beach, FL,
February 2002.)
Fig. 9. Eect o ambient temperature on power output. ( Source:
“CHP Integration (OR IES): Maximizing the Eciency o Distributed
Generation with Waste Heat Recovery,” Proceedings o the Power
Systems 2003 Conerence, Clemson, SC, March 2003.)
Fig. 10. Eect o ambient temperature on exhaust temperature.
( Source: “CHP Integration (OR IES): Maximizing the Eciency o
Distributed Generation with Waste Heat Recovery,” Proceedings o
the Power Systems 2003 Conerence, Clemson, SC, March, 2003.)
positions—ully open, 1/4 closed, and3/8 closed—and or the constant enginespeed tests, the slide damper was variedover ve settings. In both tests, theback-pressure was monitored by a pressure transducer also located inthe exhaust duct.
Because the microturbine was locatedoutdoors, the microturbine’s air inlettemperature was dictated by outdoorconditions.
4.1 CONSTANT POWER
OUTPUT DEMAND
ests were conducted at various poweroutput demands and microturbineback-pressures (damper at three dierentpositions o ully open, 1/4 closed, and3/8 closed). At ull power demand, the
FEDERAL ENERGY MANAGEMENT PROGRAM –– 11

7/29/2019 fta_microturbinechp
http://slidepdf.com/reader/full/ftamicroturbinechp 12/24
Federal Technology Alert
Fig. 11. Experimental setup or baseline
testing microturbine.
( Source: “Experimental and Theoretical
Study o Gas MicroturbineBased BCHP
System,” Proceedings o the 2001 ASME
International Mechanical EngineeringCongress and Exposition, AES23622,
New York, NY, November 2001.)
back pressure varied rom 8.34 × 10⁻⁴
atm to 1.8 × 10⁻² atm (0.34 to 7.34 in. water column). During these tests, themicroturbine’s controller adjusted theengine speed to match the powerdemand setting as closely as possible with or without the back-pressure. Teresults or damper at the ull open and
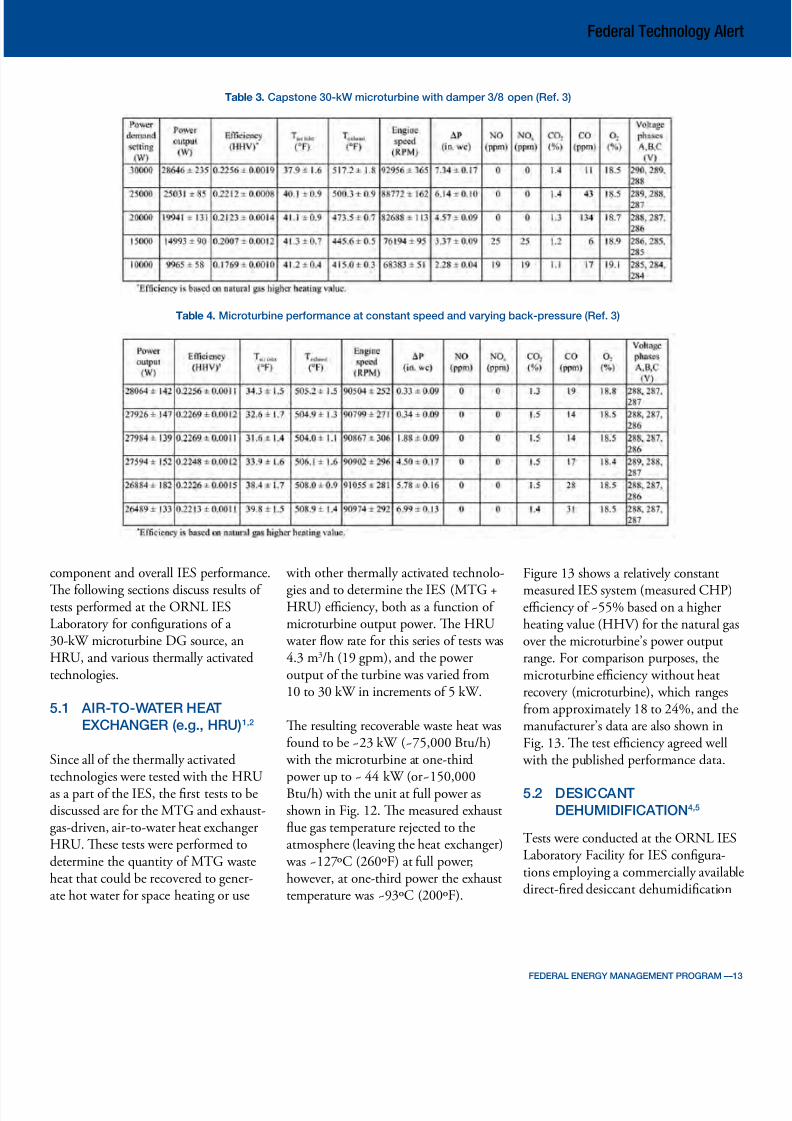
3/8 closed positions are presented inables 2 and 3, respectively.
Te turbine inlet air temperature is notcontrolled but dictated by ambienttemperature and, as noted in Sect. 3.4,the turbine speed is increased tocompensate or increases in ambienttemperature. Tereore, the rpm increase
observed between ables 2 and 3 isdependent on both increased ambienttemperature and increased back-pressure. Since the engine speed couldadjust and compensate or the back pressure and ambient temperatureincreases, the power output andeciency at corresponding output powerdemands were not signicantly aected.
In order to show the reproducibility o
the measured data, the tests with thedamper ully open were repeated or thepower demand setting o 20 kW. Teobserved relative power output andeciency percentage dierences wereless than 0.3%.
4.2 CONSTANT ENGINE SPEED
Another series o tests were conducted while the microturbine was maintainedat approximately constant engine speed
and the back-pressure was varied oreach nominal power output. able 4
shows the results at ull powerdemand o 30 kW only. At the ullpower demand and approximately constant engine speed, as the back-pressure was increased rom approximately 8.00 × 10⁻⁴ to 1.72 × 10⁻² atm (0.33 to
6.99 in. water column), the averageturbine eciency dropped by less than2%, and the average turbine poweroutput decreased by less than 6% o the values with damper ully open.
5. HEAT RECOVERY ANDCHP EFFICIENCY
On-site distributed generation (DG),as part o an integrated energy system(IES), allows the waste heat rom uel-red DG sources to be used to meetthe end user’s thermal loads and substantially improve overall system energy eciency and uel economy. As discussedin Sect. 1, the IES est Laboratory atORNL allows conguration o DG withvarious heat recovery units (presently anair-to-water HRU, direct- and indirect-red desiccant dehumidication systems,
and an indirect-red, single-eectabsorption chiller) in order to test the
Table 2. Capstone 30kW microturbine with damper ully open (Re. 3)
.
12–– FEDERAL ENERGY MANAGEMENT PROGRAM
7/29/2019 fta_microturbinechp
http://slidepdf.com/reader/full/ftamicroturbinechp 13/24
Federal Technology Alert
Table 3. Capstone 30kW microturbine with damper 3/8 open (Re. 3)
Table 4. Microturbine perormance at constant speed and varying backpressure (Re. 3)
component and overall IES perormance.
Te ollowing sections discuss results o tests perormed at the ORNL IESLaboratory or congurations o a 30-kW microturbine DG source, anHRU, and various thermally activatedtechnologies.
5.1 AIRTOWATER HEAT
EXCHANGER (e.g., HRU)1,2
Since all o the thermally activatedtechnologies were tested with the HRUas a part o the IES, the rst tests to bediscussed are or the MG and exhaust-gas-driven, air-to-water heat exchangerHRU. Tese tests were perormed todetermine the quantity o MG wasteheat that could be recovered to generate hot water or space heating or use
with other thermally activated technolo
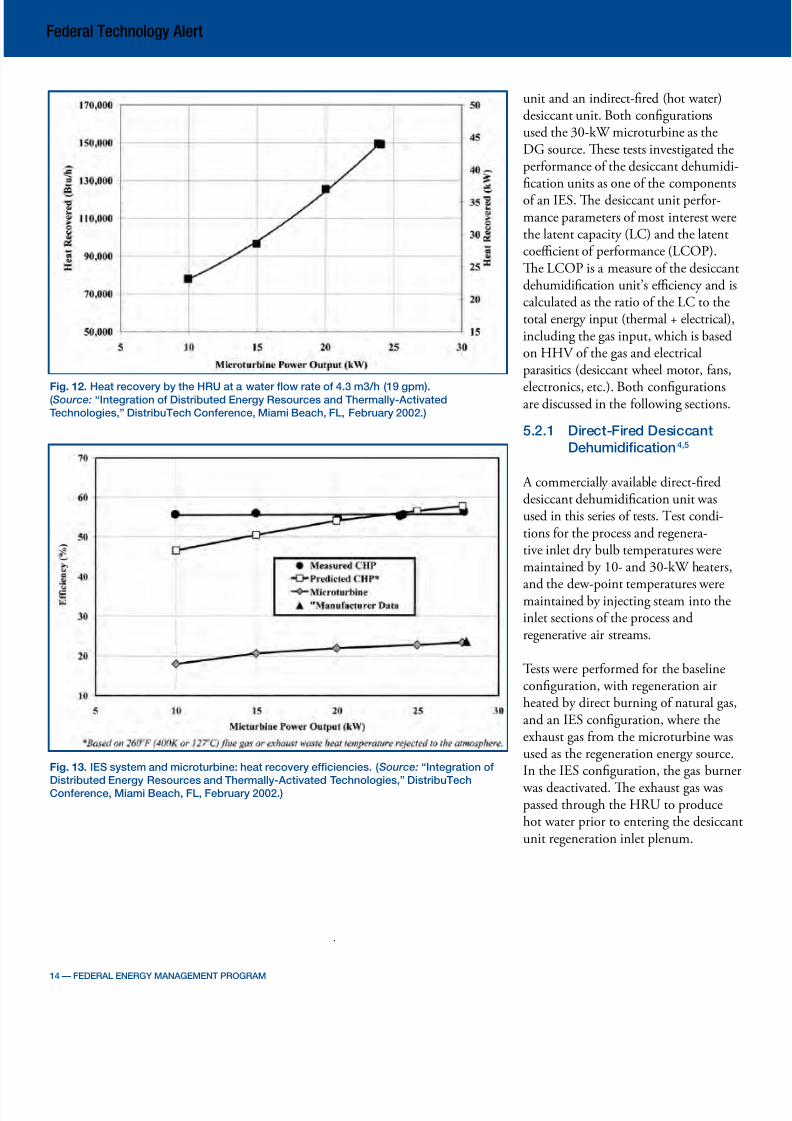
gies and to determine the IES (MG +HRU) eciency, both as a unction o microturbine output power. Te HRU water fow rate or this series o tests was4.3 m3/h (19 gpm), and the poweroutput o the turbine was varied rom10 to 30 kW in increments o 5 kW.
Te resulting recoverable waste heat wasound to be ~23 kW (~75,000 Btu/h) with the microturbine at one-thirdpower up to ~ 44 kW (or~150,000Btu/h) with the unit at ull power asshown in Fig. 12. Te measured exhaustfue gas temperature rejected to theatmosphere (leaving the heat exchanger) was ~127ºC (260ºF) at ull power;however, at one-third power the exhausttemperature was ~93ºC (200ºF).
Figure 13 shows a relatively constant
measured IES system (measured CHP)eciency o ~55% based on a higherheating value (HHV) or the natural gasover the microturbine’s power outputrange. For comparison purposes, themicroturbine eciency without heatrecovery (microturbine), which rangesrom approximately 18 to 24%, and themanuacturer’s data are also shown inFig. 13. Te test eciency agreed well with the published perormance data.
5.2 DESICCANT
DEHUMIDIFICATION4,5
ests were conducted at the ORNL IESLaboratory Facility or IES congurations employing a commercially availabledirect-red desiccant dehumidication
FEDERAL ENERGY MANAGEMENT PROGRAM ––13
7/29/2019 fta_microturbinechp
http://slidepdf.com/reader/full/ftamicroturbinechp 14/24
Federal Technology Alert
Fig. 12. Heat recovery by the HRU at a water fow rate o 4.3 m3/h (19 gpm).
( Source: “Integration o Distributed Energy Resources and ThermallyActivated
Technologies,” DistribuTech Conerence, Miami Beach, FL, February 2002.)
Fig. 13. IES system and microturbine: heat recovery eciencies. ( Source: “Integration o
Distributed Energy Resources and ThermallyActivated Technologies,” DistribuTechConerence, Miami Beach, FL, February 2002.)
unit and an indirect-red (hot water)desiccant unit. Both congurationsused the 30-kW microturbine as theDG source. Tese tests investigated theperormance o the desiccant dehumidication units as one o the components
o an IES. Te desiccant unit perormance parameters o most interest werethe latent capacity (LC) and the latentcoecient o perormance (LCOP).Te LCOP is a measure o the desiccantdehumidication unit’s eciency and iscalculated as the ratio o the LC to thetotal energy input (thermal + electrical),including the gas input, which is basedon HHV o the gas and electricalparasitics (desiccant wheel motor, ans,
electronics, etc.). Both congurationsare discussed in the ollowing sections.
5.2.1 DirectFired Desiccant
Dehumidication4,5
A commercially available direct-reddesiccant dehumidication unit wasused in this series o tests. est conditions or the process and regenerative inlet dry bulb temperatures weremaintained by 10- and 30-kW heaters,
and the dew-point temperatures weremaintained by injecting steam into theinlet sections o the process andregenerative air streams.
ests were perormed or the baselineconguration, with regeneration airheated by direct burning o natural gas,and an IES conguration, where theexhaust gas rom the microturbine wasused as the regeneration energy source.In the IES conguration, the gas burner
was deactivated. Te exhaust gas waspassed through the HRU to producehot water prior to entering the desiccantunit regeneration inlet plenum.
.
14 –– FEDERAL ENERGY MANAGEMENT PROGRAM
7/29/2019 fta_microturbinechp
http://slidepdf.com/reader/full/ftamicroturbinechp 15/24
Federal Technology Alert
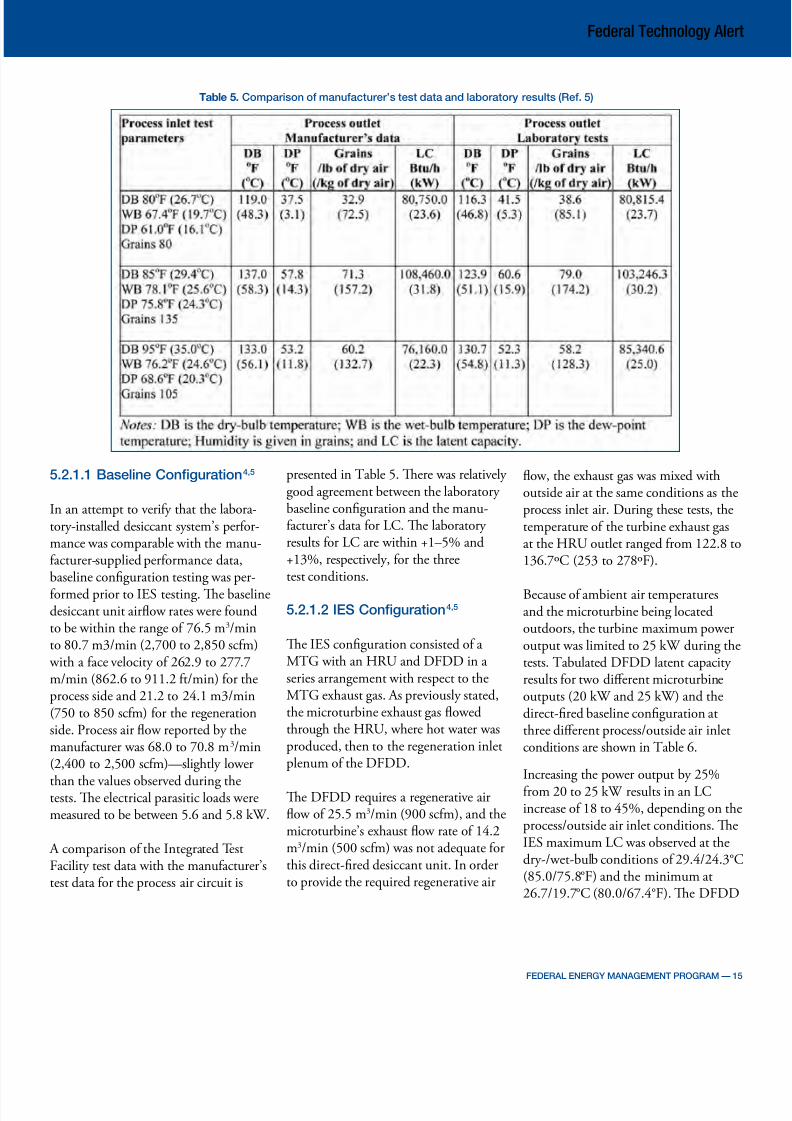
Table 5. Comparison o manuacturer’s test data and laboratory results (Re. 5)
5.2.1.1 Baseline Conguration4,5
In an attempt to veriy that the laboratory-installed desiccant system’s perormance was comparable with the manuacturer-supplied perormance data,baseline conguration testing was per
ormed prior to IES testing. Te baselinedesiccant unit airfow rates were oundto be within the range o 76.5 m3/minto 80.7 m3/min (2,700 to 2,850 scm) with a ace velocity o 262.9 to 277.7m/min (862.6 to 911.2 t/min) or theprocess side and 21.2 to 24.1 m3/min(750 to 850 scm) or the regenerationside. Process air fow reported by themanuacturer was 68.0 to 70.8 m3/min(2,400 to 2,500 scm)—slightly lower
than the values observed during thetests. Te electrical parasitic loads weremeasured to be between 5.6 and 5.8 kW.
A comparison o the Integrated estFacility test data with the manuacturer’stest data or the process air circuit is
presented in able 5. Tere was relatively good agreement between the laboratory baseline conguration and the manuacturer’s data or LC. Te laboratory results or LC are within +1–5% and+13%, respectively, or the threetest conditions.
5.2.1.2 IES Conguration4,5
Te IES conguration consisted o a MG with an HRU and DFDD in a series arrangement with respect to theMG exhaust gas. As previously stated,the microturbine exhaust gas fowedthrough the HRU, where hot water wasproduced, then to the regeneration inletplenum o the DFDD.
Te DFDD requires a regenerative airfow o 25.5 m3/min (900 scm), and themicroturbine’s exhaust fow rate o 14.2m3/min (500 scm) was not adequate orthis direct-red desiccant unit. In orderto provide the required regenerative air
fow, the exhaust gas was mixed withoutside air at the same conditions as theprocess inlet air. During these tests, thetemperature o the turbine exhaust gasat the HRU outlet ranged rom 122.8 to136.7ºC (253 to 278ºF).
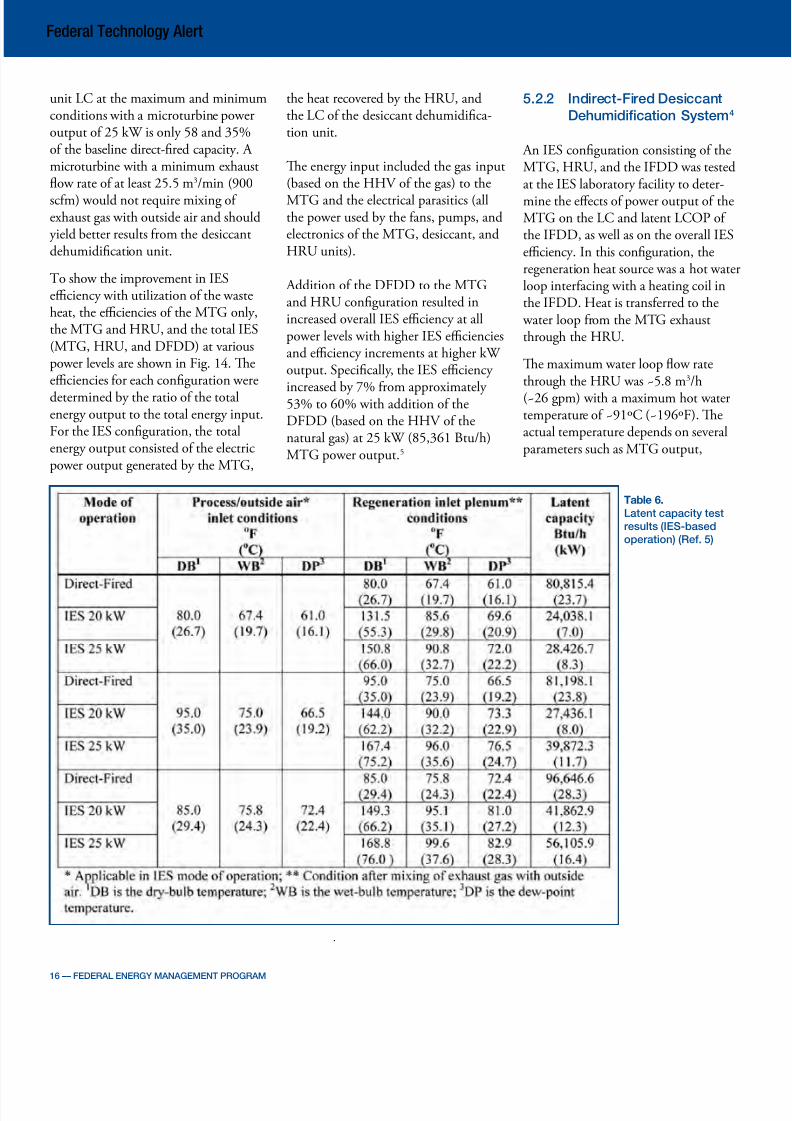
Because o ambient air temperaturesand the microturbine being locatedoutdoors, the turbine maximum poweroutput was limited to 25 kW during thetests. abulated DFDD latent capacity results or two dierent microturbineoutputs (20 kW and 25 kW) and thedirect-red baseline conguration atthree dierent process/outside air inletconditions are shown in able 6.
Increasing the power output by 25%rom 20 to 25 kW results in an LCincrease o 18 to 45%, depending on theprocess/outside air inlet conditions. TeIES maximum LC was observed at thedry-/wet-bulb conditions o 29.4/24.3°C(85.0/75.8°F) and the minimum at26.7/19.7°C (80.0/67.4°F). Te DFDD
FEDERAL ENERGY MANAGEMENT PROGRAM –– 15
7/29/2019 fta_microturbinechp
http://slidepdf.com/reader/full/ftamicroturbinechp 16/24
Federal Technology Alert
unit LC at the maximum and minimumconditions with a microturbine poweroutput o 25 kW is only 58 and 35%o the baseline direct-red capacity. A microturbine with a minimum exhaustfow rate o at least 25.5 m3/min (900
scm) would not require mixing o exhaust gas with outside air and shouldyield better results rom the desiccantdehumidication unit.
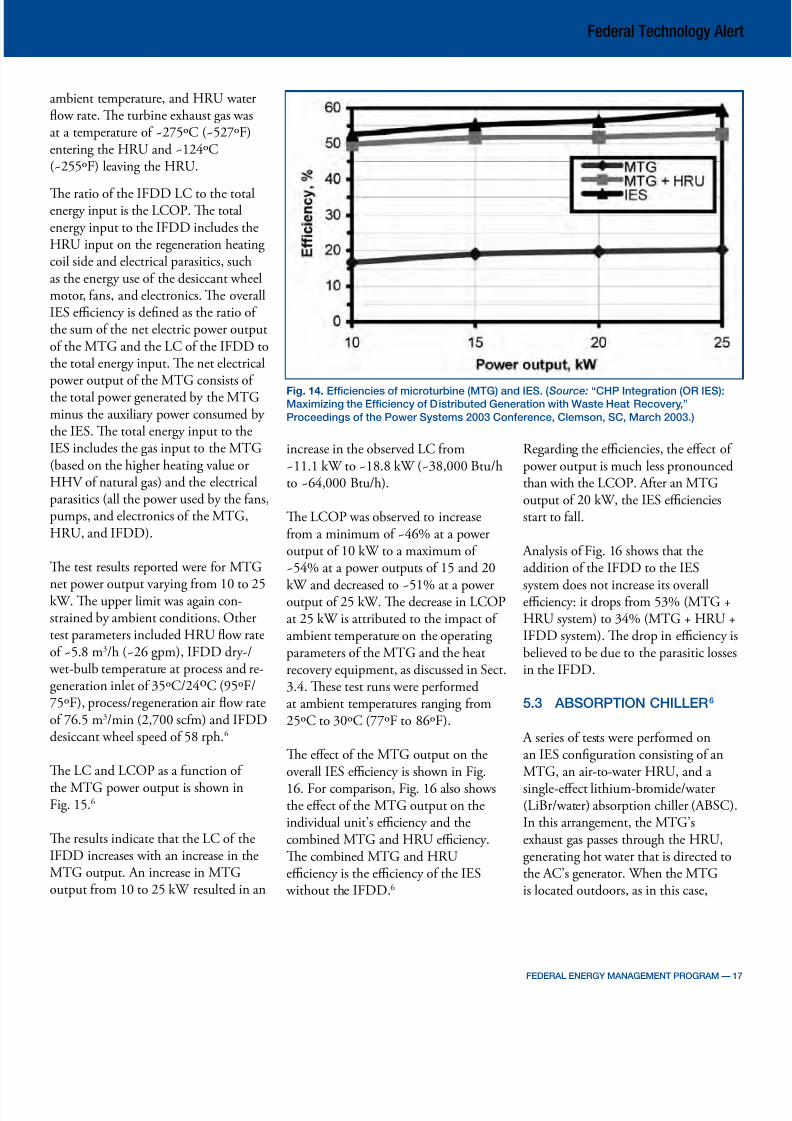
o show the improvement in IESeciency with utilization o the wasteheat, the eciencies o the MG only,the MG and HRU, and the total IES(MG, HRU, and DFDD) at variouspower levels are shown in Fig. 14. Teeciencies or each conguration were
determined by the ratio o the totalenergy output to the total energy input.For the IES conguration, the totalenergy output consisted o the electricpower output generated by the MG,
the heat recovered by the HRU, andthe LC o the desiccant dehumidication unit.
Te energy input included the gas input(based on the HHV o the gas) to the
MG and the electrical parasitics (allthe power used by the ans, pumps, andelectronics o the MG, desiccant, andHRU units).
Addition o the DFDD to the MGand HRU conguration resulted inincreased overall IES eciency at allpower levels with higher IES ecienciesand eciency increments at higher kW output. Specically, the IES eciency
increased by 7% rom approximately 53% to 60% with addition o theDFDD (based on the HHV o thenatural gas) at 25 kW (85,361 Btu/h)MG power output.5
5.2.2 IndirectFired Desiccant
Dehumidication System4
An IES conguration consisting o theMG, HRU, and the IFDD was testedat the IES laboratory acility to deter
mine the eects o power output o theMG on the LC and latent LCOP o the IFDD, as well as on the overall IESeciency. In this conguration, theregeneration heat source was a hot waterloop interacing with a heating coil inthe IFDD. Heat is transerred to the water loop rom the MG exhaustthrough the HRU.
Te maximum water loop fow ratethrough the HRU was ~5.8 m3/h
(~26 gpm) with a maximum hot watertemperature o ~91ºC (~196ºF). Teactual temperature depends on severalparameters such as MG output,
Table 6.
Latent capacity test
results (IESbased
operation) (Re. 5)
.
16 –– FEDERAL ENERGY MANAGEMENT PROGRAM
7/29/2019 fta_microturbinechp
http://slidepdf.com/reader/full/ftamicroturbinechp 17/24
Federal Technology Alert
ambient temperature, and HRU waterfow rate. Te turbine exhaust gas wasat a temperature o ~275ºC (~527ºF)entering the HRU and ~124ºC(~255ºF) leaving the HRU.
Te ratio o the IFDD LC to the totalenergy input is the LCOP. Te totalenergy input to the IFDD includes theHRU input on the regeneration heating coil side and electrical parasitics, suchas the energy use o the desiccant wheelmotor, ans, and electronics. Te overallIES eciency is dened as the ratio o the sum o the net electric power outputo the MG and the LC o the IFDD tothe total energy input. Te net electricalpower output o the MG consists o
the total power generated by the MGminus the auxiliary power consumed by the IES. Te total energy input to theIES includes the gas input to the MG(based on the higher heating value orHHV o natural gas) and the electricalparasitics (all the power used by the ans,pumps, and electronics o the MG,HRU, and IFDD).
Te test results reported were or MG
net power output varying rom 10 to 25kW. Te upper limit was again constrained by ambient conditions. Othertest parameters included HRU fow rateo ~5.8 m3/h (~26 gpm), IFDD dry-/ wet-bulb temperature at process and regeneration inlet o 35ºC/24oC (95ºF/75ºF), process/regeneration air fow rateo 76.5 m3/min (2,700 scm) and IFDDdesiccant wheel speed o 58 rph.6
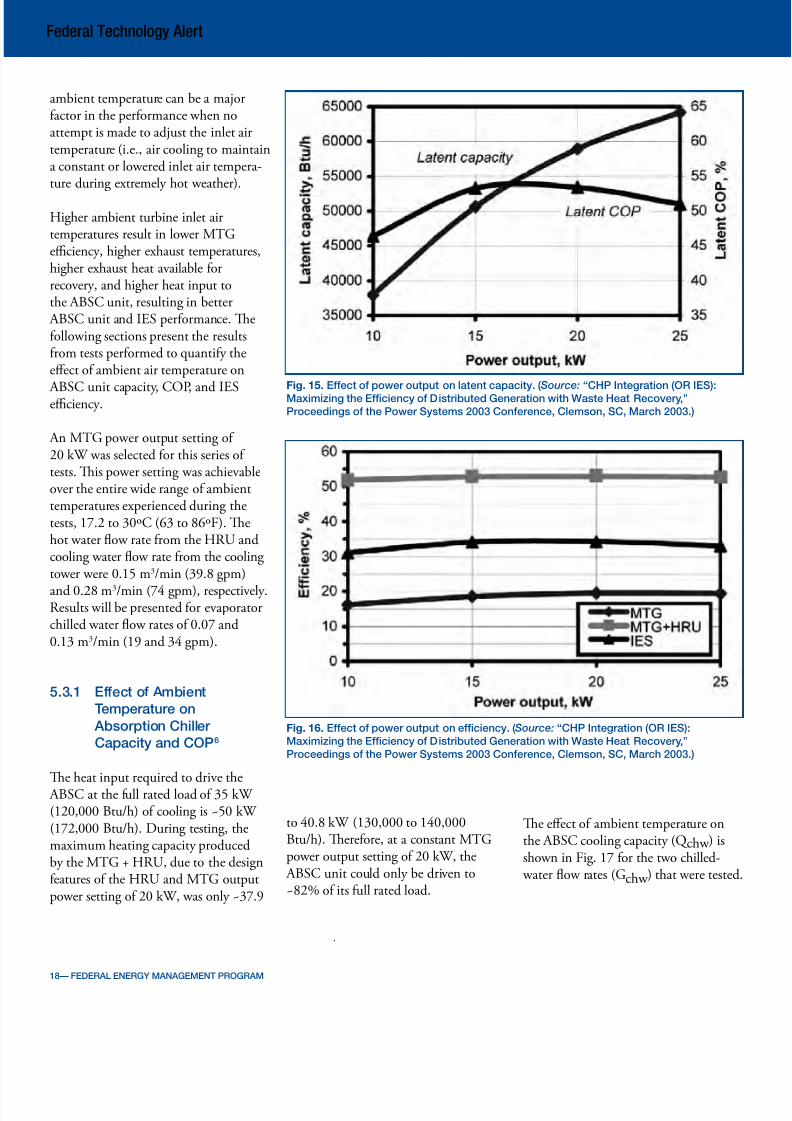
Te LC and LCOP as a unction o
the MG power output is shown inFig. 15.6
Te results indicate that the LC o theIFDD increases with an increase in theMG output. An increase in MGoutput rom 10 to 25 kW resulted in an
increase in the observed LC rom~11.1 kW to ~18.8 kW (~38,000 Btu/hto ~64,000 Btu/h).
Te LCOP was observed to increaserom a minimum o ~46% at a poweroutput o 10 kW to a maximum o ~54% at a power outputs o 15 and 20
kW and decreased to ~51% at a poweroutput o 25 kW. Te decrease in LCOPat 25 kW is attributed to the impact o ambient temperature on the operating parameters o the MG and the heatrecovery equipment, as discussed in Sect.3.4. Tese test runs were perormedat ambient temperatures ranging rom25ºC to 30ºC (77ºF to 86ºF).
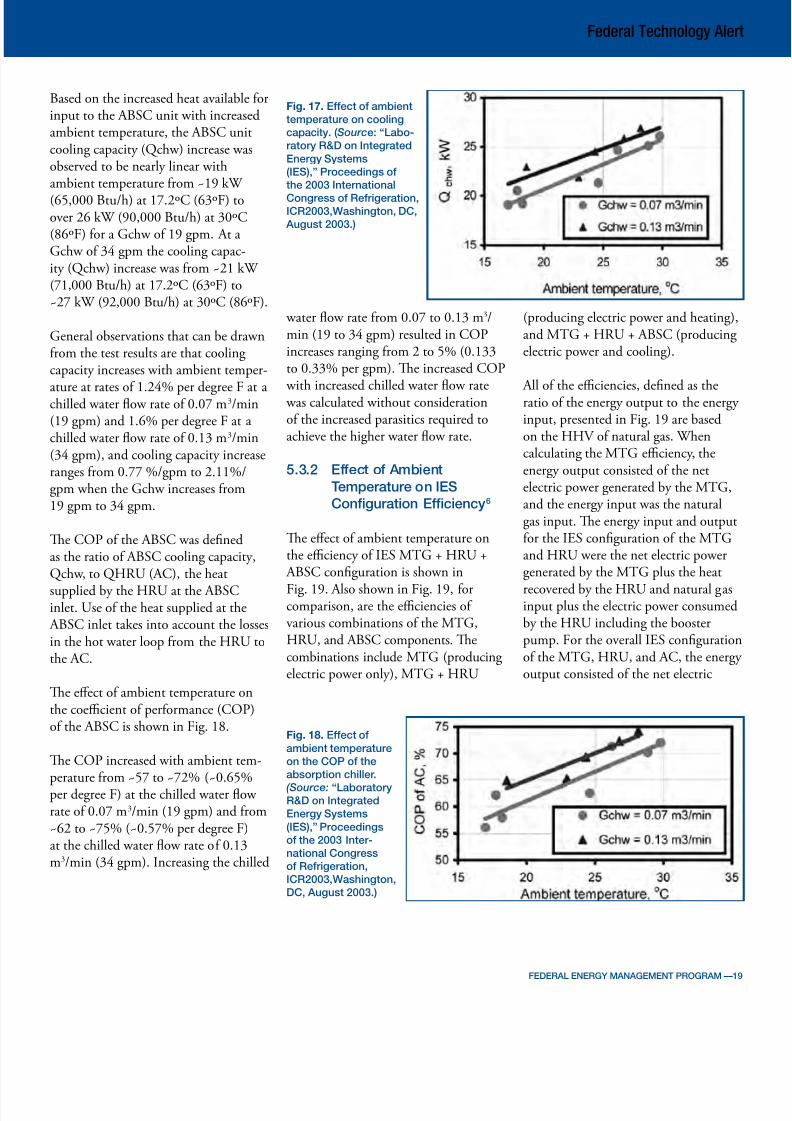
Te eect o the MG output on theoverall IES eciency is shown in Fig.
16. For comparison, Fig. 16 also showsthe eect o the MG output on theindividual unit’s eciency and thecombined MG and HRU eciency.Te combined MG and HRUeciency is the eciency o the IES without the IFDD.6
Regarding the eciencies, the eect o power output is much less pronouncedthan with the LCOP. Ater an MGoutput o 20 kW, the IES ecienciesstart to all.
Analysis o Fig. 16 shows that theaddition o the IFDD to the IES
system does not increase its overalleciency: it drops rom 53% (MG +HRU system) to 34% (MG + HRU +IFDD system). Te drop in eciency isbelieved to be due to the parasitic lossesin the IFDD.
5.3 ABSORPTION CHILLER6
A series o tests were perormed onan IES conguration consisting o anMG, an air-to-water HRU, and a
single-eect lithium-bromide/water(LiBr/water) absorption chiller (ABSC).In this arrangement, the MG’sexhaust gas passes through the HRU,generating hot water that is directed tothe AC’s generator. When the MGis located outdoors, as in this case,
Fig. 14. Eciencies o microturbine (MTG) and IES. ( Source: “CHP Integration (OR IES):Maximizing the Eciency o Distributed Generation with Waste Heat Recovery,”
Proceedings o the Power Systems 2003 Conerence, Clemson, SC, March 2003.)
FEDERAL ENERGY MANAGEMENT PROGRAM –– 17
7/29/2019 fta_microturbinechp
http://slidepdf.com/reader/full/ftamicroturbinechp 18/24
Federal Technology Alert
ambient temperature can be a majoractor in the perormance when noattempt is made to adjust the inlet airtemperature (i.e., air cooling to maintaina constant or lowered inlet air temperature during extremely hot weather).
Higher ambient turbine inlet airtemperatures result in lower MGeciency, higher exhaust temperatures,higher exhaust heat available orrecovery, and higher heat input tothe ABSC unit, resulting in better ABSC unit and IES perormance. Teollowing sections present the resultsrom tests perormed to quantiy theeect o ambient air temperature on
ABSC unit capacity, COP, and IESeciency.
An MG power output setting o 20 kW was selected or this series o tests. Tis power setting was achievableover the entire wide range o ambienttemperatures experienced during thetests, 17.2 to 30ºC (63 to 86ºF). Tehot water fow rate rom the HRU andcooling water fow rate rom the cooling tower were 0.15 m3/min (39.8 gpm)
and 0.28 m3/min (74 gpm), respectively.Results will be presented or evaporatorchilled water fow rates o 0.07 and0.13 m3/min (19 and 34 gpm).
5.3.1 Eect o Ambient
Temperature on
Absorption Chiller
Capacity and COP6
Te heat input required to drive the ABSC at the ull rated load o 35 kW (120,000 Btu/h) o cooling is ~50 kW (172,000 Btu/h). During testing, themaximum heating capacity producedby the MG + HRU, due to the designeatures o the HRU and MG outputpower setting o 20 kW, was only ~37.9
Fig. 15. Eect o power output on latent capacity. ( Source: “CHP Integration (OR IES):
Maximizing the Eciency o Distributed Generation with Waste Heat Recovery,”
Proceedings o the Power Systems 2003 Conerence, Clemson, SC, March 2003.)
Fig. 16. Eect o power output on eciency. ( Source: “CHP Integration (OR IES):
Maximizing the Eciency o Distributed Generation with Waste Heat Recovery,”
Proceedings o the Power Systems 2003 Conerence, Clemson, SC, March 2003.)
to 40.8 kW (130,000 to 140,000 Te eect o ambient temperature onBtu/h). Tereore, at a constant MG the ABSC cooling capacity (Q chw ) ispower output setting o 20 kW, the shown in Fig. 17 or the two chilled- ABSC unit could only be driven to water fow rates (Gchw ) that were tested~82% o its ull rated load.
.
18–– FEDERAL ENERGY MANAGEMENT PROGRAM
7/29/2019 fta_microturbinechp
http://slidepdf.com/reader/full/ftamicroturbinechp 19/24
Federal Technology Alert
Based on the increased heat available orinput to the ABSC unit with increasedambient temperature, the ABSC unitcooling capacity (Qchw) increase wasobserved to be nearly linear withambient temperature rom ~19 kW
(65,000 Btu/h) at 17.2ºC (63ºF) toover 26 kW (90,000 Btu/h) at 30ºC(86ºF) or a Gchw o 19 gpm. At a Gchw o 34 gpm the cooling capacity (Qchw) increase was rom ~21 kW (71,000 Btu/h) at 17.2ºC (63ºF) to~27 kW (92,000 Btu/h) at 30ºC (86ºF).
General observations that can be drawnrom the test results are that cooling capacity increases with ambient temper
ature at rates o 1.24% per degree F at a chilled water fow rate o 0.07 m3/min(19 gpm) and 1.6% per degree F at a chilled water fow rate o 0.13 m3/min(34 gpm), and cooling capacity increaseranges rom 0.77 %/gpm to 2.11%/gpm when the Gchw increases rom19 gpm to 34 gpm.
Te COP o the ABSC was denedas the ratio o ABSC cooling capacity,Qchw, to QHRU (AC), the heat
supplied by the HRU at the ABSCinlet. Use o the heat supplied at the ABSC inlet takes into account the lossesin the hot water loop rom the HRU tothe AC.
Te eect o ambient temperature onthe coecient o perormance (COP)o the ABSC is shown in Fig. 18.
Te COP increased with ambient temperature rom ~57 to ~72% (~0.65%per degree F) at the chilled water fow rate o 0.07 m3/min (19 gpm) and rom~62 to ~75% (~0.57% per degree F)at the chilled water fow rate o 0.13m3/min (34 gpm). Increasing the chilled
Fig. 17. Eect o ambient
temperature on cooling
capacity. ( Source: “Labo-
ratory R&D on Integrated
Energy Systems
(IES),” Proceedings o
the 2003 International
Congress o Rerigeration,ICR2003,Washington, DC,
August 2003.)
water fow rate rom 0.07 to 0.13 m3/min (19 to 34 gpm) resulted in COPincreases ranging rom 2 to 5% (0.133to 0.33% per gpm). Te increased COP
with increased chilled water fow rate was calculated without considerationo the increased parasitics required toachieve the higher water fow rate.
5.3.2 Eect o Ambient
Temperature on IES
Conguration Eciency6
Te eect o ambient temperature onthe eciency o IES MG + HRU + ABSC conguration is shown in
Fig. 19. Also shown in Fig. 19, orcomparison, are the eciencies o various combinations o the MG,HRU, and ABSC components. Tecombinations include MG (producing electric power only), MG + HRU
Fig. 18. Eect o
ambient temperature
on the COP o the
absorption chiller.
(Source: “LaboratoryR&D on Integrated
Energy Systems
(IES),” Proceedings
o the 2003 Inter-
national Congress
o Rerigeration,
ICR2003,Washington,
DC, August 2003.)
(producing electric power and heating),and MG + HRU + ABSC (producing electric power and cooling).
All o the eciencies, dened as theratio o the energy output to the energy input, presented in Fig. 19 are basedon the HHV o natural gas. Whencalculating the MG eciency, theenergy output consisted o the netelectric power generated by the MG,and the energy input was the naturalgas input. Te energy input and outputor the IES conguration o the MGand HRU were the net electric powergenerated by the MG plus the heat
recovered by the HRU and natural gasinput plus the electric power consumedby the HRU including the boosterpump. For the overall IES congurationo the MG, HRU, and AC, the energyoutput consisted o the net electric
FEDERAL ENERGY MANAGEMENT PROGRAM ––19

7/29/2019 fta_microturbinechp
http://slidepdf.com/reader/full/ftamicroturbinechp 20/24
Federal Technology Alert
power generated by the MG plus the ABSC cooling capacity, and the energy input consisted o the natural gas inputplus the total electric power consumedby the HRU, AC, C, and pumps.
ests were perormed or chilled waterfow rates o 0.07 and 0.13 m3/min(19 and 34 gpm). Te variation in thechilled water fow rate had practically no eect (only a 0.5 to 0.8% averageincrease) on the overall IES eciency.Tereore, the eciency versus ambienttemperature or only one fow rate ispresented in Fig. 19.
In spite o a decrease in MG eciency
(20–18%) with ambient temperature,the two IES conguration overalleciencies increased with ambienttemperature. Te MG + HRUconguration showed an eciency range o 53 to 55% over the ambienttemperatures experienced during thetest while the MG + HRU + ABSCconguration yielded an eciency rangeo 37 to 42%.
Addition o the ABSC to the MG
+ HRU conguration resulted in a decrease in IES eciency ranging rom16 to 13%, indicating, as expected, thatusing the waste heat to generate hot water or end use is more ecient thangenerating hot water or use to drive a single-eect absorption ABSC unit witha nominal COP o 0.7.
5.4 ABSORPTION CHILLER AND
DIRECTFIRED DESICCANT
DEHUMIDIFICATION6
In the previous IES conguration(MG + HRU + AC) the temperatureo the exhaust gas leaving the HRU anddischarging to the environment is inmany cases sucient or use inregenerating the desiccant in a DFDD.
Addition o a DFDD to this conguration will increase the utilization o theMG waste heat and the eciency o
the IES. A series o tests were perormedto compare a MG + HRU + ABSC +DFDD conguration with thepreviously tested congurations.
Te LC and LCOP o the DFDDincrease with an increase in process airdew-point or humidity ratio. Tereore,the series o tests were perormed at thetwo DFDD process inlet dry-/wet-bulbtemperature conditions o 29.4/24.3ºC
(85/75.8ºF) and 35.0/23.9ºC(95/75ºF). Te corresponding dew-point conditions were 22.4ºC (72.4ºF)and 19.2ºC (66.5ºF), respectively. Atboth inlet process air conditions, MGpower output, hot water, cooling water,and chilled water fow rates were heldapproximately constant at the measuredconditions listed in able 7.
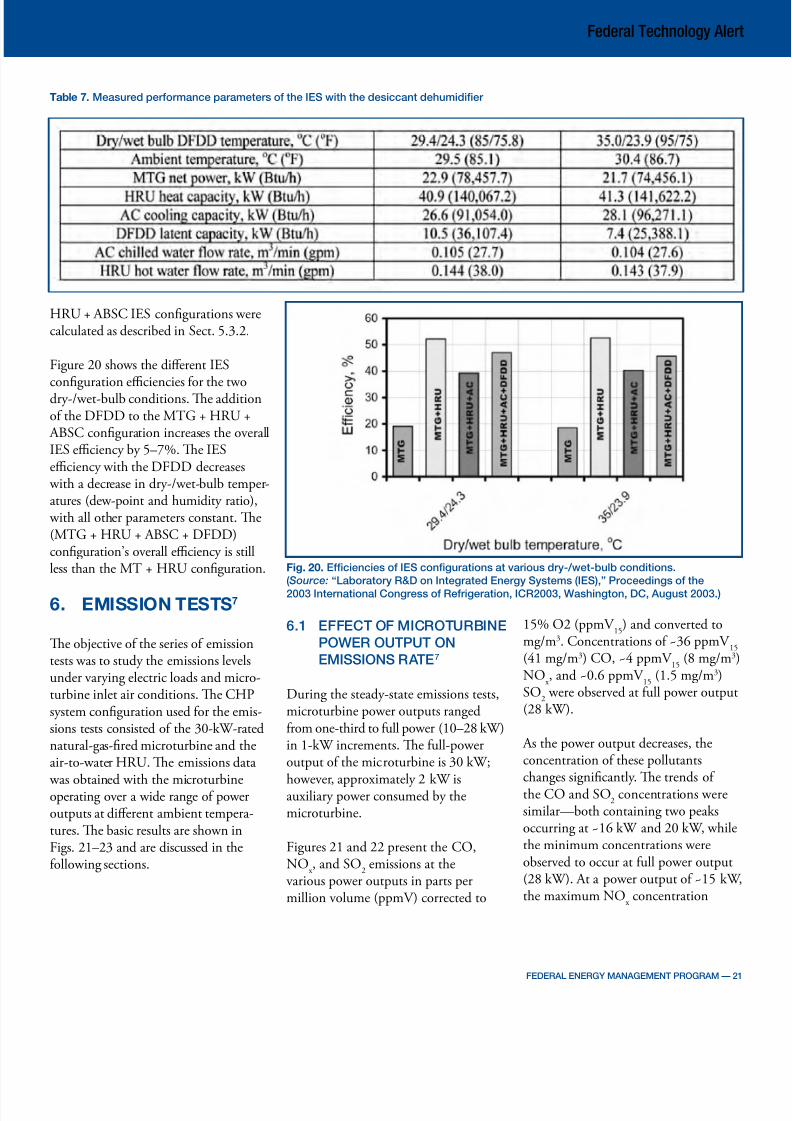
Also listed in able 7 are the majorperormance parameters (i.e., HRU heat
capacity, ABSC cooling capacity, andDFDD latent capacity) measured at thetwo process air conditions. As seen inable 7, the LC o the DFDD or the22.4ºC dew-point condition was muchhigher than that or the 19.2ºCdew-point inlet air.
Fig. 19. Eect o
ambient temperature
on the eciency o
IES congurations.
( Source: “Laboratory
R&D on Integrated
Energy Systems (IES),”Proceedings o the
2003 International
Congress o
Rerigeration,
ICR2003, Washington,
DC, August 2003.)
Te MG exhaust fow rate, ranging rom 11.33 to 4.16 m3/min (400 to500 scm), passed through the HRU and
entered the regeneration inlet plenumo the DFDD. In the regenerative inletplenum, in order to achieve a requiredregenerative stream air fow o 25.5 m3/min (~900 scm), the MGexhaust fow was mixed with outside air.Te DFDD’s air fow rates, measuredduring the tests, were ound to be withinthe range o 92.60 to 94.58 m3/min(3,270 to 3,340 scm) with a acevelocity o 318.4–325.3 m/min
(1,044.7–1,067.1 t/min) or theprocess side and 25.63–25.77 m3/min(905–910 scm) with a ace velocity o 88.1–88.6 m/min (289.1–290.7 t/min)or the regeneration side.
Te overall IES eciency with theaddition o the DFDD calculated asthe ratio o the energy output and theenergy input was determined or the twoprocess-air inlet conditions. Te energy output consisted o net electric power
generated, the ABSC cooling capacity,and the DFDD latent capacity; theenergy input included the natural gasinput and the total electric power consumed by the HRU, AC, DFDD, C,and pumps. Te eciencies o the MG, MG + HRU, and MG +
.
20–– FEDERAL ENERGY MANAGEMENT PROGRAM
7/29/2019 fta_microturbinechp
http://slidepdf.com/reader/full/ftamicroturbinechp 21/24
Federal Technology Alert
Table 7. Measured perormance parameters o the IES with the desiccant dehumidier
HRU + ABSC IES congurations werecalculated as described in Sect. 5.3.2.
Figure 20 shows the dierent IESconguration eciencies or the twodry-/wet-bulb conditions. Te additiono the DFDD to the MG + HRU + ABSC conguration increases the overallIES eciency by 5–7%. Te IESeciency with the DFDD decreases with a decrease in dry-/wet-bulb temperatures (dew-point and humidity ratio), with all other parameters constant. Te(MG + HRU + ABSC + DFDD)conguration’s overall eciency is stillless than the M + HRU conguration.
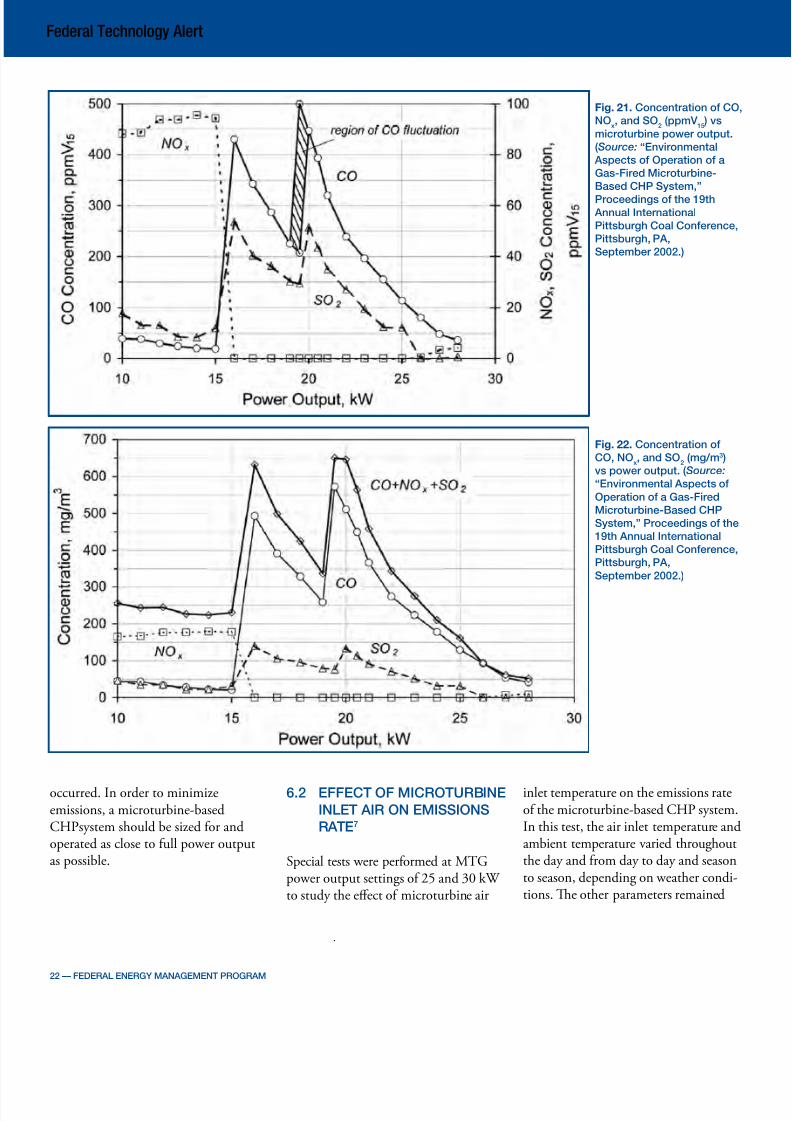
6. EMISSION TESTS7
Te objective o the series o emissiontests was to study the emissions levelsunder varying electric loads and micro-turbine inlet air conditions. Te CHPsystem conguration used or the emissions tests consisted o the 30-kW-ratednatural-gas-red microturbine and theair-to-water HRU. Te emissions data
was obtained with the microturbineoperating over a wide range o poweroutputs at dierent ambient temperatures. Te basic results are shown inFigs. 21–23 and are discussed in theollowing sections.
Fig. 20. Eciencies o IES congurations at various dry/wetbulb conditions.
( Source: “Laboratory R&D on Integrated Energy Systems (IES),” Proceedings o the
2003 International Congress o Rerigeration, ICR2003, Washington, DC, August 2003.)
6.1 EFFECT OF MICROTURBINE
POWER OUTPUT ON
EMISSIONS RATE7
During the steady-state emissions tests,microturbine power outputs rangedrom one-third to ull power (10–28 kW)in 1-kW increments. Te ull-poweroutput o the microturbine is 30 kW;
however, approximately 2 kW isauxiliary power consumed by themicroturbine.
Figures 21 and 22 present the CO,NO
x , and SO
2emissions at the
various power outputs in parts permillion volume (ppmV) corrected to
15% O2 (ppmV 15
) and converted tomg/m3. Concentrations o ~36 ppmV
15
(41 mg/m3) CO, ~4 ppmV 15
(8 mg/m3)NO
x , and ~0.6 ppmV
15(1.5 mg/m3)
SO2
were observed at ull power output(28 kW).
As the power output decreases, theconcentration o these pollutantschanges signicantly. Te trends o the CO and SO concentrations were
2
similar—both containing two peaksoccurring at ~16 kW and 20 kW, whilethe minimum concentrations wereobserved to occur at ull power output(28 kW). At a power output o ~15 kW,the maximum NO concentration
x
FEDERAL ENERGY MANAGEMENT PROGRAM –– 21
7/29/2019 fta_microturbinechp
http://slidepdf.com/reader/full/ftamicroturbinechp 22/24
Federal Technology Alert
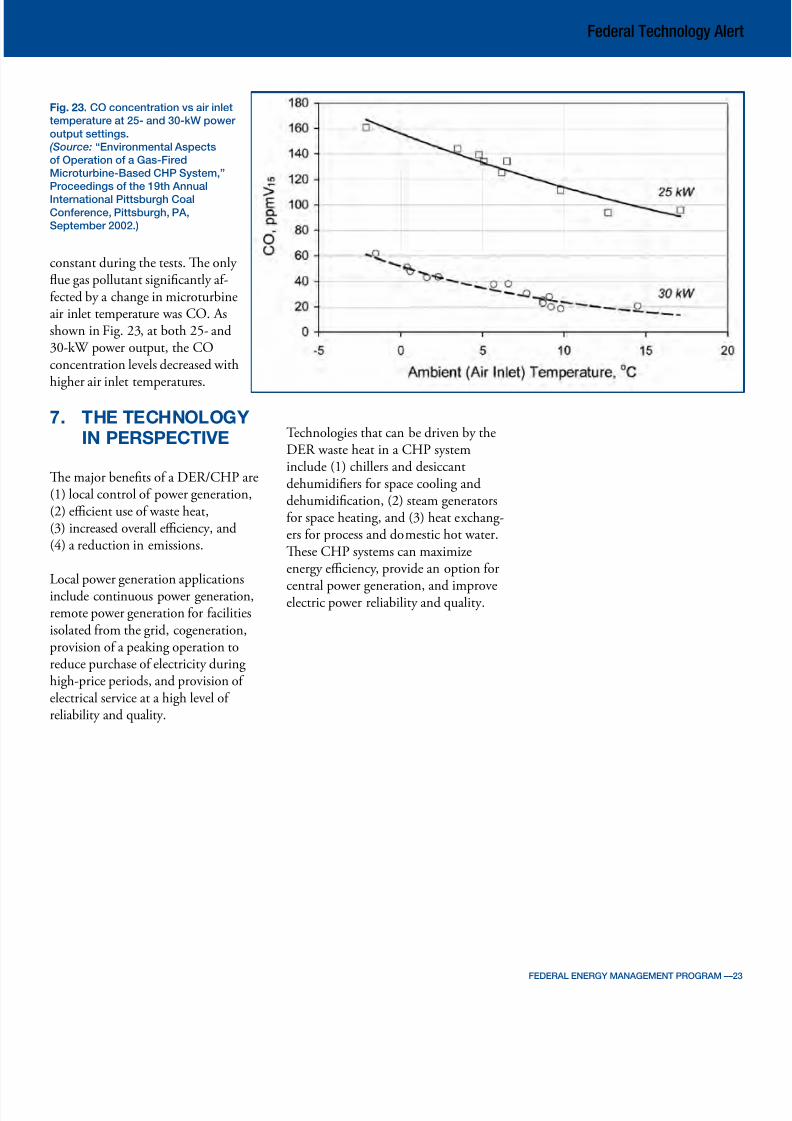
occurred. In order to minimize 6.2 EFFECT OF MICROTURBINE
emissions, a microturbine-based INLET AIR ON EMISSIONSCHPsystem should be sized or and RATE7
operated as close to ull power outputas possible. Special tests were perormed at MG
power output settings o 25 and 30 kW to study the eect o microturbine air
Fig. 21. Concentration o CO,
NOx, and SO
2(ppmV
15 ) vs
microturbine power output.
( Source: “Environmental
Aspects o Operation o a
GasFired Microturbine
Based CHP System,”
Proceedings o the 19th Annual International
Pittsburgh Coal Conerence,
Pittsburgh, PA,
September 2002.)
Fig. 22. Concentration o
CO, NOx, and SO
2(mg/m3 )
vs power output. ( Source:
“Environmental Aspects o
Operation o a GasFired
MicroturbineBased CHP
System,” Proceedings o the
19th Annual International
Pittsburgh Coal Conerence,
Pittsburgh, PA,
September 2002.)
inlet temperature on the emissions rateo the microturbine-based CHP system.In this test, the air inlet temperature andambient temperature varied throughoutthe day and rom day to day and seasonto season, depending on weather conditions. Te other parameters remained
.
22 –– FEDERAL ENERGY MANAGEMENT PROGRAM
7/29/2019 fta_microturbinechp
http://slidepdf.com/reader/full/ftamicroturbinechp 23/24
Federal Technology Alert
Fig. 23. CO concentration vs air inlet
temperature at 25 and 30kW power
output settings.
(Source: “Environmental Aspects
o Operation o a GasFired
MicroturbineBased CHP System,”
Proceedings o the 19th Annual
International Pittsburgh CoalConerence, Pittsburgh, PA,
September 2002.)
constant during the tests. Te only fue gas pollutant signicantly aected by a change in microturbineair inlet temperature was CO. Asshown in Fig. 23, at both 25- and30-kW power output, the COconcentration levels decreased withhigher air inlet temperatures.
7. THE TECHNOLOGY IN PERSPECTIVE
Te major benets o a DER/CHP are(1) local control o power generation,(2) ecient use o waste heat,(3) increased overall eciency, and(4) a reduction in emissions.
Local power generation applicationsinclude continuous power generation,remote power generation or acilitiesisolated rom the grid, cogeneration,provision o a peaking operation toreduce purchase o electricity during high-price periods, and provision o electrical service at a high level o reliability and quality.
echnologies that can be driven by theDER waste heat in a CHP systeminclude (1) chillers and desiccantdehumidiers or space cooling anddehumidication, (2) steam generatorsor space heating, and (3) heat exchangers or process and domestic hot water.Tese CHP systems can maximizeenergy eciency, provide an option or
central power generation, and improveelectric power reliability and quality.
FEDERAL ENERGY MANAGEMENT PROGRAM ––23

7/29/2019 fta_microturbinechp
http://slidepdf.com/reader/full/ftamicroturbinechp 24/24
8. REFERENCES
1. “DER Perormance esting o a Microturbine-Based Combined Cooling, Heating,and Power (CHP) System,” Proceedings o Power System 2002 Conerence,Clemson, SC, March 2002.
2. “Integration o Distributed Energy Resources and Termally-Activatedechnologies,” Distribuech Conerence, Miami Beach, FL, February 2002.
3. “Experimental and Teoretical Study o Gas Micro-turbine-Based BCHP System,”Proceedings o the 2001 ASME International Mechanical Engineering Congressand Exposition, AES-23622, New York, NY, November 2001.
4. “CHP Integration (OR IES): Maximizing the Eciency o DistributedGeneration with Waste Heat Recovery,” Proceedings o the Power Systems 2003Conerence, Clemson, SC, March 2003.
5. “Baseline and IES Perormance o a Direct-Fired Desiccant Dehumidication Unit
under Various Environmental Conditions,” 2003 ASHRAE ransactions o the Annual Meeting, KC-03-5-2, Kansas City, MI, June 2003.6. “Laboratory R&D on Integrated Energy Systems (IES),” Proceedings o the
2003 International Congress o Rerigeration, ICR2003, Washington, DC, August 2003.
7. “Environmental Aspects o Operation o a Gas-Fired Microturbine-Based CHPSystem,” Proceedings o the 19th Annual International Pittsburgh Coal Conerence,Pittsburgh, PA, September 2002.
8. ASHRAE Handbook, Rerigeration 2002, Chapter 41, “Absorption Cooling,Heating, and Rerigeration Equipment.
Log on to FEMP’s Web site for information about New Technology Demonstrations
www.eere.energy.gov/emp/You will find links to
• A New echnology Demonstration Overview • Inormation on technology demonstrations• Downloadable versions o publications in Adobe Portable Document Format (pd)• A list o new technology projects under way • Electronic access to a regular mailing list or new products when they become available• How Federal agencies may submit requests to us to assess new and emerging technologies
DISCLAIMERThis report was sponsored by the United States Department of Energy, Energy Efficiency and Renewable Energy,
Federal Energy Management Program. Neither the United States Government nor any agency or contractor
thereof, nor any of their employees, makes any warranty, express or implied, or assumes any legal liability or
responsibility for the accuracy, completeness, or usefulness of any information, apparatus, product, or process
disclosed, or representsthat its use would not infringe privately owned rights. Reference herein to any specific
commercial product, process, or service by trade name, trademark, manufacturer, or otherwise does not
necessarily constitute or imply its endorsement, recommendation, or favoring by the United States Government
or any agency or contractor thereof. The views and opinions of authors expressed herein do not necessarily
state or reflect those of the United States Government or any agency or contractor thereof.
A Strong Energy Portfolio
for a Strong America
Energy efciency and clean, renewable
energy will mean a stronger economy,
cleaner environment, and greater
energy independence or America.
Working with a wide array o state,
community, industry, and university
partners, the U.S. Department o
Energy’s Ofce o Energy Efciency
and Renewable Energy invests in a
diverse portolio o energy technologies.
For More Information
EERE Information Center
1877EEREINF
18773373464
www.eere.energy.gov/emp
General Contacts
Will LintnerTeam Lead, RSTTFederal EnergyManagement ProgramU.S. Department o Energy1000 Independence Ave, SWEE-92Washington, DC 20585Phone: (202) 586-3120Fax: (202) [email protected]
Technical Author
Ed PierceOak Ridge National Laboratory(865) [email protected]
-
DOE/EE-0316
May 2007
U S Department of Energy


