Embed Size (px)
Citation preview
Stability of Mitochondrial Membrane Proteins inTerrestrial Vertebrates Predicts Aerobic Capacity andLongevity
Yasuhiro Kitazoe*,1, Hirohisa Kishino2, Masami Hasegawa3,4, Atsushi Matsui5, Nick Lane6, andMasashi Tanaka7
1Center of Medical Information Science, Kochi Medical School, Nankoku, Kochi, Japan2Graduate School of Agricultural and Life Sciences, University of Tokyo, Yayoi, Bunkyo, Tokyo, Japan3School of Life Sciences, Fudan University, Shanghai, China4Institute of Statistical Mathematics, Tokyo, Japan5Department of Cellular and Molecular Biology, Primate Research Institute, Kyoto University, Inuyama-city, Aichi, Japan6Department of Genetics, Evolution and Environment, University College London, United Kingdom7Department of Genomics for Longevity and Health, Tokyo Metropolitan Institute of Gerontology, Japan
*Corresponding author: E-mail: [email protected].
Accepted: 23 July 2011
Abstract
The cellular energy produced by mitochondria is a fundamental currency of life. However, the extent to which mitochondrial
(mt) performance (power and endurance) is adapted to habitats and life strategies of vertebrates is not well understood. A
global analysis of mt genomes revealed that hydrophobicity (HYD) of mt membrane proteins (MMPs) is much lower interrestrial vertebrates than in fishes and shows a strong negative correlation with serine/threonine composition (STC). Here,
we present evidence that this systematic feature of MMPs was crucial for the evolution of large terrestrial vertebrates with
high aerobic capacity. An Arrhenius-type equation gave positive correlations between STC and maximum life span (MLS) in
terrestrial vertebrates (with a few exceptions relating to the lifestyle of small animals with a high resting metabolic rate
[RMR]) and negative correlations in secondary marine vertebrates, such as cetaceans and alligators (which returned from land
to water, utilizing buoyancy with increased body size). In particular, marked STC increases in primates (especially hominoids)
among placentals were associated with very high MLS values. We connected these STC increases in MMPs with greater
stability of respiratory complexes by estimating the degradation of the Arrhenius plot given by accelerating mtRMR up to mtmaximum metabolic rate. Both mtRMR and HYD in terrestrial vertebrates decreased with increasing body mass. Decreases in
mtRMR raise MMP stability when high mobility is not required, whereas decreased HYD may weaken this stability under the
hydrophobic environment of lipid bilayer. High maximal metabolic rates (5–10 RMR), which we postulate require high MMP
mobility, presumably render MMPs more unstable. A marked rise in STC may therefore be essential to stabilize MMPs,
perhaps as dynamic supercomplexes, via hydrogen bonds associated with serine/threonine motifs.
Key words: vertebrate evolution, mitochondrial membrane protein stability, hydrophobicity, serine/threonine composition,aerobic capacity, longevity.
Introduction
One of themost dramaticmacroevolutionary events in verte-
brate history was the water-to-land transition. Extant am-
phibians highlight the adaptive challenges facing this
transition. Terrestrial vertebrates needed large increases in
cellular energy budget anddeveloped apowerful lung-based
respiratory and cardiovascular system. However, the mecha-
nism by which their metabolic rates vary so substantially re-
mains poorly understood at both the physiological and
the mitochondrial (mt) levels (Lane 2006; Pontzera et al.
2010). Each group of vertebrates has its own characteristic
history of evolutionary adaptation to new habitats and life
The Author(s) 2011. Published by Oxford University Press on behalf of the Society for Molecular Biology and Evolution.
This is an Open Access article distributed under the terms of the Creative Commons Attribution Non-Commercial License (http://creativecommons.org/licenses/by-nc/
3.0), which permits unrestricted non-commercial use, distribution, and reproduction in any medium, provided the original work is properly cited.
Genome Biol. Evol. 3:1233–1244. doi:10.1093/gbe/evr079 Advance Access publication August 7, 2011 1233
GBE
strategies. If thishistory ispreservedinmtgenomes,acompar-ative study across various vertebrate groups may detect new
aspects of mt functions and answer the long-standing ques-
tion ofwhether large variations inmtDNA sequences are due
to adaptive evolution of amino acid sequences (Grossman
et al. 2001; Goldberg et al. 2003; Kitazoe et al. 2008; Min
and Hickey 2008; Moosmann and Behl 2008) or nucleotide
mutation pressure (Reyes et al. 1998; Schmitz et al. 2002;
Gibson et al. 2005; Jobson et al. 2010).Previous studies have attempted to connect the evolu-
tionary rate of mtDNA to macroscopic traits such as resting
metabolic rate (RMR), body weight (W), and maximum life
span (MLS) of vertebrates. The evolutionary rate is inversely
related toW (Bromham et al. 1996; Gillooly et al. 2007) and
quite variable across species in short-lived mammals but
constrained to low values in long-lived mammals (Welch
et al. 2008). Long-lived mammals and birds may have in-creased their MLS in part by evolving macromolecular com-
ponents that are more resistant to oxidative damage
(Pamplona and Barja 2007; Min and Hickey 2008). The evo-
lution of mtDNA shows a large variation in substitution rates
between various lineages (Spradling et al. 2001; Kitazoe
et al. 2008; Nabholz et al. 2009). For example, mtDNA
sequences in higher primates evolved twice as fast as other
placental mammals (Kitazoe et al. 2008) and birds evolvedat a quarter the speed of placentals (Nabholz et al. 2009).
From this standpoint, Galtier et al. (2000) recently argued
that a direct mechanical effect of RMR onmtDNA evolution-
ary rate is unlikely and that natural selection could act to
reduce the mtDNA mutation rate in long-lived species.
Other studies have focused on a compositional analysis of
the mt constituents. A correlation between cysteine compo-
sition andMLS has been proposed as cysteine depletionmayrender mt proteins more resistant to oxidative attack and
loss of mt membrane protein (MMP) mobility through pro-
tein cross-linking (Moosmann and Behl 2008). Mammals
and birds show a strong negative correlation between
MLS and the proportion of n� 3 polyunsaturated fatty acids
in lipids, the side chains of which are sensitive to peroxida-
tion (Pamplona et al. 2002; Hulbert et al. 2007). Mammals
also show significant correlations between GC content andMLS (Lehmann et al. 2008). A detailed tree analysis along
the primate lineage demonstrated that a predominant
T/Cflowat secondcodonsites in thehigherprimate lineage
induced amarked Thr increase, which is positively correlated
withMLS (Kitazoe et al. 2008). These compositional analyses
strongly suggest adaptation of the mt protein constituents.
In the present study, our global analysis of vertebrates
suggests that the HYD decreases and serine/threonine com-position (STC) increases in MMPs might have played a fun-
damental role in increasing the aerobic capacity of terrestrial
vertebrates after the water-to-land transition. Higher STC
values in terrestrial vertebrates were closely associated with
longer life spans. An extreme enhancement of this trend
appeared in the primate lineage. Conversely, secondary ma-rine vertebrates such as cetaceans and alligators, which uti-
lize buoyancy without the constraints of gravity, contrasted
sharply with the trend in terrestrial vertebrates. We show
that rodents and insectivores display no STC–MLS correla-
tion because STC content saturates at high RMR but instead
show a strong negative correlation between MLS and cys-
teine composition sensitive to oxidative damage and free
radical leak (Moosmann and Behl 2008). To explain theSTC–MLS correlation, we tested the stability of MMPs to
the marked HYD decrease and STC increase in primates
by using the Arrhenius plot analysis (Lachman and DeLuca
1976; Ertel and Carstensen 1990; Carstensen 2000). By ac-
celerating the mt metabolic rate from the resting rate to the
maximum rate in the Arrhenius equation, we predict that
stabilizing MMPs by the additional STC increases results
in further longevity prolongation of primates (hominoids).Finally, we demonstrate that a short-range hydrogen bond-
ing potential to stabilize MMPs can be effectively trans-
formed into a long-range dynamic anchoring of MMPs,
which we postulate may assist the formation of respirasome
supercomplexes at high metabolic rates (Acın-Perez et al.
2008; Genova et al. 2008; Lenaz and Genova 2009).
Materials and Methods
Data Retrieval
MLS, RMR, andW data were obtained from the AnAge data-
base (http://genomics.senescence.info/species/; de Magalhaes
and Costa 2009; Secor 2003), the Max Planck Institute data-base (http://www.demogr.mpg.de/longevityrecords/; Garey
and Judge 2002), and Moosmann and Behl (2008). Seven
hundred and seventy-one complete mtDNA sequences of
vertebrates were obtained from the NCBI genome database
(http://www.ncbi.nlm.nih.gov/genomes/). The 228 species
with the same scientific names in the AnAge and NCBI ge-
nome databases were collected for the present longevity
analysis. Although W data are normally available for thesespecies, RMR data are frequently lacking. Fortunately, be-
cause the correlations between these two values are excel-
lent (the correlation coefficient for placentals is 0.983 and
that for birds is 0.999), approximate RMR values were ob-
tained by using the regression line as a function of W if the
data are not available.
Maximum Life Span Analysis Using an Arrhenius-Type Equation
This paper presents a procedure of how to relate mt func-tions to the MLS of an organism. The mitochondrion is
a semiautonomous organelle with its own genome and life
span (Lmt). The life span Lmt is confounded by the flux rate
throughmt fission and fusion andmitophagy quality control
(Twig and Shirihai 2011). We assume that greater MMP
Kitazoe et al. GBE
1234 Genome Biol. Evol. 3:1233–1244. doi:10.1093/gbe/evr079 Advance Access publication August 7, 2011

stability delays the turnover of MMP complexes and so pro-longs the abstract quantity Lmt. Therefore, we primarily have
to formulate a relationship between mt functions and this
life span. Electron transport and oxidative phosphorylation
are critical activities of the MMP complexes. Electrons are
transported along the mt respiratory chain, via quantum
tunneling between redox centres, to generate a proton gra-
dient. Although the exact distance between redox centers is
critical to electron flux (Moser et al. 2006), the overall kinet-ics of oxidative phosphorylation are consistent with the dy-
namic assembly and disassembly of respirasome
supercomplexes (Acın-Perez et al. 2008; Genova et al.
2008); hence, both the stability and the mobility of MMPs
are required for respiratory function, especially at high max-
imal metabolic rate. Electrochemical energy of electron
transfer is utilized for ATP production and thermogenesis,
but some of the leaked electrons react with oxygen to gen-erate reactive oxygen species, which are mutagenic signal-
ing molecules. In this way, the MMP complexes act like
a battery in a thermal equilibrium of temperature Tmt. Then,
Lmt is given by Arrhenius equation for chemical reactions,
Lmt 5 C0 exp{C1/(kTmt)} with constants C0, C1 and Boltz-
mann constant k (Arrhenius equation is generally applied
to estimate the shelf life and stability of drugs: Lachman
and DeLuca 1976; Ertel and Carstensen 1990; Carstensen2000). As an extension of this equation, we here apply
a temperature–humidity model, Lel 5 C0 exp(C1/Tel þ C2/
Hel), to test electronic devices at different temperature
(Tel) and humidity (Hel) conditions (Accelerated Life Testing
AnalysisTheory&Principles)becausewemayreplacethedevice
property Hel by STC and HYD of MMPs assuming that Lmt and
kTmt are proportional to MLS of an organism and mtRMR in
the resting metabolic state, respectively. Then, we obtain
Y 5 lnðMLSÞ5A1=mtRMR þ A2=STC þ A3=HYD þ A0
5A1X1 þA2X2 þA3X3 þA0;
ð1Þ
with constants An (n5 0–3).
When the total numberof cells in an organism is proportional
toW, we can write mtRMR5 RMR/Wq. Here, a constant q less
than 1 takes into account the property that the mt density
within cells may fall with increasing W (Porter and Brand
1995; Porter 2001) and is determined so as to maximize the
correlation R1Y between X1 and Y. Equation (1) is useful when
the life span (Lcell) of cells is sufficiently long compared with Lmt
(stem cells fulfill this condition). Using the variables X1, X2, andX3 in place of mtRMR, STC, and HYD, respectively, we can fol-
lowa standardmultiple regression analysis. The theoretical value
Y to estimate MLS is sensitive to small mtRMR values because it
is expressed in terms of 1/mtRMR. We here note that the ex-
pression (1) is comprehensive and can include any other varia-
blesXn (n. 3), if necessary. The importance of this inclusionwill
be automatically evaluated by the multiple regression analysis.
Selection of Hydrophobic Domains in MMPs
To select hydrophobic domains in MMPs, we applied the pri-
mary structure analysis (ExPASy Proteomics Server; http://
www.expasy.ch/; Gasteiger et al. 2005), using a standard
model for the hydrophobic score (S) (Cowan and Whittaker
1990). We calculated the moving average, Sav, of local hy-drophobic scores S (with a window of five amino acid sites)
around each amino acid site. HYD of each vertebrate is de-
fined as the average value of Sav values, which are restricted
to a hydrophobic domain of MMPs. The primary structure
analysis has an accuracy of 80% to discriminate between
the helix domain and the nonhelix domain of MMPs.
HYD values depend on a model of a hydrophobic score being
applied. However, our approach was sufficient to proposequite a fundamental theory as to how MMP functions re-
sponded to the transition of vertebrates from water to land
and in different groups on land.
Results
Global Relationship between STC and HYD inMMPs of Vertebrates
The water-to-land transition of vertebrates was one of the
most dramatic events in vertebrate evolutionary history. We
therefore began our analysis by extracting amino acid com-positions in MMPs, which most changed in tandemwith this
development. For this purpose, simply dividing the 771 ver-
tebrate mt sequences (obtained from the NCBI genome da-
tabase) into two groups of fishes (382) and nonfishes (389)
(‘‘Materials and Methods’’), we made the t-test for differ-ence of means of amino acid composition values between
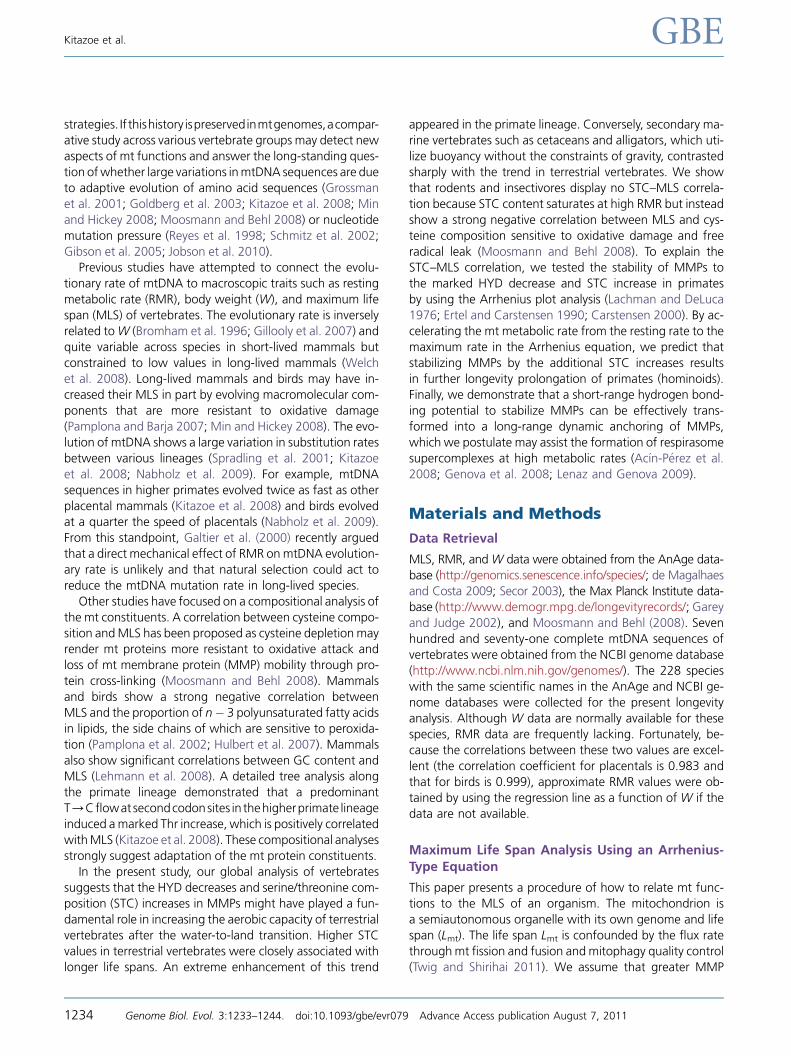
these two groups. As a result, we found that HYD provides
a very good separation (t 5 16.32 and P , 10�21) of HYDdistribution into the two groups without any constraints on
MMPs. Selecting seven proteins (ND3, ND4, CO1, CO2,
ATP6, ATP8, and CYTB) within MMPs furthermore improved
the separation rate with t 5 42.52 and P , 10�80 (fig. 1A),although the original separation without this constraint is in
itself excellent.
Wenextselectedaminoacidsthatarenegativelycorrelated
withHYD.Here,HYDstandsfortheaveragevalueofSavvaluesin ahydrophobic domain,which includes the amino acid sites
(withSav.c,andc isa constant)ofMMPs tobespecified inan
animal group, and Sav denotes the moving average of local
hydrophobic scores S around an amino acid site (Materials
andMethods.Table1showsthatthecorrelationsof threonine
and serinewith HYD aremuch better than other amino acids
ashigherhydrophobicdomainsareselectedbytheSavvalueofeach amino acid site. This trend became clearer in the helixdomain roughly estimated by the primary structure analysis,
especially when the estimated helix region with very low Savvalues (Sav, 0.1) is further excluded and the nonhelix region
with very high Sav values (Sav.0.7) is included (the red letters
Stability of Mitochondrial Membrane Proteins GBE
Genome Biol. Evol. 3:1233–1244. doi:10.1093/gbe/evr079 Advance Access publication August 7, 2011 1235
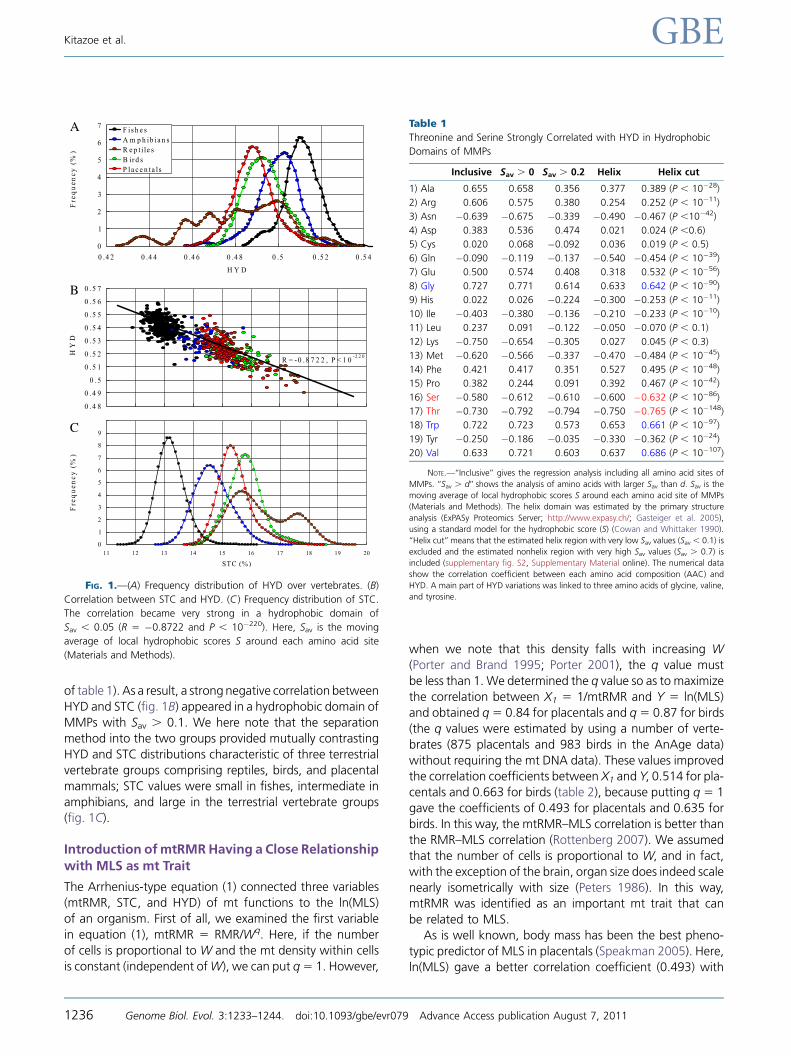
of table 1). As a result, a strong negative correlation between
HYD and STC (fig. 1B) appeared in a hydrophobic domain of
MMPs with Sav . 0.1. We here note that the separation
method into the two groups provided mutually contrasting
HYD and STC distributions characteristic of three terrestrial
vertebrate groups comprising reptiles, birds, and placental
mammals; STC values were small in fishes, intermediate in
amphibians, and large in the terrestrial vertebrate groups(fig. 1C).
Introduction ofmtRMRHaving a Close Relationshipwith MLS as mt Trait
The Arrhenius-type equation (1) connected three variables
(mtRMR, STC, and HYD) of mt functions to the ln(MLS)
of an organism. First of all, we examined the first variable
in equation (1), mtRMR 5 RMR/Wq. Here, if the number
of cells is proportional to W and the mt density within cells
is constant (independent ofW), we can put q5 1. However,
when we note that this density falls with increasing W(Porter and Brand 1995; Porter 2001), the q value must
be less than 1. We determined the q value so as to maximize
the correlation between X1 5 1/mtRMR and Y 5 ln(MLS)
and obtained q5 0.84 for placentals and q5 0.87 for birds
(the q values were estimated by using a number of verte-
brates (875 placentals and 983 birds in the AnAge data)
without requiring the mt DNA data). These values improvedthe correlation coefficients between X1 and Y, 0.514 for pla-
centals and 0.663 for birds (table 2), because putting q 5 1
gave the coefficients of 0.493 for placentals and 0.635 for
birds. In this way, the mtRMR–MLS correlation is better than
the RMR–MLS correlation (Rottenberg 2007). We assumed
that the number of cells is proportional to W, and in fact,
with the exception of the brain, organ size does indeed scale
nearly isometrically with size (Peters 1986). In this way,mtRMR was identified as an important mt trait that can
be related to MLS.
As is well known, body mass has been the best pheno-
typic predictor of MLS in placentals (Speakman 2005). Here,
ln(MLS) gave a better correlation coefficient (0.493) with
A
B
C
FIG. 1.—(A) Frequency distribution of HYD over vertebrates. (B)
Correlation between STC and HYD. (C ) Frequency distribution of STC.
The correlation became very strong in a hydrophobic domain of
Sav , 0.05 (R 5 �0.8722 and P , 10�220). Here, Sav is the moving
average of local hydrophobic scores S around each amino acid site
(Materials and Methods).
Table 1
Threonine and Serine Strongly Correlated with HYD in Hydrophobic
Domains of MMPs
Inclusive Sav . 0 Sav . 0.2 Helix Helix cut
1) Ala 0.655 0.658 0.356 0.377 0.389 (P , 10�28)
2) Arg 0.606 0.575 0.380 0.254 0.252 (P , 10�11)
3) Asn �0.639 �0.675 �0.339 �0.490 �0.467 (P ,10�42)
4) Asp 0.383 0.536 0.474 0.021 0.024 (P ,0.6)
5) Cys 0.020 0.068 �0.092 0.036 0.019 (P , 0.5)
6) Gln �0.090 �0.119 �0.137 �0.540 �0.454 (P , 10�39)
7) Glu 0.500 0.574 0.408 0.318 0.532 (P , 10�56)
8) Gly 0.727 0.771 0.614 0.633 0.642 (P , 10�90)
9) His 0.022 0.026 �0.224 �0.300 �0.253 (P , 10�11)
10) Ile �0.403 �0.380 �0.136 �0.210 �0.233 (P , 10�10)
11) Leu 0.237 0.091 �0.122 �0.050 �0.070 (P , 0.1)
12) Lys �0.750 �0.654 �0.305 0.027 0.045 (P , 0.3)
13) Met �0.620 �0.566 �0.337 �0.470 �0.484 (P , 10�45)
14) Phe 0.421 0.417 0.351 0.527 0.495 (P , 10�48)
15) Pro 0.382 0.244 0.091 0.392 0.467 (P , 10�42)
16) Ser �0.580 �0.612 �0.610 �0.600 �0.632 (P , 10�86)
17) Thr �0.730 �0.792 �0.794 �0.750 �0.765 (P , 10�148)
18) Trp 0.722 0.723 0.573 0.653 0.661 (P , 10�97)
19) Tyr �0.250 �0.186 �0.035 �0.330 �0.362 (P , 10�24)
20) Val 0.633 0.721 0.603 0.637 0.686 (P , 10�107)
NOTE.—‘‘Inclusive’’ gives the regression analysis including all amino acid sites of
MMPs. ‘‘Sav . d’’ shows the analysis of amino acids with larger Sav than d. Sav is the
moving average of local hydrophobic scores S around each amino acid site of MMPs
(Materials and Methods). The helix domain was estimated by the primary structure
analysis (ExPASy Proteomics Server; http://www.expasy.ch/; Gasteiger et al. 2005),
using a standard model for the hydrophobic score (S) (Cowan and Whittaker 1990).
‘‘Helix cut’’ means that the estimated helix region with very low Sav values (Sav , 0.1) is
excluded and the estimated nonhelix region with very high Sav values (Sav . 0.7) is
included (supplementary fig. S2, Supplementary Material online). The numerical data
show the correlation coefficient between each amino acid composition (AAC) and
HYD. A main part of HYD variations was linked to three amino acids of glycine, valine,
and tyrosine.
Kitazoe et al. GBE
1236 Genome Biol. Evol. 3:1233–1244. doi:10.1093/gbe/evr079 Advance Access publication August 7, 2011
ln(W) than that (0.392) withW. This can be easily explained
by the present approach in terms of 1/mtRMR: Using the
excellent relationship between RMR andW, that is, ln(RMR)
5 a ln(W) þ ln(b), we have approximately X1 5 Wq/RMR ’ßWq�a. Here we derived q� a5 0.145 for placentals (witha 5 0.695 and b 5 2.57). The quantity ßWq�a with such
a small q value shows a similar behavior to ln(W) in large
W values (.50 kg) (supplementary fig. S1, Supplementary
Material online). Interestingly, the correlation coefficient
(0.493) between ln(MLS) and ßWq�a in the case of q 5 1
became equal to that between ln(MLS) and ln(W). We here
note that mtRMR of placentals decreases with an increase in
W, proportional to W�0.14, whereas the mt maximum met-abolic rate (mtMMR 5 MMR/Wq) rather increases with an
increase in W; it is proportional to W0.04 when we assume
that MMR is proportional to W0.88 (Bishop 1999).
Longevity Correlations with STC and HYD,Providing Sharp Contrast between TerrestrialVertebrates and Marine Vertebrates (Cetaceansand Alligators)
Once mtRMR is identified as a variable of mt functions in the
Arrhenius-type equation (1), other mt variables such as STC
and HYD may be related to MLS. Table 2 lists the correlation
coefficients (Ri,j) for all pairs of the variables X1 5 1/mtRMR,
X2 5 1/STC, X3 5 1/HYD, and Y 5 ln(MLS) in various ver-
tebrate groups. Table 3 lists the correlation coefficients in
the multiple regression analysis, showing that the coeffi-cients give much better values than those in the single
regression analysis and that MLS can be substantially de-
scribed in terms of mtRMR and STC because of strong neg-
ative correlations between STC and HYD (table 2). In this
regression analysis, we additionally included three proteins
of ND1, ND3, and ND5 and determined the hydrophobic do-
mains and proteins in each vertebrate group so as to max-
imize the correlation between X2 and Y (supplementarytable S1, Supplementary Material online) because these pro-
teins were sometimes concerned to STC–MLS correlations,
and the theoretical estimation of helix domain is not neces-
sarily accurate (Materials and Methods). The regression
analysis provided three distinct correlation patterns: (1) Ter-
restrial placentals (excluding cetaceans, sirenians, rodents,
and insectivores), as well as birds and reptiles (excluding
crocodilians), showed positive STC–MLS and negative
HYD–MLS correlations; (2) secondarily aquatic vertebrates
(those that returned to water from land such as cetaceansand crocodilians) and amphibians showed, on the contrary,
negative STC–MLS and positive HYD–MLS correlations; and
3) primary aquatic vertebrates, that is, fishes, showed aweak
STC–MLS correlation and no HYD–MLS correlation. The
STC–MLS scatter diagrams of figure. 2A and B represent
the mutually exclusive relationships in the two patterns of
terrestrial placentals and cetaceans. The crocodilian lineage
presents a similar behavior to the cetacean lineage, with lowSTC and longMLS for alligators and crocodiles andwith high
STC and short MLS for caimans (supplementary fig. S3, Sup-
plementary Material online). We did not perform a regres-
sion analysis taking into account the tree structure
(Felsenstein 1985; Harvey and Pagel 1991) because it is dif-
ficult to estimate reliable branch lengths in placental and
bird trees, with problems such as simultaneous divergences,
large evolutionary variations, and long-branch attractions(Kitazoe et al. 2007), although this analysis was useful for a
local tree of the primate lineage (Kitazoe et al. 2008). How-
ever, the marked correlations between STC and MLS are so
robust that they may be model independent of the analysis.
Relationship between Additional STC Increasesand Very Large MLS Values in Primates
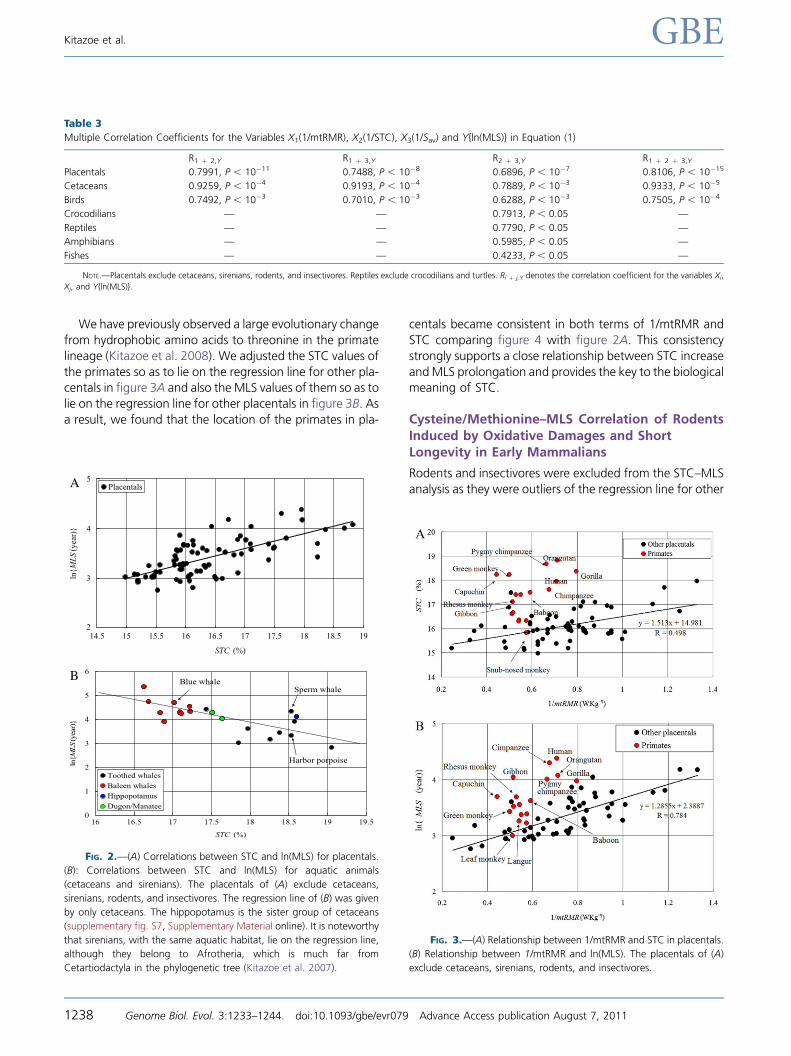
In placentals, STC showed a significant positive correlation
with MLS (table 2 and fig. 2A). However, when STC is ex-
pressed in terms of 1/mtRMR, it represents markedly large
values in hominoids and some other simians, which deviate
strongly from the regression line of other placentals as out-
liers (the red circles in fig. 3A). A similar deviation was ob-
served for MLS in terms of 1/mtRMR (the red circles in
fig. 3B) and also in terms of ln(W) (supplementary fig. S4,Supplementary Material online). We here note that primates
keep a middle position in the order of placentals as a func-
tion of 1/mtRMR (the red circles of fig. 3), whereas they oc-
cupy the highest side in the order of placentals as a function
of STC (the red circles of fig. 2A).
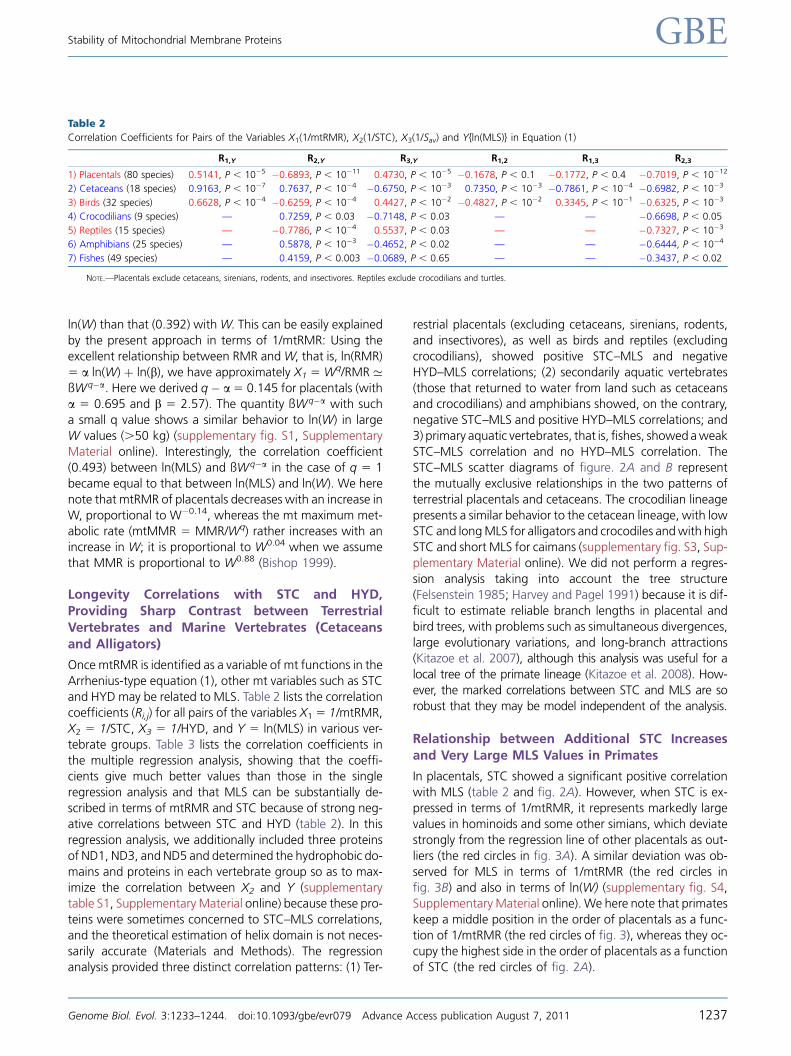
Table 2
Correlation Coefficients for Pairs of the Variables X1(1/mtRMR), X2(1/STC), X3(1/Sav) and Y{ln(MLS)} in Equation (1)
R1,Y R2,Y R3,Y R1,2 R1,3 R2,3
1) Placentals (80 species) 0.5141, P , 10�5 �0.6893, P , 10�11 0.4730, P , 10�5 �0.1678, P , 0.1 �0.1772, P , 0.4 �0.7019, P , 10�12
2) Cetaceans (18 species) 0.9163, P , 10�7 0.7637, P , 10�4 �0.6750, P , 10�3 0.7350, P , 10�3 �0.7861, P , 10�4 �0.6982, P , 10�3
3) Birds (32 species) 0.6628, P , 10�4 �0.6259, P , 10�4 0.4427, P , 10�2 �0.4827, P , 10�2 0.3345, P , 10�1 �0.6325, P , 10�3
4) Crocodilians (9 species) — 0.7259, P , 0.03 �0.7148, P , 0.03 — — �0.6698, P , 0.05
5) Reptiles (15 species) — �0.7786, P , 10�4 0.5537, P , 0.03 — — �0.7327, P , 10�3
6) Amphibians (25 species) — 0.5878, P , 10�3 �0.4652, P , 0.02 — — �0.6444, P , 10�4
7) Fishes (49 species) — 0.4159, P , 0.003 �0.0689, P , 0.65 — — �0.3437, P , 0.02
NOTE.—Placentals exclude cetaceans, sirenians, rodents, and insectivores. Reptiles exclude crocodilians and turtles.
Stability of Mitochondrial Membrane Proteins GBE
Genome Biol. Evol. 3:1233–1244. doi:10.1093/gbe/evr079 Advance Access publication August 7, 2011 1237
We have previously observed a large evolutionary change
from hydrophobic amino acids to threonine in the primate
lineage (Kitazoe et al. 2008). We adjusted the STC values of
the primates so as to lie on the regression line for other pla-centals in figure 3A and also the MLS values of them so as to
lie on the regression line for other placentals in figure 3B. Asa result, we found that the location of the primates in pla-
centals became consistent in both terms of 1/mtRMR and
STC comparing figure 4 with figure 2A. This consistency
strongly supports a close relationship between STC increase
andMLS prolongation and provides the key to the biologicalmeaning of STC.
Cysteine/Methionine–MLS Correlation of RodentsInduced by Oxidative Damages and ShortLongevity in Early Mammalians
Rodents and insectivores were excluded from the STC–MLS
analysis as they were outliers of the regression line for other
Table 3
Multiple Correlation Coefficients for the Variables X1(1/mtRMR), X2(1/STC), X3(1/Sav) and Y{ln(MLS)} in Equation (1)
R1 þ 2,Y R1 þ 3,Y R2 þ 3,Y R1 þ 2 þ 3,Y
Placentals 0.7991, P , 10�11 0.7488, P , 10�8 0.6896, P , 10�7 0.8106, P , 10�15
Cetaceans 0.9259, P , 10�4 0.9193, P , 10�4 0.7889, P , 10�3 0.9333, P , 10�5
Birds 0.7492, P , 10�3 0.7010, P , 10�3 0.6288, P , 10�3 0.7505, P , 10�4
Crocodilians — — 0.7913, P , 0.05 —
Reptiles — — 0.7790, P , 0.05 —
Amphibians — — 0.5985, P , 0.05 —
Fishes — — 0.4233, P , 0.05 —
NOTE.—Placentals exclude cetaceans, sirenians, rodents, and insectivores. Reptiles exclude crocodilians and turtles. Ri þ j,Y denotes the correlation coefficient for the variables Xi,
Xj, and Y{ln(MLS)}.
A
B
FIG. 2.—(A) Correlations between STC and ln(MLS) for placentals.
(B): Correlations between STC and ln(MLS) for aquatic animals
(cetaceans and sirenians). The placentals of (A) exclude cetaceans,
sirenians, rodents, and insectivores. The regression line of (B) was given
by only cetaceans. The hippopotamus is the sister group of cetaceans
(supplementary fig. S7, Supplementary Material online). It is noteworthy
that sirenians, with the same aquatic habitat, lie on the regression line,
although they belong to Afrotheria, which is much far from
Cetartiodactyla in the phylogenetic tree (Kitazoe et al. 2007).
FIG. 3.—(A) Relationship between 1/mtRMR and STC in placentals.
(B) Relationship between 1/mtRMR and ln(MLS). The placentals of (A)
exclude cetaceans, sirenians, rodents, and insectivores.
Kitazoe et al. GBE
1238 Genome Biol. Evol. 3:1233–1244. doi:10.1093/gbe/evr079 Advance Access publication August 7, 2011
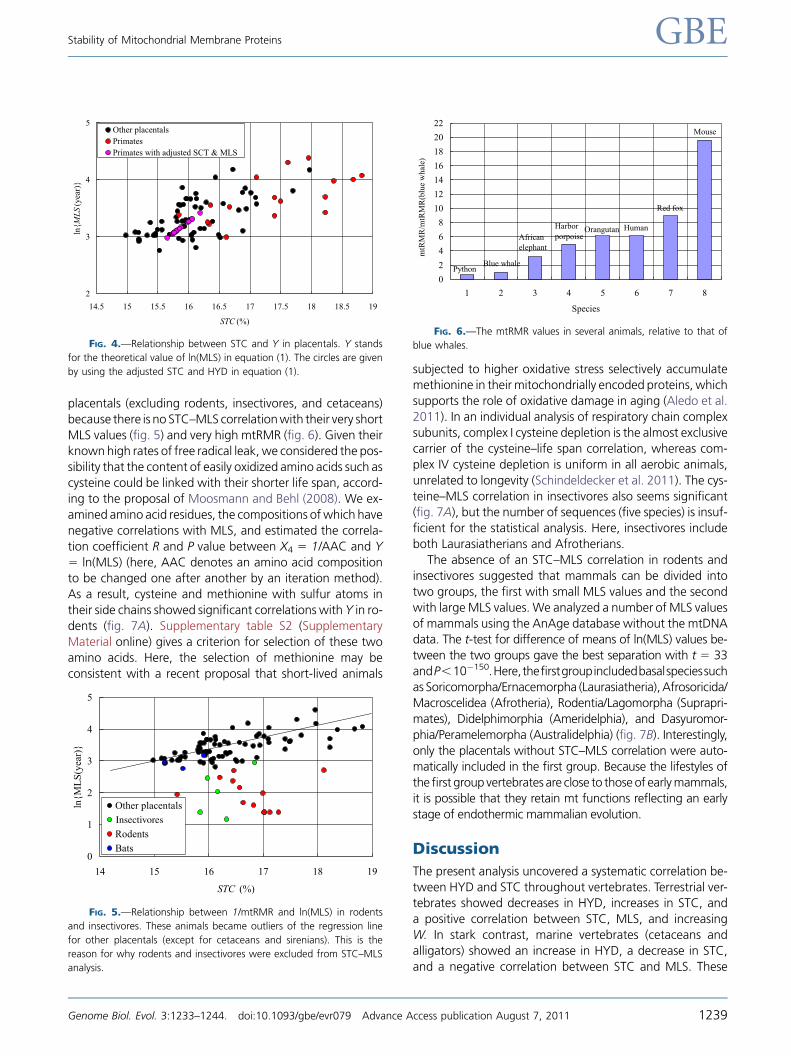
placentals (excluding rodents, insectivores, and cetaceans)
because there is no STC–MLS correlationwith their very short
MLS values (fig. 5) and very high mtRMR (fig. 6). Given theirknown high rates of free radical leak, we considered the pos-
sibility that the content of easily oxidized amino acids such as
cysteine could be linked with their shorter life span, accord-
ing to the proposal of Moosmann and Behl (2008). We ex-
amined amino acid residues, the compositions ofwhich have
negative correlations with MLS, and estimated the correla-
tion coefficient R and P value between X4 5 1/AAC and Y5 ln(MLS) (here, AAC denotes an amino acid compositionto be changed one after another by an iteration method).
As a result, cysteine and methionine with sulfur atoms in
their side chains showed significant correlations with Y in ro-
dents (fig. 7A). Supplementary table S2 (Supplementary
Material online) gives a criterion for selection of these two
amino acids. Here, the selection of methionine may be
consistent with a recent proposal that short-lived animals
subjected to higher oxidative stress selectively accumulatemethionine in their mitochondrially encoded proteins, which
supports the role of oxidative damage in aging (Aledo et al.
2011). In an individual analysis of respiratory chain complex
subunits, complex I cysteine depletion is the almost exclusive
carrier of the cysteine–life span correlation, whereas com-
plex IV cysteine depletion is uniform in all aerobic animals,
unrelated to longevity (Schindeldecker et al. 2011). The cys-
teine–MLS correlation in insectivores also seems significant(fig. 7A), but the number of sequences (five species) is insuf-
ficient for the statistical analysis. Here, insectivores include
both Laurasiatherians and Afrotherians.
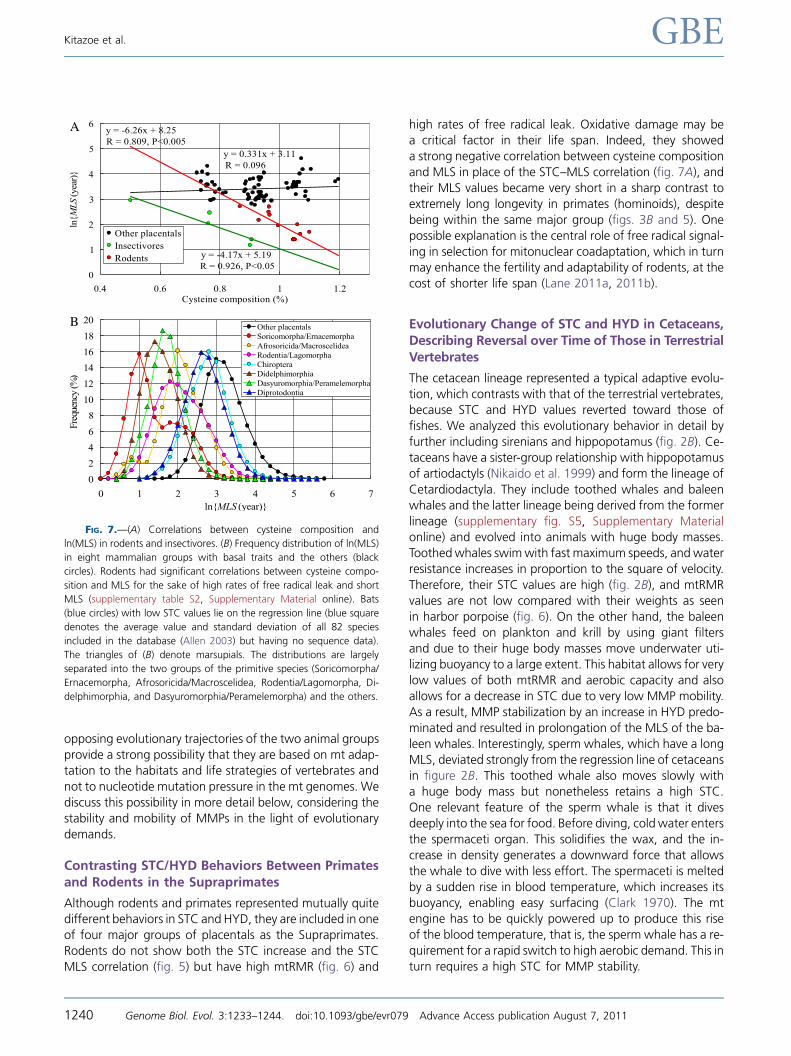
The absence of an STC–MLS correlation in rodents and
insectivores suggested that mammals can be divided into
two groups, the first with small MLS values and the second
with largeMLS values. We analyzed a number of MLS values
of mammals using the AnAge database without the mtDNAdata. The t-test for difference of means of ln(MLS) values be-
tween the two groups gave the best separation with t 5 33
andP,10�150.Here,thefirstgroupincludedbasalspeciessuch
as Soricomorpha/Ernacemorpha (Laurasiatheria),Afrosoricida/
Macroscelidea (Afrotheria), Rodentia/Lagomorpha (Suprapri-
mates), Didelphimorphia (Ameridelphia), and Dasyuromor-
phia/Peramelemorpha (Australidelphia) (fig. 7B). Interestingly,only the placentals without STC–MLS correlation were auto-matically included in the first group. Because the lifestyles of
thefirst group vertebrates are close to thoseof earlymammals,
it is possible that they retain mt functions reflecting an early
stage of endothermic mammalian evolution.
Discussion
The present analysis uncovered a systematic correlation be-
tween HYD and STC throughout vertebrates. Terrestrial ver-tebrates showed decreases in HYD, increases in STC, and
a positive correlation between STC, MLS, and increasing
W. In stark contrast, marine vertebrates (cetaceans and
alligators) showed an increase in HYD, a decrease in STC,
and a negative correlation between STC and MLS. These
FIG. 4.—Relationship between STC and Y in placentals. Y stands
for the theoretical value of ln(MLS) in equation (1). The circles are given
by using the adjusted STC and HYD in equation (1).
Insectivores
FIG. 5.—Relationship between 1/mtRMR and ln(MLS) in rodents
and insectivores. These animals became outliers of the regression line
for other placentals (except for cetaceans and sirenians). This is the
reason for why rodents and insectivores were excluded from STC–MLS
analysis.
FIG. 6.—The mtRMR values in several animals, relative to that of
blue whales.
Stability of Mitochondrial Membrane Proteins GBE
Genome Biol. Evol. 3:1233–1244. doi:10.1093/gbe/evr079 Advance Access publication August 7, 2011 1239
opposing evolutionary trajectories of the two animal groups
provide a strong possibility that they are based on mt adap-
tation to the habitats and life strategies of vertebrates and
not to nucleotide mutation pressure in the mt genomes. We
discuss this possibility in more detail below, considering the
stability and mobility of MMPs in the light of evolutionary
demands.
Contrasting STC/HYD Behaviors Between Primatesand Rodents in the Supraprimates
Although rodents and primates represented mutually quitedifferent behaviors in STC and HYD, they are included in one
of four major groups of placentals as the Supraprimates.
Rodents do not show both the STC increase and the STC
MLS correlation (fig. 5) but have high mtRMR (fig. 6) and
high rates of free radical leak. Oxidative damage may bea critical factor in their life span. Indeed, they showed
a strong negative correlation between cysteine composition
and MLS in place of the STC–MLS correlation (fig. 7A), andtheir MLS values became very short in a sharp contrast to
extremely long longevity in primates (hominoids), despite
being within the same major group (figs. 3B and 5). One
possible explanation is the central role of free radical signal-
ing in selection for mitonuclear coadaptation, which in turnmay enhance the fertility and adaptability of rodents, at the
cost of shorter life span (Lane 2011a, 2011b).
Evolutionary Change of STC and HYD in Cetaceans,Describing Reversal over Time of Those in TerrestrialVertebrates
The cetacean lineage represented a typical adaptive evolu-
tion, which contrasts with that of the terrestrial vertebrates,because STC and HYD values reverted toward those of
fishes. We analyzed this evolutionary behavior in detail by
further including sirenians and hippopotamus (fig. 2B). Ce-taceans have a sister-group relationship with hippopotamus
of artiodactyls (Nikaido et al. 1999) and form the lineage of
Cetardiodactyla. They include toothed whales and baleen
whales and the latter lineage being derived from the former
lineage (supplementary fig. S5, Supplementary Materialonline) and evolved into animals with huge body masses.
Toothedwhales swimwith fast maximum speeds, and water
resistance increases in proportion to the square of velocity.
Therefore, their STC values are high (fig. 2B), and mtRMR
values are not low compared with their weights as seen
in harbor porpoise (fig. 6). On the other hand, the baleen
whales feed on plankton and krill by using giant filters
and due to their huge body masses move underwater uti-lizing buoyancy to a large extent. This habitat allows for very
low values of both mtRMR and aerobic capacity and also
allows for a decrease in STC due to very low MMP mobility.
As a result, MMP stabilization by an increase in HYD predo-
minated and resulted in prolongation of the MLS of the ba-
leen whales. Interestingly, sperm whales, which have a long
MLS, deviated strongly from the regression line of cetaceans
in figure 2B. This toothed whale also moves slowly witha huge body mass but nonetheless retains a high STC.
One relevant feature of the sperm whale is that it dives
deeply into the sea for food. Before diving, cold water enters
the spermaceti organ. This solidifies the wax, and the in-
crease in density generates a downward force that allows
the whale to dive with less effort. The spermaceti is melted
by a sudden rise in blood temperature, which increases its
buoyancy, enabling easy surfacing (Clark 1970). The mtengine has to be quickly powered up to produce this rise
of the blood temperature, that is, the sperm whale has a re-
quirement for a rapid switch to high aerobic demand. This in
turn requires a high STC for MMP stability.
A
B
FIG. 7.—(A) Correlations between cysteine composition and
ln(MLS) in rodents and insectivores. (B) Frequency distribution of ln(MLS)
in eight mammalian groups with basal traits and the others (black
circles). Rodents had significant correlations between cysteine compo-
sition and MLS for the sake of high rates of free radical leak and short
MLS (supplementary table S2, Supplementary Material online). Bats
(blue circles) with low STC values lie on the regression line (blue square
denotes the average value and standard deviation of all 82 species
included in the database (Allen 2003) but having no sequence data).
The triangles of (B) denote marsupials. The distributions are largely
separated into the two groups of the primitive species (Soricomorpha/
Ernacemorpha, Afrosoricida/Macroscelidea, Rodentia/Lagomorpha, Di-
delphimorphia, and Dasyuromorphia/Peramelemorpha) and the others.
Kitazoe et al. GBE
1240 Genome Biol. Evol. 3:1233–1244. doi:10.1093/gbe/evr079 Advance Access publication August 7, 2011
A recent study reports that the basal swim speed of ma-rine vertebrates increases with an increase in body mass
(Watanabe et al. 2011). However, our interest is the differ-
ence between RMR and MMR. Indeed, the maximum swim
speeds of dolphins are much higher than those in baleen
whales. Unfortunately, both the RMR and the MLS data
of marine vertebrates are poor at present. It would be inter-
esting to investigate the adaptive evolution of these verte-
brates in more detail. For example, the behavior of sealsseems to be different from that of cetaceans (supplementary
fig. S6A, Supplementary Material online) and rather similar
to that of other placentals (supplementary fig. S6B, Supple-mentary Material online). They have a small variation of
W values, and their divergence time (15 million years ago)
is much later than that of cetaceans (50 million years ago).
They belong to the carnivore lineage far from the
cetartiodactyl lineage (including artiodactyls and cetaceans)and spend most of their time at sea, although they return to
landor pack ice to breedandgive birth andproduce thick fat-
rich milk that allows them to provide their pups with large
amounts of energy in a short period. In fishes, STCs of tunas
that swim fastwithW510–30 (kg) andMLS510–20 (years)
are locatedaround thepeakvalueof thedistribution (fig. 1C),whereas those of eels withW5 1–4 (kg) and MLS5 20–80
(years) are locatedon theextremeright tail of thedistribution.
Large STC/HYD Variations in Reptiles
The STC values of reptiles are divided into two regions, in-
cluding relatively low values for lizards and very high values
for some snakes (the second peak of reptiles in fig. 1C ).Snakes have large STC values and small HYD values for their
MMPs because of the negative correlation between these
two values (table 2). Small HYD values enable MMPmotility,
which may be important for powering up the mt engine
quickly. Interestingly, the true snakes such as boas, cobras,
and pythons have among the highest STC values known.
This may relate to their unusual eating habits. Such snakes
often eat only every few months and have very low RMRvalues between meals to the point of dormancy. On eating
a large meal (often 40% of body weight), their metabolic
rates rise by 5- to 44-fold over several days, whereas their
intestinal mass doubles and liver and kidney volumes in-
crease by 50% (Secor and Diamond 1995; Secor 2003).
Thus again, MMP mobility and stability depend not only
on RMR but also on the kinetics: Abrupt changes in aerobic
function apparently demand high MMP mobility, which isoffset by interhelical STC stabilization. The reason of these
speculations is discussed in the remaining paragraphs.
Why Do MMPs of Terrestrial Vertebrates DecreaseHYD and Increase STC?
Onthebasisof therecent tertiarystructuralelucidationofcom-
plex I, the dynamic assembly of respirasome supercomplexes,
andthespeedofmtfusionandfission(TwigandShirihai2011),
weassume thatMMPs undergo largemovements during theirfunction and that theirmobility and stability generally stand in
a trade-off relationship (Hildebrand et al. 2008). The mtRMR
and HYD in terrestrial vertebrates decrease with increasing
W.Theformerdecreaseraises thestabilityofMMPsduetotheir
lowermobility, whereas the latter decreaseweakens their sta-
bility as theyare embedded into thehydrophobic environment
of lipid bilayer. By this compensation, they can retain their sta-
bilitydespiteanincrease inW.However,asevereproblemtakesplace when the metabolic rate of an organism is accelerated
from the RMR to the MMR around 5- to 10-fold greater than
RMR (in fact,MMRofmammals scaleswith the 0.88power of
W, which is significantly different from 3/4 power scaling of
RMR). It is determined by the energy needs of the cells active
during ‘‘maximal work,’’ and the aerobic capacity is higher in
athletic than in nonathletic species (Bishop1999; Porter 2001;
Weibel et al.2004;WeibelandHoppeler2005). In thisway, theratiomtMMR/mtRMR5MMR/RMR (5W0.18) inmammals in-
creaseswithanincrease inW. Theweakeningof thehydropho-
bic effect permits greater mobility of MMPs, which in turn
enables theelevationofmt functional activities. Thecost is that
MMPs become increasingly unstable.
Membrane proteins are stabilized by classical hydrogen
bonds (Adamian and Liang 2002; Gimpelev et al. 2004),
most of which are found in motifs involving medium polarresidues such as serine or threonine. Indeed, it has been
shown that such serine/threonine motifs can also drive
the association of model transmembrane helices (Dawson
et al. 2002). Thus, we propose that the STC increase in ter-
restrial vertebrates could compensate for the lack of the hy-
drophobic effect and provide the driving force for
membrane protein folding (Eilers et al. 2000). In particular,
we argue that the stabilization of transmembrane helicesbyhydrogenbondingcouldcontribute to thedynamicassem-
bly of respirasome supercomplexes at high rates of ATP syn-
thesis, which in turn could speed electron flux via quantum
tunnelingwithin the solid-state respirasomemodel originally
proposed by Chance and Williams (1955).
Relationship between MMP Stability and LongevityDerived From Arrhenius Plot Analysis
The Arrhenius plot analysis is commonly applied to predict-
ing the stability of drugs (Lachman and DeLuca 1976; Ertel
and Carstensen 1990; Carstensen 2000). The stability test is
made under the stress condition of accelerated tempera-
tures and therefore called temperature-accelerated stability
study. The stability is given by the degradation rate of the
plot. In analogy to this study, we transform equation (1) intoits original form, F(mtMR)5 exp(A1/MRþA2/STCþA3/HYD
þ A0)5 F0�exp(A1/mtMR), and follow the F value as a func-tion of mtMR, which goes from mtRMR to mtMMR. Here,
the constantsAn (n5 0–3) are determined in advance by the
regression analysis of each vertebrate group. The Arrhenius
Stability of Mitochondrial Membrane Proteins GBE
Genome Biol. Evol. 3:1233–1244. doi:10.1093/gbe/evr079 Advance Access publication August 7, 2011 1241
plot describes the fall in stability of MMPs with rising mtMRvalues in an each animal. For example, the African elephant,
with a very low mtRMR (fig. 6), shows a rapidly decreasing
function of Fwith an increase in mtMR, whereas the red fox,
with a high mtRMR, shows a slowly decreasing function of
F with an increase in mtMR (supplementary fig. S7, Supple-
mentary Material online). Because mtMMR is generally
around 5- to 10-fold greater than mtRMR (Bishop 1999;
Porter 2001), the F value in this region is almost saturatedat its lowest level and insensitive to the precise value of
mtMMR in each animal. The maximum value of the fall in
stability is given by SF 5 F(mtRMR) � F(mtMMR), which
stands for the degradation of MMP stability induced by
accelerating the mt metabolic rate of an organism.
If this fall in stability is recovered by helix–helix interac-
tions of hydrogen bonding, STC should provide positive cor-
relations with SF because serine/threonine motifs are quiteimportant for stabilizing the tertiary structure of MMPs.
Such a correlation is demonstrated in placentals in which
extensive STC increases and HYD decreases were observed
in hominoids of the primate lineage (supplementary fig. S8,
Supplementary Material online). We adjusted the STC and
HYD values of primates so as to lie on the regression lines
(blue lines) for many other placentals. We estimated the
Y values of equation (1) by using these adjusted valuesand compared them with the original Y values as functions
of STC (supplementary fig. S9, Supplementary Material on-
line). As a result, the position of primates became very sim-
ilar to that of figure 4 because the relationship between STC
and Y in primates returned to that between STC and Y in
other placentals. This result enables us to speculate that
the MMP stabilization attained by additional STC increases
in hominoids and some simians offset the fall in MMP sta-bility at accelerated mt metabolic rates associated with
amarked prolongation of longevity. Amore rigorous estima-
tion of MMP stability will need to be made in the future on
the basis of a detailed tertiary structure analysis of MMPs,
for example, with help of the molecular dynamics.
Long-Range Helix–Helix Interactions Taking IntoAccount Mobility of MMPs
Helix–helix (hydrogen bonding) interactions by serine/thre-
onine motifs have normally a short range around 2A and
below 3A. However, we note here that MMPs dynamically
move during functions (Hildebrand et al. 2008) as one MMP
complex (complex I) resembles a steam engine inwhich a pis-
ton drives a set of discontinuous helices (Efremov et al.
2010). As a result, even hydrogen-bonding pairs with largerdistances (R) than 3A can enter the short range when they
oscillate with an amplitude (DR), which is enlarged with an
increase in mt metabolic rates (functional activities). In
addition, it is increasingly clear from blue-native gel electro-
phoresis (Dudkina et al. 2010) and flux-control analyses
(Acın-Perez et al. 2008; Genova et al. 2008; Lenaz andGenova 2009) that the random diffusion model of mt respi-
ratory chain function is not supported at higher metabolic
rates. Instead, dynamic respirasomes—comprising com-
plexes I and III or I, III, and IV and possibly the ATP synthase
(Acın-Perez et al. 2008)—form stable supercomplexes dur-
ing active oxidative phosphorylation. The dissociation of
supercomplexes appears to depend on the electrical prop-
erties of the innermembrane, notably themembrane poten-tial (Lenaz and Genova 2009), and we postulate that the
dynamic assembly and disassembly of these respiratory
supercomplexes could explain the high ST content of MMPs
in animals with high aerobic capacity. The high STcontent of
MMPs may also stabilize respirasomes during mt fusion and
fission, both highly dynamic processes associated with
changes in electron flux and membrane potential, taking
place in a matter of minutes (Twig and Shirihai 2011).We therefore postulate that the ability of serine and threo-
nine residues to form both short-range and long-range hy-
drogen bonds assists in the formation of dynamic
supercomplexes in the context of cristae remodeling and
changes in respiratory flux.
We simulated how much the short-range force of a two-
body potential can be effectively enlarged by the oscillation
effect by applying a ‘‘spring’’ model in which a relative dis-tance of hydrogen bond oscillates with the average ampli-
tude DR around R. Obeying Hooke’s law, we have mtMR 5
K0 (DR/R)2 with a constant K0 (mtMR goes from mtRMR to
mtMMR), and DR2 becomes proportional to mtMR. The ef-
fective two-body potential and interaction range are given
by E(R) 5 (2�p�DR2)�1�Rexp{�(R � r)2/(2�DR2)}�H(r)�dr and
Reff 5RR�E(R)�dR/
RE(R)�dR, respectively. Here, H(r) denotes
the original two-body potential of a short range. As a result,we confirmed that the effective interaction range Reff caneasily become two to three times as large as the original
range (supplementary fig. S10, Supplementary Material on-
line; the caption describes a detailed procedure to calculate
Reff). Occurrence of such a long-range potential markedly
amplifies a probability of helix–helix interactions in the 3D
configuration space associated with an increase in STC.
Possibility of Other Types of Adaptive Evolution
There is an inverse relationship betweenMLS and the propor-
tion of n � 3 polyunsaturated fatty acids in lipids, which are
sensitive to peroxidation (Pamplona et al. 2002; Hulbert et al.
2007). Thebehavioroffattyacidcompositionseemssimilar to
thatof themtRMRbecause these twovariablesdecreasewith
increases in W and MLS. It is interesting to include this fatty
effect as an additional variable ofmt composition in equation(1) for the multiple regression analysis when more data are
available in the future.Other factors, suchas theeffectofpro-
ton leak on mt membrane surface area (Porter 2001), could
also be examined by using equation (1).
Kitazoe et al. GBE
1242 Genome Biol. Evol. 3:1233–1244. doi:10.1093/gbe/evr079 Advance Access publication August 7, 2011
It is noteworthy that the hydrophobicity of MMPs is sub-ject to reversible selection in terrestrial vertebrate groups.
One of the main hypotheses for the retention of mtDNA
at all relates to the physical intractability of hydrophobic
MMPs. On the basis of our study, MMP hydrophobicity is
indeed tractable to selection, so an inability to alter the
properties of MMPs does not seem to be sufficient reason
to retainmtDNA. Other factors, such as redox regulation—the
requirement for locally calibrated changes in expression of mtgenes in response to changes in supply and demand as re-
flected in redox state and membrane potential—presumably
play an important role. The findings presented here are con-
sistent with the colocation for redox regulation hypothesis
(Allen 2003).
Concluding Remarks
In examining how mitochondria have been adapted to thehabitats and life strategies of vertebrates, we analyzed the
behavior of HYD and STC in various vertebrate groups. As a re-
sult, we speculate that low HYD and high STC are linked to
increases in MMP mobility and stability in terrestrial verte-
brates, and these features are then related to energetic
requirements and longevity of them. These speculations were
derived almost entirely within the framework of Arrhenius
equation.
Supplementary Material
Supplementary tables S1 and S2 and figures S1–S9 are avail-
able at Genome Biology and Evolution online (http://
www.gbe.oxfordjournals.org/).
Acknowledgments
Y.K. thanks Kozo Utsumi and Junichiro Futami (Okayama
University) and Keiko Udaka (Kochi Medical School) for con-
structive discussions and insights. This work was supportedby grants from Japanese Society for the Promotion of Sci-
ence (22570099 to M.H.); Grants-in-Aid for Scientific Re-
search from the Ministry of Education, Culture, Sports,
Science, and Technology of Japan (A-22240072 and B-
21390459 to M.T.); grant 20B-13 from the program Re-
search Grants for Nervous and Mental Disorders of the Min-
istry of Health, Labour, and Welfare (to M.T.); and grants for
scientific research from the Takeda Science Foundation (toM.T.). N.L. is grateful to the UCL Provost’s Venture Research
Fellowship for Support.
Literature CitedAccelerated life testing analysis theory & principles [Internet].
[cited 2011 Sept 1]. Available from: http://www.weibull.com/
acceltestwebcontents.htm
Acın-Perez R, Fernandez-Silva P, Peleato ML, Perez-Martos A, Enriquez JA.
2008. Respiratory active mitochondrial supercomplexes. Mol Cell.
32:529–539.
Adamian L, Liang J. 2002. Interhelical hydrogen bonds and spatial
motifs in membrane proteins: polar clamps and serine zippers.
Proteins 47:209–218.
Aledo JC, Li Y, de Magalhaes JP, Ruız-Camacho M, Perez-Claros JA.
2011. Mitochondrially encoded methionine is inversely related to
longevity in mammals. Aging Cell 10(2):198–207.
Allen JF. 2003. The function of genomes in bioenergetic organelles. Phil
Trans R Soc Lond. B358:19–37.
Bishop CM. 1999. The maximum oxygen consumption and aerobic
scope of birds and mammals: getting to the heart of the matter.
Proc R Soc Lond B Biol Sci. 266:2275–2281.
Bromham L, Rambaut A, Harvey PH. 1996. Determinants of rate
variation in mammalian DNA sequence evolution. J Mol Evol.
43:610–621.
Carstensen JT. 2000. Solution kinetics. In: Carstensen JT, Rhodes CT,
editors. Drug stability: principles and practices (3rd ed.). New York:
Marcel Dekker. p. 19–55.
Chance B, Williams GR. 1955. A method for the localization of sites for
oxidative phosphorylation. Nature 176:250–254.
Clark M. 1970. Function of spermaceti organ of the sperm whale.
Nature 228:873–874.
Cowan R, Whittaker RG. 1990. Hydrophobicity indices for amino acid
residues as determined by high-performance liquid chromatogra-
phy. Pept Res. 3:75–80.
Dawson JP, Weinger JS, Engelman DM. 2002. Motifs of serine and
threonine can drive association of transmembrane helices. J Mol
Biol. 316:799–805.
de Magalhaes JP, Costa J. 2009. A database of vertebrate longevity
records and their relation to other life-history traits. J Evolution Biol.
22:1770–1774. Available from: http://genomics.senescence.info/
species/.
Dudkina NV, Kouril R, Peters K, Braun HP, Boekema EJ. 2010. Structure
and function of mitochondrial supercomplexes. Biochim Biophys
Acta Bioenerg. 1797:664–670.
Efremov RG, Baradaran R, Sazanov LA. 2010. The architecture of
respiratory complex. Nature 466:441–445.
Eilers M, Shekar SC, Shieh T, Smith SO, Fleming PJ. 2000. Internal
packing of helical membrane proteins. Proc Natl Acad Sci USA.
97:5796–5801.
Ertel KD, Carstensen JT. 1990. Examination of a modified Arrhenius
relationship for pharmaceutical stability prediction. Int J Pharm. 61:9–14.
Felsenstein J. 1985. Phylogenies and the comparative method. Am Nat.
125:1–15.
Galtier N, Jobson RW, Nabholz B, Glemin S, Blier PU. 2009.
Mitochondrial whims: metabolic rate, longevity and the rate of
molecular evolution. Biol Lett. 5:413–416.
Garey JR, Judge DS. 2002. Longevity records: life spans of mammals,
birds, amphibians, reptiles, and fish. Odense (Denmark): Odense
University Press. Available from: http://www.demogr.mpg.de/
longevityrecords/.
Gasteiger E, Hoogland C, Gattiker A, Duvaud S, Wilkins MR, Appel RD,
Bairoch A. 2005. Protein identification and analysis tools on the
ExPASy server. In Walker JM, editor. The proteomics protocols
handbook. Totowa (NJ): Humana Press. p. 571–607. Available from:
http://www.expasy.ch/.
Genova ML, et al. 2008. Is supercomplex organization of the respiratory
chain required for optimal electron transfer activity? Biochim
Biophys Acta Bioenerg. 1777:740–746.
Gibson A, Gowri-Shankar V, Higgs PG, Rattray M. 2005. A comprehensive
analysis of mammalian mitochondrial genome base composition and
improved phylogenetic methods. Mol Biol Evol. 22:251–264.
Stability of Mitochondrial Membrane Proteins GBE
Genome Biol. Evol. 3:1233–1244. doi:10.1093/gbe/evr079 Advance Access publication August 7, 2011 1243

Gillooly JF, McCoy MW, Allen AP. 2007. Effects of metabolic rate on
protein evolution. Biol Lett. 3:655–659.
Gimpelev M, Forrest LR, Murray D, Honig B. 2004. Helical packing
patterns in membrane and soluble proteins. Biophys J. 87:4075–4086.
Goldberg A, et al. 2003. Adaptive evolution of cytochrome c oxidase
subunit VIII in anthropoid primates. Proc Natl Acad Sci. USA.
100:5873–5878.
Grossman LI, Schmidt TR, Wildman DE, Goodman M. 2001. Molecular
evolution of aerobic energy metabolism in primates. Mol Phylogenet
Evol. 18:26–36.
Harvey PH, Pagel MD. 1991. The comparative method in evolutionary
biology. Oxford: Oxford University Press.
Hildebrand PW, et al. 2008. Hydrogen-bonding and packing features of
membrane proteins: functional implications. Biophys J. 94:1945–1953.
Hulbert AJ, Pamplona R, Buffenstein R, Buttemer WA. 2007. Life and
death: metabolic rate, membrane composition, and life span of
animals. Physiol Rev. 87:1175–1213.
Jobson RW, Dehne-Garcia A, Galtier N. 2010. Apparent longevity-
related adaptation of mitochondrial amino acid content is due to
nucleotide compositional shifts. Mitochondrion 10:540–547.
Kitazoe Y, et al. 2007. Robust time estimation reconciles views of the
antiquity of placental mammals. PLoS One. 2:e384.
Kitazoe Y, et al. 2008. Adaptive threonine increase in transmembrane
regions of mitochondrial proteins in higher primates. PLoS One.
3:e3343.
Lachman L, DeLuca P. 1976. Kinetic principles and stability testing. The
theory and practice of industrial pharmacy (2nd ed.). Philadelphia
(PA): Lea and Febiger. p. 32–69.
Lane N. 2006. Power, sex, suicide: mitochondria and the meaning of
life. New York: Oxford Univ Press.
Lane N. Forthcoming. 2011a. The evolutionary tradeoffs of breathing.
Science.
Lane N. Forthcoming. 2011b. Mitonuclear match: optimizing fitness and
fertility over generations drives ageing within generations. BioEssays.
Lehmann G, Segal E, Muradian KK, Fraifeld VE. 2008. Do mitochondrial
DNA and metabolic rate complement each other in determination of
the mammalian maximum longevity? Rejuvenation Res. 11:409–417.
Lenaz G, Genova ML. 2009. Structural and functional organization of
the mitochondrial respiratory chain: a dynamic super-assembly. Int J
Biochem Cell Biol. 41:1750–1772.
Min XJ, Hickey DA. 2008. An evolutionary footprint of age-related
natural selection in mitochondrial DNA. J Mol Evol. 67:412–417.
Moosmann B, Behl C. 2008. Mitochondrially encoded cysteine predicts
animal lifespan. Aging Cell 7:32–46.
Moser CC, Page CC, Dutton PL. 2006. Darwin at the molecular scale:
selection and variance in electron tunnelling proteins including
cytochrome c oxidase. Phil Trans Roy Soc B. 361:1295–1305.
Nabholz B, Glemin S, Galtier N. 2009. The erratic mitochondrial clock:
variations of mutation rate, not population size, affect mtDNA
diversity across birds and mammals. BMC Evol Biol. 9:54.
NCBI Genome Database [Internet]. Bethesda (MD): The National Center
for Biotechnology Information [cited 2011 Jun 25]. Available from:
http://www.ncbi.nlm.nih.gov/genomes/.
Nikaido M, Rooney AP, Okada N. 1999. Phylogenetic relationships
among cetartiodactyls based on insertions of short and long
interpersed elements: hippopotamuses are the closest extant
relatives of whales. Proc Natl Acad Sci USA. 96:10261–10266.
Pamplona R, Barja G. 2007. Highly resistant macromolecular compo-
nents and low rate of generation of endogenous damage: two key
traits of longevity. Ageing Res Rev. 6:189–210.
Pamplona R, Barja G, Portero-Otın M. 2002. Membrane fatty acid
unsaturation, protection against oxidative stress, and maximum life
span: a homeoviscous-longevity adaptation? Ann N Y Acad Sci.
959:475–990.
Peters RH. 1986. The ecological implications of body size. Cambridge:
Cambridge University Press. p. 329. ISBN 0-521-2886-x.
Pontzera H, Raichlenb DA, Shumakerc RW, Ocobocka C, Wiche SA.
2010. Metabolic adaptation for low energy throughput in orang-
utans. Proc Natl Acad Sci USA. 107:14048–14052.
Porter RK. 2001. Allometry of mammalian cellular oxygen consumption.
Cell Mol Life. 58:815–822.
Porter RK, Brand MD. 1995. Causes of the difference in respiration rates
from mammals of different body mass. Am J Physiol.
269:R1213–R1224.
Reyes A, Gissi C, Pesole G, Saccone C. 1998. Asymmetrical directional
mutation pressure in the mitochondrial genome of mammals. Mol
Biol Evol. 15:957–966.
Rottenberg H. 2007. Coevolution of exceptional longevity, exceptionally
high metabolic rates, and mitochondrial DNA-coded proteins in
mammals. Exp Gerontol. 42(4):364–373.
Schindeldecker M, Stark M, Behl C, Moosmann B. 2011. Differential
cysteine depletion in respiratory chain complexes enables the
distinction of longevity from aerobicity. Mech Ageing Dev.
132(4):171–179.
Schmitz J, Ohme M, Zischler H. 2002. The complete mitochondrial
sequence of Tarsius bancanus: evidence for an extensive nucleotide
compositional plasticity of primate mitochondrial DNA. Mol Biol
Evol. 19:544–553.
Secor SM. 2003. Gastric function and its contribution to the post-
prandial metabolic response of the Burmese python Python
molurus. J Exp Biol. 206:1621–1630.
Secor SM, Diamond J. 1995. Adaptive responses to feeding in Burmese
pythons: pay before pumping. J Exp Biol. 198:1313–1325.
Speakman JR. 2005. Body size, energy metabolism and lifespan.
J Exp.Biol. 208:717–1730.
Spradling T, Hafner M, Demastes J. 2001. Differences in rate of
cytochrome-b evolution among species of rodents. J Mammal.
82:65–80.
Twig G, Shirihai OS. 2011. The interplay between mitochondrial
dynamics and mitophagy. Antioxid Redox Signal. 14:1939–1951.
Watanabe Y, et al. 2011. Scaling of swim speed in breath-hold divers.
J Anim Ecol. 80:57–68.
Weibel ER, Bacigalupe LD, Schmitt B, Hoppeler H. 2004. Allometric
scaling of maximal metabolic rate in mammals: muscle aerobic
capacity as determinant factor. Respir Physiol Neurobiol.
140(2):115–132.
Weibel ER, Hoppeler H. 2005. Exercise-induced maximal metabolic rate
scales with muscle aerobic capacity. J Exp Biol. 208(Pt 9):1635–1644.
Welch JJ, Bininda-Emonds OR, Bromham L. 2008. Correlates of
substitution rate variation in mammalian protein-coding sequences.
BMC Evol Biol. 8:53.
Associate editor: Bill Martin
Kitazoe et al. GBE
1244 Genome Biol. Evol. 3:1233–1244. doi:10.1093/gbe/evr079 Advance Access publication August 7, 2011