Embed Size (px)
Citation preview
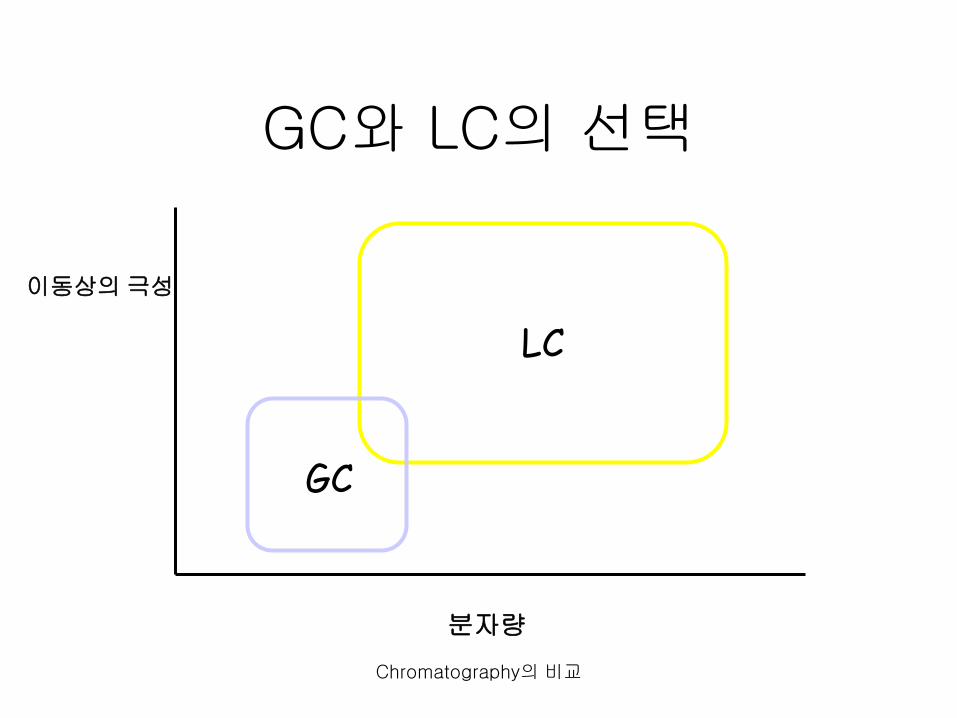
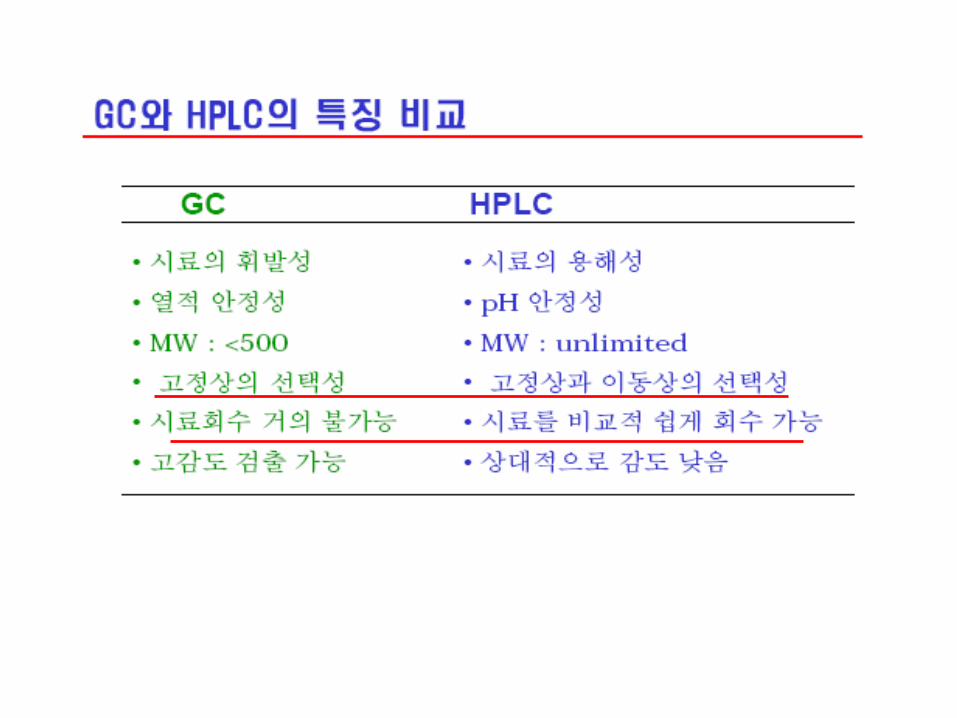
Chromatography의 비교
GC와 LC의 선택
이동상의 극성
분자량
LC
GC
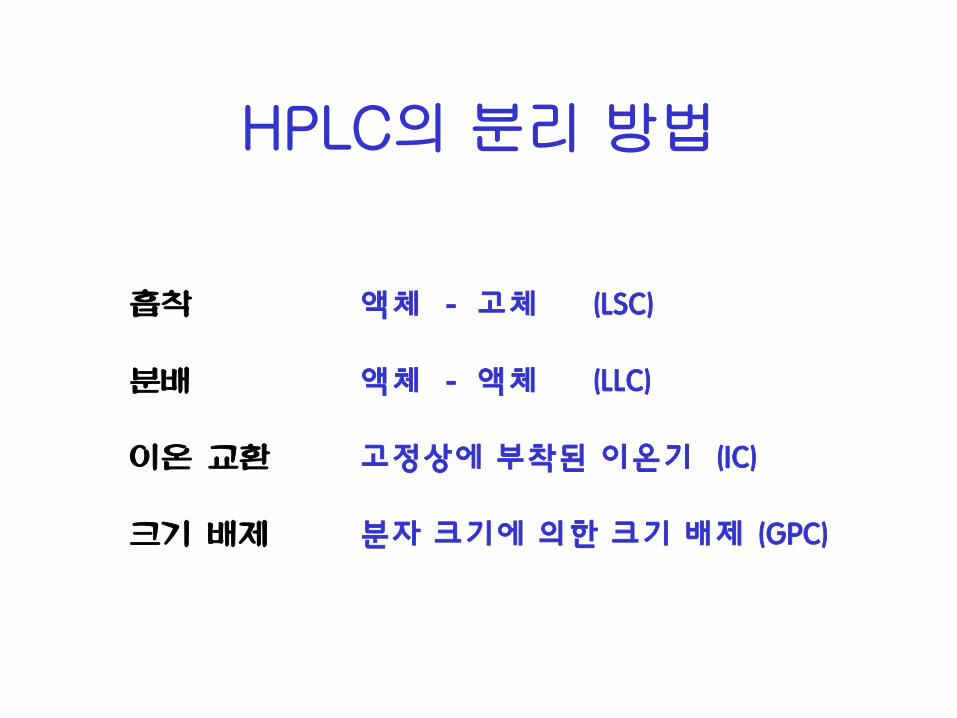
HPLC의 분리 방법
흡착 분배 이온 교환 크기 배제
액체 - 고체 (LSC) 액체 - 액체 (LLC) 고정상에 부착된 이온기 (IC) 분자 크기에 의한 크기 배제 (GPC)
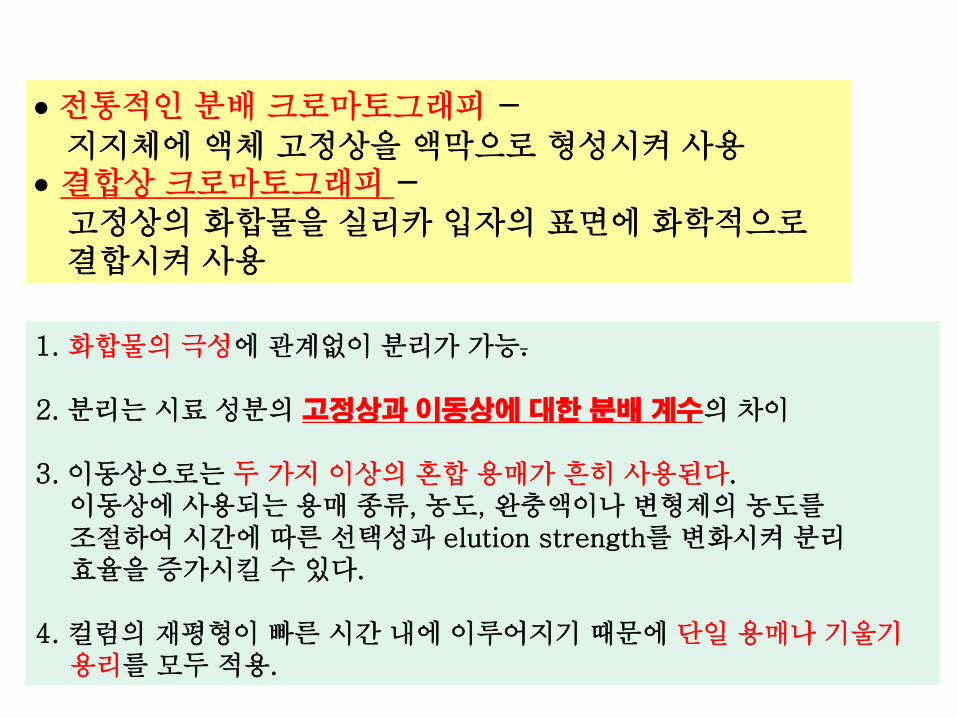
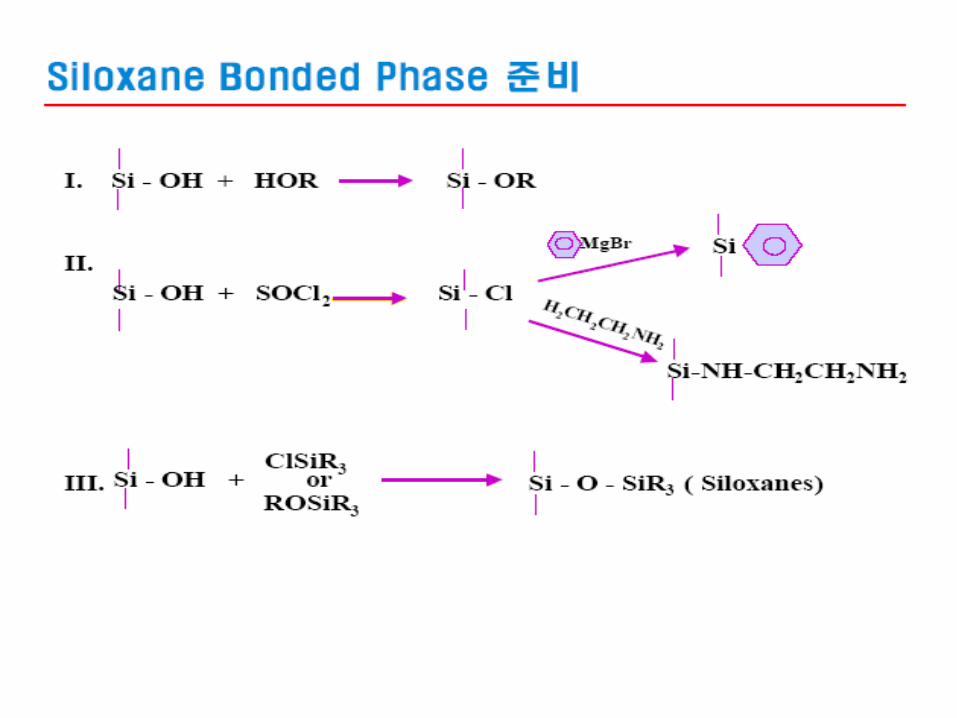
전통적인 분배 크로마토그래피 - 지지체에 액체 고정상을 액막으로 형성시켜 사용 결합상 크로마토그래피 - 고정상의 화합물을 실리카 입자의 표면에 화학적으로 결합시켜 사용
1. 화합물의 극성에 관계없이 분리가 가능. 2. 분리는 시료 성분의 고정상과 이동상에 대한 분배 계수의 차이 3. 이동상으로는 두 가지 이상의 혼합 용매가 흔히 사용된다. 이동상에 사용되는 용매 종류, 농도, 완충액이나 변형제의 농도를 조절하여 시간에 따른 선택성과 elution strength를 변화시켜 분리 효율을 증가시킬 수 있다. 4. 컬럼의 재평형이 빠른 시간 내에 이루어지기 때문에 단일 용매나 기울기 용리를 모두 적용.
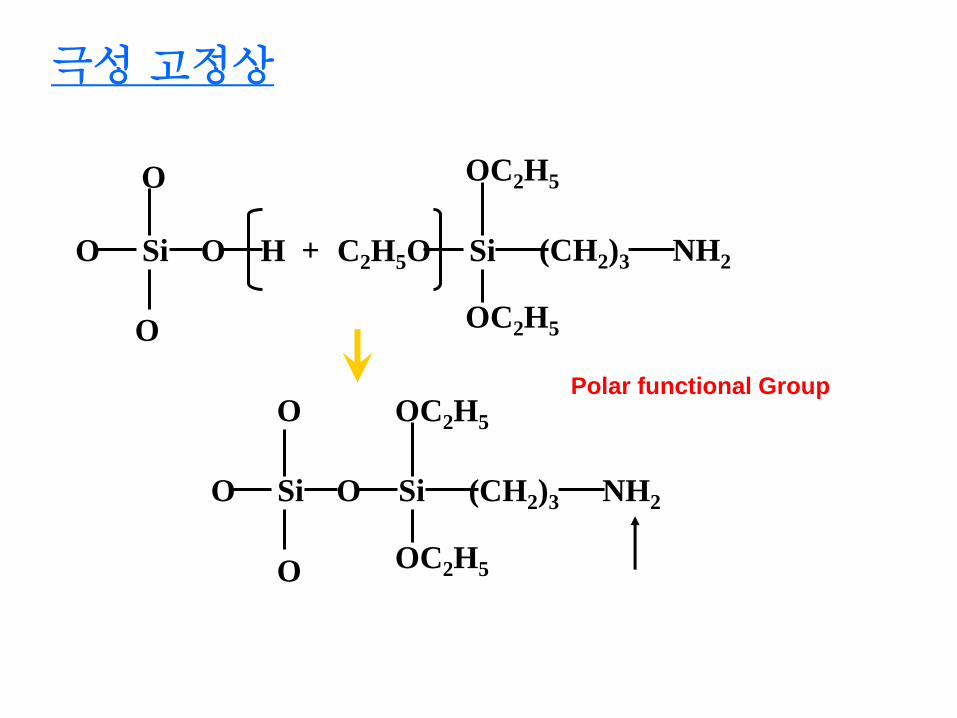
극성 고정상
Polar functional Group
O Si O H C2H5O Si
OC2H5
OC2H5
(CH2)3 NH2 +
O
O
O Si O Si
OC2H5
OC2H5
(CH2)3 NH2
O
O
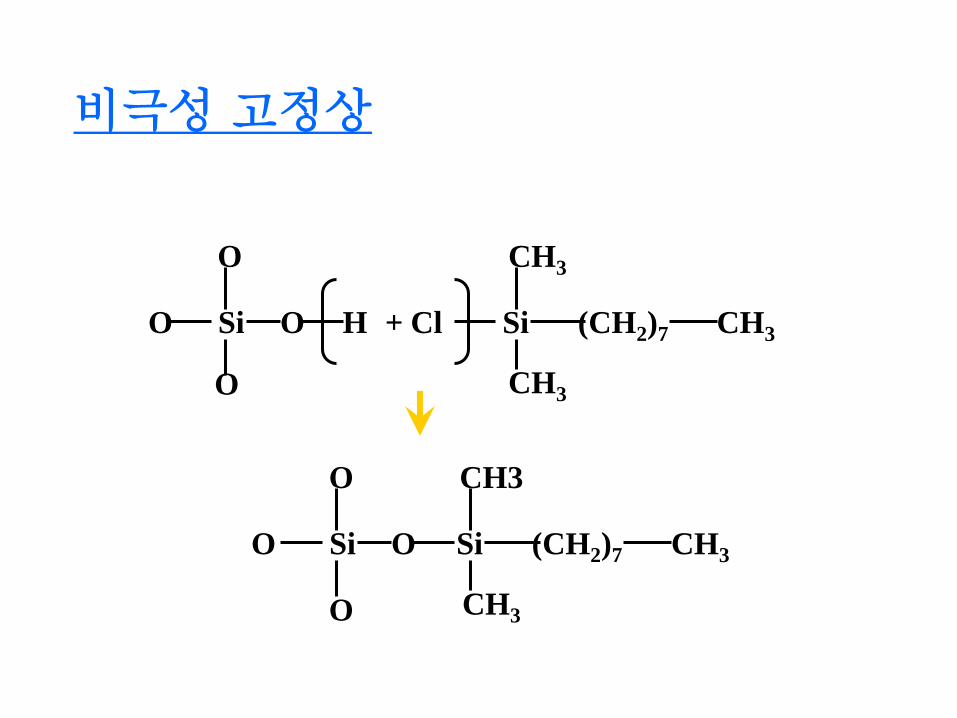
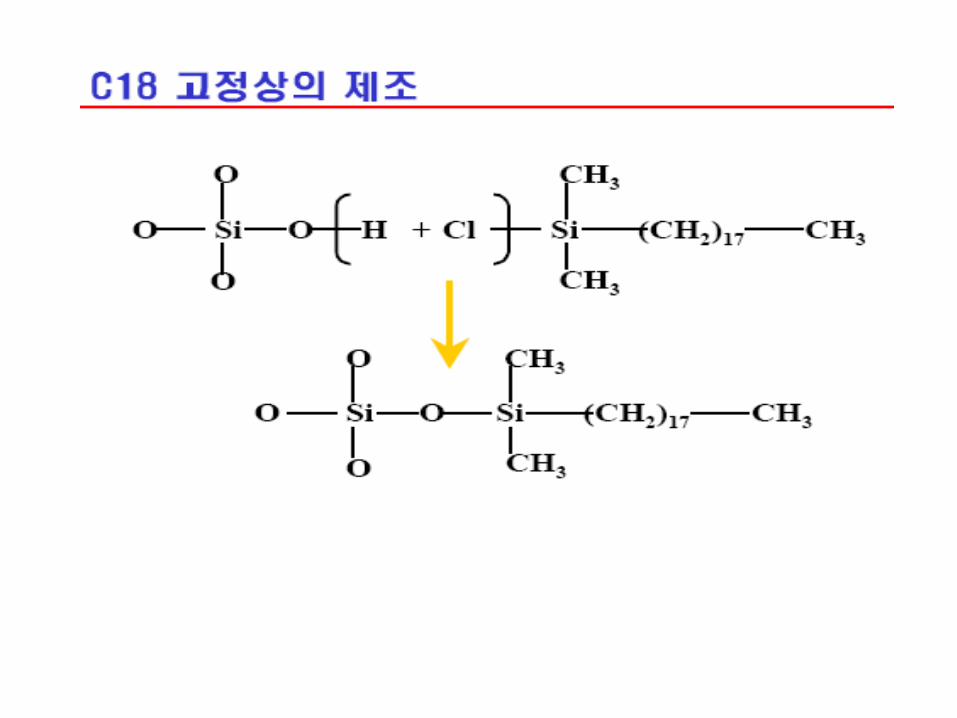
비극성 고정상
O Si O H Cl Si
CH3
CH3
(CH2)7 CH3 +
O
O
O Si O Si
CH3
CH3
(CH2)7 CH3
O
O
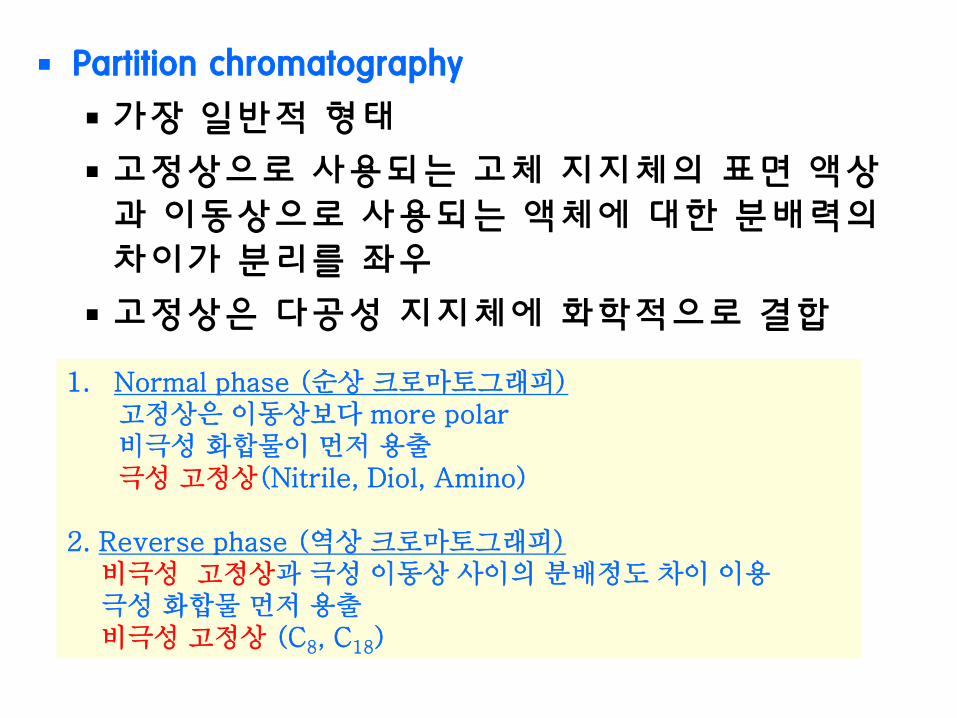
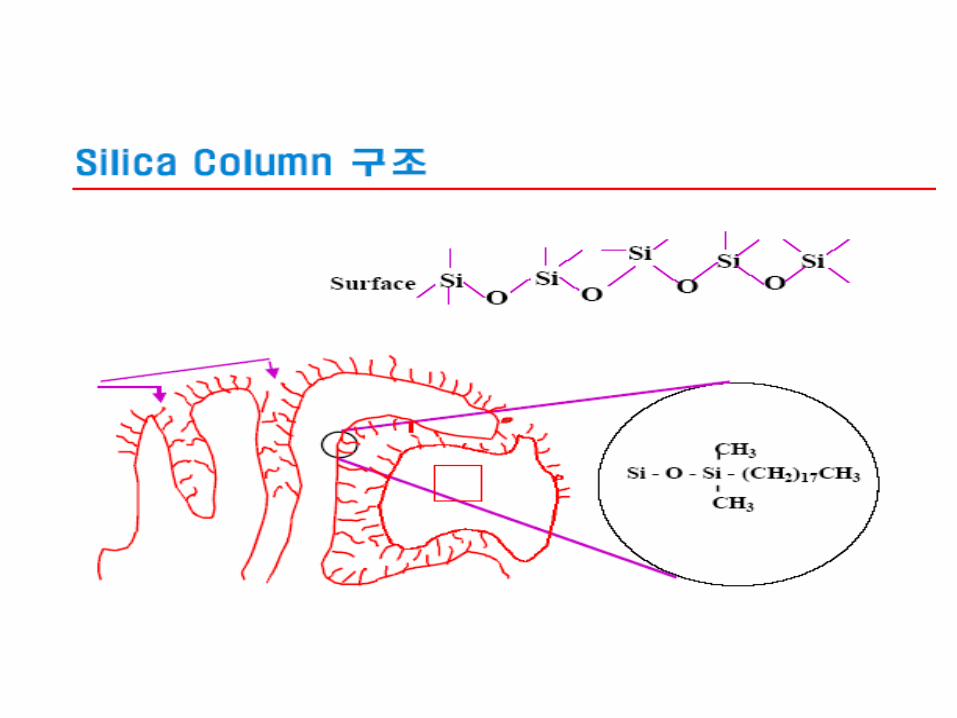
Partition chromatography
가장 일반적 형태
고정상으로 사용되는 고체 지지체의 표면 액상과 이동상으로 사용되는 액체에 대한 분배력의 차이가 분리를 좌우
고정상은 다공성 지지체에 화학적으로 결합
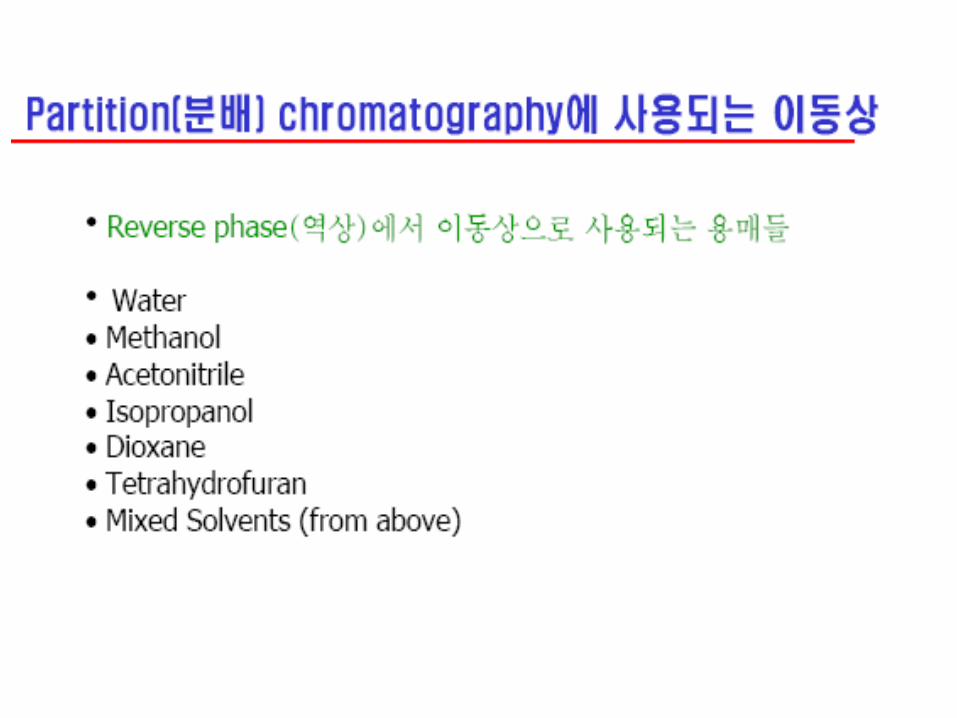
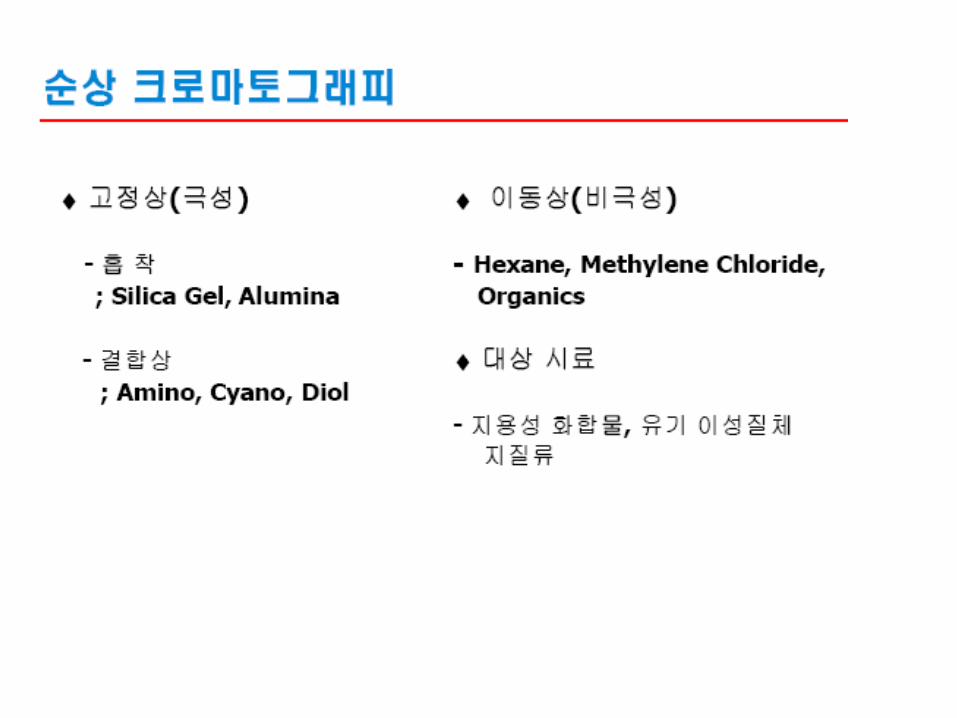
1. Normal phase (순상 크로마토그래피) 고정상은 이동상보다 more polar 비극성 화합물이 먼저 용출 극성 고정상(Nitrile, Diol, Amino) 2. Reverse phase (역상 크로마토그래피) 비극성 고정상과 극성 이동상 사이의 분배정도 차이 이용 극성 화합물 먼저 용출 비극성 고정상 (C8, C18)
11
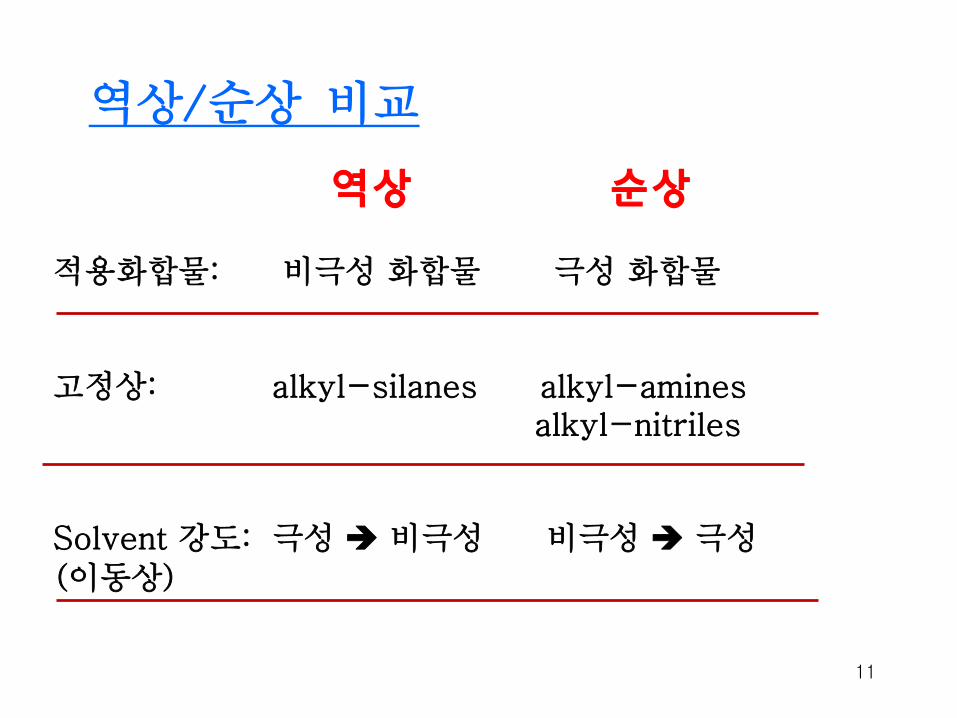
역상/순상 비교
역상 순상
적용화합물: 비극성 화합물 극성 화합물
고정상: alkyl-silanes alkyl-amines alkyl-nitriles
Solvent 강도: 극성 비극성 비극성 극성 (이동상)
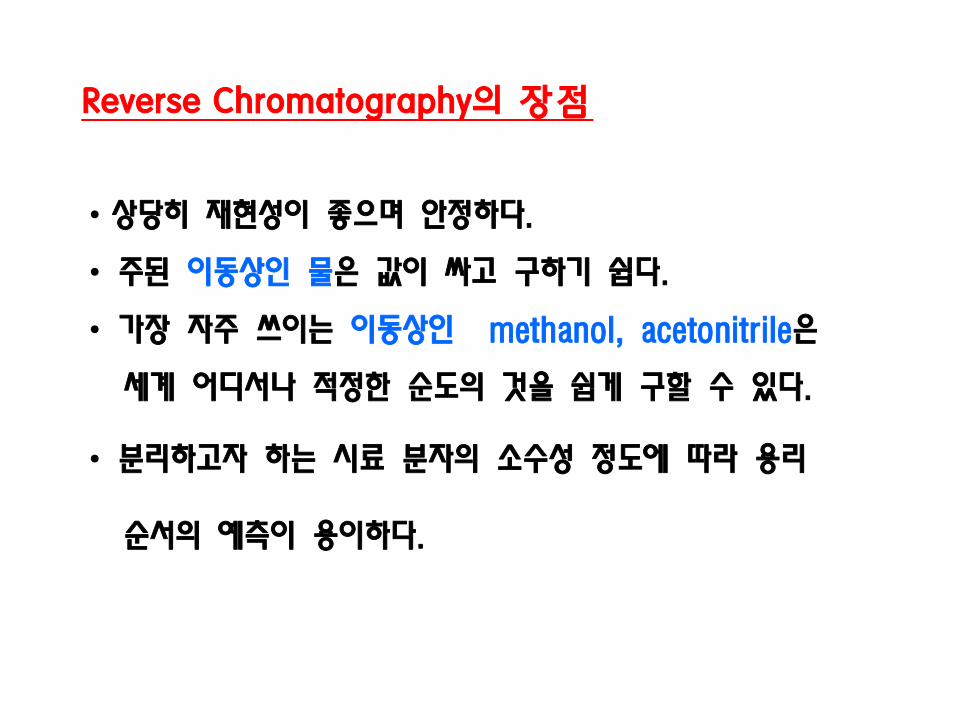
Reverse Chromatography의 장점
• 상당히 재현성이 좋으며 안정하다.
• 주된 이동상인 물은 값이 싸고 구하기 쉽다.
• 가장 자주 쓰이는 이동상인 methanol, acetonitrile은
세계 어디서나 적정한 순도의 것을 쉽게 구할 수 있다.
• 분리하고자 하는 시료 분자의 소수성 정도에 따라 용리
순서의 예측이 용이하다.

분배 크로마토그래피의 이동상
Solvent
n-Pentane
Carbon Tetrachloride
Chloroform
Dichloromethane
Tetrahydrofuran
Dioxane
Acetonitrile
Methanol
Water
Reverse Phase
Normal Phase
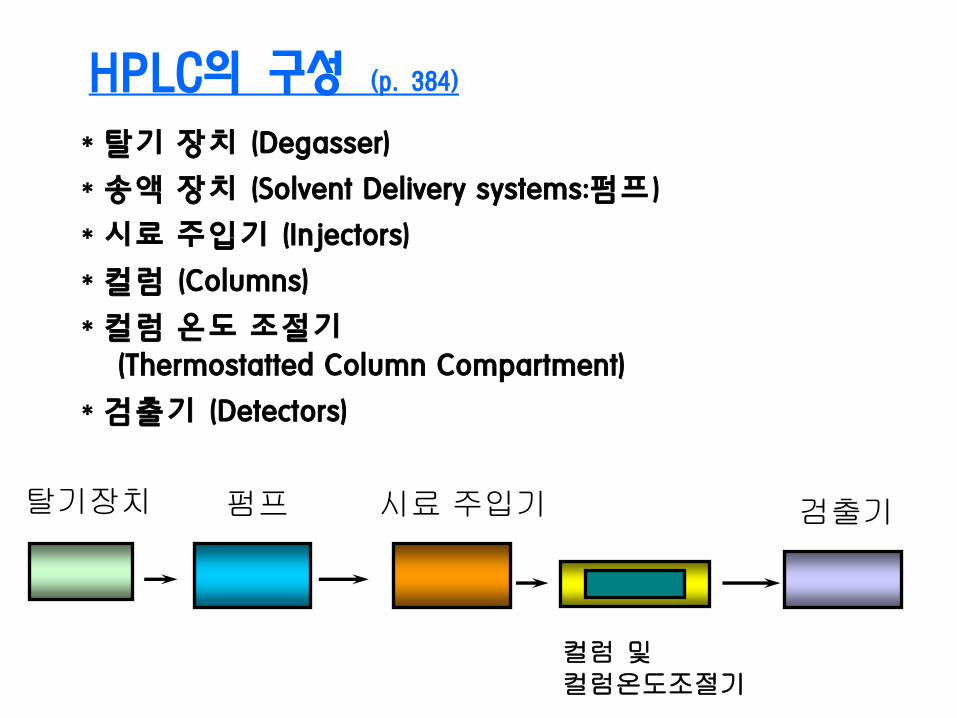
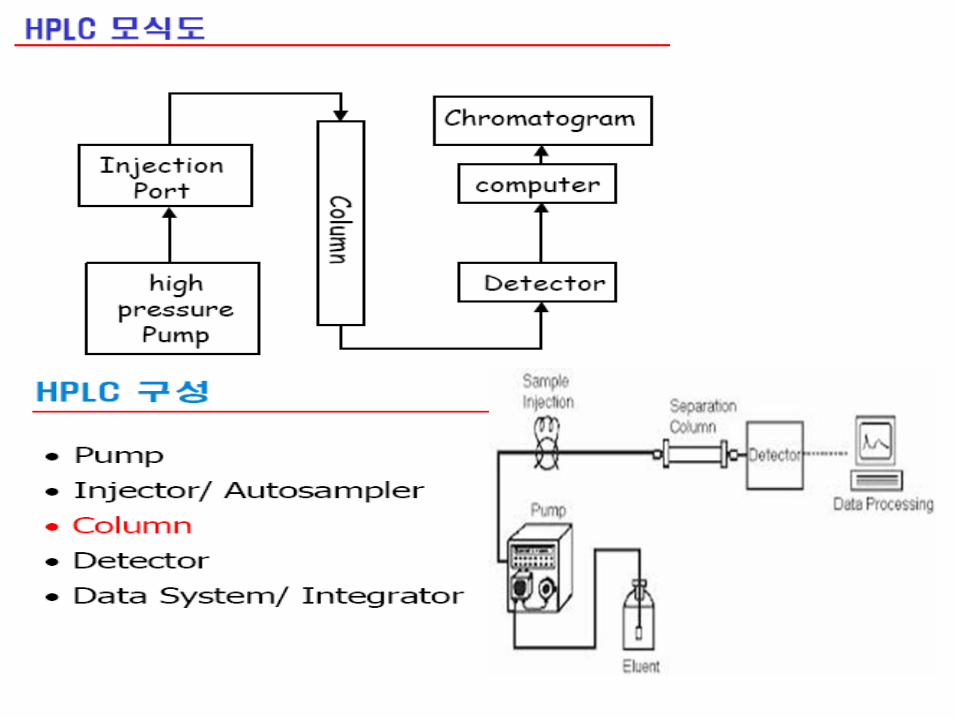
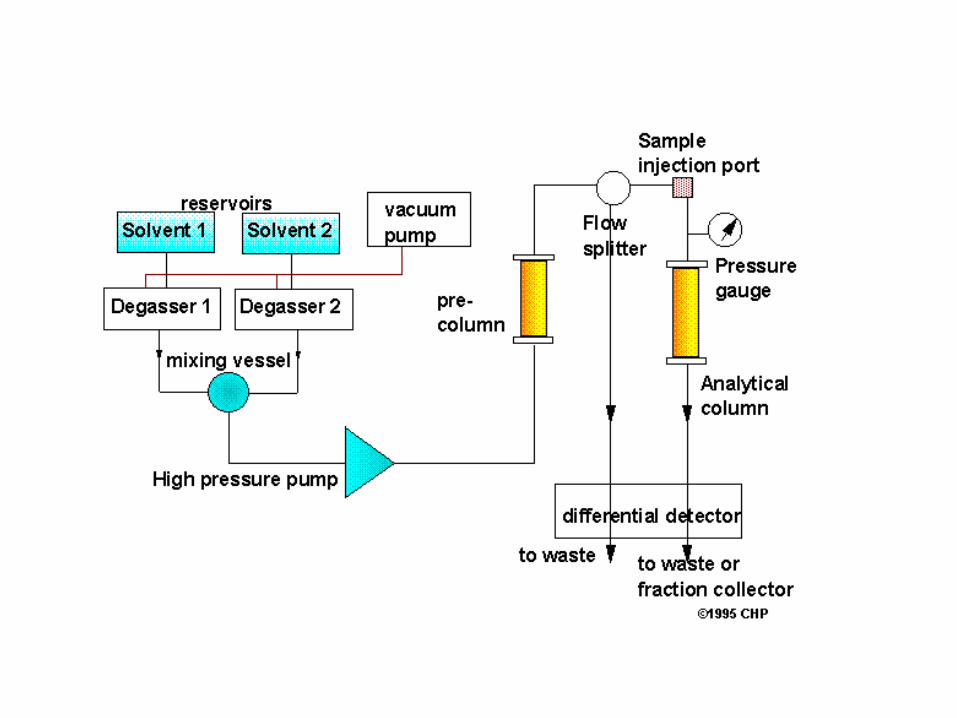
HPLC의 구성 (p. 384)
* 탈기 장치 (Degasser)
* 송액 장치 (Solvent Delivery systems:펌프)
* 시료 주입기 (Injectors)
* 컬럼 (Columns)
* 컬럼 온도 조절기 (Thermostatted Column Compartment)
* 검출기 (Detectors)
탈기장치 펌프 시료 주입기
컬럼 및 컬럼온도조절기
검출기
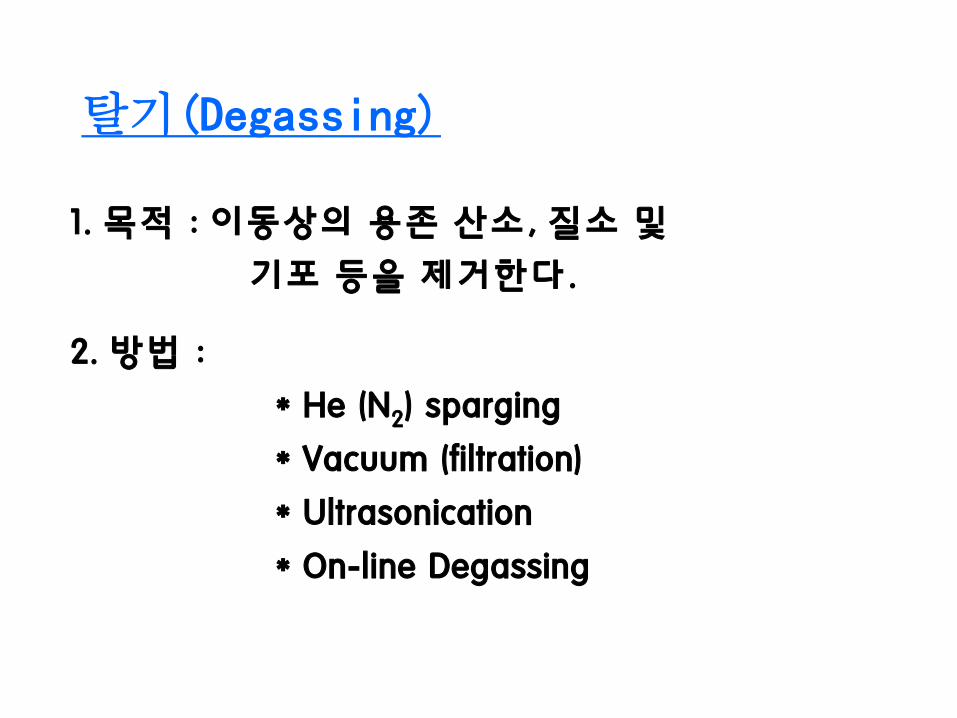
탈기(Degassing) 1. 목적 : 이동상의 용존 산소, 질소 및
기포 등을 제거한다.
2. 방법 :
* He (N2) sparging
* Vacuum (filtration)
* Ultrasonication
* On-line Degassing
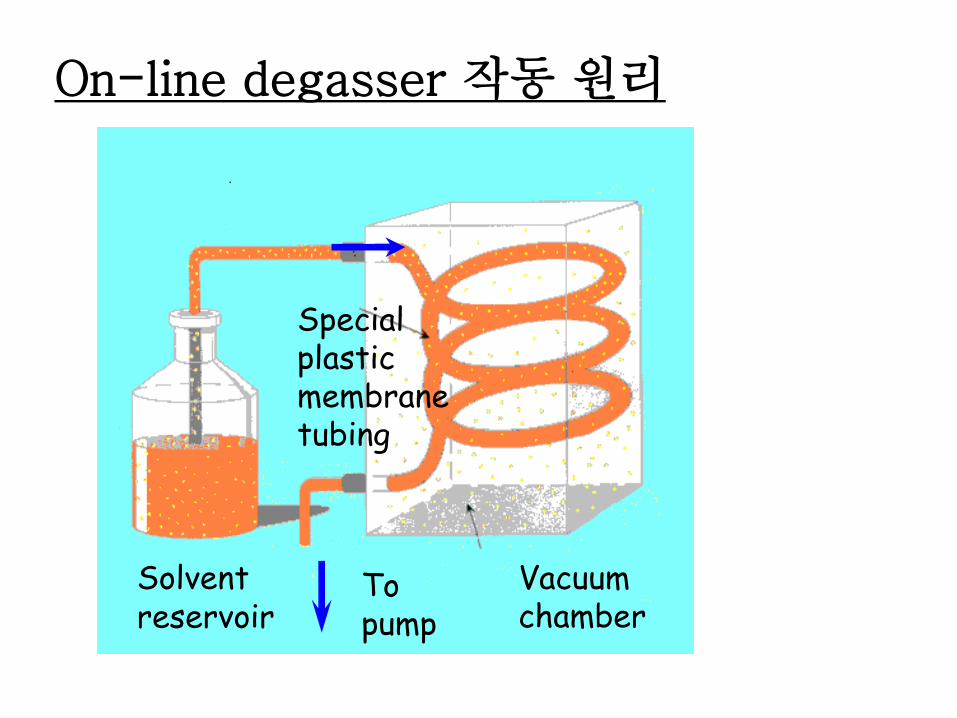
On-line degasser 작동 원리
Special plastic membrane tubing
Solvent reservoir
To pump
Vacuum chamber
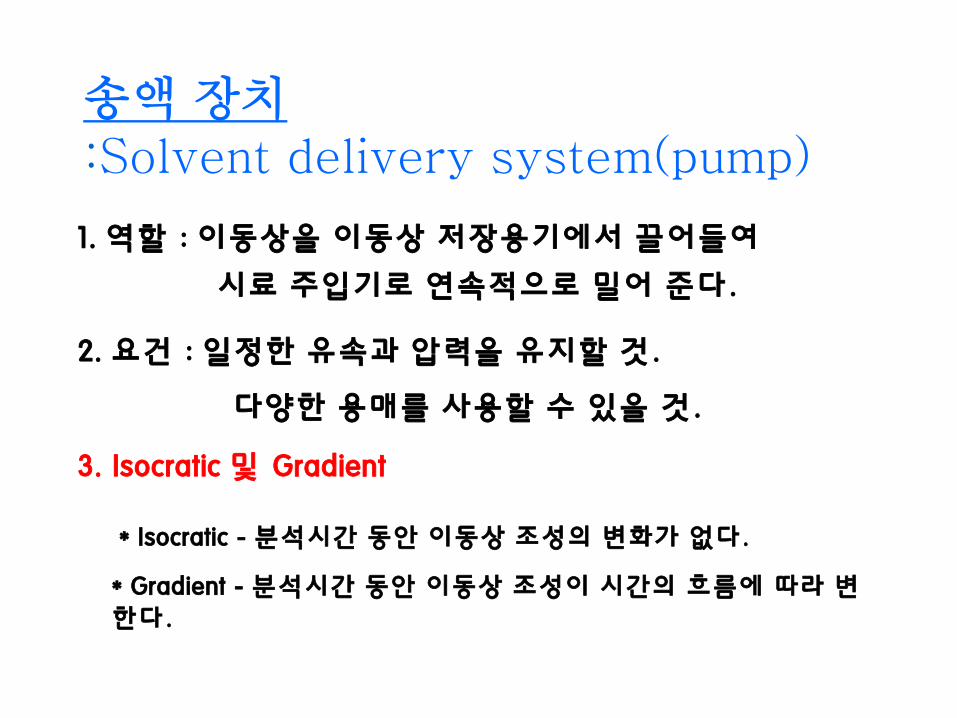
송액 장치 :Solvent delivery system(pump)
1. 역할 : 이동상을 이동상 저장용기에서 끌어들여
시료 주입기로 연속적으로 밀어 준다.
2. 요건 : 일정한 유속과 압력을 유지할 것.
다양한 용매를 사용할 수 있을 것.
3. Isocratic 및 Gradient
* Isocratic - 분석시간 동안 이동상 조성의 변화가 없다.
* Gradient - 분석시간 동안 이동상 조성이 시간의 흐름에 따라 변한다.
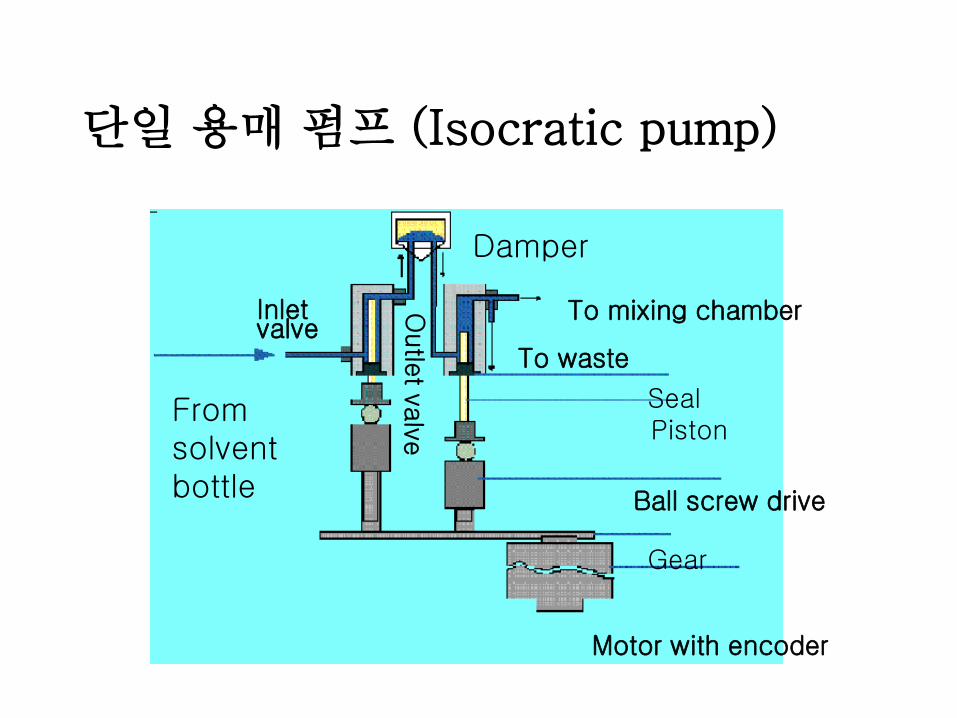
단일 용매 펌프 (Isocratic pump)
From solvent bottle
Inlet valve
To mixing chamber
To waste
Seal Piston
Ball screw drive
Gear
Motor with encoder
Damper
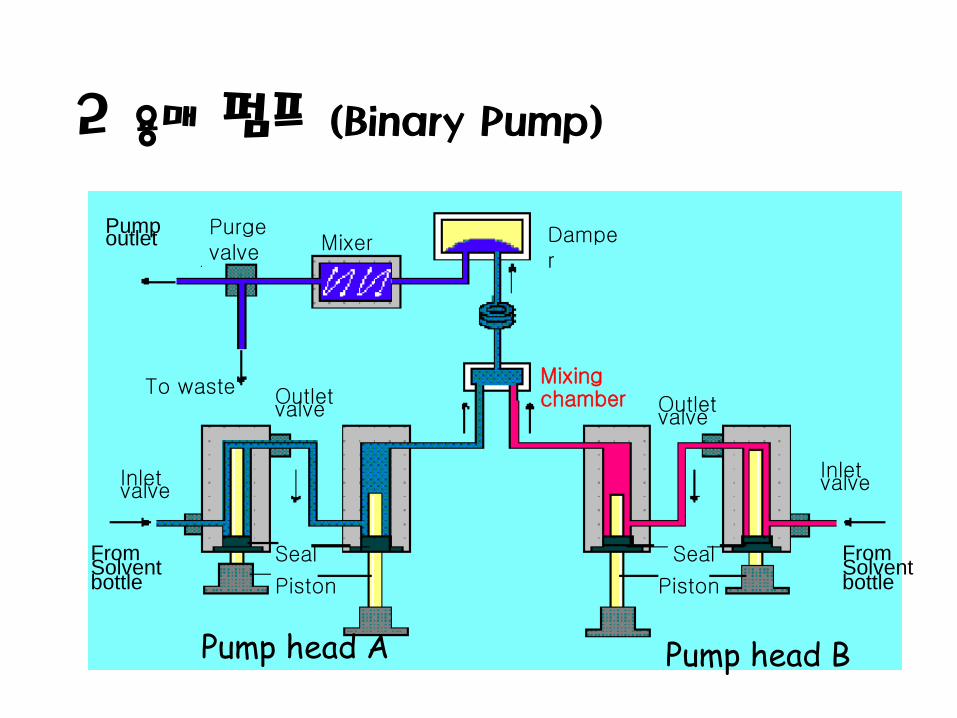
2 용매 펌프 (Binary Pump)
Pump outlet
Purge valve Mixer Dampe
r
To waste Mixing chamber
Inlet valve
From Solvent bottle
Seal
Piston
Seal
Piston
From Solvent bottle
Inlet valve
Pump head A Pump head B
시료 주입기 (Injectors)
1. 역할 : 분석하고자 하는 시료를 용매의
흐름에 실어 준다.
2. 종류 :
* 수동 (Manual Injection Valve)
* 자동 (Auto Injector)
Injector
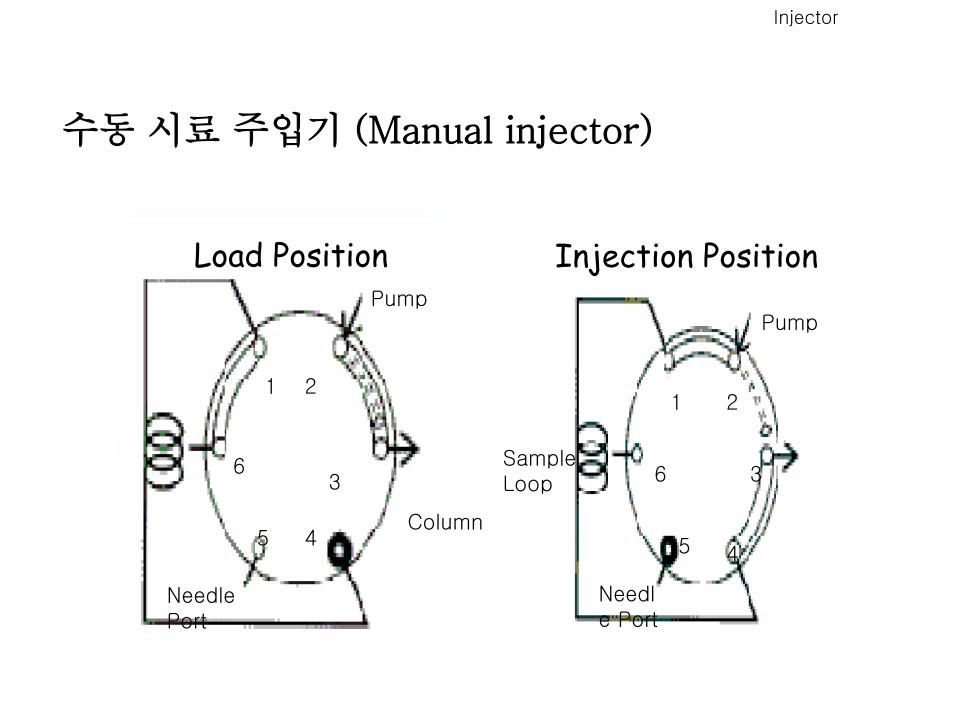
수동 시료 주입기 (Manual injector)
Load Position Pump
Column
2 1
6 3
4 5
Sample Loop
Injection Position
Pump
Column
Needle Port
Sample Loop
1 2
3
4 5
6
Needle Port
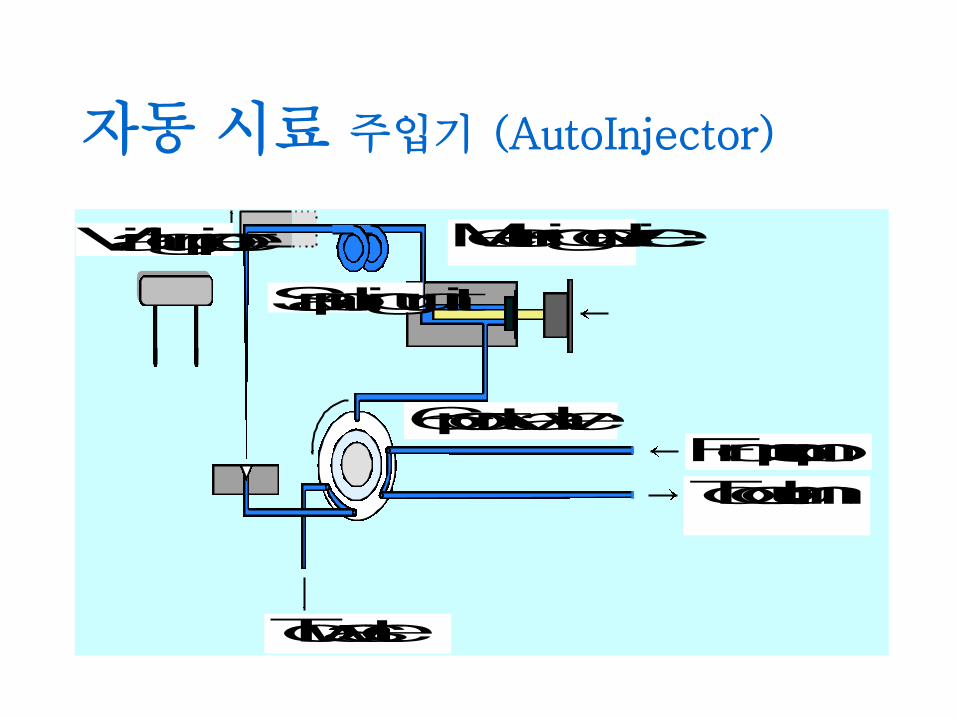
자동 시료 주입기 (AutoInjector)
From pump
To column
Metering device
6-port valve
Sampling unit
To waste
Vial gripper
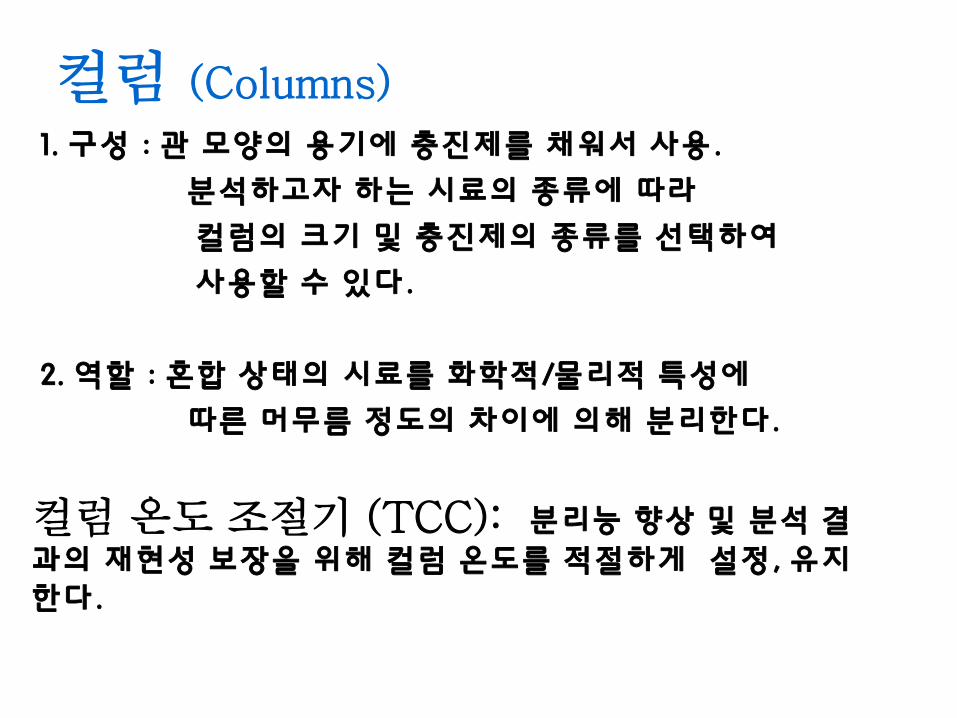
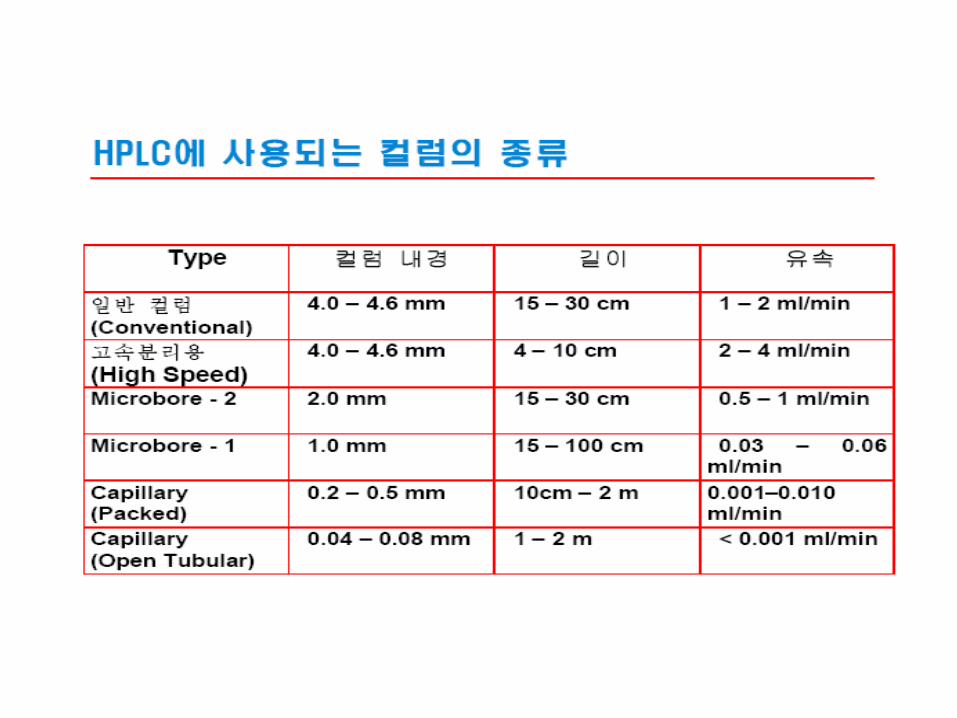
컬럼 (Columns)
1. 구성 : 관 모양의 용기에 충진제를 채워서 사용.
분석하고자 하는 시료의 종류에 따라
컬럼의 크기 및 충진제의 종류를 선택하여
사용할 수 있다.
2. 역할 : 혼합 상태의 시료를 화학적/물리적 특성에
따른 머무름 정도의 차이에 의해 분리한다.
컬럼 온도 조절기 (TCC): 분리능 향상 및 분석 결
과의 재현성 보장을 위해 컬럼 온도를 적절하게 설정, 유지한다.
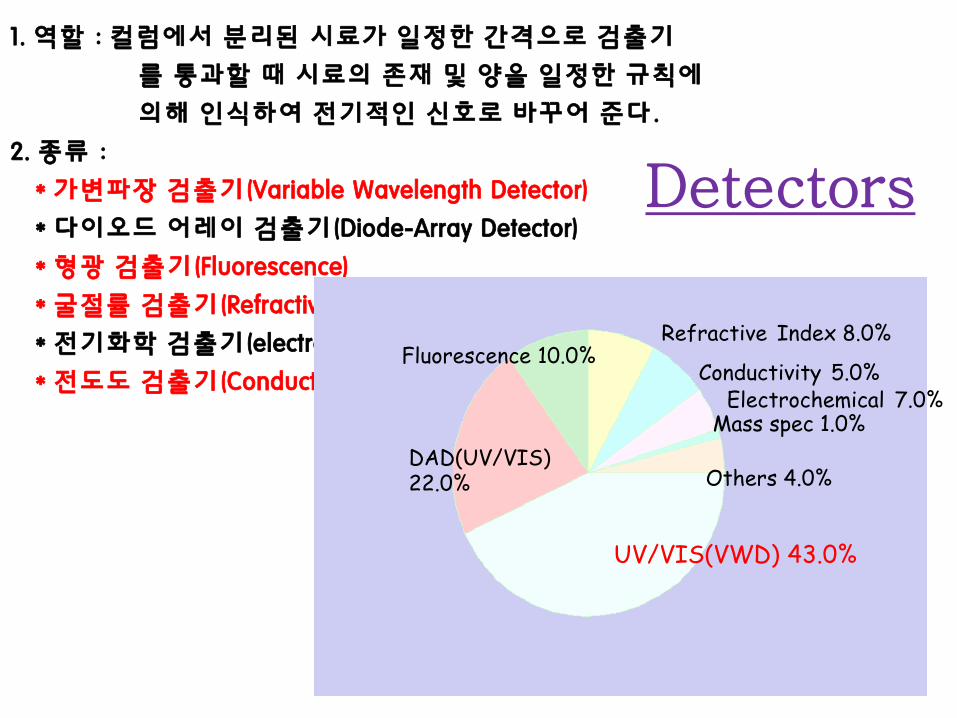
Detectors
1. 역할 : 컬럼에서 분리된 시료가 일정한 간격으로 검출기
를 통과할 때 시료의 존재 및 양을 일정한 규칙에
의해 인식하여 전기적인 신호로 바꾸어 준다.
2. 종류 :
* 가변파장 검출기(Variable Wavelength Detector)
* 다이오드 어레이 검출기(Diode-Array Detector)
* 형광 검출기(Fluorescence)
* 굴절률 검출기(Refractive Detector)
* 전기화학 검출기(electrochemical Detector)
* 전도도 검출기(Conductivity Detector) Fluorescence 10.0%
DAD(UV/VIS) 22.0%
Refractive Index 8.0%
Others 4.0%
UV/VIS(VWD) 43.0%
Electrochemical 7.0% Conductivity 5.0%
Mass spec 1.0%
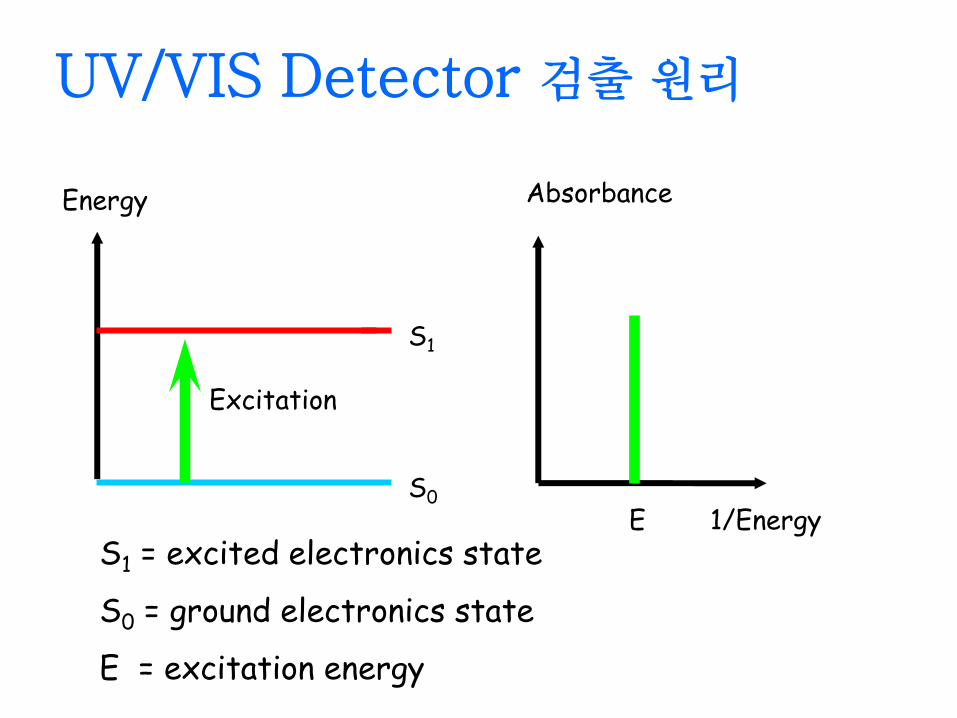
UV/VIS Detector 검출 원리
Energy
Excitation
S1
S0
Absorbance
1/Energy E S1 = excited electronics state
S0 = ground electronics state
E = excitation energy
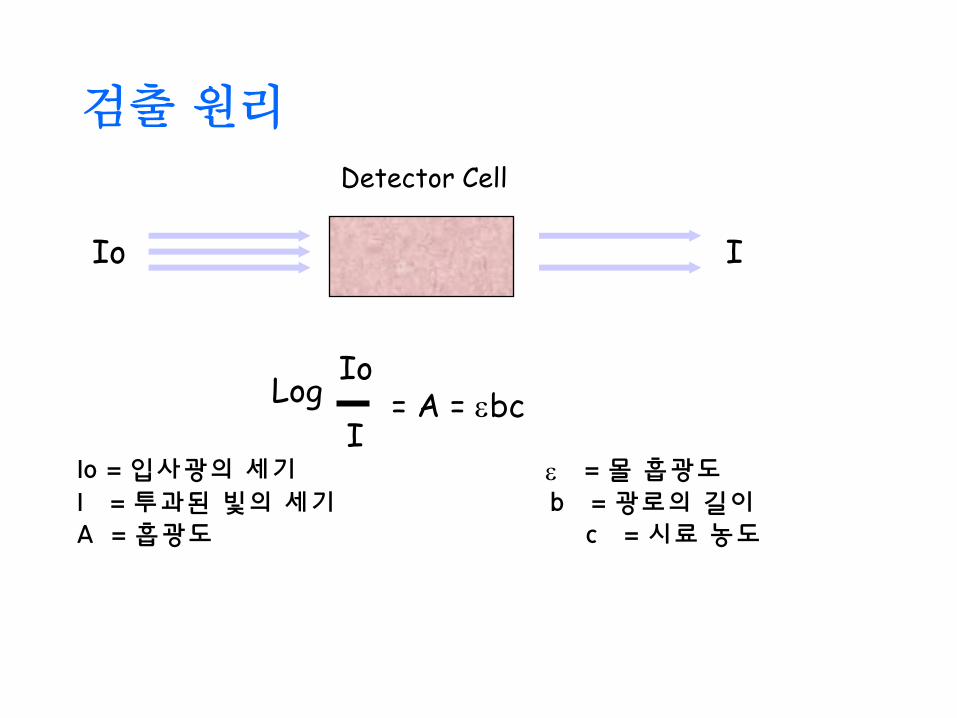
검출 원리
Detector Cell
Io I
Log Io
I = A = bc
Io = 입사광의 세기 = 몰 흡광도 I = 투과된 빛의 세기 b = 광로의 길이 A = 흡광도 c = 시료 농도
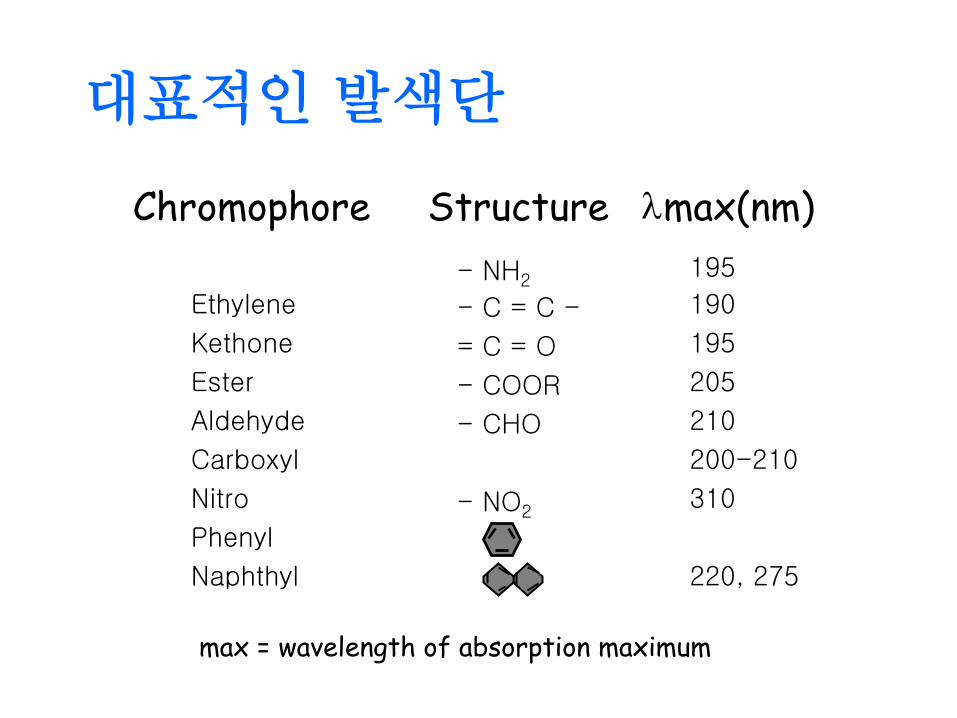
대표적인 발색단
Chromophore Structure l max(nm)
l max = wavelength of absorption maximum
Amine - NH2 195
Ethylene - C = C - 190
Kethone = C = O 195
Ester - COOR 205
Aldehyde - CHO 210
Carboxyl - COOH 200-210
Nitro - NO2 310
Phenyl 202, 255
Naphthyl 220, 275

Fluorescence Detector검출 원리
Absorption(excitation) Emission
Eo
E*
Eo
E*
E E
Ea = E* - Eo ex) : 빛, 화학 에너지
Ee = E* - Eo ex) : 열, 빛

Refractive Index Detector 검출 원리
Reference compartment
Sample compartment
1
2
n = n1
n2 =
sin2 sin1
Tangent = n1
(n1 - n2)
n : medium 1에 대한 medium 2의 굴절 지수 n1 n2 : medium 1,2 의 굴절 지수 1 2 : medium 1,2에 투사되는 광원의 각도 : reference cell 과 sample cell의 굴절 차이
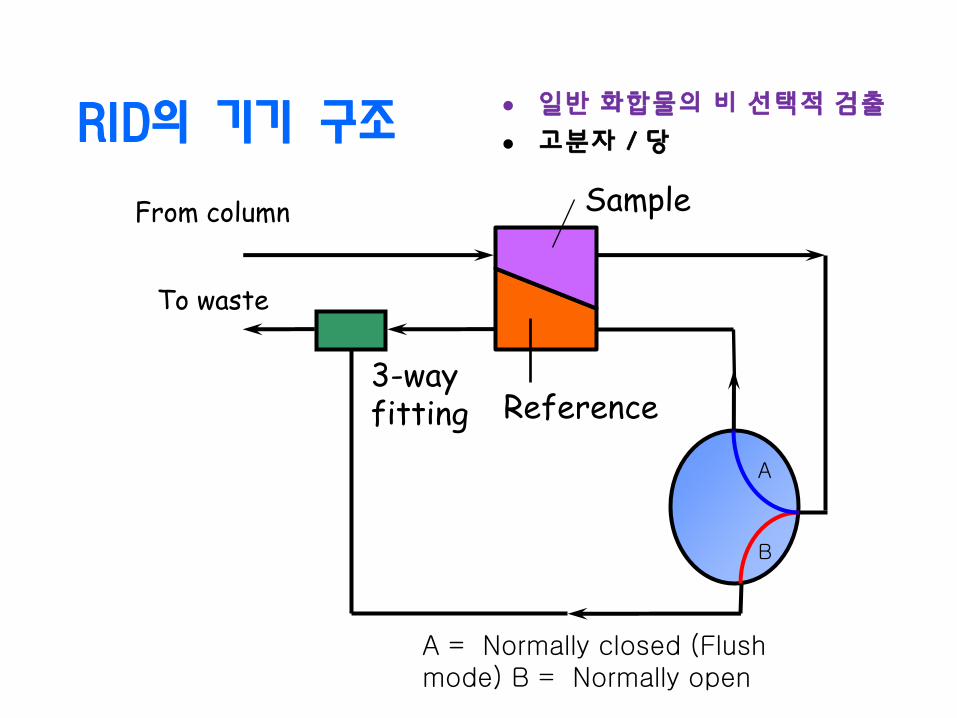
RID의 기기 구조
From column Sample
Reference 3-way fitting
A
B
A = Normally closed (Flush mode) B = Normally open
To waste
일반 화합물의 비 선택적 검출
고분자 / 당
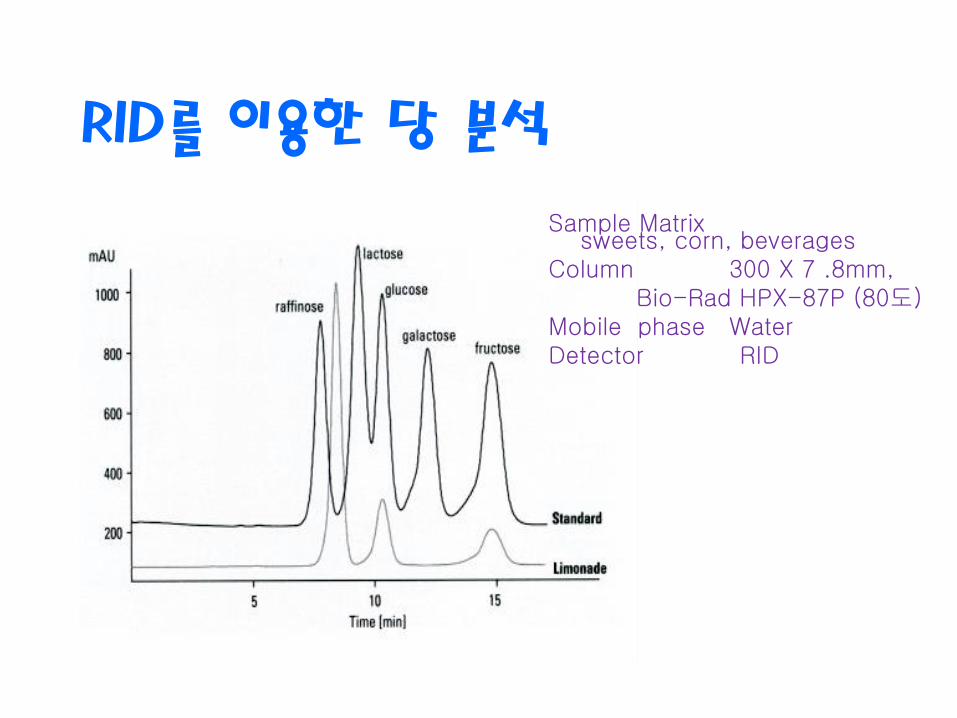
RID를 이용한 당 분석
Sample Matrix sweets, corn, beverages Column 300 X 7 .8mm, Bio-Rad HPX-87P (80도) Mobile phase Water Detector RID

Conductivity Detector검출 원리
R = KA
1
R : 두 전극간의 전기적 저항 K : 용액의 전도도 A : 전극의 면적 L : 전극사이의 거리 L/A : 검출실 고유 상수
S (or µS) = R
= KA 1
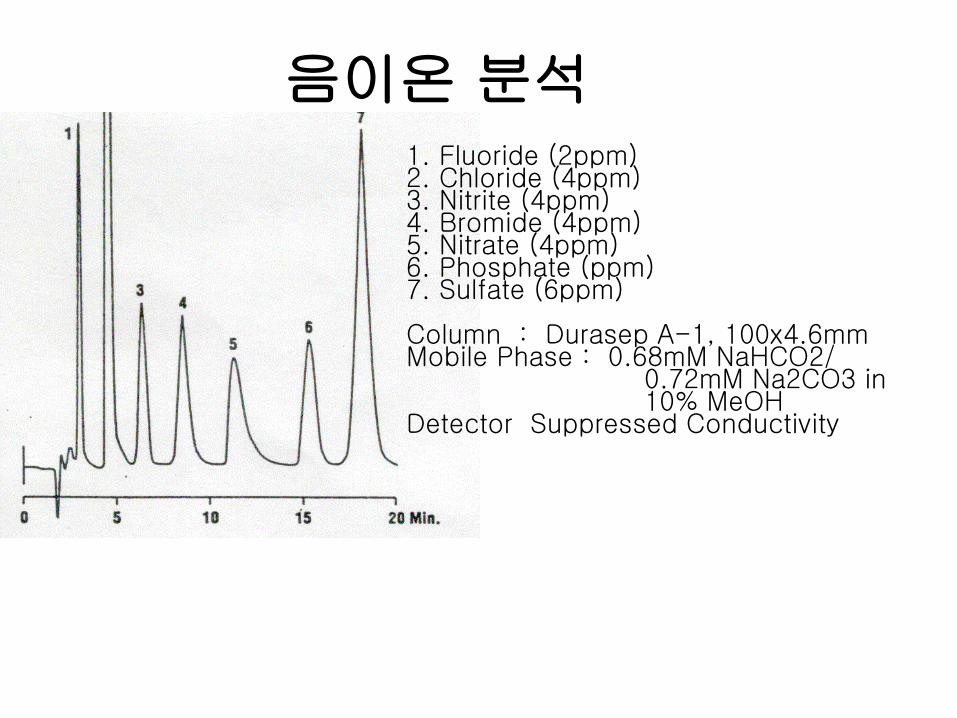
음이온 분석 1. Fluoride (2ppm) 2. Chloride (4ppm) 3. Nitrite (4ppm) 4. Bromide (4ppm) 5. Nitrate (4ppm) 6. Phosphate (ppm) 7. Sulfate (6ppm) Column : Durasep A-1, 100x4.6mm Mobile Phase : 0.68mM NaHCO2/ 0.72mM Na2CO3 in 10% MeOH Detector Suppressed Conductivity
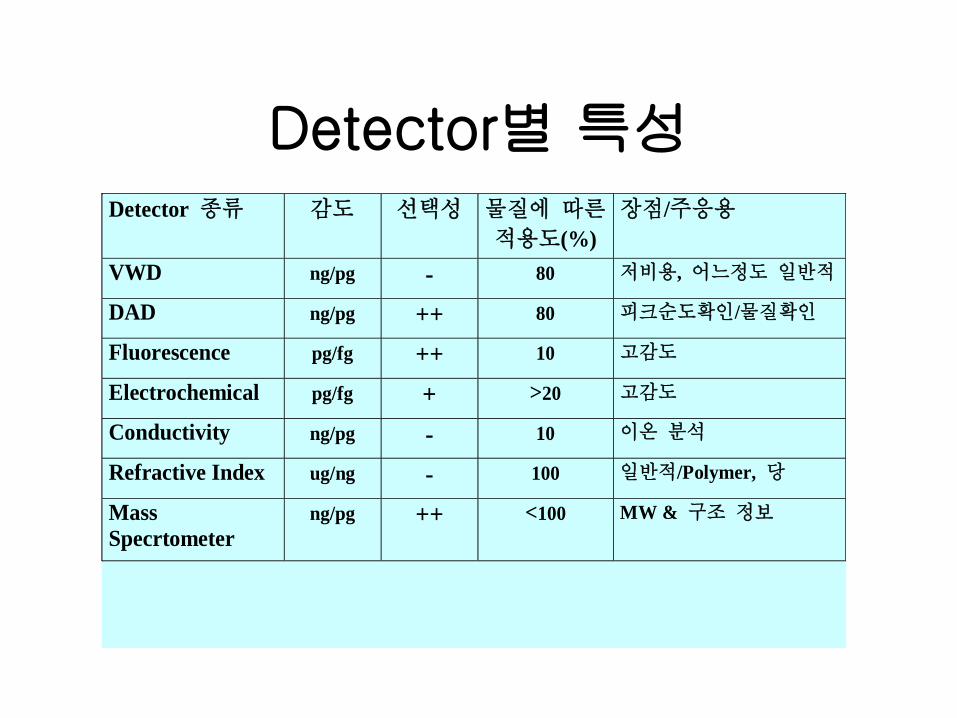
Detector별 특성 Detector 종류 감도 선택성 물질에 따른
적용도(%)
장점/주응용
VWD ng/pg - 80 저비용, 어느정도 일반적
DAD ng/pg ++ 80 피크순도확인/물질확인
Fluorescence pg/fg ++ 10 고감도
Electrochemical pg/fg + >20 고감도
Conductivity ng/pg - 10 이온 분석
Refractive Index ug/ng - 100 일반적/Polymer, 당
Mass
Specrtometer
ng/pg ++ <100 MW & 구조 정보


44
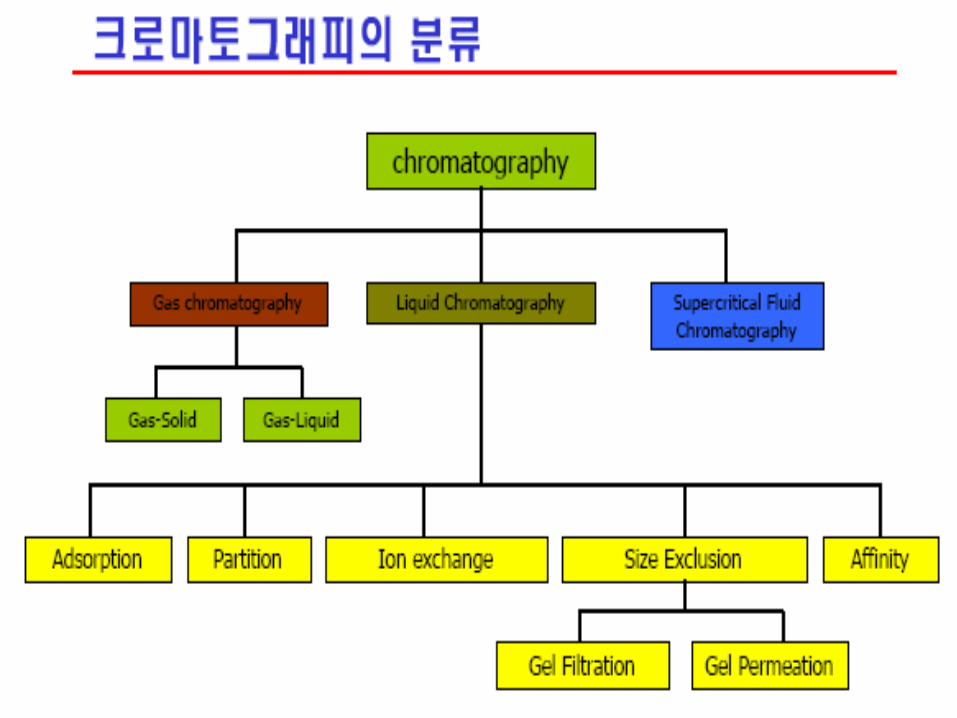
이온 교환 크로마토그래피
고정상 음이온 또는 양이온 교환 수지 폴리스티렌 이나 실리카겔 의 표면에 이온성을
가진 물질을 화학적으로 결합
이동상 aqueous/buffer counter ion
대상 시료 이온성 화합물 및 무기 이온류 시료 분리는 pH, 이온세기, 이동상에 포함된 이온 종류에 영향을 받음.
46
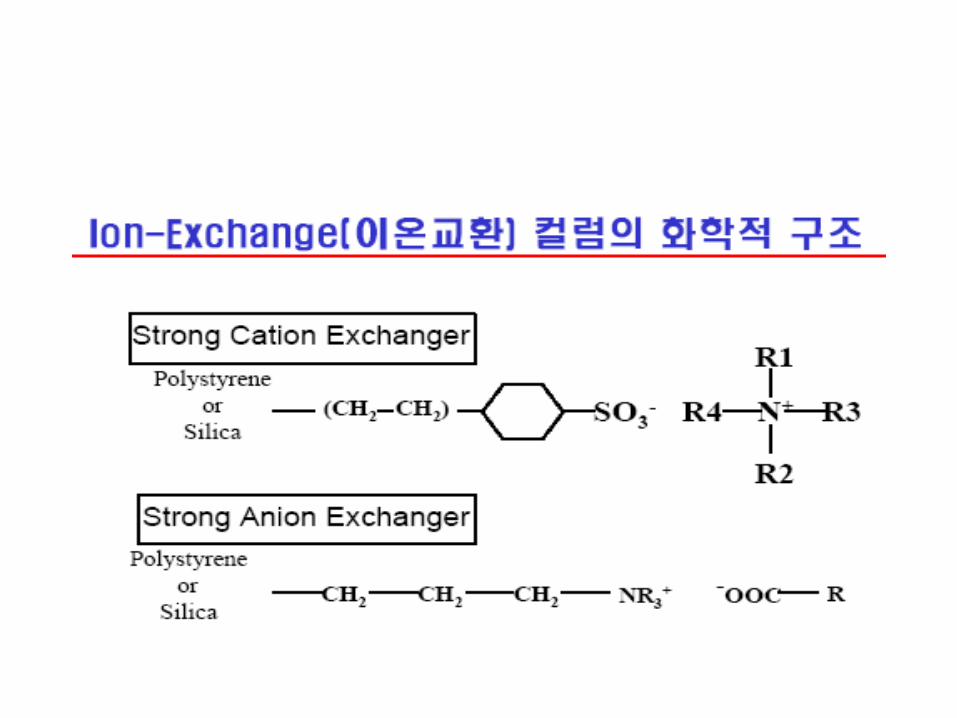
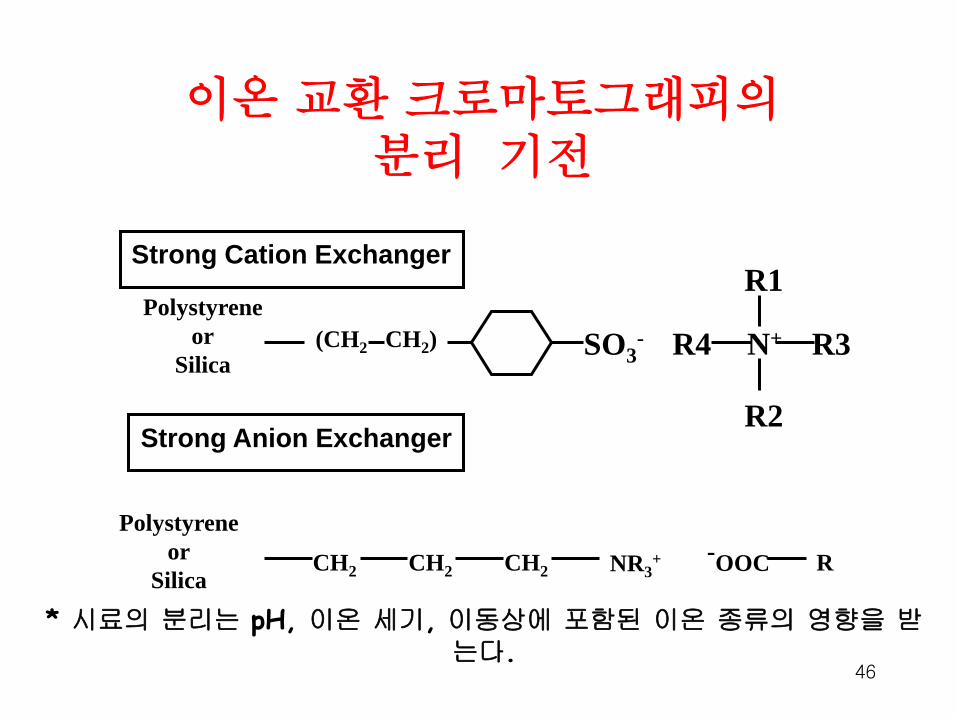
이온 교환 크로마토그래피의 분리 기전
Strong Cation Exchanger
Polystyrene
or
Silica (CH2 CH2) SO3
- R4 N+
R1
R2
R3
Strong Anion Exchanger
Polystyrene
or
Silica CH2 CH2 CH2 NR3
+ -OOC R
* 시료의 분리는 pH, 이온 세기, 이동상에 포함된 이온 종류의 영향을 받는다.
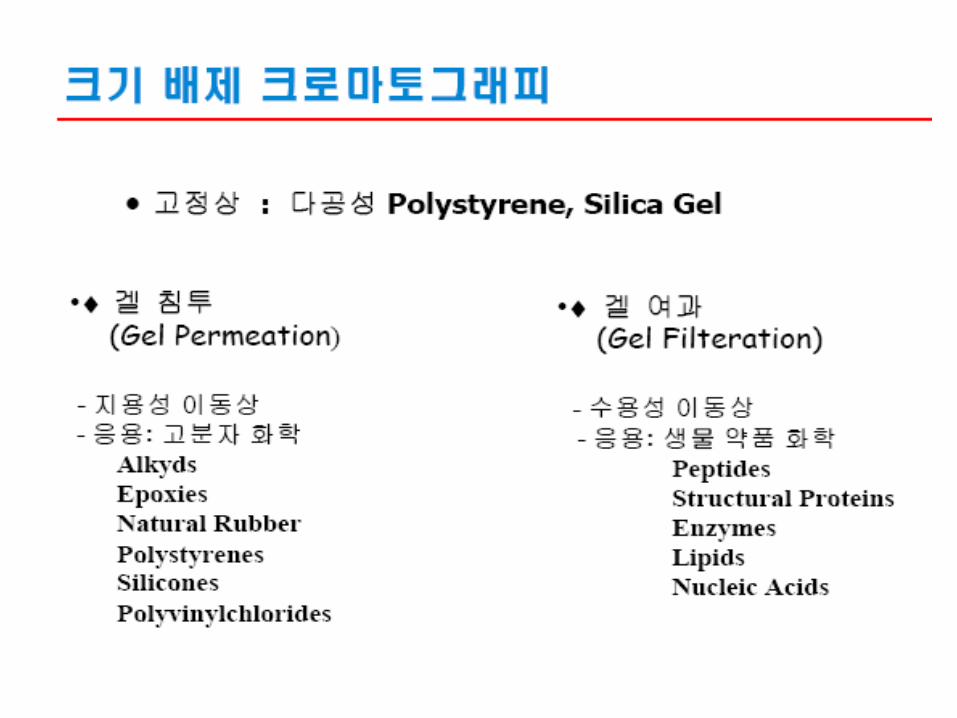
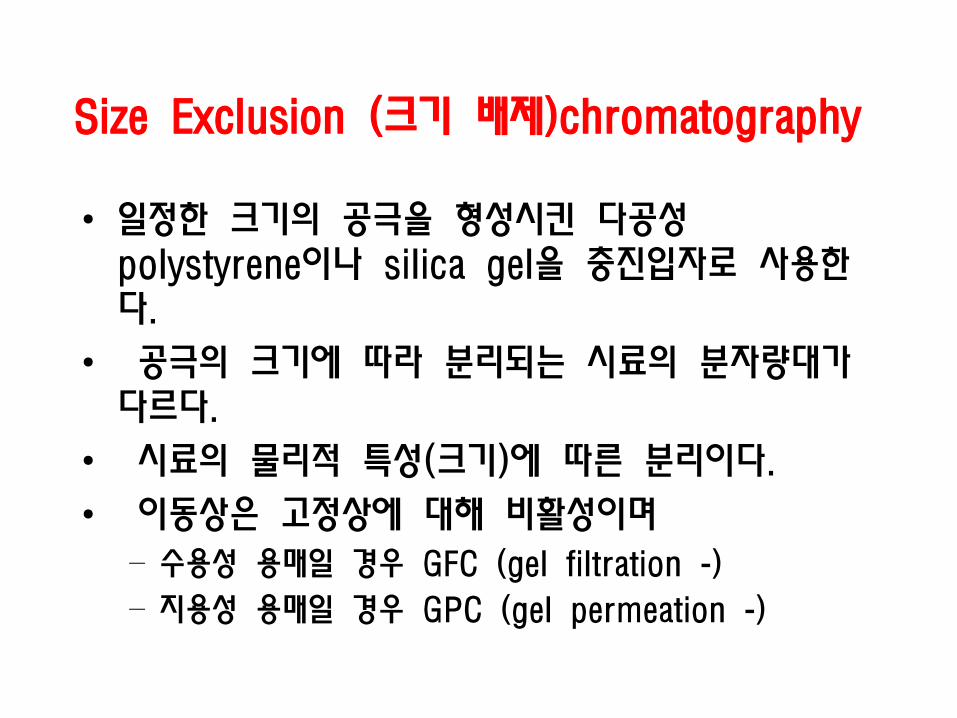
Size Exclusion (크기 배제)chromatography
• 일정한 크기의 공극을 형성시킨 다공성 polystyrene이나 silica gel을 충진입자로 사용한다.
• 공극의 크기에 따라 분리되는 시료의 분자량대가 다르다.
• 시료의 물리적 특성(크기)에 따른 분리이다.
• 이동상은 고정상에 대해 비활성이며
– 수용성 용매일 경우 GFC (gel filtration -)
– 지용성 용매일 경우 GPC (gel permeation -)
•Thin layer chromatography (TLC) is an important
technique for identification and separation of mixtures
of organic compounds. It is useful in:
• Identification of components of a mixture (using appropriate
standards)
• following the course of a reaction,
• analyzing fractions collected during purification,
• analyzing the purity of a compound.
• In TLC, components of the mixture are partitioned
between an adsorbent (the stationary phase, usually
silica gel, SiO2) and a solvent ( the mobile phase) which
flows through the adsorbent.
THIN LAYER CHROMATOGRAPHY

THIN LAYER CHROMATOGRAPHY
In TLC, a plastic, glass or aluminum sheet is coated
with a thin layer of silica gel.
A very small amount of a solution of the substance
to be analyzed is applied in a small spot with a
capillary tube, ~1cm from the bottom of the
TLC plate
The TLC is developed in a chamber
which contains the developing solvent
(the mobile phase). A truncated filter
paper placed in the chamber serves to
saturate the chamber with mobile phase.
A B CU D
A B CU
filter paper
D
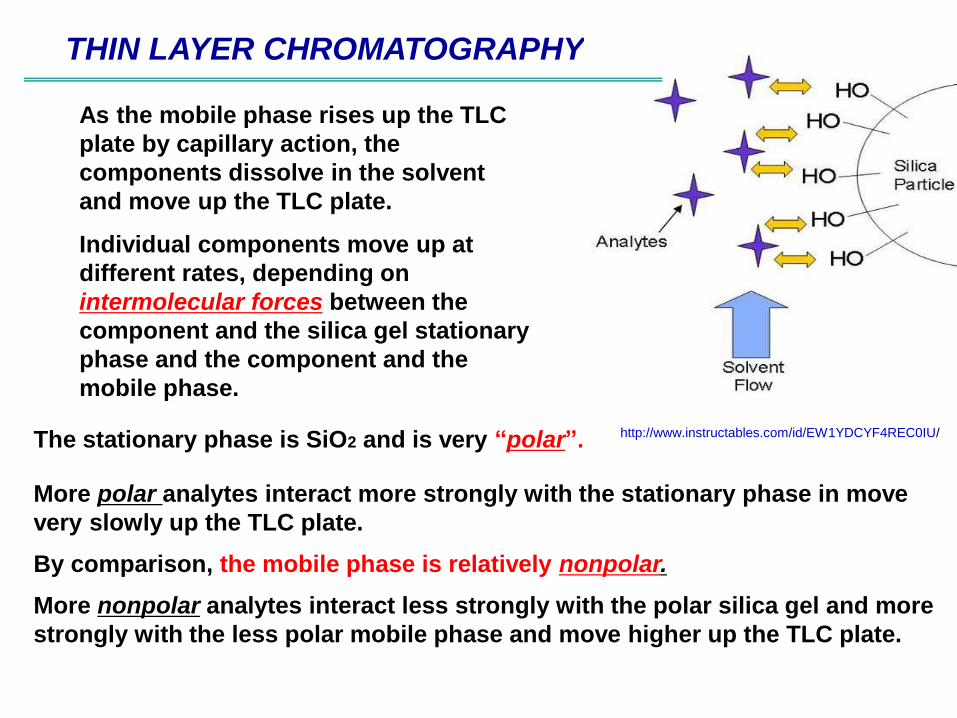
As the mobile phase rises up the TLC
plate by capillary action, the
components dissolve in the solvent
and move up the TLC plate.
Individual components move up at
different rates, depending on
intermolecular forces between the
component and the silica gel stationary
phase and the component and the
mobile phase.
THIN LAYER CHROMATOGRAPHY
The stationary phase is SiO2 and is very “polar”.
More polar analytes interact more strongly with the stationary phase in move
very slowly up the TLC plate.
By comparison, the mobile phase is relatively nonpolar.
More nonpolar analytes interact less strongly with the polar silica gel and more
strongly with the less polar mobile phase and move higher up the TLC plate.
http://www.instructables.com/id/EW1YDCYF4REC0IU/
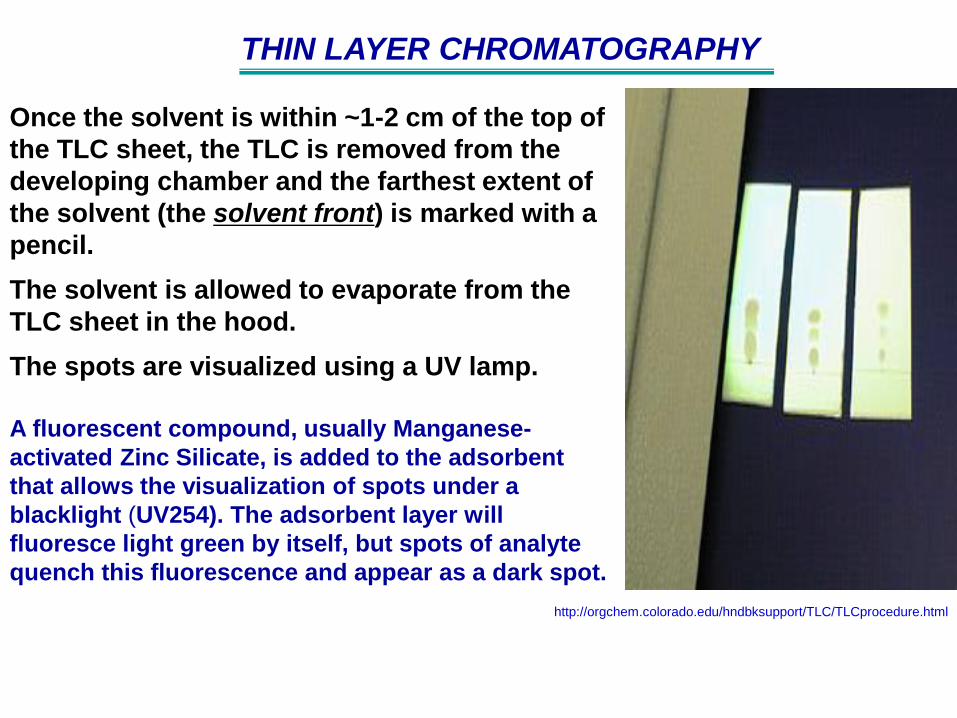
Once the solvent is within ~1-2 cm of the top of
the TLC sheet, the TLC is removed from the
developing chamber and the farthest extent of
the solvent (the solvent front) is marked with a
pencil.
The solvent is allowed to evaporate from the
TLC sheet in the hood.
The spots are visualized using a UV lamp.
A fluorescent compound, usually Manganese-
activated Zinc Silicate, is added to the adsorbent
that allows the visualization of spots under a
blacklight (UV254). The adsorbent layer will
fluoresce light green by itself, but spots of analyte
quench this fluorescence and appear as a dark spot.
THIN LAYER CHROMATOGRAPHY
http://orgchem.colorado.edu/hndbksupport/TLC/TLCprocedure.html
THIN LAYER CHROMATOGRAPHY - Visualization
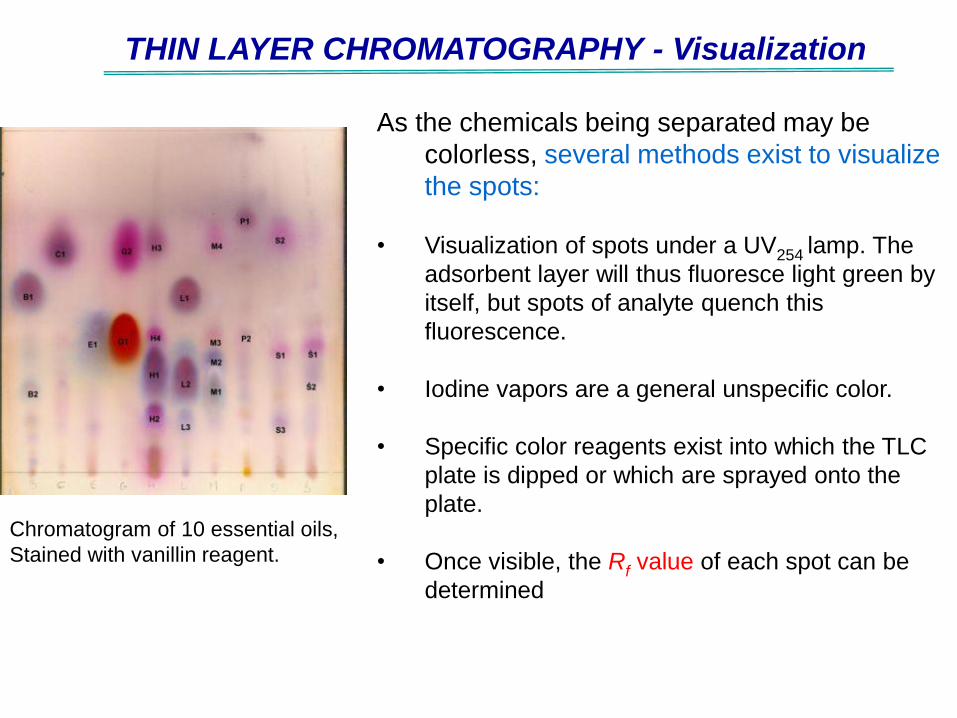
As the chemicals being separated may be
colorless, several methods exist to visualize
the spots:
• Visualization of spots under a UV254 lamp. The
adsorbent layer will thus fluoresce light green by
itself, but spots of analyte quench this
fluorescence.
• Iodine vapors are a general unspecific color.
• Specific color reagents exist into which the TLC
plate is dipped or which are sprayed onto the
plate.
• Once visible, the Rf value of each spot can be
determined
Chromatogram of 10 essential oils,
Stained with vanillin reagent.
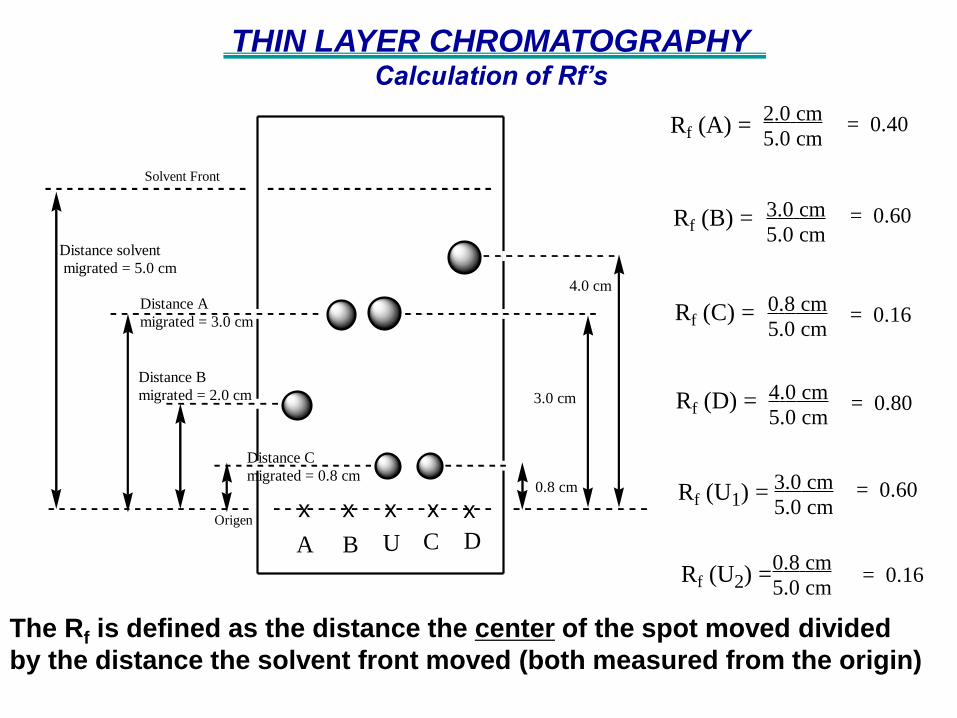
THIN LAYER CHROMATOGRAPHY Calculation of Rf’s
The Rf is defined as the distance the center of the spot moved divided
by the distance the solvent front moved (both measured from the origin)
A B CU
x xx x
Solvent Front
Origen
Distance solvent
migrated = 5.0 cm
Distance A
migrated = 3.0 cm
Distance B
migrated = 2.0 cm
Distance C
migrated = 0.8 cm0.8 cm
3.0 cm
Rf (A) =
Rf (B) =
Rf (C) =
Rf (U1) =
Rf (U2) =
2.0 cm
5.0 cm= 0.40
= 0.60
= 0.16
= 0.60
= 0.16
3.0 cm
5.0 cm
0.8 cm
5.0 cm
3.0 cm
5.0 cm
0.8 cm
5.0 cm
D
x
Rf (D) = = 0.804.0 cm
5.0 cm
4.0 cm
Rf values can be used to aid in the identification of a
substance by comparison to standards.
The Rf value is not a physical constant, and
comparison should be made only between spots on
the same sheet, run at the same time.
Two substances that have the same Rf value may be
identical; those with different Rf values are not
identical.
THIN LAYER CHROMATOGRAPHY – Rf’s


![[보도자료] 데오도란트에서 프탈레이트 검출 (2005)](https://img.pdfslide.tips/doc/110x75/55c17755bb61eb7c158b45a3/-2005-55c21e9337d3b.jpg)