Embed Size (px)
Citation preview
Generation and analysis of a mouse line
with neuronal transgenic L1 expression
and behavioural analysis of L1 deficient mice
Dissertation
zur Erlangung des
Doktorgrades der Naturwissenschaften
des Fachbereichs Chemie
an der Universität Hamburg
vorgelegt von
Meike P. Zerwas
Hamburg 2005

Gutachter
Prof. Melitta Schachner
Prof. Peter Heisig
Disputation
25.11.2005
Table of contents 1
Table of contents
ABSTRACT................................................................................................................ 4
ZUSAMMENFASSUNG ............................................................................................. 6
I INTRODUCTION ...................................................................................................... 8
1 Cell adhesion molecules in the nervous system ......................................................................................... 8
2 The immunoglobulin superfamily of neural cell adhesion molecules ..................................................... 8
3 The L1 subfamily of the immunoglobulin superfamily ............................................................................ 9
4 L1 - the founding member of the L1 subfamily ...................................................................................... 10 4.1 Molecular structure and genetics ................................................................................................... 10 4.2 Expression – function correlation................................................................................................... 11 4.3 Mechanism of function .................................................................................................................... 12 4.4 Mutations as the cause for severe neurological disorders ............................................................ 14 4.5 The L1 deficient mouse as model for CRASH ............................................................................... 15 4.6 New mouse lines investigating L1 function .................................................................................... 18
5 Aim of this study........................................................................................................................................ 18
II MATERIAL ............................................................................................................ 19
1 Chemicals and laboratory equipment...................................................................................................... 19
2 Solutions / buffers / media......................................................................................................................... 19
3 Molecular weight standards ..................................................................................................................... 23
4 Plasmids...................................................................................................................................................... 24
5 Oligonucleotides......................................................................................................................................... 24
6 Antibodies................................................................................................................................................... 24 6.1 Primary antibodies........................................................................................................................... 24 6.2 Secondary antibodies ....................................................................................................................... 25
7 Bacterial strain........................................................................................................................................... 25
8 Mouse strains ............................................................................................................................................. 25
III METHODS............................................................................................................ 26
1 Molecular biology ...................................................................................................................................... 26 1.1 Production of chemically competent bacteria................................................................................ 26 1.2 Transformation of competent bacteria .......................................................................................... 26 1.3 Plasmid DNA isolation of E.coli bacterial cultures ....................................................................... 26 1.4 Enzymatic modification of plasmid DNA....................................................................................... 27 1.5 Purification of PCR products.......................................................................................................... 27 1.6 DNA gel electrophoresis .................................................................................................................. 27 1.7 Extraction and purification of DNA fragments from agarose gels .............................................. 28
1.7.1 Column purification as preparation for cloning....................................................................... 28 1.7.2 Electroelution as preparation for pronuclear injection ........................................................... 28
1.8 Determination of DNA purity and concentration ......................................................................... 28 1.9 DNA sequencing ............................................................................................................................... 29
Table of contents 2
1.10 Computer assisted sequence analysis ............................................................................................. 29 1.11 Pronuclear injection......................................................................................................................... 29
2 Protein biochemistry ................................................................................................................................. 29 2.1 Brain homogenisation ...................................................................................................................... 29 2.2 Lysis of cerebellar granule cells ...................................................................................................... 30 2.3 Determination of protein concentration with the BCA assay ...................................................... 30 2.4 Digestion of brain homogenate with the enzyme endoglycosidase H........................................... 30 2.5 Sodiumdodecylsulfate-polyacrylamide gel electrophoresis (SDS- PAGE) .................................. 30 2.6 Western blot analysis ....................................................................................................................... 31
2.6.1 Electrophoretic transfer of proteins to nitrocellulose membrane (western blot).................. 31 2.6.2 Immunological detection of proteins on nitrocellulose membrane with enhanced
chemiluminescence .................................................................................................................................... 31
3 Cell culture of primary neurons............................................................................................................... 32 3.1 Preparation and cultivation of dissociated hippocampal neurons ............................................... 32 3.2 Preparation and cultivation of dissociated cerebellar neurons .................................................... 32 3.3 Neurite outgrowth assay of dissociated cerebellar neurons ......................................................... 33
4 Immunocytochemistry of fixed primary dissociated neuron cultures .................................................. 33
5 Immunohistochemistry ............................................................................................................................. 34 5.1 Indirect immunofluorescence staining of fresh frozen tissue sections ......................................... 34 5.2 Indirect immunofluorescence staining of fixed tissue sections ..................................................... 34
6 Behavioural biology................................................................................................................................... 35 6.1 Housing conditions ........................................................................................................................... 35 6.2 General protocol............................................................................................................................... 35 6.3 Spontaneous circadian activity ....................................................................................................... 36 6.4 Motor function ................................................................................................................................. 37
6.4.1 Pole test ........................................................................................................................................ 37 6.4.2 Wire hanging test ........................................................................................................................ 37 6.4.3 Rotarod ........................................................................................................................................ 37
6.5 Exploration / anxiety........................................................................................................................ 38 6.5.1 Open field ..................................................................................................................................... 38 6.5.2 Light/dark test ............................................................................................................................. 38 6.5.3 Elevated-plus maze...................................................................................................................... 38 6.5.4 New cage/new object exploration ............................................................................................... 39 6.5.5 Free-choice open field ................................................................................................................. 40
6.6 Pharmacology: 8-OH-DPAT-induced hypothermia ..................................................................... 40 6.7 Learning and memory: step-through passive avoidance .............................................................. 40 6.8 Analysis of behavioural parameters ............................................................................................... 41 6.9 Statistical analysis of behavioural data .......................................................................................... 41
7 Mice breeding............................................................................................................................................. 42 7.1 Genotyping by PCR, nomenclature................................................................................................ 42 7.2 Husbandry ........................................................................................................................................ 43 7.3 Body weight and viability ................................................................................................................ 43
IV RESULTS ............................................................................................................ 44
1 Generation of a mouse line for transgenic L1 expression on neurons .................................................. 44 1.1 Generation of the Thy-1.2 expression cassette with L1 cDNA ..................................................... 44 1.2 Pronuclear injection......................................................................................................................... 48 1.3 Breeding and genotyping of the founder lines with backcross into the KO line........................ 48
2 Expression and localisation of transgenic L1 .......................................................................................... 49 2.1 L1 western blot of total brain homogenate .................................................................................... 49 2.2 EndoH digestion of total brain homogenate .................................................................................. 51 2.3 L1 immunostaining of brain sections ............................................................................................. 51 2.4 Quantitative immunostaining of L1 in hippocampal neuron cultures ........................................ 52
Table of contents 3
3 Functionality of transgenic L1.................................................................................................................. 55 3.1 Neurite outgrowth assay of dissociated cerebellar neurons ......................................................... 55 3.2 General appearance of KO_T mice ................................................................................................ 58 3.3 Immunostaining of brain sections................................................................................................... 58
4 Behavioural analysis of KO and KO_T mice .......................................................................................... 59 4.1 Spontaneous circadian activity ....................................................................................................... 59 4.2 Motor function ................................................................................................................................. 60
4.2.1 Pole test ........................................................................................................................................ 60 4.2.2 Wire hanging test ........................................................................................................................ 61 4.2.3 Rotarod ........................................................................................................................................ 61
4.3 Exploration / anxiety........................................................................................................................ 62 4.3.1 Open field ..................................................................................................................................... 62 4.3.2 Light/dark test ............................................................................................................................. 63 4.3.3 Elevated-plus maze...................................................................................................................... 64 4.3.4 New cage/new object exploration ............................................................................................... 68 4.3.5 Free-choice open field ................................................................................................................. 70
4.4 Pharmacology: 8-OH-DPAT-induced hypothermia ..................................................................... 70 4.5 Learning and memory: step-through passive avoidance .............................................................. 71
V DISCUSSION........................................................................................................ 72
1 Generation of a mouse line with L1 as transgene under the control of the Thy-1.2 promoter .......... 72
2 Successful expression of transgenic L1 .................................................................................................... 73
3 Localisation of transgenic L1.................................................................................................................... 73
4 Amount of cell surface transgenic L1 comparable to wildtype level..................................................... 74
5 Functionality of transgenic L1.................................................................................................................. 75
6 Behavioural analysis of KO mice ............................................................................................................. 77
7 Partial rescue of the behavioural KO phenotype in KO_T mice........................................................... 84
8 Concluding remarks.................................................................................................................................. 86
VI REFERENCES..................................................................................................... 87
VII APPENDIX........................................................................................................ 101
1 Abbreviations........................................................................................................................................... 101
2 Oligonucleotides....................................................................................................................................... 103
3 Plasmid maps ........................................................................................................................................... 103
DANKSAGUNG ..................................................................................................... 104
CURRICULUM VITAE............................................................................................ 105
ERKLÄRUNG......................................................................................................... 106
ADDENDUM........................................................................................................... 107
ABSTRACT 4
ABSTRACT
The neural cell adhesion molecule L1, a member of the immunoglobulin superfamily,
performs important functions in the developing and in the adult nervous system. These
include processes such as neuronal cell migration, neurite elongation, fasciculation and
pathfinding of axons, and synaptic plasticity. Several mutations in the L1 gene cause
congenital neurological anomalies in humans pooled under the term “L1 spectrum”, formerly
“CRASH syndrome”. Some of the mutations lead to ablation of cell surface expression of L1
and L1 deficient mice have proven to be an animal model for this disease. The mutant mouse
has helped in understanding a lot of the functions of L1. Prominent features are reduced
corticospinal tract, hypoplasia of the cerebellar vermis, and hydrocephalus which can be
explained with the loss of L1 as guidance cue in development. Since the KO mouse is
constitutive, defects due to the lack of L1 in the mature nervous system cannot be
distinguished from those arising at earlier stages. To amend this problem a mouse was
designed here expressing transgenic L1 under the control of the Thy-1.2 promoter on neurons
starting around postnatal day 7. This mouse was then crossed into the KO background to
analyse whether recovery of defects (and which ones) of the KO mouse could be achieved by
late transgenic L1 expression. In addition, the KO mouse was characterised for the first time
in detail regarding behaviour (in comparison with the KO_T mouse) gaining new insights into
L1 function in vivo.
The new mouse line expressed transgenic L1 in neurons reaching a peak level stable
throughout adulthood by postnatal day 13. Transgenic L1 was delivered to the cell surface in
amounts comparable to wildtype level, though some cells carried substantial intracellular
deposits of L1. L1 function was re-established completely by transgenic L1 regarding
elongation of cell processes impaired in KO neurons in the neurite outgrowth assay of
cerebellar granule cells in vitro. For most typical defects of KO mice no rescue was observed
in vivo.
The behavioural characterisation of KO mice revealed a distinct phenotype due to the
deficiency in L1. They displayed higher trait anxiety, along with lower state anxiety in several
paradigms. Reduced response to 8-OH-DPAT-induced hypothermia suggested disturbance in
the serotonergic pathway perhaps related to the altered anxiety state. Concerning locomotor
activity there was no difference among the genotypes regarding spontaneous home cage
activity, but KO mice moved more and faster in the open field and in the light/dark test than
WT mice, perhaps a consequence of altered reaction to unknown territory rather than intrinsic
ABSTRACT 5
hyperlocomotion. The severe motor impairment in the pole test demonstrated the importance
of L1 function embedded in the corticospinal tract. No alterations could be observed in the
long-term memory in a passive avoidance paradigm. KO_T mice displayed partial recovery in
the pole test and in some parameters measuring anxiety. The WT_T genotype served as
control and verified that intracellular L1 did not cause adverse effects.
The only minor recovery effects by transgenic L1 in vivo may have been due to the
late onset of expression or the different cell types expressing L1 not provided with the
necessary equipment or not in the correct environment for L1 function. The origin of defects
may be early in development and of a severity impossible to overcome in the complex
environment of the nervous system in contrast to isolated cells in vitro. Despite this, the
partial recovery by transgenic L1 in the KO background confirmed defects of KO mice as
specific for L1.
ZUSAMMENFASSUNG 6
ZUSAMMENFASSUNG
Das neurale Zelladhäsions Molekül L1, ein Mitglied er Immunoglobulin Superfamilie,
erfüllt wichtige Funktionen im entstehenden und adulten Nervensystem. Diese umfassen
Prozesse wie Zellmigration, Neuritenwachstum, Faszikulierung und Wegfindung von Axonen
und synaptische Plastizität. Eine Vielzahl von Mutationen im L1 Gen verursacht angeborene
neurologische Anomalien im Menschen, zusammengefasst unter dem Begriff „L1 Spektrum“,
früher „CRASH Syndrom“. Manche der Mutationen führen zur Beseitigung der Expression
von L1 auf der Zelloberfläche, und L1 defiziente Mäuse haben sich als Tiermodell für die
Krankheit erwiesen. Die mutierte Maus hat zum Verständnis vieler Funktionen von L1
beigetragen. Prominente Merkmale sind Hypoplasie des Corticospinaltraktes, Hypoplasie der
Vermis des Cerebellum und Hydrocephalus, was mit dem Fehlen von L1 zur gerichteten
Führung von Zellen und ihren Fortsätzen während der Entwicklung erklärt werden kann. Da
die KO Maus konstitutiv ist, können Defekte durch Fehlen von L1 im reifen Nervensystem
nicht von denen unterschieden werden, die in früheren Stadien entstehen. Um dieses Problem
zu beheben, wurde hier eine Maus erzeugt, die transgenes L1 unter der Kontrolle des Thy-1.2
Promoters auf Neuronen mit Beginn um postnatalen Tag 7 exprimiert. Diese Maus wurde in
den KO Hintergrund gekreuzt, um zu analysieren, ob Defekte (und welche) der KO Maus
durch späte Expression von transgenem L1 beseitigt werden können. Zusätzlich wurde die
KO Maus zum ersten Mal detailliert in ihrem Verhalten charakterisiert (im Vergleich mit der
KO_T Maus), wodurch neue Einblicke in L1 Funktionen in vivo gewonnen wurden.
Die neue Mauslinie exprimierte transgenes L1 in Neuronen und erreichte das
Höchstmaß bis postnatalem Tag 13, welches stabil im adulten Alter aufrechterhalten wurde.
Transgenes L1 wurde an die Zelloberfläche geliefert, vergleichbar im Umfang mit der
Wildtyp-Situation. Allerdings enthielten manche Zellen beträchtliche Mengen an
intrazellulärem L1. L1 Funktion wurde durch transgenes L1 hinsichtlich Elongation von
Zellfortsätzen in vitro vollständig wiederhergestellt. Die meisten typischen Defekte der KO
Maus wurden jedoch in vivo nicht kompensiert.
Die Charakterisierung der KO Maus hinsichtlich Verhalten enthüllte einen
charakteristischen Phänotyp, bestimmt durch das Fehlen von L1. Sie zeigte erhöhte
intrinsische Angst einhergehend mit reduzierter Zustandsangst in mehreren Paradigmen.
Vermindertes Ansprechen auf Hypothermie-Induktion durch 8-OH-DPAT wies auf Störung
im serotonergen Signalnetzwerk hin, möglicher Weise in Zusammenhang mit den veränderten
Angstzuständen. In der lokomotorischen Aktivität war kein Unterschied festzustellen
ZUSAMMENFASSUNG 7
hinsichtlich der spontanen Aktivität im Heimatkäfig, aber die KO Maus bewegte sich mehr
und schneller im „open field“ und im „light/dark test“ als die WT Maus, eher als Konsequenz
der veränderten Reaktion auf unbekanntes Gebiet denn intrinsischer Hyperaktivität. Der
gravierende Defekt in der motorischen Funktion im „pole test“ zeigte die wichtige Rolle von
L1 innerhalb des Corticospinaltraktes. Keine Veränderungen konnten festgestellt werden
hinsichtlich des Langzeitgedächtnisses im passiven Vermeidungs-Paradigma. Die KO_T
Maus zeigte eine partielle Aufhebung des Defektes im „pole test“ in einigen Parametern, die
Angst messen. Der WT_T Genotyp diente als Kontrolle und verifizierte, dass intrazelluläres
L1 keine störenden Auswirkungen hatte.
Die nur geringen re-etablierenden Effekte durch transgenes L1 in vivo könnte durch
den späten Beginn der Expression oder durch die unterschiedlichen Zelltypen verursacht sein,
die L1 exprimierten, aber nicht mit der notwendigen Maschinerie ausgestattet waren oder
nicht im richtigen Umfeld für L1 Funktion lagen. Der Ursprung der Defekte könnte früh in
der Entwicklung gelegen haben und von einem Schweregrad gewesen sein, der unmöglich zu
überwinden war in dem komplexen Umfeld des Nervensystems im Gegensatz zu isolierten
Zellen in vitro. Trotz allem bestätigte diese, wenn auch nur partielle, Kompensation durch
transgenes L1 im KO Hintergrund, Defekte der KO Maus als spezifisch für L1.
I INTRODUCTION 8
I INTRODUCTION
1 Cell adhesion molecules in the nervous system
It is vital for every organism to develop and maintain its complex units. The nervous
system is an example of nature’s sophisticated design to achieve this. Events such as
induction, proliferation, and differentiation of cells mark the development. The refined
architecture is determined by position, morphology, and connectivity with the environment
(neighbouring cells and extracellular matrix) of every single cell embedded. It is established
by cell migration and directed extension, arborisation, and bundling of cell processes along
attractive and repulsive guidance cues and interweaving the cells. Also the mature nervous
system experiences highly dynamic processes such as changes in connectivity of the cells
converting signals in learning (synaptic plasticity). This remodelling of the network
challenges strict organisation in balance with the required stability. Communication between
cell-cell and cell-matrix is essential to form a functioning entity and neural cell adhesion
molecules make a major contribution (Rutishauser, 1993). Their name dates back to the initial
discovery of their ability to hold cells together. Today their role in the processes involving
cell signalling is more appropriately acknowledged by the term cell recognition molecules.
One distinguishes three classes of cell recognition molecules in the nervous system:
the cadherins (Shapiro et al., 1998), the integrins (Albelda et al., 1990), and the
immunoglobulin superfamily (Uyemura et al., 1996; Rougon et al., 2003). Since their
function is relevant also for processes in other tissue, they are not confined to the nervous
system. An additional class is known in the immune system, the selectins (Tedder et al.,
1995).
2 The immunoglobulin superfamily of neural cell adhesion molecules
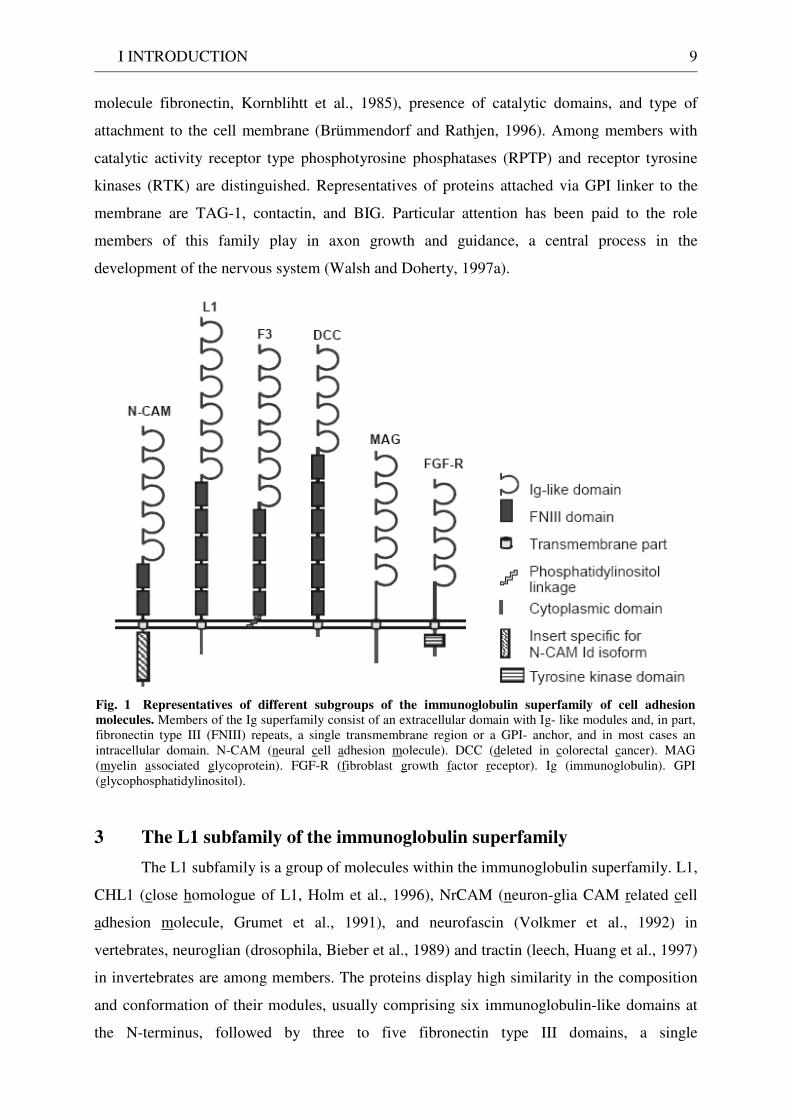
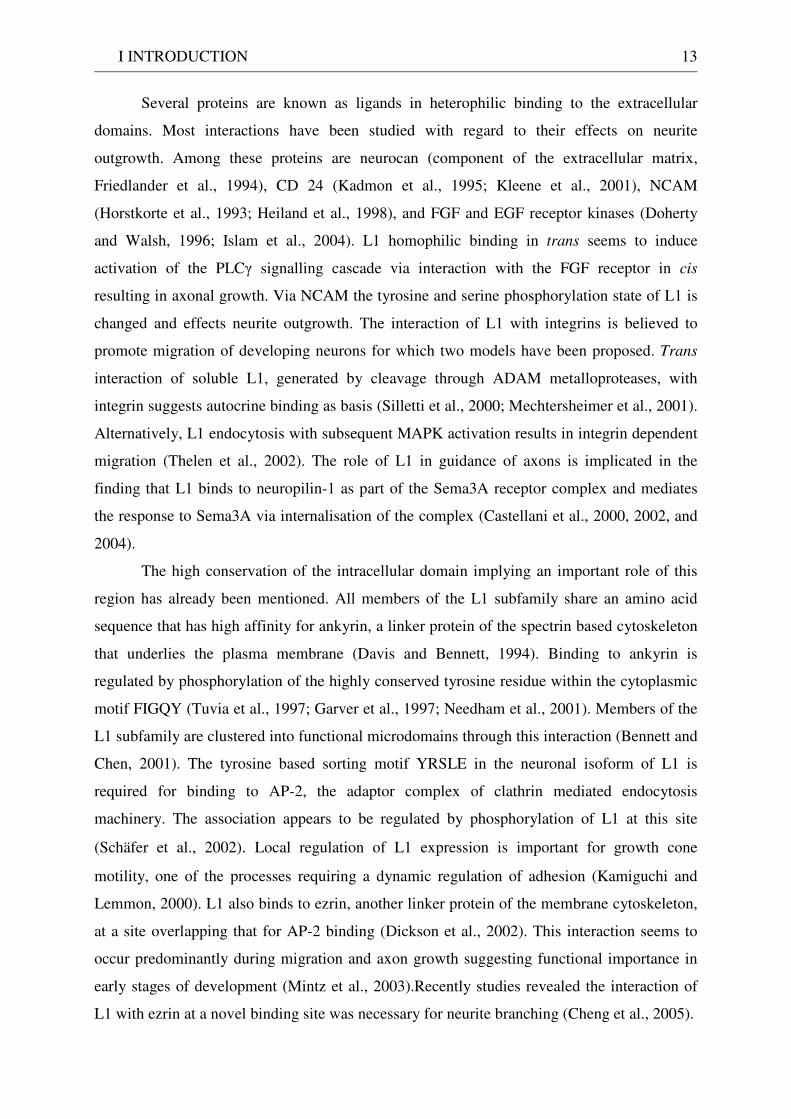
As the name immunoglobulin superfamily already indicates proteins of this group
share the presence of at least one immunoglobulin-like domain allowing cell adhesion
independent of Ca2+ (Fig. 1). A similar module is typical of proteins assisting the immune
response, i.e. antibody (Edelman et al., 1987), which enables recognition and binding of
structures with high specificity. The common feature suggests an evolutionary connection and
it has been verified that duplication and diversification of originally few genes laid the basis
for the emergence of the large family of cell recognition molecules (Williams and Barclay,
1988). The family is divided into subfamilies according to characteristics such as presence of
repeated fibronectin type III domains (originally identified as motif in the extracellular matrix
I INTRODUCTION 9
molecule fibronectin, Kornblihtt et al., 1985), presence of catalytic domains, and type of
attachment to the cell membrane (Brümmendorf and Rathjen, 1996). Among members with
catalytic activity receptor type phosphotyrosine phosphatases (RPTP) and receptor tyrosine
kinases (RTK) are distinguished. Representatives of proteins attached via GPI linker to the
membrane are TAG-1, contactin, and BIG. Particular attention has been paid to the role
members of this family play in axon growth and guidance, a central process in the
development of the nervous system (Walsh and Doherty, 1997a).
Fig. 1 Representatives of different subgroups of the immunoglobulin superfamily of cell adhesion
molecules. Members of the Ig superfamily consist of an extracellular domain with Ig- like modules and, in part, fibronectin type III (FNIII) repeats, a single transmembrane region or a GPI- anchor, and in most cases an intracellular domain. N-CAM (neural cell adhesion molecule). DCC (deleted in colorectal cancer). MAG (myelin associated glycoprotein). FGF-R (fibroblast growth factor receptor). Ig (immunoglobulin). GPI (glycophosphatidylinositol).
3 The L1 subfamily of the immunoglobulin superfamily
The L1 subfamily is a group of molecules within the immunoglobulin superfamily. L1,
CHL1 (close homologue of L1, Holm et al., 1996), NrCAM (neuron-glia CAM related cell
adhesion molecule, Grumet et al., 1991), and neurofascin (Volkmer et al., 1992) in
vertebrates, neuroglian (drosophila, Bieber et al., 1989) and tractin (leech, Huang et al., 1997)
in invertebrates are among members. The proteins display high similarity in the composition
and conformation of their modules, usually comprising six immunoglobulin-like domains at
the N-terminus, followed by three to five fibronectin type III domains, a single
I INTRODUCTION 10
transmembrane segment, and a short highly conserved cytoplasmic region (Hortsch, 2000).
The glycoproteins are predominantly expressed by neuronal and glial cells widespread
throughout the developing nervous system from postmitotic stage on, with particularly high
levels along major axonal pathways suggesting involvement in guidance and fasciculation of
neurons. Indeed, their function is crucial for a lot of other steps as well ranging from
myelination, to morphogenesis, and cell migration (Hortsch, 1996). They mediate effects
through homophilic or heterophilic binding of their extracellular domains and the interaction
of their intracellular region with the cytoskeleton and further binding partners triggers
important processes (Brümmendorf et al., 1998).
4 L1 - the founding member of the L1 subfamily
L1 was one of the first isolated and characterised cell adhesion molecules (Rathjen and
Schachner, 1984). Homologues of L1 exist in several species, i.e. LAD-1 (L1-like adhesion-1,
Caenorhabditis elegans, Chen et al., 2001), neuroglian (drosophila, Bieber et al., 1989), L1.1
and L1.2 (zebrafish, Tongiorgi et al., 1995), E587 (goldfish, Vielmetter et al., 1991), Ng-
CAM (neuron-glia cell adhesion molecule, chicken, Grumet and Edelman, 1984), and NILE
(nerve growth factor inducible large external glycoprotein, rat, Salton et al., 1983). The amino
acid sequence similarity of these proteins ranges between 30 and 60 % (Hlavin and Lemmon,
1991; Hortsch, 2000). The cytoplasmic part shows remarkable conservation in general,
reaching even complete identity in human, rat and mouse. The presence of homologues across
diverse species and the high degree of conservation in the course of evolution speaks for the
key role L1 owns.
4.1 Molecular structure and genetics
The size of full length L1 is approximately 200 kD. Proteolytic cleavage gives rise to
smaller forms with a molecular weight of 180, 140, 80 and 50 kD (Sadoul et al., 1988). The
extracellular domains contain several glycosylation sites of N- and O-type linkage accounting
for 25 % of the total molecular mass of L1.
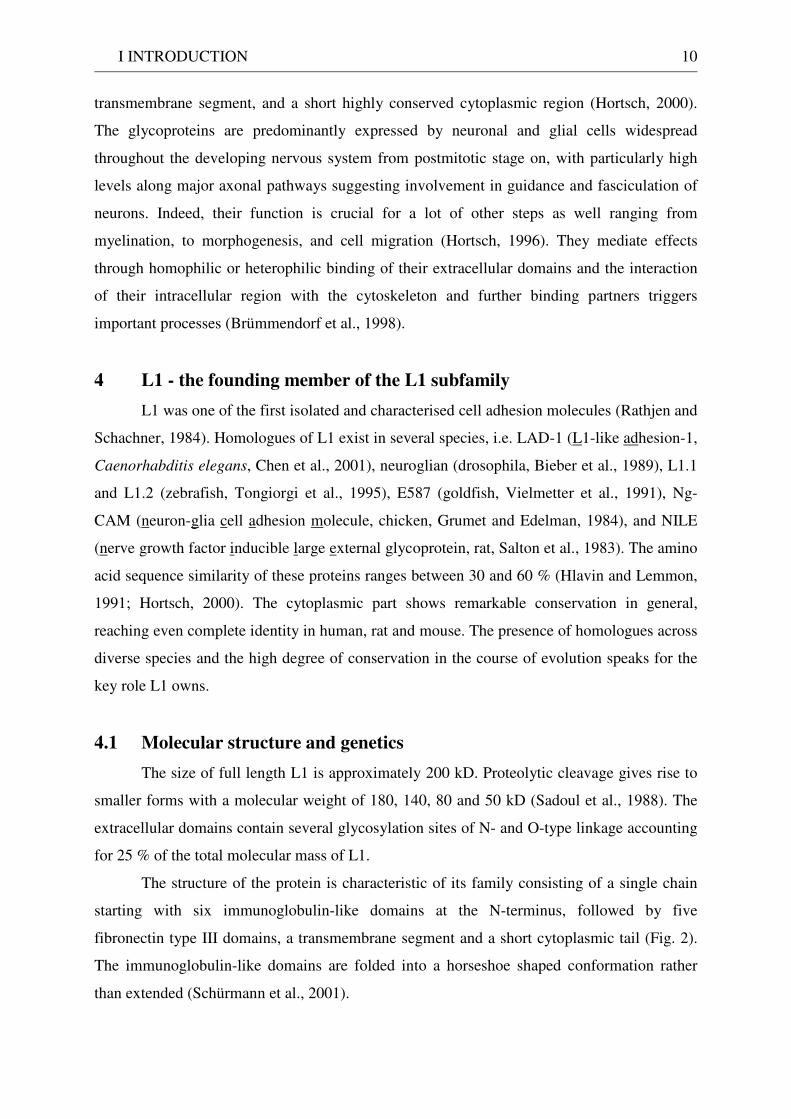
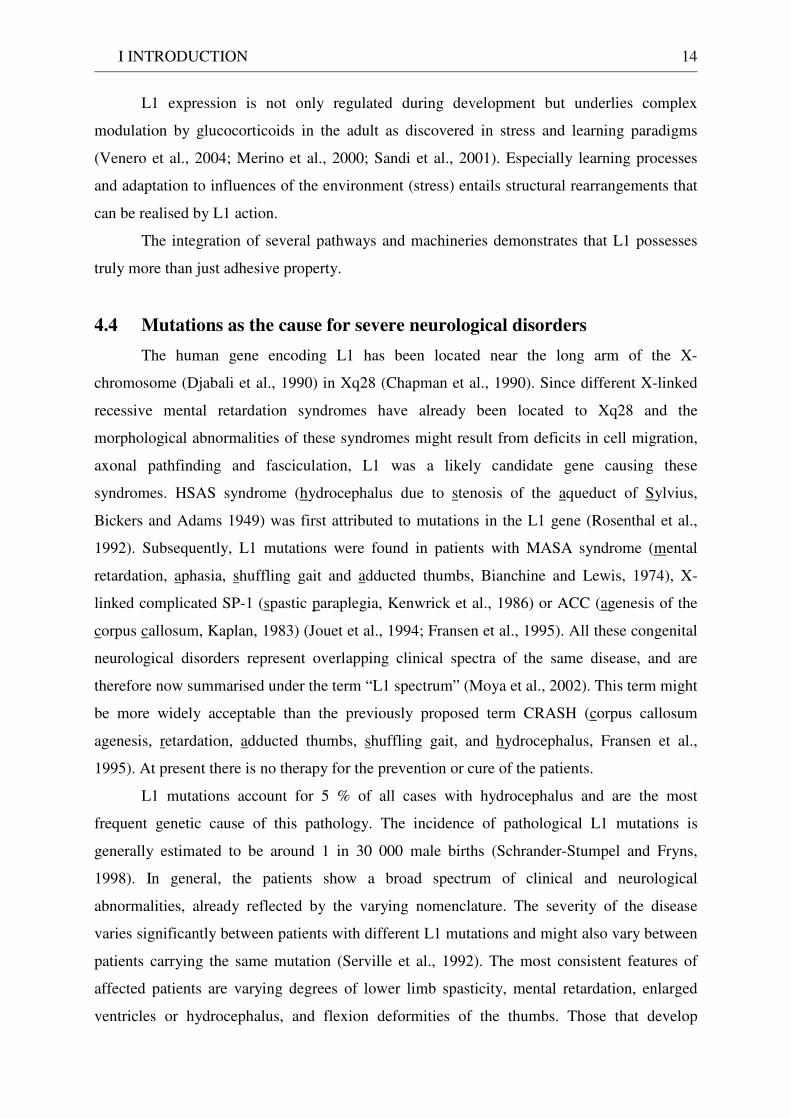
The structure of the protein is characteristic of its family consisting of a single chain
starting with six immunoglobulin-like domains at the N-terminus, followed by five
fibronectin type III domains, a transmembrane segment and a short cytoplasmic tail (Fig. 2).
The immunoglobulin-like domains are folded into a horseshoe shaped conformation rather
than extended (Schürmann et al., 2001).
I INTRODUCTION 11
Fig. 2 Structure of L1. The molecule consists of six immunoglobulin domains, five fibronectin type III repeats next to the N-terminal. The single transmembrane pass is followed by a short intracellular domain. Glycosylation sites are distributed over the extracellular part and indicated as black dots.
The gene coding for L1 is located on the X chromosome and contains 28 codons that
are translated preceded by exon 1a comprising 5’ untranslated sequences (Kohl et al., 1992;
Kallunki et al., 1997). The mRNA provides an open reading frame of 3783 nucleotides. The
mature protein of 1241 amino acids is generated by removal of a signal peptide sequence 19
amino acids long (Moos et al., 1988). Two tissue and cell specific isoforms are known for L1
resulting from alternative splicing (Takeda et al., 1996). The neural isoform is based on the
sequence including all 28 exons coding for L1, while the non-neuronal isoform (blood
lymphocytes, kidney, Schwann cells) lacks residues encoded in exons 2 and 27.
Oligodendrocytes have been found to express both isoforms in a maturation dependent
manner (Itoh et al., 2000). Exon 27 codes for the amino acid sequence RSLE within the
cytoplasmic region. It represents the tyrosine based sorting motif YRSL required in clathrin
mediated endocytosis (Kamiguchi et al., 1998a). Exon 2 codes for the six amino acid stretch
YEGHHV (human) or YKGHHV (mouse) in the extracellular part of L1 preceding the first
immunoglobulin-like domain (Jouet et al., 1995). It appears to be responsible for homophilic
binding and neurite outgrowth promoting properties of L1 (De Angelis et al., 2001; Jacob et
al., 2002).
4.2 Expression – function correlation
Here the focus is on L1 in the nervous system, although it is also expressed in other
tissue such as the crypt cells of the intestine (Thor et al., 1987), the epithelia of the kidney
(Nolte et al., 1999), and T- and B-cells of the immune system (Ebeling et al., 1996). The
upregulation of expression in tumour cells suggests its involvement in cancer (Meli et al.,
1999).
In the nervous system L1 expression is temporally and spatially regulated. It is
detected from embryonic day 10 onwards in the central nervous system on postmitotic
I INTRODUCTION 12
neurons and the distribution in the developing nervous system already indicates its role in late
cell migration (Rathjen and Schachner, 1984; Fushiki and Schachner, 1986). Studies in young
mice showed expression of L1 in the hippocampus is restricted to fasciculating axons forming
the stratum moleculare and the hilus where expression increases with age while dendrites and
regions rich in cell body remain negative for L1 (Persohn and Schachner, 1990). Again the
expression profile is indicative of one of its functions, here fasciculation of axons. From
observations in the developing cerebellum corresponding conclusion could be drawn (Persohn
and Schachner, 1987). In adulthood expression of L1 is continued on unmyelinated axons, but
it disappears from myelinated axons, i.e. white matter (Bartsch et al., 1989). In the peripheral
nervous system L1 is also found on non-myelinating Schwann cells (Martini and Schachner,
1986). L1 has never been detected in synapses (Schuster et al., 2001).
Several functional assays have proven the expression pattern of L1 to be consistent
with its function. During the development of the nervous system, L1 plays a role in migration
of postmitotic neurons (Lindner et al., 1983; Asou et al., 1992), in axon outgrowth,
pathfinding and fasciculation (Fischer et al., 1986; Lagenaur and Lemmon, 1987; Chang et
al., 1987; Kunz et al., 1998), growth cone morphology (Payne et al., 1992; Burden-Gulley et
al., 1995), adhesion between neurons and between neurons and Schwann cells (Rathjen and
Schachner, 1984; Faissner et al., 1984; Persohn and Schachner, 1987), and myelination
(Seilheimer et al., 1989). In addition, L1 has been implicated in axonal regeneration (Martini
and Schachner, 1988), neuronal cell survival (Chen et al., 1999; Nishimune et al., 2005), and
proliferation and differentiation of neurons (Dihné et al., 2003). Furthermore learning and
memory formation (Rose, 1995; Venero et al., 2004) and the establishment of long-term
potentiation in the hippocampus (Lüthi et al., 1996) are modulated by L1.
4.3 Mechanism of function
The variety of L1 function derives from its interaction with diverse binding partners
and posttranslational modification as a trigger for signalling cascades. Cytoplasmic and
extracellular part, cis and trans interaction, homophilic and heterophilic binding are factors
involved. Only a few aspects shall be highlighted here.
Although the homophilic interaction (L1 – L1 binding) has been proven by neurite
outgrowth assays of wildtype and L1 deficient neurons on purified L1 (Dahme et al., 1997)
the debate is still continuing as to which domains are required for the interaction. Opinions
range from several extracellular domains (Holm et al., 1995) to one immunoglobulin-like
domain (Ig 2, Zhao et al., 1998).
I INTRODUCTION 13
Several proteins are known as ligands in heterophilic binding to the extracellular
domains. Most interactions have been studied with regard to their effects on neurite
outgrowth. Among these proteins are neurocan (component of the extracellular matrix,
Friedlander et al., 1994), CD 24 (Kadmon et al., 1995; Kleene et al., 2001), NCAM
(Horstkorte et al., 1993; Heiland et al., 1998), and FGF and EGF receptor kinases (Doherty
and Walsh, 1996; Islam et al., 2004). L1 homophilic binding in trans seems to induce
activation of the PLCγ signalling cascade via interaction with the FGF receptor in cis
resulting in axonal growth. Via NCAM the tyrosine and serine phosphorylation state of L1 is
changed and effects neurite outgrowth. The interaction of L1 with integrins is believed to
promote migration of developing neurons for which two models have been proposed. Trans
interaction of soluble L1, generated by cleavage through ADAM metalloproteases, with
integrin suggests autocrine binding as basis (Silletti et al., 2000; Mechtersheimer et al., 2001).
Alternatively, L1 endocytosis with subsequent MAPK activation results in integrin dependent
migration (Thelen et al., 2002). The role of L1 in guidance of axons is implicated in the
finding that L1 binds to neuropilin-1 as part of the Sema3A receptor complex and mediates
the response to Sema3A via internalisation of the complex (Castellani et al., 2000, 2002, and
2004).
The high conservation of the intracellular domain implying an important role of this
region has already been mentioned. All members of the L1 subfamily share an amino acid
sequence that has high affinity for ankyrin, a linker protein of the spectrin based cytoskeleton
that underlies the plasma membrane (Davis and Bennett, 1994). Binding to ankyrin is
regulated by phosphorylation of the highly conserved tyrosine residue within the cytoplasmic
motif FIGQY (Tuvia et al., 1997; Garver et al., 1997; Needham et al., 2001). Members of the
L1 subfamily are clustered into functional microdomains through this interaction (Bennett and
Chen, 2001). The tyrosine based sorting motif YRSLE in the neuronal isoform of L1 is
required for binding to AP-2, the adaptor complex of clathrin mediated endocytosis
machinery. The association appears to be regulated by phosphorylation of L1 at this site
(Schäfer et al., 2002). Local regulation of L1 expression is important for growth cone
motility, one of the processes requiring a dynamic regulation of adhesion (Kamiguchi and
Lemmon, 2000). L1 also binds to ezrin, another linker protein of the membrane cytoskeleton,
at a site overlapping that for AP-2 binding (Dickson et al., 2002). This interaction seems to
occur predominantly during migration and axon growth suggesting functional importance in
early stages of development (Mintz et al., 2003).Recently studies revealed the interaction of
L1 with ezrin at a novel binding site was necessary for neurite branching (Cheng et al., 2005).
I INTRODUCTION 14
L1 expression is not only regulated during development but underlies complex
modulation by glucocorticoids in the adult as discovered in stress and learning paradigms
(Venero et al., 2004; Merino et al., 2000; Sandi et al., 2001). Especially learning processes
and adaptation to influences of the environment (stress) entails structural rearrangements that
can be realised by L1 action.
The integration of several pathways and machineries demonstrates that L1 possesses
truly more than just adhesive property.
4.4 Mutations as the cause for severe neurological disorders
The human gene encoding L1 has been located near the long arm of the X-
chromosome (Djabali et al., 1990) in Xq28 (Chapman et al., 1990). Since different X-linked
recessive mental retardation syndromes have already been located to Xq28 and the
morphological abnormalities of these syndromes might result from deficits in cell migration,
axonal pathfinding and fasciculation, L1 was a likely candidate gene causing these
syndromes. HSAS syndrome (hydrocephalus due to stenosis of the aqueduct of Sylvius,
Bickers and Adams 1949) was first attributed to mutations in the L1 gene (Rosenthal et al.,
1992). Subsequently, L1 mutations were found in patients with MASA syndrome (mental
retardation, aphasia, shuffling gait and adducted thumbs, Bianchine and Lewis, 1974), X-
linked complicated SP-1 (spastic paraplegia, Kenwrick et al., 1986) or ACC (agenesis of the
corpus callosum, Kaplan, 1983) (Jouet et al., 1994; Fransen et al., 1995). All these congenital
neurological disorders represent overlapping clinical spectra of the same disease, and are
therefore now summarised under the term “L1 spectrum” (Moya et al., 2002). This term might
be more widely acceptable than the previously proposed term CRASH (corpus callosum
agenesis, retardation, adducted thumbs, shuffling gait, and hydrocephalus, Fransen et al.,
1995). At present there is no therapy for the prevention or cure of the patients.
L1 mutations account for 5 % of all cases with hydrocephalus and are the most
frequent genetic cause of this pathology. The incidence of pathological L1 mutations is
generally estimated to be around 1 in 30 000 male births (Schrander-Stumpel and Fryns,
1998). In general, the patients show a broad spectrum of clinical and neurological
abnormalities, already reflected by the varying nomenclature. The severity of the disease
varies significantly between patients with different L1 mutations and might also vary between
patients carrying the same mutation (Serville et al., 1992). The most consistent features of
affected patients are varying degrees of lower limb spasticity, mental retardation, enlarged
ventricles or hydrocephalus, and flexion deformities of the thumbs. Those that develop
I INTRODUCTION 15
hydrocephalus in utero or soon after birth have a low life expectancy and many of them die
neonatally. Another striking morphological abnormality is a hypoplasia of the corticospinal
tract (CST) and the corpus callosum. The CST is important for voluntary motor functions and
its impaired development is believed to cause spasticity of the affected patients. The corpus
callosum connects the cerebral hemispheres and pathological alterations of this large
commissure might contribute to mental retardation. More brain malformations have been
observed, including hypoplasia of the cerebellar vermis (Wong et al., 1995b; Fransen et al.,
1996; Kenwrick et al., 2000).
Up to date about 140 different pathogenic mutations have been identified in virtually
all regions of the gene. All types of mutations were found in human patients including
missense, nonsense, and frame shift mutations, deletions, duplication, insertion, and splice
site mutations. Despite the wide range of symptoms, a certain correlation between the severity
of the disease and the type and location of the mutation has been demonstrated (Bateman et
al., 1996; Fransen et al., 1998b). Mutations that truncate the protein in the extracellular
domain are expected to abolish cell surface expression resulting in a “loss of function” of L1
mediated interactions. Such truncations generally produce the most severe phenotypes
(Yamasaki et al., 1997). Most frequent are missense mutations within the extracellular domain
(35 %). In many cases they produce a severe phenotype. Those mutations occurring in key
residues might interfere with homophilic or heterophilic interactions of L1 or with targeting of
the protein to the cell surface (De Angelis et al., 1999 and 2002; Moulding et al., 2000). In
contrast, any mutation within the cytoplasmic domain causes a moderate phenotype. These
mutations are expected to interfere with intracellular signalling and interactions with the
cytoskeleton, but are unlikely to disrupt L1 mediated adhesion deduced from studies with a
deletion of large portions of the intracellular domain of L1 (Wong et al., 1995a).
4.5 The L1 deficient mouse as model for CRASH
Based on the knowledge that some of the L1 mutations cause disruption of cell surface
expression of the protein leading to the neurological disorder in humans, two L1 knock out
(KO) mouse lines were generated to test as an animal model for the human disease. They
were generated independently in different laboratories by targeted disruption of the L1 gene
and have been thoroughly analysed by several scientists by now (Dahme et al., 1997; Cohen
et al., 1998). A third KO mouse line resembling the existing two has been generated later and
was used in this study (Rolf et al., 2001). The various L1 mutants share many of the
pathological features observed in human patients independent of their origin. The availability
I INTRODUCTION 16
of a mouse model for the human disease opened the possibility to further investigate the
disorder and simultaneously gain deeper insight into the functional role and mechanism of L1.
The general appearance of the mutants displayed several characteristics. They were
smaller than their wildtype littermates. They were also mostly infertile and less viable. Their
eyes were sunken and lacrimous. The observed weakness in hind limbs could be the
impairment corresponding to the spasticity in human patients.
The most prominent feature was the enlargement of ventricles in varying degrees
(characteristic of the human pathology as well) dependent on the genetic background the mice
were bred on (Dahme et al., 1997; Rolf et al., 2001; Demyanenko et al., 1999). Mice of the
C57BL/6J background were more disposed to develop a severe hydrocephalus, while mice of
the 129Sv background only showed slightly dilated ventricles. Although it is considered to be
a specific consequence of L1 deficiency the precise mechanism is unknown up to now.
Impaired cell migration or outgrowth and/or pathfinding of axons and subsequent death of
those neurons which fail to find their right position or to innervate their appropriate targets are
discussed.
The gross cytoarchitecture of the brain regions was undisturbed. This was rather
surprising considering the importance of L1 in processes during development including cell
migration. Yet abnormalities in major axonal paths and the detailed analysis of cell
morphology elicited this role of L1. Axons of the corticospinal tract failed to cross the midline
at the point of decussation and did not reach their target which resulted in a reduced size of
the tract probably due to cell death (Dahme et al., 1997; Cohen et al., 1998). This defect also
occurring in human patients is believed to produce the spasticity perhaps corresponding to the
weakness in hind limbs of the mutant mice. Comparable dysgenesis was observed for the
corpus callosum reminiscent of the histological reports of human patients (Demyanenko et al.,
1999). This could explain the mental retardation in humans but in mice no definite effect
could be assigned so far. Other axonal tracts appeared normal suggesting compensation in
guidance by alternative molecules available at the particular time and region in response to
the lack of L1. The involvement of the semaphorin pathway in L1 dependent axonal guidance
was initially revealed by studies on L1 deficient neurons in co-cultures where their
outgrowing processes were not repelled by Sema3A in contrast to wildtype cells (Castellani et
al., 2000). Axons of the retinocollicular projection failed to arborize at normal anterior target
sites in KO mice (Demyanenko et al., 2003). Regarding dopaminergic neurons alterations in
location and cell morphology were discovered (Demyanenko et al., 2001). Similar
abnormalities in dendrite morphology and displacement were observed in the hippocampus
I INTRODUCTION 17
and in the cerebral cortices (Demyanenko et al., 1999). Undulation and less and shorter
branching of apical dendrites not reaching their destination in the correct layer and the
reduced number of pyramidal cells in KO mice pointed to L1 as important factor in guidance,
survival, and migration of cells and their processes during development. Hypoplasia of the
cerebellar vermis in KO mice was attributed to the lack of L1 as regulatory element in cell
migration (Fransen et al., 1998a) and represents another feature paralleled in humans.
Consequences have not yet been determined.
In the peripheral nervous system mutant mice showed morphological abnormalities of
unmyelinated fibers due to loss of heterophilic binding by axonal L1 (Dahme et al., 1997,
Haney et al., 1999). Schwann cells were not able to maintain axonal ensheathment of sensory
unmyelinated axons and axonal degeneration of unmyelinated axons.
In vitro assays revealed impairment in neurite outgrowth of cerebellar neurons taken
from KO mice grown on L1 as substrate indicating the prerequisite of L1-L1 interaction for
the extension of cell processes (Dahme et al., 1997; Fransen et al., 1998a) and explaining
morphological changes observed in KO brain. Electrophysiological studies did not show
alterations in long-term potentiation (Bliss et al., 2000), but in GABAergic transmission in
inhibitory hippocampal neurons (Saghatelyan et al., 2004).
So far only little data has been published on the behaviour of KO mice. They
possessed decreased nociceptive heat sensitivity in a thermal stimulation paradigm (Thelin et
al., 2003). This hypoalgesia is explained with disturbance in central signal processing through
NMDA receptor with which L1 is known to interact (Husi et al., 2000). Reduced sensory
function in the von Frey pressure test measuring skin sensitivity to applied pressure is
probably due to axonal degeneration of the unmyelinated axons in the peripheral nervous
system described above (Haney et al., 1999). KO mice have been observed doing stereotype
peripheral circling in the open field test and being hypoactive, but they displayed no motor
impairment in the rotarod and no impairment in long-term memory in the passive avoidance
task (Fransen et al., 1998a). Possible spatial learning defects were concluded from impaired
performance in the Morris Water Maze (Fransen et al., 1998a). But the authors suggested that
the poor swimming abilities of KO mice may have affected the general performance in the
water maze. In addition, electrophysiological studies did not show a change in long-term
potentiation considered as marker for hippocampal spatial dependent learning (Bliss et al.,
2000). Only recently it has been discovered that L1 deficient mice show reduced response in
the prepulse inhibition paradigm (Irintchev et al., 2004). This sensory gating defect is found
in humans with psychiatric disorders as well.
I INTRODUCTION 18
4.6 New mouse lines investigating L1 function
Another mouse has been created where L1 is present during development but ablated
in the forebrain and the hippocampus from postnatal day 21 onwards to dissect L1 function in
the adult separated from its role in development (Law et al., 2003). This mouse displayed
decreased anxiety in the classical paradigms open field and elevated-plus maze. In addition,
they showed altered learning behaviour in the Morris Water maze. Electrophysiological
studies revealed an increase in basal excitatory synaptic transmission not apparent in
constitutive KO mice in contrast to undisturbed long-term potentiation.
To assess which of the L1 domains are responsible for specific effects, a mouse line
with deletion of the sixth immunoglobulin-like domain was generated (Itoh et al., 2004).
Although L1 expression was preserved, in vitro experiments showed that homophilic L1-L1
binding and heterophilic L1-integrin binding was lost. Semaphorin communication was intact.
This finding could explain why many of the axon guidance defects of KO mice were not
observed. However, mice of the C57BL/6J background did develop hydrocephalus suggesting
homophilic binding essential here.
5 Aim of this study
Most studies on L1 have concentrated on its role during development. But L1
expression is continued throughout life and hence must contribute to maintain the functioning
of the mature nervous system. The generation of a mouse line expressing transgenic L1 on
neurons with postnatal start of expression and subsequent crossing into the L1 deficient
mouse line aimed to find an answer using a rescue model. At the same time the aim was to
confirm defects known for the KO mouse as specific effects for the loss of L1. The different
genotypes were compared regarding morphology and in vitro functionality where KO mice
are known to display defects. Additionally, all genotypes were characterised regarding their
behavioural phenotype, which delivered new data for the KO mouse.
II MATERIAL 19
II MATERIAL
1 Chemicals and laboratory equipment
All chemicals were purchased from the following companies in p.a. quality:
GibcoBRL (Life Technologies, Karlsruhe, Germany), Merck (Darmstadt, Germany), Serva
(Heidelberg, Germany), Sigma-Aldrich (Steinheim, Germany), and Carl Roth GmbH
(Karlsruhe, Germany). General laboratory material and equipment were provided by
Eppendorf (Hamburg, Germany), Nunc (Roskilde, Denmark), and Becton Dickinson
Biosciences (Heidelberg, Germany). Cell culture material was ordered from Nunc (Roskilde,
Denmark), Life Technologies and PAA Laboratories GmbH (Cölbe, Germany). Centrifuges
were chosen appropriate for the sample volumes: Eppendorf table centrifuges (Hamburg,
Germany) 5415D and 5417R for volumes < 2 ml, 5403 for volumes < 50 ml, Sorvall
Ultracentrifuge RC 5C Plus (Langenselbold, Germany) for volumes > 50 ml. Specific
material (e.g. DNA purification kits) and instruments (i.e. microscopes) are specified when
mentioned in the chapter “methods” below.
2 Solutions / buffers / media
Bi-distilled water was used for preparation unless indicated otherwise.
Agar-PBS 6 % agar in PBS
(vibratome sections) brought to a boil, stirred constantly until lukewarm
Agarose-TAE 0.7 -2 % agarose in TAE
(DNA gels) brought to a boil, stored at 60°C
Antibody dilution buffer 0.1 % BSA in PBS
(immunohistochemistry) for fixed tissue addition of 0.3 % Triton X-100
Antibody dilution buffer 3 % BSA in PBS
(immunocytochemistry)
Antibody dilution buffer 3 % milk powder in TBS
(western blot)
Blocking buffer 3 % BSA in PBS
(immunocyto-/histochemistry)
Blocking buffer 3 % milk powder in TBS
(western blot)
II MATERIAL 20
Boston digestion buffer 50 mM Tris-HCl, pH 8
(tailcut biopsies) 50 mM KCl
2.5 mM EDTA
0.45 % Nonidet-P40
0.45 % Tween 20
0.1 mg/ml Proteinase K
Citrate buffer, 5fold 375mM Na-citrate
(EndoH digestion) adjust to pH 5.5 prior to use
Coating solution hL1-Fc 10 µg/ml human L1-Fc in PBS
(neurite outgrowth assay)
Coating solution laminin 2 µg/ml laminin in PBS
(neurite outgrowth assay)
Coating solution PLL 0.01 % poly-L-lysine in PBS
(primary neuron cultures)
Digestion solution, sterile filtered HBSS (GibcoBRL), pH 7.8, supplemented with:
(primary neuron cultures) 0.01 g/ml trypsin
2 mg/ml DNase I
80 mM MgCl2
Dissection solution, sterile filtered BME medium (GibcoBRL) supplemented with:
(primary neuron cultures) 0.5 mg/ml DNase I
2.5 mg/ml glucose
DNA sample buffer, 5fold 20 % glycerol
(DNA gels) 0.025 % Orange G
in TAE buffer
dNTP stock solution 20 mM each dATP, dCTP, dGTP, dTTP
(PCR)
Fixing solution 4 % paraformaldehyde in PBS, pH 7.4
(immuncyto-/histochemistry) 2 % paraformaldehyde in PBS for postfixation
heated to 65°C, stirred constantly until cooled to RT
Fixing solution, 10fold 25 % glutaraldehyde
(neurite outgrowth assay)
II MATERIAL 21
Gibco buffer, 10fold 200 mM Tris-HCl, pH 8.75
(PCR) 100 mM KCl
100 mM (NH4)2SO4
20 mM MgSO4
1 mg/ml BSA
1 % Triton X-100
LB-medium, autoclaved 10 g/l bacto-tryptone, pH 7.4
(E.coli cultures) 10 g/l NaCl
5 g/l yeast extract
LB-amp medium 100 mg/l ampicillin in LB-medium
(E.coli cultures)
LB-amp plates 20 g/l agar in LB-medium
(E.coli cultures) 100 mg/l ampicillin supplemented prior to use
Ligation buffer, 10fold 200 mM Tris-HCl, pH 7.9
(DNA ligation) 100 mM MgCl2
100 mM DTT
6 mM ATP
Lysis buffer II, 5fold 100 mM Tris-HCl, pH 7.5
(brain homogenisation, cell lysis) 750 mM NaCl
5 mM EDTA
5 mM EGTA
5 % Nonidet-P40
MOPS buffer, 2fold 100 mM MOPS
(DNA electroelution) 1.5 M NaCl
adjust to pH 7
8-OH-DPAT solution (±)-8-hydroxy-2-(di-n-propylamino)tetralin
(hypothermia induction) required concentration in sterile 0.9 % NaCl solution
PBS 150 mM NaCl
20 mM Na3PO4, pH 7.4
Permeabilisation solution 0.25 % Triton X-100 in PBS
(immuncyto-/histochemistry)
II MATERIAL 22
Protease inhibitor mix, 25fold 1 tablet in 2 ml PBS
(Complete, Roche)
SDS running buffer, 10fold 250 mM Tris-HCl, pH 8.3
(SDS-PAGE) 1.92 M glycine
1 M SDS
SDS sample buffer, 5fold 62.5 mM Tris-HCl, pH 6.8
(SDS-PAGE) 50 % glycerol
12.5 % SDS
5 % 2-mercapto-ethanol
1 % bromphenol blue
Separating gel 8 % 375 mM Tris, pH 8.8
(SDS-PAGE) 0.1 % SDS
8 % acrylamide -bis 29:1
0.02 % APS
0.1 % TEMED
Stacking gel 5 % 120 mM Tris, pH 6.8
(SDS-PAGE) 7.5 % SDS
6 % acrylamide -bis 29:1
0.1 % APS
0.1 % TEMED
Staining solution 1 % toluidine blue O
(cerebellar neuron cultures) 1 % methylene blue
1 % Na-tetraborate
stirred overnight, filtered
Staining solution 0.5 µg/ml ethidiumbromide in TAE
(DNA gels)
TAE, 50fold 2 M Tris-actetate, pH 8
(DNA gels) 100 mM EDTA
TFB I 100 mM RbCl
(competent E.coli) 50 mM MnCl2
30 mM K-acetate
10 mM CaCl2
II MATERIAL 23
15 % glycerol
adjust to pH 5.8
TFB II 10 mM MOPS
(competent E.coli) 10 mM RbCl
75 mM CaCl2
15 % glycerol
adjust to pH 8
TBS 10 mM Tris-HCl, pH 8
150 mM NaCl
TBS-T 0.1 % Tween 20 in TBS
TE, 10fold 100 mM Tris-HCl, pH 7.5
10 mM EDTA
Transfer buffer 25 mM Tris
(western blot) 192 mM glycine
0.001 % SDS
10 % methanol
X-1 medium, sterile filtered BME medium (GibcoBRL) supplemented with:
(cerebellar neuron cultures) 50 U/ml penicillin/streptomycin
1 % BSA
10 µg/ml insulin
4 nM L-thyroxin
100 µg/ml transferrin, holo
0,027 TIU/ml aprotinin
30 nM Na-selenite
1 mM Na-pyruvate
4 mM L-glutamine
3 Molecular weight standards
1 kb DNA Ladder (Life Technologies, GibcoBRL, Karlsruhe, Germany)
12 bands from 1018 to 12216 bp, additionally fragments from 75 to 1636 bp
100 bp DNA Ladder (Life Technologies)
15 bands from 100 to 1500 bp in 100 bp steps, additionally 2072 fragment
II MATERIAL 24
Smart Ladder (Eurogentec, Liège, Belgium)
14 bands from 200 to 10000 bp
5 µl/lane gives the amount (ng) as 1/100 of the bp size of each band.
BenchMark™ Prestained Protein Ladder (Life Technologies)
10 bands from 8.4 kD to 182.9 kD
4 Plasmids
pBluescriptIIKS (+/-) phagemid (Stratagene, La Jolla, USA) 3kb, Ampr
L1 cDNA \ EcoR I has been inserted (produced in the lab of Prof. Schachner) and was
the source for the genetic sequence of L1.
pSP72 vector (Promega, Mannheim, Germany), 2.5kb, Ampr
The vector was used for an intermediate cloning step.
pTSC21k (gift of Dr. H. van der Putten, Novartis, Basel, Switzerland), 9kb, Ampr
This vector contained a modified Thy-1.2 cassette and was the final targeting vector
for the L1 cDNA.
Maps are listed in the appendix.
5 Oligonucleotides
Primers were used for sequencing of L1 cDNA (L1 X1; DeIa2; DeIIa; DeIIIa; DeIVa;
Apa1; Apa2; DeIb1), sequencing of L1 cDNA and checking orientation of L1 cDNA in the
pTSC21k vector (L1 3’down; L1 5’ up), and genotyping with “T” PCR (L1-292; L1-709; L1-
C; L1-D) or “KO” PCR (L1 arm2; tTAup3; L1-5'up2). They were designed appropriate for
the application (PCR or DNA sequencing) according to the general rules. All oligonucleotides
were ordered at Metabion (Munich, Germany). Sequences are listed in the appendix
6 Antibodies
6.1 Primary antibodies
All antibodies were directed against mouse proteins.
anti-calbindin monoclonal, mouse (Sigma-Aldrich, Deisenhofen, Germany)
dilution 1000fold
anti-GAPDH monoclonal, mouse (Chemicon, Temecula, USA)
dilution 2000fold
anti-L1 (1) polyclonal, rabbit (Dr. F. Plöger, ZMNH)
dilution 8000fold for western blots
II MATERIAL 25
anti-L1 (2) polyclonal, rabbit (Faissner et al., 1985)
dilution 500fold immunostaining
anti-L1 “555” monoclonal, rat (Appel et al., 1995)
dilution 100fold immunostaining, 20000fold western blots
anti-MAP2 polyclonal, rabbit (Sigma-Aldrich)
dilution 200fold
anti-neurofilament polyclonal, rabbit (Abcam Ltd., Cambridge, UK)
dilution 4000fold
anti-parvalbumin monoclonal, mouse (Sigma-Aldrich)
dilution 1000fold
anti-synaptophysin polyclonal, rabbit (Acris, Hiddenhausen, Germany)
dilution 200fold
anti-tyrosinehydroxylase polyclonal, rabbit (Chemicon)
dilution 500fold
6.2 Secondary antibodies
All secondary antibodies directed against Ig of the species of the primary antibody
were purchased at Dianova (Hamburg, Germany). Antibodies coupled to horseradish
peroxidase (HRP) were diluted 10000fold for western blot analysis. Cyanine2 (Cy2) and
Cyanine3 (Cy3) coupled antibodies were diluted 100fold for indirect immunofluorescence
staining.
7 Bacterial strain
Escherichia coli DH5α (Clontech, Heidelberg, Germany): deoR, endA1, gyrA96,
hsdR17(rk-mk
+), recA1, relA1, supE44, thi-1, ∆(lacZYA-argFV169) Φ80lacZ∆M15, F-.
Bacteria were made competent for transformation with plasmid DNA or ligation mixtures.
8 Mouse strains
Foster mothers and oocytes retrieved for pronuclear injection were of the 129Ola
background. First offspring were backcrossed into the C57BL/6J background. Following
generations were crossed with the KO strain (Rolf et al., 2001) into the C57BL/6J background
and into the 129Svj background. All WT mice of the various genetic backgrounds were
originally from The Jackson Laboratory, Bar Harbor, USA.
III METHODS 26
III METHODS
1 Molecular biology
1.1 Production of chemically competent bacteria
(Inoue et al., 1990)
E.coli DH5α bacteria were streaked on LB-plates and incubated at 37°C overnight.
Single colonies were picked and inoculated in 10 ml LB-medium at 37°C overnight. 1 ml of
this overnight culture was diluted 100fold with LB-medium and shaken at 37°C until the
optical density of OD600 = 0.5 (Spectrometer Ultraspec 3000, Amersham Pharmacia Biotech,
Freiburg, Germany) was reached (after 90-120 min). The culture was cooled on ice and
centrifuged (4000xg, 4°C, 5 min). The supernatant was discarded and the cells were
resuspended in 30 ml ice cooled TFB I buffer. The suspension was kept on ice for 90 min.
After centrifugation (4000xg, 4°C, 5 min) the supernatant was discarded again and the cell
pellet resuspended in 4 ml ice cold TFB II buffer. The competent bacteria were frozen in
aliquots in dry ice/ethanol mixture and stored at -80°C.
1.2 Transformation of competent bacteria
(Sambrook et al., 1989)
To transform bacteria 100 µl of competent bacteria were incubated with 10-100 ng
plasmid DNA or a ligation mixture on ice for 30 min. After heat shock at 42°C for 2 min and
successive incubation on ice for 5 min, the bacteria were shaken with 1 ml LB-medium at
37°C for 60 min. The cells were streaked out on LB-plates supplemented with the appropriate
antibiotic and cultivated at 37°C overnight.
1.3 Plasmid DNA isolation of E.coli bacterial cultures
(Sambrook et al., 1989)
Small scale (GFX Micro Plasmid Prep Kit, Macherey und Nagel, Düren, Germany)
An overnight culture of transformed bacteria was centrifuged (15800xg, RT, 1 min).
Plasmid DNA was isolated from the bacterial cell pellet according to the manufacturer’s
protocol (lysis, precipitation of cell debris, plasmid DNA binding to column, washing). DNA
was eluted with 50 µl 10 mM Tris-HCl, pH 8 (50°C) by centrifugation (15800xg, RT, 2 min).
III METHODS 27
Large scale (Plasmid Maxi Kit, Qiagen, Hilden, Germany)
3 ml of a starter culture of transformed bacteria were inoculated with 300 ml LB-
medium with the appropriate antibiotic and shaken (220 rpm) at 37°C overnight. Cells were
pelleted (6000xg, 4°C, 15 min) and the plasmid DNA was isolated as described in the
manufacturer’s protocol. The procedure resembled that of the small scale plasmid isolation,
but in addition DNA was precipitated with ethanol. Finally, the DNA pellet was dissolved in
600 µl 10 mM Tris-HCl, pH 8 (~50°C).
1.4 Enzymatic modification of plasmid DNA
(Sambrook et al., 1989)
Restriction of plasmid DNA
DNA was incubated with twice the recommended amount of restriction enzymes (New
England Biolabs, Frankfurt am Main, Germany and MBI Fermentas, St. Leon Rot, Germany)
in the recommended buffer at the appropriate temperature for 2 h. Restriction was terminated
by addition of DNA sample buffer and checked by agarose gel electrophoresis. The restriction
product was either used directly or purified by the Concert Rapid PCR Purification System or
eluted from an agarose gel after electrophoretic separation.
Ligation of DNA fragments
DNA fragments were ligated by mixing 50 ng vector DNA with the 5fold molar
excess of insert DNA and 1 U of T4 Ligase (New England Biolabs, Frankfurt am Main,
Germany) in ligation buffer. The reaction mix was incubated either at RT for 2 h or at 16°C
overnight. The mixture was used directly for transformation without any further purification.
1.5 Purification of PCR products
(Concert Rapid PCR Purification System, GibcoBRL, Karlsruhe, Germany)
The product of a restriction reaction was purified with this kit directly following the
manufacturer’s protocol. DNA was eluted from the column with 50 µl 10 mM Tris-HCl, pH 8
(65°C) by centrifugation (15800xg, RT, 2 min).
1.6 DNA gel electrophoresis
(Sambrook et al., 1989)
DNA fragments were separated in agarose gels using horizontal electrophoresis
chambers (Bio-Rad, Munich, Germany). Gels were prepared with 0.7-2 % agarose depending
III METHODS 28
on the size of DNA fragments and submerged with TAE buffer in the electrophoresis
chamber. Samples mixed with loading buffer were applied next to a molecular weight marker
and the gel was run at constant voltage (10V/cm gel length) until the orange G dye had
reached the end of the gel. Afterwards, the gel was stained in an ethidiumbromide solution for
20 min and documented using the E.A.S.Y. UV-light documentation system (Herolab,
Wiesloh, Germany).
1.7 Extraction and purification of DNA fragments from agarose gels
1.7.1 Column purification as preparation for cloning
(Concert Gel Extraction System, GibcoBRL)
Ethidiumbromide stained gels were illuminated with UV light and the appropriate
DNA band was excised from the gel and transferred into an Eppendorf tube. The fragment
was isolated following the manufacturer’s protocol. The fragment was eluted from the column
with 50 µl 10 mM Tris-HCl, pH 8 (70°C) by centrifugation (15800xg, RT, 2 min).
1.7.2 Electroelution as preparation for pronuclear injection
(Plasmid Maxi Kit, Qiagen)
After electrophoretic separation of the DNA fragments, the agarose gel was briefly
stained in an ethidiumbromide solution and the appropriate band excised under UV light
illumination. The segment was transferred into a dialysis bag with TAE running buffer to be
subjected to electrophoresis as described above for DNA agarose gels. When the DNA was
completely eluted (check under UV light) into the buffer, the solution in the dialysis bag was
transferred into a falcon tube and the pH adjusted by dilution with MOPS buffer, pH 7. This
mixture was applied to the column and the DNA was eluted according to the manufacturer’s
protocol. Then DNA was precipitated with ethanol and dissolved in aqua ad injectabila.
1.8 Determination of DNA purity and concentration
DNA concentrations were determined with the spectrometer Ultraspec 3000
(Amersham Pharmacia Biotech). The absorbance at 260 nm, 280 nm, and 320 nm was
measured. Absorbance at 260 nm had to be higher than 0.1 but less than 0.6 for reliable
determinations. A ratio of A260/A280 between 1.8 and 2 indicated sufficient purity of the
DNA preparation.
III METHODS 29
DNA prepared for pronuclear injection was diluted to a concentration of 100 ng/µl.
Purity was additionally checked by agarose gel electrophoresis as described above. The DNA
amount was calculated by correlation to the Smart Ladder.
1.9 DNA sequencing
DNA sequencing was performed by the sequencing facility of the ZMNH using Step-
by-Step protocols for DNA-sequencing with Sequenase-Version 2.0, 5th ed., USB, 1990. For
the preparation, 1 µg of DNA dissolved in 10 mM Tris-HCl, pH 8 and 10 pmoles of the
appropriate sequencing primer were diluted with bi-distilled water to a final volume of 8 µl.
1.10 Computer assisted sequence analysis
Sequence analyses and -comparisons were performed with the Lasergene programme
DNASTAR. The database “BLASTN” of the NCBI (National Centre for Biotechnology
Information) served as reference.
1.11 Pronuclear injection
Pronuclear injection was performed by the transgenic animal facility of the ZMNH.
The linearised DNA was injected into the nucleus of fertilised oocytes and these implanted
into pseudo pregnant female mice (Hogan et al., 1994). Offspring were then tested for the
insertion of the transgene into their genome by PCR of DNA extracted from tailcut biopsies.
2 Protein biochemistry
2.1 Brain homogenisation
Mice of the appropriate ages were decapitated. Young mice (postnatal day 6 to 21)
were narcotised in halothane saturated atmosphere, adult mice were killed by CO2 exposure
before decapitation. Brains were removed from skulls and immediately homogenised with the
2fold volume of lysis buffer II supplemented with protease inhibitors in a Dounce
homogenizer (Weaton, Teflon pestle, 0.1 µm). The suspension was centrifuged (20000xg,
4°C, 45 min) and the supernatant frozen at -20°C for 60 min. The sample was thawed on ice
and centrifuged again under the same conditions. The supernatant was separated from the
pellet for further use.
III METHODS 30
2.2 Lysis of cerebellar granule cells
Granular cells of cerebella were dissociated as described below. The cell pellet was
suspended in lysis buffer II supplemented with complete and incubated on ice for 30 min. The
suspension was centrifuged (1000xg, 4°C, 15 min). The total protein content of the
supernatant was determined using the BCA kit as described below to prepare samples for
SDS-PAGE.
2.3 Determination of protein concentration with the BCA assay
(Ausubel, 1996)
(BCA kit, Pierce, Rockford, USA)
Solution A and B were mixed in a ratio of 1/50 to give the reaction solution. 10 µl of
sample was applied to 200 µl of the solution in microtitre plates and incubated at 37°C for 30
min. BSA standards ranging from 125 µg/ml to 1.5 mg/ml were simultaneously incubated
with the solution. The extinction was determined at 562 nm in the microtitre plate by an
ELISA reader (Micronaut Skan, Merlin, Bornheim-Hersel, Germany). The protein content of
the samples was calculated by correlation to the BSA standards.
2.4 Digestion of brain homogenate with the enzyme endoglycosidase H
Brain homogenate was adjusted to 40 µg total protein content in a small volume of
SDS sample buffer with PBS. After heating to 95°C for 5 min, protease inhibitors and 10 U of
the enzyme endoglycosidase H (New England Biolabs, Frankfurt am Main, Germany) in 75
mM Na-citrate buffer, pH 5.5, were added. The samples were incubated at 37°C overnight
and prepared for SDS-PAGE the next day.
2.5 Sodiumdodecylsulfate-polyacrylamide gel electrophoresis (SDS-
PAGE)
(Laemmli, 1970)
Proteins were separated by discontinuous sodiumdodecylsulfate-polyacrylamide gel
electrophoresis (SDS-PAGE) using the Mini-Protean III system (Bio-Rad, Munich,
Germany). 1mm thick gels were prepared composed of a separating gel with 8 % acrylamide
and a narrow stacking gel with 5 % acrylamide. After complete polymerisation of the gel, the
chamber was assembled as described in the manufacturer’s protocol. Samples (mixed with
SDS sample buffer and boiled for 2 min) were loaded next to the BenchMark™ Prestained
Protein Ladder and the gel was run in SDS running buffer at constant voltage of 80 V until the
III METHODS 31
samples had entered the stacking gel (~ 10 min). Then voltage was raised to 150 V until the
bromphenol blue line had reached the end of the gel. Gels were then subjected to western
blotting.
2.6 Western blot analysis
2.6.1 Electrophoretic transfer of proteins to nitrocellulose membrane
(western blot)
(Towbin et al., 1979)
Proteins previously separated by SDS-PAGE were transferred from the gel onto a
nitrocellulose membrane (Protran Nitrocellulose, Schleicher & Schüll, Dassel, Germany)
using a MINI TRANSBLOT-apparatus (Bio-Rad). After equilibration of the gel in transfer
buffer for 5 min, the blotting sandwich was assembled as described in the manufacturer’s
protocol. Proteins were electrophoretically transferred in transfer buffer at constant voltage
(85 V, 4°C, 120 min). The BenchMark™ Prestained Protein Ladder served as molecular
weight marker and as a control for the efficiency of the transfer.
2.6.2 Immunological detection of proteins on nitrocellulose membrane with
enhanced chemiluminescence
(Ausubel, 1996)
After electrophoretic transfer, the membranes were removed from the sandwich and
washed once in TBS before incubation with blocking buffer at RT for 1 h. Then the primary
antibody was applied either at RT for 2 h or at 4°C overnight. The primary antibody was
removed and membranes were washed 5x 5 min with TBS-T. The appropriate secondary
horseradish peroxidase (HRP)-coupled antibody was applied for 1 h at RT. Membranes were
washed again 5x 5 min with TBS-T.
Immunoreactive bands (complexes composed of protein bound to nitrocellulose
membrane, primary antibody, and secondary HRP-coupled antibody) were visualized using
the enhanced chemiluminescence detection system (ECL, Pierce, Rockford, USA). The
membrane was soaked for 1 min in detection solution (1/1 mixture of solutions I and II). After
removal of the solution the membrane was placed between two Saran wrap foils and exposed
to X-ray film (BioMax MR, Kodak) in the dark. Signals on the film were developed and fixed
with Kodak solutions.
To quantify the signal intensity films were scanned with maximal resolution and
analysed with the computer software TINA 5 (open source). Data were evaluated with the
III METHODS 32
Mann Whitney t-test, two-tailed, and are shown as mean ± S.E.M. (standard error of the
mean) and in percent with WT set to 100 %.
3 Cell culture of primary neurons
3.1 Preparation and cultivation of dissociated hippocampal neurons
The experiments were performed by Vladimir Sytnyk.
Hippocampal neurons of mice of postnatal day 1-4 were prepared as described
(Lochter et al., 1991) and grown on PLL coverslips under sterile conditions. The procedure
comprised dissection, enzymatic digestion, mechanical dissociation, and removal of cell
debris prior to plating the cells.
Mice were decapitated and brains removed from skull. Brains were cut along the
midline; hippocampi were released and split into 1 mm thick pieces. Hippocampi were
washed twice with dissection solution and treated with trypsin/DNase I at RT for 5 min.
Digestion solution was removed, hippocampi were washed twice with dissection solution.
Hippocampi were suspended in dissection solution containing DNase I. Tituration with glass
pasteur pipettes having successively smaller diameters dissociated the hippocampi to a
homogeneous suspension. Cell debris was removed by centrifugation (80xg, 4°C, 15 min).
The cell pellet was resuspended in dissection buffer. An aliquot of cells was stained with
trypan blue to be counted in a Neubauer cell chamber. Cells were then plated on PLL coated
coverslips (method described below) to provide a density of 1000 cells/mm2. They were
cultivated on PLL coated coverslips under constant CO2 atmosphere of 5 % at 37°C for the
required time period.
3.2 Preparation and cultivation of dissociated cerebellar neurons
Cerebellar neurons of mice of postnatal day 7 were prepared and cultivated similar to
the protocol of hippocampal neuron cultures under sterile conditions.
Mice were decapitated and the sculls opened. Cerebella were pinched out and split into
3 pieces in HBSS buffer (GibcoBRL). Cerebella were washed with HBSS and then treated
with trypsin and DNase I at RT for 15 min. Digestion solution was removed by washing
cerebella 3x with ice cooled HBSS. Cerebella were suspended in dissection solution
containing DNAse I. Tituration with glass Pasteur pipettes having successively smaller
diameters dissociated cerebella to homogeneous suspensions. The suspension was diluted
with ice cooled HBSS and centrifuged (100xg, 4°C, 15 min). The cell pellet was resuspended
in X-1 medium. After staining an aliquot with trypan blue, cells were counted in a Neubauer
III METHODS 33
cell chamber and diluted in X-1 medium to provide a density of 2x 10⁵ and 1x 10⁵
cells/coverslip. Neurons were cultivated on coverslips coated with the appropriate substrate
(method described below) under constant CO2 atmosphere of 5 % at 37°C for the required
time period.
3.3 Neurite outgrowth assay of dissociated cerebellar neurons
Coverslips were coated with poly-L-lysine (PLL) at 4°C overnight, washed 3x with bi-
distilled H2O and dried under sterile conditions. Human L1-Fc (10 µg/ml) or laminin (2
µg/ml, positive control) were coated on these PLL coverslips at 4°C overnight. As a negative
control coverslips coated only with poly-L-lysine were used. The solutions were removed and
coverslips kept in HBSS until neurons were dissociated as described above. The cells were
plated with densities of 2x 10⁵ and 1x 10⁵ cells/coverslip. Neurons were allowed to grow at
37°C under 5 % CO2 for 24 h. Cells were then fixed at RT for 1 h. After removal of the fixing
solution by washing with H2O, neurons were stained with toluidine blue at RT for 30 min.
Coverslips were washed 2x with H2O and dried at RT before mounting them on glass slides
with the quick hardening mounting medium Eukitt (Sigma-Aldrich, Steinheim, Germany).
Cells were imaged with a Kontron microscope (Carl Zeiss, Göttingen, Germany) and analysed
with Carl Zeiss Vision KS 400 V2.2 software. For each experimental value, neurites of at
least 50 cells with neurites longer than the cell body diameter were measured (Lochter et al.,
1991). Results were statistically evaluated with a nonparametric one way ANOVA test
(Kruskal Wallis test) followed by the Dunn’s multiple comparison post hoc test, two-tailed.
Values are presented as mean ± S.E.M.
4 Immunocytochemistry of fixed primary dissociated neuron cultures
Cultured dissociated neurons were fixed at RT for 15 min. The fixation solution was
removed by washing with PBS 4x 5 min. The cells were blocked at RT for 15 min before
application of the first polyclonal primary antibody (here against L1, rabbit) at RT for 60 min.
After washing 4x 5 min with PBS, the secondary antibody (anti-rabbit-Cy3) was applied at
RT for 45 min to achieve indirect immunofluorescence. This was followed by washing 4x 5
min in PBS and postfixation at RT for 5 min. Fixing solution was removed by washing 2x 5
min with PBS. Now cells were permeabilised with at RT for 5 min. They were briefly washed
with PBS and incubated with blocking solution at RT for 30 min. Now a monoclonal primary
antibody against L1 (555, rat) was applied in humid atmosphere at 4°C overnight. Next day
coverslips were washed 4x 5 min in PBS and exposed to secondary antibody (anti-rat-Cy2) at
III METHODS 34
RT for 60 min. Again cells were washed 4x 5 min and postfixed at RT for 5 min. They were
then washed 1x 5 min with PBS and mounted onto glass slides with Aqua-Poly/Mount
(Polysciences, Warrington, USA). Coverslips were stored at 4°C in the dark. Neurons were
visualised with a confocal laserscanning microscope (Carl Zeiss, Göttingen, Germany) and
the pictures obtained with the compatible digital camera were analysed with the computer
software Scion Image (open source, Scion Corp., Frederick, USA). Statistical evaluation was
based on the Mann Whitney t-test, two-tailed. Data are shown as mean ± S.E.M. and as box
extending from 25 percentile to 75 percentile with the median as line at 50 percentile and with
whiskers marking highest and lowest values.
5 Immunohistochemistry
5.1 Indirect immunofluorescence staining of fresh frozen tissue sections
Mice were sacrificed by exposure to CO2 and organs (brain, spinal cord, eyes, and
sciatic nerve) were removed. The tissue was embedded in Tissue-Tek® O.C.T. compound
(Sakura Finetek, Zoeterwonde, Netherlands) and frozen in isopentan cooled in liquid nitrogen.
14 µm thick frontal or sagittal cryosections were prepared at a cryostat (Leica, Bensheim,
Germany) and melted onto superfrosted glass slides. They were dried at RT for 60 min before
further use. After fixation in methanol at -20°C for 10 min, the tissue was rehydrated with
PBS at RT for 10 min. Then slides were submerged with blocking solution and after washing
5x 5 min with PBS incubated with primary antibody at 4°C overnight. Next day the samples
were washed as before and incubated with the appropriate secondary antibody coupled to Cy2
or Cy3 at RT for 120 min for indirect immunofluorescence. After another washing step as
above the sections were protected with Aqua-Poly/Mount under coverslips and kept at 4°C in
the dark. Sections were imaged with an Axiophot fluorescence microscope (Carl Zeiss,
Göttingen, Germany), with compatible digital camera and software.
5.2 Indirect immunofluorescence staining of fixed tissue sections
Mice were deeply anesthetized and perfused through the left heart ventricle with the
fixing solution. Brains were removed and postfixed in the same fixative at 4°C overnight.
Tissue was embedded into agar and 40 µm thick frontal or sagittal slices, cut with a vibratome
(Leica, Bensheim, Germany), were collected in PBS. Sections were blocked at RT for 2 h
followed by incubation with the required primary antibody at RT 2 h. After washing 3x 10
min at RT in PBS, sections were incubated with the appropriate Cy2 or Cy3 conjugated
secondary antibody at RT for 1 h, washed as above and mounted with Aqua-Poly/Mount on
III METHODS 35
glass slides. Imaging and analysis of tissue by indirect immunofluorescence was performed
with an Axiophot fluorescence microscope (Zeiss, Göttingen, Germany).
6 Behavioural biology
6.1 Housing conditions
At the age of 6-8 weeks, at least 13 male mice of each genotype (WT; WT_T; KO;
KO_T; third generation of backcrossing into the 129Svj background) were transferred from
the breeding facility into a vivarium with an inverted 12 : 12 light : dark cycle (light off at
7:00 am) and maintained under standard housing conditions (21 ± 1°C, 40-50 % humidity,
food and water ad libitum). They were kept grouped with their original littermates (3-4 mice
in macrolon type II long cages 13 x 20 x 23 cm) and were given two weeks to acclimatise to
the new environment before testing started. After a series of experiments the mice were
isolated and kept single housed in macrolon type II 22 x 16 x 14 cm cages during the
remaining tesing phase.
6.2 General protocol
All behavioural tests were performed during the dark cycle in a room next to the
vivarium that was illuminated with dim red light. Tests were started at least 2 h after light
offset and ended 2 h before light onset. Light intensity during the tests was measured with a
digital luxmeter (RO-1332, Rotronic Messgeräte GmbH, Ettlingen, Germany). The
experimental equipment was cleaned with soap, water, and 70 % ethanol after each contact
with an animal.
To avoid a “litter effect”, no more than two males/genotype were used from the same
litter. Each mouse went through the same temporal order of experiments as follows, with a
break of at least two days between experiments: open field, light/dark test, elevated-plus
maze, pole test, wire hanging test, rotarod, new cage/new object exploration (isolation, from
now on single housed, approximately two months after start of the testing phase, ten days
break), open field, elevated-plus maze, free-choice open field, circadian activity, step-through
passive avoidance, 8-OH-DPAT-induced hypothermia.
One KO and one KO_T mouse displayed abnormal movement by repeated rotation
around their own body. They were excluded from the analysis of the open field, the light/dark
field, the new object/new cage exploration, and the elevated-plus maze tests. One KO and two
KO_T mice died in the course of the behavioural studies (cause unknown). Table 1
summarises the number of mice/genotype included for evaluation of the data.
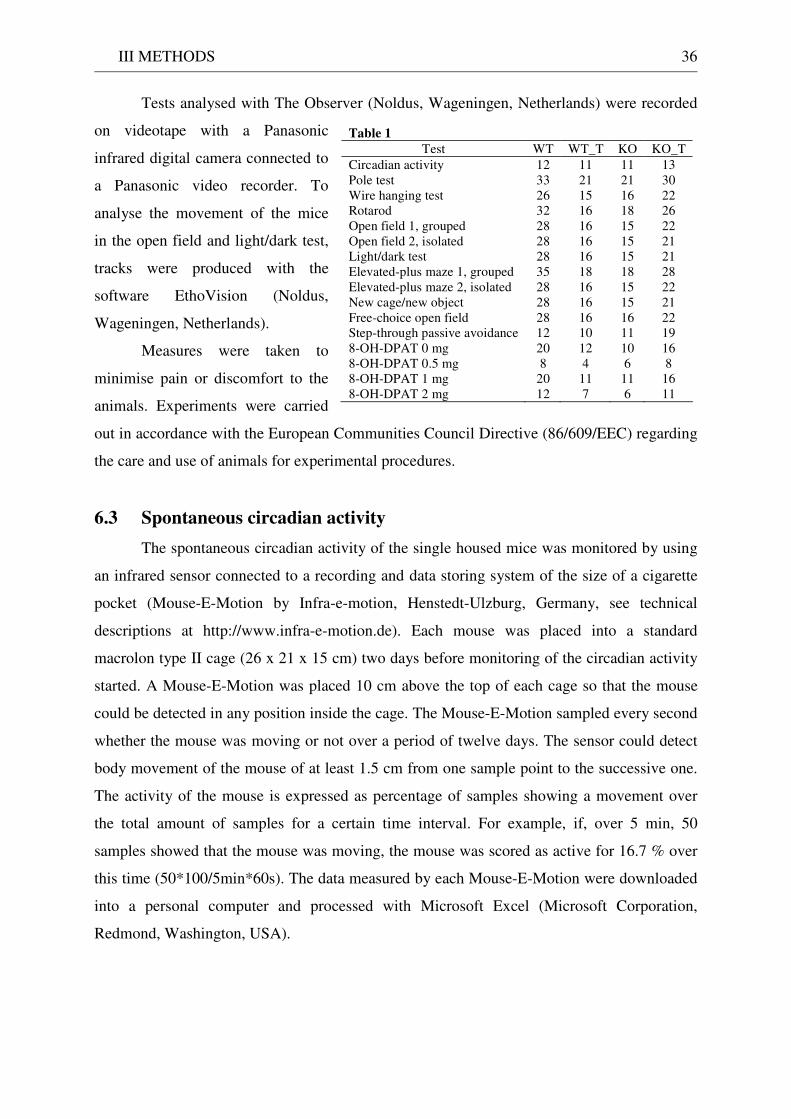
III METHODS 36
Tests analysed with The Observer (Noldus, Wageningen, Netherlands) were recorded
on videotape with a Panasonic
infrared digital camera connected to
a Panasonic video recorder. To
analyse the movement of the mice
in the open field and light/dark test,
tracks were produced with the
software EthoVision (Noldus,
Wageningen, Netherlands).
Measures were taken to
minimise pain or discomfort to the
animals. Experiments were carried
out in accordance with the European Communities Council Directive (86/609/EEC) regarding
the care and use of animals for experimental procedures.
6.3 Spontaneous circadian activity
The spontaneous circadian activity of the single housed mice was monitored by using
an infrared sensor connected to a recording and data storing system of the size of a cigarette
pocket (Mouse-E-Motion by Infra-e-motion, Henstedt-Ulzburg, Germany, see technical
descriptions at http://www.infra-e-motion.de). Each mouse was placed into a standard
macrolon type II cage (26 x 21 x 15 cm) two days before monitoring of the circadian activity
started. A Mouse-E-Motion was placed 10 cm above the top of each cage so that the mouse
could be detected in any position inside the cage. The Mouse-E-Motion sampled every second
whether the mouse was moving or not over a period of twelve days. The sensor could detect
body movement of the mouse of at least 1.5 cm from one sample point to the successive one.
The activity of the mouse is expressed as percentage of samples showing a movement over
the total amount of samples for a certain time interval. For example, if, over 5 min, 50
samples showed that the mouse was moving, the mouse was scored as active for 16.7 % over
this time (50*100/5min*60s). The data measured by each Mouse-E-Motion were downloaded
into a personal computer and processed with Microsoft Excel (Microsoft Corporation,
Redmond, Washington, USA).
Table 1
Test WT WT_T KO KO_T Circadian activity 12 11 11 13 Pole test 33 21 21 30 Wire hanging test 26 15 16 22 Rotarod 32 16 18 26 Open field 1, grouped 28 16 15 22 Open field 2, isolated 28 16 15 21 Light/dark test 28 16 15 21 Elevated-plus maze 1, grouped 35 18 18 28 Elevated-plus maze 2, isolated 28 16 15 22 New cage/new object 28 16 15 21 Free-choice open field 28 16 16 22 Step-through passive avoidance 12 10 11 19 8-OH-DPAT 0 mg 20 12 10 16 8-OH-DPAT 0.5 mg 8 4 6 8 8-OH-DPAT 1 mg 20 11 11 16 8-OH-DPAT 2 mg 12 7 6 11
III METHODS 37
6.4 Motor function
6.4.1 Pole test
In the pole test, motor coordination was monitored while mice were climbing down a
pole consisting of a rough-surfaced vertical wooden rod (48.5 cm long, 0.8 cm in diameter)
illuminated with white light of 10 lux.The mice were placed head upward with all four paws
grasping on to the top end of the pole. To motivate the mouse to climb down, nesting material
of the mouse’s home cage was placed at the bottom of the pole. The mouse was given a
maximum of 80 s to reach the floor. The ability of the mouse to turn 180° and climb down
with the head pointing downwards was evaluated. In case the mouse turned, it was
documented whether it turned at the top (level 1, above 32 cm), at the middle (level 2,
between 32 and 16 cm) or at the bottom of the rod (level 3, below 16 cm). To test motor
learning, each mouse had to perform three consecutive trials with an intertrial interval of 30 s
during which the mouse was placed back into its home cage.
6.4.2 Wire hanging test
Mice were placed with their forepaws gripping the middle of a 50 cm long horizontal
metallic wire (1.5 mm in diameter) that was suspended 30 cm above a foam mattress
illuminated with white light of 10 lux. The mice had to perform three trials with an intertrial
interval of 45 min (maximum duration of each trial was 10 min). The ability to grip the wire
with 1-2 or 3-4 paws was scored.
6.4.3 Rotarod
Mice had to walk on a turning, corrugated rod (3.2 cm in diameter) (Accelerating
Rotarod for mice, Jones & Roberts, TSE systems, Bad Homburg, Germany). The rod was
started to rotate 5 s after the mice were placed onto it. Mice underwent five trials with an
intertrial interval of 45 min. Trials 1 and 2 were performed at slow, constant speed (4 rpm) for
a maximum duration of 3 min. Trials 3-5 were performed with the accelerating rod, increasing
from 4 rpm to 40 rpm within 4 min, with a maximum duration of 6 min. On the following
day, a sixth trial with the accelerating rod was carried out. The performance of the mice was
evaluated by scoring the latency to fall down.
III METHODS 38
6.5 Exploration / anxiety
6.5.1 Open field
The open field consisted of a 50 x 50 cm arena enclosed by 40 cm high walls made of
wood laminated with rough, matted light-grey resin illuminated with white light of 50 lux.
The mouse was gently placed in an opaque Plexiglas cylinder (∅ 11 x 23 cm) located in one
corner of the arena. As the cylinder was lifted after 10 s, the mouse could freely move in the
arena for 15 min which was videotaped. Boli were counted at the end of the trial.
The following parameters were calculated based on tracks generated by the software
EthoVision: locomotor activity in the form of total distance moved, mean velocity, maximal
velocity; thigmotaxis represented by mean distance to the wall; exploration/anxiety displayed
in time spent and distance moved in different imaginary zones of the arena (centre = inner
square of 20 x 20 cm, border = area along the walls of the arena of 5 cm width), latency to
enter the centre, number of entries into the different zones.
The following behavioural parameters were scored with the software The Observer for
the first 5 min of the first trial: stretch attend posture (SAP, calculated when the mouse
stretched forward and then retracted to the original position without forward locomotion,
parameter for risk assessment), rearing off wall (vertical exploration by standing on the hind
paws), rearing on wall (rearing with one or two forepaws touching the wall), self grooming
(expression of conflict), immobility (expression of anxiety), flat posture (slow forward
movement of the mouse for risk assessment).
6.5.2 Light/dark test
The test was performed in the boxes described for the open field test. As a
modification from commonly used tests with a box as the dark compartment, a quadrant of 25
x 25 cm in one corner of the open field arena was kept dim at 20 lux. Mice were started in the
brightly illuminated part of the box (white light of 200 lux) and left to freely explore the arena
for 10 min. Boli were counted at the end of the trial. Tracks were generated by the software
EthoVision to calculate the percentage of time spent in the dark quadrant, total distance
moved and mean velocity in the bright part of the arena.
6.5.3 Elevated-plus maze
The arena was made of white PVC and had the shape of a plus elevated 75 cm above
the ground. Its four arms were 30 cm long and 5 cm wide, connected by a 5 x 5 cm central
platform. Two opposing arms were bordered by 15 cm high walls (closed arms), whereas the
III METHODS 39
other two arms (open arms) were bordered by a 2 mm rim to provide some gripping surface.
The test was carried out in the dark and videotaped with an infrared camera. The mouse was
gently placed in the centre facing one of the open arms and observed for 5 min, then returned
to its home cage. Boli were documented at the end of the test.
Exploratory drive / anxiety of the mouse was deduced from the following parameters
analyzed with the software The Observer: latency to enter the open arms and closed arms;
latency to reach the edge of the open arms; number of entries into the arms (calculated when
all four paws on the arm) and centre (calculated when two paws in the centre); time spent in
closed arms, on open arms, and in the centre; SAP, rearing on wall, self grooming, and
protected head dips (exploratory head movement over the side of the open arms with the snout
pointing downwards with only the two front paws on one of the open arms while the rest of
the body remains in one of the closed arms or centre), unprotected head dipping (movement
of the head as in protected head dips, but with all four paws on one of the open arms).
6.5.4 New cage/new object exploration
Mice caged together were removed from their home cage and each simultaneously
placed separately into a new large cage (macrolon type III 38 x 22 x 15 cm) with fresh
bedding and food pellets in one corner. The cage was closed with a grid and illuminated with
white light of 10 lux. The mice were video recorded for 5 min and then they were left
undisturbed in this cage with free access to water. After 24 h the water bottle was removed for
the duration of the new object test. The behaviour in the cage (now familiar to the mouse) was
video recorded for 5 min before introducing a new object into the cage. A water bottle (7 x 7
x 10 cm) for rodents with the bottom cut off and with an entrance of 3 x 4 cm on one side
served as a new object. It was placed into one side of the cage standing upright with the
metallic top fixed between the bars of the cage top and the entrance facing the centre of the
cage. Behaviour of the mouse was videotaped for 5 min after the new object had been
introduced into the cage.
The following behavioural parameters determining arousal state of the mouse were
analysed using the software The Observer for the new cage test: self grooming, rearing
(definition as in open field, but no distinction between on and off wall), digging (rapid
movement of the front paws in the bedding), climbing (four paws on the grid at the top of the
cage), and motionless state. For the new object test additional behavioural parameters
concerning novelty seeking were scored: risk assessment (SAP towards the object), time in
contact with object, time spent at the wall of the cage opposing the object, rearing on the
III METHODS 40
object (vertical exploration of the object by standing on the hind paws with one or two front
paws on the object) and entries with head/body into the object.
6.5.5 Free-choice open field
Mice were single housed for two days in a macrolon type II long cage equipped with a
lockable hole (4 cm in diameter) at the bottom of one of the shorter walls. The cage (with the
hole closed) was placed next to an arena (75 x 90 cm) dimmly illuminated by 5 lux. The
whole arena was surrounded by 45 cm high walls. One short wall contained a gap where the
small side of the cage fitted in perfectly allowing direct access of the mouse from its home
cage into the arena through the hole. After 5 min the hole was opened and the mouse had 10
min to recognise this exit. As soon as the mouse realised the open door, it was given a
maximum of 10 min to enter the arena with four paws, otherwise the test was not pursued
further. The ratio of mice leaving the home cage wihtin this time was calculated for each
genotype.
6.6 Pharmacology: 8-OH-DPAT-induced hypothermia
In this paradigm the body temperature of the mouse was measured after peritoneal
injection of the 5-HT1A receptor agonist (±)-8-hydroxy-2-(di-n-propylamino)tetralin (8-OH-
DPAT). Based on the body weight of the mouse taken 1 h before the start of the test the
injection solution was prepared to administer a dose of either 0.5 mg/kg (8-OH-DPAT/body
weight) or 1 or 2 mg/kg. As a control only the saline carrier (0.9 % NaCl) was injected. The
thermometer CyQ 111 (CyberSense, Nicholasville, USA) was a wire introduced into the anus
of the mouse measuring the rectal temperature by voltage. Immediately before the injection
the body temperature of the mouse was taken as baseline value. Body temperature was
measured again 20 min after injection, then in 15 min intervals for 2 h. The mice were left
undisturbed in their home cages between measurements. The difference to the original body
temperature was calculated and the maximal decrease within 65 min after injection was
determined.
6.7 Learning and memory: step-through passive avoidance
A two chamber box equipped with a grid-floor (25 x 22 cm, 0.6 cm between bars, 1.1
mm in diameter) was used. The box was made of white PVC with a sliding door (5 x 5 cm)
connecting the two chambers, each 25 x 21 x 30 cm). One was illuminated with white light of
200 lux while the other remained dark (0.5 lux). On experimental day 1 mice were
III METHODS 41
familiarised with the set-up by placing them in the light chamber with the door closed for 1
min. Then the sliding door was raised. When the mouse encountered the open door for the
first time the latency to enter the dark chamber was taken. As soon as the mouse had entered
the dark compartment with all four paws the door was closed and a foot shock (1 s, 0,25 mA)
was delivered simultaneously. Immediately afterwards the mouse was placed back in its home
cage. Retention was tested 24 h later on experimental day 2 by repeating the procedure
without delivering a foot shock. Mice were given a maximum of 5 min to enter the dark
chamber, otherwise they were returned to their home cages. Latencies were documented.
6.8 Analysis of behavioural parameters
All experiments were done in a double blind manner, i.e. the experimentator was not
aware of the genotypes/treatment of the mice during experiments and data analysis.
Tests analysed with the software The Observer (Noldus, Wageningen, Netherlands)
were video recorded. A trained experimenter blind to the genotype of the mice analysed the
behaviour of the mice after training until he could repeatedly score at least 85 % of
consistency between two analyses performed at different times on the same mice, calculated
with the Reliability Test provided by the software The Observer (having 2 s as maximal time
discrepancy). Parameters evaluated are listed in the paragraphs of the individual tests above.
For the open field and light/dark test, tracks representing the position of the mice were
created and analysed with the software Ethovision (Noldus, Wageningen, Netherlands) with a
sampling rate of 5 samples/s. For the analysis of the tracks the minimal distance moved was
set to 1.6 cm, except for the parameter “minimal distance to a zone” (open field). This
parameter was analysed with a minimal distance moved of 0 cm to calculate the mean
distance the mouse kept from the “wall” (defined as a rim of 2 cm at the walls) of the open
field.. The other parameters analysed are explained in the paragraphs of the individual tests
above.
6.9 Statistical analysis of behavioural data
Data were analysed with non parametric statistical tests. Differences between
genotypes were tested with the Mann Whitney t-test (WT vs. WT_T mice) or the Kruskal
Wallis one way ANOVA test, followed by Dunn’s multiple comparisons post hoc test (WT
vs. KO vs. KO_T mice), when appropriate. open field and light/dark tests were additionally
split into intervals (open field: 3 x 5 min, 5 x 1 min for the first 5 min; light/dark test: 2 x 5
min) and analysed with the ANOVA for repeated measurements followed by the Newman
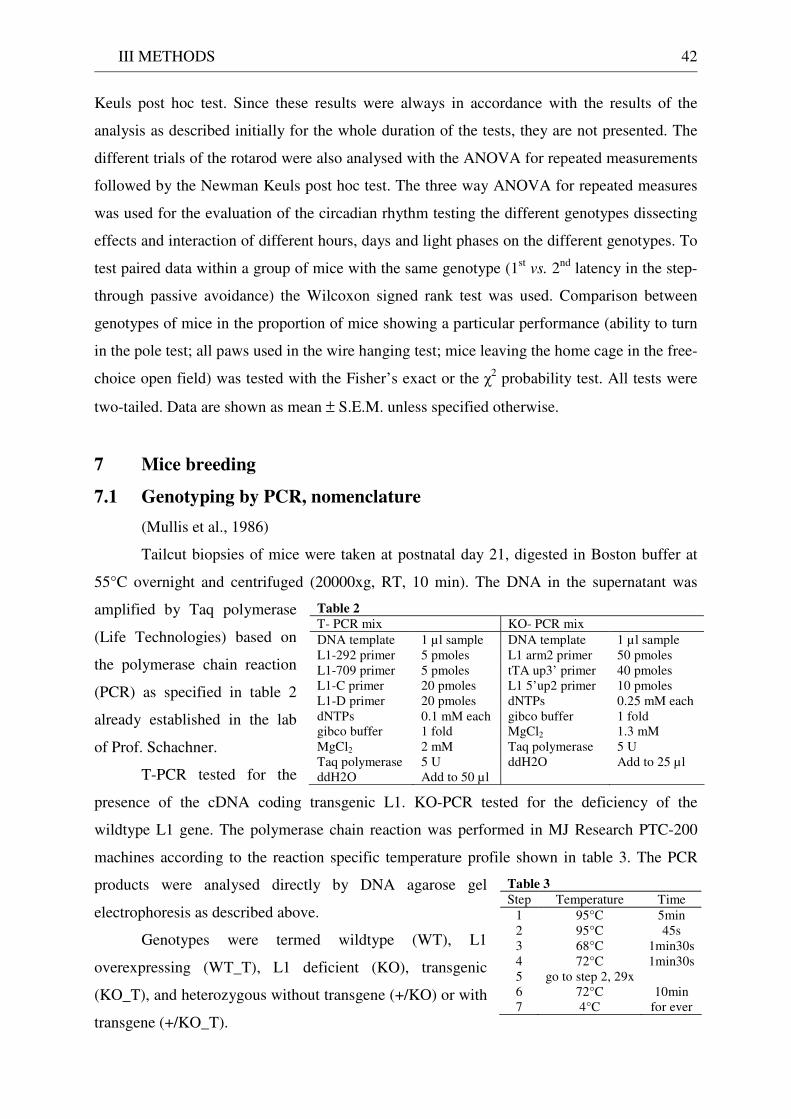
III METHODS 42
Keuls post hoc test. Since these results were always in accordance with the results of the
analysis as described initially for the whole duration of the tests, they are not presented. The
different trials of the rotarod were also analysed with the ANOVA for repeated measurements
followed by the Newman Keuls post hoc test. The three way ANOVA for repeated measures
was used for the evaluation of the circadian rhythm testing the different genotypes dissecting
effects and interaction of different hours, days and light phases on the different genotypes. To
test paired data within a group of mice with the same genotype (1st vs. 2nd latency in the step-
through passive avoidance) the Wilcoxon signed rank test was used. Comparison between
genotypes of mice in the proportion of mice showing a particular performance (ability to turn
in the pole test; all paws used in the wire hanging test; mice leaving the home cage in the free-
choice open field) was tested with the Fisher’s exact or the χ2 probability test. All tests were
two-tailed. Data are shown as mean ± S.E.M. unless specified otherwise.
7 Mice breeding
7.1 Genotyping by PCR, nomenclature
(Mullis et al., 1986)
Tailcut biopsies of mice were taken at postnatal day 21, digested in Boston buffer at
55°C overnight and centrifuged (20000xg, RT, 10 min). The DNA in the supernatant was
amplified by Taq polymerase
(Life Technologies) based on
the polymerase chain reaction
(PCR) as specified in table 2
already established in the lab
of Prof. Schachner.
T-PCR tested for the
presence of the cDNA coding transgenic L1. KO-PCR tested for the deficiency of the
wildtype L1 gene. The polymerase chain reaction was performed in MJ Research PTC-200
machines according to the reaction specific temperature profile shown in table 3. The PCR
products were analysed directly by DNA agarose gel
electrophoresis as described above.
Genotypes were termed wildtype (WT), L1
overexpressing (WT_T), L1 deficient (KO), transgenic
(KO_T), and heterozygous without transgene (+/KO) or with
transgene (+/KO_T).
Table 2
T- PCR mix KO- PCR mix DNA template 1 µl sample DNA template 1 µl sample L1-292 primer 5 pmoles L1 arm2 primer 50 pmoles L1-709 primer 5 pmoles tTA up3’ primer 40 pmoles L1-C primer 20 pmoles L1 5’up2 primer 10 pmoles L1-D primer 20 pmoles dNTPs 0.25 mM each dNTPs 0.1 mM each gibco buffer 1 fold gibco buffer 1 fold MgCl2 1.3 mM MgCl2 2 mM Taq polymerase 5 U Taq polymerase 5 U ddH2O Add to 25 µl ddH2O Add to 50 µl
Table 3
Step Temperature Time 1 95°C 5min 2 95°C 45s 3 68°C 1min30s 4 72°C 1min30s 5 go to step 2, 29x 6 72°C 10min 7 4°C for ever
III METHODS 43
7.2 Husbandry
Initially, mice carrying the transgene (WT_T) were backcrossed into the C57BL/6J
background. After six backcrossings WT_T male mice were bred with heterozygous KO
females either of a C57BL/6J or a 129Svj genetic background (both strains were available in
the lab of Prof. Schachner). For following generations, heterozygous KO females with
transgenic L1 (+/KO_T) of the 129Svj strain were bred with WT 129Svj males. Mice were
bred under specific pathogen free conditions, food and water were supplied ad libitum.
Offspring were separated from their mother at postnatal day 21 when tailcut biopsies were
taken and housed together with their littermates gender separated.
The third generation of backcrossing into the 129Svj background was used for
behavioural tests.
7.3 Body weight and viability
Body weight was taken of the male mice used for behavioural analysis with a digital
balance with a dish to hold the mouse. Data were collected once a week for 19 weeks at the
same hour of day. At the age of 15 weeks, 28 WT, 16 WT_T, 16 KO, and 23 KO_T mice
were weighed as basis for statistical evaluation by the Mann Whitney t-test (WT vs. WT_T)
and the Kruskal Wallis test, followed by Dunn’s multiple comparisons (WT vs. KO vs.
KO_T). All tests were two-tailed.
Viability of the four different genotypes of males was estimated by counting mice
surviving postnatal day 21 and comparing the ratio with the theoretical distribution of 25 %
for each genotype according to Mendelian segregation.
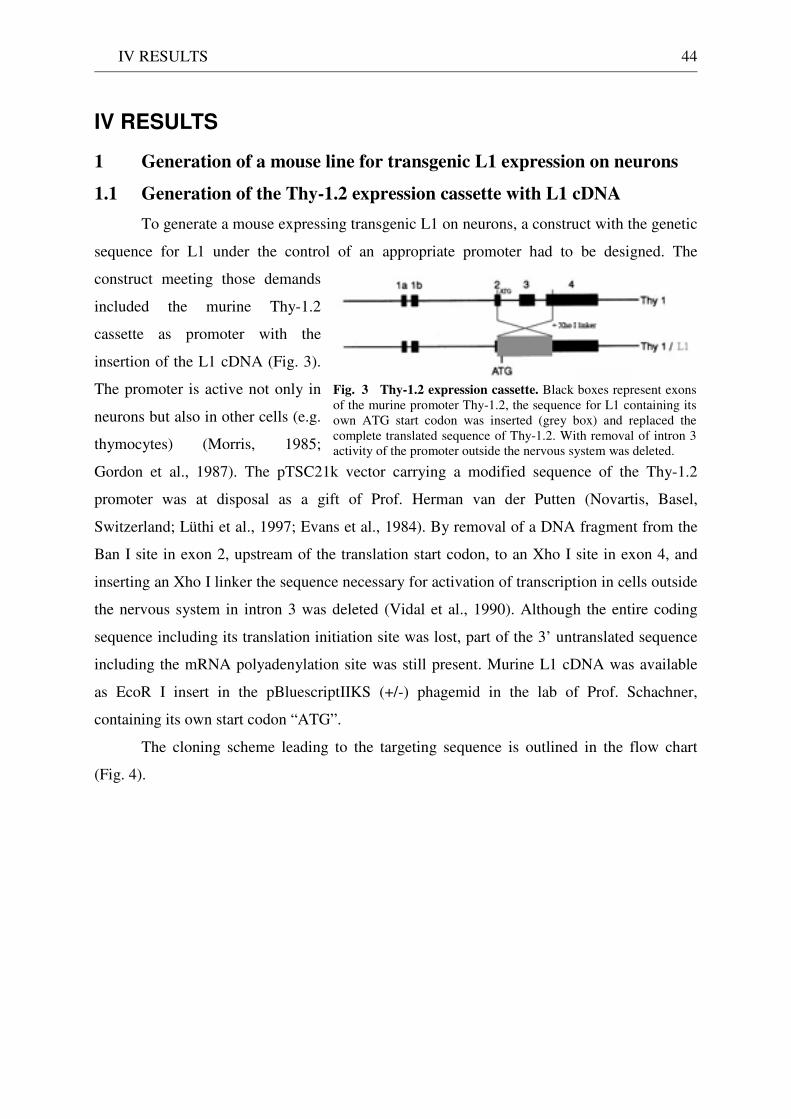
IV RESULTS 44
IV RESULTS
1 Generation of a mouse line for transgenic L1 expression on neurons
1.1 Generation of the Thy-1.2 expression cassette with L1 cDNA
To generate a mouse expressing transgenic L1 on neurons, a construct with the genetic
sequence for L1 under the control of an appropriate promoter had to be designed. The
construct meeting those demands
included the murine Thy-1.2
cassette as promoter with the
insertion of the L1 cDNA (Fig. 3).
The promoter is active not only in
neurons but also in other cells (e.g.
thymocytes) (Morris, 1985;
Gordon et al., 1987). The pTSC21k vector carrying a modified sequence of the Thy-1.2
promoter was at disposal as a gift of Prof. Herman van der Putten (Novartis, Basel,
Switzerland; Lüthi et al., 1997; Evans et al., 1984). By removal of a DNA fragment from the
Ban I site in exon 2, upstream of the translation start codon, to an Xho I site in exon 4, and
inserting an Xho I linker the sequence necessary for activation of transcription in cells outside
the nervous system in intron 3 was deleted (Vidal et al., 1990). Although the entire coding
sequence including its translation initiation site was lost, part of the 3’ untranslated sequence
including the mRNA polyadenylation site was still present. Murine L1 cDNA was available
as EcoR I insert in the pBluescriptIIKS (+/-) phagemid in the lab of Prof. Schachner,
containing its own start codon “ATG”.
The cloning scheme leading to the targeting sequence is outlined in the flow chart
(Fig. 4).
Fig. 3 Thy-1.2 expression cassette. Black boxes represent exons of the murine promoter Thy-1.2, the sequence for L1 containing its own ATG start codon was inserted (grey box) and replaced the complete translated sequence of Thy-1.2. With removal of intron 3 activity of the promoter outside the nervous system was deleted.
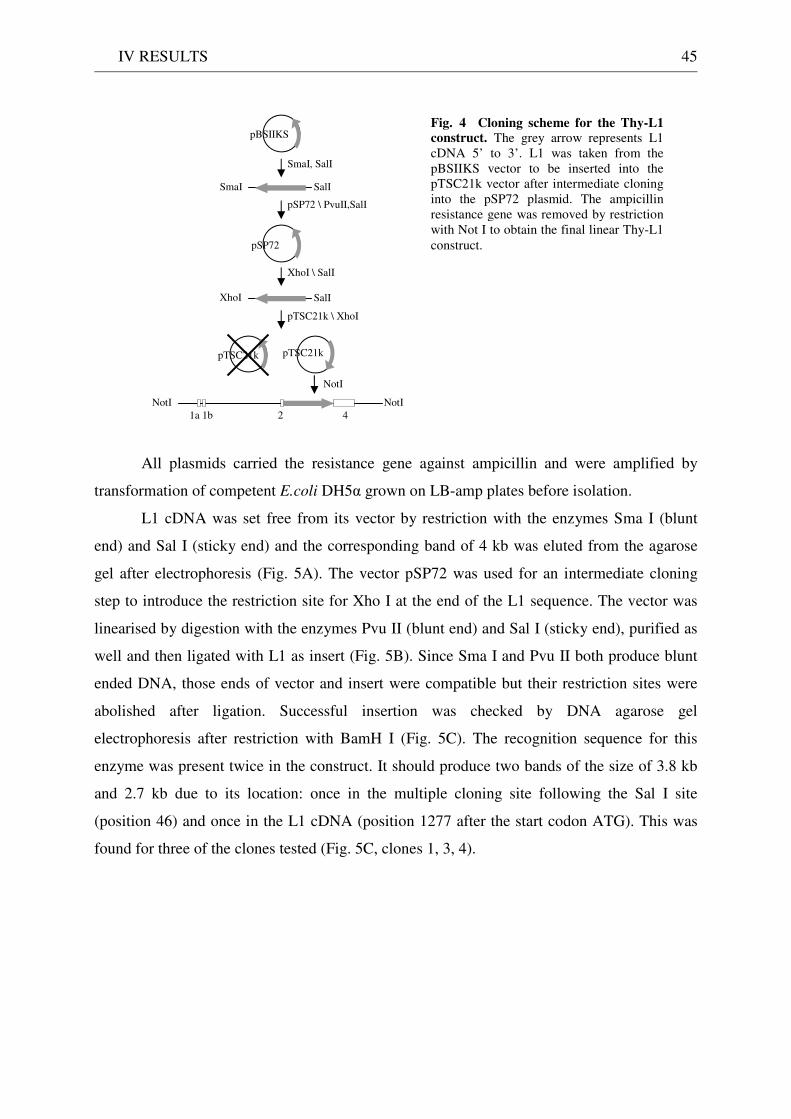
IV RESULTS 45
All plasmids carried the resistance gene against ampicillin and were amplified by
transformation of competent E.coli DH5α grown on LB-amp plates before isolation.
L1 cDNA was set free from its vector by restriction with the enzymes Sma I (blunt
end) and Sal I (sticky end) and the corresponding band of 4 kb was eluted from the agarose
gel after electrophoresis (Fig. 5A). The vector pSP72 was used for an intermediate cloning
step to introduce the restriction site for Xho I at the end of the L1 sequence. The vector was
linearised by digestion with the enzymes Pvu II (blunt end) and Sal I (sticky end), purified as
well and then ligated with L1 as insert (Fig. 5B). Since Sma I and Pvu II both produce blunt
ended DNA, those ends of vector and insert were compatible but their restriction sites were
abolished after ligation. Successful insertion was checked by DNA agarose gel
electrophoresis after restriction with BamH I (Fig. 5C). The recognition sequence for this
enzyme was present twice in the construct. It should produce two bands of the size of 3.8 kb
and 2.7 kb due to its location: once in the multiple cloning site following the Sal I site
(position 46) and once in the L1 cDNA (position 1277 after the start codon ATG). This was
found for three of the clones tested (Fig. 5C, clones 1, 3, 4).
NotI
2 NotI
SalI SmaI
SalI XhoI
SmaI, SalI
pSP72 \ PvuII,SalI
XhoI \ SalI
pTSC21k \ XhoI
NotI
pBSIIKS
4 1a 1b
pSP72
pTSC21k pTSC21k
Fig. 4 Cloning scheme for the Thy-L1
construct. The grey arrow represents L1 cDNA 5’ to 3’. L1 was taken from the pBSIIKS vector to be inserted into the pTSC21k vector after intermediate cloning into the pSP72 plasmid. The ampicillin resistance gene was removed by restriction with Not I to obtain the final linear Thy-L1 construct.
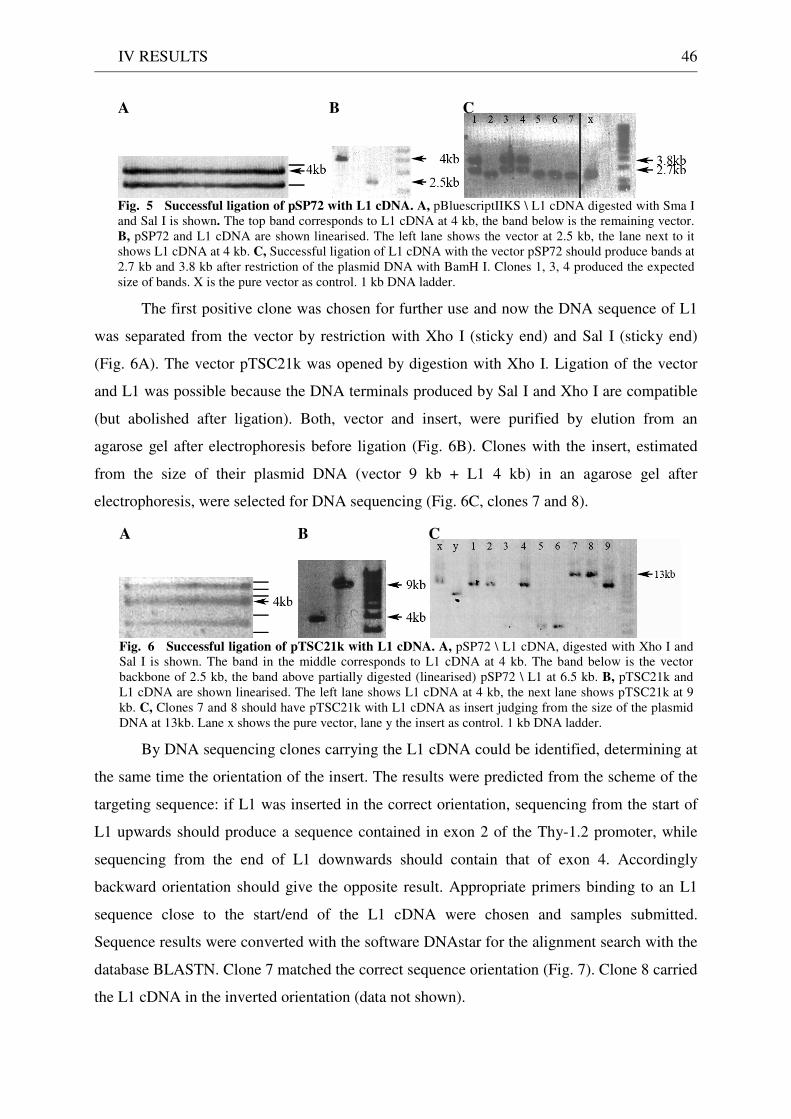
IV RESULTS 46
Fig. 5 Successful ligation of pSP72 with L1 cDNA. A, pBluescriptIIKS \ L1 cDNA digested with Sma I and Sal I is shown. The top band corresponds to L1 cDNA at 4 kb, the band below is the remaining vector.B, pSP72 and L1 cDNA are shown linearised. The left lane shows the vector at 2.5 kb, the lane next to it shows L1 cDNA at 4 kb. C, Successful ligation of L1 cDNA with the vector pSP72 should produce bands at 2.7 kb and 3.8 kb after restriction of the plasmid DNA with BamH I. Clones 1, 3, 4 produced the expected size of bands. X is the pure vector as control. 1 kb DNA ladder.
A B C
The first positive clone was chosen for further use and now the DNA sequence of L1
was separated from the vector by restriction with Xho I (sticky end) and Sal I (sticky end)
(Fig. 6A). The vector pTSC21k was opened by digestion with Xho I. Ligation of the vector
and L1 was possible because the DNA terminals produced by Sal I and Xho I are compatible
(but abolished after ligation). Both, vector and insert, were purified by elution from an
agarose gel after electrophoresis before ligation (Fig. 6B). Clones with the insert, estimated
from the size of their plasmid DNA (vector 9 kb + L1 4 kb) in an agarose gel after
electrophoresis, were selected for DNA sequencing (Fig. 6C, clones 7 and 8).
Fig. 6 Successful ligation of pTSC21k with L1 cDNA. A, pSP72 \ L1 cDNA, digested with Xho I and Sal I is shown. The band in the middle corresponds to L1 cDNA at 4 kb. The band below is the vector backbone of 2.5 kb, the band above partially digested (linearised) pSP72 \ L1 at 6.5 kb. B, pTSC21k and L1 cDNA are shown linearised. The left lane shows L1 cDNA at 4 kb, the next lane shows pTSC21k at 9 kb. C, Clones 7 and 8 should have pTSC21k with L1 cDNA as insert judging from the size of the plasmid DNA at 13kb. Lane x shows the pure vector, lane y the insert as control. 1 kb DNA ladder.
A B C
By DNA sequencing clones carrying the L1 cDNA could be identified, determining at
the same time the orientation of the insert. The results were predicted from the scheme of the
targeting sequence: if L1 was inserted in the correct orientation, sequencing from the start of
L1 upwards should produce a sequence contained in exon 2 of the Thy-1.2 promoter, while
sequencing from the end of L1 downwards should contain that of exon 4. Accordingly
backward orientation should give the opposite result. Appropriate primers binding to an L1
sequence close to the start/end of the L1 cDNA were chosen and samples submitted.
Sequence results were converted with the software DNAstar for the alignment search with the
database BLASTN. Clone 7 matched the correct sequence orientation (Fig. 7). Clone 8 carried
the L1 cDNA in the inverted orientation (data not shown).
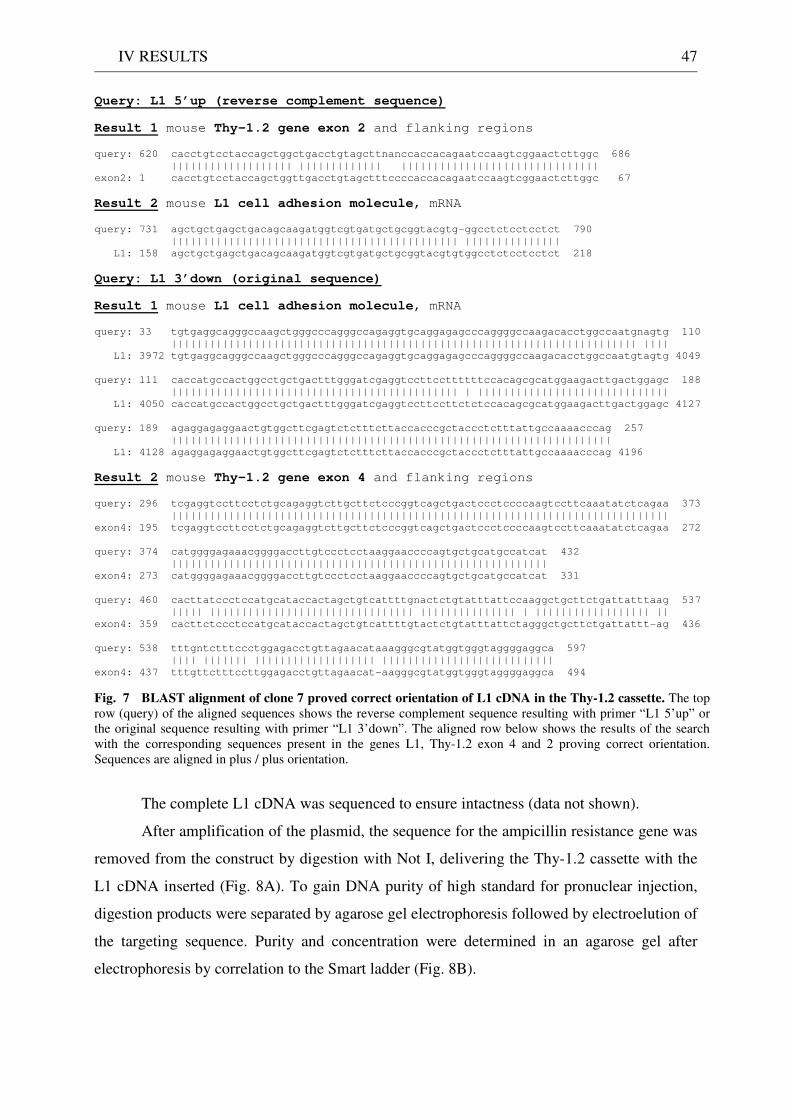
IV RESULTS 47
Query: L1 5’up (reverse complement sequence)
Result 1 mouse Thy-1.2 gene exon 2 and flanking regions
query: 620 cacctgtcctaccagctggctgacctgtagcttnanccaccacagaatccaagtcggaactcttggc 686
||||||||||||||||||| ||||||||||||| |||||||||||||||||||||||||||||||
exon2: 1 cacctgtcctaccagctggttgacctgtagctttccccaccacagaatccaagtcggaactcttggc 67
Result 2 mouse L1 cell adhesion molecule, mRNA
query: 731 agctgctgagctgacagcaagatggtcgtgatgctgcggtacgtg-ggcctctcctcctct 790
||||||||||||||||||||||||||||||||||||||||||||| |||||||||||||||
L1: 158 agctgctgagctgacagcaagatggtcgtgatgctgcggtacgtgtggcctctcctcctct 218
Query: L1 3’down (original sequence)
Result 1 mouse L1 cell adhesion molecule, mRNA
query: 33 tgtgaggcagggccaagctgggcccagggccagaggtgcaggagagcccaggggccaagacacctggccaatgnagtg 110
||||||||||||||||||||||||||||||||||||||||||||||||||||||||||||||||||||||||| ||||
L1: 3972 tgtgaggcagggccaagctgggcccagggccagaggtgcaggagagcccaggggccaagacacctggccaatgtagtg 4049
query: 111 caccatgccactggcctgctgactttgggatcgaggtccttccttttttccacagcgcatggaagacttgactggagc 188
||||||||||||||||||||||||||||||||||||||||||||| | ||||||||||||||||||||||||||||||
L1: 4050 caccatgccactggcctgctgactttgggatcgaggtccttccttctctccacagcgcatggaagacttgactggagc 4127
query: 189 agaggagaggaactgtggcttcgagtctctttcttaccacccgctaccctctttattgccaaaacccag 257
|||||||||||||||||||||||||||||||||||||||||||||||||||||||||||||||||||||
L1: 4128 agaggagaggaactgtggcttcgagtctctttcttaccacccgctaccctctttattgccaaaacccag 4196
Result 2 mouse Thy-1.2 gene exon 4 and flanking regions
query: 296 tcgaggtccttcctctgcagaggtcttgcttctcccggtcagctgactccctccccaagtccttcaaatatctcagaa 373
||||||||||||||||||||||||||||||||||||||||||||||||||||||||||||||||||||||||||||||
exon4: 195 tcgaggtccttcctctgcagaggtcttgcttctcccggtcagctgactccctccccaagtccttcaaatatctcagaa 272
query: 374 catggggagaaacggggaccttgtccctcctaaggaaccccagtgctgcatgccatcat 432
|||||||||||||||||||||||||||||||||||||||||||||||||||||||||||
exon4: 273 catggggagaaacggggaccttgtccctcctaaggaaccccagtgctgcatgccatcat 331
query: 460 cacttatccctccatgcataccactagctgtcattttgnactctgtatttattccaaggctgcttctgattatttaag 537
||||| |||||||||||||||||||||||||||||||| ||||||||||||||| | |||||||||||||||||| ||
exon4: 359 cacttctccctccatgcataccactagctgtcattttgtactctgtatttattctagggctgcttctgattattt-ag 436
query: 538 tttgntctttccctggagacctgttagaacataaagggcgtatggtgggtaggggaggca 597
|||| ||||||| ||||||||||||||||||| |||||||||||||||||||||||||||
exon4: 437 tttgttctttccttggagacctgttagaacat-aagggcgtatggtgggtaggggaggca 494
Fig. 7 BLAST alignment of clone 7 proved correct orientation of L1 cDNA in the Thy-1.2 cassette. The top row (query) of the aligned sequences shows the reverse complement sequence resulting with primer “L1 5’up” orthe original sequence resulting with primer “L1 3’down”. The aligned row below shows the results of the search with the corresponding sequences present in the genes L1, Thy-1.2 exon 4 and 2 proving correct orientation.Sequences are aligned in plus / plus orientation.
The complete L1 cDNA was sequenced to ensure intactness (data not shown).
After amplification of the plasmid, the sequence for the ampicillin resistance gene was
removed from the construct by digestion with Not I, delivering the Thy-1.2 cassette with the
L1 cDNA inserted (Fig. 8A). To gain DNA purity of high standard for pronuclear injection,
digestion products were separated by agarose gel electrophoresis followed by electroelution of
the targeting sequence. Purity and concentration were determined in an agarose gel after
electrophoresis by correlation to the Smart ladder (Fig. 8B).
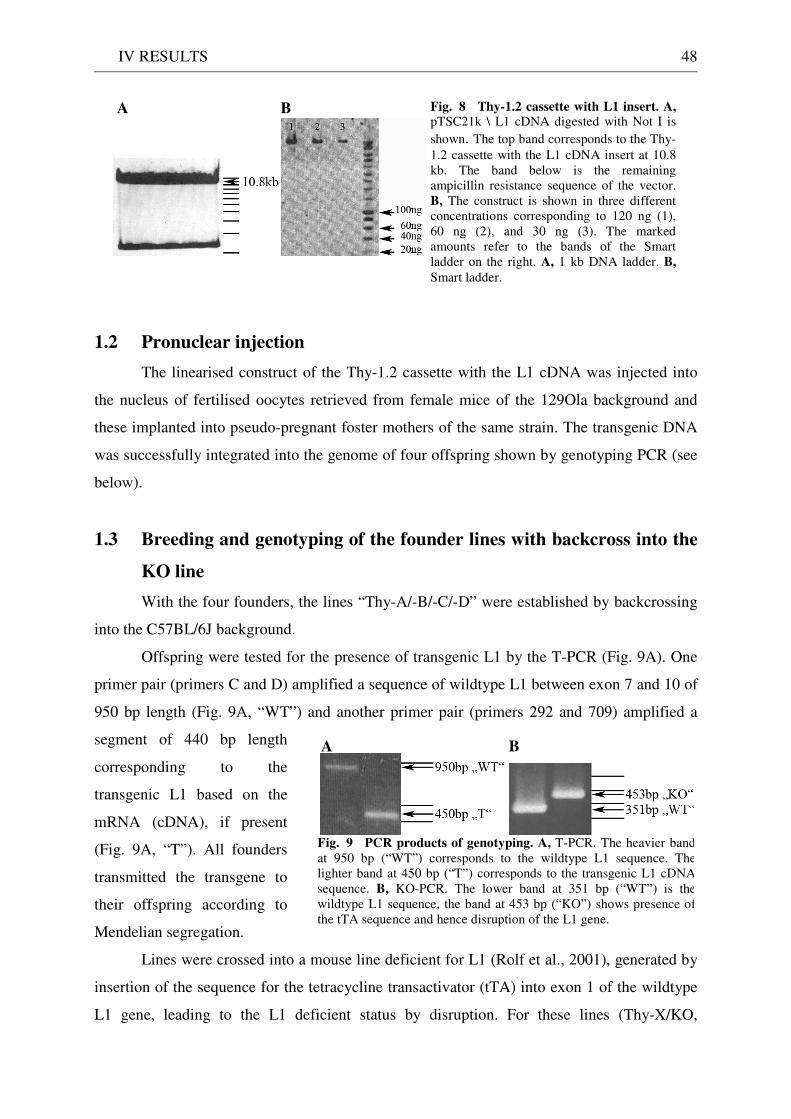
IV RESULTS 48
Fig. 8 Thy-1.2 cassette with L1 insert. A, pTSC21k \ L1 cDNA digested with Not I is
shown. The top band corresponds to the Thy-1.2 cassette with the L1 cDNA insert at 10.8 kb. The band below is the remaining ampicillin resistance sequence of the vector. B, The construct is shown in three different concentrations corresponding to 120 ng (1), 60 ng (2), and 30 ng (3). The marked amounts refer to the bands of the Smart ladder on the right. A, 1 kb DNA ladder. B, Smart ladder.
A B
1.2 Pronuclear injection
The linearised construct of the Thy-1.2 cassette with the L1 cDNA was injected into
the nucleus of fertilised oocytes retrieved from female mice of the 129Ola background and
these implanted into pseudo-pregnant foster mothers of the same strain. The transgenic DNA
was successfully integrated into the genome of four offspring shown by genotyping PCR (see
below).
1.3 Breeding and genotyping of the founder lines with backcross into the
KO line
With the four founders, the lines “Thy-A/-B/-C/-D” were established by backcrossing
into the C57BL/6J background.
Offspring were tested for the presence of transgenic L1 by the T-PCR (Fig. 9A). One
primer pair (primers C and D) amplified a sequence of wildtype L1 between exon 7 and 10 of
950 bp length (Fig. 9A, “WT”) and another primer pair (primers 292 and 709) amplified a
segment of 440 bp length
corresponding to the
transgenic L1 based on the
mRNA (cDNA), if present
(Fig. 9A, “T”). All founders
transmitted the transgene to
their offspring according to
Mendelian segregation.
Lines were crossed into a mouse line deficient for L1 (Rolf et al., 2001), generated by
insertion of the sequence for the tetracycline transactivator (tTA) into exon 1 of the wildtype
L1 gene, leading to the L1 deficient status by disruption. For these lines (Thy-X/KO,
Fig. 9 PCR products of genotyping. A, T-PCR. The heavier band at 950 bp (“WT”) corresponds to the wildtype L1 sequence. The lighter band at 450 bp (“T”) corresponds to the transgenic L1 cDNA sequence. B, KO-PCR. The lower band at 351 bp (“WT”) is the wildtype L1 sequence, the band at 453 bp (“KO”) shows presence of the tTA sequence and hence disruption of the L1 gene.
A B
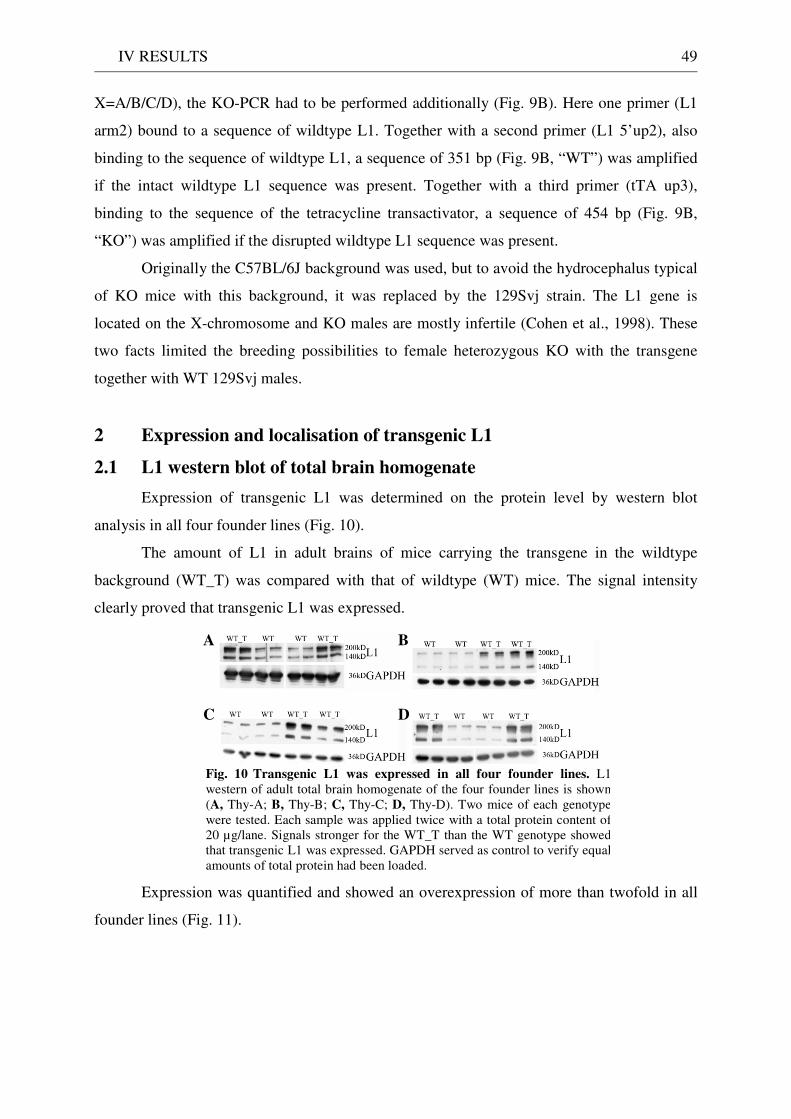
IV RESULTS 49
X=A/B/C/D), the KO-PCR had to be performed additionally (Fig. 9B). Here one primer (L1
arm2) bound to a sequence of wildtype L1. Together with a second primer (L1 5’up2), also
binding to the sequence of wildtype L1, a sequence of 351 bp (Fig. 9B, “WT”) was amplified
if the intact wildtype L1 sequence was present. Together with a third primer (tTA up3),
binding to the sequence of the tetracycline transactivator, a sequence of 454 bp (Fig. 9B,
“KO”) was amplified if the disrupted wildtype L1 sequence was present.
Originally the C57BL/6J background was used, but to avoid the hydrocephalus typical
of KO mice with this background, it was replaced by the 129Svj strain. The L1 gene is
located on the X-chromosome and KO males are mostly infertile (Cohen et al., 1998). These
two facts limited the breeding possibilities to female heterozygous KO with the transgene
together with WT 129Svj males.
2 Expression and localisation of transgenic L1
2.1 L1 western blot of total brain homogenate
Expression of transgenic L1 was determined on the protein level by western blot
analysis in all four founder lines (Fig. 10).
The amount of L1 in adult brains of mice carrying the transgene in the wildtype
background (WT_T) was compared with that of wildtype (WT) mice. The signal intensity
clearly proved that transgenic L1 was expressed.
Fig. 10 Transgenic L1 was expressed in all four founder lines. L1 western of adult total brain homogenate of the four founder lines is shown(A, Thy-A; B, Thy-B; C, Thy-C; D, Thy-D). Two mice of each genotype were tested. Each sample was applied twice with a total protein content of 20 µg/lane. Signals stronger for the WT_T than the WT genotype showed that transgenic L1 was expressed. GAPDH served as control to verify equal amounts of total protein had been loaded.
A B
C D
Expression was quantified and showed an overexpression of more than twofold in all
founder lines (Fig. 11).
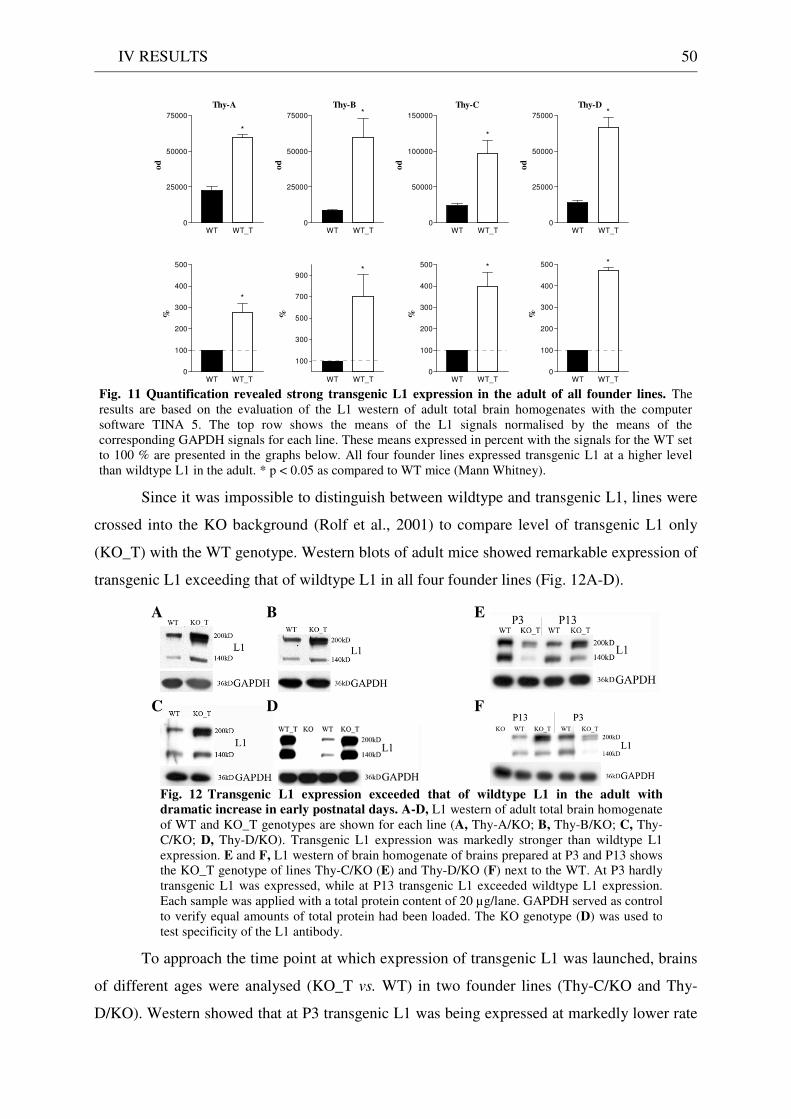
IV RESULTS 50
Thy-A
WT WT_T0
25000
50000
75000
*
od
Thy-B
WT WT_T0
25000
50000
75000 *
od
Thy-C
WT WT_T0
50000
100000
150000
*
od
Thy-D
WT WT_T0
25000
50000
75000 *
od
WT WT_T0
100
200
300
400
500
*
%
WT WT_T
100
300
500
700
900*
%
WT WT_T0
100
200
300
400
500 *
%
WT WT_T0
100
200
300
400
500 *
%
Fig. 11 Quantification revealed strong transgenic L1 expression in the adult of all founder lines. The results are based on the evaluation of the L1 western of adult total brain homogenates with the computer software TINA 5. The top row shows the means of the L1 signals normalised by the means of the corresponding GAPDH signals for each line. These means expressed in percent with the signals for the WT set to 100 % are presented in the graphs below. All four founder lines expressed transgenic L1 at a higher level than wildtype L1 in the adult. * p < 0.05 as compared to WT mice (Mann Whitney).
Since it was impossible to distinguish between wildtype and transgenic L1, lines were
crossed into the KO background (Rolf et al., 2001) to compare level of transgenic L1 only
(KO_T) with the WT genotype. Western blots of adult mice showed remarkable expression of
transgenic L1 exceeding that of wildtype L1 in all four founder lines (Fig. 12A-D).
Fig. 12 Transgenic L1 expression exceeded that of wildtype L1 in the adult with
dramatic increase in early postnatal days. A-D, L1 western of adult total brain homogenate of WT and KO_T genotypes are shown for each line (A, Thy-A/KO; B, Thy-B/KO; C, Thy-C/KO; D, Thy-D/KO). Transgenic L1 expression was markedly stronger than wildtype L1 expression. E and F, L1 western of brain homogenate of brains prepared at P3 and P13 shows the KO_T genotype of lines Thy-C/KO (E) and Thy-D/KO (F) next to the WT. At P3 hardly transgenic L1 was expressed, while at P13 transgenic L1 exceeded wildtype L1 expression. Each sample was applied with a total protein content of 20 µg/lane. GAPDH served as control to verify equal amounts of total protein had been loaded. The KO genotype (D) was used to test specificity of the L1 antibody.
A E B
C D F
To approach the time point at which expression of transgenic L1 was launched, brains
of different ages were analysed (KO_T vs. WT) in two founder lines (Thy-C/KO and Thy-
D/KO). Western showed that at P3 transgenic L1 was being expressed at markedly lower rate
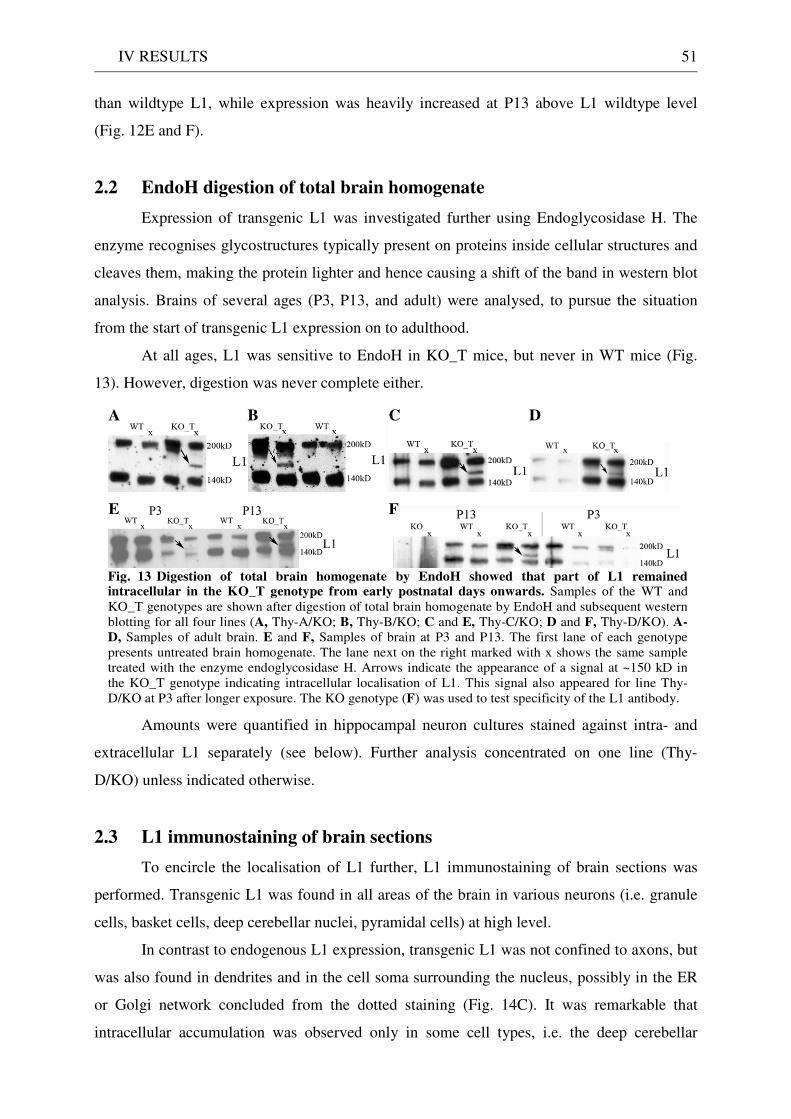
IV RESULTS 51
than wildtype L1, while expression was heavily increased at P13 above L1 wildtype level
(Fig. 12E and F).
2.2 EndoH digestion of total brain homogenate
Expression of transgenic L1 was investigated further using Endoglycosidase H. The
enzyme recognises glycostructures typically present on proteins inside cellular structures and
cleaves them, making the protein lighter and hence causing a shift of the band in western blot
analysis. Brains of several ages (P3, P13, and adult) were analysed, to pursue the situation
from the start of transgenic L1 expression on to adulthood.
At all ages, L1 was sensitive to EndoH in KO_T mice, but never in WT mice (Fig.
13). However, digestion was never complete either.
Fig. 13 Digestion of total brain homogenate by EndoH showed that part of L1 remainedintracellular in the KO_T genotype from early postnatal days onwards. Samples of the WT and KO_T genotypes are shown after digestion of total brain homogenate by EndoH and subsequent western blotting for all four lines (A, Thy-A/KO; B, Thy-B/KO; C and E, Thy-C/KO; D and F, Thy-D/KO). A-
D, Samples of adult brain. E and F, Samples of brain at P3 and P13. The first lane of each genotype presents untreated brain homogenate. The lane next on the right marked with x shows the same sample treated with the enzyme endoglycosidase H. Arrows indicate the appearance of a signal at ~150 kD in the KO_T genotype indicating intracellular localisation of L1. This signal also appeared for line Thy-D/KO at P3 after longer exposure. The KO genotype (F) was used to test specificity of the L1 antibody.
A B C D
E F
Amounts were quantified in hippocampal neuron cultures stained against intra- and
extracellular L1 separately (see below). Further analysis concentrated on one line (Thy-
D/KO) unless indicated otherwise.
2.3 L1 immunostaining of brain sections
To encircle the localisation of L1 further, L1 immunostaining of brain sections was
performed. Transgenic L1 was found in all areas of the brain in various neurons (i.e. granule
cells, basket cells, deep cerebellar nuclei, pyramidal cells) at high level.
In contrast to endogenous L1 expression, transgenic L1 was not confined to axons, but
was also found in dendrites and in the cell soma surrounding the nucleus, possibly in the ER
or Golgi network concluded from the dotted staining (Fig. 14C). It was remarkable that
intracellular accumulation was observed only in some cell types, i.e. the deep cerebellar
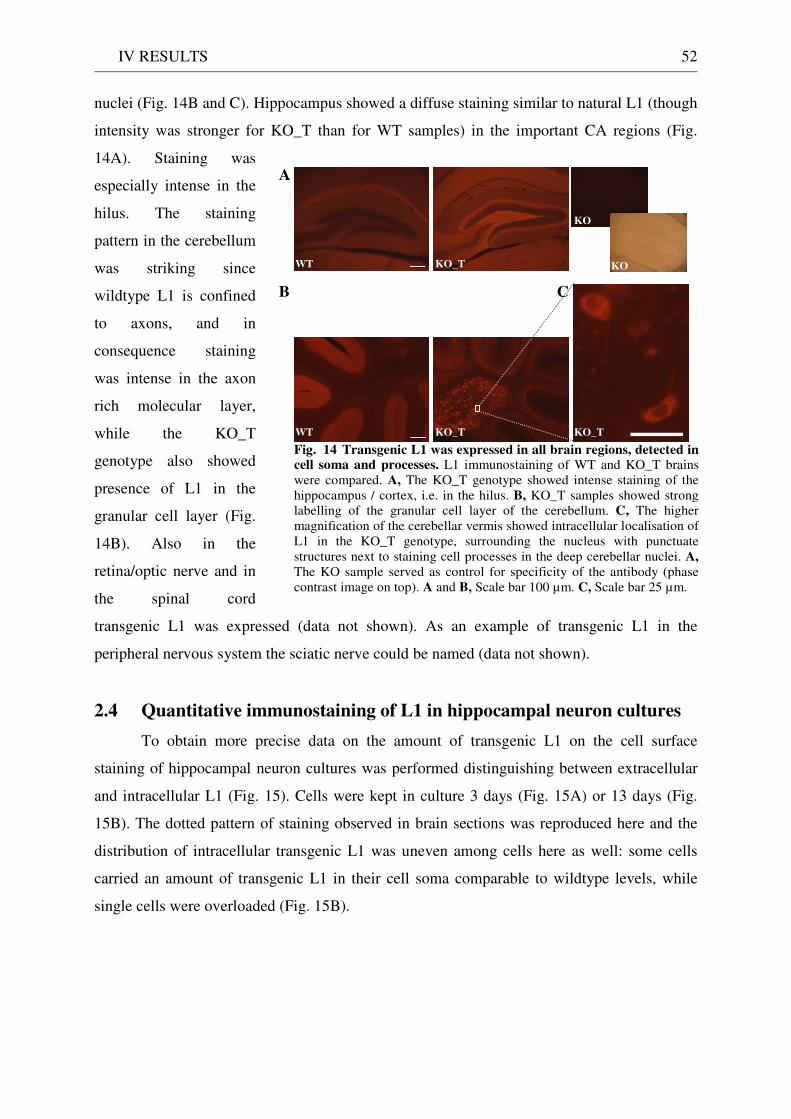
IV RESULTS 52
nuclei (Fig. 14B and C). Hippocampus showed a diffuse staining similar to natural L1 (though
intensity was stronger for KO_T than for WT samples) in the important CA regions (Fig.
14A). Staining was
especially intense in the
hilus. The staining
pattern in the cerebellum
was striking since
wildtype L1 is confined
to axons, and in
consequence staining
was intense in the axon
rich molecular layer,
while the KO_T
genotype also showed
presence of L1 in the
granular cell layer (Fig.
14B). Also in the
retina/optic nerve and in
the spinal cord
transgenic L1 was expressed (data not shown). As an example of transgenic L1 in the
peripheral nervous system the sciatic nerve could be named (data not shown).
2.4 Quantitative immunostaining of L1 in hippocampal neuron cultures
To obtain more precise data on the amount of transgenic L1 on the cell surface
staining of hippocampal neuron cultures was performed distinguishing between extracellular
and intracellular L1 (Fig. 15). Cells were kept in culture 3 days (Fig. 15A) or 13 days (Fig.
15B). The dotted pattern of staining observed in brain sections was reproduced here and the
distribution of intracellular transgenic L1 was uneven among cells here as well: some cells
carried an amount of transgenic L1 in their cell soma comparable to wildtype levels, while
single cells were overloaded (Fig. 15B).
Fig. 14 Transgenic L1 was expressed in all brain regions, detected in
cell soma and processes. L1 immunostaining of WT and KO_T brains were compared. A, The KO_T genotype showed intense staining of the hippocampus / cortex, i.e. in the hilus. B, KO_T samples showed strong labelling of the granular cell layer of the cerebellum. C, The higher magnification of the cerebellar vermis showed intracellular localisation of L1 in the KO_T genotype, surrounding the nucleus with punctuate structures next to staining cell processes in the deep cerebellar nuclei. A, The KO sample served as control for specificity of the antibody (phase contrast image on top). A and B, Scale bar 100 µm. C, Scale bar 25 µm.
WT KO_T
KO
KO
WT KO_T KO_T
A
B C
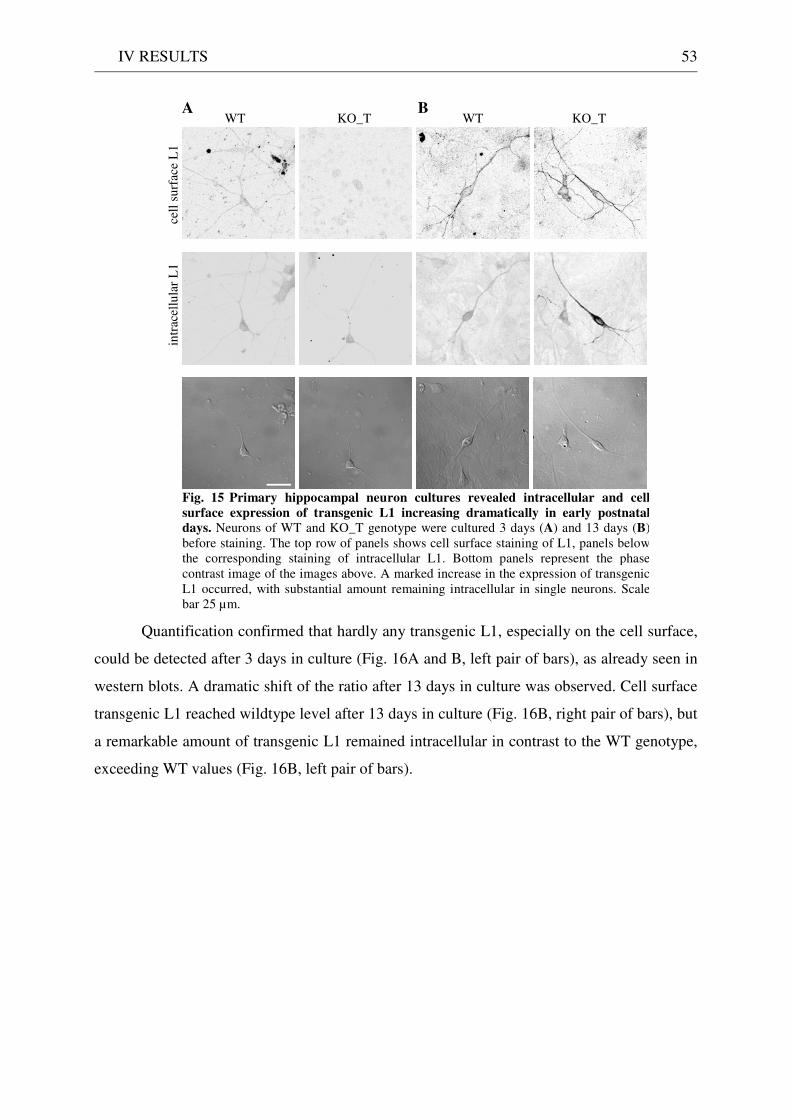
IV RESULTS 53
Fig. 15 Primary hippocampal neuron cultures revealed intracellular and cell
surface expression of transgenic L1 increasing dramatically in early postnatal
days. Neurons of WT and KO_T genotype were cultured 3 days (A) and 13 days (B) before staining. The top row of panels shows cell surface staining of L1, panels belowthe corresponding staining of intracellular L1. Bottom panels represent the phase contrast image of the images above. A marked increase in the expression of transgenic L1 occurred, with substantial amount remaining intracellular in single neurons. Scale bar 25 µm.
WT WT KO_T KO_T
cell
sur
face
L1
intr
acel
lula
r L
1
A B
Quantification confirmed that hardly any transgenic L1, especially on the cell surface,
could be detected after 3 days in culture (Fig. 16A and B, left pair of bars), as already seen in
western blots. A dramatic shift of the ratio after 13 days in culture was observed. Cell surface
transgenic L1 reached wildtype level after 13 days in culture (Fig. 16B, right pair of bars), but
a remarkable amount of transgenic L1 remained intracellular in contrast to the WT genotype,
exceeding WT values (Fig. 16B, left pair of bars).
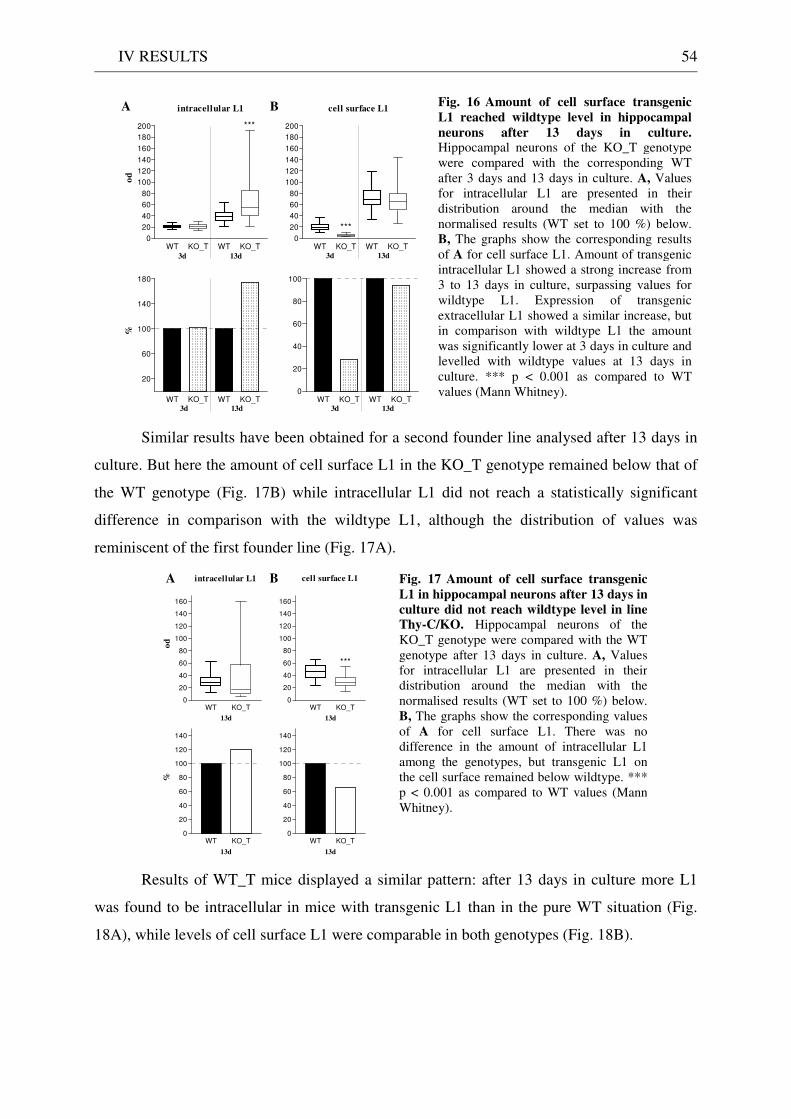
IV RESULTS 54
Fig. 16 Amount of cell surface transgenic
L1 reached wildtype level in hippocampal
neurons after 13 days in culture.Hippocampal neurons of the KO_T genotype were compared with the corresponding WTafter 3 days and 13 days in culture. A, Values for intracellular L1 are presented in their distribution around the median with the normalised results (WT set to 100 %) below. B, The graphs show the corresponding results of A for cell surface L1. Amount of transgenic intracellular L1 showed a strong increase from 3 to 13 days in culture, surpassing values for wildtype L1. Expression of transgenic extracellular L1 showed a similar increase, but in comparison with wildtype L1 the amount was significantly lower at 3 days in culture and levelled with wildtype values at 13 days in culture. *** p < 0.001 as compared to WTvalues (Mann Whitney).
A B intracellular L1
WT KO_T WT KO_T0
20
40
60
80
100
120
140
160
180
200
3d 13d
***o
d
cell surface L1
WT KO_T WT KO_T0
20
40
60
80
100
120
140
160
180
200
3d 13d
***
WT KO_T WT KO_T
20
60
100
140
180
3d 13d
%
WT KO_T WT KO_T0
20
40
60
80
100
3d 13d
Similar results have been obtained for a second founder line analysed after 13 days in
culture. But here the amount of cell surface L1 in the KO_T genotype remained below that of
the WT genotype (Fig. 17B) while intracellular L1 did not reach a statistically significant
difference in comparison with the wildtype L1, although the distribution of values was
reminiscent of the first founder line (Fig. 17A).
Fig. 17 Amount of cell surface transgenic
L1 in hippocampal neurons after 13 days in
culture did not reach wildtype level in line
Thy-C/KO. Hippocampal neurons of the KO_T genotype were compared with the WTgenotype after 13 days in culture. A, Values for intracellular L1 are presented in theirdistribution around the median with the normalised results (WT set to 100 %) below.B, The graphs show the corresponding values of A for cell surface L1. There was no difference in the amount of intracellular L1 among the genotypes, but transgenic L1 on the cell surface remained below wildtype. *** p < 0.001 as compared to WT values (Mann Whitney).
A B intracellular L1
WT KO_T0
20
40
60
80
100
120
140
160
13d
od
cell surface L1
WT KO_T0
20
40
60
80
100
120
140
160
***
13d
WT KO_T0
20
40
60
80
100
120
140
13d
%
WT KO_T0
20
40
60
80
100
120
140
13d
Results of WT_T mice displayed a similar pattern: after 13 days in culture more L1
was found to be intracellular in mice with transgenic L1 than in the pure WT situation (Fig.
18A), while levels of cell surface L1 were comparable in both genotypes (Fig. 18B).
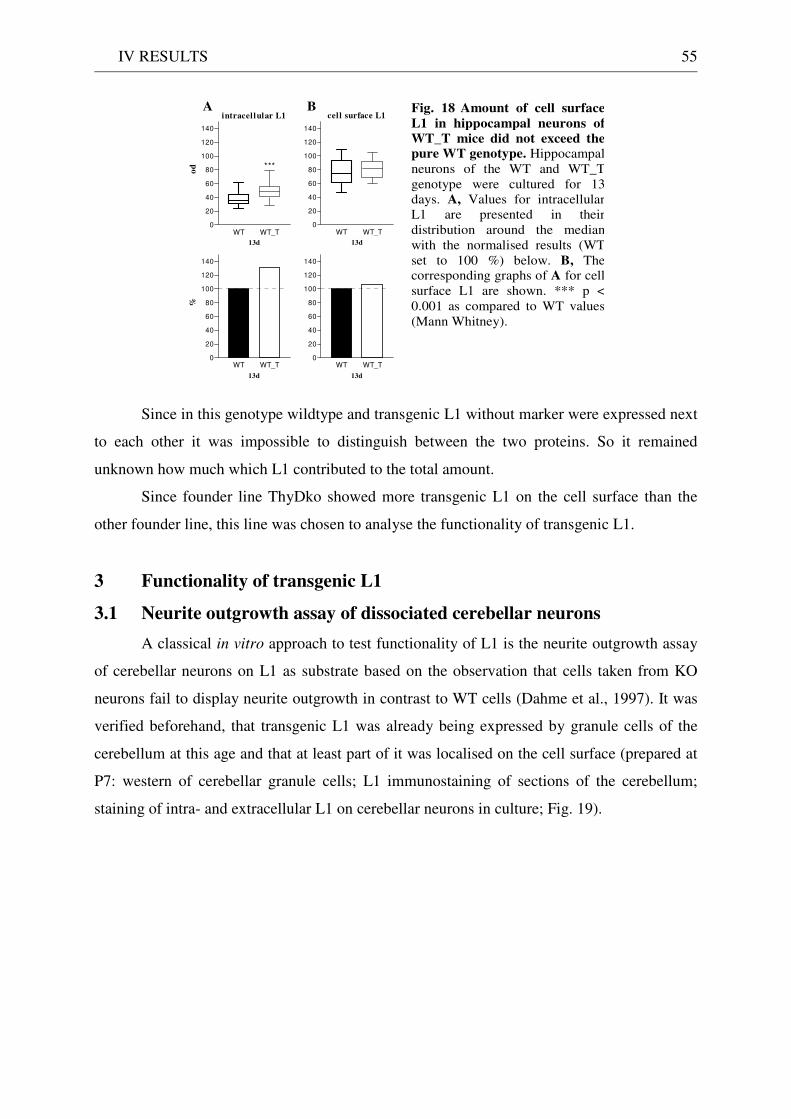
IV RESULTS 55
Fig. 18 Amount of cell surface
L1 in hippocampal neurons of
WT_T mice did not exceed the
pure WT genotype. Hippocampal neurons of the WT and WT_T genotype were cultured for 13days. A, Values for intracellular L1 are presented in their distribution around the median with the normalised results (WTset to 100 %) below. B, The corresponding graphs of A for cell surface L1 are shown. *** p < 0.001 as compared to WT values (Mann Whitney).
A B intracellular L1
WT WT_T0
20
40
60
80
100
120
140
***
13d
od
cel l surface L1
WT WT_T0
20
40
60
80
100
120
140
13d
WT WT_T0
20
40
60
80
100
120
140
13d
%
WT WT_T0
20
40
60
80
100
120
140
13d
Since in this genotype wildtype and transgenic L1 without marker were expressed next
to each other it was impossible to distinguish between the two proteins. So it remained
unknown how much which L1 contributed to the total amount.
Since founder line ThyDko showed more transgenic L1 on the cell surface than the
other founder line, this line was chosen to analyse the functionality of transgenic L1.
3 Functionality of transgenic L1
3.1 Neurite outgrowth assay of dissociated cerebellar neurons
A classical in vitro approach to test functionality of L1 is the neurite outgrowth assay
of cerebellar neurons on L1 as substrate based on the observation that cells taken from KO
neurons fail to display neurite outgrowth in contrast to WT cells (Dahme et al., 1997). It was
verified beforehand, that transgenic L1 was already being expressed by granule cells of the
cerebellum at this age and that at least part of it was localised on the cell surface (prepared at
P7: western of cerebellar granule cells; L1 immunostaining of sections of the cerebellum;
staining of intra- and extracellular L1 on cerebellar neurons in culture; Fig. 19).
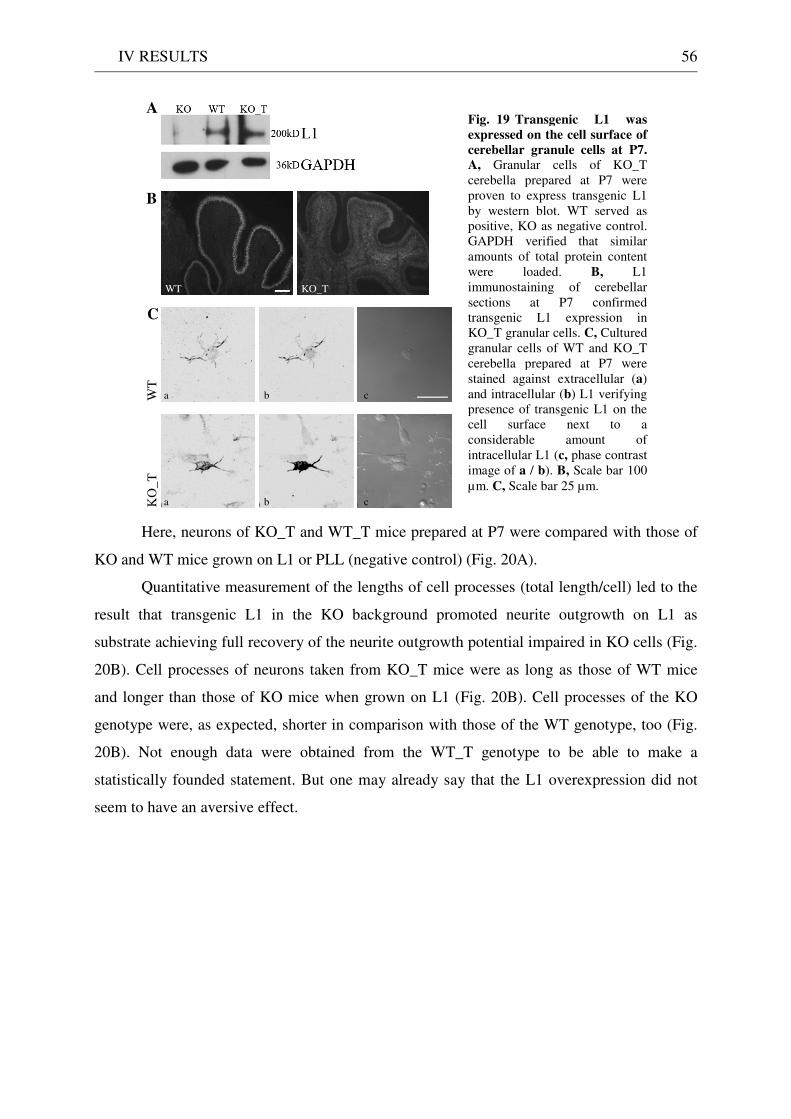
IV RESULTS 56
WT KO_T
a b c
a b c
Fig. 19 Transgenic L1 was
expressed on the cell surface of
cerebellar granule cells at P7.
A, Granular cells of KO_T cerebella prepared at P7 were proven to express transgenic L1 by western blot. WT served as positive, KO as negative control. GAPDH verified that similar amounts of total protein content were loaded. B, L1 immunostaining of cerebellar sections at P7 confirmed transgenic L1 expression in KO_T granular cells. C, Cultured granular cells of WT and KO_T cerebella prepared at P7 were stained against extracellular (a) and intracellular (b) L1 verifying presence of transgenic L1 on the cell surface next to a considerable amount of intracellular L1 (c, phase contrast image of a / b). B, Scale bar 100 µm. C, Scale bar 25 µm.
WT
K
O_T
A
B
C
Here, neurons of KO_T and WT_T mice prepared at P7 were compared with those of
KO and WT mice grown on L1 or PLL (negative control) (Fig. 20A).
Quantitative measurement of the lengths of cell processes (total length/cell) led to the
result that transgenic L1 in the KO background promoted neurite outgrowth on L1 as
substrate achieving full recovery of the neurite outgrowth potential impaired in KO cells (Fig.
20B). Cell processes of neurons taken from KO_T mice were as long as those of WT mice
and longer than those of KO mice when grown on L1 (Fig. 20B). Cell processes of the KO
genotype were, as expected, shorter in comparison with those of the WT genotype, too (Fig.
20B). Not enough data were obtained from the WT_T genotype to be able to make a
statistically founded statement. But one may already say that the L1 overexpression did not
seem to have an aversive effect.
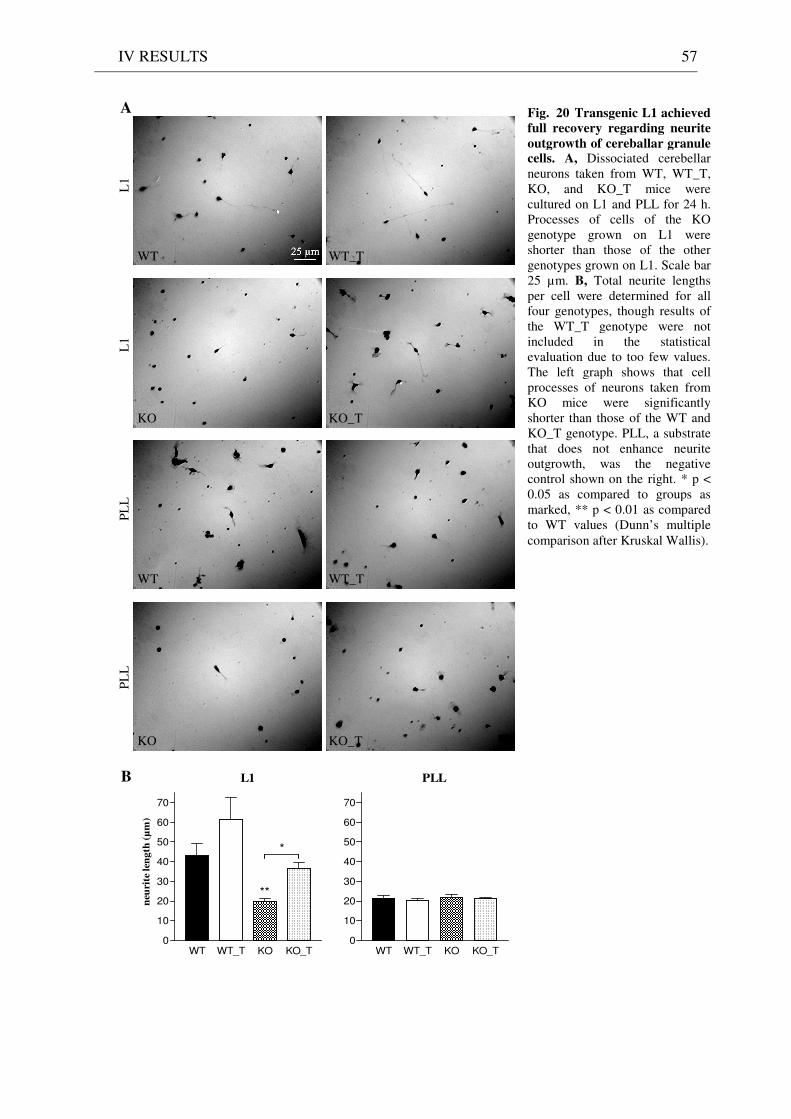
IV RESULTS 57
PLL
WT WT_T KO KO_T0
10
20
30
40
50
60
70
L1
WT WT_T KO KO_T0
10
20
30
40
50
60
70
**
*
neu
rite
len
gth
(µ
m)
WT WT_T
KO KO_T
WT WT_T
KO KO_T
L1
PL
L
A
B
Fig. 20 Transgenic L1 achieved
full recovery regarding neurite
outgrowth of cereballar granule cells. A, Dissociated cerebellar neurons taken from WT, WT_T, KO, and KO_T mice were cultured on L1 and PLL for 24 h. Processes of cells of the KO genotype grown on L1 were shorter than those of the other genotypes grown on L1. Scale bar 25 µm. B, Total neurite lengths per cell were determined for all four genotypes, though results of the WT_T genotype were not included in the statistical evaluation due to too few values. The left graph shows that cell processes of neurons taken from KO mice were significantly shorter than those of the WT and KO_T genotype. PLL, a substrate that does not enhance neurite outgrowth, was the negative control shown on the right. * p < 0.05 as compared to groups as marked, ** p < 0.01 as compared to WT values (Dunn’s multiple comparison after Kruskal Wallis).
PL
L
L1
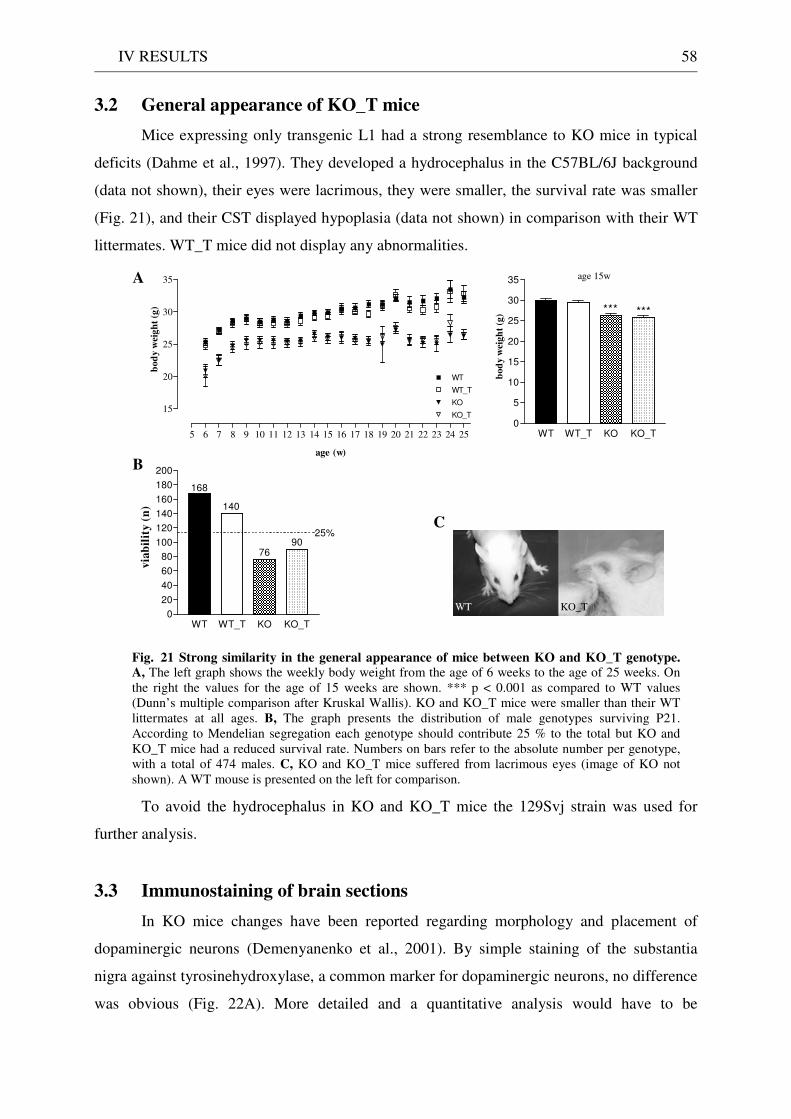
IV RESULTS 58
3.2 General appearance of KO_T mice
Mice expressing only transgenic L1 had a strong resemblance to KO mice in typical
deficits (Dahme et al., 1997). They developed a hydrocephalus in the C57BL/6J background
(data not shown), their eyes were lacrimous, they were smaller, the survival rate was smaller
(Fig. 21), and their CST displayed hypoplasia (data not shown) in comparison with their WT
littermates. WT_T mice did not display any abnormalities.
5 6 7 8 9 10 11 12 13 14 15 16 17 18 19 20 21 22 23 24 25
15
20
25
30
35
WT
WT_T
KO
KO_T
age (w)
bo
dy
wei
gh
t (g
)
age 15w
WT WT_T KO KO_T0
5
10
15
20
25
30
35
*** ***
bo
dy
wei
gh
t (g
)
WT WT_T KO KO_T0
20
40
60
80
100
120
140
160
180
200
25%
168
140
7690
via
bil
ity
(n
)
Fig. 21 Strong similarity in the general appearance of mice between KO and KO_T genotype. A, The left graph shows the weekly body weight from the age of 6 weeks to the age of 25 weeks. On the right the values for the age of 15 weeks are shown. *** p < 0.001 as compared to WT values (Dunn’s multiple comparison after Kruskal Wallis). KO and KO_T mice were smaller than their WT littermates at all ages. B, The graph presents the distribution of male genotypes surviving P21. According to Mendelian segregation each genotype should contribute 25 % to the total but KO and KO_T mice had a reduced survival rate. Numbers on bars refer to the absolute number per genotype, with a total of 474 males. C, KO and KO_T mice suffered from lacrimous eyes (image of KO not shown). A WT mouse is presented on the left for comparison.
WT KO_T
A
B
C
To avoid the hydrocephalus in KO and KO_T mice the 129Svj strain was used for
further analysis.
3.3 Immunostaining of brain sections
In KO mice changes have been reported regarding morphology and placement of
dopaminergic neurons (Demenyanenko et al., 2001). By simple staining of the substantia
nigra against tyrosinehydroxylase, a common marker for dopaminergic neurons, no difference
was obvious (Fig. 22A). More detailed and a quantitative analysis would have to be
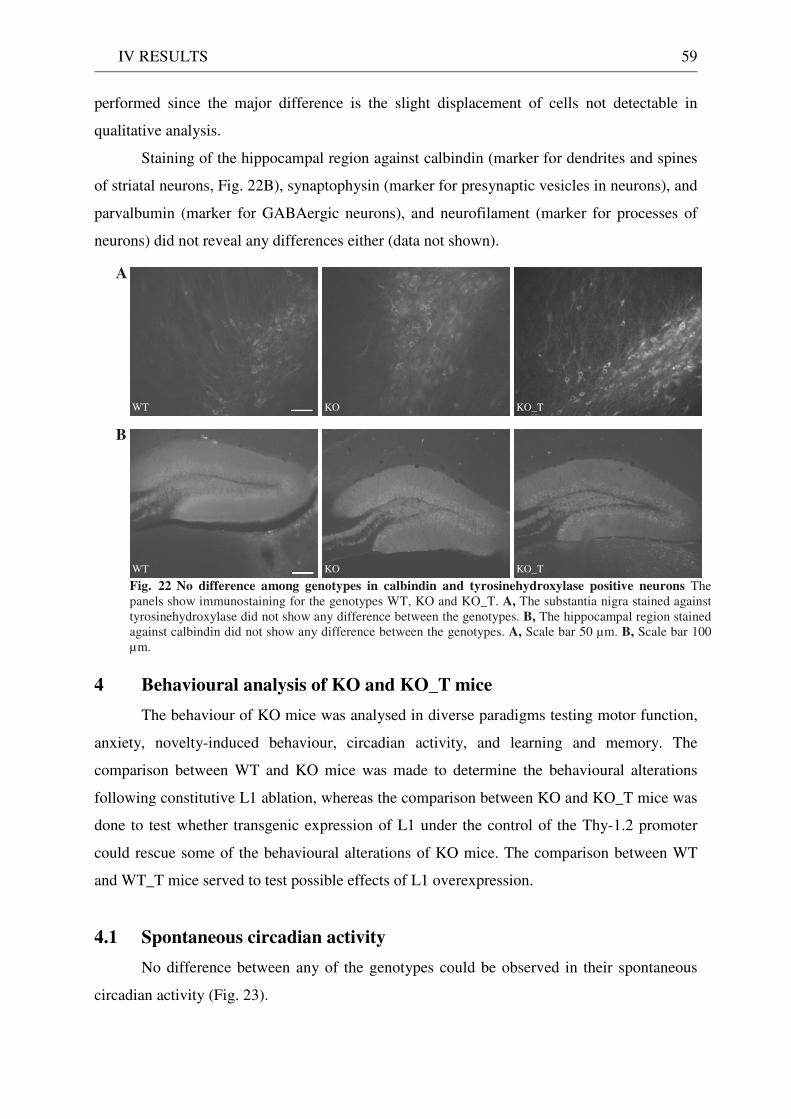
IV RESULTS 59
performed since the major difference is the slight displacement of cells not detectable in
qualitative analysis.
Staining of the hippocampal region against calbindin (marker for dendrites and spines
of striatal neurons, Fig. 22B), synaptophysin (marker for presynaptic vesicles in neurons), and
parvalbumin (marker for GABAergic neurons), and neurofilament (marker for processes of
neurons) did not reveal any differences either (data not shown).
Fig. 22 No difference among genotypes in calbindin and tyrosinehydroxylase positive neurons The panels show immunostaining for the genotypes WT, KO and KO_T. A, The substantia nigra stained against tyrosinehydroxylase did not show any difference between the genotypes. B, The hippocampal region stained against calbindin did not show any difference between the genotypes. A, Scale bar 50 µm. B, Scale bar 100 µm.
WT KO KO_T
A
B
WT KO KO_T
4 Behavioural analysis of KO and KO_T mice
The behaviour of KO mice was analysed in diverse paradigms testing motor function,
anxiety, novelty-induced behaviour, circadian activity, and learning and memory. The
comparison between WT and KO mice was made to determine the behavioural alterations
following constitutive L1 ablation, whereas the comparison between KO and KO_T mice was
done to test whether transgenic expression of L1 under the control of the Thy-1.2 promoter
could rescue some of the behavioural alterations of KO mice. The comparison between WT
and WT_T mice served to test possible effects of L1 overexpression.
4.1 Spontaneous circadian activity
No difference between any of the genotypes could be observed in their spontaneous
circadian activity (Fig. 23).
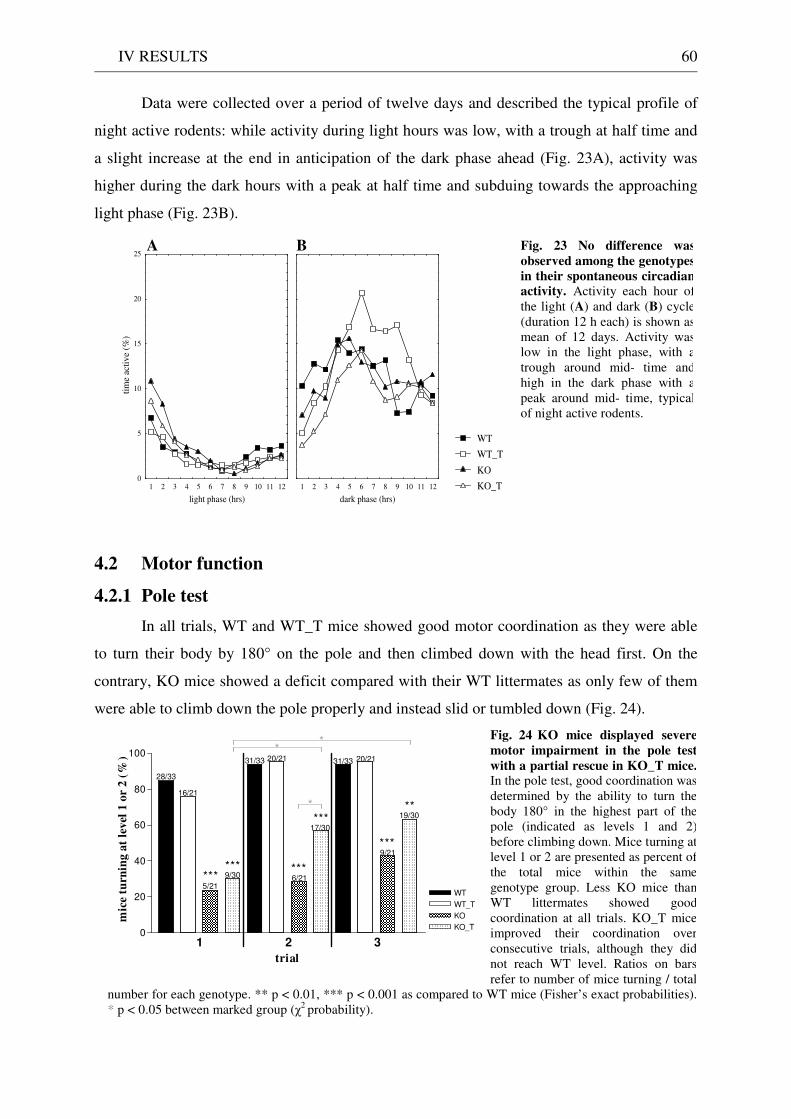
IV RESULTS 60
Data were collected over a period of twelve days and described the typical profile of
night active rodents: while activity during light hours was low, with a trough at half time and
a slight increase at the end in anticipation of the dark phase ahead (Fig. 23A), activity was
higher during the dark hours with a peak at half time and subduing towards the approaching
light phase (Fig. 23B).
Fig. 23 No difference was
observed among the genotypes
in their spontaneous circadian
activity. Activity each hour of the light (A) and dark (B) cycle (duration 12 h each) is shown as mean of 12 days. Activity was low in the light phase, with a trough around mid- time and high in the dark phase with a peak around mid- time, typical of night active rodents.
WT
WT_T
KO
KO_T light phase (hrs)
tim
e ac
tive
(%
)
0
5
10
15
20
25
1 2 3 4 5 6 7 8 9 10 11 12
dark phase (hrs)
1 2 3 4 5 6 7 8 9 10 11 12
A B
4.2 Motor function
4.2.1 Pole test
In all trials, WT and WT_T mice showed good motor coordination as they were able
to turn their body by 180° on the pole and then climbed down with the head first. On the
contrary, KO mice showed a deficit compared with their WT littermates as only few of them
were able to climb down the pole properly and instead slid or tumbled down (Fig. 24).
Fig. 24 KO mice displayed severe
motor impairment in the pole test
with a partial rescue in KO_T mice. In the pole test, good coordination was determined by the ability to turn the body 180° in the highest part of the pole (indicated as levels 1 and 2) before climbing down. Mice turning at level 1 or 2 are presented as percent of the total mice within the same genotype group. Less KO mice than WT littermates showed good coordination at all trials. KO_T mice improved their coordination over consecutive trials, although they did not reach WT level. Ratios on bars refer to number of mice turning / total
number for each genotype. ** p < 0.01, *** p < 0.001 as compared to WT mice (Fisher’s exact probabilities).* p < 0.05 between marked group (χ2 probability).
WT WT_TKO KO_TWT WT_TKO KO_TWT WT_TKO KO_T0
20
40
60
80
100
WT
WT_T
KO
KO_T
28/33
19/30
9/21
20/2131/33
17/30
6/21
20/2131/33
9/30
5/21
16/21
1 32
****** ***
***
***
***
**
trial
mic
e tu
rnin
g a
t le
vel
1 o
r 2
(%
)
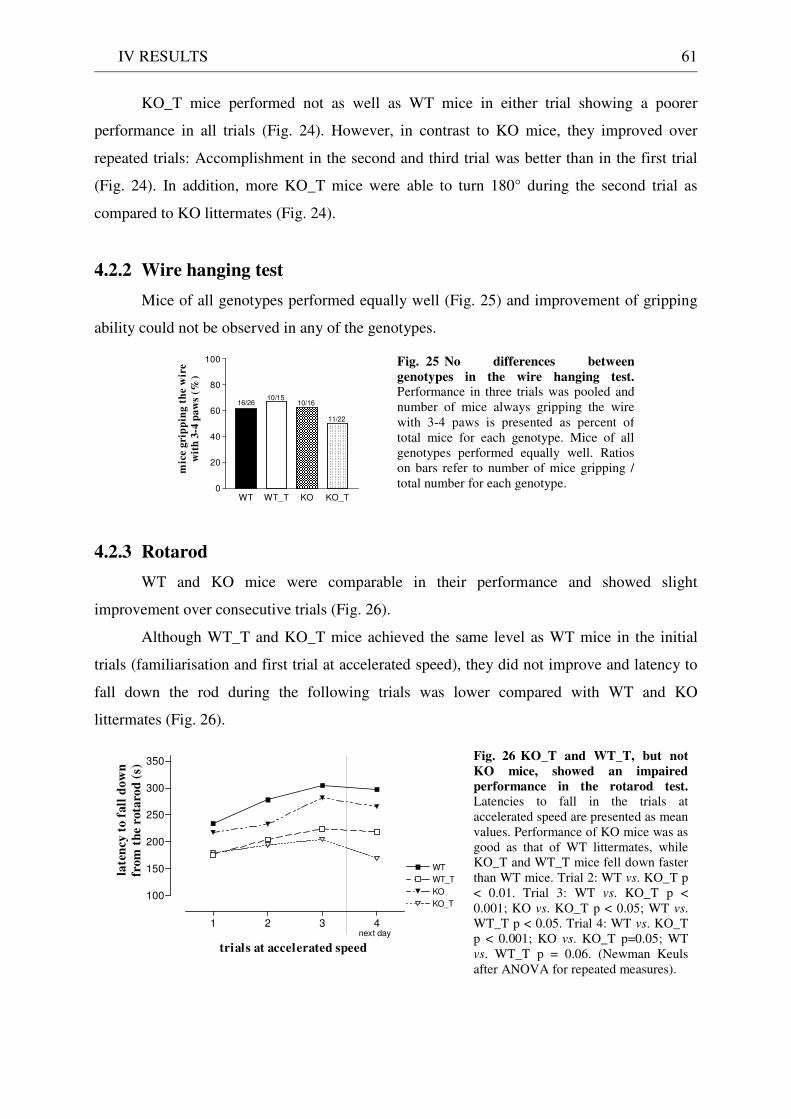
IV RESULTS 61
KO_T mice performed not as well as WT mice in either trial showing a poorer
performance in all trials (Fig. 24). However, in contrast to KO mice, they improved over
repeated trials: Accomplishment in the second and third trial was better than in the first trial
(Fig. 24). In addition, more KO_T mice were able to turn 180° during the second trial as
compared to KO littermates (Fig. 24).
4.2.2 Wire hanging test
Mice of all genotypes performed equally well (Fig. 25) and improvement of gripping
ability could not be observed in any of the genotypes.
Fig. 25 No differences between
genotypes in the wire hanging test.Performance in three trials was pooled and number of mice always gripping the wire with 3-4 paws is presented as percent of total mice for each genotype. Mice of all genotypes performed equally well. Ratios on bars refer to number of mice gripping /total number for each genotype.
WT WT_T KO KO_T0
20
40
60
80
100
16/26
11/22
10/1610/15
mic
e g
rip
pin
g t
he w
ire
wit
h 3
-4 p
aw
s (%
)
4.2.3 Rotarod
WT and KO mice were comparable in their performance and showed slight
improvement over consecutive trials (Fig. 26).
Although WT_T and KO_T mice achieved the same level as WT mice in the initial
trials (familiarisation and first trial at accelerated speed), they did not improve and latency to
fall down the rod during the following trials was lower compared with WT and KO
littermates (Fig. 26).
Fig. 26 KO_T and WT_T, but not
KO mice, showed an impaired
performance in the rotarod test.
Latencies to fall in the trials at accelerated speed are presented as mean values. Performance of KO mice was as good as that of WT littermates, while KO_T and WT_T mice fell down faster than WT mice. Trial 2: WT vs. KO_T p < 0.01. Trial 3: WT vs. KO_T p < 0.001; KO vs. KO_T p < 0.05; WT vs. WT_T p < 0.05. Trial 4: WT vs. KO_T p < 0.001; KO vs. KO_T p=0.05; WT vs. WT_T p = 0.06. (Newman Keuls after ANOVA for repeated measures).
1 2 3 4
100
150
200
250
300
350
WT
WT_T
KO
KO_T
next day
trials at accelerated speed
late
ncy
to
fall
do
wn
from
th
e ro
taro
d (
s)
IV RESULTS 62
4.3 Exploration / anxiety
4.3.1 Open field
The open field test was performed to analyse novelty-induced exploratory behaviour.
To test possible effects of housing conditions on the behaviour of the mice, one test was done
as mice were grouped housed and one test after mice had been single housed for 10 days. In
both open field tests, KO and KO_T mice displayed higher locomotion and more exploration
of the central part of the arena than WT and WT_T littermates.
Open field, 1st test (grouped housed mice)
The parameter total distance moved revealed higher locomotor activity of KO and
KO_T mice compared with WT littermates (Fig. 27A). Moreover, KO mice, but not KO_T
mice, moved faster than WT mice (Fig. 27B). KO_T mice displayed partial rescue as they did
not differ from WT mice (Fig. 27B). KO and KO_T mice showed less thigmotaxis compared
to WT mice as shown by the higher mean distance from the wall, while WT_T mice did not
differ from WT littermates (Fig. 27C). Accordingly, KO and KO_T mice entered the centre
more often and spent more time in the centre and less time in the border as compared to WT
mice (Fig. 27D-F).
No difference between genotypes was observed for stretch attend posture (SAP),
rearing on or off wall, self grooming, and time spent motionless. In contrast, KO mice, but not
KO_T littermates, showed less flat posture in comparison to WT mice (Fig. 27G). KO and
KO_T mice made less boli than WT littermates (Fig. 27H). No difference between WT and
WT_T littermates was observed for any of the parameters analysed (Fig. 27).
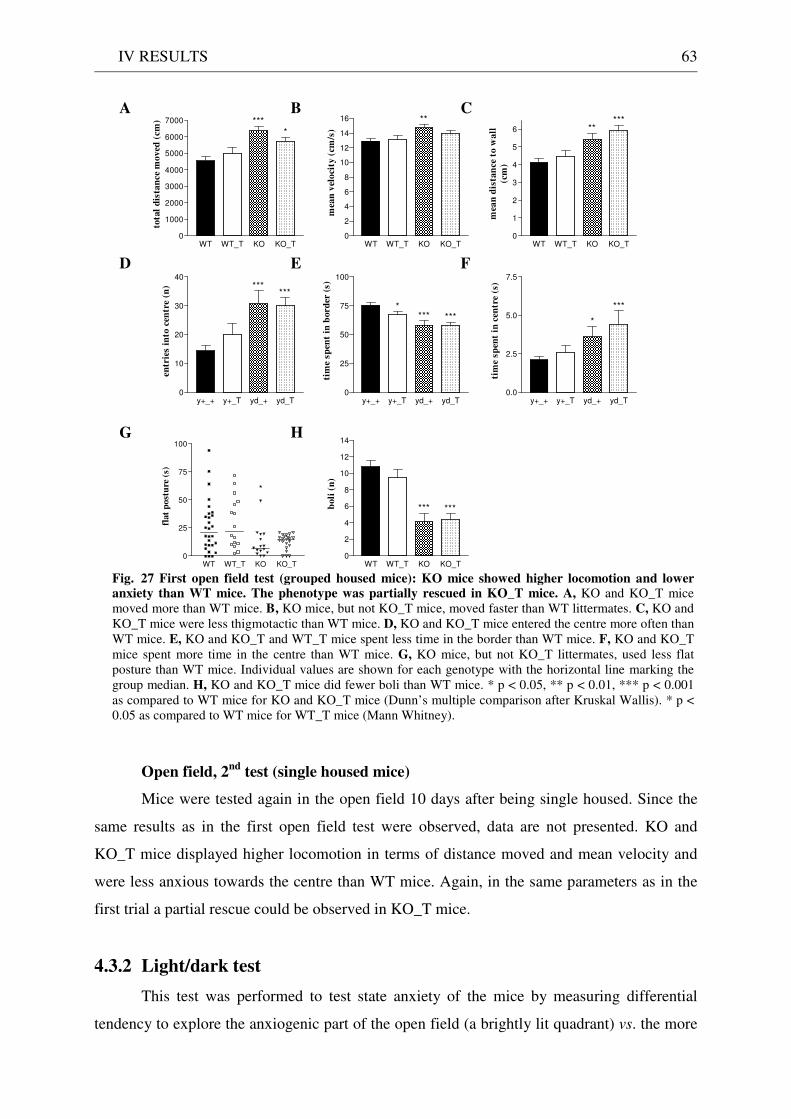
IV RESULTS 63
WT WT_T KO KO_T0
1000
2000
3000
4000
5000
6000
7000 ****
tota
l d
ista
nce
mo
ved
(cm
)
WT WT_T KO KO_T0
2
4
6
8
10
12
14
16 **
mea
n v
elo
city
(cm
/s)
WT WT_T KO KO_T0
1
2
3
4
5
6 *****
mea
n d
ista
nce
to
wa
ll
(cm
)
y+_+ y+_T yd_+ yd_T0
10
20
30
40***
***
en
trie
s i
nto
cen
tre (
n)
y+_+ y+_T yd_+ yd_T0
25
50
75
100
*** ****
tim
e sp
ent
in b
ord
er (
s)
y+_+ y+_T yd_+ yd_T0.0
2.5
5.0
7.5
*
***
tim
e sp
ent
in c
entr
e (
s)
WT WT_T KO KO_T0
25
50
75
100
*
flat
po
stu
re (
s)
WT WT_T KO KO_T0
2
4
6
8
10
12
14
*** ***bo
li (
n)
Fig. 27 First open field test (grouped housed mice): KO mice showed higher locomotion and lower anxiety than WT mice. The phenotype was partially rescued in KO_T mice. A, KO and KO_T mice moved more than WT mice. B, KO mice, but not KO_T mice, moved faster than WT littermates. C, KO and KO_T mice were less thigmotactic than WT mice. D, KO and KO_T mice entered the centre more often than WT mice. E, KO and KO_T and WT_T mice spent less time in the border than WT mice. F, KO and KO_T mice spent more time in the centre than WT mice. G, KO mice, but not KO_T littermates, used less flat posture than WT mice. Individual values are shown for each genotype with the horizontal line marking the group median. H, KO and KO_T mice did fewer boli than WT mice. * p < 0.05, ** p < 0.01, *** p < 0.001 as compared to WT mice for KO and KO_T mice (Dunn’s multiple comparison after Kruskal Wallis). * p < 0.05 as compared to WT mice for WT_T mice (Mann Whitney).
A B C
D E F
G H
Open field, 2nd
test (single housed mice)
Mice were tested again in the open field 10 days after being single housed. Since the
same results as in the first open field test were observed, data are not presented. KO and
KO_T mice displayed higher locomotion in terms of distance moved and mean velocity and
were less anxious towards the centre than WT mice. Again, in the same parameters as in the
first trial a partial rescue could be observed in KO_T mice.
4.3.2 Light/dark test
This test was performed to test state anxiety of the mice by measuring differential
tendency to explore the anxiogenic part of the open field (a brightly lit quadrant) vs. the more
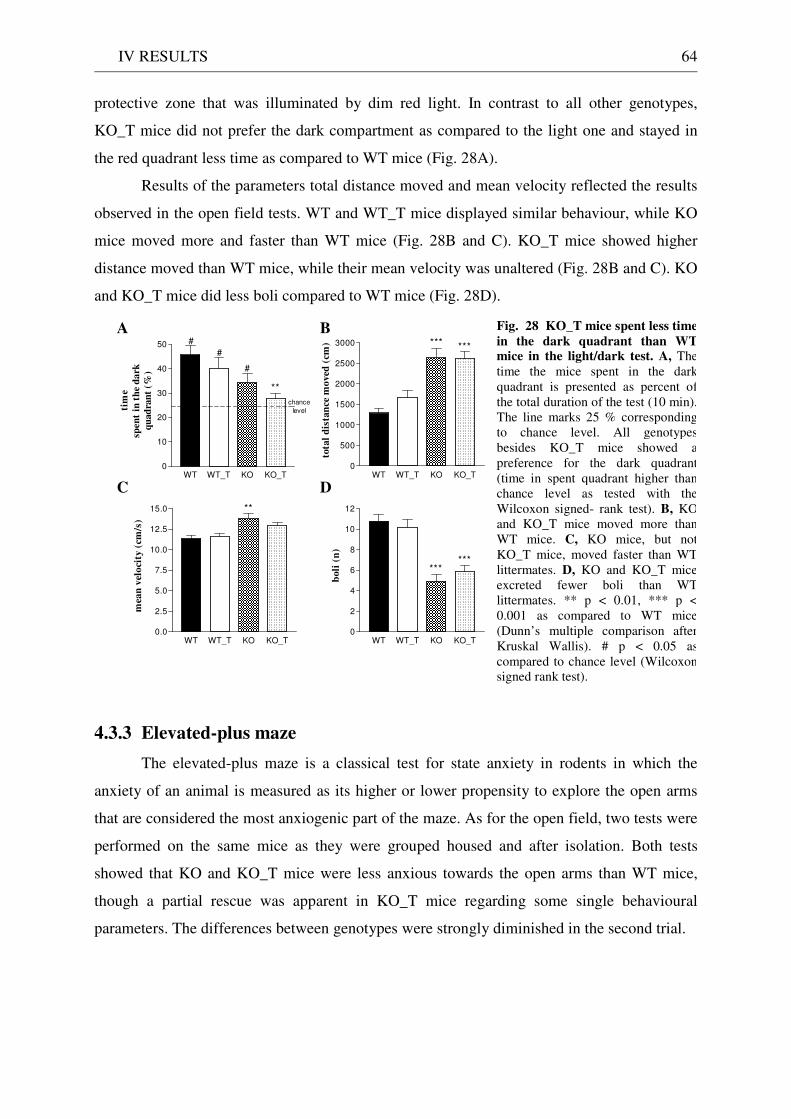
IV RESULTS 64
protective zone that was illuminated by dim red light. In contrast to all other genotypes,
KO_T mice did not prefer the dark compartment as compared to the light one and stayed in
the red quadrant less time as compared to WT mice (Fig. 28A).
Results of the parameters total distance moved and mean velocity reflected the results
observed in the open field tests. WT and WT_T mice displayed similar behaviour, while KO
mice moved more and faster than WT mice (Fig. 28B and C). KO_T mice showed higher
distance moved than WT mice, while their mean velocity was unaltered (Fig. 28B and C). KO
and KO_T mice did less boli compared to WT mice (Fig. 28D).
Fig. 28 KO_T mice spent less time
in the dark quadrant than WT mice in the light/dark test. A, The time the mice spent in the dark quadrant is presented as percent of the total duration of the test (10 min). The line marks 25 % corresponding to chance level. All genotypes besides KO_T mice showed a preference for the dark quadrant (time in spent quadrant higher than chance level as tested with the Wilcoxon signed- rank test). B, KOand KO_T mice moved more than WT mice. C, KO mice, but not KO_T mice, moved faster than WT littermates. D, KO and KO_T mice excreted fewer boli than WT littermates. ** p < 0.01, *** p < 0.001 as compared to WT mice (Dunn’s multiple comparison after Kruskal Wallis). # p < 0.05 as compared to chance level (Wilcoxon signed rank test).
WT WT_T KO KO_T0
10
20
30
40
50
**
chance
leveltim
e
spen
t in
th
e d
ark
qu
ad
ran
t (%
)
#
#
#
WT WT_T KO KO_T0
500
1000
1500
2000
2500
3000 *** ***
tota
l d
ista
nce
mo
ved
(cm
)
WT WT_T KO KO_T0.0
2.5
5.0
7.5
10.0
12.5
15.0 **
mea
n v
elo
city
(cm
/s)
WT WT_T KO KO_T0
2
4
6
8
10
12
******
bo
li (
n)
A B
C D
4.3.3 Elevated-plus maze
The elevated-plus maze is a classical test for state anxiety in rodents in which the
anxiety of an animal is measured as its higher or lower propensity to explore the open arms
that are considered the most anxiogenic part of the maze. As for the open field, two tests were
performed on the same mice as they were grouped housed and after isolation. Both tests
showed that KO and KO_T mice were less anxious towards the open arms than WT mice,
though a partial rescue was apparent in KO_T mice regarding some single behavioural
parameters. The differences between genotypes were strongly diminished in the second trial.
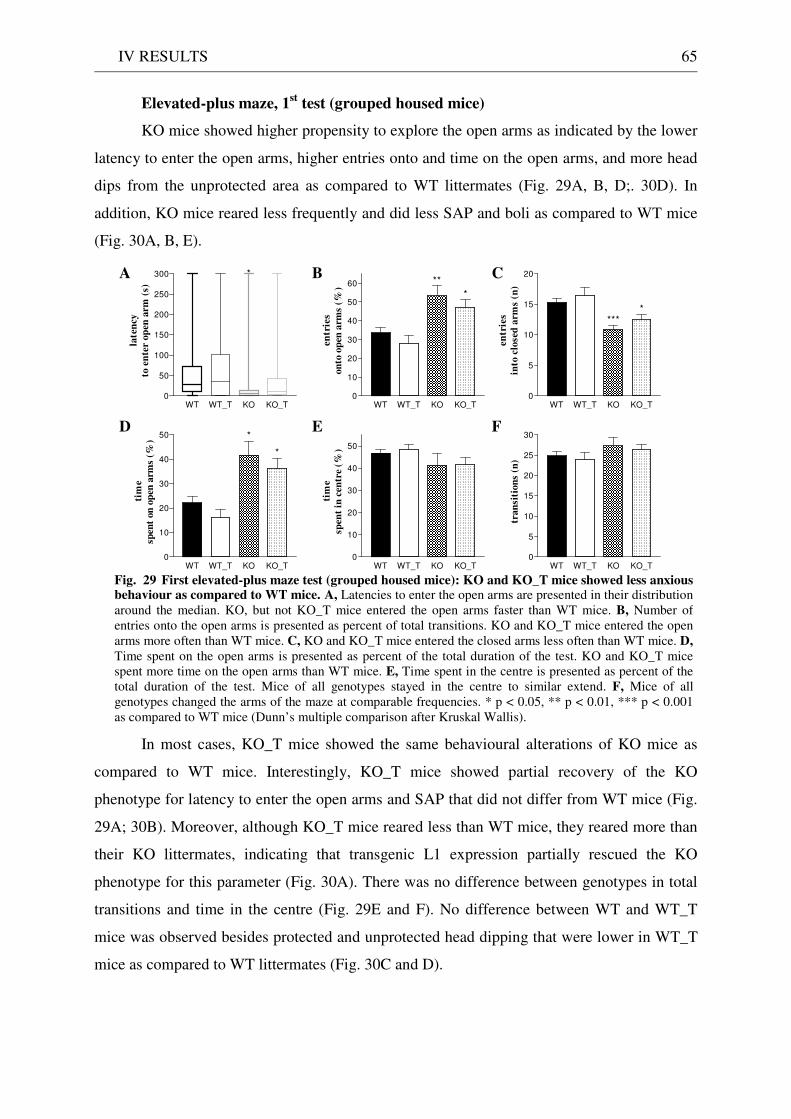
IV RESULTS 65
Elevated-plus maze, 1st test (grouped housed mice)
KO mice showed higher propensity to explore the open arms as indicated by the lower
latency to enter the open arms, higher entries onto and time on the open arms, and more head
dips from the unprotected area as compared to WT littermates (Fig. 29A, B, D;. 30D). In
addition, KO mice reared less frequently and did less SAP and boli as compared to WT mice
(Fig. 30A, B, E).
WT WT_T KO KO_T0
50
100
150
200
250
300
late
ncy
to e
nte
r op
en a
rm (
s)
*
WT WT_T KO KO_T0
10
20
30
40
50
60 **
*
en
trie
s
on
to o
pen
arm
s (%
)
WT WT_T KO KO_T0
5
10
15
20
****
en
trie
s
into
clo
sed
arm
s (n
)
WT WT_T KO KO_T0
10
20
30
40
50 *
*
tim
e
spen
t on
op
en a
rms
(%)
WT WT_T KO KO_T0
10
20
30
40
50
tim
e
spen
t in
cen
tre
(%)
WT WT_T KO KO_T0
5
10
15
20
25
30
tran
siti
on
s (n
)
Fig. 29 First elevated-plus maze test (grouped housed mice): KO and KO_T mice showed less anxious behaviour as compared to WT mice. A, Latencies to enter the open arms are presented in their distribution around the median. KO, but not KO_T mice entered the open arms faster than WT mice. B, Number of entries onto the open arms is presented as percent of total transitions. KO and KO_T mice entered the open arms more often than WT mice. C, KO and KO_T mice entered the closed arms less often than WT mice. D, Time spent on the open arms is presented as percent of the total duration of the test. KO and KO_T mice spent more time on the open arms than WT mice. E, Time spent in the centre is presented as percent of the total duration of the test. Mice of all genotypes stayed in the centre to similar extend. F, Mice of all genotypes changed the arms of the maze at comparable frequencies. * p < 0.05, ** p < 0.01, *** p < 0.001 as compared to WT mice (Dunn’s multiple comparison after Kruskal Wallis).
A B
D
C
E F
In most cases, KO_T mice showed the same behavioural alterations of KO mice as
compared to WT mice. Interestingly, KO_T mice showed partial recovery of the KO
phenotype for latency to enter the open arms and SAP that did not differ from WT mice (Fig.
29A; 30B). Moreover, although KO_T mice reared less than WT mice, they reared more than
their KO littermates, indicating that transgenic L1 expression partially rescued the KO
phenotype for this parameter (Fig. 30A). There was no difference between genotypes in total
transitions and time in the centre (Fig. 29E and F). No difference between WT and WT_T
mice was observed besides protected and unprotected head dipping that were lower in WT_T
mice as compared to WT littermates (Fig. 30C and D).
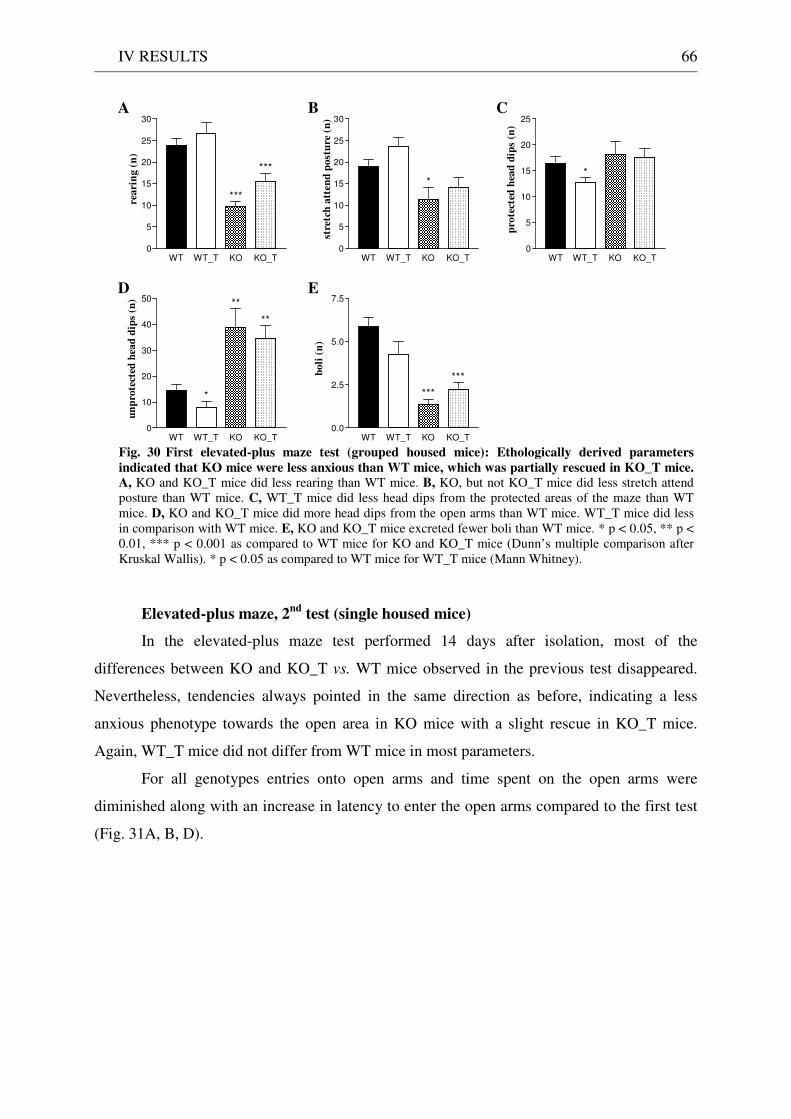
IV RESULTS 66
WT WT_T KO KO_T0
5
10
15
20
25
30
***
***
rea
rin
g (
n)
WT WT_T KO KO_T0
5
10
15
20
25
30
*
stre
tch
att
end
po
stu
re (
n)
WT WT_T KO KO_T0
5
10
15
20
25
*
pro
tect
ed h
ead
dip
s (n
)
WT WT_T KO KO_T0
10
20
30
40
50
*
**
**
un
pro
tect
ed h
ead
dip
s (n
)
WT WT_T KO KO_T0.0
2.5
5.0
7.5
***
***bo
li (
n)
Fig. 30 First elevated-plus maze test (grouped housed mice): Ethologically derived parameters
indicated that KO mice were less anxious than WT mice, which was partially rescued in KO_T mice. A, KO and KO_T mice did less rearing than WT mice. B, KO, but not KO_T mice did less stretch attend posture than WT mice. C, WT_T mice did less head dips from the protected areas of the maze than WT mice. D, KO and KO_T mice did more head dips from the open arms than WT mice. WT_T mice did less in comparison with WT mice. E, KO and KO_T mice excreted fewer boli than WT mice. * p < 0.05, ** p < 0.01, *** p < 0.001 as compared to WT mice for KO and KO_T mice (Dunn’s multiple comparison after Kruskal Wallis). * p < 0.05 as compared to WT mice for WT_T mice (Mann Whitney).
A
D E
B C
Elevated-plus maze, 2nd
test (single housed mice)
In the elevated-plus maze test performed 14 days after isolation, most of the
differences between KO and KO_T vs. WT mice observed in the previous test disappeared.
Nevertheless, tendencies always pointed in the same direction as before, indicating a less
anxious phenotype towards the open area in KO mice with a slight rescue in KO_T mice.
Again, WT_T mice did not differ from WT mice in most parameters.
For all genotypes entries onto open arms and time spent on the open arms were
diminished along with an increase in latency to enter the open arms compared to the first test
(Fig. 31A, B, D).
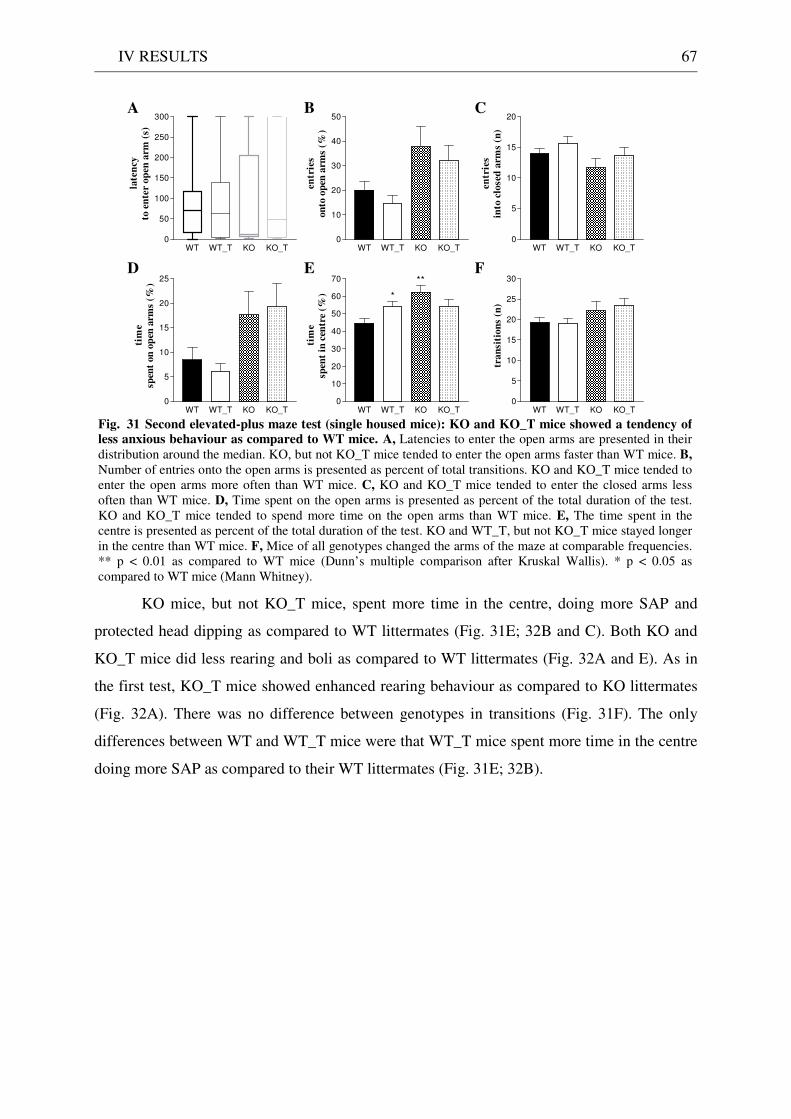
IV RESULTS 67
WT WT_T KO KO_T0
50
100
150
200
250
300
late
ncy
to e
nte
r o
pen
arm
(s)
WT WT_T KO KO_T0
10
20
30
40
50
en
trie
s
on
to o
pen
arm
s (%
)
WT WT_T KO KO_T0
5
10
15
20
en
trie
s
into
clo
sed
arm
s (n
)
WT WT_T KO KO_T0
5
10
15
20
25
tim
e
spen
t on
op
en a
rms
(%)
WT WT_T KO KO_T0
10
20
30
40
50
60
70 **
*
tim
e
spen
t in
cen
tre
(%)
WT WT_T KO KO_T0
5
10
15
20
25
30
tra
nsi
tio
ns
(n)
Fig. 31 Second elevated-plus maze test (single housed mice): KO and KO_T mice showed a tendency of less anxious behaviour as compared to WT mice. A, Latencies to enter the open arms are presented in their distribution around the median. KO, but not KO_T mice tended to enter the open arms faster than WT mice. B,
Number of entries onto the open arms is presented as percent of total transitions. KO and KO_T mice tended to enter the open arms more often than WT mice. C, KO and KO_T mice tended to enter the closed arms less often than WT mice. D, Time spent on the open arms is presented as percent of the total duration of the test. KO and KO_T mice tended to spend more time on the open arms than WT mice. E, The time spent in thecentre is presented as percent of the total duration of the test. KO and WT_T, but not KO_T mice stayed longer in the centre than WT mice. F, Mice of all genotypes changed the arms of the maze at comparable frequencies.** p < 0.01 as compared to WT mice (Dunn’s multiple comparison after Kruskal Wallis). * p < 0.05 as compared to WT mice (Mann Whitney).
A B
D
C
E F
KO mice, but not KO_T mice, spent more time in the centre, doing more SAP and
protected head dipping as compared to WT littermates (Fig. 31E; 32B and C). Both KO and
KO_T mice did less rearing and boli as compared to WT littermates (Fig. 32A and E). As in
the first test, KO_T mice showed enhanced rearing behaviour as compared to KO littermates
(Fig. 32A). There was no difference between genotypes in transitions (Fig. 31F). The only
differences between WT and WT_T mice were that WT_T mice spent more time in the centre
doing more SAP as compared to their WT littermates (Fig. 31E; 32B).
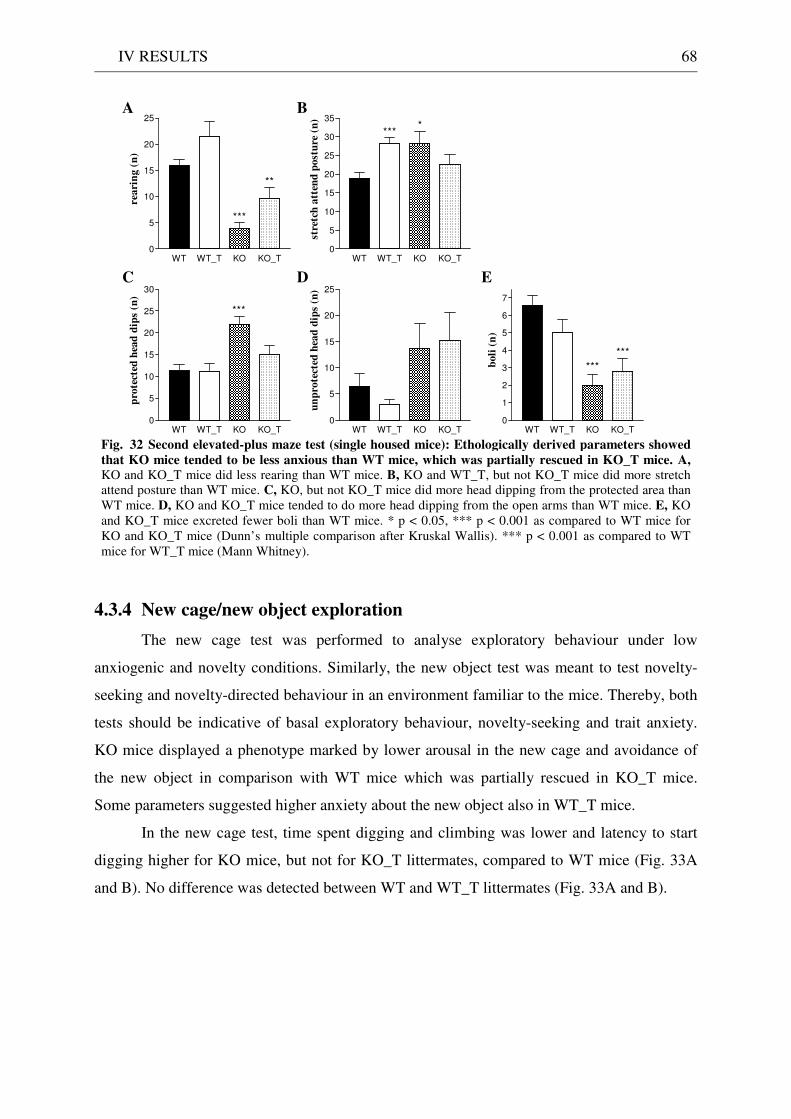
IV RESULTS 68
WT WT_T KO KO_T0
5
10
15
20
25
***
**
rea
rin
g (
n)
WT WT_T KO KO_T0
5
10
15
20
25
30
35*
***
stre
tch
att
end
post
ure
(n
)
WT WT_T KO KO_T0
5
10
15
20
25
30
***
pro
tect
ed h
ead
dip
s (n
)
WT WT_T KO KO_T0
5
10
15
20
25
un
pro
tect
ed h
ead
dip
s (n
)
WT WT_T KO KO_T0
1
2
3
4
5
6
7
***
***
boli
(n
)
Fig. 32 Second elevated-plus maze test (single housed mice): Ethologically derived parameters showed
that KO mice tended to be less anxious than WT mice, which was partially rescued in KO_T mice. A, KO and KO_T mice did less rearing than WT mice. B, KO and WT_T, but not KO_T mice did more stretch attend posture than WT mice. C, KO, but not KO_T mice did more head dipping from the protected area than WT mice. D, KO and KO_T mice tended to do more head dipping from the open arms than WT mice. E, KO and KO_T mice excreted fewer boli than WT mice. * p < 0.05, *** p < 0.001 as compared to WT mice for KO and KO_T mice (Dunn’s multiple comparison after Kruskal Wallis). *** p < 0.001 as compared to WT mice for WT_T mice (Mann Whitney).
A
D E
B
C
4.3.4 New cage/new object exploration
The new cage test was performed to analyse exploratory behaviour under low
anxiogenic and novelty conditions. Similarly, the new object test was meant to test novelty-
seeking and novelty-directed behaviour in an environment familiar to the mice. Thereby, both
tests should be indicative of basal exploratory behaviour, novelty-seeking and trait anxiety.
KO mice displayed a phenotype marked by lower arousal in the new cage and avoidance of
the new object in comparison with WT mice which was partially rescued in KO_T mice.
Some parameters suggested higher anxiety about the new object also in WT_T mice.
In the new cage test, time spent digging and climbing was lower and latency to start
digging higher for KO mice, but not for KO_T littermates, compared to WT mice (Fig. 33A
and B). No difference was detected between WT and WT_T littermates (Fig. 33A and B).
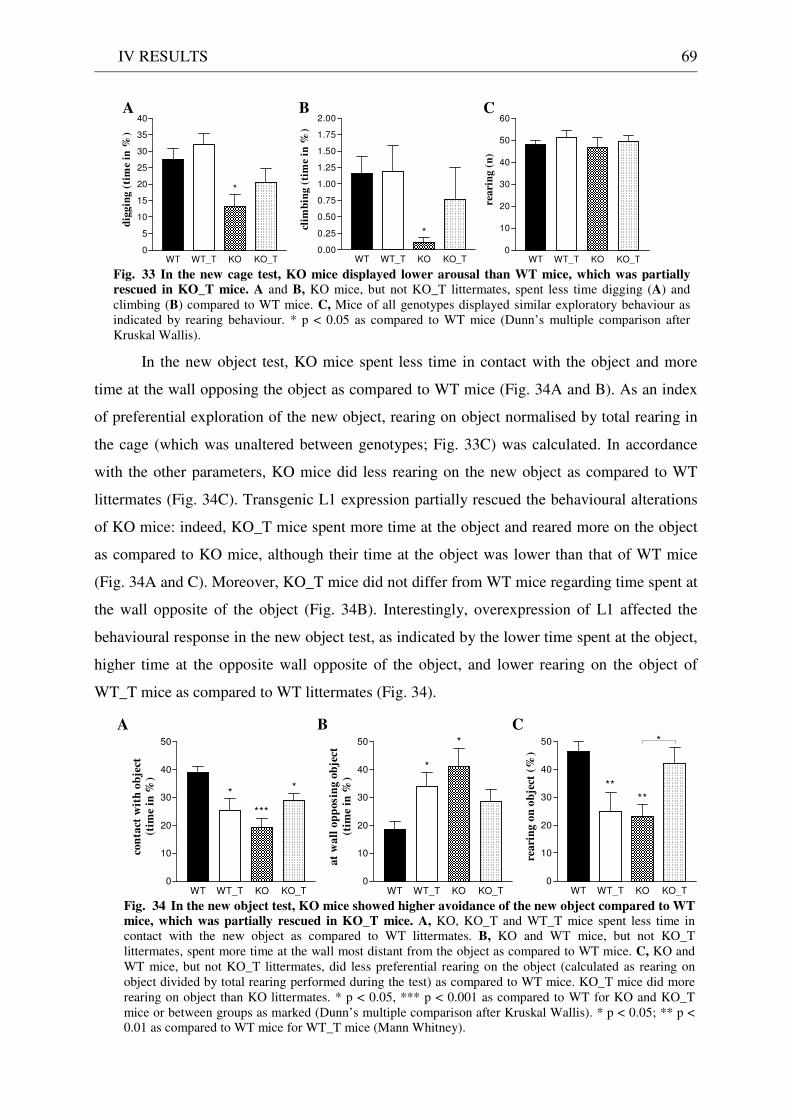
IV RESULTS 69
WT WT_T KO KO_T0
5
10
15
20
25
30
35
40
*
dig
gin
g (
tim
e in
%)
WT WT_T KO KO_T0.00
0.25
0.50
0.75
1.00
1.25
1.50
1.75
2.00
*
clim
bin
g (
tim
e in
%)
WT WT_T KO KO_T0
10
20
30
40
50
60
rea
rin
g (
n)
Fig. 33 In the new cage test, KO mice displayed lower arousal than WT mice, which was partially
rescued in KO_T mice. A and B, KO mice, but not KO_T littermates, spent less time digging (A) and climbing (B) compared to WT mice. C, Mice of all genotypes displayed similar exploratory behaviour as indicated by rearing behaviour. * p < 0.05 as compared to WT mice (Dunn’s multiple comparison after Kruskal Wallis).
A B C
In the new object test, KO mice spent less time in contact with the object and more
time at the wall opposing the object as compared to WT mice (Fig. 34A and B). As an index
of preferential exploration of the new object, rearing on object normalised by total rearing in
the cage (which was unaltered between genotypes; Fig. 33C) was calculated. In accordance
with the other parameters, KO mice did less rearing on the new object as compared to WT
littermates (Fig. 34C). Transgenic L1 expression partially rescued the behavioural alterations
of KO mice: indeed, KO_T mice spent more time at the object and reared more on the object
as compared to KO mice, although their time at the object was lower than that of WT mice
(Fig. 34A and C). Moreover, KO_T mice did not differ from WT mice regarding time spent at
the wall opposite of the object (Fig. 34B). Interestingly, overexpression of L1 affected the
behavioural response in the new object test, as indicated by the lower time spent at the object,
higher time at the opposite wall opposite of the object, and lower rearing on the object of
WT_T mice as compared to WT littermates (Fig. 34).
WT WT_T KO KO_T0
10
20
30
40
50
***
**
con
tact
wit
h o
bje
ct
(tim
e in
%)
WT WT_T KO KO_T0
10
20
30
40
50 *
*
at
wa
ll o
pp
osin
g o
bje
ct
(tim
e in
%)
WT WT_T KO KO_T0
10
20
30
40
50
**
*
reari
ng
on
ob
ject
(%
)
**
Fig. 34 In the new object test, KO mice showed higher avoidance of the new object compared to WT
mice, which was partially rescued in KO_T mice. A, KO, KO_T and WT_T mice spent less time in contact with the new object as compared to WT littermates. B, KO and WT mice, but not KO_T littermates, spent more time at the wall most distant from the object as compared to WT mice. C, KO and WT mice, but not KO_T littermates, did less preferential rearing on the object (calculated as rearing on object divided by total rearing performed during the test) as compared to WT mice. KO_T mice did more rearing on object than KO littermates. * p < 0.05, *** p < 0.001 as compared to WT for KO and KO_Tmice or between groups as marked (Dunn’s multiple comparison after Kruskal Wallis). * p < 0.05; ** p < 0.01 as compared to WT mice for WT_T mice (Mann Whitney).
A C B
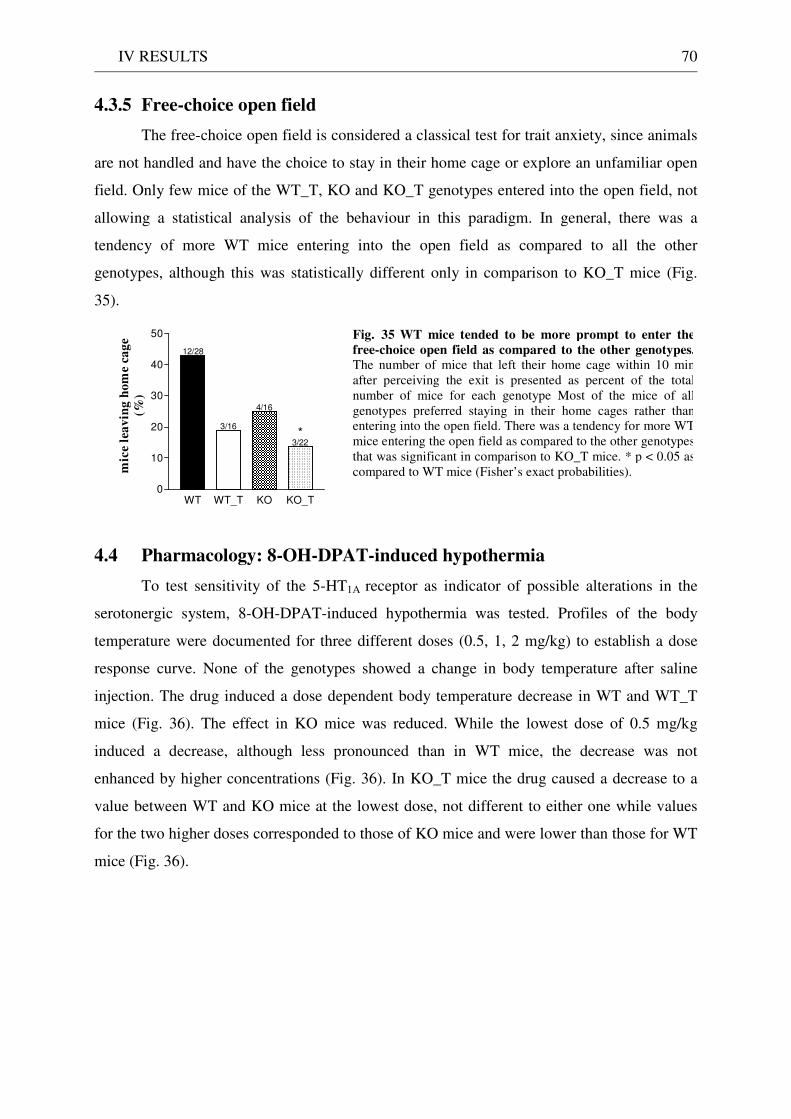
IV RESULTS 70
4.3.5 Free-choice open field
The free-choice open field is considered a classical test for trait anxiety, since animals
are not handled and have the choice to stay in their home cage or explore an unfamiliar open
field. Only few mice of the WT_T, KO and KO_T genotypes entered into the open field, not
allowing a statistical analysis of the behaviour in this paradigm. In general, there was a
tendency of more WT mice entering into the open field as compared to all the other
genotypes, although this was statistically different only in comparison to KO_T mice (Fig.
35).
Fig. 35 WT mice tended to be more prompt to enter the
free-choice open field as compared to the other genotypes.
The number of mice that left their home cage within 10 min after perceiving the exit is presented as percent of the total number of mice for each genotype Most of the mice of all genotypes preferred staying in their home cages rather than entering into the open field. There was a tendency for more WT mice entering the open field as compared to the other genotypes that was significant in comparison to KO_T mice. * p < 0.05 as compared to WT mice (Fisher’s exact probabilities).
WT WT_T KO KO_T0
10
20
30
40
50
12/28
3/22
4/16
3/16*
mic
e le
av
ing
ho
me c
ag
e
(%)
4.4 Pharmacology: 8-OH-DPAT-induced hypothermia
To test sensitivity of the 5-HT1A receptor as indicator of possible alterations in the
serotonergic system, 8-OH-DPAT-induced hypothermia was tested. Profiles of the body
temperature were documented for three different doses (0.5, 1, 2 mg/kg) to establish a dose
response curve. None of the genotypes showed a change in body temperature after saline
injection. The drug induced a dose dependent body temperature decrease in WT and WT_T
mice (Fig. 36). The effect in KO mice was reduced. While the lowest dose of 0.5 mg/kg
induced a decrease, although less pronounced than in WT mice, the decrease was not
enhanced by higher concentrations (Fig. 36). In KO_T mice the drug caused a decrease to a
value between WT and KO mice at the lowest dose, not different to either one while values
for the two higher doses corresponded to those of KO mice and were lower than those for WT
mice (Fig. 36).
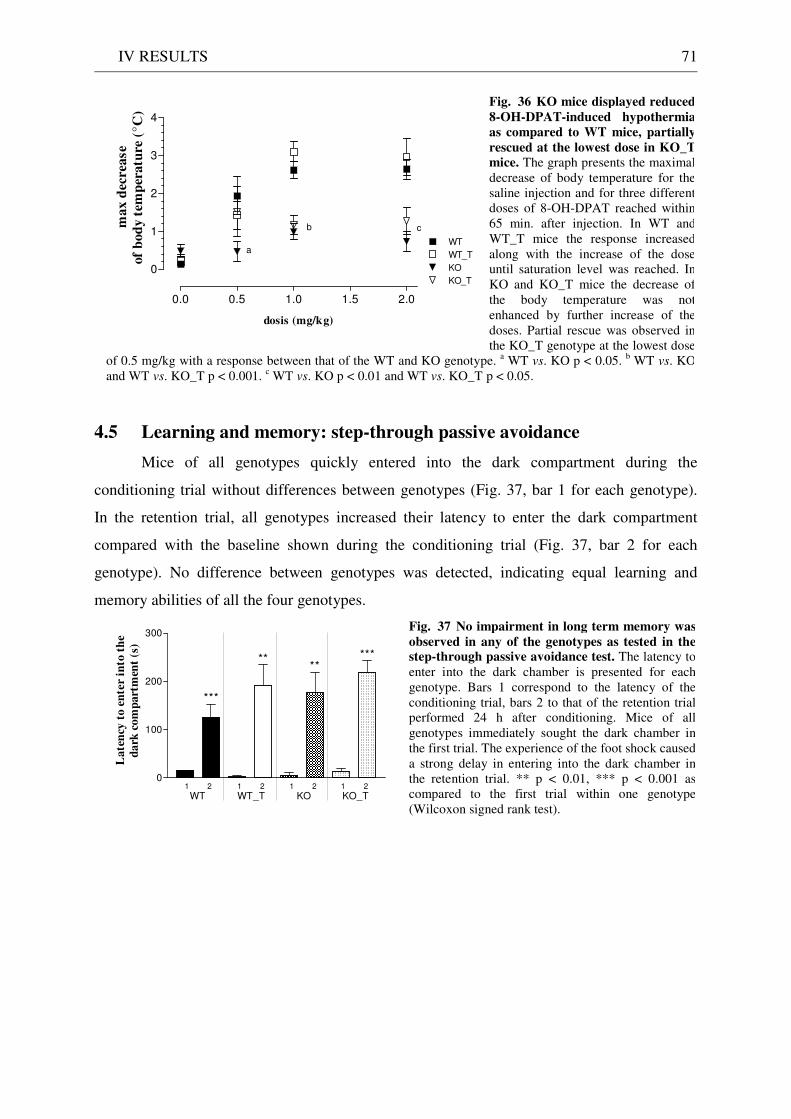
IV RESULTS 71
Fig. 36 KO mice displayed reduced
8-OH-DPAT-induced hypothermia
as compared to WT mice, partially
rescued at the lowest dose in KO_T
mice. The graph presents the maximal decrease of body temperature for the saline injection and for three different doses of 8-OH-DPAT reached within 65 min. after injection. In WT and WT_T mice the response increased along with the increase of the dose until saturation level was reached. In KO and KO_T mice the decrease of the body temperature was not enhanced by further increase of the doses. Partial rescue was observed in the KO_T genotype at the lowest dose
of 0.5 mg/kg with a response between that of the WT and KO genotype. a WT vs. KO p < 0.05. b WT vs. KOand WT vs. KO_T p < 0.001. c WT vs. KO p < 0.01 and WT vs. KO_T p < 0.05.
0.0 0.5 1.0 1.5 2.0
0
1
2
3
4
WT
WT_T
KO
KO_T
a
b c
dosis (mg/kg)
ma
x d
ecre
ase
of
bod
y t
emp
eratu
re (
°C)
4.5 Learning and memory: step-through passive avoidance
Mice of all genotypes quickly entered into the dark compartment during the
conditioning trial without differences between genotypes (Fig. 37, bar 1 for each genotype).
In the retention trial, all genotypes increased their latency to enter the dark compartment
compared with the baseline shown during the conditioning trial (Fig. 37, bar 2 for each
genotype). No difference between genotypes was detected, indicating equal learning and
memory abilities of all the four genotypes.
Fig. 37 No impairment in long term memory was
observed in any of the genotypes as tested in the step-through passive avoidance test. The latency to enter into the dark chamber is presented for each genotype. Bars 1 correspond to the latency of the conditioning trial, bars 2 to that of the retention trialperformed 24 h after conditioning. Mice of all genotypes immediately sought the dark chamber in the first trial. The experience of the foot shock caused a strong delay in entering into the dark chamber inthe retention trial. ** p < 0.01, *** p < 0.001 as compared to the first trial within one genotype(Wilcoxon signed rank test).
y+_+ 1y+_+ 2y+_T 1y+_T 2yd_+ 1yd_+ 2yd_T 1yd_T 20
100
200
300
1 2
WT1 21 21 2
KO_TKOWT_T
***
****
***
La
ten
cy t
o e
nte
r in
to t
he
da
rk c
om
part
men
t (s
)
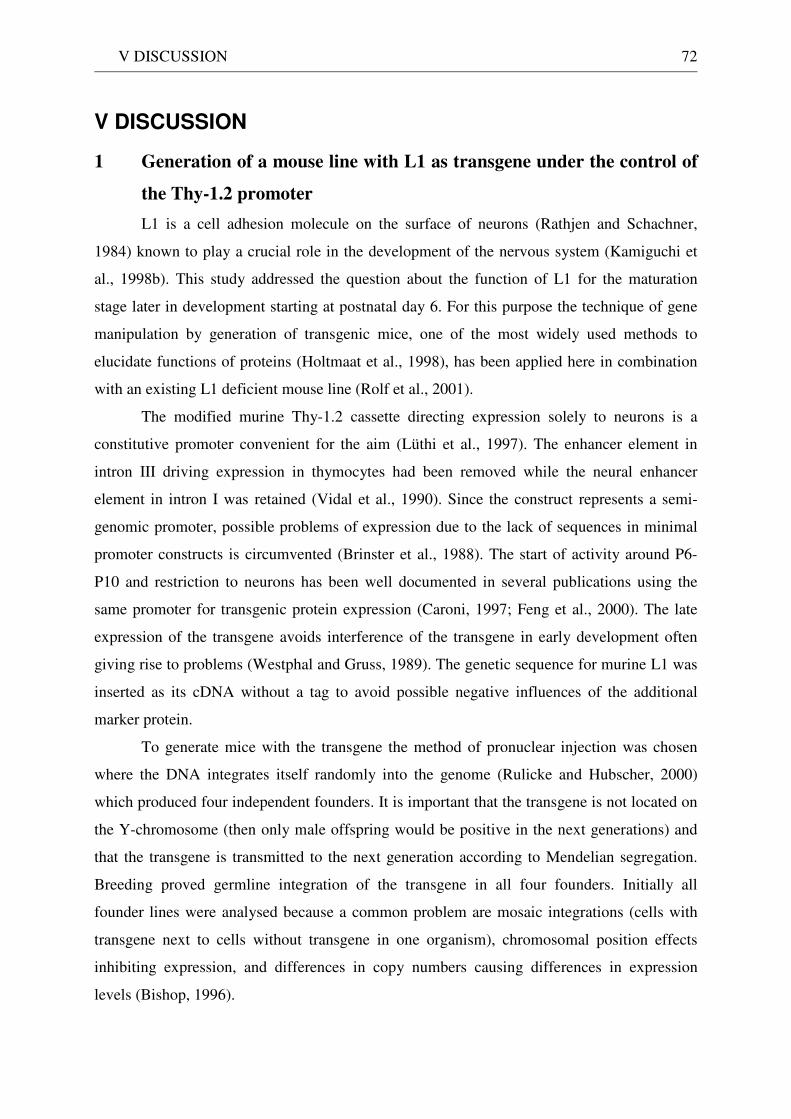
V DISCUSSION 72
V DISCUSSION
1 Generation of a mouse line with L1 as transgene under the control of
the Thy-1.2 promoter
L1 is a cell adhesion molecule on the surface of neurons (Rathjen and Schachner,
1984) known to play a crucial role in the development of the nervous system (Kamiguchi et
al., 1998b). This study addressed the question about the function of L1 for the maturation
stage later in development starting at postnatal day 6. For this purpose the technique of gene
manipulation by generation of transgenic mice, one of the most widely used methods to
elucidate functions of proteins (Holtmaat et al., 1998), has been applied here in combination
with an existing L1 deficient mouse line (Rolf et al., 2001).
The modified murine Thy-1.2 cassette directing expression solely to neurons is a
constitutive promoter convenient for the aim (Lüthi et al., 1997). The enhancer element in
intron III driving expression in thymocytes had been removed while the neural enhancer
element in intron I was retained (Vidal et al., 1990). Since the construct represents a semi-
genomic promoter, possible problems of expression due to the lack of sequences in minimal
promoter constructs is circumvented (Brinster et al., 1988). The start of activity around P6-
P10 and restriction to neurons has been well documented in several publications using the
same promoter for transgenic protein expression (Caroni, 1997; Feng et al., 2000). The late
expression of the transgene avoids interference of the transgene in early development often
giving rise to problems (Westphal and Gruss, 1989). The genetic sequence for murine L1 was
inserted as its cDNA without a tag to avoid possible negative influences of the additional
marker protein.
To generate mice with the transgene the method of pronuclear injection was chosen
where the DNA integrates itself randomly into the genome (Rulicke and Hubscher, 2000)
which produced four independent founders. It is important that the transgene is not located on
the Y-chromosome (then only male offspring would be positive in the next generations) and
that the transgene is transmitted to the next generation according to Mendelian segregation.
Breeding proved germline integration of the transgene in all four founders. Initially all
founder lines were analysed because a common problem are mosaic integrations (cells with
transgene next to cells without transgene in one organism), chromosomal position effects
inhibiting expression, and differences in copy numbers causing differences in expression
levels (Bishop, 1996).
V DISCUSSION 73
2 Successful expression of transgenic L1
The next step was to verify that not only the transgene is incorporated into the genome
but also transcribed and finally translated into protein. Expression level is generally described
high in the literature where the same promoter has been used for other transgenes. Here, the
expression of transgenic L1 is so strong that it is more than twofold higher than wildtype L1
level. While wildtype L1 expression starts already at embryonic day 10 (Fushiki and
Schachner, 1986), transgenic L1 is only faintly detectable at P3, with a steep increase by P13.
The high level of expression is maintained throughout adulthood. This profile of expression is
consistent with the natural activity of the Thy-1.2 promoter (Morris, 1985) and the other
reports using the promoter for transgene expression (Lüthi et al., 1997; Caroni, 1997). The
reason for the high expression level could be not only due to the genuine activity of the
promoter. It could also be the consequence of integration at a site of high activity in the
chromosome or integration of a large number of copies of the transgene (Bishop, 1996).
However, since all four founder lines show strong expression of transgenic L1 and since
several reports cited above have observed similar levels, it is most likely that the drive for
strong expression lies in the character of the promoter itself rather than in secondary effects.
3 Localisation of transgenic L1
It had to be verified that transgenic L1 reaches the cell surface as a rudimentary
condition for functionality. Digestion by the enzyme endoglycosidase H detects possible
intracellular localisation of L1. The enzyme cleaves N-glycans with terminal mannose
residues found typically on proteins localised in the endoplasmatic reticulum (ER) and early
Golgi network before they are processed for cell surface localisation. Intracellular localisation
is concluded from EndoH sensitivity whenever transgenic L1 is present (be it on the WT or on
the KO background), but never observed in the WT genotype. This signals that in the WT
situation L1 is displayed on the cell surface 100 % (based on sensitivity of western blot),
while part of L1 always remains inside the cell when transgenic L1 is present. Still, part of
transgenic L1 must reach the cell surface in the KO background, since the protein is never
completely digested. The situation in the WT background cannot be determined as precisely
since the distinction between wildtype and transgenic L1 is not possible. However, deducing
from the previous conclusion, it is most likely to be transgenic L1 retained in part
intracellular. Already when expressed solely (in the KO background) some of transgenic L1
remains inside, while the pure WT genotype transports all of L1 to the cell surface. One cause
for L1 retention in the ER might be a strictly controlled transport maintaining the amount of
V DISCUSSION 74
L1 displayed on the cell surface at a definite saturation level. It has been shown that L1
underlies clathrin mediated endocytosis in growth cones (Kamiguchi et al., 1998a)
corroborating the proposed mechanism. In addition, the machinery of the cell might not be
able to process the flood of L1 (in the KO_T and WT_T genotypes) leading to excess L1 in
the cell soma. Intracellular accumulation of the transgenic protein expressed under the control
of the Thy-1.2 promoter has been observed frequently (Götz et al., 2001). Retention in the ER
due to misfolding of the protein often observed, also for mutated forms including L1 (Rünker
et al., 2003), was excluded since the original cDNA was retrieved from mouse.
Immunostaining of brain sections against L1 revealed that transgenic L1 expression is
confined to neurons, but in the WT_T and KO_T genotype some cells are heavily loaded with
L1 in their cell soma (excluding the nucleus), while others are comparable to the WT
genotype. For example, the deep cerebellar nuclei arre stained intensely, which has also been
reported in another study (Wisden et al., 2002). Possible explanations have already been
discussed for the results of the endoglycosidase H digestion. Production of transgenic L1 may
be so high that the machinery of the cell trafficking L1 to the cell surface is challenged or a
control mechanism may suppress further transport. It cannot be proven that only transgenic
L1 is intracellular in the WT_T genotype. However, this can be assumed (similar to the
interpretation of the endoglycosidase H results) since only whenever transgenic L1 is present,
intracellular L1 is observed. Why the distribution of transgenic L1 among cells or rather the
production rate of transgenic L1 varies to such extend among cells remains unclear. This
effect was also observed when the promoter was used for the expression of other transgenes
(Wisden et al., 2002; Götz et al., 2001). All the same, transgenic L1 does reach the cell
surface undoubtedly.
4 Amount of cell surface transgenic L1 comparable to wildtype level
Since it is crucial that the amount of L1 on the cell surface is sufficient to expect
functional effects, quantitative studies have been performed on hippocampal primary neuron
cultures. This method to identify the localisation of proteins is well established (Sytnyk et al.,
2002; Sampo et al., 2003). Periods in culture were chosen by orientation on the start of the
activity of the Thy-1.2 promoter: after 3 days in culture (corresponding to P3 in vivo) and 13
days in culture (P13) the situation before and after start of strong activity of the promoter was
visualised. The results concerning level of activity at the two time points reflect the in vivo
situation shown by western blot and published in the literature (Lüthi et al., 1997). Expression
of transgenic L1 is generally low at the early stage, while it is high later on. The endogenous
V DISCUSSION 75
L1 promoter is already active before the Thy-1.2 promoter starts activity, so wildtype L1 is
well detectable at P3, while transgenic L1 is not. The large quantities of L1 in the cell soma in
the KO_T and WT_T genotypes confirm the observation in the L1 immunostaining of brain
sections and suggest ER or Golgi localisation, typical structures where proteins are found
when processed for targeting to the cell surface, concluded from the dotted pattern of staining.
This complements the results of the endoglycosidase H digestion. Quantification shows that
wildtype level is reached in the KO_T genotype regarding cell surface L1 by P13. Data for the
WT_T genotype suggest the same. This supports the above proposed mechanism of
saturation. It is important for the interpretation of the following studies that results can be
compared between WT and KO_T genotypes without effects being based on different
amounts of L1 present on the cell surface.
5 Functionality of transgenic L1
Rescue of the KO phenotype in vitro
There is a rescue of the KO phenotype regarding neurite outgrowth capability of
cerebellar neurons in the KO_T genotype. It is known that cell adhesion molecules including
L1 are involved in neurite outgrowth (Walsh et al., 1997b). In vitro studies have shown that
the neurite outgrowth promoting effect of L1 as a substrate given to neurons deficient for L1
in culture is abolished due to the loss of homophilic binding (Lemmon et al., 1989; Dahme et
al., 1997) and is even enhanced when ectopically expressed on astrocytes (Mohajeri et al.,
1996). This demonstrates the high potency of L1 in this important process. Data of KO_T
neurons compared with those of WT and KO genotypes reveal that transgenic L1
compensates for wildtype L1 and enhances neurite outgrowth to the full degree of WT
neurons. This finding is a key result for proof of the functionality of transgenic L1. Not
enough data have been obtained to interpret the WT_T genotype. It will be interesting to see
whether these neurons show even an increase in neurite outgrowth in comparison with the
WT genotype since they are equipped with wildtype L1 next to transgenic L1. But prediction
may be that the effect is not strong if any at all, since the crucial point is most probably the
amount of L1 on the cell surface, and quantification has shown that there is no increase in
WT_T mice.
V DISCUSSION 76
No rescue of the KO phenotype in the general appearance / morphology of mice
The KO mouse displays several characteristic features due to the deficiency of L1.
And a lot of distinct marks for the KO phenotype are found in the KO_T genotype despite the
rescue observed in vitro. Male KO mice are mostly infertile, less viable and smaller from birth
than their WT littermates (Dahme et al., 1997; Cohen et al., 1998). This is also the case for the
male mice with transgenic L1 in the KO background. Additionally, KO and KO_T mice
suffer from sunken, lacrimating eyes, never observed in WT or WT_T mice (Dahme et al.,
1997; Fransen et al., 1998a). When bred in the C57BL/6J background, KO mice develop a
severe hydrocephalus (Dahme et al., 1997) appearing also in KO_T mice. The corticospinal
tract of KO mice is reduced (Dahme et al., 1997; Cohen et al., 1998), also observed in KO_T
mice.
All these examples of deficits typical of KO mice found in KO_T mice are probably
caused by the lack of L1 in early development. It is known for example, that the principle
formation of the corticospinal tract is established by P3 (Martin, 2005). At this time, wildtype
L1 is being highly expressed to assist in the guidance of the axons across the midline. It has
been shown that the Thy-1.2 promoter only barely starts faint activity at this time point and
therefore L1 necessary for the process is not provided.
Another reason for malfunctions in KO_T mice resembling those of KO mice might
also be not time related, but dependent on the cell type. Cells expressing transgenic L1 are
neurons, but not all neuron types express the same amount of transgenic L1. Either there
might be a lack of L1 on neuron subtypes relevant for the process, or the L1 in spite of cell
surface localisation on the correct cell type is not functional despite the in vitro results. Of
course, the combination of both causes (time of expression and cell type) might contribute to
the phenotype of KO_T mice. Disturbance by intracellular L1 deposits is excluded as a
reason, since the KO_T phenotype is so close to the KO phenotype and WT_T mice resemble
WT mice.
Immunostaining against functional markers (tyrosinehydroxylase, calbindin,
synaptophysin, parvalbumin etc.) do not reveal any differences among the genotypes. A
publication on another L1 deficient mouse has also reported no differences using the same
markers (Fransen et. al., 1998a). But it has been proven that dopaminergic neurons display
abnormalities in placement and morphology in L1 deficient mice (Demyanenko et al., 2001).
Very thorough and detailed analyses would be necessary to find these differences.
The fact that KO_T neurons display full neurite outgrowth in contrast to KO neurons
provokes the question why so many features of the KO phenotype appear in KO_T mice. The
V DISCUSSION 77
decisive difference between the two situations is the context under which the effects are
observed. While the deficits are retrieved from the in vivo situation, the neurite outgrowth
effect is produced in an in vitro assay. So, although transgenic L1 has been proven to be
functional in itself, the circumstances might be aversive to carry out its positive effect
embedded in the natural environment. Deficits already displayed before the expression start of
transgenic L1 might be too strong to be overcome by transgenic L1. Alternatively, necessary
developmental stages gone wrong due to the lack of L1 might inhibit transgenic L1 function.
The most prominent example is the blocking of regeneration in the central nervous system,
and already in the development of the nervous system inhibitory mechanisms counterplay
outgrowth promoting systems (Schachner, 1994; Skaper et al., 2001). Another possibility
could be that the cell and environment are wrong, because not all cells expressing naturally
L1 are the identical ones expressing transgenic L1 so that maybe downstream signalling
pathways are not available and cannot be triggered.
6 Behavioural analysis of KO mice
To test possible rescue effects of transgenic L1 expression on the behaviour of KO
mice, the phenotype of KO mice had to be determined, since only little data was available on
the behaviour of this mutant. This study produced novel findings for KO mice revealing a
distinct phenotype especially regarding motor impairment and altered anxiety status. The tests
were restricted to the male offspring not only due to the limited breeding options mentioned
above. Behaviour is subject to the influence of a vast number of factors, in females the
hormone cycle is an additional factor. By concentrating on male mice maintained under equal
conditions variability caused by the hormonal cycle in females is avoided (Lathe, 2004).
No alteration in the spontaneous circadian activity
The genotype of the mice does not have any influence on their spontaneous circadian
activity. They had been kept under an inverted light dark cycle for several months by the time
their activity was monitored. The general low activity throughout is striking, but strains are
known to show a different baseline level of activity in both phases (Rodgers et al., 2002; Tang
and Sanford, 2005). In contrast to the unaltered circadian rhythm described here, hypoactivity
has been reported for KO mice (Fransen et al., 1998a). But in this publication the observation
was limited to two hours, while here the data were collected for more than ten days. As true
for all behavioural tests, results are strongly influenced by handling of mice which cannot be
completely identical in different laboratories. Perhaps handling shortly before measurement
V DISCUSSION 78
produced a different reaction in KO vs. WT mice, not evident anymore in the observation of
their undisturbed activity over days. In addition, the L1 deficient mouse line used in their
study was also generated differently and the genetic background was not identical (Cohen et
al., 1998).
Motor impairment
Motor deficits of KO mice are apparent only in the pole test. Since performance in the
wire hanging test and rotarod chiefly depends on the strength of the forepaws, the reported
weakness in the hind limbs (Dahme et al., 1997; Cohen et al., 1998) may have been masked.
In addition, the dragging of the hind limbs has been observed in aged mice, much older than
the mice used here. Failure of KO mice in the pole test could not be due to a deficit in using
the paws argued with the good performance in the wire hanging test. It is unlikely that the
motor impairment of KO mice is caused by higher stress response to the handling and
protocol (Metz et al., 2001), since the behaviour in tests measuring state anxiety revealed KO
mice as being less anxious (see below). Mice knocked out for other molecules have been
observed to improve their motor abilities with training (Freitag et al., 2003). The fact that
there is no improvement in KO mice demonstrates the high impact of the L1 deficiency on a
central mechanism for this motor skill. The tests measure different aspects of motor
coordination and the challenge to turn the whole body in a coordinated manner on a narrow
pole is more demanding than just maintaining the rhythm of a rotating rod or holding on to a
wire, explaining the impairment limited to the pole test.
In addition, various centres (i.e. corticospinal tract, cerebellum) are involved in the
motor function and so cells deficient for L1 might be involved in the functional system
applied in the pole test but not in the other tests. KO mice suffer from reduced corticospinal
tract with errors in the projection of neuronal axons (Dahme et al., 1997; Cohen et al., 1998).
Since this pathway is pivotal in motor function (Martin, 2005) it is likely that this
malformation is the cause of the impaired performance. Interestingly, also dopamine
transporter knock out mice fail in this paradigm (Fernagut et al., 2003). Since it is known that
the dopaminergic network is altered in L1 deficient mice (Demyanenko et al., 2001), this
could be a hint for another factor influencing motor function. However, other characteristics
of the phenotype are not congruent in the two types of knock out mice. Though KO mice have
a reduced vermis of the cerebellum (Fransen et al., 1998a), otherwise the cerebellum does not
seem to be affected, so this might explain that deficiency in L1 does not affect performance in
all tests. Interestingly, motor impairment was revealed in the rotarod test in mice deficient for
V DISCUSSION 79
the close homologue of L1 (CHL1) despite a cerebellum of normal morphological
organisation (Pratte et al., 2003). The two molecules display high similarity in their structure
but apparently their functional role is quite divergent in this respect.
The results for KO mice in the rotarod test are in slight contradiction to previously
published data (Fransen et al., 1998a). The authors describe KO mice as struggling to keep the
balance on the rotarod, though this did not lead to reduced latencies. This is not observed in
the present study. But it must be noted that experiments were performed on L1 deficient mice
generated by different approaches and also the genetic background of the strain was different.
As the hydrocephalus developing in the C57BL/6J background of KO mice, but at most
slightly enlarged ventricles in the 129Sv background, demonstrates, the strain can make
decisive contributions to the manifestation of effects (Dahme et al., 1997; Demyanenko et al.,
1999). In addition, different handling of mice influences performance of mice in all sorts of
paradigms, even those measuring locomotor ability (Patin et al., 2004). Anyway, the motor
impairment of KO mice that has been reported as a personal observation (Fransen et al.,
1998a), could be better determined and quantified in this study by using the pole test.
Decreased state, but increased trait anxiety
Several tests measuring anxiety in various different contexts have been analysed
investigating trait (intrinsic) and state (reaction to a stimulus) anxiety (Lister, 1990).
Exploratory behaviour and locomotor activity are influenced by anxiety, but also form a
separate category of behaviour by themselves analysed in the same paradigms. The overlap
renders the interpretation of behavioural parameters more difficult (Tang and Sanford, 2005).
The focus has been on paradigms chiefly evaluating state anxiety under different conditions in
terms of environmental novelty and anxiogenic stimuli (except for the free-choice open field
test) to obtain enough data for sound evaluation.
A standard paradigm is the open field where several parameters characterise
exploration and anxiety on one hand and locomotor activity (possibly modulated by the
influence of the stressful situation) on the other hand (Aburawi et al., 2003). The light/dark
and elevated-plus maze are commonly used to test anxiety in rodents. In the light/dark
paradigm, the mouse has the possibility to escape from the bright part of the arena into a dark
quadrant. A modification of the classical set up consisting in two boxes (Belzung et al., 1987;
Bourin and Hascoet, 2003) was used, so that conditions were similar to those of an open field.
The most widely used behavioural paradigm to characterise state anxiety is the elevated-plus
maze where the mouse is exposed to unfamiliar territory and can choose between supposedly
V DISCUSSION 80
safe (arms closed by walls) and dangerous (open arms) environment (Pellow et al., 1985;
Belzung 2001). Various parameters including traditional ones (e.g. time spent on the open
arms) and ethologically derived ones (e.g. several forms of risk assessment and exploration)
are taken into account contributing to a finely tuned description of the behavioural response of
an animal (Rodgers and Johnson, 1995). As in the open field, the origin (anxiety or
exploratory drive) of each single behavioural parameter cannot be attributed easily as it is
determined by a composition of factors (Weiss et al., 1998).
The behaviour of KO mice is marked by reduced state anxiety and increased
exploration in all tests. In the open field, the conclusion is based on the enhanced exploration
of the central area and reduced risk assessment shown by KO mice. In the elevated-plus maze,
KO mice explore the open arms to higher extend without risk assessment while WT mice
clearly prefer the sheltered arms and explore the open arms only after thorough risk
assessment. KO mice also explore more often the open arms by unprotected head dipping on
one hand and tend to do less self grooming as reaction to stress than their WT littermates also
rooting in their less anxious state (Kalueff and Tuohimaa, 2004).
It has been reported that lower anxiety in mice is accompanied by higher novelty-
seeking (Kazlauckas et al., 2005). Indeed, in the new object test and partially in the open field,
KO mice show increased rearing, a parameter that is considered as a typical indicator of
novelty-induced exploration (Crusio et al., 1989; Bardo et al., 1990). Less exploration by
rearing in KO mice in the elevated-plus maze is most likely a secondary effect due to the
shorter time they spend in the closed arms, the part of the maze where rearing is mainly done.
Indeed, in this test, KO mice show enhanced exploration of the open arms by head dipping,
thereby supporting higher novelty-induced exploration in these mice.
The reason for the higher locomotor activity of KO mice in the open field and
light/dark tests could also be interpreted as enhanced reactivity to novelty. An innate drive to
move more in general is excluded on the basis of the unaltered spontaneous circadian activity
in the home cage. It has been reported that less anxious mice display higher locomotion in the
open field, suggesting a correlation between the two behaviours (Kazlauckas et al., 2005). But
another study did not find any correlation between locomotion and anxiety in the hole board
test (Ohl et al., 2003). One possible explanation for the higher activity interprets locomotion
as search for escape (Easton et al., 2003). This reaction could be rooted in an unbiased altered
strategy or in panic like anxiety. The hypothesis could also explain the increased exploration
of the open arms in the elevated-plus maze by KO mice and the latter cause has indeed been
observed in a modified elevated-plus maze (Jones et al., 2002). This would also corroborate
V DISCUSSION 81
the interpretation of higher trait anxiety in the free-choice open field and new object tests. In
the elevated-plus maze, locomotion is unaltered in KO mice as indicated by total transitions.
General transitions in the elevated-plus maze serve as control, to verify that differences in
entries into the arms are not a consequence of higher activity but of the emotional state.
As indicator of the anxiety state of the mouse its defecation behaviour can be analysed
along with the other parameters (Kim et al., 2002). At first glance the data here are consistent
with the results of the other parameters, indicating lower state anxiety in KO mice. But when
taken into account that this result is reproduced in every single test despite divergences in
other parameters this interpretation seems frail. It is more likely that L1 has some
physiological influence provoking reduced defecation behaviour when lacking. This is
supported by the fact that expression of transgenic L1 is restricted to neurons, and on the
contrary, it is known that wildtype L1 is also found in other organs such as the intestine (Thor
et al., 1987) and in the kidneys where it causes severe morphological malformations in KO
mice (Debiec et al., 2002).
Neither housing conditions nor the experience of several behavioural tests affected the
behaviour in the second trial of the open field and reproduced the results of the first, although
it has been observed that mice react differently when encountering the open field a second
time (McIlwain et al., 2001). Since there was a time lag of several weeks between the trial
when grouped and the one when isolated, this could explain the recurrence of initial behaviour
of the mice when isolated. In contrast, in the second trial of the elevated-plus maze
significances were reduced or abolished because values converged. There was a decrease in
the exploration of the open arms in all genotypes. This effect at second exposure has been
reported before (Holmes et al., 2000). Especially KO mice obviously retracted from the open
arms back to the centre from where they increased their risk assessment as a sign of higher
alert. Still they were less anxious in comparison with WT mice apparent for example in the
higher frequency of protected head dipping. Increase in anxiety resulting from social isolation
has been reported for the elevated-plus maze (Weiss et al. 2004). Here housing did not have
an effect in the open field re-exposure when isolated and the same has been observed in the
cited study. Another factor could have been the older age (Bessa et al., 2005). But here the
age of the mice was not considerably older at re-exposure.
Contradictory to the result that KO mice spend more time in the central part of the
open field as compared to WT littermates, a study describes extremely high thigmotaxis in
KO mice tested in the open field (Fransen et al., 1998a). It is possible that the opposite results
of this study and that of Fransen et al. (1998a) are due to different protocols and
V DISCUSSION 82
environmental conditions known to affect the behaviour of mice (Calamandrei, 2004;
Wahlsten et al., 2003). But we tend to exclude this hypothesis since the behavioural
phenotype of KO mice was, in our case, confirmed in different behavioural paradigms under
different experimental and housing conditions in which we never observed the abnormalities
described by Fransen et al. (1998a). It is therefore most likely that divergences between the
two studies are caused by differences in the genetic background between the two independent
mutants.
In contrast to the open field, the light/dark test and the elevated-plus maze, where KO
mice display low state anxiety and an enhanced novelty-induced exploration, their behaviour
in other tests for anxiety is determined by higher trait anxiety. One paradigm focusing on trait
anxiety or state anxiety under low anxiogenic conditions is the new cage/new object test
(Brandewiede et al., 2005). Arousal, probably related to state anxiety, is elicited to lower
degree in KO mice deduced from less climbing and digging (Deacon and Rawlins, 2005).
Parameters characterising the reaction directed towards the new object reveal avoidance by
KO mice although their general exploratory behaviour is elevated as in the other tests above
suggesting an increase in trait anxiety. A test to study even more specifically trait anxiety is
the free-choice open field (Griebel et al., 1993). Here, exploration of the new territory
depends solely on the innate drive of the mouse. The factor stress, still mildly present in the
new cage/new object test is removed completely. Exploration of the arena was very low for
all genotypes, not only in number, but the mice that did go out hardly covered the arena but
just shortly and barely stepped outside. It is known that there are differences among mouse
strains in a lot of behavioural parameters, including anxiety related ones and explorative
character (Fernandes et al., 2004). So perhaps the strain used here is not optimal for testing in
the free-choice open field and explains that only a tendency in difference becomes apparent.
Nevertheless, the tendency demonstrates higher trait anxiety in KO mice, corroborating the
interpretation of the new object test.
The combination of the results (reduced state anxiety, raised trait anxiety) has also
been observed for other mutant mice (Brandewiede et al., 2005) and proves the possibility of
inversion of the two types of anxiety in one animal. Additionally, pharmacological studies
verified trait and state anxiety as distinct (Belzung et al., 1994; Griebel et al., 1996).
Interestingly, the substances identifying the anxiety types, target GABA receptors which play
a role in the network of inhibitory neurons that has been proven to display abnormalities in
electrophysiological studies in L1 deficient mice (Saghatelyan et al., 2004).
V DISCUSSION 83
Reduced response in 8-OH-DPAT-induced hypothermia
An approach to elucidate possible disturbances in the serotonergic system involves the
injection of 8-OH-DPAT, an agonist of the 5-HT1A receptor (Meller et al., 1992). The
receptor is involved in the regulation of the body temperature such that the drug induces a
decrease of the body temperature (Millan et al. 1993; Hedlund et al., 2004). The dose
response curve confirms this for WT mice and shows a dose dependency verifying the
specificity of the effect. The data obtained for KO mice clearly suggests lower affinity and/or
lower number of available receptors targeted by the drug in KO mice compared to WT mice.
Interestingly, a reduced 8-OH-DPAT-induced hypothermia has also been observed for the
conditional L1 deficient mouse (Zenthöfer et al., personal communication), suggesting that
the alteration is due to L1 functions in the adult brain rather than to developmental
abnormalities. The serotonergic system is known to be involved in anxiety related states.
Similarly to L1 deficient mice, mice knocked out for the 5-HT1A receptor display resistance to
8-OH-DPAT-induced hypothermia as well as reduced anxiety (Heisler et al., 1998). Another
mutant knocked out for the serotonin transporter also displays reduced response to the drug,
although in that case mice show increased anxiety (Holmes et al., 2003). Since the brain is a
complex environment with systems underlying modulatory influences (negative feed back,
compensating mechanisms, and alternative pathways, different environment leading to
different computation of signals) the contrasting results regarding anxiety next to the identical
insensitivity to 8-OH-DPAT is conceivable. A link between L1 – serotonergic system –
anxiety is suggested deduced from the results testing anxiety and 8-OH-DPAT responsiveness
in L1 deficient mice. Interestingly, corticosterone is said to be involved in the system affected
by 8-OH-DPAT as well (McAllister-Williams et al., 2001; Man et al., 2002). Integration of a
communication between corticosterone and L1 within the proposed path is reasonable. Stress
studies show a correlation between L1 and corticosterone and it has been suggested that L1
might mediate stress-induced anxiety and cognitive impairments (Sandi et al., 2005).
No impairment in long-term memory
One possible paradigm evaluating hippocampus-dependent learning ability and
memory of mice is the step-through passive avoidance test (Izquierdo and Medina, 1997).
Mice prefer dark to bright environment but when this darkness is linked with a negative
stimulus they will avoid it at re-exposure if the experience is remembered. This is exactly the
reaction the mice of all genotypes show here. Deficiency for L1 did not interfere with the
learning effect seen in WT mice indicating intact long-term memory. The identical result has
V DISCUSSION 84
been published for another L1 deficient mouse (Fransen et al., 1998a). Still, this is quite
interesting because numerous experiments have shown involvement of L1 in the learning
process. Injection of L1 antibodies in chicken and L1.1 antibodies in zebrafish cause amnesia
in avoidance conditioning paradigms (Scholey et al., 1995; Pradel et al., 2000). The
antibodies are thought to simulate the L1 deficient status which in turn blocks learning.
Apparently the mechanism is more complex since KO mice with constant L1 deficiency are
not impaired in the passive avoidance task as would have been predicted from the previous
studies. Stress is recognised as a component modulating the cognitive system via influence of
corticoids and cell adhesion molecules, including L1. Increase in L1 expression has been
observed after training in a contextual fear conditioning paradigm delivering another hint for a
functional role of L1 in learning (Merino et al., 2000; Sandi et al., 2001). Several studies have
based their conclusions on the Morris Water Maze, retrieving information on the mechanism
for spatial learning. For example, there is a correlation between mRNA level and latency in
finding the platform (Venero et al., 2004) and mice expressing ectopically L1 learn better
(Wolfer et al., 1998). Furthermore, conditional L1-KO and CHL1-KO (molecule highly
similar in structure to L1) mice display altered learning (Montag-Sallaz et al., 2002; Law et
al., 2003). Unfortunately KO mice display sunken eyes so that a Morris Water Maze working
with visual cues would probably not deliver an answer for the capability of KO mice
concerning spatial learning. The same KO mouse for which the passive avoidance results
have been published has been tested in the Morris Water Maze and spatial learning defects
have been observed though the authors themselves offer also another interpretation of the
results not due to memory dysfunction but to motor abnormality preventing proper swimming
performance (Fransen et al., 1998a).
7 Partial rescue of the behavioural KO phenotype in KO_T mice
Expression of transgenic L1 in the KO background leads to a partial recovery of the
KO phenotype in some behavioural parameters proving the deficits to be specific for L1.
Motor deficits of KO mice in the pole test are partially rescued despite the fact that
KO_T mice display hypoplasia of the corticospinal tract as KO mice. Either transgenic L1
functions within the remaining corticospinal tract, or another area expressing transgenic L1
compensates, for example it is expressed in the motor neurons of the spinal cord. In contrast,
transgenic L1 leads to impairment in the rotarod not observed for the KO genotype.
Responsible for coordinated movement are the deep cerebellar nuclei (Grusser-Cornehls and
Baurle, 2001). Especially in these cells large deposits of intracellular L1 in the KO_T
V DISCUSSION 85
genotype are detected that might disturb the signalling pathway. This would also explain the
difficulties of WT_T mice in this task, charged with intracellular L1 as well. The importance
of the cerebellum for the movement required in the rotarod is evident in the reduced
performance of other transgenic mice with severely affected cerebellum, i.e. overexpression
of Purkinje cells (signalling to the deep cerebellar nuclei; Goswami et al., 2005) and a mouse
model for the Down syndrome (Costa et al., 1999). This corroborates the suggestion that
intracellular L1 in cells of the cerebellum interfere with function necessary in the rotarod test.
In the tests measuring state anxiety (open field, light/dark , and elevated-plus maze
tests) KO_T mice display most of the behavioural alterations shown by KO mice.
Nevertheless, several parameters that differ between KO and WT mice are unaltered in KO_T
mice, such as latencies to enter onto the open arms of the elevated-plus maze, mean velocity
in the open field, and risk assessment and rearing as measured in all tests, suggesting that
transgenic L1 expression partially recovers alterations of KO mice. Also in the new cage/new
object tests, avoidance of the new object shown by KO mice is rescued in KO_T mice. It is
therefore possible that the partial effects of transgenic L1 on state anxiety levels of the mice
become apparent only under relatively low anxiogenic and novel stimuli, whereas transgenic
L1 is not enough to compensate constitutive L1 ablation when environmental stimuli have
strong valence (such as in the open field and elevated-plus maze). The partial rescue of the
state anxiety is confirmed by the partial rescue in 8-OH-DPAT-induced hypothermia,
indicative of functioning of the serotonergic system which is involved in anxiety.
Since transgenic L1 is on the cell surface of neurons and has been shown to function in
vitro, it certainly has the potency to modulate behaviour. But the complex environment of the
brain may block L1 mediating complete re-establishment in all behavioural parameters. The
cause for the observed only partial rescue could be explained with the same argument as
already described for the morphological malformations. The promoter driving transgene
expression is active in different cell subtypes (and starts activity later) perhaps not involved in
or not equipped with the required machinery for natural L1 function. Morphological
malformations develop already early before expression of transgenic L1 starts. These
malformations in turn could be the reason why effects in motor ability mediated by transgenic
L1 are only faintly detectable. The recovery in anxiety related behaviour, although only
partial, agrees well with the results for the conditional L1 deficient mouse (Law et al., 2003).
The behaviour of this mouse must have been shaped by lack of L1 in the mature nervous
system, verified as specific for L1 by the constitutive KO mouse in this study. Both
conclusions (specificity for L1 and determination in the mature nervous system) are
V DISCUSSION 86
confirmed with KO_T mice, where L1 expression has late onset. In addition, it is published
that mouse strains of different genetic background show a different strength in response to
behavioural tests (Tang et al., 2005). Maybe responses are so low that possible differences
between KO and KO_T mice due to recovery do not come to light or only incompletely.
With the exception of the motor impairment in the rotarod discussed above, in most
cases, WT_T mice show the same behaviour as that of WT mice. The data on the amount of
cell surface L1 in this genotype indicates no difference to the WT genotype. This could
explain the similarity in the behavioural testing (and in the other analyses) with WT mice.
Although WT_T mice carry a lot of intracellular L1 their data allow the assumption that this
does not interfere with the cells’ function (with the exception of the rotarod, see above) and
serves as control for KO_T mice. So the faint rescue seen in the KO_T genotype which also
display substantial amount of intracellular L1 can be attributed to specific effects of cell
surface transgenic L1. Decreased exploration by head dipping in the elevated-plus maze and
increased caution towards the new object in the new object test suggest influence of
transgenic L1 in the WT background on anxiety but could not be further specified. Apparently
circuits were involved where L1 overexpression has an enhancing effect on anxiety. This
contradiction to the partial rescue effect of KO_T mice towards WT level in anxiety might be
explained by the difference in their wildtype L1 status. Although both genotypes express
transgenic L1, it is likely that the presence or absence of wildtype L1 may have led to the
inverted effect.
8 Concluding remarks
The study has newly shown that the L1 deficient mouse displays a characteristic
phenotype with deficits in motor function and altered anxiety status. The in vitro neurite
outgrowth assay of cerebellar neurons produces full recovery of the KO phenotype by
expression of transgenic L1 on neurons, while behavioural analyses shows a faint partial
rescue effect. Apparently the brain tissue environment or development of the environment in
the absence of L1 before expression of transgenic L1 starts, does not give way for functional
effects. In addition, the difference between wildtype L1 and transgenic L1 regarding subtypes
of neurons expressing the protein might be the cause for reduced effects of the transgenic L1.
Nevertheless, the combined analysis of the KO and KO_T genotype led to the discovery of
specific L1 function in behaviour.
VI REFERENCES 87
VI REFERENCES
Aburawi SM, Elhwuegi AS, Ahmed SS, Saad SF, Attia AS (2003) Behavioral effects of acute and chronic
triazolam treatments in albino rats. Life Sci 73: 3095-3107.
Albelda SM, Buck CA (1990) Integrins and other cell adhesion molecules. FASEB J 4: 2868-2880.
Appel F, Holm J, Conscience JF, Bohlen und HF, Faissner A, James P, Schachner M (1995) Identification of the
border between fibronectin type III homologous repeats 2 and 3 of the neural cell adhesion molecule L1 as a
neurite outgrowth promoting and signal transducing domain. J Neurobiol 28: 297-312.
Arami S, Jucker M, Schachner M, Welzl H (1996) The effect of continuous intraventricular infusion of L1 and
NCAM antibodies on spatial learning in rats. Behav Brain Res 81: 81-87.
Asou H, Miura M, Kobayashi M, Uyemura K, Itoh K (1992) Cell adhesion molecule L1 guides cell migration in
primary reaggregation cultures of mouse cerebellar cells. Neurosci Lett 144: 221-224.
Ausubel FM (1996) Current Protocols in Molecular Biology. Brooklyn, New York: Greene Publishing
Associates, Inc.
Bardo MT, Bowling SL, Pierce RC (1990) Changes in locomotion and dopamine neurotransmission following
amphetamine, haloperidol, and exposure to novel environmental stimuli. Psychopharmacology (Berl) 101:
338-343.
Bartsch U, Kirchhoff F, Schachner M (1989) Immunohistological localization of the adhesion molecules L1, N-
CAM, and MAG in the developing and adult optic nerve of mice. J Comp Neurol 284: 451-462.
Bateman A, Jouet M, MacFarlane J, Du JS, Kenwrick S, Chothia C (1996) Outline structure of the human L1
cell adhesion molecule and the sites where mutations cause neurological disorders. EMBO J 15: 6050-6059.
Belzung C, Misslin R, Vogel E, Dodd RH, Chapouthier G (1987) Anxiogenic effects of methyl-beta-carboline-3-
carboxylate in a light/dark choice situation. Pharmacol Biochem Behav 28: 29-33.
Belzung C, Pineau N, Beuzen A, Misslin R (1994) PD135158, a CCK-B antagonist, reduces "state," but not
"trait" anxiety in mice. Pharmacol Biochem Behav 49: 433-436.
Belzung C, Griebel G (2001) Measuring normal and pathological anxiety-like behaviour in mice: a review.
Behav Brain Res 125: 141-149.
Bennett V, Chen L (2001) Ankyrins and cellular targeting of diverse membrane proteins to physiological sites.
Curr Opin Cell Biol 13: 61-67.
Bessa JM, Oliveira M, Cerqueira JJ, Almeida OF, Sousa N (2005) Age-related qualitative shift in emotional
behaviour: Paradoxical findings after re-exposure of rats in the elevated-plus maze. Behav Brain Res 162: 135-
142.
Bianchine JW, Lewis RC, Jr. (1974) The MASA syndrome: a new heritable mental retardation syndrome. Clin
Genet 5: 298-306.
Bickers D, Adams R (1949) Hereditary stenosis of the aqueduct of Sylvius as a cause of congenital
hydrocephalus. Brain 72: 246-262.
VI REFERENCES 88
Bieber AJ, Snow PM, Hortsch M, Patel NH, Jacobs JR, Traquina ZR, Schilling J, Goodman CS (1989)
Drosophila neuroglian: a member of the immunoglobulin superfamily with extensive homology to the
vertebrate neural adhesion molecule L1. Cell 59: 447-460.
Bishop JO (1996) Chromosomal insertion of foreign DNA. Reprod Nutr Dev 36: 607-618.
Bliss T, Errington M, Fransen E, Godfraind JM, Kauer JA, Kooy RF, Maness PF, Furley AJ (2000) Long-term
potentiation in mice lacking the neural cell adhesion molecule L1. Curr Biol 10: 1607-1610.
Bourin M, Hascoet M (2003) The mouse light/dark box test. Eur J Pharmacol 463: 55-65.
Brandewiede J, Schachner M, Morellini F (2005) Ethological analysis of the senescence-accelerated P/8 mouse.
Behav Brain Res 158: 109-121.
Brinster RL, Allen JM, Behringer RR, Gelinas RE, Palmiter RD (1988) Introns increase transcriptional
efficiency in transgenic mice. Proc Natl Acad Sci U S A 85: 836-840.
Brummendorf T, Rathjen FG (1996) Structure/function relationships of axon-associated adhesion receptors of
the immunoglobulin superfamily. Curr Opin Neurobiol 6: 584-593.
Brummendorf T, Kenwrick S, Rathjen FG (1998) Neural cell recognition molecule L1: from cell biology to
human hereditary brain malformations. Curr Opin Neurobiol 8: 87-97.
Burden-Gulley SM, Payne HR, Lemmon V (1995) Growth cones are actively influenced by substrate-bound
adhesion molecules. J Neurosci 15: 4370-4381.
Calamandrei G (2004) Ethological and methodological considerations in the use of newborn rodents in
biomedical research. Ann Ist Super Sanita 40: 195-200.
Caroni P (1997) Overexpression of growth-associated proteins in the neurons of adult transgenic mice. J
Neurosci Methods 71: 3-9.
Castellani V, Chedotal A, Schachner M, Faivre-Sarrailh C, Rougon G (2000) Analysis of the L1-deficient mouse
phenotype reveals cross-talk between Sema3A and L1 signaling pathways in axonal guidance. Neuron 27:
237-249.
Castellani V, De Angelis E, Kenwrick S, Rougon G (2002) Cis and trans interactions of L1 with neuropilin-1
control axonal responses to semaphorin 3A. EMBO J 21: 6348-6357.
Castellani V, Falk J, Rougon G (2004) Semaphorin3A-induced receptor endocytosis during axon guidance
responses is mediated by L1 CAM. Mol Cell Neurosci 26: 89-100.
Chang S, Rathjen FG, Raper JA (1987) Extension of neurites on axons is impaired by antibodies against specific
neural cell surface glycoproteins. J Cell Biol 104: 355-362.
Chapman VM, Keitz BT, Stephenson DA, Mullins LJ, Moos M, Schachner M (1990) Linkage of a gene for
neural cell adhesion molecule, L1 (CamL1) to the Rsvp region of the mouse X chromosome. Genomics 8:
113-118.
Chen L, Ong B, Bennett V (2001) LAD-1, the Caenorhabditis elegans L1CAM homologue, participates in
embryonic and gonadal morphogenesis and is a substrate for fibroblast growth factor receptor pathway-
dependent phosphotyrosine-based signaling. J Cell Biol 154: 841-855.
VI REFERENCES 89
Chen S, Mantei N, Dong L, Schachner M (1999) Prevention of neuronal cell death by neural adhesion molecules
L1 and CHL1. J Neurobiol 38: 428-439.
Cheng L, Itoh K, Lemmon V (2005) L1-mediated branching is regulated by two ezrin-radixin-moesin (ERM)-
binding sites, the RSLE region and a novel juxtamembrane ERM-binding region. J Neurosci 25: 395-403.
Cohen NR, Taylor JS, Scott LB, Guillery RW, Soriano P, Furley AJ (1998) Errors in corticospinal axon
guidance in mice lacking the neural cell adhesion molecule L1. Curr Biol 8: 26-33.
Costa AC, Walsh K, Davisson MT (1999) Motor dysfunction in a mouse model for Down syndrome. Physiol
Behav 68: 211-220.
Crusio WE, Schwegler H, Brust I, Van Abeelen JH (1989) Genetic selection for novelty-induced rearing
behavior in mice produces changes in hippocampal mossy fiber distributions. J Neurogenet 5: 87-93.
Dahme M, Bartsch U, Martini R, Anliker B, Schachner M, Mantei N (1997) Disruption of the mouse L1 gene
leads to malformations of the nervous system. Nat Genet 17: 346-349.
Davis JQ, Bennett V (1994) Ankyrin binding activity shared by the neurofascin/L1/NrCAM family of nervous
system cell adhesion molecules. J Biol Chem 269: 27163-27166.
De Angelis E, MacFarlane J, Du JS, Yeo G, Hicks R, Rathjen FG, Kenwrick S, Brummendorf T (1999)
Pathological missense mutations of neural cell adhesion molecule L1 affect homophilic and heterophilic
binding activities. EMBO J 18: 4744-4753.
De Angelis E, Brummendorf T, Cheng L, Lemmon V, Kenwrick S (2001) Alternative use of a mini exon of the
L1 gene affects L1 binding to neural ligands. J Biol Chem 276: 32738-32742.
De Angelis E, Watkins A, Schafer M, Brummendorf T, Kenwrick S (2002) Disease-associated mutations in L1
CAM interfere with ligand interactions and cell-surface expression. Hum Mol Genet 11: 1-12.
Deacon RM, Rawlins JN (2005) Hippocampal lesions, species-typical behaviours and anxiety in mice. Behav
Brain Res 156: 241-249.
Debiec H, Kutsche M, Schachner M, Ronco P (2002) Abnormal renal phenotype in L1 knockout mice: a novel
cause of CAKUT. Nephrol Dial Transplant 17 Suppl 9: 42-44.
Demyanenko GP, Tsai AY, Maness PF (1999) Abnormalities in neuronal process extension, hippocampal
development, and the ventricular system of L1 knockout mice. J Neurosci 19: 4907-4920.
Demyanenko GP, Shibata Y, Maness PF (2001) Altered distribution of dopaminergic neurons in the brain of L1
null mice. Brain Res Dev Brain Res 126: 21-30.
Demyanenko GP, Maness PF (2003) The L1 cell adhesion molecule is essential for topographic mapping of
retinal axons. J Neurosci 23: 530-538.
Dickson TC, Mintz CD, Benson DL, Salton SR (2002) Functional binding interaction identified between the
axonal CAM L1 and members of the ERM family. J Cell Biol 157: 1105-1112.
Dihne M, Bernreuther C, Sibbe M, Paulus W, Schachner M (2003) A new role for the cell adhesion molecule L1
in neural precursor cell proliferation, differentiation, and transmitter-specific subtype generation. J Neurosci
23: 6638-6650.
VI REFERENCES 90
Djabali M, Mattei MG, Nguyen C, Roux D, Demengeot J, Denizot F, Moos M, Schachner M, Goridis C, Jordan
BR (1990) The gene encoding L1, a neural adhesion molecule of the immunoglobulin family, is located on the
X chromosome in mouse and man. Genomics 7: 587-593.
Doherty P, Walsh FS (1996) CAM-FGF Receptor Interactions: A Model for Axonal Growth. Mol Cell Neurosci
8: 99-111.
Easton A, Arbuzova J, Turek FW (2003) The circadian Clock mutation increases exploratory activity and
escape-seeking behavior. Genes Brain Behav 2: 11-19.
Ebeling O, Duczmal A, Aigner S, Geiger C, Schollhammer S, Kemshead JT, Moller P, Schwartz-Albiez R,
Altevogt P (1996) L1 adhesion molecule on human lymphocytes and monocytes: expression and involvement
in binding to alpha v beta 3 integrin. Eur J Immunol 26: 2508-2516.
Edelman GM, Gall WE (1969) The antibody problem. Annu Rev Biochem 38: 415-466.
Evans GA, Ingraham HA, Lewis K, Cunningham K, Seki T, Moriuchi T, Chang HC, Silver J, Hyman R (1984)
Expression of the Thy-1 glycoprotein gene by DNA-mediated gene transfer. Proc Natl Acad Sci U S A 81:
5532-5536.
Faissner A, Kruse J, Nieke J, Schachner M (1984) Expression of neural cell adhesion molecule L1 during
development, in neurological mutants and in the peripheral nervous system. Brain Res 317: 69-82.
Faissner A, Teplow DB, Kubler D, Keilhauer G, Kinzel V, Schachner M (1985) Biosynthesis and membrane
topography of the neural cell adhesion molecule L1. EMBO J 4: 3105-3113.
Feng G, Mellor RH, Bernstein M, Keller-Peck C, Nguyen QT, Wallace M, Nerbonne JM, Lichtman JW, Sanes
JR (2000) Imaging neuronal subsets in transgenic mice expressing multiple spectral variants of GFP. Neuron
28: 41-51.
Fernagut PO, Chalon S, Diguet E, Guilloteau D, Tison F, Jaber M (2003) Motor behaviour deficits and their
histopathological and functional correlates in the nigrostriatal system of dopamine transporter knockout mice.
Neuroscience 116: 1123-1130.
Fernandes C, Liu L, Paya-Cano JL, Gregorova S, Forejt J, Schalkwyk LC (2004) Behavioral characterization of
wild derived male mice (Mus musculus musculus) of the PWD/Ph inbred strain: high exploration compared to
C57BL/6J. Behav Genet 34: 621-630.
Fischer G, Kunemund V, Schachner M (1986) Neurite outgrowth patterns in cerebellar microexplant cultures are
affected by antibodies to the cell surface glycoprotein L1. J Neurosci 6: 605-612.
Fransen E, Lemmon V, Van Camp G, Vits L, Coucke P, Willems PJ (1995) CRASH syndrome: clinical
spectrum of corpus callosum hypoplasia, retardation, adducted thumbs, spastic paraparesis and hydrocephalus
due to mutations in one single gene, L1. Eur J Hum Genet 3: 273-284.
Fransen E, Vits L, Van Camp G, Willems PJ (1996) The clinical spectrum of mutations in L1, a neuronal cell
adhesion molecule. Am J Med Genet 64: 73-77.
Fransen E, D'Hooge R, Van Camp G, Verhoye M, Sijbers J, Reyniers E, Soriano P, Kamiguchi H, Willemsen R,
Koekkoek SK, De Zeeuw CI, De Deyn PP, Van der LA, Lemmon V, Kooy RF, Willems PJ (1998a) L1
VI REFERENCES 91
knockout mice show dilated ventricles, vermis hypoplasia and impaired exploration patterns. Hum Mol Genet
7: 999-1009.
Fransen E, Van Camp G, D'Hooge R, Vits L, Willems PJ (1998b) Genotype-phenotype correlation in L1
associated diseases. J Med Genet 35: 399-404.
Freitag S, Schachner M, Morellini F (2003) Behavioral alterations in mice deficient for the extracellular matrix
glycoprotein tenascin-R. Behav Brain Res 145: 189-207.
Friedlander DR, Milev P, Karthikeyan L, Margolis RK, Margolis RU, Grumet M (1994) The neuronal
chondroitin sulfate proteoglycan neurocan binds to the neural cell adhesion molecules Ng-CAM/L1/NILE and
N-CAM, and inhibits neuronal adhesion and neurite outgrowth. J Cell Biol 125: 669-680.
Fushiki S, Schachner M (1986) Immunocytological localization of cell adhesion molecules L1 and N-CAM and
the shared carbohydrate epitope L2 during development of the mouse neocortex. Brain Res 389: 153-167.
Garver TD, Ren Q, Tuvia S, Bennett V (1997) Tyrosine phosphorylation at a site highly conserved in the L1
family of cell adhesion molecules abolishes ankyrin binding and increases lateral mobility of neurofascin. J
Cell Biol 137: 703-714.
Gordon JW, Chesa PG, Nishimura H, Rettig WJ, Maccari JE, Endo T, Seravalli E, Seki T, Silver J (1987)
Regulation of Thy-1 gene expression in transgenic mice. Cell 50: 445-452.
Goswami J, Martin LA, Goldowitz D, Beitz AJ, Feddersen RM (2005) Enhanced Purkinje cell survival but
compromised cerebellar function in targeted anti-apoptotic protein transgenic mice. Mol Cell Neurosci 29:
202-221.
Gotz J, Chen F, Barmettler R, Nitsch RM (2001) Tau filament formation in transgenic mice expressing P301L
tau. J Biol Chem 276: 529-534.
Griebel G, Belzung C, Misslin R, Vogel E (1993) The free-exploratory paradigm: an effective method for
measuring neophobic behaviour in mice and testing potential neophobia-reducing drugs. Behav Pharmacol 4:
637-644.
Griebel G, Sanger DJ, Perrault G (1996) Further evidence for differences between non-selective and BZ-1
(omega 1) selective, benzodiazepine receptor ligands in murine models of "state" and "trait" anxiety.
Neuropharmacology 35: 1081-1091.
Grumet M, Edelman GM (1984) Heterotypic binding between neuronal membrane vesicles and glial cells is
mediated by a specific cell adhesion molecule. J Cell Biol 98: 1746-1756.
Grumet M, Mauro V, Burgoon MP, Edelman GM, Cunningham BA (1991) Structure of a new nervous system
glycoprotein, Nr-CAM, and its relationship to subgroups of neural cell adhesion molecules. J Cell Biol 113:
1399-1412.
Grusser-Cornehls U, Baurle J (2001) Mutant mice as a model for cerebellar ataxia. Prog Neurobiol 63: 489-540.
Haney CA, Sahenk Z, Li C, Lemmon VP, Roder J, Trapp BD (1999) Heterophilic binding of L1 on
unmyelinated sensory axons mediates Schwann cell adhesion and is required for axonal survival. J Cell Biol
146: 1173-1184.
VI REFERENCES 92
Hedlund PB, Kelly L, Mazur C, Lovenberg T, Sutcliffe JG, Bonaventure P (2004) 8-OH-DPAT acts on both 5-
HT1A and 5-HT7 receptors to induce hypothermia in rodents. Eur J Pharmacol 487: 125-132.
Heiland PC, Griffith LS, Lange R, Schachner M, Hertlein B, Traub O, Schmitz B (1998) Tyrosine and serine
phosphorylation of the neural cell adhesion molecule L1 is implicated in its oligomannosidic glycan dependent
association with NCAM and neurite outgrowth. Eur J Cell Biol 75: 97-106.
Heisler LK, Chu HM, Brennan TJ, Danao JA, Bajwa P, Parsons LH, Tecott LH (1998) Elevated anxiety and
antidepressant-like responses in serotonin 5-HT1A receptor mutant mice. Proc Natl Acad Sci U S A 95:
15049-15054.
Hlavin ML, Lemmon V (1991) Molecular structure and functional testing of human L1CAM: an interspecies
comparison. Genomics 11: 416-423.
Hogan BLM, Beddington R, Constantini F, Lacy E (1994) Manipulating the Mouse Embryo: A Laboratory
Manual. Cold Spring, New York: Cold Spring Harbor Publications.
Holm J, Appel F, Schachner M (1995) Several extracellular domains of the neural cell adhesion molecule L1 are
involved in homophilic interactions. J Neurosci Res 42: 9-20.
Holm J, Hillenbrand R, Steuber V, Bartsch U, Moos M, Lubbert H, Montag D, Schachner M (1996) Structural
features of a close homologue of L1 (CHL1) in the mouse: a new member of the L1 family of neural
recognition molecules. Eur J Neurosci 8: 1613-1629.
Holmes A, Parmigiani S, Ferrari PF, Palanza P, Rodgers RJ (2000) Behavioral profile of wild mice in the
elevated plus-maze test for anxiety. Physiol Behav 71: 509-516.
Holmes A, Lit Q, Murphy DL, Gold E, Crawley JN (2003) Abnormal anxiety-related behavior in serotonin
transporter null mutant mice: the influence of genetic background. Genes Brain Behav 2: 365-380.
Holtmaat AJ, Oestreicher AB, Gispen WH, Verhaagen J (1998) Manipulation of gene expression in the
mammalian nervous system: application in the study of neurite outgrowth and neuroregeneration-related
proteins. Brain Res Brain Res Rev 26: 43-71.
Horstkorte R, Schachner M, Magyar JP, Vorherr T, Schmitz B (1993) The fourth immunoglobulin-like domain
of NCAM contains a carbohydrate recognition domain for oligomannosidic glycans implicated in association
with L1 and neurite outgrowth. J Cell Biol 121: 1409-1421.
Hortsch M (1996) The L1 family of neural cell adhesion molecules: old proteins performing new tricks. Neuron
17: 587-593.
Hortsch M (2000) Structural and functional evolution of the L1 family: are four adhesion molecules better than
one? Mol Cell Neurosci 15: 1-10.
Huang Y, Jellies J, Johansen KM, Johansen J (1997) Differential glycosylation of tractin and LeechCAM, two
novel Ig superfamily members, regulates neurite extension and fascicle formation. J Cell Biol 138: 143-157.
Husi H, Ward MA, Choudhary JS, Blackstock WP, Grant SG (2000) Proteomic analysis of NMDA receptor-
adhesion protein signaling complexes. Nat Neurosci 3: 661-669.
VI REFERENCES 93
Inoue H, Nojima H, Okayama H (1990) High efficiency transformation of Escherichia coli with plasmids. Gene
96: 23-28.
Irintchev A, Koch M, Needham LK, Maness P, Schachner M (2004) Impairment of sensorimotor gating in mice
deficient in the cell adhesion molecule L1 or its close homologue, CHL1. Brain Res 1029: 131-134.
Islam R, Kristiansen LV, Romani S, Garcia-Alonso L, Hortsch M (2004) Activation of EGF receptor kinase by
L1-mediated homophilic cell interactions. Mol Biol Cell 15: 2003-2012.
Itoh K, Sakurai Y, Asou H, Umeda M (2000) Differential expression of alternatively spliced neural cell adhesion
molecule L1 isoforms during oligodendrocyte maturation. J Neurosci Res 60: 579-586.
Itoh K, Cheng L, Kamei Y, Fushiki S, Kamiguchi H, Gutwein P, Stoeck A, Arnold B, Altevogt P, Lemmon V
(2004) Brain development in mice lacking L1-L1 homophilic adhesion. J Cell Biol 165: 145-154.
Izquierdo I, Medina JH (1997) Memory formation: the sequence of biochemical events in the hippocampus and
its connection to activity in other brain structures. Neurobiol Learn Mem 68: 285-316.
Jacob J, Haspel J, Kane-Goldsmith N, Grumet M (2002) L1 mediated homophilic binding and neurite outgrowth
are modulated by alternative splicing of exon 2. J Neurobiol 51: 177-189.
Jones N, King SM, Duxon MS (2002) Further evidence for the predictive validity of the unstable elevated
exposed plus-maze, a behavioural model of extreme anxiety in rats: differential effects of fluoxetine and
chlordiazepoxide. Behav Pharmacol 13: 525-535.
Jouet M, Rosenthal A, Armstrong G, MacFarlane J, Stevenson R, Paterson J, Metzenberg A, Ionasescu V,
Temple K, Kenwrick S (1994) X-linked spastic paraplegia (SPG1), MASA syndrome and X-linked
hydrocephalus result from mutations in the L1 gene. Nat Genet 7: 402-407.
Jouet M, Rosenthal A, Kenwrick S (1995) Exon 2 of the gene for neural cell adhesion molecule L1 is
alternatively spliced in B cells. Brain Res Mol Brain Res 30: 378-380.
Kadmon G, Bohlen und HF, Horstkorte R, Eckert M, Altevogt P, Schachner M (1995) Evidence for cis
interaction and cooperative signalling by the heat-stable antigen nectadrin (murine CD24) and the cell
adhesion molecule L1 in neurons. Eur J Neurosci 7: 993-1004.
Kallunki P, Edelman GM, Jones FS (1997) Tissue-specific expression of the L1 cell adhesion molecule is
modulated by the neural restrictive silencer element. J Cell Biol 138: 1343-1354.
Kalueff AV, Tuohimaa P (2004) Grooming analysis algorithm for neurobehavioural stress research. Brain Res
Brain Res Protoc 13: 151-158.
Kamiguchi H, Long KE, Pendergast M, Schaefer AW, Rapoport I, Kirchhausen T, Lemmon V (1998a) The
neural cell adhesion molecule L1 interacts with the AP-2 adaptor and is endocytosed via the clathrin-mediated
pathway. J Neurosci 18: 5311-5321.
Kamiguchi H, Hlavin ML, Lemmon V (1998b) Role of L1 in neural development: what the knockouts tell us.
Mol Cell Neurosci 12: 48-55.
Kamiguchi H, Lemmon V (2000) Recycling of the cell adhesion molecule L1 in axonal growth cones. J Neurosci
20: 3676-3686.
VI REFERENCES 94
Kaplan P (1983) X linked recessive inheritance of agenesis of the corpus callosum. J Med Genet 20: 122-124.
Kazlauckas V, Schuh J, Dall'igna OP, Pereira GS, Bonan CD, Lara DR (2005) Behavioral and cognitive profile
of mice with high and low exploratory phenotypes. Behav Brain Res 162: 272-278.
Kenwrick S, Ionasescu V, Ionasescu G, Searby C, King A, Dubowitz M, Davies KE (1986) Linkage studies of
X-linked recessive spastic paraplegia using DNA probes. Hum Genet 73: 264-266.
Kenwrick S, Watkins A, De Angelis E (2000) Neural cell recognition molecule L1: relating biological
complexity to human disease mutations. Hum Mol Genet 9: 879-886.
Kim S, Lee S, Ryu S, Suk J, Park C (2002) Comparative analysis of the anxiety-related behaviors in four inbred
mice. Behav Processes 60: 181-190.
Kleene R, Yang H, Kutsche M, Schachner M (2001) The neural recognition molecule L1 is a sialic acid-binding
lectin for CD24, which induces promotion and inhibition of neurite outgrowth. J Biol Chem 276: 21656-
21663.
Kohl A, Giese KP, Mohajeri MH, Montag D, Moos M, Schachner M (1992) Analysis of promoter activity and 5'
genomic structure of the neural cell adhesion molecule L1. J Neurosci Res 32: 167-177.
Kornblihtt AR, Umezawa K, Vibe-Pedersen K, Baralle FE (1985) Primary structure of human fibronectin:
differential splicing may generate at least 10 polypeptides from a single gene. EMBO J 4: 1755-1759.
Kunz S, Spirig M, Ginsburg C, Buchstaller A, Berger P, Lanz R, Rader C, Vogt L, Kunz B, Sonderegger P
(1998) Neurite fasciculation mediated by complexes of axonin-1 and Ng cell adhesion molecule. J Cell Biol
143: 1673-1690.
Laemmli UK (1970) Cleavage of structural proteins during the assembly of the head of bacteriophage T4. Nature
227: 680-685.
Lagenaur C, Lemmon V (1987) An L1-like molecule, the 8D9 antigen, is a potent substrate for neurite extension.
Proc Natl Acad Sci U S A 84: 7753-7757.
Lathe R (2004) The individuality of mice. Genes Brain Behav 3: 317-327.
Law JW, Lee AY, Sun M, Nikonenko AG, Chung SK, Dityatev A, Schachner M, Morellini F (2003) Decreased
anxiety, altered place learning, and increased CA1 basal excitatory synaptic transmission in mice with
conditional ablation of the neural cell adhesion molecule L1. J Neurosci 23: 10419-10432.
Lemmon V, Farr KL, Lagenaur C (1989) L1-mediated axon outgrowth occurs via a homophilic binding
mechanism. Neuron 2: 1597-1603.
Lindner J, Rathjen FG, Schachner M (1983) L1. Nature 305: 427-430.
Lister RG (1990) Ethologically-based animal models of anxiety disorders. Pharmacol Ther 46: 321-340.
Lochter A, Vaughan L, Kaplony A, Prochiantz A, Schachner M, Faissner A (1991) J1/tenascin in substrate-
bound and soluble form displays contrary effects on neurite outgrowth. J Cell Biol 113: 1159-1171.
VI REFERENCES 95
Luthi A, Mohajeri H, Schachner M, Laurent JP (1996) Reduction of hippocampal long-term potentiation in
transgenic mice ectopically expressing the neural cell adhesion molecule L1 in astrocytes. J Neurosci Res 46:
1-6.
Luthi A, Van der PH, Botteri FM, Mansuy IM, Meins M, Frey U, Sansig G, Portet C, Schmutz M, Schroder M,
Nitsch C, Laurent JP, Monard D (1997) Endogenous serine protease inhibitor modulates epileptic activity and
hippocampal long-term potentiation. J Neurosci 17: 4688-4699.
Man MS, Young AH, McAllister-Williams RH (2002) Corticosterone modulation of somatodendritic 5-HT1A
receptor function in mice. J Psychopharmacol 16: 245-252.
Martin JH (2005) The corticospinal system: from development to motor control. Neuroscientist 11: 161-173.
Martini R, Schachner M (1986) Immunoelectron microscopic localization of neural cell adhesion molecules (L1,
N-CAM, and MAG) and their shared carbohydrate epitope and myelin basic protein in developing sciatic
nerve. J Cell Biol 103: 2439-2448.
Martini R, Schachner M (1988) Immunoelectron microscopic localization of neural cell adhesion molecules (L1,
N-CAM, and myelin-associated glycoprotein) in regenerating adult mouse sciatic nerve. J Cell Biol 106: 1735-
1746.
McAllister-Williams RH, Anderson AJ, Young AH (2001) Corticosterone selectively attenuates 8-OH-DPAT-
mediated hypothermia in mice. Int J Neuropsychopharmacol 4: 1-8.
McIlwain KL, Merriweather MY, Yuva-Paylor LA, Paylor R (2001) The use of behavioral test batteries: effects
of training history. Physiol Behav 73: 705-717.
Mechtersheimer S, Gutwein P, Agmon-Levin N, Stoeck A, Oleszewski M, Riedle S, Postina R, Fahrenholz F,
Fogel M, Lemmon V, Altevogt P (2001) Ectodomain shedding of L1 adhesion molecule promotes cell
migration by autocrine binding to integrins. J Cell Biol 155: 661-673.
Meli ML, Carrel F, Waibel R, Amstutz H, Crompton N, Jaussi R, Moch H, Schubiger PA, Novak-Hofer I (1999)
Anti-neuroblastoma antibody chCE7 binds to an isoform of L1-CAM present in renal carcinoma cells. Int J
Cancer 83: 401-408.
Meller E, Chalfin M, Bohmaker K (1992) Serotonin 5-HT1A receptor-mediated hypothermia in mice: absence of
spare receptors and rapid induction of tolerance. Pharmacol Biochem Behav 43: 405-411.
Merino JJ, Cordero MI, Sandi C (2000) Regulation of hippocampal cell adhesion molecules NCAM and L1 by
contextual fear conditioning is dependent upon time and stressor intensity. Eur J Neurosci 12: 3283-3290.
Metz GA, Schwab ME, Welzl H (2001) The effects of acute and chronic stress on motor and sensory
performance in male Lewis rats. Physiol Behav 72: 29-35.
Millan MJ, Rivet JM, Canton H, Marouille-Girardon S, Gobert A (1993) Induction of hypothermia as a model of
5-hydroxytryptamine1A receptor-mediated activity in the rat: a pharmacological characterization of the actions
of novel agonists and antagonists. J Pharmacol Exp Ther 264: 1364-1376.
Mintz CD, Dickson TC, Gripp ML, Salton SR, Benson DL (2003) ERMs colocalize transiently with L1 during
neocortical axon outgrowth. J Comp Neurol 464: 438-448.
VI REFERENCES 96
Mohajeri MH, Bartsch U, Van der PH, Sansig G, Mucke L, Schachner M (1996) Neurite outgrowth on non-
permissive substrates in vitro is enhanced by ectopic expression of the neural adhesion molecule L1 by mouse
astrocytes. Eur J Neurosci 8: 1085-1097.
Montag-Sallaz M, Schachner M, Montag D (2002) Misguided axonal projections, neural cell adhesion molecule
180 mRNA upregulation, and altered behavior in mice deficient for the close homolog of L1. Mol Cell Biol
22: 7967-7981.
Moos M, Tacke R, Scherer H, Teplow D, Fruh K, Schachner M (1988) Neural adhesion molecule L1 as a
member of the immunoglobulin superfamily with binding domains similar to fibronectin. Nature 334: 701-
703.
Morris R (1985) Thy-1 in developing nervous tissue. Dev Neurosci 7: 133-160.
Moulding HD, Martuza RL, Rabkin SD (2000) Clinical mutations in the L1 neural cell adhesion molecule affect
cell-surface expression. J Neurosci 20: 5696-5702.
Moya GE, Michaelis RC, Holloway LW, Sanchez JM (2002) Prenatal diagnosis of L1 cell adhesion molecule
mutations. Capabilities and limitations. Fetal Diagn Ther 17: 115-119.
Mullis K, Faloona F, Scharf S, Saiki R, Horn G, Erlich H (1986) Specific enzymatic amplification of DNA in
vitro: the polymerase chain reaction. Cold Spring Harb Symp Quant Biol 51 Pt 1: 263-273.
Needham LK, Thelen K, Maness PF (2001) Cytoplasmic domain mutations of the L1 cell adhesion molecule
reduce L1-ankyrin interactions. J Neurosci 21: 1490-1500.
Nishimune H, Bernreuther C, Carroll P, Chen S, Schachner M, Henderson CE (2005) Neural adhesion molecules
L1 and CHL1 are survival factors for motoneurons. J Neurosci Res 80: 593-599.
Nolte C, Moos M, Schachner M (1999) Immunolocalization of the neural cell adhesion molecule L1 in epithelia
of rodents. Cell Tissue Res 298: 261-273.
Ohl F, Roedel A, Binder E, Holsboer F (2003) Impact of high and low anxiety on cognitive performance in a
modified hole board test in C57BL/6 and DBA/2 mice. Eur J Neurosci 17: 128-136.
Patin V, Vincent A, Lordi B, Caston J (2004) Does prenatal stress affect the motoric development of rat pups?
Brain Res Dev Brain Res 149: 85-92.
Payne HR, Burden SM, Lemmon V (1992) Modulation of growth cone morphology by substrate-bound adhesion
molecules. Cell Motil Cytoskeleton 21: 65-73.
Pellow S, Chopin P, File SE, Briley M (1985) Validation of open:closed arm entries in an elevated plus-maze as
a measure of anxiety in the rat. J Neurosci Methods 14: 149-167.
Persohn E, Schachner M (1987) Immunoelectron microscopic localization of the neural cell adhesion molecules
L1 and N-CAM during postnatal development of the mouse cerebellum. J Cell Biol 105: 569-576.
Persohn E, Schachner M (1990) Immunohistological localization of the neural adhesion molecules L1 and N-
CAM in the developing hippocampus of the mouse. J Neurocytol 19: 807-819.
Pradel G, Schmidt R, Schachner M (2000) Involvement of L1.1 in memory consolidation after active avoidance
conditioning in zebrafish. J Neurobiol 43: 389-403.
VI REFERENCES 97
Pratte M, Rougon G, Schachner M, Jamon M (2003) Mice deficient for the close homologue of the neural
adhesion cell L1 (CHL1) display alterations in emotional reactivity and motor coordination. Behav Brain Res
147: 31-39.
Rathjen FG, Schachner M (1984) Immunocytological and biochemical characterization of a new neuronal cell
surface component (L1 antigen) which is involved in cell adhesion. EMBO J 3: 1-10.
Rodgers RJ, Johnson NJ (1995) Factor analysis of spatiotemporal and ethological measures in the murine
elevated plus-maze test of anxiety. Pharmacol Biochem Behav 52: 297-303.
Rodgers RJ, Boullier E, Chatzimichalaki P, Cooper GD, Shorten A (2002) Contrasting phenotypes of
C57BL/6JOlaHsd, 129S2/SvHsd and 129/SvEv mice in two exploration-based tests of anxiety-related
behaviour. Physiol Behav 77: 301-310.
Rolf B, Kutsche M, Bartsch U (2001) Severe hydrocephalus in L1-deficient mice. Brain Res 891: 247-252.
Rose SP (1995) Cell-adhesion molecules, glucocorticoids and long-term-memory formation. Trends Neurosci
18: 502-506.
Rosenthal A, Jouet M, Kenwrick S (1992) Aberrant splicing of neural cell adhesion molecule L1 mRNA in a
family with X-linked hydrocephalus. Nat Genet 2: 107-112.
Rougon G, Hobert O (2003) New insights into the diversity and function of neuronal immunoglobulin
superfamily molecules. Annu Rev Neurosci 26: 207-238.
Rulicke T, Hubscher U (2000) Germ line transformation of mammals by pronuclear microinjection. Exp Physiol
85: 589-601.
Runker AE, Bartsch U, Nave KA, Schachner M (2003) The C264Y missense mutation in the extracellular
domain of L1 impairs protein trafficking in vitro and in vivo. J Neurosci 23: 277-286.
Rutishauser U (1993) Adhesion molecules of the nervous system. Curr Opin Neurobiol 3: 709-715.
Sadoul K, Sadoul R, Faissner A, Schachner M (1988) Biochemical characterization of different molecular forms
of the neural cell adhesion molecule L1. J Neurochem 50: 510-521.
Saghatelyan AK, Nikonenko AG, Sun M, Rolf B, Putthoff P, Kutsche M, Bartsch U, Dityatev A, Schachner M
(2004) Reduced GABAergic transmission and number of hippocampal perisomatic inhibitory synapses in
juvenile mice deficient in the neural cell adhesion molecule L1. Mol Cell Neurosci 26: 191-203.
Salton SR, Richter-Landsberg C, Greene LA, Shelanski ML (1983) Nerve growth factor-inducible large external
(NILE) glycoprotein: studies of a central and peripheral neuronal marker. J Neurosci 3: 441-454.
Sambrook J, Fritsch EF, Maniatis T (1989) Molecular cloning: A Labroatory Manual, 2nd edition Cold Spring
Harbor, NY: Cold Spring Harbor Laboratory.
Sampo B, Kaech S, Kunz S, Banker G (2003) Two distinct mechanisms target membrane proteins to the axonal
surface. Neuron 37: 611-624.
Sandi C, Merino JJ, Cordero MI, Touyarot K, Venero C (2001) Effects of chronic stress on contextual fear
conditioning and the hippocampal expression of the neural cell adhesion molecule, its polysialylation, and L1.
Neuroscience 102: 329-339.
VI REFERENCES 98
Sandi C, Woodson JC, Haynes VF, Park CR, Touyarot K, Lopez-Fernandez MA, Venero C, Diamond DM
(2005) Acute stress-induced impairment of spatial memory is associated with decreased expression of neural
cell adhesion molecule in the hippocampus and prefrontal cortex. Biol Psychiatry 57: 856-864.
Schachner M (1994) Neural recognition molecules in disease and regeneration. Curr Opin Neurobiol 4: 726-734.
Schaefer AW, Kamei Y, Kamiguchi H, Wong EV, Rapoport I, Kirchhausen T, Beach CM, Landreth G, Lemmon
SK, Lemmon V (2002) L1 endocytosis is controlled by a phosphorylation-dephosphorylation cycle stimulated
by outside-in signaling by L1. J Cell Biol 157: 1223-1232.
Scholey AB, Mileusnic R, Schachner M, Rose SP (1995) A role for a chicken homolog of the neural cell
adhesion molecule L1 in consolidation of memory for a passive avoidance task in the chick. Learn Mem 2: 17-
25.
Schrander-Stumpel C, Fryns JP (1998) Congenital hydrocephalus: nosology and guidelines for clinical approach
and genetic counselling. Eur J Pediatr 157: 355-362.
Schurmann G, Haspel J, Grumet M, Erickson HP (2001) Cell adhesion molecule L1 in folded (horseshoe) and
extended conformations. Mol Biol Cell 12: 1765-1773.
Schuster T, Krug M, Stalder M, Hackel N, Gerardy-Schahn R, Schachner M (2001) Immunoelectron
microscopic localization of the neural recognition molecules L1, NCAM, and its isoform NCAM180, the
NCAM-associated polysialic acid, beta1 integrin and the extracellular matrix molecule tenascin-R in synapses
of the adult rat hippocampus. J Neurobiol 49: 142-158.
Seilheimer B, Persohn E, Schachner M (1989) Neural cell adhesion molecule expression is regulated by
Schwann cell-neuron interactions in culture. J Cell Biol 108: 1909-1915.
Serville F, Lyonnet S, Pelet A, Reynaud M, Louail C, Munnich A, Le Merrer M (1992) X-linked hydrocephalus:
clinical heterogeneity at a single gene locus. Eur J Pediatr 151: 515-518.
Shapiro L, Colman DR (1998) Structural biology of cadherins in the nervous system. Curr Opin Neurobiol 8:
593-599.
Silletti S, Mei F, Sheppard D, Montgomery AM (2000) Plasmin-sensitive dibasic sequences in the third
fibronectin-like domain of L1-cell adhesion molecule (CAM) facilitate homomultimerization and concomitant
integrin recruitment. J Cell Biol 149: 1485-1502.
Skaper SD, Moore SE, Walsh FS (2001) Cell signalling cascades regulating neuronal growth-promoting and
inhibitory cues. Prog Neurobiol 65: 593-608.
Sytnyk V, Leshchyns'ka I, Delling M, Dityateva G, Dityatev A, Schachner M (2002) Neural cell adhesion
molecule promotes accumulation of TGN organelles at sites of neuron-to-neuron contacts. J Cell Biol 159:
649-661.
Takeda Y, Asou H, Murakami Y, Miura M, Kobayashi M, Uyemura K (1996) A nonneuronal isoform of cell
adhesion molecule L1: tissue-specific expression and functional analysis. J Neurochem 66: 2338-2349.
Tang X, Sanford LD (2005) Home cage activity and activity-based measures of anxiety in 129P3/J, 129X1/SvJ
and C57BL/6J mice. Physiol Behav 84: 105-115.
VI REFERENCES 99
Tedder TF, Steeber DA, Chen A, Engel P (1995) The selectins: vascular adhesion molecules. FASEB J 9: 866-
873.
Thelen K, Kedar V, Panicker AK, Schmid RS, Midkiff BR, Maness PF (2002) The neural cell adhesion
molecule L1 potentiates integrin-dependent cell migration to extracellular matrix proteins. J Neurosci 22:
4918-4931.
Thelin J, Waldenstrom A, Bartsch U, Schachner M, Schouenborg J (2003) Heat nociception is severely reduced
in a mutant mouse deficient for the L1 adhesion molecule. Brain Res 965: 75-82.
Thor G, Probstmeier R, Schachner M (1987) Characterization of the cell adhesion molecules L1, N-CAM and J1
in the mouse intestine. EMBO J 6: 2581-2586.
Tongiorgi E, Bernhardt RR, Schachner M (1995) Zebrafish neurons express two L1-related molecules during
early axonogenesis. J Neurosci Res 42: 547-561.
Towbin H, Staehelin T, Gordon J (1979) Electrophoretic transfer of proteins from polyacrylamide gels to
nitrocellulose sheets: procedure and some applications. Proc Natl Acad Sci U S A 76: 4350-4354.
Tuvia S, Garver TD, Bennett V (1997) The phosphorylation state of the FIGQY tyrosine of neurofascin
determines ankyrin-binding activity and patterns of cell segregation. Proc Natl Acad Sci U S A 94: 12957-
12962.
Uyemura K, Asou H, Yazaki T, Takeda Y (1996) Cell-adhesion proteins of the immunoglobulin superfamily in
the nervous system. Essays Biochem 31: 37-48.
Venero C, Tilling T, Hermans-Borgmeyer I, Herrero AI, Schachner M, Sandi C (2004) Water maze learning and
forebrain mRNA expression of the neural cell adhesion molecule L1. J Neurosci Res 75: 172-181.
Vidal M, Morris R, Grosveld F, Spanopoulou E (1990) Tissue-specific control elements of the Thy-1 gene.
EMBO J 9: 833-840.
Vielmetter J, Lottspeich F, Stuermer CA (1991) The monoclonal antibody E587 recognizes growing (new and
regenerating) retinal axons in the goldfish retinotectal pathway. J Neurosci 11: 3581-3593.
Volkmer H, Hassel B, Wolff JM, Frank R, Rathjen FG (1992) Structure of the axonal surface recognition
molecule neurofascin and its relationship to a neural subgroup of the immunoglobulin superfamily. J Cell Biol
118: 149-161.
Wahlsten D, Metten P, Phillips TJ, Boehm SL, Burkhart-Kasch S, Dorow J, Doerksen S, Downing C, Fogarty J,
Rodd-Henricks K, Hen R, McKinnon CS, Merrill CM, Nolte C, Schalomon M, Schlumbohm JP, Sibert JR,
Wenger CD, Dudek BC, Crabbe JC (2003) Different data from different labs: lessons from studies of gene-
environment interaction. J Neurobiol 54: 283-311.
Walsh FS, Doherty P (1997a) Neural cell adhesion molecules of the immunoglobulin superfamily: role in axon
growth and guidance. Annu Rev Cell Dev Biol 13: 425-456.
Walsh FS, Meiri K, Doherty P (1997b) Cell signalling and CAM-mediated neurite outgrowth. Soc Gen Physiol
Ser 52: 221-226.
VI REFERENCES 100
Weiss IC, Pryce CR, Jongen-Relo AL, Nanz-Bahr NI, Feldon J (2004) Effect of social isolation on stress-related
behavioural and neuroendocrine state in the rat. Behav Brain Res 152: 279-295.
Weiss SM, Wadsworth G, Fletcher A, Dourish CT (1998) Utility of ethological analysis to overcome locomotor
confounds in elevated maze models of anxiety. Neurosci Biobehav Rev 23: 265-271.
Westphal H, Gruss P (1989) Molecular genetics of development studied in the transgenic mouse. Annu Rev Cell
Biol 5: 181-196.
Williams AF, Barclay AN (1988) The immunoglobulin superfamily--domains for cell surface recognition. Annu
Rev Immunol 6: 381-405.
Wisden W, Cope D, Klausberger T, Hauer B, Sinkkonen ST, Tretter V, Lujan R, Jones A, Korpi ER, Mody I,
Sieghart W, Somogyi P (2002) Ectopic expression of the GABA(A) receptor alpha6 subunit in hippocampal
pyramidal neurons produces extrasynaptic receptors and an increased tonic inhibition. Neuropharmacology 43:
530-549.
Wolfer DP, Mohajeri HM, Lipp HP, Schachner M (1998) Increased flexibility and selectivity in spatial learning
of transgenic mice ectopically expressing the neural cell adhesion molecule L1 in astrocytes. Eur J Neurosci
10: 708-717.
Wong EV, Cheng G, Payne HR, Lemmon V (1995a) The cytoplasmic domain of the cell adhesion molecule L1
is not required for homophilic adhesion. Neurosci Lett 200: 155-158.
Wong EV, Kenwrick S, Willems P, Lemmon V (1995b) Mutations in the cell adhesion molecule L1 cause
mental retardation. Trends Neurosci 18: 168-172.
Yamasaki M, Thompson P, Lemmon V (1997) CRASH syndrome: mutations in L1CAM correlate with severity
of the disease. Neuropediatrics 28: 175-178.
Zhao X, Yip PM, Siu CH (1998) Identification of a homophilic binding site in immunoglobulin-like domain 2 of
the cell adhesion molecule L1. J Neurochem 71: 960-971.
VII APPENDIX 101
VII APPENDIX
1 Abbreviations
Chemical symbols of elements and molecules, amino acids, and nucleobases / nucleosides /
polynucleotides were abbreviated using the codes according to the recommendations by IUPAC and IUBMB.
Dimensions: k (kilo, 103), c (centi, 10-2), m (milli, 10-3), µ (micro, 10-6), n (nano, 10-9), p (pico, 10-12), s
(seconds), min (minutes), h (hours), m (meter), g (gram), l (litre), bp (base pairs), kb (kilo bases), kD (kilo
Dalton), U (enzymatic units), V (Volt), A (Ampère), lux, °C (degree Celsius), xg (g force), rpm (rotations per
minute), % (percent)
5-HT1A R serotonin1A receptor
8-OH-DPAT (±)-8-hydroxy-2-(di-n-propylamino)
tetralin
ACC agenesis of the corpus callosum
ADAM a disintegrin-like and metalloprotease
Amp ampicillin
Ampr ampicillin resistance
ANOVA analysis of variance
AP-2 adaptor protein-2
APS ammonium peroxodisulfate
ATP adenosine triphosphate
BCA bicinchonin acid
BIG brain-derived Ig molecule
BLASTN Basic Local Alignment Search Tool,
Nucleotides
BME basal medium, eagle
BSA bovine serum albumine
CA cornu ammonis
CD 24 cluster of differentiation 24
cDNA complementary deoxyribonucleic acid
CHL1 close homologue of L1
CRASH corpus callosum agenesis, retardation,
adducted thumbs, shuffling gait,
hydrocephalus
CST corticospinal tract
Cy2/3 cyanine 2/3
dATP deoxyadenosine-triphosphate
DCC deleted in colorectal cancer
dCTP deoxycytosine-triphosphate
ddH2O bi-distilled water
dGTP deoxyguanosine-triphosphate
DNA deoxyribonucleic acid
DNase deoxyribonuclease
dNTP deoxynucleoside-triphosphate
DTT dithiothreitol
dTTP deoxythymidine-triphosphate
ECL enhanced chemiluminescence
E.coli Escheria coli
EDTA ethylenediaminetetraacetic acid
e.g. exampli gratia
EGF epidermal growth factor
EGTA ethyleneglycol-bis-2-
aminoethylether-tetraacetic acid
ELISA enzyme linked immuno sorbent assay
EndoH endoglycosidase H
ER endoplasmatic reticulum
et al. et alii
FGF-R fibroblast growth factor receptor
Fig. Figure
GABA γ aminobutyric acid
GAPDH glyceraldehyde-3-phosphate
dehydrogenase
GPI glycophosphatidylinositol
HBSS Hank's Balanced Salt Solution
hL1-Fc human L1-constant fragment
HRP horseradish peroxidase
HSAS hydrocephalus due to stenosis of the
aqueduct of Sylvius
i.e. id est
Ig immunoglobulin
IUBMB International Union of Biochemistry
& Molecular Biology
VII APPENDIX 102
IUPAC International Union of Pure &
Applied Chemistry
KO L1 knock out
KO_T L1 knock out_transgenic L1
LAD-1 L1-like adhesion-1
LB Luria Bertani
MAG myelin-associated glycoprotein
MAPK mitogen-activated protein kinase
MASA mental retardation, aphasia, shuffling
gait, adducted thumbs
MOPS 3-(n-morpholino)propanesulfonic acid
mRNA messenger ribonucleic acid
NCAM neural cell adhesion molecule
NCBI National Centre for Biotechnology
Information
NgCAM neuron-glia cell adhesion molecule
NILE nerve growth factor inducible large
external glycoprotein
NMDA N-methyl-D-aspartate
NrCAM Ng CAM-related cell adhesion
molecule
O.C.T. optimal cutting temperature
ODx optical density
P postnatal day
p.a. pro analysi
PAGE polyacrylamide gel electrophoresis
PBS phosphate buffered saline
PCR polymerase chain reaction
PLC phospholipase C
PLL poly-L-lysine
pH potentia hydrogenii
PVC polyvinyl chloride
RPTP receptor type phosphotyrosine
phosphatase
RT room temperature
RTK receptor tyrosine kinase
SAP stretch attend posture
SDS sodium dodecyl sulfate
S.E.M. standard error of the mean
Sema3A semaphorin 3A
SP-1 spastic paraplegia-1
TAE tris acetate EDTA
TAG-1 transiently expressed axonal surface
glycoprotein
TBS tris buffered saline
TBS-T tris buffered saline-Tween
TE tris EDTA
TEMED tetramethylethylenediamine
TFB transforming buffer
TIU trypsin inhibitor unit
Tris tris(hydroxymethyl)-aminomethane
tTA tetracycline transactivator
UV ultra violet
vs. versus
WT wildtype
WT_T wildtype_transgenic L1
ZMNH Zentrum für Molekulare
Neurobiologie Hamburg
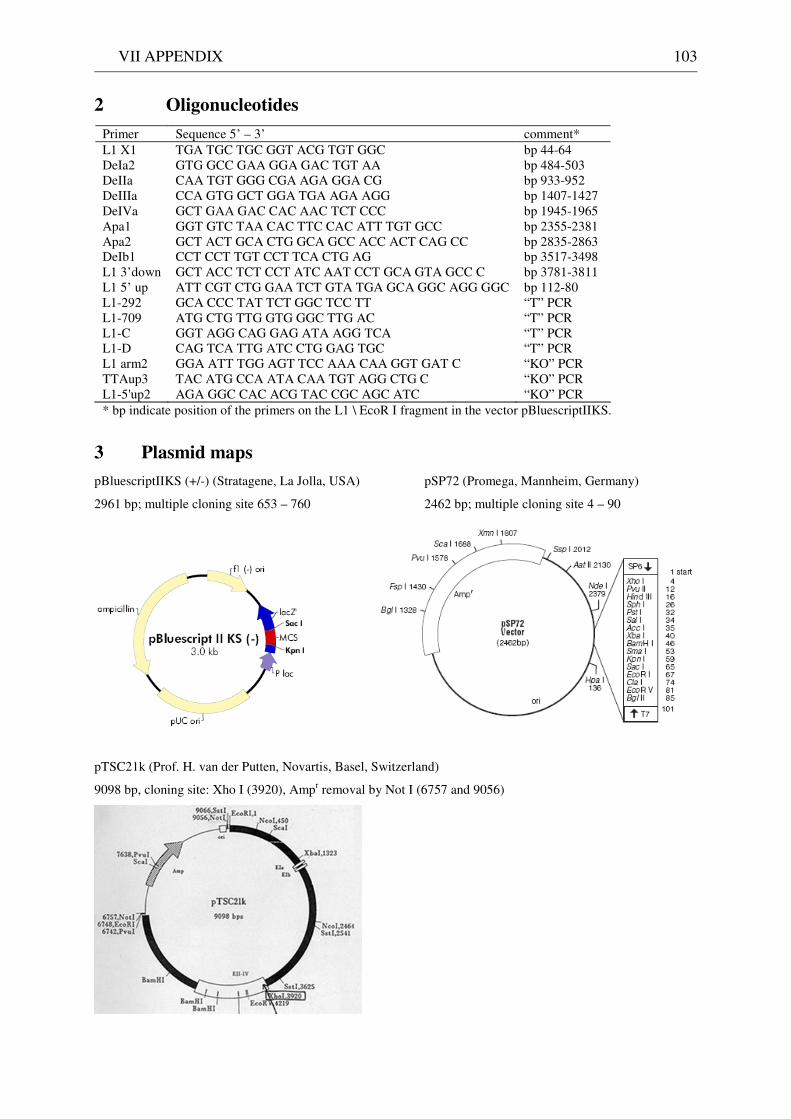
VII APPENDIX 103
2 Oligonucleotides
Primer Sequence 5’ – 3’ comment* L1 X1 TGA TGC TGC GGT ACG TGT GGC bp 44-64 DeIa2 GTG GCC GAA GGA GAC TGT AA bp 484-503 DeIIa CAA TGT GGG CGA AGA GGA CG bp 933-952 DeIIIa CCA GTG GCT GGA TGA AGA AGG bp 1407-1427 DeIVa GCT GAA GAC CAC AAC TCT CCC bp 1945-1965 Apa1 GGT GTC TAA CAC TTC CAC ATT TGT GCC bp 2355-2381 Apa2 GCT ACT GCA CTG GCA GCC ACC ACT CAG CC bp 2835-2863 DeIb1 CCT CCT TGT CCT TCA CTG AG bp 3517-3498 L1 3’down GCT ACC TCT CCT ATC AAT CCT GCA GTA GCC C bp 3781-3811 L1 5’ up ATT CGT CTG GAA TCT GTA TGA GCA GGC AGG GGC bp 112-80 L1-292 GCA CCC TAT TCT GGC TCC TT “T” PCR L1-709 ATG CTG TTG GTG GGC TTG AC “T” PCR L1-C GGT AGG CAG GAG ATA AGG TCA “T” PCR L1-D CAG TCA TTG ATC CTG GAG TGC “T” PCR L1 arm2 GGA ATT TGG AGT TCC AAA CAA GGT GAT C “KO” PCR TTAup3 TAC ATG CCA ATA CAA TGT AGG CTG C “KO” PCR L1-5'up2 AGA GGC CAC ACG TAC CGC AGC ATC “KO” PCR * bp indicate position of the primers on the L1 \ EcoR I fragment in the vector pBluescriptIIKS.
3 Plasmid maps
pBluescriptIIKS (+/-) (Stratagene, La Jolla, USA) pSP72 (Promega, Mannheim, Germany)
2961 bp; multiple cloning site 653 – 760 2462 bp; multiple cloning site 4 – 90
pTSC21k (Prof. H. van der Putten, Novartis, Basel, Switzerland)
9098 bp, cloning site: Xho I (3920), Ampr removal by Not I (6757 and 9056)
DANKSAGUNG 104
DANKSAGUNG
An dieser Stelle möchte ich Frau Prof. Melitta Schachner danken für die Überlassung
des Themas und die Möglichkeit der Durchführung am Institut für Biosynthese Neuraler
Strukturen des ZMNH, sowie für ihre großzügige Unterstützung bei dieser Arbeit.
Herrn Prof. Peter Heisig gilt mein besonderer Dank für die Bereitschaft, diese Arbeit
als externe Promotion zu betreuen.
Herrn Prof. Hermann van der Putten danke ich, dass er den Vektor mit der Thy-1.2
Kassette zur Verfügung gestellt hat.
Dr. Fabio Morellini danke ich für die de novo Einweisung in die phantastische Welt
der Verhaltensbiologie und die umfangreiche Betreuung.
Dr. Vladimir Sytnyk und Dr. Irina Leshchyns’ka danke ich für die Anfertigung der
hippocampalen Neuronenkulturen und die Einführung in die quantitative Analyse.
Dr. Gabriele Loers danke ich für die tatkräftige Hilfe bei der Präparation der
cerebellaren Neuronenkulturen.
Für die Pflege der Mauslinien danke ich Gudrun Arndt, für die Genotypisierungen
Achim Dahlmann.
Dank gilt auch allen Kollegen, die mich durch fachliche Gespräche und
Hilfsbereitschaft im Labor unterstützt haben. Den früheren E05 Laborgefährten (Annette,
Bettina, Sandra) danke ich außerdem, dass sie den Arbeitsalltag aufgeheitert haben.
Last but not least danke ich meiner Familie, die mir in jeder Hinsicht stets zur Seite
gestanden hat, und unerschütterlich an mich geglaubt hat. Insbesondere die Zuversicht meiner
Mutter hat mich getragen.
CURRICULUM VITAE 105
CURRICULUM VITAE
Meike Petra Zerwas
Geb. 04.08.1973, Aachen
Universität / Ausbildung
Seit 1999 Dissertation an der Universität Hamburg, ZMNH
2000-02 Aufbaustudium Molekularbiologie an der Universität Hamburg
1998-99 Biologiekurse an der University of Edinburgh, Department of Biology
08.06.1998 Approbation als Apothekerin
1997-98 Praktisches Jahr in der Harscamp Apotheke, Aachen
1992-97 Pharmaziestudium an der Universität Heidelberg, Fakultät für Pharmazie
1995 Pharmaziekurse an der University of London, School of Pharmacy
Schule
1983-92 St. Ursula Gymnasium, Aachen (Abschluss mit Abitur)
1985 Burlingame Intermediate School, Burlingame, Kalifornien
1979-83 Grundschule Jesuitenstraße, Aachen
1982 El Carmelo Elementary School, Palo Alto, Kalifornien

ERKLÄRUNG 106
ERKLÄRUNG
Hiermit versichere ich an Eides statt, dass ich die vorliegende Arbeit selbstständig und
ohne fremde Hilfe verfasst habe. Ich habe keine anderen als die angegebenen Hilfsmittel und
Quellen benutzt und habe die entnommen Stellen als solche kenntlich gemacht. Soweit Hilfe
in Anspruch genommen wurde, ist dies entsprechend im Text vermerkt.
Diese Arbeit ist zuvor keiner Prüfungsbehörde, weder in dieser noch in abgewandelter
Form, zum Erwerb des Doktorgrades vorgelegt worden. Auch mit keiner anderen Arbeit habe
ich mich zuvor um den Erwerb des Doktorgrades bemüht.
Hamburg, September 2005
Meike Zerwas
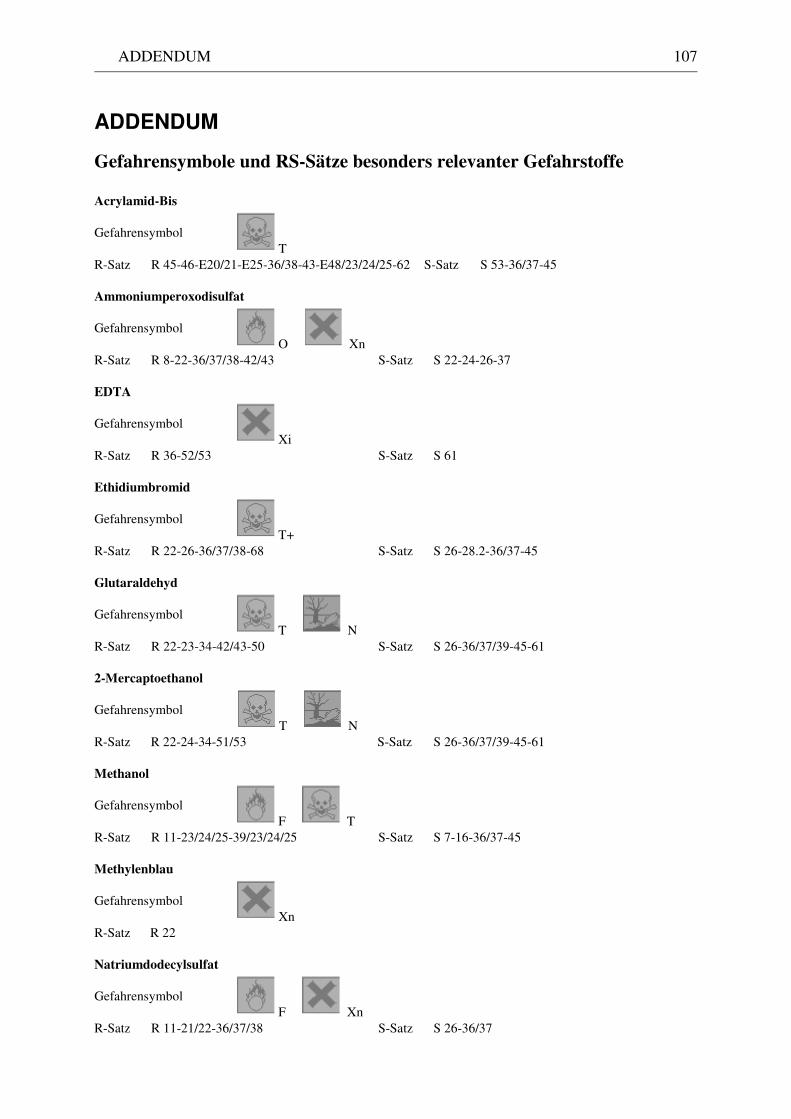
ADDENDUM 107
ADDENDUM
Gefahrensymbole und RS-Sätze besonders relevanter Gefahrstoffe
Acrylamid-Bis
Gefahrensymbol T
R-Satz R 45-46-E20/21-E25-36/38-43-E48/23/24/25-62 S-Satz S 53-36/37-45 Ammoniumperoxodisulfat
Gefahrensymbol O Xn
R-Satz R 8-22-36/37/38-42/43 S-Satz S 22-24-26-37 EDTA
Gefahrensymbol Xi
R-Satz R 36-52/53 S-Satz S 61 Ethidiumbromid
Gefahrensymbol T+
R-Satz R 22-26-36/37/38-68 S-Satz S 26-28.2-36/37-45
Glutaraldehyd
Gefahrensymbol T N
R-Satz R 22-23-34-42/43-50 S-Satz S 26-36/37/39-45-61
2-Mercaptoethanol
Gefahrensymbol T N
R-Satz R 22-24-34-51/53 S-Satz S 26-36/37/39-45-61
Methanol
Gefahrensymbol F T
R-Satz R 11-23/24/25-39/23/24/25 S-Satz S 7-16-36/37-45 Methylenblau
Gefahrensymbol Xn
R-Satz R 22 Natriumdodecylsulfat
Gefahrensymbol F Xn
R-Satz R 11-21/22-36/37/38 S-Satz S 26-36/37
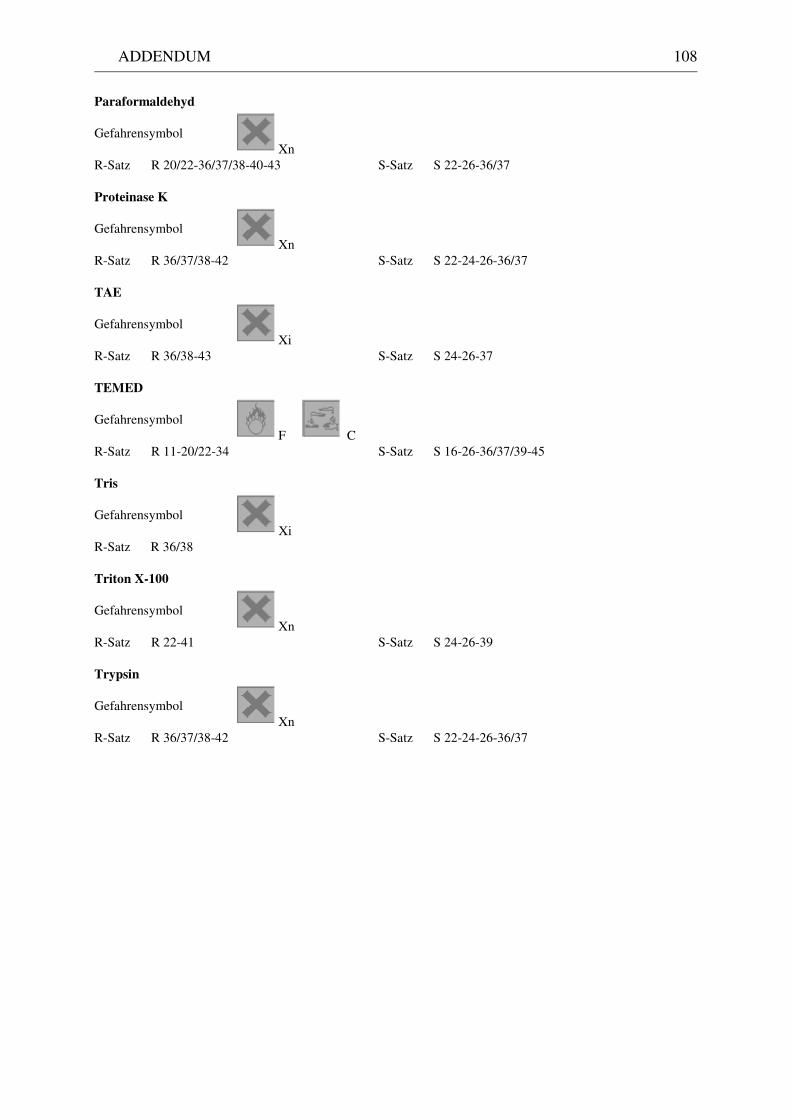
ADDENDUM 108
Paraformaldehyd
Gefahrensymbol Xn
R-Satz R 20/22-36/37/38-40-43 S-Satz S 22-26-36/37 Proteinase K
Gefahrensymbol Xn
R-Satz R 36/37/38-42 S-Satz S 22-24-26-36/37 TAE
Gefahrensymbol Xi
R-Satz R 36/38-43 S-Satz S 24-26-37 TEMED
Gefahrensymbol F C
R-Satz R 11-20/22-34 S-Satz S 16-26-36/37/39-45 Tris
Gefahrensymbol Xi
R-Satz R 36/38 Triton X-100
Gefahrensymbol Xn
R-Satz R 22-41 S-Satz S 24-26-39 Trypsin
Gefahrensymbol Xn
R-Satz R 36/37/38-42 S-Satz S 22-24-26-36/37