Embed Size (px)
Citation preview
������������� ������������������������
�
��������������� ���������������������
��
�
�
�
�
�
�
�
�
�
���������������������������
�� ����������� ���������������������������������!�������
�
�
�
�
�
�
������������� ������������������������
�
�
�
�
�
�
�������
�
���� ��������������� ��
������������������ �������������
��������� ������

WHO Global Status Report on Alcohol 2004
35
Health effects and global burden of disease Alcohol use is related to wide range of physical, mental and social harms1. Most health professionals agree that alcohol affects practically every organ in the human body. Alcohol consumption was linked to more than 60 disease conditions in a series of recent meta-analyses (English et al., 1995; Gutjahr, Gmel & Rehm, 2001; Ridolfo & Stevenson, 2001; Single et al., 1999). The present chapter mainly draws on the work of Gutjahr and Gmel (2001) and Rehm et al. (in press).
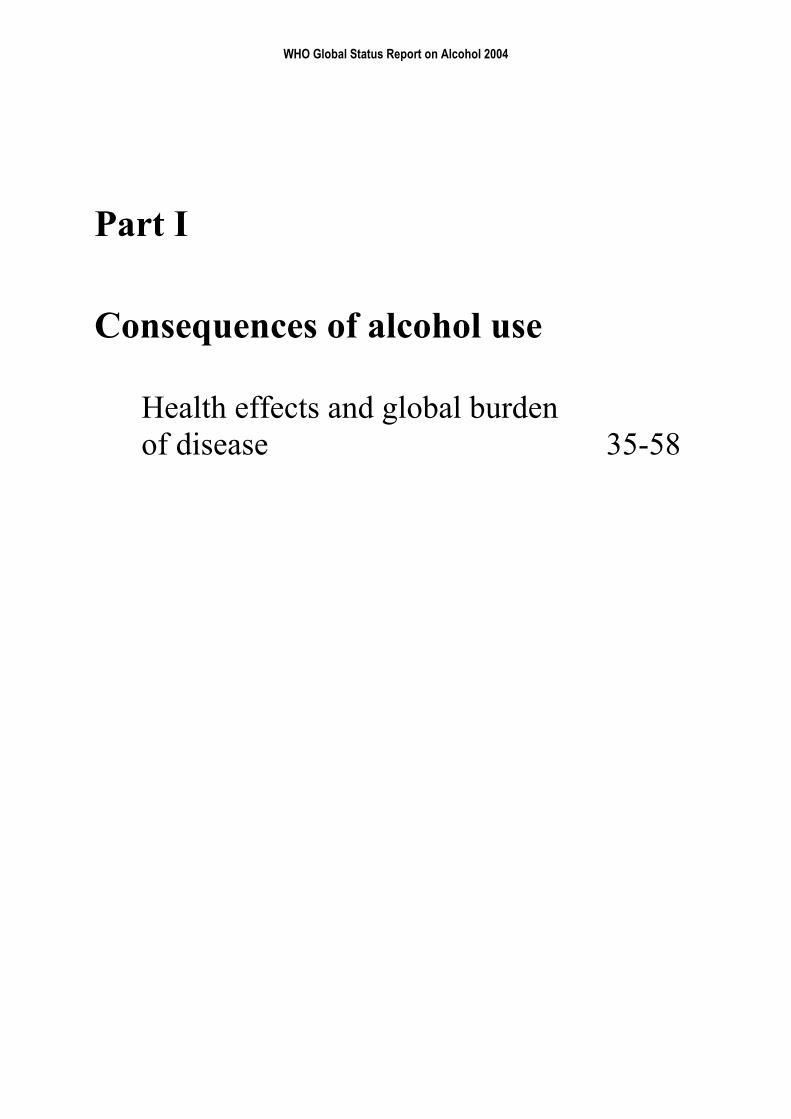
The link between alcohol consumption and consequences depends a) on the two main dimensions of alcohol consumption: average volume of consumption and patterns of drinking; and b) on the mediating mechanisms: biochemical effects, intoxication, and dependence (see Figure 4 for the main paths).
Figure 4: Model of alcohol consumption, mediating variables, and short-term and long-term consequences
* Independent of intoxication or dependence Source: Rehm et al. (2003c)
Direct biochemical effects of alcohol may influence chronic disease either in a beneficial (e.g., protection against blood clot formation of moderate consumption (Zakhari, 1997), which is protective for coronary heart disease) or harmful way (e.g., toxic effects on acinar cells triggering pancreatic damage (Apte, Wilson & Korsten, 1997). Intoxication is a
1 Social outcomes of alcohol are defined as changes that affect the social behaviour of individuals, or their interaction with partners and other family members, or their circumstances (Klingemann & Gmel, 2001). Social outcomes would include family problems, public disorder, or workplace problems. Social outcomes or consequences will not be addressed as part of this chapter unless they are part of the International Statistical Classification of Diseases and Related Health Problems (ICD). The majority of these problems are not covered by the ICD classification, even though health by WHO is defined in a broad way to include well-being. However, the quantification of such outcomes is difficult to derive and fraught by methodological difficulties. It is nevertheless important to note that social harm has a major impact on wellbeing, which may even exceed that from “quantifiable” diseases. For overviews see e.g. Klingeman and Gmel (2001) or Gmel and Rehm (2003).
Chronic disease
Accidents/Injuries
(acute disease)
Acute social consequences
Chronic social
IntoxicationToxic and benefical biochemical
effects * Dependence
Patterns of drinking Average volume
WHO Global Status Report on Alcohol 2004
36
powerful mediator mainly for acute outcomes, such as accidents, or intentional injuries or deaths, domestic conflict and violence (Klingemann & Gmel, 2001; Gmel & Rehm, 2003). Alcohol dependence is a powerful mechanism sustaining alcohol consumption and thus impacting on both chronic and acute consequences of alcohol (see Drummond, 1990), though it is also a consequence of drinking itself.
Total consumption or average volume of consumption has been historically the usual measure of exposure linking alcohol to disease (Bruun et al., 1975). Average volume of consumption as a risk factor is mainly linked to long-term consequences (WHO, 2000a). Acute effects of alcohol related to injury and death are much better predicted by patterns of drinking (Rehm et al., 1996; Bondy, 1996; Puddey et al., 1999), although there is also an association with volume of drinking. For example, the same overall average volume of alcohol can be consumed in small quantities regularly with meals (e.g. two drinks a day with meals) or in large quantities on few occasions (e.g. two bottles of wine on a single occasion every Friday). In other words, the impact of an average volume of consumption on mortality or morbidity is partly moderated by the way alcohol is consumed by the individual, which in turn is influenced by the social context (Room & Mäkelä, 2000). It should be noted that patterns of drinking have not only been linked to acute health outcomes such as injuries (Greenfield, 2001; Rossow, Pernanen & Rehm, 2001), but also to chronic diseases such as coronary heart disease (CHD) and especially sudden cardiac death (Britton & McKee, 2000; Chadwick & Goode, 1998; Puddey et al., 1999; Trevisan et al., 2001a; Trevisan et al., 2001b).
Thus, the variation of disease burden due to alcohol consumption across countries depends at least on two factors. First, it depends on the overall amount consumed in a country for which an indicator is per capita consumption. Per capita consumption of course is also influenced by the percentages of drinkers (or abstainers) in a country. Second, it depends on the way alcohol is consumed, e.g. regularly in moderate amounts with meals versus irregular in heavy drinking occasions often outside meals. Similarly, the distribution of alcohol related burden across diseases may vary widely across countries. At the risk of oversimplifying, chronic alcohol-related diseases predominantly depend on volume of drinking and should thus have a bigger share of the total burden in countries in which total per capita consumption is high, but the prevailing drinking pattern is a regular drinking pattern, whereas the share of acute consequences on the total burden should be higher in countries, where alcohol is commonly used more infrequently but often in high amounts when alcohol consumption takes place.
“Alcohol relatedness” varies across diseases. This is commonly expressed in alcohol attributable fractions (AAF). Some diseases or consequences are fully attributable to alcohol (e.g. the alcohol dependence syndrome), other consequences have a high alcohol attribution such as liver cirrhosis, for some consequences there are many other factors which may cause a disease, among which alcohol often plays one role, and thus the alcohol attributable part may be low. Low, however does not mean negligible. If 10% of all cases may be attributable to alcohol, for some highly prevalent diseases (e.g. breast cancer for women) the alcohol-related share may clearly outnumber diseases that are fully attributable to alcohol, but commonly rare. There are different ways to determine AAFs of diseases (for details see English et al., 1995). One is the indirect way, where relative risk estimates derived from meta-analyses are combined with country-specific disease prevalences to yield country-specific AAFs. The second is to use directly estimated AAFs, e.g. the percentage of traffic accidents where an involved person was tested positive for a blood alcohol concentration (BAC) exceeding a certain amount (e.g. 0.5 per mille). For most chronic diseases the indirect method is used. Behind this calculation stands the assumption that the mechanism for the development of a disease depend mainly on the consumed amount of alcohol and is therefore cross-culturally
WHO Global Status Report on Alcohol 2004
37
stable. Therefore, Relative Risks (RR) can be derived by meta-analytical pooling of epidemiologic studies across different countries and regions all over the world. Differences in AAFs across countries then depend mainly on the prevalence of consumption distribution, e.g. the prevalence of chronic heavy drinking.
For most acute diseases, however, AAFs should be derived directly, because they depend on the way alcohol is consumed, e.g. a drinking pattern of frequent drinking to intoxication. An example for consequences for which the AAF are commonly directly derived are road accidents for which an alcohol attributable fraction is based on whether the accident-responsible driver tested positive for alcohol and to what degree (e.g. at blood alcohol concentration BAC >0.05%).
Harmful effects of alcohol consumption excluding depression and coronary heart disease
Wholly alcohol-attributable diseases
A number of diseases are by definition fully attributable to alcohol (AAF = 1 or 100%). These are listed in Table 12
Table 12: Disease conditions which are by definition alcohol-related (attributable fraction of 1)
ICD-9 Disease
291 Alcoholic psychoses 303 Alcohol-dependence syndrome 305.0 Alcohol abuse 357.5 Alcoholic polyneuropathy 425.5 Alcoholic cardiomyopathy 535.3 Alcoholic gastritis 571.0–571.3 Alcoholic liver cirrhosis 790.3 Excess blood alcohol 980.0, 980.1 Ethanol and methanol toxicity Source: Rehm et al. (2003c)
Diseases with a contributory role
Cancer Oropharyngeal, oesophageal and liver cancers: Alcohol has consistently been related to the risk of cancer of the mouth (lip, tongue), pharynx, larynx, hypopharynx, oesophagus and liver (Corrao et al., 1999; English et al., 1995; Gurr, 1996; Single et al., 1999; US Department of Health and Human Services, 2000; WHO, 2000a). The relationship between average volume of alcohol consumption and cancer is usually characterized as almost monotonically increasing relative risks with increasing volume of drinking (Bagnardi et al., 2001).
Female breast cancer: Much research has been conducted over the last decade on breast cancer. Prior to 1995, it has most often been concluded that evidence of a causal relationship with alcohol was insufficient (English et al., 1995; Rosenberg, Metzger & Palmer, 1993;
WHO Global Status Report on Alcohol 2004
38
Schatzkin & Longnecker, 1994). However, recent studies and reviews have shown that not only hazardous or harmful drinking, but also even moderate alcohol consumption, can cause female breast cancer (Single et al., 1999). A meta-analysis by Smith-Warner et al. (1998) found a clear linear relationship over the whole continuum of consumption. Other original studies supported this finding (Bowlin et al., 1997; Corrao et al., 1999; Nasca et al., 1994; Royo-Bordonada et al., 1997; Swanson et al., 1997; van den Brandt, Goldbohm & van 't Veer, 1995; Wingo et al., 1997).
Cancers of the stomach, pancreas, colon, rectum, prostate, salivary glands, ovarium, endometrium, bladder: Many recent research projects have investigated whether these cancers are alcohol-related. Overall, evidence for a causal relationship between alcohol and cancer of the stomach, pancreas, colon, rectum, if any was found, was weak and inconclusive (Bode & Bode, 1997; Boutron et al., 1995; De Stefani et al., 1998; Gapstur, Potter & Folsom, 1994; Harnack et al., 1997; Ji et al., 1996 ; Longnecker & Enger, 1996; Lundberg & Passik, 1997; Piette, Barnett & Moos, 1998; Sarles, Bernard & Johnson, 1996; Seitz, Poschl & Simanowski, 1998; Seitz et al., 1998; Soler et al., 1998). A recent meta-analysis assessing the link between alcohol and various types of cancer showed that statistically significant increases in risk existed for cancers of the stomach, colon, rectum and ovaries (Bagnardi et al., 2001).
On prostate cancer, again most studies did not report observing an increased risk (Breslow & Weed, 1998; Ellison et al., 1998; Hiatt et al., 1994; Tavani et al., 1994), whereas two cohort studies (Ajani et al., 1998; Putnam et al., 1998) and one case–control study (Hayes et al., 1996) reported a small increased risk in men who consume even moderate amounts of alcohol.
It has been hypothesized that alcohol might constitute a risk factor for cancer of the major salivary glands (Horn-Ross, Ljung & Morrow, 1997; Muscat & Wynder, 1998), ovarium, endometrium (Bradley et al., 1998; Longnecker & Enger, 1996; Newcomb, Trentham-Dietz & Storer, 1997; Parazzini et al., 1995), and the bladder (Bruemmer et al., 1997; Donato et al., 1997; Longnecker & Enger, 1996; Yu et al., 1997). For each of these sites, results were either scarce or heterogeneous, or the effects, if any were found, not statistically significant. In sum, evidence for a causal relationship between alcohol and cancers of these sites so far has not produced consistent results, especially with regard to physiological pathways.
Overall, the risk relationship between alcohol and alcohol-related cancers can be characterized by an almost linear dose–response relationship between volume of drinking and the relative risk of outcome. Although there have been speculations about the impact of patterns of drinking, especially for breast cancer (Kohlmeier & Mendez, 1997), the current state of knowledge does not suggest that patterns of drinking play an important role in the etiology of cancer.2
Cardiovascular disease There is increasing research in the past decades about the role of alcohol as both a risk and protective factor for cardiovascular disease. Coronary heart disease and the protective role of alcohol has been the focus of most research and will be discussed in a separate point below. Most studies suggest that low-level consumption equally offers some protection against ischaemic stroke.
2 Part of this lack of an influence on patterns of cancer risk may be due to methodological reasons. Most epidemiological studies only measure volume of consumption and only model monotonically increasing trends and thus could not detect any influence of patterns of drinking even it were present.
WHO Global Status Report on Alcohol 2004
39
In contrast, hypertension and other cardiovascular disorders such as cardiac arrhythmias or heart failure are adversely affected by alcohol (see Friedman, 1998; Klatsky, 1995; Puddey et al., 1999; Rosenqvist, 1998; US Department of Health and Human Services, 1997; Wood et al., 1998). There are some indications that hypertension may be related to the pattern of heavy drinking occasions (Murray et al., 2002; Puddey et al., 1999; Wannamethee & Shaper, 1991).
For haemorrhagic stroke, the weight of evidence suggests an increase in risk for males even at low levels of consumption (Berger et al., 1999; Jackson, 1994; Sacco et al., 1999; You et al., 1997). For females the most recent meta-analyses of Ridolfo and Stevenson (2001) suggested a protective effect for drinking below 40 g pure ethanol per day, but an 8-fold increased risk for drinking above these limits. Patterns of drinking not only play a role in any protective effects of alcohol on CHD, drinking patterns are also relevant to risks of stroke (Hillbom, Juvela & Karttunen, 1998) and for sudden cardiovascular death or cardiovascular death in general (Kauhanen et al., 1997a; Kauhanen et al., 1997b; Kozarevic et al., 1982; Poikolainen, 1983; Wannamethee & Shaper, 1992) with heavy drinking occasions and intoxication resulting in increased risk.
Liver cirrhosis Alcohol has been estimated as the leading cause of liver cirrhosis in established market economies (Corrao et al., 1997; Corrao et al., 1998; English et al., 1995). There is some debate whether alcohol’s contributory role should be restricted to alcoholic liver cirrhosis alone or be extended to unspecified liver cirrhosis. Several authors contend that, empirically, it is extremely difficult to separate alcoholic from unspecified liver cirrhosis, and that the term “unspecified liver cirrhosis” is applied when no specific etiological factor is reported or identified (English et al., 1995). Research in the United States and in Central and South American countries indicated that an appreciable proportion of cirrhosis deaths without mention of alcohol was in fact attributable to alcohol (Haberman & Weinbaum, 1990; Puffer & Griffith, 1967; Room, 1972).
On the other hand, applying RRs of liver cirrhosis derived in established market economies to other countries can be extremely misleading. In many countries (e.g. China or India), liver cirrhosis is mainly caused by other factors such as viral infections. The corresponding AAFs have been shown to vary between less than 10% (China) and 90 % (Finland) (WHO, 2000a).
The relationship between alcohol consumption and liver cirrhosis seems to be mainly dependent on volume of drinking and independent of patterns of drinking (Lelbach, 1975; Lelbach, 1976). However, some research also indicates a potential effect of occasions of heavy drinking (Rhodés, Salaspuro & Sorensen, 1993).
Effects of prenatal alcohol exposure Alcohol consumption during pregnancy is related to various risks to the fetus, which include gross congenital anomalies and Fetal Alcohol Spectrum Disorders (FASD), which include conditions such as fetal alcohol syndrome (Alvear, Andreani & Cortes, 1998; Church et al., 1997; Faden, Graubard & Dufour, 1997; Habbick et al., 1997; Larkby & Day, 1997; Larroque & Kaminski, 1996; Mattson et al., 1997; Passaro & Little, 1997; Passaro et al., 1996; Polygenis et al., 1998; Roebuck, Mattson & Riley, 1998; Shu et al., 1995; Windham et al., 1995). FASD ranges from individual anomalies at one end and serious neurobiological dysfunctions, including mental retardation, on the other (Connor & Streissguth, 1996). The prenatal teratogenic effects of alcohol also include lethal consequences. They comprise spontaneous abortion, low birth weight, fetal damage, prematurity, and intrauterine growth retardation (Abel, 1997; Bradley et al., 1998; Windham et al., 1997).
WHO Global Status Report on Alcohol 2004
40
Mental conditions The co-morbidity of alcohol dependence with other mental conditions is high, both in clinical and in general population samples (e.g. Grant & Harford, 1995; Merikangas et al., 1998). The crucial question in this respect is about causation. Sufficient evidence for a causal role of alcohol consumption at this point of research appears to exist mainly for depression. Since this relationship is controversial it will be discussed below in a separate section.
Other chronic conditions Other risks of alcohol consumption currently discussed in the literature include epilepsy (see e.g. Jallon et al., 1998; Leone et al., 1997; Martín et al., 1995), acute and chronic pancreatitis (Ammann, Heitz & Klöppel, 1996; Skinazi, Lévy & Bernades, 1995; Damström Thakker, 1998; Robles-Diaz & Gorelick, 1997) and psoriasis (English et al., 1995).
Beneficial health effects of alcohol consumption excluding CHD
Ischaemic stroke Cerebrovascular disease (stroke) consists of several subtypes, the most common subtypes being ischaemic stroke and haemorrhagic stroke, which are affected differently by alcohol. For ischaemic stroke, the predominant type of stroke, the weight of evidence including biological mechanisms, suggests effects similar to those for CHD, namely that low to moderate consumption may offer some protection (Beilin, Puddey & Burke, 1996; Hillbom, 1998; Keil et al., 1997; Kitamura et al., 1998; Knuiman & Vu, 1996; Sacco et al., 1999; Thun et al., 1997; Yuan et al., 1997; Wannamethee & Shaper, 1996). Alcohol consumption has detrimental effects on haemorrhagic stroke.
Other beneficial health effects of alcohol consumption
Alcohol may offer some protection against diabetes and cholelithiasis (gallstones) (English et al., 1995; see also Ashley et al., 2000, for a recent overview on beneficial effects of alcohol). Findings from a cohort of more than 40 000 male health professionals showed that moderate alcohol consumption may decrease the risk of diabetes, perhaps through the effects of alcohol on insulin sensitivity (Rimm et al., 1995). The protective effect was further substantiated, mainly in studies in established market economies (Perry et al., 1995; Ajani et al., 1999), however there may be differential effects on men and women, and even detrimental effects at higher levels of intake (Wei et al., 2000; Kao et al., 1998). Plausible biological mechanisms were seen to exist in mediating effects of moderate alcohol intake on glucose tolerance and insulin resistance (Facchini, Chen & Reaven, 1994; Kiechl et al., 1996; Lazarus, Sparrow & Weiss, 1997; Flanagan et al., 2000).
With regard to cholelithiasis (gallstones) there is some evidence that alcohol may offer some protection against gallstones (English et al., 1995; Holman et al., 1996). These findings have been substantiated by recent large-scale cohort and case-control studies, which reported an inverse relationship (Attili et al., 1998; Caroli-Bosc et al., 1998; Chen et al., 1999; Leitzmann et al., 1998).
WHO Global Status Report on Alcohol 2004
41
Table 13 gives an overview of diseases on which alcohol potentially has beneficial effects.
Table 13: Relative risks for beneficial alcohol-related health effects for different drinking categories (compared to abstainers)
Disease ICD-9 RR Drinking category I Drinking category II Drinking category III F M F M F M
Diabetes 250 0.92 0.99 0.87 0.57 1.13 0.73 Ischaemic stroke 433-435 0.52 0.94 0.64 1.33 1.06 1.65 Cholelithiasis 574 0.82 0.82 0.68 0.68 0.50 0.50
Source: Gutjahr, Gmel & Rehm (2001), Ridolfo & Stevenson (2001); Rehm et al. (in press). Definition of drinking categories: category I: for females not exceeding on average 0 to 19.99 g pure alcohol per day; for males not exceeding on average 0 to 39.99 g pure alcohol per day; category II: for females not exceeding on average 20 to 39.99 g pure alcohol per day; for males not exceeding on average 40 to 59.99 g pure alcohol per day; category III: for females on average 40 g pure alcohol and above per day; for males on average 60 g pure alcohol and above per day. For comparison: a 75 cl. bottle of wine contains about 70 g of pure alcohol.
CHD as a chronic condition where alcohol has harmful and beneficial consequences
Coronary heart disease3 is one of the leading causes of death in the world (Murray & Lopez, 1996a). The most important health benefits of alcohol have been found in the area of coronary heart disease at low to moderate levels of average volume of alcohol consumption (Beaglehole & Jackson, 1992; Doll, 1998; Edwards et al., 1994; Fuchs et al., 1995; Goldberg, Hahn & Parkes, 1995; Hillbom, 1998; Holman et al., 1996; Jackson, 1994; Rehm et al., 1997; Single et al., 1999; Svärdsudd, 1998). Only a few individual-level studies have failed to substantiate this association in men (Hart et al., 1999) or women (Fillmore et al., 1998; Maskarinec, Meng & Kolonel, 1998).
While some studies have found that alcohol may offer protection against CHD not only at low to moderate average intake, but across the continuum of alcohol consumption (Camargo et al., 1997; Doll et al., 1994; Keil et al., 1997), they nevertheless show that most of the protective effect is gained at low levels of consumption such as one drink every other day. The common assumption nowadays is that – at least in established market economies - average volume of drinking and CHD shows a J-shape relationship (Corrao et al., 2000), with detrimental effects compared with abstainers at higher levels of alcohol intake. The epidemiological evidence that light to moderate average alcohol consumption protects against CHD is strengthened by substantial evidence concerning the biological mechanisms by which a protective effect could be mediated:
Favourable lipid profiles, especially an increase in high-density lipoproteins (HDL) (Baraona & Lieber, 1998). It has been estimated that as much as 40%–50% of the protective effect may be attributable to this mechanism (Criqui et al., 1987; Criqui & Ringek, 1994; Shu et al., 1992).
Favourable effects on coagulation profiles, in particular, through its effects on platelet aggregation (McKenzie & Eisenberg, 1996; Rubin, 1999) and fibrinolysis (Reeder et al., 1996).
3 CHD is used here for denoting all diseases with ICD 9 rubrics 410–414 (ICD 10: I20–I25). The same categories have also been labelled ischaemic heart disease (IHD).
WHO Global Status Report on Alcohol 2004
42
Favourable effects on insulin resistance (Kiechl et al., 1996; Lazarus, Sparrow & Weiss, 1997; Rankin, 1994).
Favourable effects on hormonal profiles, in particular, its estrogen effects (Svärdsudd, 1998).
Alcohol metabolite acetate has been postulated to protect against CHD by promoting vasodilation (US Department of Health and Human Services, 1997).
Alcohol may affect inflammation (Imhof et al., 2001; Jacques et al., 2001; Morrow & Ridker, 2000; Ridker, 2001).
Finally, it is possible that some of the protective effects are mediated through the anti-oxidative constituents of alcohol beverages, especially wine (Reinke & McKay, 1996). However, most of the protective effect appears to be linked to ethanol, per se. In sum, the relationship between average volume of drinking and CHD seems to be J-shaped. Light to moderate drinking is associated with a lower CHD risk than abstaining or heavy drinking. However, the studies on average volume of consumption and CHD are heterogeneous, indicating that factors other than the ones included in the study co-determine the relationship. One of the main factors is pattern of drinking (i.e. the way in which the same average amount of alcohol is consumed). In this respect two patterns deserve mentioning: irregular heavy drinking occasions and drinking with meals.
As regards heavy drinking occasions, several studies showed that for the same volume consumed (i.e. adjusting for volume in multiple regression models) heavy drinking occasions (e.g. eight drinks in one sitting) have detrimental effects on CHD (McElduff & Dobson, 1997; Murray et al., 2002; Trevisan et al., 2001a).
In addition to the effect on CHD, there appears to be a relationship between irregular heavy drinking occasions and other forms of cardiovascular death, especially sudden cardiac death (Kauhanen et al., 1997b; Wannamethee & Shaper, 1992; Wood et al., 1998). This is consistent with the physiological mechanisms of increased clotting and reducing the threshold for ventricular fibrillation after heavy drinking occasions, which have been reviewed by McKee and Britton (1998). Specifically, heavy drinking occasions have been shown to increase low-density lipoproteins, which in turn have been linked to negative cardiovascular outcomes. Contrary to low or moderate steady drinking, heavy irregular drinking occasions are not associated with an increase of high-density lipoproteins, which themselves have been linked to favourable cardiovascular outcomes. In addition, irregular drinking is associated with increased risk of thrombosis, occurring after cessation of drinking (Renaud & Ruf, 1996). Finally, irregular heavy drinking seems to predispose to histological changes in the myocardium and conducting system, as well as to a reduction in the threshold for ventricular fibrillation. In sum, irregular heavy drinking occasions are mainly associated with physiological mechanisms increasing the risk of sudden cardiac death and other cardiovascular outcomes, in contrast to the physiological mechanisms triggered by steady low to moderate consumption and linked to favourable cardiac outcomes.
With respect to drinking with meals, Trevisan and colleagues (2001a; 2001b) reported more protective effects of alcohol consumption when it was predominately consumed with meals compared to alcohol consumption outside meals.
The potential mechanisms linking consumption of alcoholic beverages with meals to a lower CHD risk, remain to be fully clarified. Mechanisms may be the reduced postprandial blood pressure (Foppa et al., 1999), positive effects on fibrinolysis (Hendriks et al., 1994) and lipids
WHO Global Status Report on Alcohol 2004
43
(Veenstra et al., 1990), and an increased alcohol elimination rate or a reduced alcohol absorption rate with food in the gastrointestinal tract (Gentry, 2000; Ramchandani, Kwo & Li, 2001). Several studies - mainly conducted at the aggregate level - showed that cultural drinking patterns are related to differential effects of volume on CHD mortality and morbidity. Most of them were either related to drastic changes in alcohol consumption and CHD mortality connected with the anti-alcohol campaign of the last years of the Soviet Union (Shkolnikov & Nemtsov, 1997; Bobak & Marmot, 1999; Britton & McKee, 2000; Leon et al., 1997; McKee, Shkolnikov & Leon, 2001; Notzon et al., 1998; Shkolnikov, McKee & Leon, 2001). Another indirect line of research on the effect of heavy drinking on CHD shows that countries with a tradition of heavier or binge-drinking occasions on weekends show proportionately high CHD or cardiovascular disease morality on or immediately after the weekend [Germany: CHD, (Willich et al., 1994); Moscow, Russian Federation: cardiovascular disease events, (Chenet et al., 1998); Lithuania: CHD events, (Chenet et al., 2001); Scotland: CHD events (cf. Evans et al., 2000)]. Finally, in the Global Burden of Disease (GBD) 2000 study, the moderating effect of drinking patterns on CHD could be demonstrated (Gmel, Rehm & Frick, 2003; Rehm et al., in press).
Depression
Alcohol is implicated in a variety of mental disorders which are not alcohol-specific. However, before the GBD 2000 study no major overview on alcohol-attributable burden of disease has included these conditions (English et al., 1995; Gutjahr, Gmel & Rehm, 2001; Rehm & Gmel, 2001; Ridolfo & Stevenson, 2001; Single et al., 1999). While the causality of the relation is hard to define, sufficient evidence now exists to assume alcohol’s causal role in depression, a common mental disorder.
In the general population, alcohol dependence and major depression co-occur over-proportionally, on both a 12-month and a lifetime basis (Kessler et al., 1996; Kessler et al., 1997; Lynskey, 1998). Among alcohol consumers in the general population, higher volume of consumption is associated with more symptoms of depression (Graham & Schmidt, 1999; Mehrabian, 2001; Rodgers et al., 2000). Among patients in treatment for alcohol abuse and dependence, the prevalence of major depression is higher than in the general population (Lynskey, 1998; Schuckit et al., 1997). Higher prevalence of alcohol use disorders has been documented for patients in treatment for depression (Alpert et al., 1999; Blixen, McDougall & Suen, 1997).
This suggests that alcohol use disorders are linked to depressive symptoms, and that alcohol dependence and depressive disorders co-occur to a larger degree than expected by chance. However, it is not clear in the individual case whether the depression caused alcohol problems, whether the alcohol consumption or alcohol problems caused depression, or whether both could be attributed to a third cause (Vaillant, 1993). The pathway from depression to harmful alcohol use and alcohol dependence has long been discussed under the heading of self-medication (i.e. the use of alcohol to alleviate depressive symptoms). In addition, a shared third cause could be certain neurobiological mechanisms (see Markou, Kosten & Koob, 1998) or genetic predisposition. To be a causal factor, one condition is that alcohol use disorders must precede depression, i.e. only that fraction of depression can logically be caused by alcohol dependence where the onset of dependence preceded the onset of depression. Such fractions can be found in many countries (see data of the International Consortium in Psychiatric Epidemiology (ICPE), Merikangas et al., 1998). Commonly, proportions of depressive disorders, which are preceded by alcohol dependence, were higher
WHO Global Status Report on Alcohol 2004
44
for males than for females. This corresponds to the higher prevalence rates of alcohol dependence in men. In fact, the proportion of depressive disorders and alcohol dependence rates correlate to about 0.80 (Rehm et al., in press; Rehm & Eschmann, 2002). Besides strength of association (commonly two-fold to three-fold increase in risk of depressive disorders have been found, e.g. Schuckit, 1996; Swendsen et al., 1998; Hilarski & Wodarki, 2001), reversibility (remission during abstinence) is a key indicator for causal effect of alcohol dependence on depressive disorders. There is sufficient evidence that abstinence substantially removes depressive symptoms in alcohol dependent persons within a short time frame (Brown & Schuckit, 1988; Dackis et al., 1986; Davidson, 1995; Gibson & Becker, 1973; Penick et al., 1988; Pettinati, Sugerman & Maurer, 1982; Willenbring, 1986).
The evidence indicates that a clear and consistent association exists between alcohol dependence and depressive disorders and that chance, confounding variables and other bias can be ruled out with reasonable confidence as factors in this association.
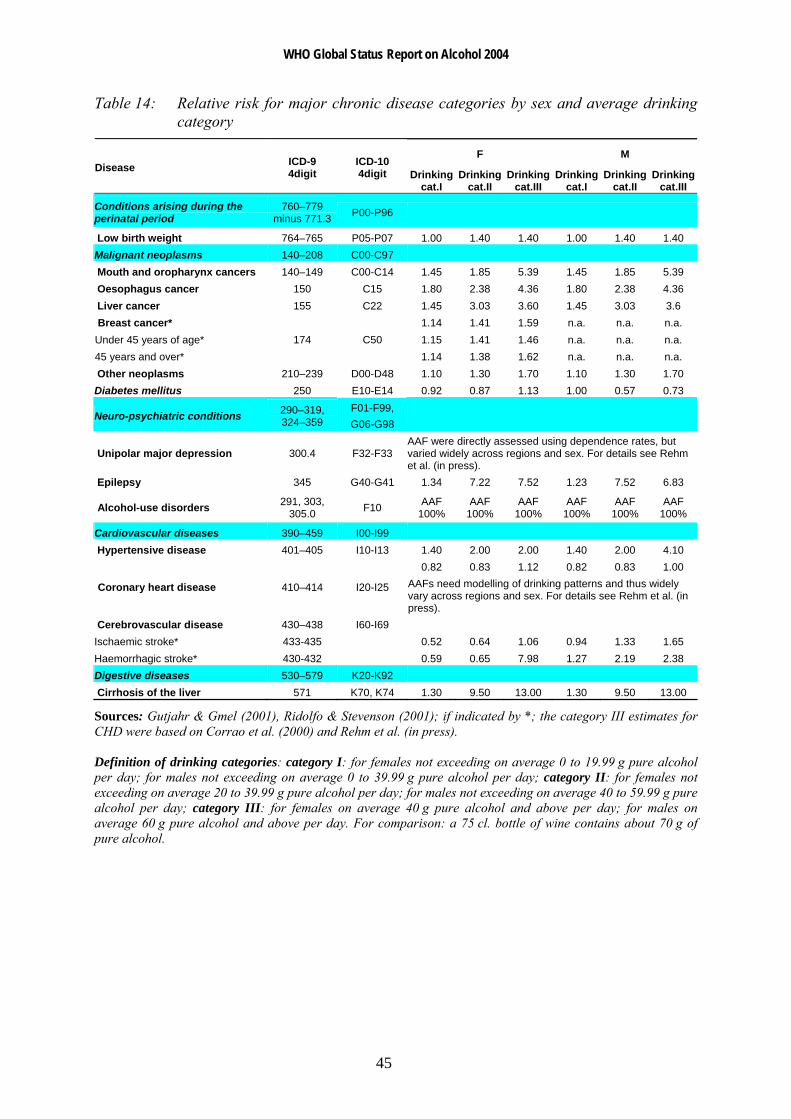
Summary on diseases related mainly to chronic alcohol consumption
Table 14 gives an overview of relative risks of major chronic diseases related to alcohol consumption.
WHO Global Status Report on Alcohol 2004
45
Table 14: Relative risk for major chronic disease categories by sex and average drinking category
F M Disease ICD-9
4digit ICD-10 4digit Drinking
cat.I Drinking
cat.II Drinking
cat.III Drinking
cat.I Drinking
cat.II Drinking
cat.III
Conditions arising during the perinatal period
760–779 minus 771.3 P00-P96
Low birth weight 764–765 P05-P07 1.00 1.40 1.40 1.00 1.40 1.40 Malignant neoplasms 140–208 C00-C97 Mouth and oropharynx cancers 140–149 C00-C14 1.45 1.85 5.39 1.45 1.85 5.39 Oesophagus cancer 150 C15 1.80 2.38 4.36 1.80 2.38 4.36 Liver cancer 155 C22 1.45 3.03 3.60 1.45 3.03 3.6 Breast cancer* 1.14 1.41 1.59 n.a. n.a. n.a. Under 45 years of age* 1.15 1.41 1.46 n.a. n.a. n.a. 45 years and over*
174 C50 1.14 1.38 1.62 n.a. n.a. n.a.
Other neoplasms 210–239 D00-D48 1.10 1.30 1.70 1.10 1.30 1.70 Diabetes mellitus 250 E10-E14 0.92 0.87 1.13 1.00 0.57 0.73
Neuro-psychiatric conditions 290–319, 324–359
F01-F99, G06-G98
Unipolar major depression 300.4 F32-F33 AAF were directly assessed using dependence rates, but varied widely across regions and sex. For details see Rehm et al. (in press).
Epilepsy 345 G40-G41 1.34 7.22 7.52 1.23 7.52 6.83
Alcohol-use disorders 291, 303, 305.0 F10 AAF
100% AAF
100% AAF
100% AAF
100% AAF
100% AAF
100%
Cardiovascular diseases 390–459 I00-I99 Hypertensive disease 401–405 I10-I13 1.40 2.00 2.00 1.40 2.00 4.10
0.82 0.83 1.12 0.82 0.83 1.00
Coronary heart disease 410–414 I20-I25 AAFs need modelling of drinking patterns and thus widely vary across regions and sex. For details see Rehm et al. (in press).
Cerebrovascular disease 430–438 I60-I69 Ischaemic stroke* 433-435 0.52 0.64 1.06 0.94 1.33 1.65 Haemorrhagic stroke* 430-432 0.59 0.65 7.98 1.27 2.19 2.38 Digestive diseases 530–579 K20-K92 Cirrhosis of the liver 571 K70, K74 1.30 9.50 13.00 1.30 9.50 13.00
Sources: Gutjahr & Gmel (2001), Ridolfo & Stevenson (2001); if indicated by *; the category III estimates for CHD were based on Corrao et al. (2000) and Rehm et al. (in press). Definition of drinking categories: category I: for females not exceeding on average 0 to 19.99 g pure alcohol per day; for males not exceeding on average 0 to 39.99 g pure alcohol per day; category II: for females not exceeding on average 20 to 39.99 g pure alcohol per day; for males not exceeding on average 40 to 59.99 g pure alcohol per day; category III: for females on average 40 g pure alcohol and above per day; for males on average 60 g pure alcohol and above per day. For comparison: a 75 cl. bottle of wine contains about 70 g of pure alcohol.
WHO Global Status Report on Alcohol 2004
46
Acute adverse health consequences: accidental injury and poisoning, suicide, interpersonal violence and assaults
Alcohol use has been associated with increased risk of injury in a wide variety of settings including road traffic accident (vehicles, bicycles, pedestrians), falls, fires, injuries related to sports and recreational activities, self-inflicted injuries or injuries resulting from interpersonal violence (Cherpitel, 1992; Freedland, McMicken & D'Onofrio, 1993; Hingson & Howland, 1987; Hingson & Howland, 1993; Hurst, Harte & Firth, 1994; Martin, 1992; Martin & Bachman, 1997; US Department of Health and Human Services, 1997; US Department of Health and Human Services, 2000). There is also some evidence that the presence of alcohol in the body at the time of injury may be associated with greater severity of injury and less positive outcomes (Fuller, 1995; Li et al., 1997).
Unintentional injuries
Alcohol consumption produces effects that are often perceived as positive, as evidenced by the widespread popularity of drinking. But it also leads to actions that result in unintentional injury and death. This section highlights research findings on causality of alcohol involvement and findings relevant to establishing dose–response relationships and drinking patterns. It focuses on traffic injuries, as most of the research has been conducted in this area, and traffic accidents are the most important component of unintentional injuries (Rehm et al., 2003a).
Studies relating average volume of drinking to risk of injury have found the risk of injury to be positively related to increasing average intake levels of alcohol, with the risk increasing at relatively low volumes of intake (Cherpitel et al., 1995). Several patterns of drinking have been related to injury risk. Frequent heavy drinking and frequent subjective drunkenness are both associated with injury, particularly injury resulting from violence (Cherpitel, 1996). Often, the greatest risk was found in individuals who consume relatively large amounts on some occasions, and whose highest amounts are markedly greater than their average amount per occasion (Gruenewald & Nephew, 1994; Gruenewald, Mitchell & Treno, 1996; Gruenewald, Treno & Mitchell, 1996; Treno, Gruenewald & Ponicki, 1997; Treno & Holder, 1997). This was also confirmed in a statistically adequate re-analysis of the Grand Rapids study, that indicates that though all levels of BAC are associated with an increased risk of crashes, relative to a BAC of zero, the risk slope was accelerated for less frequent drinkers (Hurst, Harte & Firth, 1994).
There are clear biological mechanisms why alcohol is related to injury. Moderate doses of alcohol have been demonstrated in controlled experimental studies to have cognitive and psychomotor effects that are relevant to the risk of injury, such as reaction time, cognitive processing, coordination and vigilance (Eckhardt et al., 1998; Krüger et al., 1993; Moskowitz & Robinson, 1988; US Department of Health and Human Services, 1997). The comprehensive recent review by Eckardt and colleagues (1998) concluded that the threshold dose for negative effects on psychomotor tasks is generally found at around 40 to 50 mg% (equivalent to 0.04%–0.05%).
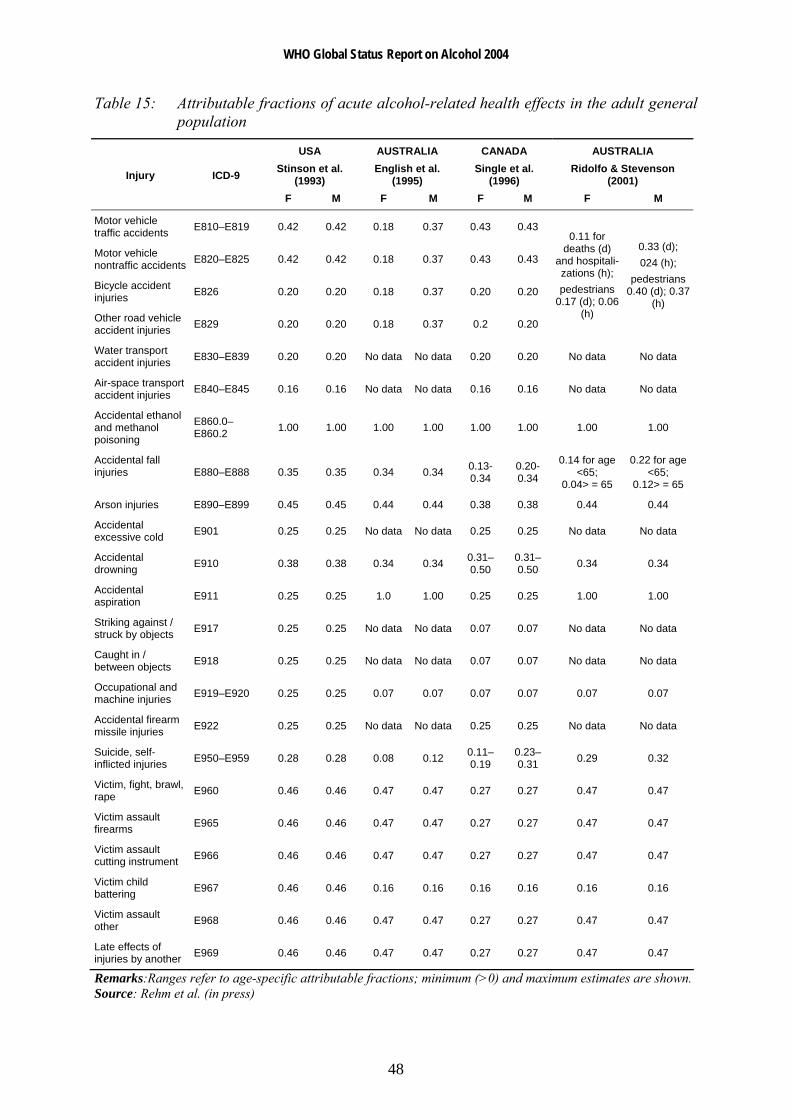
In summary, the evidence indicates that the amount consumed per occasion, and more specifically blood alcohol content, is the critical feature in determining risk of injury. Table 15 gives the attributable fractions for alcohol for different kinds of injuries in four recent reviews. The reviews based their estimates on meta-analyses or other summaries of the
WHO Global Status Report on Alcohol 2004
47
relations found in published studies. It should be recognized that, while there are many such studies, they are mostly from a relatively small range of countries, mostly from established market economies. Hence, such estimates cannot necessarily be projected to other countries with different patterns of drinking and different average volumes of drinking.
Intentional injuries
Alcohol is strongly associated with violent crime (Graham & West, 2001), although this association varies considerably across settings (Murdoch, Pihl & Ross, 1990; Room & Rossow (2001), Rossow, Pernanen & Rehm, 2001). Studies on violence have repeatedly shown that alcohol consumption precedes violent events, and that the amount of drinking is related to severity of subsequent violence. Based on meta-analyses of experimental studies there appears to be a small effect size of about 0.22 (Bushman, 1997) in the overall relationship between alcohol consumption and aggression. However, experimental research was not able to attribute effects on aggression to pharmacological effects only. Specific expectations of consumers as regards the effects of alcohol must accompany alcohol consumption to result in aggression (Gmel & Rehm, 2003). The general conclusion is that expectations form part of the “psycho-pharmacological” effects of alcohol (Bushman, 1997; Graham et al., 1998), and should not be separated in attempting to understand the effects of alcohol.
There are a number of different effects of alcohol contributing to increased likelihood of aggressive behaviour. Alcohol may have an effect on the serotonin (5HT) and GABA brain receptors that may reduce fear and anxiety about social, physical or legal consequences of one’s actions. Alcohol also affects cognitive functioning (Peterson et al., 1990), leading to impaired problem solving in conflict situations (Sayette, Wilson & Elias, 1993) and overly emotional responses or emotional ability (Pihl, Peterson & Lau, 1993). Other behavioural and attitudinal effects of alcohol related to aggression have been identified, although at this point not necessarily linked to particular pharmacological effects on the brain. These include a narrow and tenacious focus on the present (Graham, West & Wells, 2000; Washburne, 1956), also described as “alcohol myopia” (Steele & Josephs, 1990), and increased concerns with demonstrating personal power, at least for men (Graham, West & Wells, 2000; McClelland et al., 1972; Tomsen, 1997).
Estimating the proportion of alcohol induced intentional injuries is problematic and needs assessment from different sources, such as time-series analyses, natural experiments, case–control studies, emergency-room studies, general population surveys, and experimental designs (Pernanen, 2001). For details of a potential approach, using volume of drinking and drinking patterns in a cross-cultural approach see Rehm et al. (in press).
WHO Global Status Report on Alcohol 2004
48
Table 15: Attributable fractions of acute alcohol-related health effects in the adult general population
USA Stinson et al.
(1993)
AUSTRALIA English et al.
(1995)
CANADA Single et al.
(1996)
AUSTRALIA Ridolfo & Stevenson
(2001) Injury ICD-9
F M F M F M F M
Motor vehicle traffic accidents E810–E819 0.42 0.42 0.18 0.37 0.43 0.43
Motor vehicle nontraffic accidents E820–E825 0.42 0.42 0.18 0.37 0.43 0.43
Bicycle accident injuries E826 0.20 0.20 0.18 0.37 0.20 0.20
Other road vehicle accident injuries E829 0.20 0.20 0.18 0.37 0.2 0.20
0.11 for deaths (d)
and hospitali-zations (h); pedestrians
0.17 (d); 0.06 (h)
0.33 (d); 024 (h);
pedestrians 0.40 (d); 0.37
(h)
Water transport accident injuries E830–E839 0.20 0.20 No data No data 0.20 0.20 No data No data
Air-space transport accident injuries E840–E845 0.16 0.16 No data No data 0.16 0.16 No data No data
Accidental ethanol and methanol poisoning
E860.0–E860.2 1.00 1.00 1.00 1.00 1.00 1.00 1.00 1.00
Accidental fall injuries E880–E888 0.35 0.35 0.34 0.34 0.13-
0.34 0.20-0.34
0.14 for age <65;
0.04> = 65
0.22 for age <65;
0.12> = 65
Arson injuries E890–E899 0.45 0.45 0.44 0.44 0.38 0.38 0.44 0.44
Accidental excessive cold E901 0.25 0.25 No data No data 0.25 0.25 No data No data
Accidental drowning E910 0.38 0.38 0.34 0.34 0.31–
0.50 0.31–0.50 0.34 0.34
Accidental aspiration E911 0.25 0.25 1.0 1.00 0.25 0.25 1.00 1.00
Striking against / struck by objects E917 0.25 0.25 No data No data 0.07 0.07 No data No data
Caught in / between objects E918 0.25 0.25 No data No data 0.07 0.07 No data No data
Occupational and machine injuries E919–E920 0.25 0.25 0.07 0.07 0.07 0.07 0.07 0.07
Accidental firearm missile injuries E922 0.25 0.25 No data No data 0.25 0.25 No data No data
Suicide, self-inflicted injuries E950–E959 0.28 0.28 0.08 0.12 0.11–
0.19 0.23–0.31 0.29 0.32
Victim, fight, brawl, rape E960 0.46 0.46 0.47 0.47 0.27 0.27 0.47 0.47
Victim assault firearms E965 0.46 0.46 0.47 0.47 0.27 0.27 0.47 0.47
Victim assault cutting instrument E966 0.46 0.46 0.47 0.47 0.27 0.27 0.47 0.47
Victim child battering E967 0.46 0.46 0.16 0.16 0.16 0.16 0.16 0.16
Victim assault other E968 0.46 0.46 0.47 0.47 0.27 0.27 0.47 0.47
Late effects of injuries by another E969 0.46 0.46 0.47 0.47 0.27 0.27 0.47 0.47
Remarks:Ranges refer to age-specific attributable fractions; minimum (>0) and maximum estimates are shown. Source: Rehm et al. (in press)
WHO Global Status Report on Alcohol 2004
49
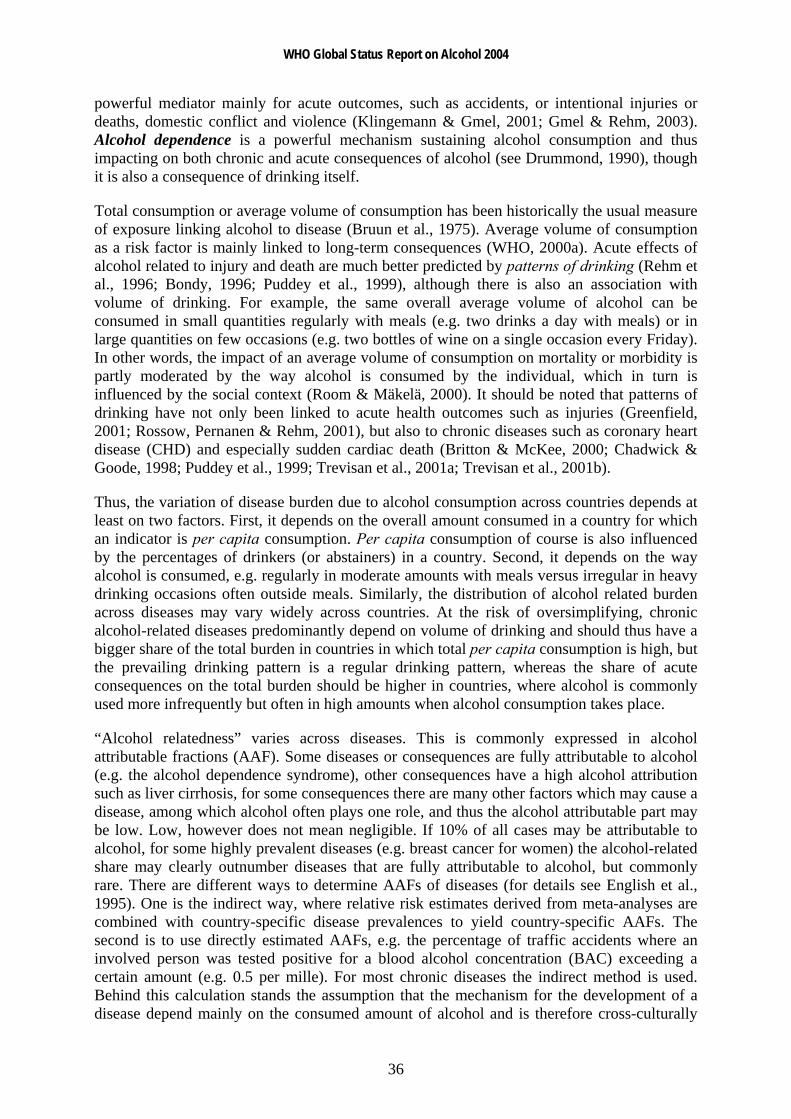
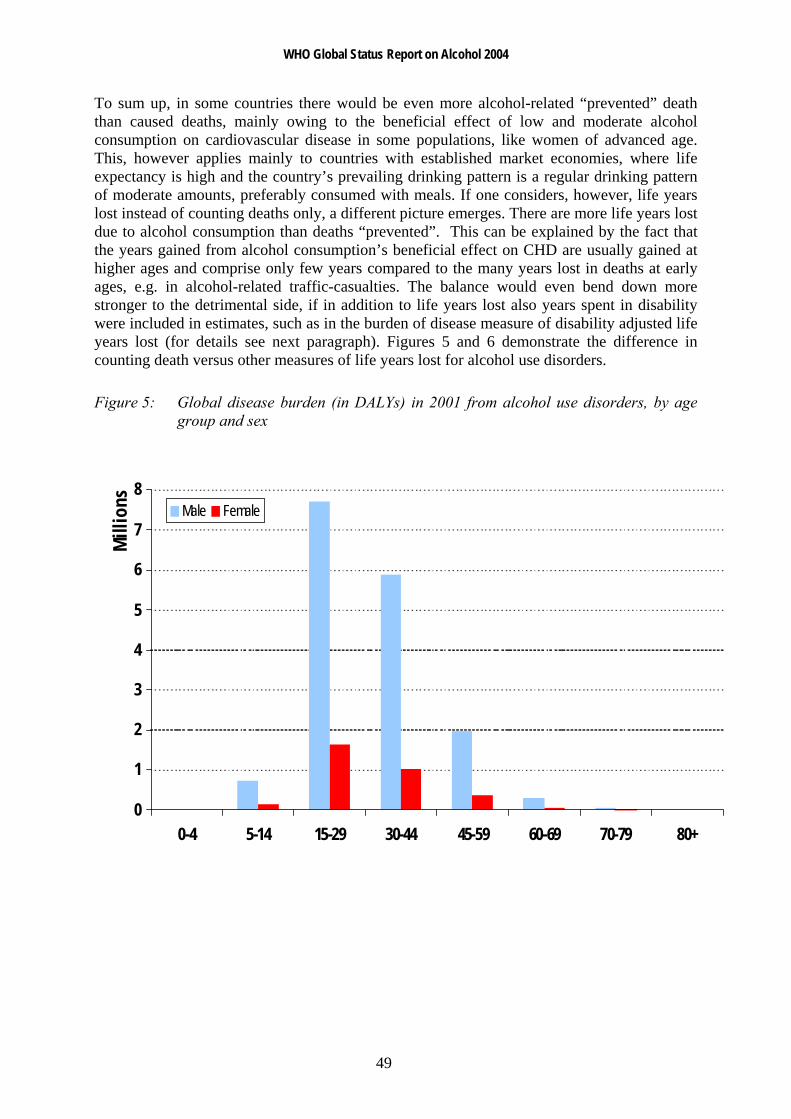
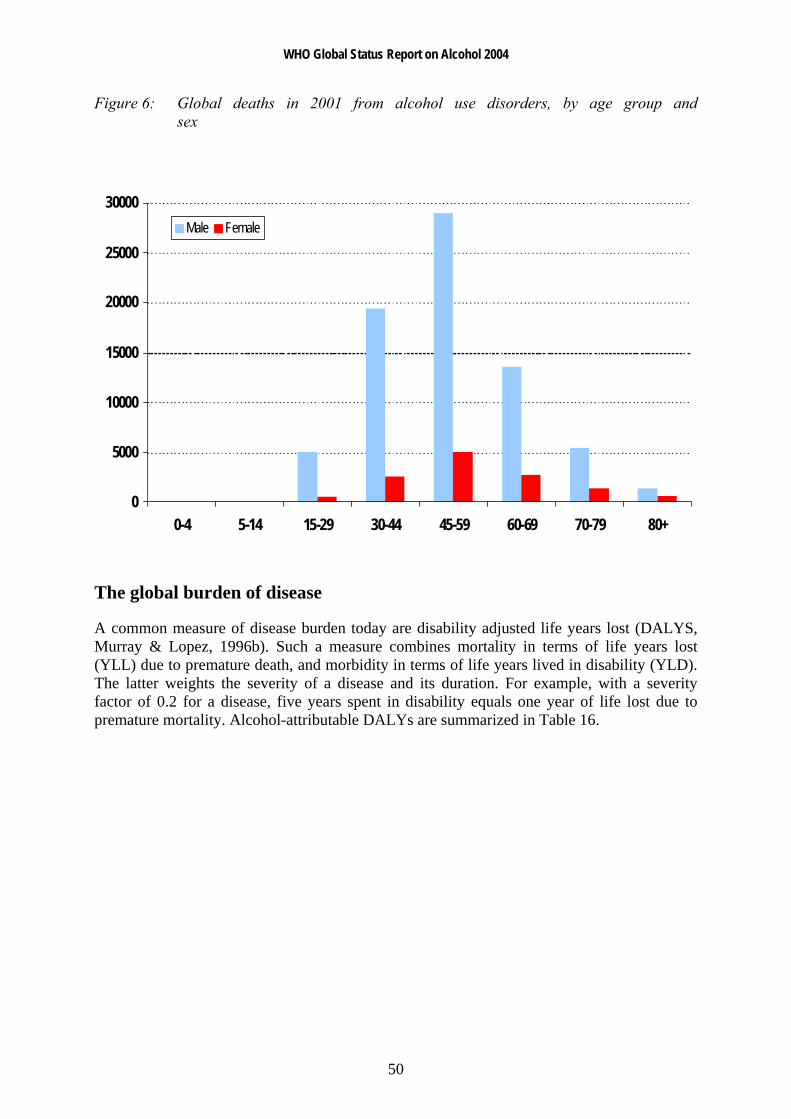
To sum up, in some countries there would be even more alcohol-related “prevented” death than caused deaths, mainly owing to the beneficial effect of low and moderate alcohol consumption on cardiovascular disease in some populations, like women of advanced age. This, however applies mainly to countries with established market economies, where life expectancy is high and the country’s prevailing drinking pattern is a regular drinking pattern of moderate amounts, preferably consumed with meals. If one considers, however, life years lost instead of counting deaths only, a different picture emerges. There are more life years lost due to alcohol consumption than deaths “prevented”. This can be explained by the fact that the years gained from alcohol consumption’s beneficial effect on CHD are usually gained at higher ages and comprise only few years compared to the many years lost in deaths at early ages, e.g. in alcohol-related traffic-casualties. The balance would even bend down more stronger to the detrimental side, if in addition to life years lost also years spent in disability were included in estimates, such as in the burden of disease measure of disability adjusted life years lost (for details see next paragraph). Figures 5 and 6 demonstrate the difference in counting death versus other measures of life years lost for alcohol use disorders.
Figure 5: Global disease burden (in DALYs) in 2001 from alcohol use disorders, by age group and sex
0
1
2
3
4
5
6
7
8
0-4 5-14 15-29 30-44 45-59 60-69 70-79 80+
Mill
ions Male Female
WHO Global Status Report on Alcohol 2004
50
Figure 6: Global deaths in 2001 from alcohol use disorders, by age group and sex
0
5000
10000
15000
20000
25000
30000
0-4 5-14 15-29 30-44 45-59 60-69 70-79 80+
Male Female
The global burden of disease
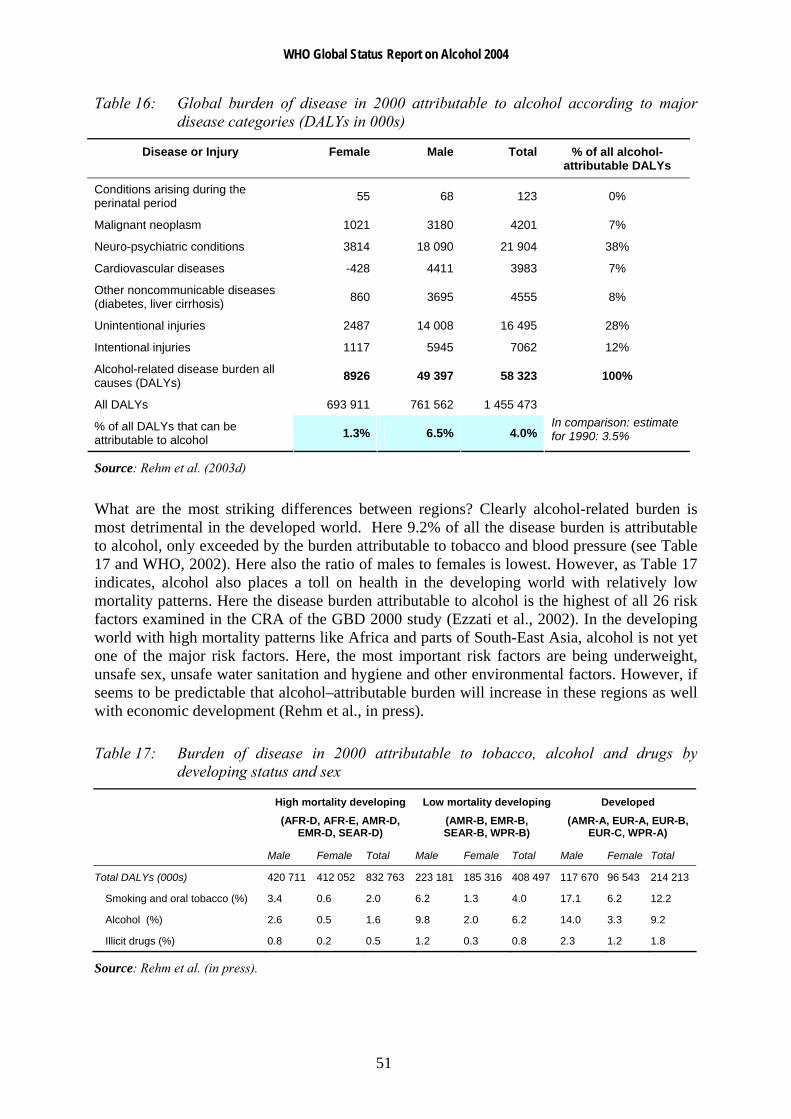
A common measure of disease burden today are disability adjusted life years lost (DALYS, Murray & Lopez, 1996b). Such a measure combines mortality in terms of life years lost (YLL) due to premature death, and morbidity in terms of life years lived in disability (YLD). The latter weights the severity of a disease and its duration. For example, with a severity factor of 0.2 for a disease, five years spent in disability equals one year of life lost due to premature mortality. Alcohol-attributable DALYs are summarized in Table 16.
WHO Global Status Report on Alcohol 2004
51
Table 16: Global burden of disease in 2000 attributable to alcohol according to major disease categories (DALYs in 000s)
Disease or Injury Female Male Total % of all alcohol-attributable DALYs
Conditions arising during the perinatal period 55 68 123 0%
Malignant neoplasm 1021 3180 4201 7%
Neuro-psychiatric conditions 3814 18 090 21 904 38%
Cardiovascular diseases -428 4411 3983 7%
Other noncommunicable diseases (diabetes, liver cirrhosis) 860 3695 4555 8%
Unintentional injuries 2487 14 008 16 495 28%
Intentional injuries 1117 5945 7062 12%
Alcohol-related disease burden all causes (DALYs) 8926 49 397 58 323 100%
All DALYs 693 911 761 562 1 455 473
% of all DALYs that can be attributable to alcohol 1.3% 6.5% 4.0%
In comparison: estimate for 1990: 3.5%
Source: Rehm et al. (2003d)
What are the most striking differences between regions? Clearly alcohol-related burden is most detrimental in the developed world. Here 9.2% of all the disease burden is attributable to alcohol, only exceeded by the burden attributable to tobacco and blood pressure (see Table 17 and WHO, 2002). Here also the ratio of males to females is lowest. However, as Table 17 indicates, alcohol also places a toll on health in the developing world with relatively low mortality patterns. Here the disease burden attributable to alcohol is the highest of all 26 risk factors examined in the CRA of the GBD 2000 study (Ezzati et al., 2002). In the developing world with high mortality patterns like Africa and parts of South-East Asia, alcohol is not yet one of the major risk factors. Here, the most important risk factors are being underweight, unsafe sex, unsafe water sanitation and hygiene and other environmental factors. However, if seems to be predictable that alcohol–attributable burden will increase in these regions as well with economic development (Rehm et al., in press).
Table 17: Burden of disease in 2000 attributable to tobacco, alcohol and drugs by developing status and sex
High mortality developing Low mortality developing Developed
(AFR-D, AFR-E, AMR-D, EMR-D, SEAR-D)
(AMR-B, EMR-B, SEAR-B, WPR-B)
(AMR-A, EUR-A, EUR-B,EUR-C, WPR-A)
Male Female Total Male Female Total Male Female Total
Total DALYs (000s) 420 711 412 052 832 763 223 181 185 316 408 497 117 670 96 543 214 213
Smoking and oral tobacco (%) 3.4 0.6 2.0 6.2 1.3 4.0 17.1 6.2 12.2
Alcohol (%) 2.6 0.5 1.6 9.8 2.0 6.2 14.0 3.3 9.2
Illicit drugs (%) 0.8 0.2 0.5 1.2 0.3 0.8 2.3 1.2 1.8
Source: Rehm et al. (in press).
WHO Global Status Report on Alcohol 2004
52
As stated above, the impact of alcohol consumption on diseases and the distribution of alcohol-related diseases should vary according to two factors: the volume and the drinking pattern.
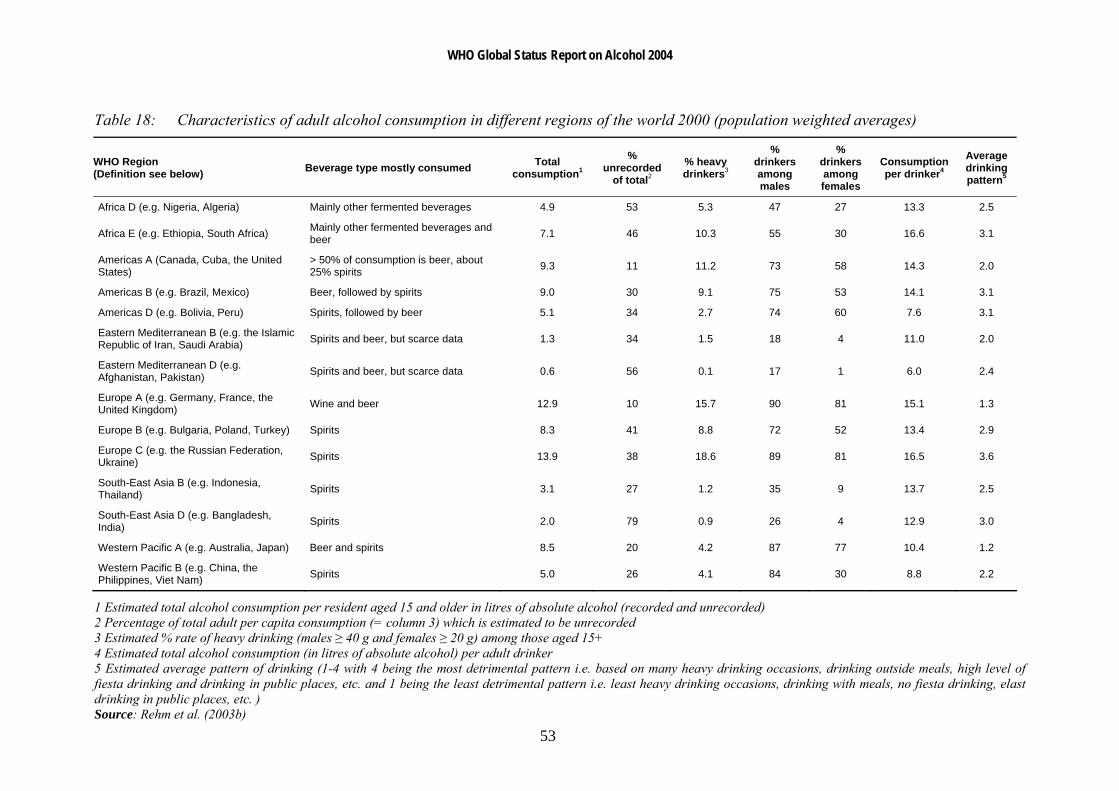
Table 18 gives an overview of differences in alcohol consumption across WHO regions. The regional subgroupings have been defined by WHO (2000b) on the basis of high, medium or low levels of adult and of infant mortality. 'A' stands for very low child and very low adult mortality, 'B' stands for low child and low adult mortality, 'C' for low child and high adult mortality, 'D' for high child and high adult mortality, and 'E' for very high child and very high adult mortality (WHO, 2000b). From this it can be seen that in the developed low mortality countries (EUR-A, AMR-A, WPR-A) alcohol consumption of drinkers is usually high but alcohol is commonly consumed in a less detrimental way (e.g. regularly with meals; for details as regards the average drinking pattern, see Rehm et al., in press), and thus one would expect a larger share of chronic diseases including alcohol abuse and dependence, and a lower share of acute consequences such as injury. In developing countries with low mortality (AMR-B, EMR-B, SEAR-B, WPR-B) volume of drinking is high but drinking patterns are more detrimental. Thus, there should be a larger share of acute consequences. The same is true for high mortality developing countries (AFR-D, AFR-E, AMR-D, EMR-D, SEAR-D), for which however volume of drinking is usually low and thus the total alcohol-related burden should also be lower compared to the developing countries with low mortality. The greatest burden from alcohol consumption should be expected in the EUR-B and EUR-C regions where both volume of drinking is high and alcohol is consumed mostly in a detrimental pattern, and thus there should again be a high share of acute consequences again.
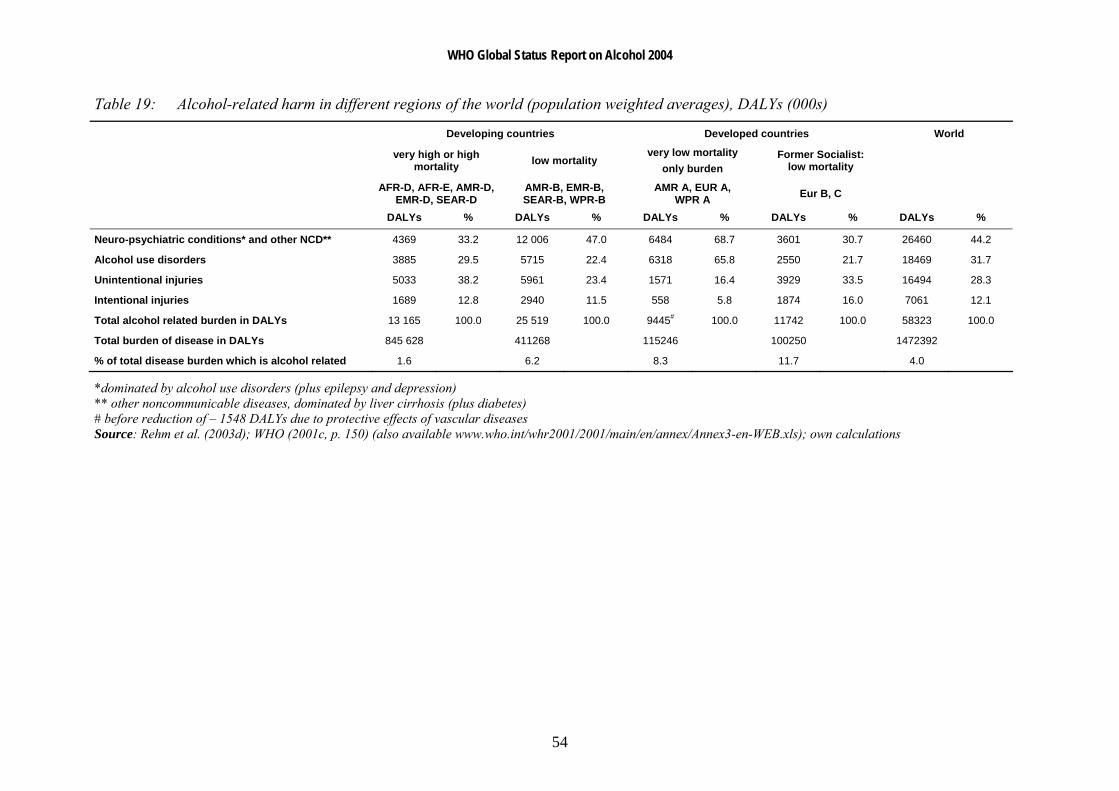
As Table 19 shows, empirically the aforementioned predictions could be confirmed, with the highest alcohol-related burden in the former socialist countries and the lowest burden in regions with low volume of drinking. Burden from acute consequences are highest in those regions, where regular drinking is rare, but alcohol is often consumed in large amounts when drinking takes place.
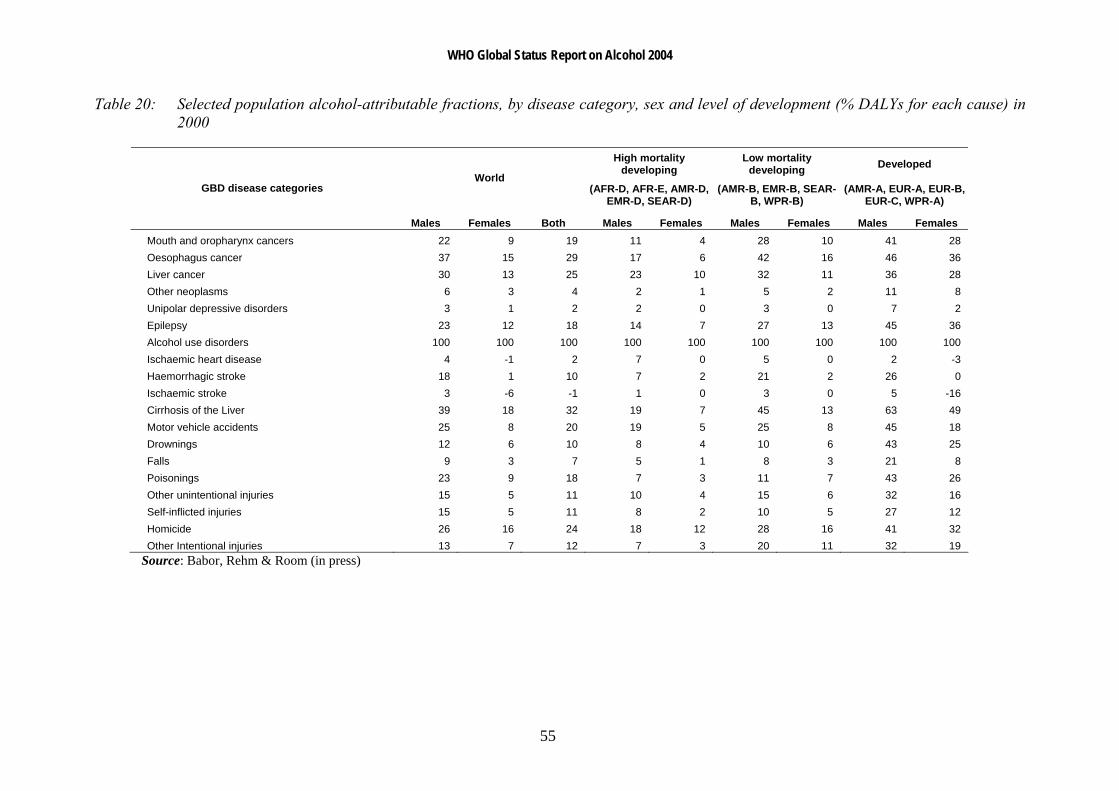
Table 20 shows the average attributable alcohol fractions (AAF) which were derived from calculations described in Babor, Rehm and Room (in press), for the categories of disorders for which alcohol was considered to be causal. The average AAFs are shown for men and women separately and together, for the world as a whole and for the three categories of high-mortality developing countries, low-mortality developing countries, and developed countries. Looking at the table, there are obvious gender differences to be found, with males having higher AAFs than females globally and in all regions. Also, the AAFs for developed countries are considerably higher than those of developing countries.
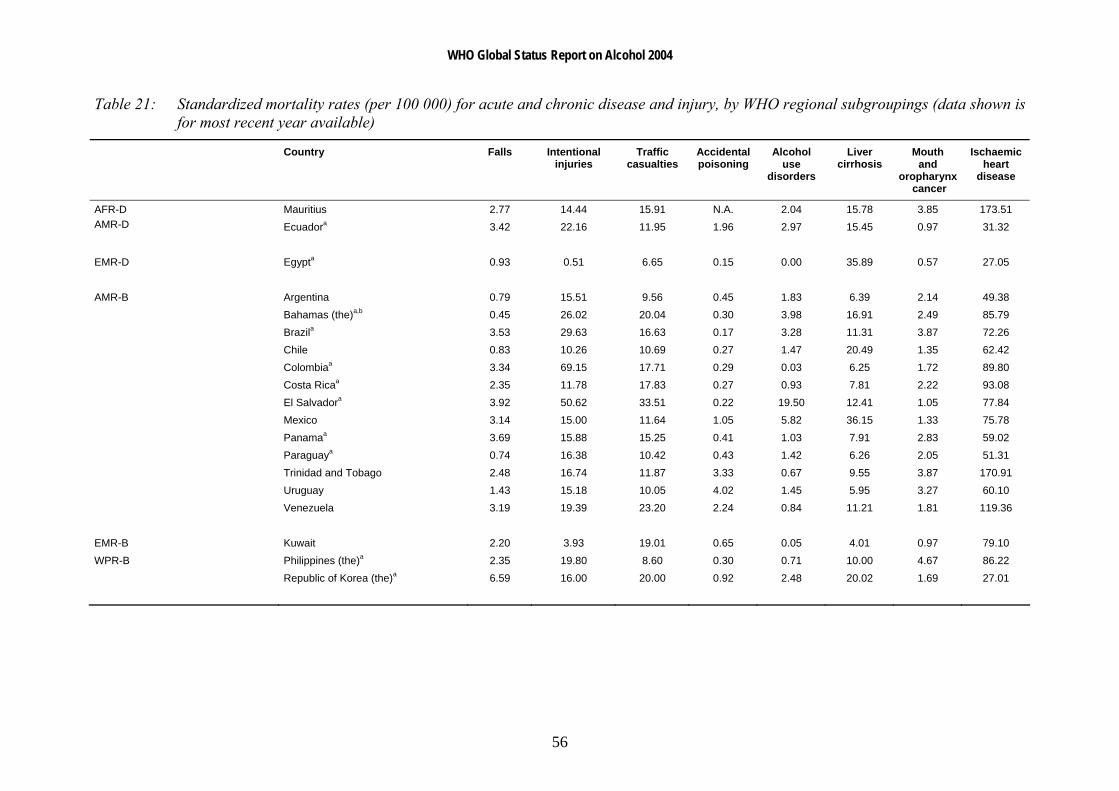
Table 21 gives an overview of standardized death rates for the chronic and acute diseases used in the current report (data shown is for most recent year available). It should be noted that these are not purely alcohol-related deaths. Traffic injuries, for example, also depend on the development of the transport system in a country, traffic or car densities, or road safety issues. Similarly, liver cirrhosis in many countries do not have a high alcohol involvement, but are related to poor sanitary conditions (poor drinking water quality causing high levels of hepatitis infections and liver diseases). Also, the numbers here do not imply that alcohol is responsible for all deaths from say cirrhosis of the liver or mouth and oropharynx cancer - with the exception of alcohol use disorders, the standardized mortality rates shown here are derived from the total number of deaths from the eight causes chosen irrespective of whether alcohol was a direct or indirect contributor to the deaths.
WHO Global Status Report on Alcohol 2004
53
Table 18: Characteristics of adult alcohol consumption in different regions of the world 2000 (population weighted averages)
WHO Region (Definition see below) Beverage type mostly consumed Total
consumption1
% unrecorded
of total2 % heavy drinkers3
% drinkers among males
% drinkers among females
Consumption per drinker4
Average drinking pattern5
Africa D (e.g. Nigeria, Algeria) Mainly other fermented beverages 4.9 53 5.3 47 27 13.3 2.5
Africa E (e.g. Ethiopia, South Africa) Mainly other fermented beverages and beer 7.1 46 10.3 55 30 16.6 3.1
Americas A (Canada, Cuba, the United States)
> 50% of consumption is beer, about 25% spirits 9.3 11 11.2 73 58 14.3 2.0
Americas B (e.g. Brazil, Mexico) Beer, followed by spirits 9.0 30 9.1 75 53 14.1 3.1
Americas D (e.g. Bolivia, Peru) Spirits, followed by beer 5.1 34 2.7 74 60 7.6 3.1
Eastern Mediterranean B (e.g. the Islamic Republic of Iran, Saudi Arabia) Spirits and beer, but scarce data 1.3 34 1.5 18 4 11.0 2.0
Eastern Mediterranean D (e.g. Afghanistan, Pakistan) Spirits and beer, but scarce data 0.6 56 0.1 17 1 6.0 2.4
Europe A (e.g. Germany, France, the United Kingdom) Wine and beer 12.9 10 15.7 90 81 15.1 1.3
Europe B (e.g. Bulgaria, Poland, Turkey) Spirits 8.3 41 8.8 72 52 13.4 2.9
Europe C (e.g. the Russian Federation, Ukraine) Spirits 13.9 38 18.6 89 81 16.5 3.6
South-East Asia B (e.g. Indonesia, Thailand) Spirits 3.1 27 1.2 35 9 13.7 2.5
South-East Asia D (e.g. Bangladesh, India) Spirits 2.0 79 0.9 26 4 12.9 3.0
Western Pacific A (e.g. Australia, Japan) Beer and spirits 8.5 20 4.2 87 77 10.4 1.2
Western Pacific B (e.g. China, the Philippines, Viet Nam) Spirits 5.0 26 4.1 84 30 8.8 2.2
1 Estimated total alcohol consumption per resident aged 15 and older in litres of absolute alcohol (recorded and unrecorded) 2 Percentage of total adult per capita consumption (= column 3) which is estimated to be unrecorded 3 Estimated % rate of heavy drinking (males ≥ 40 g and females ≥ 20 g) among those aged 15+ 4 Estimated total alcohol consumption (in litres of absolute alcohol) per adult drinker 5 Estimated average pattern of drinking (1-4 with 4 being the most detrimental pattern i.e. based on many heavy drinking occasions, drinking outside meals, high level of fiesta drinking and drinking in public places, etc. and 1 being the least detrimental pattern i.e. least heavy drinking occasions, drinking with meals, no fiesta drinking, elast drinking in public places, etc. ) Source: Rehm et al. (2003b)
WHO Global Status Report on Alcohol 2004
54
Table 19: Alcohol-related harm in different regions of the world (population weighted averages), DALYs (000s)
Developing countries Developed countries World
very high or high mortality low mortality
very low mortality only burden
Former Socialist: low mortality
AFR-D, AFR-E, AMR-D,EMR-D, SEAR-D
AMR-B, EMR-B, SEAR-B, WPR-B
AMR A, EUR A, WPR A Eur B, C
DALYs % DALYs % DALYs % DALYs % DALYs %
Neuro-psychiatric conditions* and other NCD** 4369 33.2 12 006 47.0 6484 68.7 3601 30.7 26460 44.2
Alcohol use disorders 3885 29.5 5715 22.4 6318 65.8 2550 21.7 18469 31.7
Unintentional injuries 5033 38.2 5961 23.4 1571 16.4 3929 33.5 16494 28.3
Intentional injuries 1689 12.8 2940 11.5 558 5.8 1874 16.0 7061 12.1
Total alcohol related burden in DALYs 13 165 100.0 25 519 100.0 9445# 100.0 11742 100.0 58323 100.0
Total burden of disease in DALYs 845 628 411268 115246 100250 1472392
% of total disease burden which is alcohol related 1.6 6.2 8.3 11.7 4.0
*dominated by alcohol use disorders (plus epilepsy and depression) ** other noncommunicable diseases, dominated by liver cirrhosis (plus diabetes) # before reduction of – 1548 DALYs due to protective effects of vascular diseases Source: Rehm et al. (2003d); WHO (2001c, p. 150) (also available www.who.int/whr2001/2001/main/en/annex/Annex3-en-WEB.xls); own calculations
WHO Global Status Report on Alcohol 2004
55
Table 20: Selected population alcohol-attributable fractions, by disease category, sex and level of development (% DALYs for each cause) in 2000
High mortality developing
Low mortality developing Developed
World (AFR-D, AFR-E, AMR-D,
EMR-D, SEAR-D) (AMR-B, EMR-B, SEAR-
B, WPR-B) (AMR-A, EUR-A, EUR-B,
EUR-C, WPR-A) GBD disease categories
Males Females Both Males Females Males Females Males Females Mouth and oropharynx cancers 22 9 19 11 4 28 10 41 28 Oesophagus cancer 37 15 29 17 6 42 16 46 36 Liver cancer 30 13 25 23 10 32 11 36 28 Other neoplasms 6 3 4 2 1 5 2 11 8 Unipolar depressive disorders 3 1 2 2 0 3 0 7 2 Epilepsy 23 12 18 14 7 27 13 45 36 Alcohol use disorders 100 100 100 100 100 100 100 100 100 Ischaemic heart disease 4 -1 2 7 0 5 0 2 -3 Haemorrhagic stroke 18 1 10 7 2 21 2 26 0 Ischaemic stroke 3 -6 -1 1 0 3 0 5 -16 Cirrhosis of the Liver 39 18 32 19 7 45 13 63 49 Motor vehicle accidents 25 8 20 19 5 25 8 45 18 Drownings 12 6 10 8 4 10 6 43 25 Falls 9 3 7 5 1 8 3 21 8 Poisonings 23 9 18 7 3 11 7 43 26 Other unintentional injuries 15 5 11 10 4 15 6 32 16 Self-inflicted injuries 15 5 11 8 2 10 5 27 12 Homicide 26 16 24 18 12 28 16 41 32 Other Intentional injuries 13 7 12 7 3 20 11 32 19
Source: Babor, Rehm & Room (in press)
WHO Global Status Report on Alcohol 2004
56
Table 21: Standardized mortality rates (per 100 000) for acute and chronic disease and injury, by WHO regional subgroupings (data shown is for most recent year available)
Country Falls Intentional injuries
Traffic casualties
Accidentalpoisoning
Alcohol use
disorders
Liver cirrhosis
Mouth and
oropharynx cancer
Ischaemic heart
disease
Mauritius 2.77 14.44 15.91 N.A. 2.04 15.78 3.85 173.51 AFR-D AMR-D Ecuadora 3.42 22.16 11.95 1.96 2.97 15.45 0.97 31.32 EMR-D Egypta 0.93 0.51 6.65 0.15 0.00 35.89 0.57 27.05 AMR-B Argentina 0.79 15.51 9.56 0.45 1.83 6.39 2.14 49.38 Bahamas (the)a,b 0.45 26.02 20.04 0.30 3.98 16.91 2.49 85.79 Brazila 3.53 29.63 16.63 0.17 3.28 11.31 3.87 72.26 Chile 0.83 10.26 10.69 0.27 1.47 20.49 1.35 62.42 Colombiaa 3.34 69.15 17.71 0.29 0.03 6.25 1.72 89.80 Costa Ricaa 2.35 11.78 17.83 0.27 0.93 7.81 2.22 93.08 El Salvadora 3.92 50.62 33.51 0.22 19.50 12.41 1.05 77.84 Mexico 3.14 15.00 11.64 1.05 5.82 36.15 1.33 75.78 Panamaa 3.69 15.88 15.25 0.41 1.03 7.91 2.83 59.02 Paraguaya 0.74 16.38 10.42 0.43 1.42 6.26 2.05 51.31 Trinidad and Tobago 2.48 16.74 11.87 3.33 0.67 9.55 3.87 170.91 Uruguay 1.43 15.18 10.05 4.02 1.45 5.95 3.27 60.10 Venezuela 3.19 19.39 23.20 2.24 0.84 11.21 1.81 119.36 EMR-B Kuwait 2.20 3.93 19.01 0.65 0.05 4.01 0.97 79.10 WPR-B Philippines (the)a 2.35 19.80 8.60 0.30 0.71 10.00 4.67 86.22 Republic of Korea (the)a 6.59 16.00 20.00 0.92 2.48 20.02 1.69 27.01
WHO Global Status Report on Alcohol 2004
57
Country Falls Intentional injuries
Traffic casualties
Accidentalpoisoning
Alcohol use
disorders
Liver cirrhosis
Mouth and
oropharynx cancer
Ischaemic heart
disease
AMR-A Canada 3.08 12.09 8.45 2.73 1.61 5.24 2.06 82.97 Cuba 12.26 18.22 12.19 0.32 2.31 7.61 3.82 108.52 United States of America (the) 6.78 20.21 15.00 0.58 1.90 7.47 2.00 112.40 EUR-A Austria 6.76 15.38 9.84 1.11 2.98 14.95 3.96 100.03 Croatia 8.33 17.32 11.27 1.72 3.18 20.90 5.27 127.98 Czech Republic (the) 12.18 14.31 8.65 2.76 0.76 12.36 4.04 141.13 Denmark 12.20 13.00 9.57 2.96 6.90 11.70 3.17 90.91 Finland 10.84 23.20 7.77 9.12 3.63 9.60 1.82 122.98 France 8.69 15.01 13.06 0.79 3.37 11.45 5.85 39.12 Germany 4.40 11.15 8.05 1.14 4.01 13.36 3.77 95.74 Greece 3.20 4.06 18.88 2.57 0.05 3.83 1.22 63.65 Icelandb 2.81 11.42 6.16 0.57 2.29 2.58 1.60 108.20 Ireland 7.00 11.97 10.14 1.04 1.98 3.94 3.04 133.70 Israel 1.46 8.26 5.57 0.26 0.93 3.85 1.20 77.33 Italy 7.48 6.38 11.76 0.37 0.22 10.73 2.90 57.20 Luxembourgb 5.25 16.77 17.36 5.22 4.17 12.19 4.28 59.33 Maltab 8.70 9.55 4.49 1.30 0.37 5.46 4.64 144.63 Netherlands (the) 2.66 9.54 6.59 0.74 1.39 4.44 2.47 70.17 Norway 8.05 12.16 6.05 1.99 3.44 3.10 2.47 81.19 Portugal 3.38 4.82 12.50 0.64 0.32 13.08 4.06 50.51 Spain 2.31 7.49 13.98 2.03 0.52 8.45 3.75 49.94 Sweden 18.45 21.10 5.84 1.49 2.47 3.97 1.69 89.28 Switzerland 2.88 14.65 6.50 3.85 2.31 5.79 3.33 70.55 United Kingdom (the) 14.80 14.62 5.62 1.91 0.87 7.36 2.15 112.41 WPR-A Australia 2.27 13.63 8.91 3.05 0.99 3.77 2.69 85.46 Japan 2.78 18.80 7.38 0.38 0.24 6.15 2.23 27.29 New Zealand 4.17 13.23 11.57 0.83 0.46 2.40 2.65 102.50 Singaporea 3.09 9.47 4.96 0.09 N.A. 2.84 5.83 91.24
WHO Global Status Report on Alcohol 2004
58
Country Falls Intentional injuries
Traffic casualties
Accidentalpoisoning
Alcohol use
disorders
Liver cirrhosis
Mouth and
oropharynx cancer
Ischaemic heart
disease
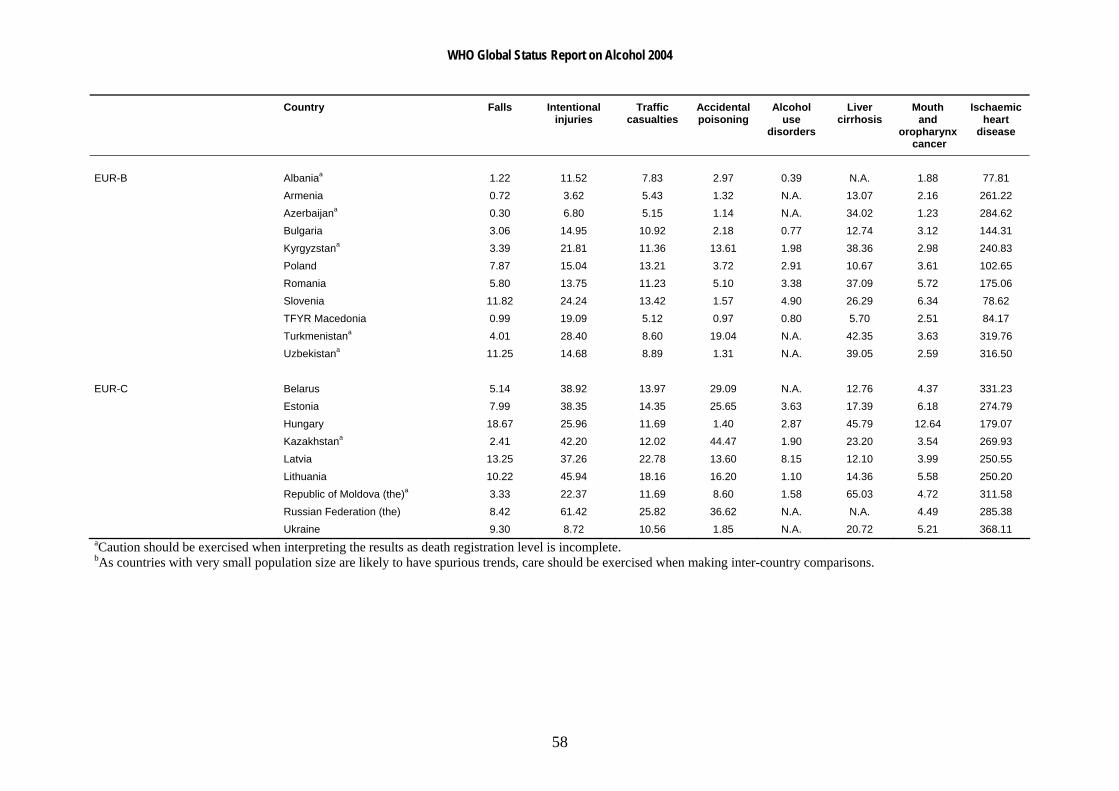
EUR-B Albaniaa 1.22 11.52 7.83 2.97 0.39 N.A. 1.88 77.81 Armenia 0.72 3.62 5.43 1.32 N.A. 13.07 2.16 261.22 Azerbaijana 0.30 6.80 5.15 1.14 N.A. 34.02 1.23 284.62 Bulgaria 3.06 14.95 10.92 2.18 0.77 12.74 3.12 144.31 Kyrgyzstana 3.39 21.81 11.36 13.61 1.98 38.36 2.98 240.83 Poland 7.87 15.04 13.21 3.72 2.91 10.67 3.61 102.65 Romania 5.80 13.75 11.23 5.10 3.38 37.09 5.72 175.06 Slovenia 11.82 24.24 13.42 1.57 4.90 26.29 6.34 78.62 TFYR Macedonia 0.99 19.09 5.12 0.97 0.80 5.70 2.51 84.17 Turkmenistana 4.01 28.40 8.60 19.04 N.A. 42.35 3.63 319.76 Uzbekistana 11.25 14.68 8.89 1.31 N.A. 39.05 2.59 316.50 EUR-C Belarus 5.14 38.92 13.97 29.09 N.A. 12.76 4.37 331.23 Estonia 7.99 38.35 14.35 25.65 3.63 17.39 6.18 274.79 Hungary 18.67 25.96 11.69 1.40 2.87 45.79 12.64 179.07 Kazakhstana 2.41 42.20 12.02 44.47 1.90 23.20 3.54 269.93 Latvia 13.25 37.26 22.78 13.60 8.15 12.10 3.99 250.55 Lithuania 10.22 45.94 18.16 16.20 1.10 14.36 5.58 250.20 Republic of Moldova (the)a 3.33 22.37 11.69 8.60 1.58 65.03 4.72 311.58 Russian Federation (the) 8.42 61.42 25.82 36.62 N.A. N.A. 4.49 285.38 Ukraine 9.30 8.72 10.56 1.85 N.A. 20.72 5.21 368.11 aCaution should be exercised when interpreting the results as death registration level is incomplete. bAs countries with very small population size are likely to have spurious trends, care should be exercised when making inter-country comparisons.


![Uuden ajokorttilain muutoksia [Yhteensopivuustila] · 2017. 4. 28. · www e fiautokoulu.fi Who: Global status report on road safety (()2009) Who: European status report on road safety](https://img.pdfslide.tips/doc/110x75/6121bb4e7cba9b4f254ad972/uuden-ajokorttilain-muutoksia-yhteensopivuustila-2017-4-28-www-e-fiautokoulufi.jpg)