Embed Size (px)
Citation preview
Global and time-resolved monitoring of cropphotosynthesis with chlorophyll fluorescenceLuis Guantera,1,2, Yongguang Zhanga,1, Martin Jungb, Joanna Joinerc, Maximilian Voigta, Joseph A. Berryd,Christian Frankenberge, Alfredo R. Huetef, Pablo Zarco-Tejadag, Jung-Eun Leeh, M. Susan Morani,Guillermo Ponce-Camposi, Christian Beerj, Gustavo Camps-Vallsk, Nina Buchmannl, Damiano Gianellem,Katja Klumppn, Alessandro Cescattio, John M. Bakerp, and Timothy J. Griffisq
aInstitute for Space Sciences, Freie Universität Berlin, 12165 Berlin, Germany; bDepartment for Biogeochemical Systems, Max Planck Institute forBiogeochemistry, 07745 Jena, Germany; cLaboratory for Atmospheric Chemistry and Dynamics (Code 614) National Aeronautics and Space AdministrationGoddard Space Flight Center, Greenbelt, MD 20771; dDepartment of Global Ecology, Carnegie Institution for Science, Stanford, CA 94305; eJet PropulsionLaboratory, California Institute of Technology, Pasadena, CA 91109; fPlant Functional Biology and Climate Change Cluster, University of TechnologySydney, Sydney, 2007, Australia; gInstituto de Agricultura Sostenible, Consejo Superior de Investigaciones Científicas, 14004 Córdoba, Spain; hGeologicalSciences, Brown University, Providence, RI 02912; iSouthwest Watershed Research, Agricultural Research Service, US Department of Agriculture, Tucson,AZ 85719; jDepartment of Applied Environmental Science and Bolin Centre for Climate Research, Stockholm University, 10691 Stockholm, Sweden; kImageProcessing Laboratory, Universitat de València, 46980 València, Spain; lAgricultural Sciences, Eidgenössiche Technische Hochschule Zurich, 8092 Zurich,Switzerland; mSustainable Agro-ecosystems and Bioresources Department, Research and Innovation Centre, Fondazione Edmund Mach, 38010 San Micheleall’Adige, Italy; nGrassland Ecosystem Research Unit, Institut National de la Recherche Agronomique, Clermont-Ferrand, France 63122; oInstitute forEnvironment and Sustainability, Joint Research Centre, European Commission, 20127 Ispra, Italy; pSoil and Water Management Research, AgriculturalResearch Service, US Department of Agriculture, St. Paul, MN 55108; and qDepartment of Soil, Water, and Climate, University of Minnesota, St. Paul,MN 55108
Edited by Gregory P. Asner, Carnegie Institution for Science, Stanford, CA, and approved February 25, 2014 (received for review October 24, 2013)
Photosynthesis is the process by which plants harvest sunlight toproduce sugars from carbon dioxide and water. It is the primarysource of energy for all life on Earth; hence it is important tounderstand how this process responds to climate change andhuman impact. However, model-based estimates of gross primaryproduction (GPP, output from photosynthesis) are highly uncer-tain, in particular over heavily managed agricultural areas. Recentadvances in spectroscopy enable the space-based monitoring ofsun-induced chlorophyll fluorescence (SIF) from terrestrial plants.Here we demonstrate that spaceborne SIF retrievals providea direct measure of the GPP of cropland and grassland ecosystems.Such a strong link with crop photosynthesis is not evident fortraditional remotely sensed vegetation indices, nor for morecomplex carbon cycle models. We use SIF observations to providea global perspective on agricultural productivity. Our SIF-basedcrop GPP estimates are 50–75% higher than results from state-of-the-art carbon cycle models over, for example, the US Corn Beltand the Indo-Gangetic Plain, implying that current models severelyunderestimate the role of management. Our results indicate thatSIF data can help us improve our global models for more accurateprojections of agricultural productivity and climate impact on cropyields. Extension of our approach to other ecosystems, along withincreased observational capabilities for SIF in the near future,holds the prospect of reducing uncertainties in the modeling ofthe current and future carbon cycle.
crop productivity | carbon fluxes | Earth observation | carbon modeling |spaceborne spectroscopy
The rapidly growing demand for food and biofuels constitutesone of the greatest challenges for humanity in coming decades
(1). It is estimated that we must double world food production by2050 to meet increasing demand (2), but the once rapid growthseen in the “green revolution” has stalled, and even past advancesare threatened by climate change (3–5). Much of past yield im-provement has focused on increases in the harvest index andresistance to pests. However, all else being equal, the quantity ofphotosynthesis places an upper limit on the supply of food andfuels from our agricultural systems.Ironically, we currently have very limited ability to assess
photosynthesis of the breadbaskets of the world. Agriculturalproduction inventories provide important information aboutcrop productivity and yields (6–8), but these are difficult tocompare between regions and lag actual production. Carboncycle models, based on either process-oriented biogeochemistry
or semiempirical data-driven approaches, have been used tounderstand the controls and variations of global gross primaryproduction (GPP, equivalent to ecosystem gross photosynthesis)(9) and to investigate the climate impact on crop yields (10).However, uncertainty associated with inaccurate input data andmuch simplified process descriptions based on the plant func-tional type concept severely challenge the application of thesemodels to agricultural systems. Recent model intercomparisonsconducted as part of the North American Carbon Project foundthat GPP estimates for crop areas varied by a factor of 2 (11).The best available estimates of GPP of crop systems are fromdirect measurement of carbon dioxide exchange by so-called fluxtowers over agricultural fields (12). However, these generallysample small areas (<1 km2) and are concentrated in NorthAmerica and Europe.Remote sensing of reflectance-based vegetation parameters
has been used in the last decades to monitor agricultural
Significance
Global food and biofuel production and their vulnerability ina changing climate are of paramount societal importance.However, current global model predictions of crop photosyn-thesis are highly uncertain. Here we demonstrate that newspace-based observations of chlorophyll fluorescence, an emis-sion intrinsically linked to plant biochemistry, enable an accurate,global, and time-resolved measurement of crop photosynthesis,which is not possible from any other remote vegetation mea-surement. Our results show that chlorophyll fluorescence datacan be used as a unique benchmark to improve our globalmodels, thus providing more reliable projections of agriculturalproductivity and climate impact on crop yields. The enormousincrease of the observational capabilities for fluorescence in thevery near future strengthens the relevance of this study.
Author contributions: L.G., Y.Z., M.J., and J.A.B. designed research; L.G., Y.Z., M.V., A.R.H.,P.Z.-T., J.-E.L., M.S.M., and G.P.-C. performed research; L.G., Y.Z., M.J., J.J., C.B., G.C.-V.,N.B., D.G., K.K., A.C., J.M.B., and T.J.G. contributed new reagents/analytic tools; L.G., Y.Z.,J.J., M.V., and C.F. analyzed data; and L.G., Y.Z., J.A.B., C.F., and A.R.H. wrote the paper.
The authors declare no conflict of interest.
This article is a PNAS Direct Submission.1L.G. and Y.Z. contributed equally to this work.2To whom correspondence should be addressed. E-mail: [email protected].
This article contains supporting information online at www.pnas.org/lookup/suppl/doi:10.1073/pnas.1320008111/-/DCSupplemental.
www.pnas.org/cgi/doi/10.1073/pnas.1320008111 PNAS | Published online March 25, 2014 | E1327–E1333
ENVIRONMEN
TAL
SCIENCE
SPN
ASPL
US
resources (e.g., refs. 13, 14). The signal of the so-called spectralvegetation indices convolves leaf chlorophyll content, biomass, can-opy structure, and cover (15, 16), such that estimating actual pro-ductivity from vegetation indices requires additional data andmodeling steps, both associated with considerable uncertainty.Complementing reflectance-based indices, global space-based esti-mates of sun-induced chlorophyll fluorescence (SIF) became avail-able recently. SIF is an electromagnetic signal emitted in the 650- to850-nm spectral window as a by-product of photosynthesis (e.g., refs.17–19). The first global maps of SIF were derived using data fromthe Greenhouse Gases Observing Satellite (GOSAT) (20–23). De-spite the complicated photosynthesis-SIF relationships and theconvolution of the signal with canopy structure (16), SIF retrievalsshowed high correlations with data-driven GPP estimates at globaland annual scales (21, 22), as well as intriguing patterns of seasonaldrought response in Amazonia (24, 25). Recently, a global SIF dataset with better spatial and temporal sampling than that fromGOSAT was produced using spectra from the Global OzoneMonitoring Experiment-2 (GOME-2) instrument onboard theMetOp-A platform (26) (see SI Appendix, SIF Retrievals).Our attention is drawn to the remarkably high SIF returns
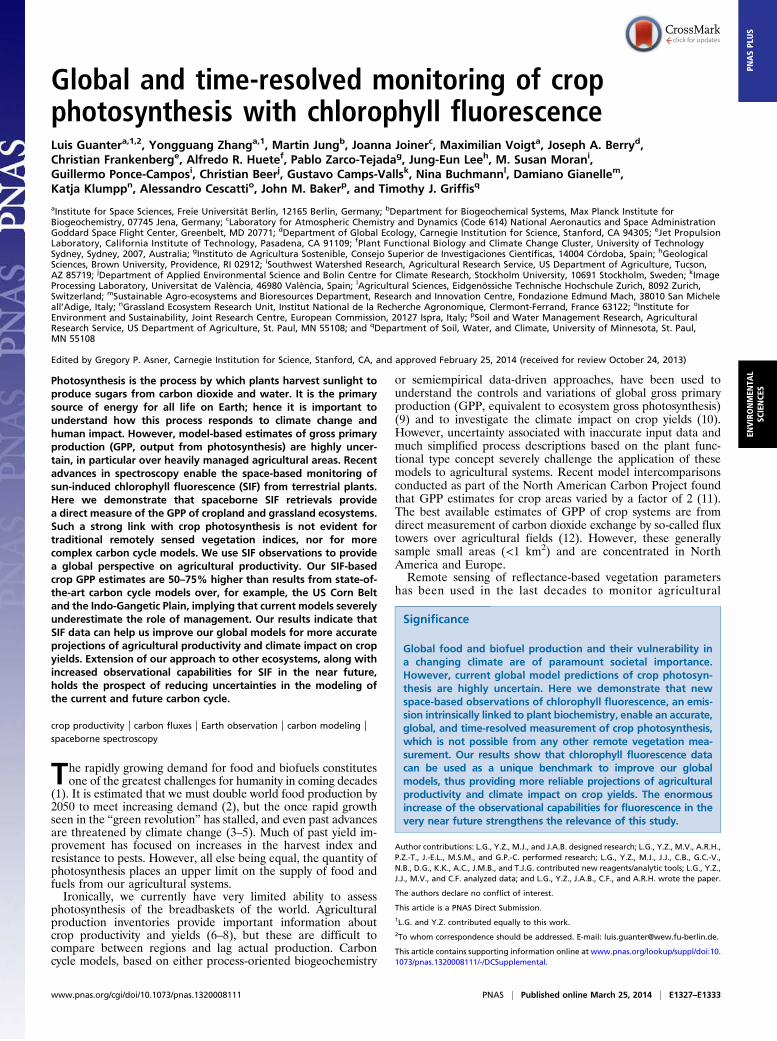
from the US Corn Belt (CB) region (Fig. 1). This highly pro-
ductive area (Fig. 2D) accounts for >40% of world soybean andcorn production (30). We hypothesize that the high SIF indi-cates very high GPP for this area and report here on studiesthat compare SIF retrievals to GPP models and flux tower datawith the aim of gaining a unique global perspective on cropphotosynthesis.
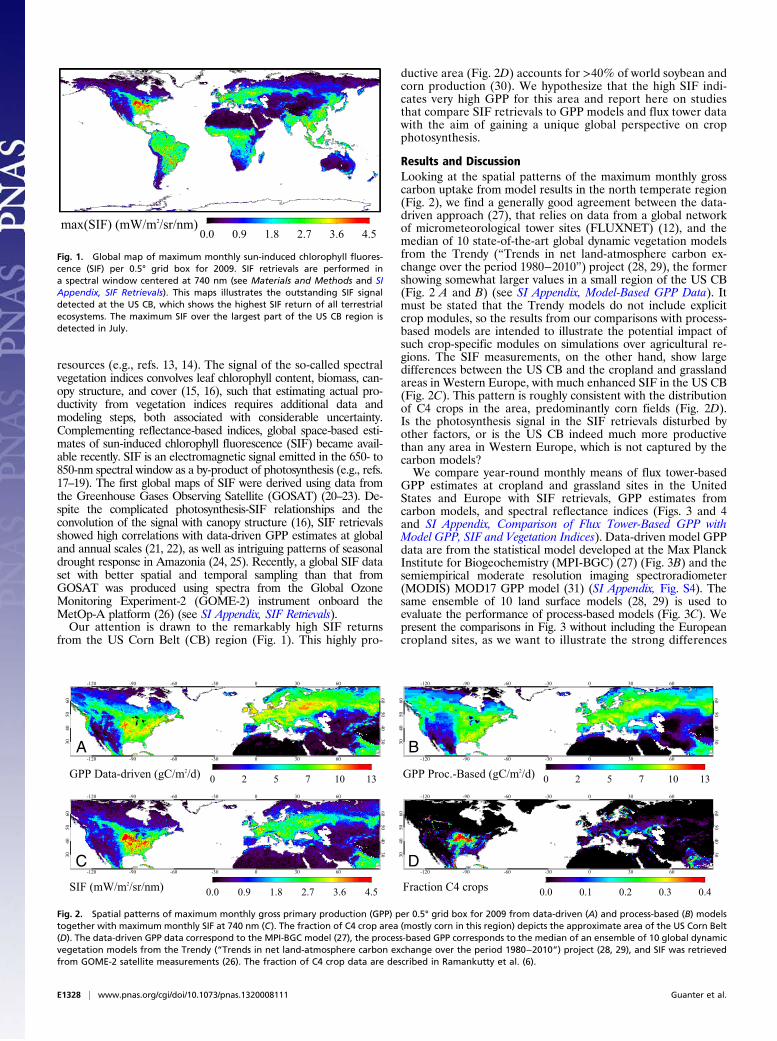
Results and DiscussionLooking at the spatial patterns of the maximum monthly grosscarbon uptake from model results in the north temperate region(Fig. 2), we find a generally good agreement between the data-driven approach (27), that relies on data from a global networkof micrometeorological tower sites (FLUXNET) (12), and themedian of 10 state-of-the-art global dynamic vegetation modelsfrom the Trendy (“Trends in net land-atmosphere carbon ex-change over the period 1980−2010”) project (28, 29), the formershowing somewhat larger values in a small region of the US CB(Fig. 2 A and B) (see SI Appendix, Model-Based GPP Data). Itmust be stated that the Trendy models do not include explicitcrop modules, so the results from our comparisons with process-based models are intended to illustrate the potential impact ofsuch crop-specific modules on simulations over agricultural re-gions. The SIF measurements, on the other hand, show largedifferences between the US CB and the cropland and grasslandareas in Western Europe, with much enhanced SIF in the US CB(Fig. 2C). This pattern is roughly consistent with the distributionof C4 crops in the area, predominantly corn fields (Fig. 2D).Is the photosynthesis signal in the SIF retrievals disturbed byother factors, or is the US CB indeed much more productivethan any area in Western Europe, which is not captured by thecarbon models?We compare year-round monthly means of flux tower-based
GPP estimates at cropland and grassland sites in the UnitedStates and Europe with SIF retrievals, GPP estimates fromcarbon models, and spectral reflectance indices (Figs. 3 and 4and SI Appendix, Comparison of Flux Tower-Based GPP withModel GPP, SIF and Vegetation Indices). Data-driven model GPPdata are from the statistical model developed at the Max PlanckInstitute for Biogeochemistry (MPI-BGC) (27) (Fig. 3B) and thesemiempirical moderate resolution imaging spectroradiometer(MODIS) MOD17 GPP model (31) (SI Appendix, Fig. S4). Thesame ensemble of 10 land surface models (28, 29) is used toevaluate the performance of process-based models (Fig. 3C). Wepresent the comparisons in Fig. 3 without including the Europeancropland sites, as we want to illustrate the strong differences
0.0 0.9 1.8 2.7 3.6 4.5max(SIF) (mW/m2/sr/nm)
Fig. 1. Global map of maximum monthly sun-induced chlorophyll fluores-cence (SIF) per 0.5° grid box for 2009. SIF retrievals are performed ina spectral window centered at 740 nm (see Materials and Methods and SIAppendix, SIF Retrievals). This maps illustrates the outstanding SIF signaldetected at the US CB, which shows the highest SIF return of all terrestrialecosystems. The maximum SIF over the largest part of the US CB region isdetected in July.
-120 -90 -60 -30 0 30 60
-120 -90 -60 -30 0 30 60
3040
5060
3040
5060
0 2 5 7 10 13GPP Data-driven (gC/m2/d)-120 -90 -60 -30 0 30 60
-120 -90 -60 -30 0 30 60
3040
5060
3040
5060
0 2 5 7 10 13GPP Proc.-Based (gC/m2/d)
-120 -90 -60 -30 0 30 60
-120 -90 -60 -30 0 30 60
3040
5060
3040
5060
0.0 0.9 1.8 2.7 3.6 4.5SIF (mW/m2/sr/nm)-120 -90 -60 -30 0 30 60
-120 -90 -60 -30 0 30 60
3040
5060
3040
5060
0.0 0.1 0.2 0.3 0.4
A B
C D
Fraction C4 crops
Fig. 2. Spatial patterns of maximum monthly gross primary production (GPP) per 0.5° grid box for 2009 from data-driven (A) and process-based (B) modelstogether with maximum monthly SIF at 740 nm (C). The fraction of C4 crop area (mostly corn in this region) depicts the approximate area of the US Corn Belt(D). The data-driven GPP data correspond to the MPI-BGC model (27), the process-based GPP corresponds to the median of an ensemble of 10 global dynamicvegetation models from the Trendy (“Trends in net land-atmosphere carbon exchange over the period 1980−2010”) project (28, 29), and SIF was retrievedfrom GOME-2 satellite measurements (26). The fraction of C4 crop data are described in Ramankutty et al. (6).
E1328 | www.pnas.org/cgi/doi/10.1073/pnas.1320008111 Guanter et al.
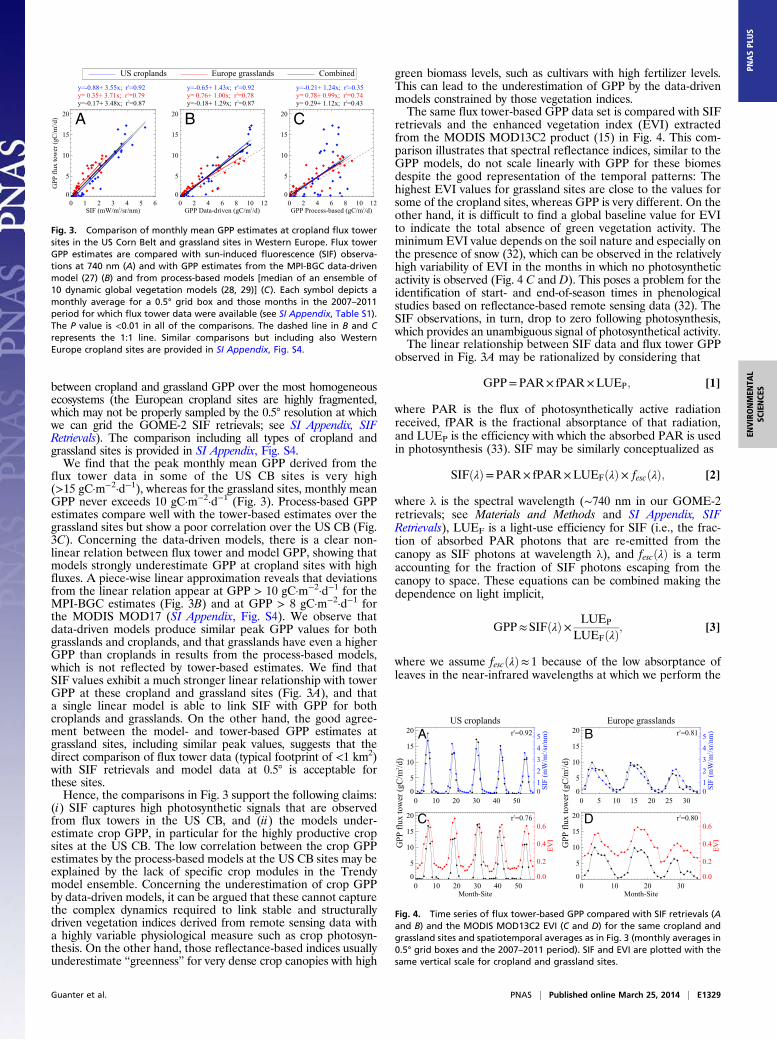
between cropland and grassland GPP over the most homogeneousecosystems (the European cropland sites are highly fragmented,which may not be properly sampled by the 0.5° resolution at whichwe can grid the GOME-2 SIF retrievals; see SI Appendix, SIFRetrievals). The comparison including all types of cropland andgrassland sites is provided in SI Appendix, Fig. S4.We find that the peak monthly mean GPP derived from the
flux tower data in some of the US CB sites is very high(>15 gC·m−2·d−1), whereas for the grassland sites, monthly meanGPP never exceeds 10 gC·m−2·d−1 (Fig. 3). Process-based GPPestimates compare well with the tower-based estimates over thegrassland sites but show a poor correlation over the US CB (Fig.3C). Concerning the data-driven models, there is a clear non-linear relation between flux tower and model GPP, showing thatmodels strongly underestimate GPP at cropland sites with highfluxes. A piece-wise linear approximation reveals that deviationsfrom the linear relation appear at GPP > 10 gC·m−2·d−1 for theMPI-BGC estimates (Fig. 3B) and at GPP > 8 gC·m−2·d−1 forthe MODIS MOD17 (SI Appendix, Fig. S4). We observe thatdata-driven models produce similar peak GPP values for bothgrasslands and croplands, and that grasslands have even a higherGPP than croplands in results from the process-based models,which is not reflected by tower-based estimates. We find thatSIF values exhibit a much stronger linear relationship with towerGPP at these cropland and grassland sites (Fig. 3A), and thata single linear model is able to link SIF with GPP for bothcroplands and grasslands. On the other hand, the good agree-ment between the model- and tower-based GPP estimates atgrassland sites, including similar peak values, suggests that thedirect comparison of flux tower data (typical footprint of <1 km2)with SIF retrievals and model data at 0.5° is acceptable forthese sites.Hence, the comparisons in Fig. 3 support the following claims:
(i) SIF captures high photosynthetic signals that are observedfrom flux towers in the US CB, and (ii) the models under-estimate crop GPP, in particular for the highly productive cropsites at the US CB. The low correlation between the crop GPPestimates by the process-based models at the US CB sites may beexplained by the lack of specific crop modules in the Trendymodel ensemble. Concerning the underestimation of crop GPPby data-driven models, it can be argued that these cannot capturethe complex dynamics required to link stable and structurallydriven vegetation indices derived from remote sensing data witha highly variable physiological measure such as crop photosyn-thesis. On the other hand, those reflectance-based indices usuallyunderestimate “greenness” for very dense crop canopies with high
green biomass levels, such as cultivars with high fertilizer levels.This can lead to the underestimation of GPP by the data-drivenmodels constrained by those vegetation indices.The same flux tower-based GPP data set is compared with SIF
retrievals and the enhanced vegetation index (EVI) extractedfrom the MODIS MOD13C2 product (15) in Fig. 4. This com-parison illustrates that spectral reflectance indices, similar to theGPP models, do not scale linearly with GPP for these biomesdespite the good representation of the temporal patterns: Thehighest EVI values for grassland sites are close to the values forsome of the cropland sites, whereas GPP is very different. On theother hand, it is difficult to find a global baseline value for EVIto indicate the total absence of green vegetation activity. Theminimum EVI value depends on the soil nature and especially onthe presence of snow (32), which can be observed in the relativelyhigh variability of EVI in the months in which no photosyntheticactivity is observed (Fig. 4 C and D). This poses a problem for theidentification of start- and end-of-season times in phenologicalstudies based on reflectance-based remote sensing data (32). TheSIF observations, in turn, drop to zero following photosynthesis,which provides an unambiguous signal of photosynthetical activity.The linear relationship between SIF data and flux tower GPP
observed in Fig. 3A may be rationalized by considering that
GPP=PAR× fPAR×LUEP; [1]
where PAR is the flux of photosynthetically active radiationreceived, fPAR is the fractional absorptance of that radiation,and LUEP is the efficiency with which the absorbed PAR is usedin photosynthesis (33). SIF may be similarly conceptualized as
SIFðλÞ=PAR× fPAR×LUEFðλÞ× fescðλÞ; [2]
where λ is the spectral wavelength (∼740 nm in our GOME-2retrievals; see Materials and Methods and SI Appendix, SIFRetrievals), LUEF is a light-use efficiency for SIF (i.e., the frac-tion of absorbed PAR photons that are re-emitted from thecanopy as SIF photons at wavelength λ), and fescðλÞ is a termaccounting for the fraction of SIF photons escaping from thecanopy to space. These equations can be combined making thedependence on light implicit,
GPP≈ SIFðλÞ× LUEP
LUEFðλÞ; [3]
where we assume fescðλÞ≈ 1 because of the low absorptance ofleaves in the near-infrared wavelengths at which we perform the
0 1 2 3 4 5 6SIF (mW/m2/sr/nm)
0
5
10
15
20
GPP
flux
tow
er (g
C/m
2 /d)
US croplands Europe grasslands Combinedy=-0.88+ 3.55x; r2=0.92y= 0.35+ 3.71x; r2=0.79y=-0.17+ 3.48x; r2=0.87
0 2 4 6 8 10 12GPP Data-driven (gC/m2/d)
0
5
10
15
20
y=-0.65+ 1.43x; r2=0.92y= 0.76+ 1.00x; r2=0.78y=-0.18+ 1.29x; r2=0.87
0 2 4 6 8 10 12GPP Process-based (gC/m2/d)
0
5
10
15
20
y=-0.21+ 1.24x; r2=0.35y= 0.78+ 0.99x; r2=0.74y= 0.29+ 1.12x; r2=0.43
A B C
Fig. 3. Comparison of monthly mean GPP estimates at cropland flux towersites in the US Corn Belt and grassland sites in Western Europe. Flux towerGPP estimates are compared with sun-induced fluorescence (SIF) observa-tions at 740 nm (A) and with GPP estimates from the MPI-BGC data-drivenmodel (27) (B) and from process-based models [median of an ensemble of10 dynamic global vegetation models (28, 29)] (C). Each symbol depicts amonthly average for a 0.5° grid box and those months in the 2007–2011period for which flux tower data were available (see SI Appendix, Table S1).The P value is <0.01 in all of the comparisons. The dashed line in B and Crepresents the 1:1 line. Similar comparisons but including also WesternEurope cropland sites are provided in SI Appendix, Fig. S4.
US croplands
0 10 20 30 40 500
5
10
15
20
012345
SIF
(mW
/m2 /s
r/nm
)r2=0.92
0 10 20 30 40 50Month-Site
0
5
10
15
20
0.0
0.2
0.4
0.6
EVI
r2=0.76
Europe grasslands
0 5 10 15 20 25 300
5
10
15
20
012345
SIF
(mW
/m2 /s
r/nm
)r2=0.81
0 10 20 30Month-Site
0
5
10
15
20
0.0
0.2
0.4
0.6
EVI
r2=0.80
GPP
flux
tow
er (g
C/m
2 /d)
GPP
flux
tow
er (g
C/m
2 /d)
A B
C D
Fig. 4. Time series of flux tower-based GPP compared with SIF retrievals (Aand B) and the MODIS MOD13C2 EVI (C and D) for the same cropland andgrassland sites and spatiotemporal averages as in Fig. 3 (monthly averages in0.5° grid boxes and the 2007–2011 period). SIF and EVI are plotted with thesame vertical scale for cropland and grassland sites.
Guanter et al. PNAS | Published online March 25, 2014 | E1329
ENVIRONMEN
TAL
SCIENCE
SPN
ASPL
US
SIF retrievals and the relatively simple plant structure and highleaf area index of grasses and crops (34).Empirical studies at the leaf and canopy scale indicate that the
two light-use efficiency terms tend to covary under the conditionsof the satellite measurement (35–37). Hence, the SIF data shouldprovide information on both the light absorbed and the efficiencywith which it is being used for photosynthesis. Vegetation indicesderived from reflectance measurements from spaceborne instru-ments such as MODIS (15) and knowledge of the solar angle andatmospheric condition can be used to estimate PAR × fPAR (Eq.1), but LUEP is a free parameter. These data from the CB areconsistent with LUEP being much higher for intensively managedcrops than for native grasslands or less managed crops.Based on the linear relationship obtained from the comparison
of SIF with tower-based GPP at all of the US and Western Europecropland and grassland flux tower sites [GPP(SIF) = −0.10 + 3.72 ×SIF; see SI Appendix, Comparison of Flux Tower-Based GPP withModel GPP, SIF and Vegetation Indices and Derivation of Spatially-Explicit Crop GPP Estimates], we have produced unique globalestimates of annual crop GPP. Even though tower data outsidethe US CB and Western Europe were not available for thederivation of the empirical GPP−SIF relationship, we assume itto hold for all of the ecosystems in which GPP is driven bycanopy chlorophyll content such as croplands and grasslands(14). We have compared our SIF-based crop GPP estimates withthe GPP predicted by ensembles of state-of-the-art data-driven(9) and process-based (28, 29) biogeochemistry models (see SIAppendix, Model-Based GPP Data). We evaluate the consistencyof the different GPP estimates with the agricultural yield statis-tics from the National Agriculture Statistics Service of the USDepartment of Agriculture (USDA NASS) (38) (only NorthAmerica, years 2006–2008) and the data set by Monfreda et al.(7) (global coverage, year 2000). These inventories provide large-scale cropland net primary production (NPP, biomass pro-duction by plants) estimates by combining national, state, andcounty-level census statistics with maps of cropland areas (see SIAppendix, NPP Data from Agricultural Inventories).The comparison between our annual crop GPP estimates and
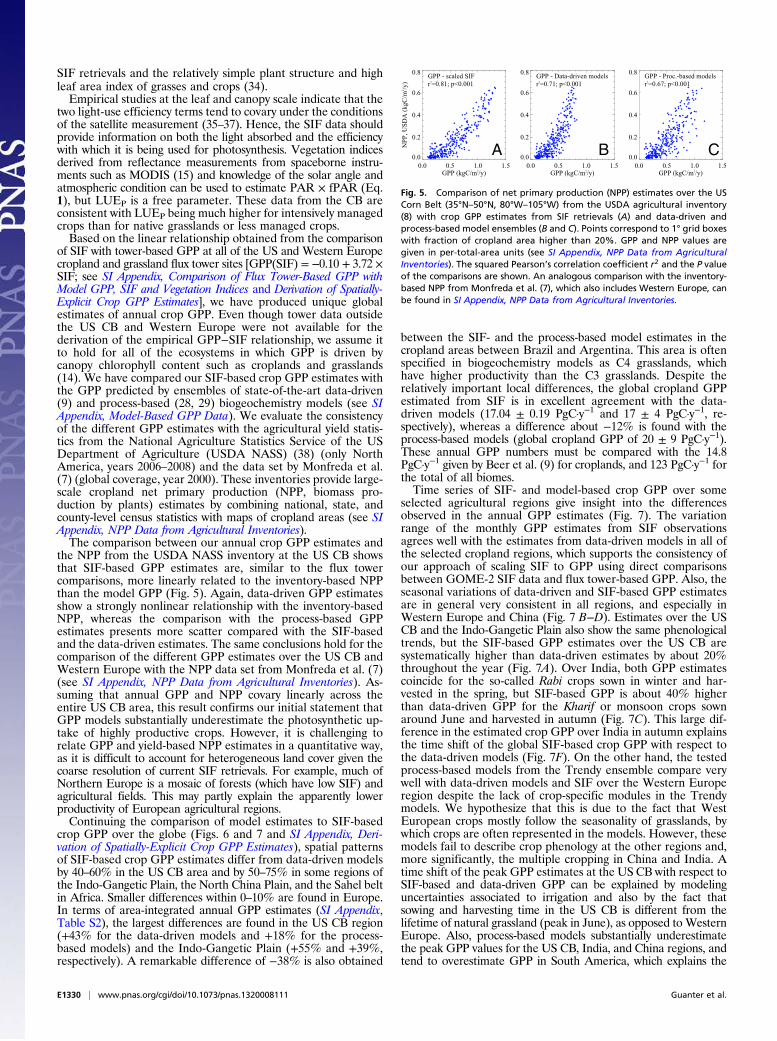
the NPP from the USDA NASS inventory at the US CB showsthat SIF-based GPP estimates are, similar to the flux towercomparisons, more linearly related to the inventory-based NPPthan the model GPP (Fig. 5). Again, data-driven GPP estimatesshow a strongly nonlinear relationship with the inventory-basedNPP, whereas the comparison with the process-based GPPestimates presents more scatter compared with the SIF-basedand the data-driven estimates. The same conclusions hold for thecomparison of the different GPP estimates over the US CB andWestern Europe with the NPP data set from Monfreda et al. (7)(see SI Appendix, NPP Data from Agricultural Inventories). As-suming that annual GPP and NPP covary linearly across theentire US CB area, this result confirms our initial statement thatGPP models substantially underestimate the photosynthetic up-take of highly productive crops. However, it is challenging torelate GPP and yield-based NPP estimates in a quantitative way,as it is difficult to account for heterogeneous land cover given thecoarse resolution of current SIF retrievals. For example, much ofNorthern Europe is a mosaic of forests (which have low SIF) andagricultural fields. This may partly explain the apparently lowerproductivity of European agricultural regions.Continuing the comparison of model estimates to SIF-based
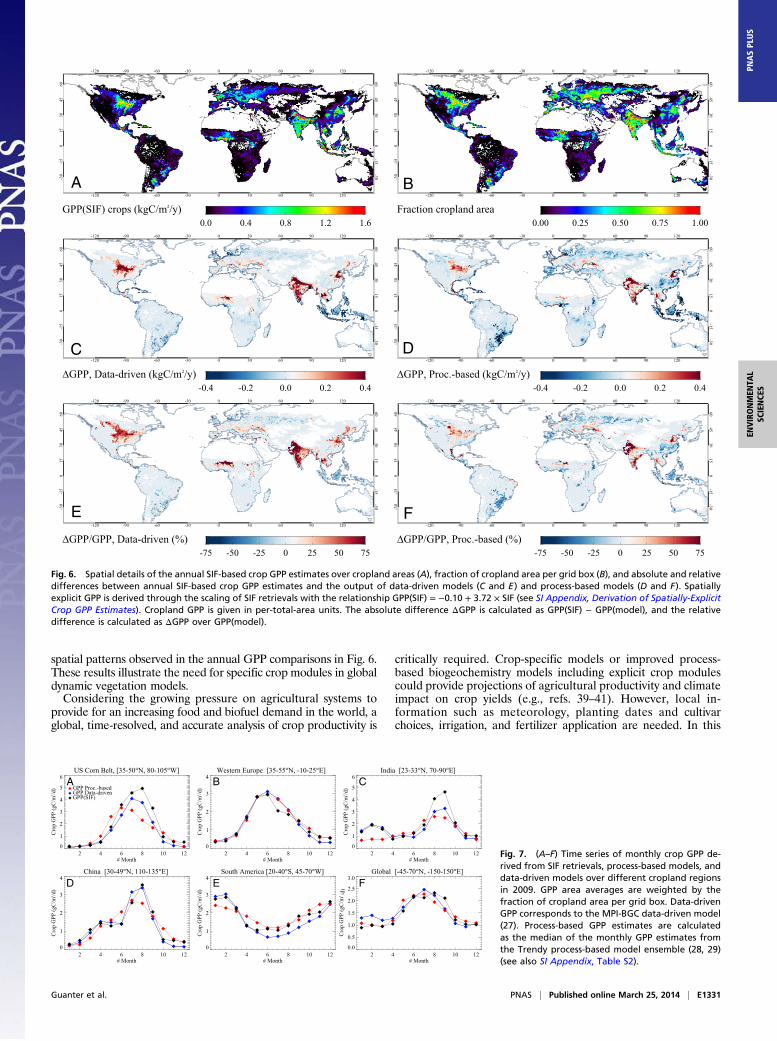
crop GPP over the globe (Figs. 6 and 7 and SI Appendix, Deri-vation of Spatially-Explicit Crop GPP Estimates), spatial patternsof SIF-based crop GPP estimates differ from data-driven modelsby 40–60% in the US CB area and by 50–75% in some regions ofthe Indo-Gangetic Plain, the North China Plain, and the Sahel beltin Africa. Smaller differences within 0–10% are found in Europe.In terms of area-integrated annual GPP estimates (SI Appendix,Table S2), the largest differences are found in the US CB region(+43% for the data-driven models and +18% for the process-based models) and the Indo-Gangetic Plain (+55% and +39%,respectively). A remarkable difference of −38% is also obtained
between the SIF- and the process-based model estimates in thecropland areas between Brazil and Argentina. This area is oftenspecified in biogeochemistry models as C4 grasslands, whichhave higher productivity than the C3 grasslands. Despite therelatively important local differences, the global cropland GPPestimated from SIF is in excellent agreement with the data-driven models (17.04 ± 0.19 PgC·y−1 and 17 ± 4 PgC·y−1, re-spectively), whereas a difference about −12% is found with theprocess-based models (global cropland GPP of 20 ± 9 PgC·y−1).These annual GPP numbers must be compared with the 14.8PgC·y−1 given by Beer et al. (9) for croplands, and 123 PgC·y−1 forthe total of all biomes.Time series of SIF- and model-based crop GPP over some
selected agricultural regions give insight into the differencesobserved in the annual GPP estimates (Fig. 7). The variationrange of the monthly GPP estimates from SIF observationsagrees well with the estimates from data-driven models in all ofthe selected cropland regions, which supports the consistency ofour approach of scaling SIF to GPP using direct comparisonsbetween GOME-2 SIF data and flux tower-based GPP. Also, theseasonal variations of data-driven and SIF-based GPP estimatesare in general very consistent in all regions, and especially inWestern Europe and China (Fig. 7 B−D). Estimates over the USCB and the Indo-Gangetic Plain also show the same phenologicaltrends, but the SIF-based GPP estimates over the US CB aresystematically higher than data-driven estimates by about 20%throughout the year (Fig. 7A). Over India, both GPP estimatescoincide for the so-called Rabi crops sown in winter and har-vested in the spring, but SIF-based GPP is about 40% higherthan data-driven GPP for the Kharif or monsoon crops sownaround June and harvested in autumn (Fig. 7C). This large dif-ference in the estimated crop GPP over India in autumn explainsthe time shift of the global SIF-based crop GPP with respect tothe data-driven models (Fig. 7F). On the other hand, the testedprocess-based models from the Trendy ensemble compare verywell with data-driven models and SIF over the Western Europeregion despite the lack of crop-specific modules in the Trendymodels. We hypothesize that this is due to the fact that WestEuropean crops mostly follow the seasonality of grasslands, bywhich crops are often represented in the models. However, thesemodels fail to describe crop phenology at the other regions and,more significantly, the multiple cropping in China and India. Atime shift of the peak GPP estimates at the US CB with respect toSIF-based and data-driven GPP can be explained by modelinguncertainties associated to irrigation and also by the fact thatsowing and harvesting time in the US CB is different from thelifetime of natural grassland (peak in June), as opposed to WesternEurope. Also, process-based models substantially underestimatethe peak GPP values for the US CB, India, and China regions, andtend to overestimate GPP in South America, which explains the
0.0 0.5 1.0 1.5GPP (kgC/m2/y)
0.0
0.2
0.4
0.6
0.8
NPP
, USD
A (k
gC/m
2 /y)
GPP - scaled SIFr2=0.81; p<0.001
0.0 0.5 1.0 1.5GPP (kgC/m2/y)
0.0
0.2
0.4
0.6
0.8 GPP - Data-driven modelsr2=0.71; p<0.001
0.0 0.5 1.0 1.5GPP (kgC/m2/y)
0.0
0.2
0.4
0.6
0.8 GPP - Proc.-based modelsr2=0.67; p<0.001
A B C
Fig. 5. Comparison of net primary production (NPP) estimates over the USCorn Belt (35°N–50°N, 80°W–105°W) from the USDA agricultural inventory(8) with crop GPP estimates from SIF retrievals (A) and data-driven andprocess-based model ensembles (B and C). Points correspond to 1° grid boxeswith fraction of cropland area higher than 20%. GPP and NPP values aregiven in per-total-area units (see SI Appendix, NPP Data from AgriculturalInventories). The squared Pearson’s correlation coefficient r2 and the P valueof the comparisons are shown. An analogous comparison with the inventory-based NPP from Monfreda et al. (7), which also includes Western Europe, canbe found in SI Appendix, NPP Data from Agricultural Inventories.
E1330 | www.pnas.org/cgi/doi/10.1073/pnas.1320008111 Guanter et al.
spatial patterns observed in the annual GPP comparisons in Fig. 6.These results illustrate the need for specific crop modules in globaldynamic vegetation models.Considering the growing pressure on agricultural systems to
provide for an increasing food and biofuel demand in the world, aglobal, time-resolved, and accurate analysis of crop productivity is
critically required. Crop-specific models or improved process-based biogeochemistry models including explicit crop modulescould provide projections of agricultural productivity and climateimpact on crop yields (e.g., refs. 39–41). However, local in-formation such as meteorology, planting dates and cultivarchoices, irrigation, and fertilizer application are needed. In this
-120 -90 -60 -30 0 30 60 90 120
-120 -90 -60 -30 0 30 60 90 120
-30
-15
015
3045
60
-30-15
015
3045
60
0.0 0.4 0.8 1.2 1.6GPP(SIF) crops (kgC/m2/y)
-120 -90 -60 -30 0 30 60 90 120
-120 -90 -60 -30 0 30 60 90 120
-30
-15
015
3045
60
-30-15
015
3045
60
0.00 0.25 0.50 0.75 1.00Fraction cropland area
-120 -90 -60 -30 0 30 60 90 120
-120 -90 -60 -30 0 30 60 90 120
-30
-15
015
3045
60
-30-15
015
304 5
60
-0.4 -0.2 0.0 0.2 0.4ΔGPP, Data-driven (kgC/m2/y)
-120 -90 -60 -30 0 30 60 90 120
-120 -90 -60 -30 0 30 60 90 120
-30
-15
015
3045
60
-30-15
015
3045
60
-0.4 -0.2 0.0 0.2 0.4
-120 -90 -60 -30 0 30 60 90 120
-120 -90 -60 -30 0 30 60 90 120
-30
-15
015
3045
60
-30-15
015
3045
60
-75 -50 -25 0 25 50 75ΔGPP/GPP, Data-driven (%)
-120 -90 -60 -30 0 30 60 90 120
-120 -90 -60 -30 0 30 60 90 120-3
0-1
50
1530
4560
-30-15
015
3045
60
-75 -50 -25 0 25 50 75ΔGPP/GPP, Proc.-based (%)
A B
C D
E F
ΔGPP, Proc.-based (kgC/m2/y)
Fig. 6. Spatial details of the annual SIF-based crop GPP estimates over cropland areas (A), fraction of cropland area per grid box (B), and absolute and relativedifferences between annual SIF-based crop GPP estimates and the output of data-driven models (C and E) and process-based models (D and F). Spatiallyexplicit GPP is derived through the scaling of SIF retrievals with the relationship GPP(SIF) = −0.10 + 3.72 × SIF (see SI Appendix, Derivation of Spatially-ExplicitCrop GPP Estimates). Cropland GPP is given in per-total-area units. The absolute difference ΔGPP is calculated as GPP(SIF) − GPP(model), and the relativedifference is calculated as ΔGPP over GPP(model).
US Corn Belt, [35-50°N, 80-105°W]
2 4 6 8 10 12# Month
0
1
2
3
4
5
6
Cro
p G
PP (g
C/m
2 /d) GPP Proc.-based
GPP Data-drivenGPP(SIF)
China [30-49°N, 110-135°E]
2 4 6 8 10 12# Month
0
1
2
3
4
Cro
p G
PP (g
C/m
2 /d)
Western Europe [35-55°N, -10-25°E]
2 4 6 8 10 12# Month
0
1
2
3
4
Cro
p G
PP (g
C/m
2 /d)
South America [20-40°S, 45-70°W]
2 4 6 8 10 12# Month
0
1
2
3
4
Cro
p G
PP (g
C/m
2 /d)
India [23-33°N, 70-90°E]
2 4 6 8 10 12# Month
0
1
2
3
4
5
6
Cro
p G
PP (g
C/m
2 /d)
Global [-45-70°N, -150-150°E]
2 4 6 8 10 12# Month
0.0
0.5
1.0
1.5
2.0
2.5
3.0
Cro
p G
PP (g
C/m
2/d
)
A B C
D E F
Fig. 7. (A–F) Time series of monthly crop GPP de-rived from SIF retrievals, process-based models, anddata-driven models over different cropland regionsin 2009. GPP area averages are weighted by thefraction of cropland area per grid box. Data-drivenGPP corresponds to the MPI-BGC data-driven model(27). Process-based GPP estimates are calculatedas the median of the monthly GPP estimates fromthe Trendy process-based model ensemble (28, 29)(see also SI Appendix, Table S2).
Guanter et al. PNAS | Published online March 25, 2014 | E1331
ENVIRONMEN
TAL
SCIENCE
SPN
ASPL
US
work, we have demonstrated that spaceborne SIF retrievals canprovide realistic estimates of photosynthetic uptake rates overthe largest crop belts worldwide without need of any additionalinformation. This finding indicates that SIF data can help usimprove our current models of the global carbon cycle, which wehave shown to substantially underestimate GPP in some largeagricultural regions such as the US CB and the Indo-GangeticPlain. The launch of the Orbiting Carbon Observatory-2 and theSentinel 5-Precursor satellite missions in 2014 or 2015 willenormously improve the observational potential for SIF, up toa 100-fold increase in spatiotemporal resolution (42, 43). Thiswill especially benefit measurements over the typically frag-mented agricultural areas, which suggests that SIF-based esti-mates of crop photosynthesis will soon become a unique data setfor both an unbiased monitoring of agricultural productivity andthe benchmarking of carbon cycle models.
Materials and MethodsWe have used monthly averages of SIF retrievals (26) from the GOME-2 in-strument onboard the MetOp-A platform to produce unique estimates ofglobal cropland GPP. GOME-2 SIF retrievals are performed in the 715- to758-nm spectral window. Single retrievals are quality-filtered and aggre-gated in a 0.5° grid. The GOME-2 SIF data set used in this study covers the2007–2011 time period (see SI Appendix, SIF Retrievals).
Ensembles of process-based and data-driven biogeochemistry models havebeen analyzed to assess the ability of global models to represent crop GPP(see SI Appendix, Model-Based GPP Data). The process-based model ensemblecomprises the 10 global dynamic vegetation models (CLM4C, CLM4CN,HYLAND, LPJ, LPJ-GUESS, OCN, Orichidee, SDGVM, TRIFFID, and VEGAS) in-cluded in the Trends in net land carbon exchange over the period 1980–2010(Trendy) project (28, 29). It must be noted that these models do not includeexplicit crop modules. The data-driven model ensemble consists of theMTE1, MTE2, ANN, KGB, and LUE models used by Beer et al. (9). In addition,monthly GPP estimates from the MPI-BGC data-driven model (27), whichcorresponds to the MTE1 in the data-driven model ensemble, and the MODISGPP product (MOD17) (31) have been compared with monthly flux tower-based GPP over croplands and grasslands to evaluate the ability of data-driven models to reproduce GPP at those biomes. Cropland GPP is calculatedfrom the SIF observations and the model ensembles as the product of thetotal GPP in each 0.5° grid box by the fraction of cropland area given byRamankutty et al. (6) (see SI Appendix, Derivation of Spatially-Explicit CropGPP Estimates). EVI data in Fig. 4 and SI Appendix, Comparison of Flux
Tower-Based GPP with Model GPP, SIF and Vegetation Indices, have beenextracted from the MODIS MOD13C2 product (15).
Flux tower-based GPP estimates covering the 2007–2011 period wereextracted from 14 sites in Midwest United States and Western Europe. Sitescorrespond to the Ameriflux and the European Fluxes Database networks.Only the most spatially homogeneous sites have been selected to enabledirect comparisons with the SIF observations and the GPP model outputsavailable in 0.5° grid cells. The relationship GPP = −0.1 + 3.72 × GPP derivedfrom the comparison of GOME-2 monthly SIF composites with flux towerGPP data has been used to scale SIF to GPP (see SI Appendix, Comparison ofFlux Tower-Based GPP with Model GPP, SIF and Vegetation Indices).
Large-scale NPP estimates have been derived from the USDA-NASS (38)and Monfreda et al. (7) agricultural inventory data sets. The USDA inventorycovers North America and the 2006–2008 period. It is based on a statisticalmethod to upscale county-level crop NPP data from the USDA NationalAgricultural Statistics Service (8, 38). The inventory by Monfreda et al. (7) isfor 2000. It is based on the aggregation of 175 crop classes in a 5 min by5 min grid. Inventory-based NPP is converted from per-harvested-area to per-total-area units through scaling by the fraction of harvested area, followingMonfreda et al. (7) (see SI Appendix, NPP Data from Agricultural Inventories).
ACKNOWLEDGMENTS. We thank T. Meyers (National Oceanic andAtmospheric Administration Air Resources Laboratory), D. Cook andR. Matamala (Argonne National Laboratory), A. Suyker (University ofNebraska), C. Bernhofer (Technische Universität Dresden), Z. Nagy (SzentIstván University), M. Aubinet (Université de Liège), W. Kutsch (Johann Hein-rich von Thuenen Institut), and K. Schneider (University of Cologne) for kindlyproviding eddy covariance data. We acknowledge C. Monfreda (Arizona StateUniversity), P. H. Verburg (Vrije Universiteit University Amsterdam), andN. Ramankutty (McGill University) for the crop fraction and NPP data setsand/or advice on their use, Eumetsat for the GOME-2 data, the Trendy projectfor the process-based model runs, and the USDA NASS for their agriculturalinventory data. We also thank the two anonymous reviewers and Dr. Asner fortheir valuable suggestions and comments. MODIS MOD17 GPP data weredownloaded from the server of the Numerical Terradynamic Simulation Groupat the University of Montana, MODIS MOD13 data were obtained from theMODIS Land Processes Distributed Active Archive Center archive, and MERIS-MTCI from the Infoterra Ltd server. This work used eddy covariance data ac-quired by AmeriFlux and GHG-Europe. The work by L.G., Y.Z., and M.V. hasbeen funded by the Emmy Noether Programme (GlobFluo project) of the Ger-man Research Foundation. J.J. is supported by the National Aeronautics andSpace Administration (NASA) Carbon Cycle Science program (NNH10DA001N)and G.P.-C. is supported by NASA Soil Moisture Active Passive Science DefinitionTeam (08-SMAPSDT08-0042). We also thank the W. M. Keck Foundation forfunding the New Methods to Measure Photosynthesis from Space workshopheld at the Caltech Keck Institute for Space Studies.
1. Foley JA, et al. (2011) Solutions for a cultivated planet. Nature 478(7369):337–342.2. Tilman D, Balzer C, Hill J, Befort BL (2011) Global food demand and the sustainable
intensification of agriculture. Proc Natl Acad Sci USA 108(50):20260–20264.3. Wheeler T, von Braun J (2013) Climate change impacts on global food security. Sci-
ence 341(6145):508–513.4. Battisti DS, Naylor RL (2009) Historical warnings of future food insecurity with un-
precedented seasonal heat. Science 323(5911):240–244.5. Lobell DB, et al. (2013) The critical role of extreme heat for maize production in the
United States. Nat Clim Change 3(5):497–501.6. Ramankutty N, et al. (2008) Farming the planet: 1. Geographic distribution of global
agricultural lands in the year 2000. Global Biogeochem Cycles 22:GB1003, 10.1029/2007GB002952.
7. Monfreda C, et al. (2008) Farming the planet: 2. Geographic distribution of crop areas,yields, physiological types, and net primary production in the year 2000. Global Bio-geochem Cycles 22:GB1022, 10.1029/2007GB002947.
8. Hicke JA, et al. (2004) Cropland area and net primary production computed from 30years of USDA agricultural harvest data. Earth Interact 8(10):1–20.
9. Beer C, et al. (2010) Terrestrial gross carbon dioxide uptake: Global distribution andcovariation with climate. Science 329(5993):834–838.
10. Ciais P, et al. (2005) Europe-wide reduction in primary productivity caused by the heatand drought in 2003. Nature 437(7058):529–533.
11. Schaefer K, et al. (2012) A model-data comparison of gross primary productivity:Results from the North American Carbon Program site synthesis. J Geophys Res117:G03010, 10.1029/2012JG001960.
12. Baldocchi D, et al. (2001) FLUXNET: A new tool to study the temporal and spatialvariability of ecosystem-scale carbon dioxide, water vapor, and energy flux densities.Bull Am Meteorol Soc 82(11):2415–2434.
13. Moran MS, et al. (1997) Opportunities and limitations for image-based remotesensing in precision crop management. Remote Sens Environ 61(3):319–346.
14. Gitelson AA, et al. (2006) Relationship between gross primary production and chlo-rophyll content in crops: Implications for the synoptic monitoring of vegetationproductivity. J Geophys Res 111:D08S11, 10.1029/2005JD006017.
15. Huete A, et al. (2002) Overview of the radiometric and biophysical performance ofthe modis vegetation indices. Remote Sens Environ 83(1-2):195–213.
16. Knyazikhin Y, et al. (2013) Hyperspectral remote sensing of foliar nitrogen content.Proc Natl Acad Sci USA 110(3):E185–E192.
17. Baker NR (2008) Chlorophyll fluorescence: A probe of photosynthesis in vivo. AnnuRev Plant Biol 59:89–113.
18. Meroni M, et al. (2009) Remote sensing of solar induced chlorophyll fluores-cence: Review of methods and applications. Remote Sens Environ 113(10):2037–2051.
19. Rascher U, et al. (2009) CEFLES2: The remote sensing component to quantify photo-synthetic efficiency from the leaf to the region by measuring sun-induced fluores-cence in the oxygen absorption bands. Biogeosciences 6(7):1181–1198.
20. Joiner J, et al. (2011) First observations of global and seasonal terrestrial chlorophyllfluorescence from space. Biogeosciences 8(3):637–651.
21. Frankenberg C, et al. (2011) New global observations of the terrestrial carbon cyclefrom GOSAT: Patterns of plant fluorescence with gross primary productivity. GeophysRes Lett 38:L17706, 10.1029/2011GL048738.
22. Guanter L, et al. (2012) Retrieval and global assessment of terrestrial chlorophyll fluo-rescence from GOSAT space measurements. Remote Sens Environ 121:236–251.
23. Joiner J, et al. (2012) Filling-in of near-infrared solar lines by terrestrial fluorescenceand other geophysical effects: Simulations and space-based observations fromSCIAMACHY and GOSAT. Atmos Meas Tech 5(4):809–829.
24. Lee J-E, et al. (2013) Forest productivity and water stress in Amazonia: Observationsfrom GOSAT chlorophyll fluorescence. Proc Biol Sci 280(1761):20130171.
25. Parazoo NC, et al. (2013) Interpreting seasonal changes in the carbon balance ofsouthern amazonia using measurements of XCO2 and chlorophyll fluorescence fromGOSAT. Geophys Res Lett 40(11):2829–2833.
26. Joiner J, et al. (2013) Global monitoring of terrestrial chlorophyll fluorescencefrom moderate spectral resolution near-infrared satellite measurements: Meth-odology, simulations, and application to GOME-2. Atmos Meas Tech Discuss 6(2):3883–3930.
27. Jung M, et al. (2011) Global patterns of land-atmosphere fluxes of carbon dioxide,latent heat, and sensible heat derived from eddy covariance, satellite, and meteo-rological observations. J Geophys Res 116:G00J07, 10.1029/2010JG001566.
28. Sitch S, et al. (2013) Trends and drivers of regional sources and sinks of carbon dioxideover the past two decades. Biogeosci Discuss 10(12):20113–20177.
E1332 | www.pnas.org/cgi/doi/10.1073/pnas.1320008111 Guanter et al.
29. Piao S, et al. (2013) Evaluation of terrestrial carbon cycle models for their response toclimate variability and to CO2 trends. Global Change Biol 19(7):2117–2132.
30. USDA Foreign Agricultural Service (August 2013) World Agricultural Production (USDepartment of Agriculture, Washington, DC), Circular Ser WAP 8-13, 26 pp.
31. Running SW, et al. (2004) A continuous satellite-derived measure of global terrestrialprimary production. Bioscience 54(6):547–560.
32. Zhang X, et al. (2006) Global vegetation phenology from Moderate Resolution Im-aging Spectroradiometer (MODIS): Evaluation of global patterns and comparisonwith in situ measurements. J Geophys Res 111:G04017, 10.1029/2006JG000217.
33. Monteith JL (1972) Solar-radiation and productivity in tropical ecosystems. J Appl Ecol9(3):747–766.
34. Fournier A, et al. (2012) Effect of canopy structure on sun-induced chlorophyll fluo-rescence. ISPRS J Photogramm Remote Sens 68:112–120.
35. Flexas J, et al. (2002) Steady-state chlorophyll fluorescence (Fs) measurements asa tool to follow variations of net CO2 assimilation and stomatal conductance duringwater-stress in C3 plants. Physiol Plant 114(2):231–240.
36. Zarco-Tejada PJ, et al. (2013) Spatio-temporal patterns of chlorophyll fluorescenceand physiological and structural indices acquired from hyperspectral imagery as
compared with carbon fluxes measured with eddy covariance. Remote Sens Environ133:102–115.
37. Damm A, et al. (2010) Remote sensing of sun-induced fluorescence to improve modelingof diurnal courses of gross primary production (GPP). Global Change Biol 16(1):171–186.
38. US Department of Agriculture National Agricultural Statistics Service. Cropland datalayer. Available at http://gcmd.nasa.gov/records/GCMD_USDA_NASS_CROPLAND.html.Accessed March 15, 2013.
39. Yang HS, et al. (2004) Hybrid-Maize—A maize simulation model that combines twocrop modeling approaches. Field Crops Res 87(23):131–154.
40. Keating BA, et al. (2003) An overview of APSIM, a model designed for farming sys-tems simulation. Eur J Agron 18(34):267–288.
41. Bondeau A, et al. (2007) Modelling the role of agriculture for the 20th century globalterrestrial carbon balance. Global Change Biol 13(3):679–706.
42. Frankenberg C, et al. (2014) Prospects for chlorophyll fluorescence remote sensingfrom the Orbiting Carbon Observatory-2. Remote Sens Environ, 10.1016/j.rse.2014.02.007.
43. Veefkind JP, et al. (2012) TROPOMI on the ESA Sentinel-5 Precursor: A GMES missionfor global observations of the atmospheric composition for climate, air quality andozone layer applications. Remote Sens Environ 120:70–83.
Guanter et al. PNAS | Published online March 25, 2014 | E1333
ENVIRONMEN
TAL
SCIENCE
SPN
ASPL
US