Embed Size (px)
Citation preview
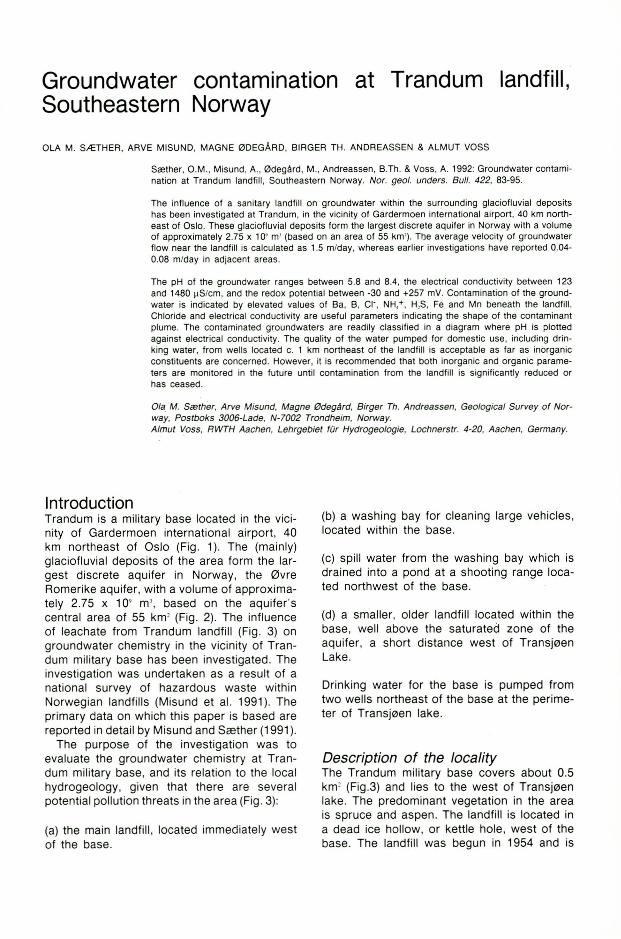
Groundwater contamination at Trandum landfill,Southeastern Norway
OlA M. SA:T HER, ARVE MISUND, MAGNE 0 DEGARD, BIRGER TH. ANDREASSEN & AlM UT VOSS
S<ether, O.M., Misund, A., 0 degArd, M., Andreassen, B.Th. & Voss, A. 1992: Groundwa ter contamination at Trandum landfil1, Southeastern Norway. Nor. geo/. unders . Bull. 422, 83-95.
The influence of a sanitary landfil1 on groundwater within the surro unding glaciofluvial depositshas been investigated at Trandum, in the vicinity of Gardermoen international airport, 40 km nort heast of Oslo. These glaciofluvial deposits form the largest discrete aquifer in Norway with a volumeof approximately 2.75 x 10' m' (based on an area of 55 km'). The average velocity of groundwaterflow near the landfill is calculated as 1.5 m/day. whereas earlier investigations have reported 0.040.08 m/day in adjacent areas .
The pH of the groundwater ranges between 5.8 and 8.4. the electr ical conductivity between 123and 1480 ~S/cm , and the redox potential between -30 and +257 mV. Contamination of the groundwater is indicated by elevated values of Ba. B. CI-, NH,+, H,S, Fe and Mn beneath the landfill.Chloride and electrica l conduc tivity are usefu l parameters indicat ing the shape of the contaminantplume. The contaminated groundwaters are readily classified in a diagram where pH is plottedagainst electrical conduct ivity. The quality of the water pumped for domestic use, including drinking water, from wells located c. 1 km northeast of the landfil1 is acceptab le as far as inorganicconsti tuent s are concerned . However , it is recommended that both inorganic and organic parameters are monitored in the future until contam ination from the landfill is significantly reduced orhas ceased.
Ote ·M. Srether, Arve Misund. Magne @degilrd, Birger Th. Andreassen, Geological Survey of Norway. Postboss 3006-Lade , N-7002 Trondneim, Norway.A/rnut Voss. RWTH Ascnen , Lehrgeb iet tur Hydroge%gie, Lochnerstr. 4-20, Aachen, Germany.
IntroductionTrandum is a military base located in the vicinity of Gardermoen international airport, 40km northeast of Oslo (Fig. 1). The (mainly)glaciofluvial deposits of the area form the largest discrete aquifer in Norway , the 0vreRomerike aquifer, with a volume of approximately 2.75 x 10' m" based on the aquifer'scentral area of 55 km' (Fig. 2). The influenceof leachate from Trandum landfill (Fig. 3) ongrou ndwater chemistry in the vicinity of Trandum military base has been investigated. Theinvestigation was undertaken as a result of anational survey of hazardous waste withinNorwegian landfill s (Misund et al. 1991). Theprimary data on which this paper is based arereported in detail by Misund and Srether (1991).
The purpose of the investigation was toevaluate the grou ndwater chemistry at Trandum military base, and its relation to the localhydrogeology, given that there are severalpotential pollution threats in the area (Fig. 3):
(a) the main landfill , located immediately westof the base.
(b) a washing bay for cleaning large vehicles,located within the base.
(c) spill water from the washing bay which isdrained into a pond at a shooting range located northwest of the base.
(d) a smaller , older landf ill located within thebase, well above the saturated zone of theaquifer , a short distance west of TransjeenLake.
Drinking water for the base is pumped fromtwo wells northeast of the base at the perimeter of Trans jeen lake.
Description of the localityThe Trandum military base covers about 0.5km' (Fig.3) and lies to the west of Transjeenlake. The predom inant vegetation in the areais spruce and aspen. The landf ill is located ina dead ice hollow, or kettle hole, west of thebase. The landfill was begun in 1954 and is
84 Ola M. Srether, Arve Misund, Magne 0degArd. Birger Th. Andreassen & Almut Voss NGU - BULL. 422. 1992
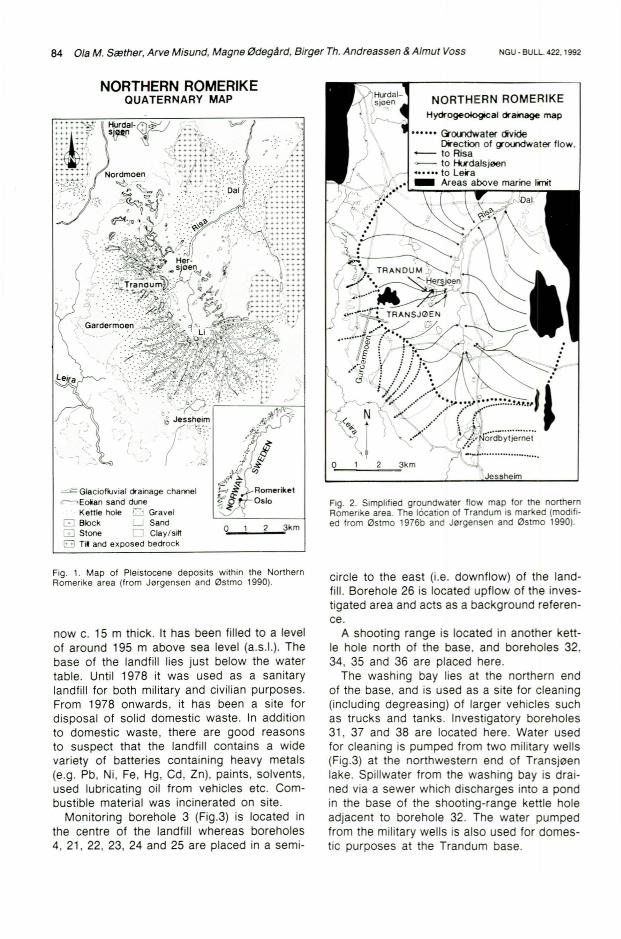
NORTHERN ROMERIKEQUATERNARY MAP
~ Glaciofluvial drainage channel,-'Eolian sand dune
Kettle hole Cl Gravelo Block '--" SandGJ Stone Cl Clay/s i"E3 Til and axposed bedrock
o ';> 3km
NORTHERN ROMERIKEHydrogeological drainage map
... ... G'cxndwaler divideDire c t ion of grcxndwater flo w.
- to Risa- 10 Hu"dalsioen...... 10 Leira_ Areas above mar ine limit
o 2 3kmJessheim
Fig . 2. Simplified groundwater flow map for the northernRomerike area. The location of Trandum is marked (modi fied from e stmo 197Gb and Jcr gensen and 0 stmo 1990).
Fig. 1. Map of Pleistocene deposits within the Nort hernRomerike area (from Jorgen sen and 0 stmo 1990).
now c. 15 m thick. It has been filled to a levelof around 195 m above sea level (a.s.I.). Thebase of the landfill lies just below the watertable. Until 1978 it was used as a sanitarylandfill for both military and civilian purposes.From 1978 onward s, it has been a site fordisposa l of solid domestic waste. In additionto domestic waste , there are good reasonsto suspect that the landfill contains a widevariety of batter ies containing heavy metals(e.g. Pb, Ni, Fe, Hg, Cd, Zn), paints, solvents,used lubricating oil from vehicles etc. Combust ible material was incinerated on site.
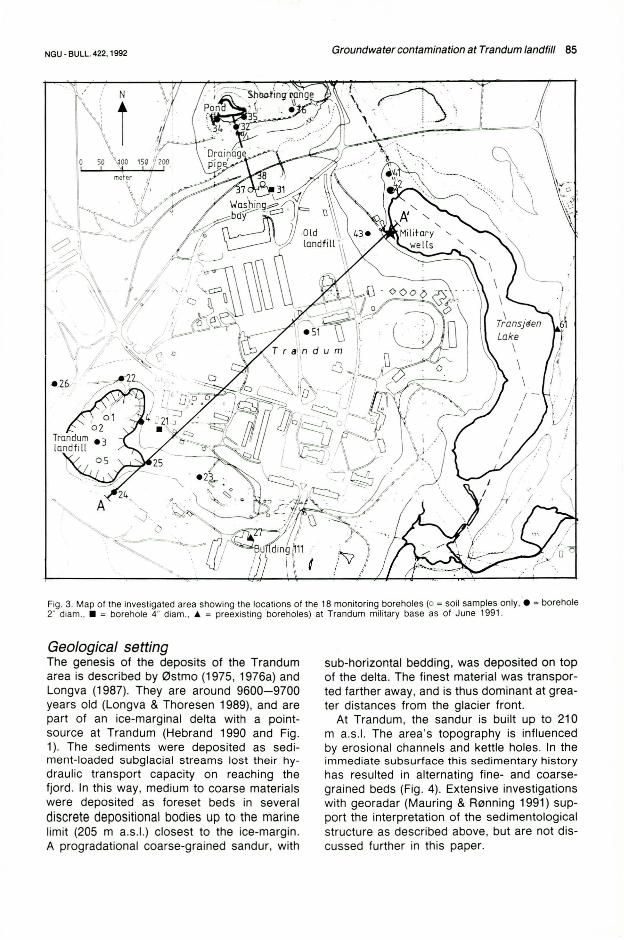
Monitor ing borehole 3 (Fig.3) is located inthe centre of the landfill whereas boreholes4, 21, 22, 23, 24 and 25 are placed in a semi-
circle to the east (Le. downflow) of the landfill. Borehole 26 is located upflow of the investigated area and acts as a background reference.
A shoot ing range is located in another kettle hole north of the base. and boreholes 32,34, 35 and 36 are placed here.
The washing bay lies at the northern endof the base, and is used as a site for cleaning(including degreasing) of larger vehicles suchas trucks and tanks. Investigatory boreholes31. 37 and 38 are located here. Water usedfor cleaning is pumped from two military wells(Fig.3) at the northwestern end of Transjeenlake. Spillwater from the washing bay is drained via a sewer which discharges into a pondin the base of the shooting-range kettle holeadjacent to borehole 32. The water pumpedfrom the military wells is also used for domestic purposes at the Trandum base.
NGU · BULL. 422, 1992 Groundwater contamination at Trandum landfill 85
,\ .'~" ".' -, l. ) .\ . ~' .;;..i _~. .~. ;,......&..:.~~_'"
/;yi-c
. .. .. .(~
Fig. 3. Map of the investigated area showing the locations of the 18 monitor ing boreholes (0 ; soil samples only, '. ; borehole2" diam.. • ; borehole 4" diam., ... ; preexisting boreholes) at Trandum military base as of June 1991.
Geological settingThe genesis of the depos its of the Trandumarea is descr ibed by 0stmo (1975, 1976a) andLongva (1987). They are around 9600-9700years old (Longva & Thoresen 1989), and arepart of an ice-marginal delta with a pointsource at Trandum (Hebrand 1990 and Fig.1). The sediments were deposited as sediment-loaded subglac ial streams lost their hydraul ic transport capacity on reaching thefjord . In this way, medium to coarse materialswere depos ited as foreset beds in severaldiscrete depositional bodies up to the marinelimit (205 m a.s.l.) closest to the ice-margin.A prog radat ional coarse-g rained sandur , with
sub-horizonta l bedding, was deposited on topof the delta. The finest mater ial was transported farther away, and is thus dominant at greater distances from the glacier front.
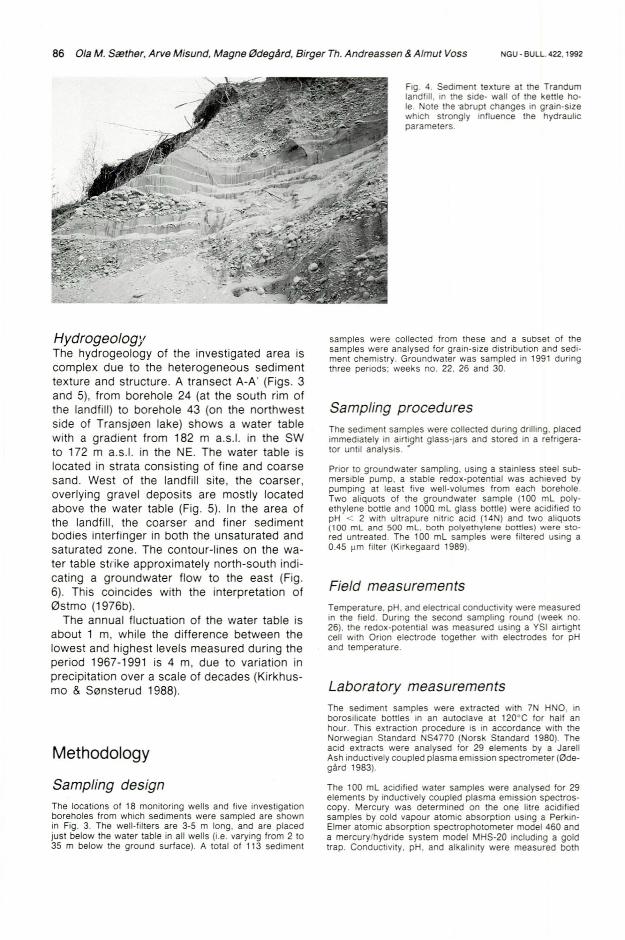
At Trandum, the sandur is built up to 210m a.s.1. The area's topography is influencedby erosional channels and kettle holes . In theimmediate subsurface this sedimentary historyhas resulted in alternating fine- and coarsegrained beds (Fig. 4). Extens ive investigationswith georadar (Mauring & R0nning 1991) support the interpretation of the sedimentologicalstructure as described above, but are not discussed further in this paper.
86 O/a M. SlBther. Arve Misund, Magne fi!JdegArd. Birger Th. Andreassen & A/mut Voss NGU - BULL. 422. 1992
Fig. 4. Sediment texture at the Trandumlandtill, in the side- wall of the kettle hole. ore the a brupt Changes in gra in-sizewhich strongly influence the hydraulicparameter s.
Hydrog eologyThe hydrogeology of the investigated area iscomp lex due to the heterogeneous sedimenttextu re and structure. A transect A-A ' (Figs. 3and 5), from borehole 24 (at the south rim ofthe landfill) to borehole 43 (on the northwestside of Transjeen lake) shows a water tablewith a gradient from 182 m a.s.1. in the SWto 172 m a.s.1. in the NE. The water table islocated in strata consisting of fine and coarsesand. West of the landfill site, the coarser,overlying gravel deposits are mostly locatedabove the water table (Fig. 5). In the area ofthe landf ill, the coarser and finer sedimentbodies interfinger in both the unsaturated andsaturated zone. The contou r-lines on the water table strike approximately north-south indicating a gro undwater flow to the east (Fig.6). This coincides with the interpretation of0 stmo (1976b).
The annual fluctuation of the water table isabout 1 m, while the difference between thelowest and highest levels measured during theperiod 1967-1991 is 4 m, due to variation inprecipitation over a scale of decades (Kirkhusmo & Sensterud 1988).
Methodology
Sampling designThe locations of 18 mon itor ing wells and five investigat ionboreh oles from which sediments were sampled are shownin Fig. 3. The well-f ilters are 3-5 m long . and are placedjust below the water table in all wells (i.e. varying from 2 to35 m below the ground surface). A tota l of 113 sediment
samples were co llected from these and a subset of thesamples were analysed for grain-s ize distr ibution and sediment chem istry . Groundwater was samp led in 1991 dur ingthree periods; weeks no. 22. 26 and 30.
Sampling proceduresThe sediment samples were collected dur ing drilling. placedimmediately in airt ight glass -jars and sto red in a refr igerator until analysis. •
Prior to qrounowate r sampling. using a stainless stee l submersible pump. a stab le redox -potential was achieved bypumping at least five well-volumes from each bore hole.Two auquots of the groundwater sample (100 rnl, polyethy lene bottle and 1000 ml glass bottle ) were acidified topH < 2 with ultra pure nitr ic acid (14 ) and two auquots(100 mL and 500 rnt.. ootn polyethy lene bottles) were stored untreated. The 100 ml samples were filtered using a0.45 urn filter (Kirkegaard 1989).
Field measurementsTempe rature. pH. and electrical conductivity were measuredin the field . During the second sampling roun d (wee no .26). the redox -potential was measured using a YSI airtightcell with Orion electrode toge ther with elect rodes for pHand temp erature .
Laboratory measurementsThe sed iment samples were extracted with 7 H 0 , inboros ilicate bottles in an autoc lave at 120·C for half anhour. This extract ion proced ure is in accordance with theNorweg ian Standard NS4770 ( orsk Standard 1980). Theacid ext racts were analysed for 29 elements by a Jare llAsh inductively coup led plasma emiss ion spectrometer (0 degArd 1983).
The 100 ml acidified water samples were analysed for 29elements by inductively coupled plasma emiss ion spectrescopy . Mercury was determ ined on the one litre acidifiedsamp les by cold vapour atom ic absorption using a PerkinElmer atomic absorp tion spectrophotometer model 460 anda mercury/hydr ide system mode l MHS-20 including a goldtrap . Conduc tivity. pH. and alkalinity were measured both

NGU - BULl. 422, 1992 Groundwater contamination at Trandum landfill 87
1:5m 85m
A '
10 '.I ' : 0I . »: Sa ...I .~ . Gr ...I ':. SII .I : :I ' 0
" ,1 11 !
275m
MSa
51
, • FGr •. ; ' Sa
:. ~ FGr•.. •. MSa
•...
Fine sand
410m
Sand and gravel
Gravel and stone . ' Gr.SI_ _ _ _ _ _ _ _ _ _ _ _ ___ _ __ _ _ _ _ ", ~r _
.: FSa
.',
21
-, FSa .; , Gr
. " Gr. ,,'"0; St /
• I• I
~·6 Sa...t St
I • .
IIIIIIIIIIIIII1 i
.".: Sa
..... FSa
M a.s.l. A208 ' 24
106204202
2001961961941921901881861841821801781761~
m170168166
164162160
158156
154
T RANSECT A-A' (see Fig. 3)100
St: StoneGr : Grave l
GGr : Coa rse grave lFGr: Fine gravel
Sa: SandMSa: Medium sandFSa: Fine sand
H: Hardground
H3: Military water supply borehole24: Well-number
meter
Fig. 5. SW-NE transect showing the sedimentology between Trandum landfill and Transjaen lake.
in the field and in the laboratory on the untreated 500 mLaliquots . Seven anions were 'analysed on the untreated 100mL aliquot by HPIC using an ion chromatograph model2010i from DIONEX. Laboratory measuremen ts were performed mainly according to methods used at the GeologicalSurvey of Norway (0degard & Andreassen 1987).
Results
Sediment samplesThere is a large variation in the texture of thesediments due to the complex depositionalhistory governed by interfingering deltas anda braided river syste m. The sediments aroundborehole 27 were found to be mainly of siltgrade below the water table (Storm 1991,Storm & Banks 1992). In borehole 23, however , located 180 m northwest of borehole 27,a sediment sample located 4 m below thewater table conta ined 75% gravel. Similarlythere are wide variations in grain-size vert ically within each borenole, as is illustrated inFigs. 4 and 5. At borehole 61 on the easternshore of Transjeen Lake the sediments con-
Fig. 6. Map of piezometric head (m a.s.l.) in the investigated area at Trandum military base, for June 1991. Numbers correspond to borehote reference numbers in Fig. 3.
sist of sand and gravel down to at least 45 mbelow the water table.
Many of the sediment samples were found

88 a la M. Saather. Arve Misund. Magne 0degard, Birger tn. Andreasse n & Almut Voss NGU - BULL 422 . 199 2
Tab le 1. Maximum enrichment factors for metals in sediment samples (relative to background samples from borenole 26). A. B and C refer to the soil cr iteria used in theNetherlands for contaminated land (Moen et al. 1986).Boreh oles are ranked accord ing to decreas ing deg ree ofsedim ent conta mination.
Element Enrichment -ABC-- Ranking of boreholefactor syste m
Pb 120x C Bh 34.5.3.4.35.38.37.32Zn 15 x B Bh 51.5.34.31.1.4.2.42Hg 10 x A Bh 5.34.31.43.41.1.4.2Mn 6 x Bh 4.34.5.23.38.1.32.35V 3.5 x Bh 5.23.34.2.32.35.38.4
Cu 3 x > A Bh 5.34.38.3.4.32.2.1Fe 2 x Bh 4.2.34.5.23.32.35.38Ni 1.7 x A Bh 4.5.32.2.51.38.34.43
to conta in levels of the heavy meta ls Pb, Zn,Hg, V, Cu and Ni well above the backgroundvalues found in borehole 26. Some meta ls,particularly Pb and Zn, show enr ichment factors of 15-120, relative to the background level ; e.g. at the shooting range , in the centralarea of the military base (borehole 51) andbelow the landfill (borehole 5) (Table 1 andFig. 3).
Groundwater flowThe hydrau lic conduct ivity, porosity and effective porosity of the aquifer have been est imatedfrom gra in-size analyses by a slight mod ificat ion of the Beyer & Schwe iger method as desc ribed by Langguth & Voigt (1980). Estimatesof the hydraulic paramete rs , based on sediment samples from below the water table alongprof ile A-A ' (Fig. 5) are shown in Table 2. Theaverage hydrau lic conductivity is 4 x 10-' rn/swhich , with an average effect ive porosity of0.29 and a hydraulic grad ient of 0.013, impliesa groundwater flow -veloc ity of about 1.5 m/day (1.85 x 10-' rn/s). These resu lts are cons is-
tent with values reported by Klemetsrud (1986)and Snekkerbakken (1990).
However, the large variation in sedimenttexture implies a correspondingly large variation in grou ndwat er flow velocity , since a volume of approx imately 150 U s (Klemetsrud 1986)is transmitted through a cross-sect ion of thesub-catchment at anyone time. For example,Storre (1991) deduced a flow velocity of 0.040.08 m/day (5 - 9 x 10.7 m/s) at borehole 27.The investigations indicate that a significantpart of the contaminat ion in the groundwaterat Trandum has its origin at the Trandum landfill, and is transported in the direction ofgroundwater flow towards the east. There is,however , little evidence of a signif icant com ponent of southerly spreading of contamination(see Figs.7); for example, there are few tracesof con tamination found in borehole 27. Thismay reflect the generally finer gra ined natureand lower permeabil ity of sediments in thesouth.
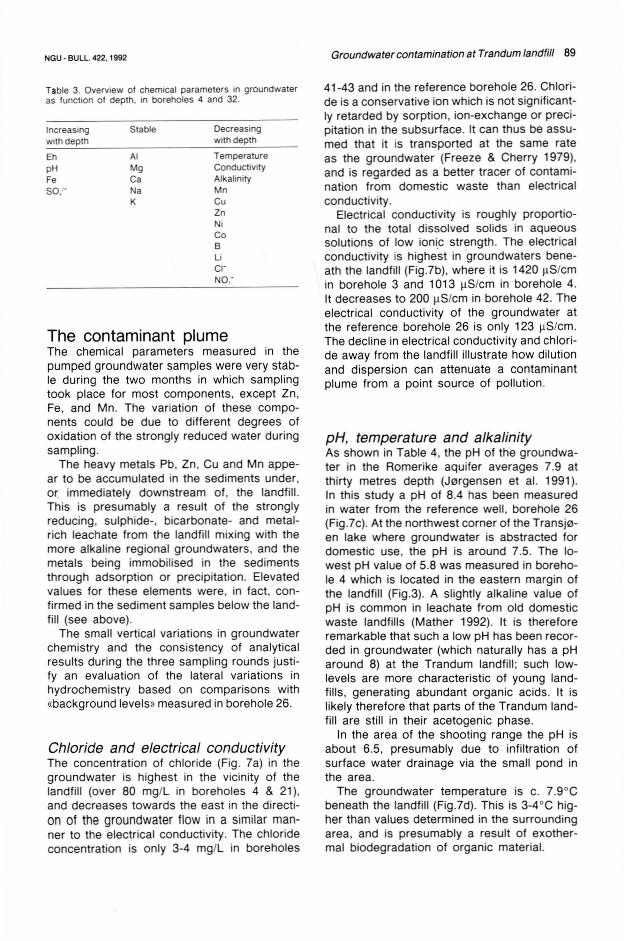
Chemical stratificationTo investigate the variation of various chemical parameters with depth, three groundwatersamples were taken during dr illing at two mete r depth intervals down from the watertable in borehole 4 (at the landfill) and bor ehole 32 (at the shooting-range). The results areshown in Table 3. The fact that the temperature, alkalinity and chlor ide concentrat ions decrease with depth at the landfill , and that theEh and pH increase, indicate that the groundwate r is most polluted in the upper zone ofthe aquifer. Electr ical conductivity , and thustota l dissolved solids , also shows a slightdecrease with depth in borehole 4 (from 1226to 1142 J-l S/cm; i.e. by 6.9%), but is constantin borehole 32.
Tab le 2. Estimates of the hydrau lic paramet ers based on grain- size dist ributions of sediment samples from below the wate rtable (see Langguth & Voigt 1980). d; & d. , are gra in size paramete rs. PIn) = poros ity. PIn,,) = effective porosity . P(S .) =co rrection factor for effe ctive poros ity.
Bore hole c, c... u C Hydraulic P P P Gradient Real Realno.& con e. (n) (S ,) (n..) (i) veloc ity veloci tydep th (m/s) m/s mid
2 4- 18 0 .29 0 .64 2 0 .0 1 BA . 10 " 0 .3 5 0 .9 0 .32 0-01 3 3.4 . ID " 2.925-14 0.09 1.3 14 0.007 5.7 . ID " 0.28 0.8 0.22 0.013 3.4 . 10" 0.2921-26 0.09 0.2 2 0.01 7.4 . 10" 0.35 0.8 0.28 0.013 3.4 .10- 0.2951-33 0.16 0.47 3 0.009 2.3 . 10-' 0.33 0.9 0.29 0-017 1.3 . ID " 1.1643-18 0.22 0.47 2 0.01 4.8 . 10-' 0.35 0.9 0.32 0.025 3.8 . 10"' 3.2444-18 0.28 0.8 '3 0.009 7.4 . 10-' 0.34 0.9 0.31
NGU - BULL. 422, 1992 Groundwater contamination at Trandum landfill 89
Table 3. Overv iew of chem ical parame ters in groundwateras funct ion of depth . in borenotes 4 and 32.
Chloride and electrical conductivityThe concentration of chloride (Fig. 7a) in thegroundwater is highest in the vicinity of thelandfill (over 80 mg/L in boreholes 4 & 21),and decreases towards the east in the direction of the groundwater flow in a similar manner to the electrical conductivity. The chlorideconcentration is only 3-4 mg/L in boreholes
The contaminant plumeThe chemical parameters measured in thepumped groundwater samples were very stable during the two months in which samplingtook place for most components, except Zn,Fe, and Mn. The variation of these components could be due to different degrees ofoxidation of the strongly reduced water duringsampling.
The heavy metals Pb, Zn, Cu and Mn appear to be accumulated in the sediments under,or. immediately downstream of , the landftll.This is presumably a result of the stronglyreducing, sulphide-, bicarbonate- and metalrich leachate from the landfill mixing with themore alkaline regional groundwaters, and themetals being immobilised in the sedimentsthrou gh adsorption or precipitation. Elevatedvalues for these elements were, in fact , confirmed in the sediment samples below the landfill (see above).
The small vertical variations in groundwaterchemistry and the consistency of analyticalresults during the three sampling rounds justify an evaluation of the lateral variations inhydrochemistry based on comparisons with«background levels»measured in borehole 26.
Increasingwith depth
EhpHFeSO,'-
Stable
AIMgCaNaK
Decreasingwith depth
TemperatureConductivityAlka linityMnCuZnNiCoBLiCI-NO.-
41-43 and in the reference borehole 26. Chloride is a conservative ion which is not significantly retarded by sorption, ion-exchange or precipitation in the subsurface. It can thus be assumed that it is transported at the same rateas the grou ndwater (Freeze & Cherry 1979),and is regarded as a better tracer of contam ination from domestic waste than electr icalconductivity.
Electrical conductivity is rough ly proportional to the tota l dissolved solids in aqueoussolutions of low ionic strength. The electr icalconductivity is highest in "groundwaters beneath the landfill (Fig.7b), where it is 1420 J1 S/cmin borehole 3 and 1013 J1 S/cm in borehole 4.It decreases to 200 J1 S/cm in borehole 42. Theelectrical conductivity of the groundwater atthe reference borehole 26 is only 123 J1 S/cm.The decline in electrical conductivity and chlor ide away from the landfill illustrate how dilutionand dispersion can attenuate a contaminantplume from a point source of pollut ion.
pH, temperature and alkalinityAs shown in Table 4, the pH of the groundwater in the Romerike aquifer averages 7.9 atthirty metres depth (Jerqensen et al. 1991).In this study a pH of 8.4 has been measuredin water from the reference well, borehole 26(Fig.7c). At the northwest corner of the Transjeen lake where groundwater is abstracted fordomestic use, the pH is around 7.5. The lowest pH value of 5.8 was measured in borehole 4 which is located in the eastern margin ofthe landfill (Fig.3). A slightly alkaline value ofpH is common in leachate from old domesticwaste landfills (Mather 1992). It is thereforeremarkable that such a low pH has been recorded in groundwater (which naturally has a pHaround 8) at the Trandu m landf ill; such lowlevels are more characteristic of young landfills , generating abundant organ ic acids. It islikely therefore that parts of the Trandum landfill are still in their acetogen ic phase .
In the area of the shoot ing range the pH isabout 6.5, presumably due to infiltration ofsurface water drainage via the small pond inthe area.
The groundwater temperature is c. 7.9°Cbeneath the landfill (Fig.7d). This is 3-4°C higher than values determined in the surroundingarea, and is presumably a result of exothermal biodegradation of organic material.

90 Gla M. Srether, Arve Misund. Magn e 0 deg;Jrd. Birger Th. Andreassen & Almut Voss GU · BULL. 422. 1992
,..I
500
.~Jildi ng III
Washingha) .:....- ---fi7
b )0 - (mg/L )
0100200'---'--'
mete r
~liIita l")
" el l\ ~
)~Transjeen
Lake. 5.6
5 ~. 1.0Building III
a )
Of1)f f'SSI'd~ ta lUM
o 100 200~
OtprtSS fd~valu"
Tempera ure
•
, . 19ShOOlm£~. e 57ra nge r. 3
3 9
Tra ndumlandfill
f )
d)
N ...I
pH
o 100 200~
meter
s o~- (mg/ L )
:\1i1itary
" ell\ ~
)8~Transj een
Lake
Shooti ngrang e
6.5
7.5
·~~: I-d-i n-g-I-I-I-- 8,0
Shooting~ e Hra nge 8.5~~·5
Washin 2ha) .::...- - -t-£ 7'
Wash ineba~ ":"- - -7' ''EJ'
e )
c )
Fig. 7. Contour maps showing the distr ibut ion of a) chlor ide (rng/L). b) electrical conductivity (li S/cm). c) pH. d) temperature (0C).e) sulphate (mgIL). and f) nitrate (mg NO; /L) in the groun,jwater of the investigated area.

NGU • BULL. 422, 1992 Groundwater contam ination at Trandum landfill 91
Table 4. Chemical parameters in groundwater derived from this investigation, results from other investigations and SIFFsquality requirements for inorganic constituents in drink ing water. All concentrations are in mg/L. Trsj: Transjeen lake, Msb:Military supply borehole, Dgw: Deep groundwater sample collected at 30 m depth at Furusmo, (G): Good, (A) : Acceptable,(P): Poor quality, SIFF = drinking water requirements (SIFF 1967).
Sample Na K Mg Ca Cl' SO.'· NO; ·N Alk Cond pHmmollL JlS/cm
Risa' 3.1 1.2 2.9 31.4 2.9 12.1 0.1 1.6 172 7.7Aurtjern' 1.4 0.5 0.6 3.7 1.1 3.7 0.1 0.3 30 6.7Trsj' 5.6 1.5 4.7 50.9 6.2 16.3 < 0.1 2.6 255 7.6Trsj 4.1 < 0.2 3.5 51.6 5.5 16.6 < 0.1 2.4 259 6.2Build. l ll + 3.5 1.0 3.0 53.0 2.5 13.0 2.0 2.7 290 6.1Build. 111 2.5 < 0.2 1.7 36.0 2.0 11.7 0.6 2.1 221 6.1Bh26 2.0 < 0.2 1.9 17.6 3.4 7.0 0.1 1.1 123 B.4Bh3 45 34.6 30 146 76.4 0.2 < 0.1 1,3.6 1420 7.1Bh43 6.7 < 0.2 6.9 126 6.0 19.7 4.4 6.6 644 7.5Msb 3.4 1.1 3.6 56.2 4.0 17.6 < 0.1 2.7 275 6.0Dgw' 1.9 1.25 2.5 39.1 1.1 14.9 < 0.1 1.9 202 7.9SIFF < 20 (G) > 20 (P) 15·25 (G) > 200 (P) > 100 (P) > 10 (p) < 1.0 (G) 6.5-9.0 (A)
• Data from Jerqensen et al. (1991)+ Data from Storm (1991).
Alkalinity varies between 1 mmollL at thereference well to 14 mmol/L in borehole 3.This reflects the high concentration of bicarbonate beneath the landfill due to the disinte grat ion of organic refuse. Johansen & Carlson(1976) report an alkalinity between 6 and 41mmol/L in leachate from six landfills in Norway .
Sulphur and nitrogenConcentranons of more than 100 mg/L sulphate were found in borehole 4 (Fig:7e). Elevatedvalues of 10 to 30 mg/L were also found inboreholes 21, 23, 24, 25, 31, 43 and 51. Thebackground value, as measured in borehole26, was 6-7 mg/L. The concentration of sulphate in borehole 3 was very low « 0.2 mg/L), buta potent smell of HzS gas was evident, indicating reduc ing cond itions under the landfill.This is reflected in the redox - potential whichwas found to be -30 mV in borehole 3, incontrast to over +100 mV in pumped samplesfrom the adjacent areas .
The concentrat ion of nitrate is less than 0.3mg NO,'/L in the reference borehole 26 (Fig.7f). The nitrate concentrat ions are below thedetec tion limit (0.05 mg/L) in boreholes 3, 21and 24 located centrally and just east of thelandfil l. However, nitrogen in the groundwaterin the vicinity of the landfill is present asammonium ion (20-25 mg/L ) due to the stro ngly reducing conditions. Nitrite was only detected in borehole 25 indicating a transition inredox-conditions in this area. The highest concentrations (31.2 mg/L) of nitrate were foundin borehole 36, prob ably deriving from gunpow-
der from the shooting range. Nitrogen in allthree forms is believed to ref lect the influenceof anthropogenic sources, including the landfill.
Discussion
Classification of the groundwatersThe groundwater samples are of calciumbicarbonate type (Fig. 8) with a pH between5.8 and 8.4. Elevated concentrations of Mg,Na and K are found in the waters beneath thelandfill , compared to the less- or uncontaminated waters such as in boreho le 26. The percent proportion of Ca is, however, lower inthe vicinity of the landfill (Fig.8), relative to theother major cations. Whereas Cl' concentrat ions are high in the contam inated waters in thevicinity of the landfill, differe nces in the bicarbonate and sulphate (due to the SUlphide tosulphate redox trans ition) concentrat ions cause the neighbouring boreholes 3 and 4 to bewidely separated on the anion-tr iangle, andthus on the central diamond , of the Piper diagram (Fig.8).
The conta minated groundwaters are readilyclass ified in a diagram where pH is plottedagainst electr ical conductivity (Fig. 9):
(a) Waters with the lowest pH-values and highest cond uctivities are found in wells 3, 4, 21,23 and 25, Le. those surrounding the landfill.These are the most contaminated groundw aters.

92 O/a M. SiBther, Arve Misund. Magne 0degard, Birger Th. Andreassen & A/mut Voss NGU - BULL. 422. 1992
Wells contaminatedby landf i ll leacha es
WELL 3 *WELL 4 xWELL 26 0
WELL 21 •WELL 25 •WELLS 22,23,24,27,31.32,34,35,36, £)41, 42,43, 51 (f}f1
(b) Boreholes 31, 43 and 51 (beneath the military base) conta in water with slightly elevatedTDS (i.e. higher conductivity) but with «normal» pH values . It is poss ible that these groundwaters are slight ly contam inated by the outerfr inges of the contaminant plume.
(c) Groundwate r samples from the boreholesat the shooting range (boreholes 34, 35 and36) have a low pH, but the conductivity iswe ll below 400 ll S/cm. They cannot be cons idered as contaminated. The lower pH is presu mab ly due to infiltration of Iow-pH, low TDSsurface water drainage (including dra inagefrom the wash ing bay) through the relativelythin unsaturated zone in the base of the kett le hole.
(d) The gro undwa ters from wells 22, 24, 32,41, 42 are all fairly similar in quality to thatfrom bore hole 26 (normal pH and low TDS).
Saturation indicesThe natura l groundwaters in the 0vre Romerike aquifer are in equilibr ium with the (Ca-r ,
Fig. 8. Piper-diagram Showing the chemical composmon of the groundwate rsamples. Well 26 acts as a backgroundreference and is located up-gra dientfrom the land!;I!.
Anion10(l 0/0
Mg++) CO,= -type found in these deposits (J0rgensen et al. 1991). The state of equilibr iumbetween the groundwaters and several minerals has been estimated using a computercode based on thermodynamic calculationsof ion act ivity products (lAP) which in turn arerelated to equilibrium constants (Keq), ionicstrength and ion activity coeff icients. A calculation of the saturat ion indices (SI= 10g(IAPIKeq) = pKeq - pIAP) for calcite in each well(Fig. 10a) indicates that the groundwatersarou nd the landfill and at the shooting rangeare significantly undersaturated in spite of thehigh alkalinity and high concentra tions of calcium measured in these areas. This is a result of the low pH which causes the calcite tobe consumed at a higher rate than it is produced .
The acid pro duced by the landfill com binedwith the anaerobic environment generates reduced species of sulphur (H,S, HS') and nitrogen (NH,+, NO,'). The transition between NH,+and NO,' is located between boreholes 3 and25 (Fig. 7f). The redox boundary between H,Sand SO,= is indirectly delineated in Fig. 10bwhere the saturation indices of barite from
NGU - BULL. 422, 1992 Groundwater contamination at Trandum landfill 93
1600-,---------- - ------,-------- ---------,
8.587.5
b)
7
0 3
o DS
0 21
6.5
0 4
6
a)
0 25 0 23 43rn 0 51
- - - - - - - - - - - - -- - - - - - ~ - - - - - -~ - - - - - - - -C) I d) 0 41 0 22
0 34 0350 36 I 24003~FB oTNI 420I 0 26I
O -+-----,------,----~:.....-r__----:.---.___---___.----____j
5.5
E 1400U-CfJ 1200:::1.>--'S; 1000-U:::J"0 800c0o
600roo.;;::
400-U(1)
W 200
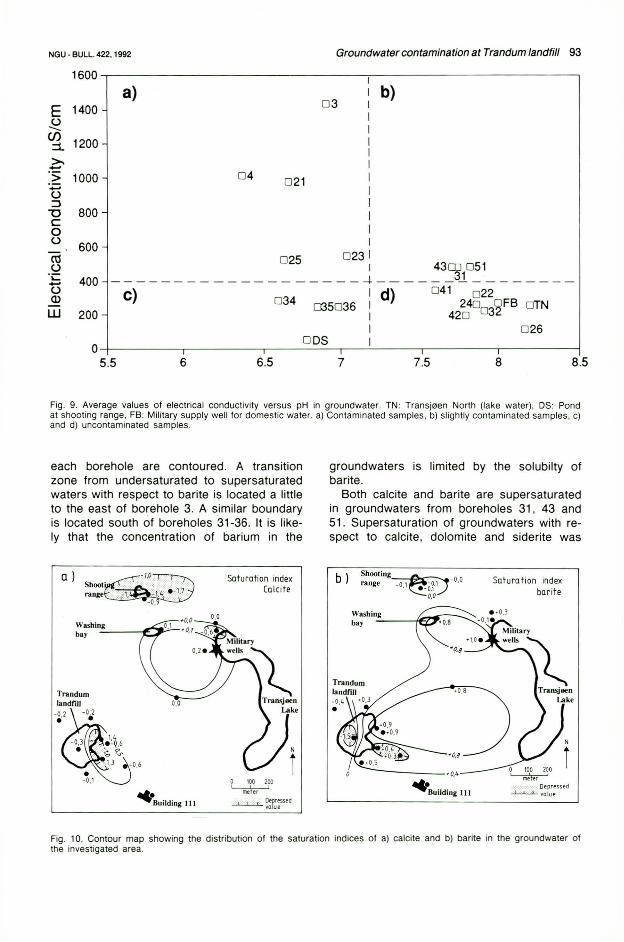
Fig. 9. Average values of electr ical conductivity versus pH in groundwater. TN: Transjeen North (lake water), OS: Pondat shoot ing range. FB: Military supply well for domestic water. a) Contaminated samples . b) slightly contaminated samples. c)and d) uncontaminated samples.
each borehole are contoured. A transitionzone from undersaturated to supersaturatedwaters with respect to barite is located a littleto the east of borehole 3. A similar bounda ryis located south of boreho les 31-36. It is likely that the concentration of barium in the
groundwaters is limited by the solubilty ofbarite.
Both calcite and barite are supersaturatedin groundwaters from boreholes 31, 43 and51. Supersaturation of groundwaters with respect to calcite, dolomite and sider ite was
Saturalion indexbarite
---- - - - 0.4
~·BUild i ng 111
w ash ing_ _ ~f.=l:~-;;--"bay -
b) ShOOtinJ:~ra nge -0 1 -0.1 -0,0
, e - O.l0.0
o lOO 200~
meter
-L-I...-.L. e~r~:sse d
Saturat ion indexCalcite
~·BUil d i ng 11I
-0.6
Washin..:g__---i~p-bay
Fig. 10. Contour map showing the distr ibution of the saturat ion indices of a) calcite and b) barite in the groundwater ofthe investigated area.

94 Ola M. Seether, Arve Misund, Magne 0degard, Birger Th. Andreassen & Almut Voss NGU - BULL. 422. 1992
also detected in a plume from the KL Landfillin Kalamazoo County, Michigan, USA (Kehew& Passero 1990).
Comparison between water typesA comparison of the chemical analyses obtained in this study with resu lts from earlier investigations at Building 111 (Storm 1991 - Table4), shows a variation of up to 25% in TDSat bore hole 27 (Fig.3). This may be due todifferent sampling proced ures , particularly withrespect to pumping before sa.np llnq. At Transjeen lake the resu lts vary only by 2% (forTDS) during a six month period .
The concentrat ions of the major ions Na-,K+, Mg++ , Cl', are 10-30 times higher in thecontam inated wate rs at borehole 3 than at theMilita ry supply wells and Trans jeen lake (whichis almost wholly groundwater-fed), indicatingan attenuation of at least one order of magnitude across the investigated area.
There is a two-fold net increase in spec ificconductivity from the reference boreho le 26to the military domestic water supp ly wellswhere drinking water is withdrawn. This latterwater is very similar to the waters of Trans]een lake. This implies that the gro undwater inthe vicinity of the lake has acquired a significant amount of all major ions (except NO,')dur ing its dra inage across the investigatedarea. This water fails to meet the SIFF qualitystand ards requ ired for «good» drinking waterbecause of its high cont ent of calcium (SIFF1987), but it is regarded as of «acceptable»qua lity.
ConclusionsThe groundwater flow at the site is in an easterly direction with a real velocity of 1.5 m/day.
Significant contamination of soils andgroundwater in the immediate surround ingsof the landfill at Trandum has been detected .Sediments conta in levels of Pb, Zn, Hg, Mn,V, Cu and Ni which are well above background values. However, only Pb and Zn arefound to exceed the European Community'srequirements for further mapping of the extent of the pollution.
The grou ndwater is not cont aminated belowthe washing bay nor in the vicinity of its sewer discharge at the shoot ing range.
The qrou ndwaters electr ical conductivitydecreases from over 1000 ~S/cm just beneaththe landf ill to 200' ~ S/cm one kilometre downgradient to the east. Upstream, the background level is 123 ~S/cm at a referencewell 100 m NW of the center of the landfill .The concentrat ions of the major ions Na-, K+,Mg++ , CI-, are 10-30 times higher in the contaminated waters at bore hole 3 than at the military wells and Transjoen lake, indicating an attenuation of at least one order of magnitudeacross the investigated area.
The gro undwaters , apart from those in theimmediate vicinity of the landfill, tend to besupersaturated with respect to calcite andbarite suggesting that the concentrations ofCa++, HCO,-, and Ba are part ially govemedby the saturation of these minerals.
It is recommended that both inorganic andorgan ic compo nents of the grou ndwater aremon itored in the future until contamination fromthe landfill is significantly reduced or has ceased.
Acknowledgemen tThis work was commiss ioned by the orweqian Department of Defence. The emp loyees at Trandum and at Forsva rets Bygningstjeneste. Harnar, are thanked for the ir coo pera tion and ass istance in releasing this data for pub lication .

NGU·BULL.422,1992
ReferencesFreeze R. A. & Cherry J. A. 1979: Groundwater. Prentice
Hall Inc., Englewood Cliffs, New Jersey 07632. 604 pp.Hebrand, M. 1990: Garderrnoen - jordartsgeologisk modell.
VIAK AB-rapport 12<02.662360, 7 pp.Johansen, a.J. & Carlson, OA 1976: Characterization ot
sanitary JandfiJI leachates. Water Research, 10, 11291134.
Jerqensen, P. & 0stmo, S.R. 1990: Hydrogeology in theRomerike area, SOuthern Norway. Nor.geol.unders.418, 19-26.
Jerqensen, P., Stuanes, A.a. & 0stmo, S.R. 1991: Aqueousgeochemistry of the Romerike area, Southern Norway.Nor.geol.unders. 420, 57-67.
Kehew, A.E. & Passero, R.N. 1990: pH and redox bufferingmechanisms in a glacial drift aquifer contaminated bylandfiJI leachate. Groundwater, 28, 5, 728-737.
Kirkegaard, C. 1989: FOrpumpning. In Kjeldsen, P. (ed.)Grundvandsprovetagning og feltm~ling. Utredningsrapport U3, Lossepladsprosjektet, Danmark, April 1989,41-66.
Kirkhusmo, L.A. & Sensterud, R. 1988: OvervAking av grunnvann. Landsomfattende grunnvannsnett (LGN). Nor.geol.unders. report 88.046, 72pp.
Klemetsrud, T. 1986: Klausulering av grunnvannsbmnnerved Transjeen, Trandum leir. Nor.geol.unders. report86.006.
Langguth, H.R. & Voigt, R.H. 1980: Hydrogeologische Methoden. Springer Verlag, 486 pp.
Longva, O. 1987: Ullensaker 1914-11. Beskrivelse til kvarteergeologisk kart - M 1:50.000. Nor.qeol.unders. skritter 76.
Longva, O. & Thoresen, M.K. 1989: The age of the Hauerseter delta. Norsk Geol. Tidsskrttt, 69, 131-134.
Mather, J.D. 1992: Filosofen bak avfallsdeponering i Stor. britannia - NAvrerende utviklinq og konsekvenser for
milj0et. Vann, 27, 1C, 158-165.Mauring, E. & R0nning, J.S. 1991: Underseketser av foruren
set grunn/grunnvann pA Trandurn. GeoradarmAlinger.Nor.geol.unders. report 91.218
Misund, A. & Srether, a.M. 1991:·UnderS0kelser av torurenset grunn og grunnvann ved Trandum militrerJeir. Nor.geol.unders. report 91.228, 137 pp.
Groundwatercontamination at Trandum landfill 95
Misund, A., Banks, D., Morland, G. & Brunstad, H. 1991:Norwegian national survey of hazardous waste in landfills and contaminated grouM. Waste Manage. Today(News J.), 4, No.8, Aug.1991, 30-35.
Moen, J.E.T., Cornet, J.P. & Evers, CWA 1986: Soil protection and remedial action: criteria for decision makingand standarizatlon of requirements. In Assink J.W. &Vanderbrink W.J. (eds.) Contaminated soil, MartinusNijhoff Publishers, Dordrechl.
Norsk Standard 1980: Vannunders0kelse. Metaller i vann,slam og sedimenter. Norsk standard P193, NS4770,243-251.
SIFF 1987: Kvalitetsnormer for drikkevann. Statens Instituttfor Folkehelse (SIFF), repon 'Drikkevsnn G2'. ISBN82-7364-013-2,72 pp.
Snekkerbakken, A. M. 1990: Grunnvannet pA 0vre Romerike - SArbarhetskartJegging. VIAK AB report, Karlstad,Sweden.
Storm, G. 1991: Kartlegging av oljeforurenset grunn/grunnvann ved bygning 111, Trandum militrerleir. Nor.geol.uncers. report 91.155, 71 pp.
Storm, G. & Banks, D. 1992: Oil leakages on the 0vreRomerike aquifer, Southern Norway. Nor. geol. unoers.422 (this volume).
0degArd, M. 1983: Utvidet program for analyse av geologiske materialer basert pA syreekstraksjon og plasmaspektrometri. Nor.qeol.unders. report 2113, 36 pp.
0degArd, M. & Andreassen, B. Th. 1987: Methods forwater analysis at the Geological Survey of Norway. In:Geomedical Consequences of Chemical Compositionof rresnwster. The Norwegian Academy of Science andLetters, 133-150.
0stmo, S.R. 1975: Rapport vedrerenda kartlegging medspesiell vekt pA registrering 09 undersekelsar av sandog grusforekomster i Ullensaker kommune, Akershusfylke. Nor.qeot.unoers. report 0-75045.
0stmo, S.R. 1976a: Gardermoen. Kvartrergeologisk kart C01205152. Scale 1:20.000. Nor.qeot.untiers.
0stmo, S.R. 1976b: HydrogeOlogisk kart over 0vre Romerike, Scale 1:20.000. Nor.geol.unders.
Manuscript received December 1991; revised typescript accepted May 1992.