Embed Size (px)
Citation preview

8/8/2019 Hay Tham Khao
http://slidepdf.com/reader/full/hay-tham-khao 1/28

8/8/2019 Hay Tham Khao
http://slidepdf.com/reader/full/hay-tham-khao 2/28
©2010. The Mosaic Company. All rights reserved. K-Mag is a registered trademark of The Mosaic Company. KMAG-0060
TUNE IN TO K-MAG.
HIGHER YIELDS.FOR
A
• Ask or K-Mag® in your next ertilizer blend
• Potassium, magnesium and sulur — three nutrients in one
• All nutrients are readily available to the crop
• Visit www.kmag.com to view the new inormational video
8/8/2019 Hay Tham Khao
http://slidepdf.com/reader/full/hay-tham-khao 3/28
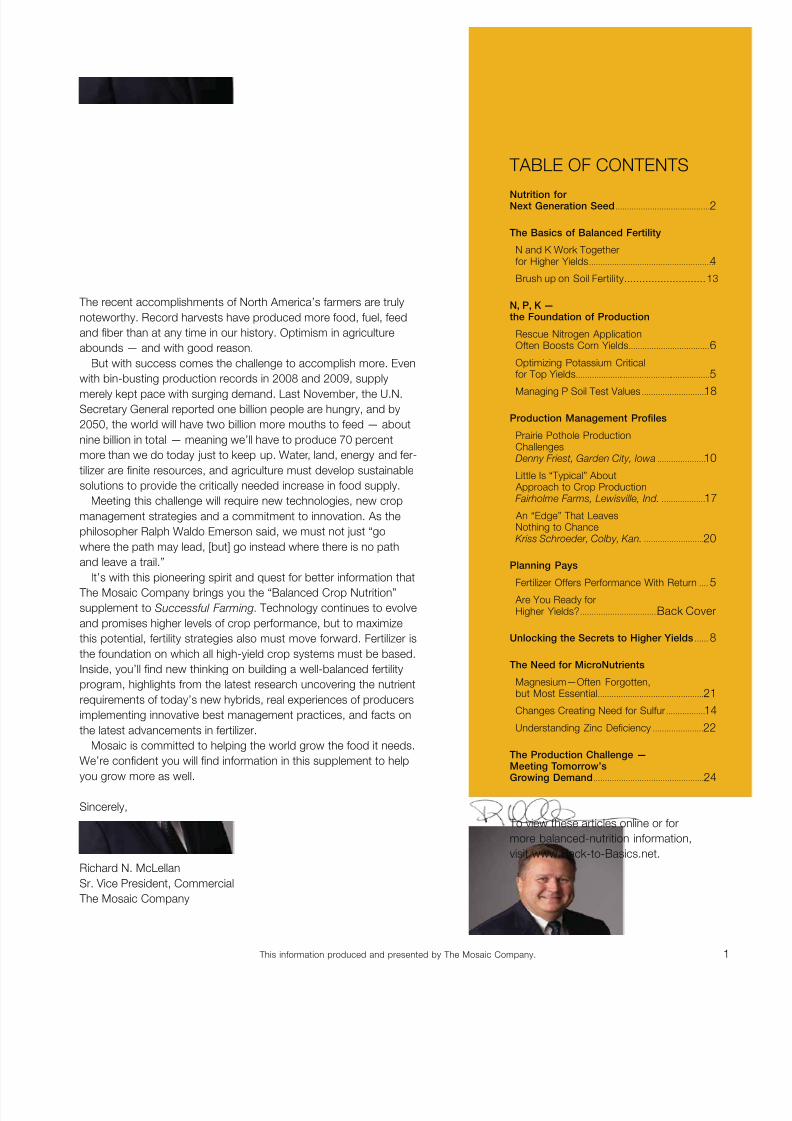
The recent accomplishments o North America’s armers are truly
noteworthy. Record harvests have produced more ood, uel, eed
and fber than at any time in our history. Optimism in agriculture
abounds — and with good reason.
But with success comes the challenge to accomplish more. Even
with bin-busting production records in 2008 and 2009, supply
merely kept pace with surging demand. Last November, the U.N.Secretary General reported one billion people are hungry, and by
2050, the world will have two billion more mouths to eed — about
nine billion in total — meaning we’ll have to produce 70 percent
more than we do today just to keep up. Water, land, energy and er-
tilizer are fnite resources, and agriculture must develop sustainable
solutions to provide the critically needed increase in ood supply.
Meeting this challenge will require new technologies, new crop
management strategies and a commitment to innovation. As the
philosopher Ralph Waldo Emerson said, we must not just “go
where the path may lead, [but] go instead where there is no path
and leave a trail.”
It’s with this pioneering spirit and quest or better inormation that
The Mosaic Company brings you the “Balanced Crop Nutrition”
supplement to Successful Farming. Technology continues to evolve
and promises higher levels o crop perormance, but to maximize
this potential, ertility strategies also must move orward. Fertilizer is
the oundation on which all high-yield crop systems must be based.
Inside, you’ll fnd new thinking on building a well-balanced ertility
program, highlights rom the latest research uncovering the nutrient
requirements o today’s new hybrids, real experiences o producers
implementing innovative best management practices, and acts on
the latest advancements in ertilizer.
Mosaic is committed to helping the world grow the ood it needs.
We’re confdent you will fnd inormation in this supplement to help
you grow more as well.
Sincerely,
Richard N. McLellan
Sr. Vice President, Commercial
The Mosaic Company
TABLE OF CONTENTS
Nutrition orNext Generation Seed..........................................2
The Basics o Balanced Fertility
N and K Work Togetheror Higher Yields......................................................4
Brush up on Soil Fertility ...........................13
N, P, K —the Foundation o Production
Rescue Nitrogen ApplicationOten Boosts Corn Yields ................................... 6
Optimizing Potassium Criticalor Top Yields........................................................... 5
Managing P Soil Test Values ............................18
Production Management Profles
Prairie Pothole ProductionChallengesDenny Friest, Garden City, Iowa .....................10
Little Is “Typical” About Approach to Crop ProductionFairholme Farms, Lewisville, Ind. ...................17
An “Edge” That LeavesNothing to ChanceKriss Schroeder, Colby, Kan. ..........................20
Planning Pays
Fertilizer Oers Perormance With Return .... 5 Are You Ready orHigher Yields?..................................Back Cover
Unlocking the Secrets to Higher Yields ...... 8
The Need or MicroNutrients
Magnesium—Oten Forgotten,but Most Essential ................................................21
Changes Creating Need or Sulur.................14
Understanding Zinc Defciency ......................22
The Production Challenge —Meeting Tomorrow’s
Growing Demand ..................................................24
To view these articles online or or
more balanced-nutrition inormation,
visit www.Back-to-Basics.net.
This inormation produced and presented by The Mosaic Company. 1
8/8/2019 Hay Tham Khao
http://slidepdf.com/reader/full/hay-tham-khao 4/28
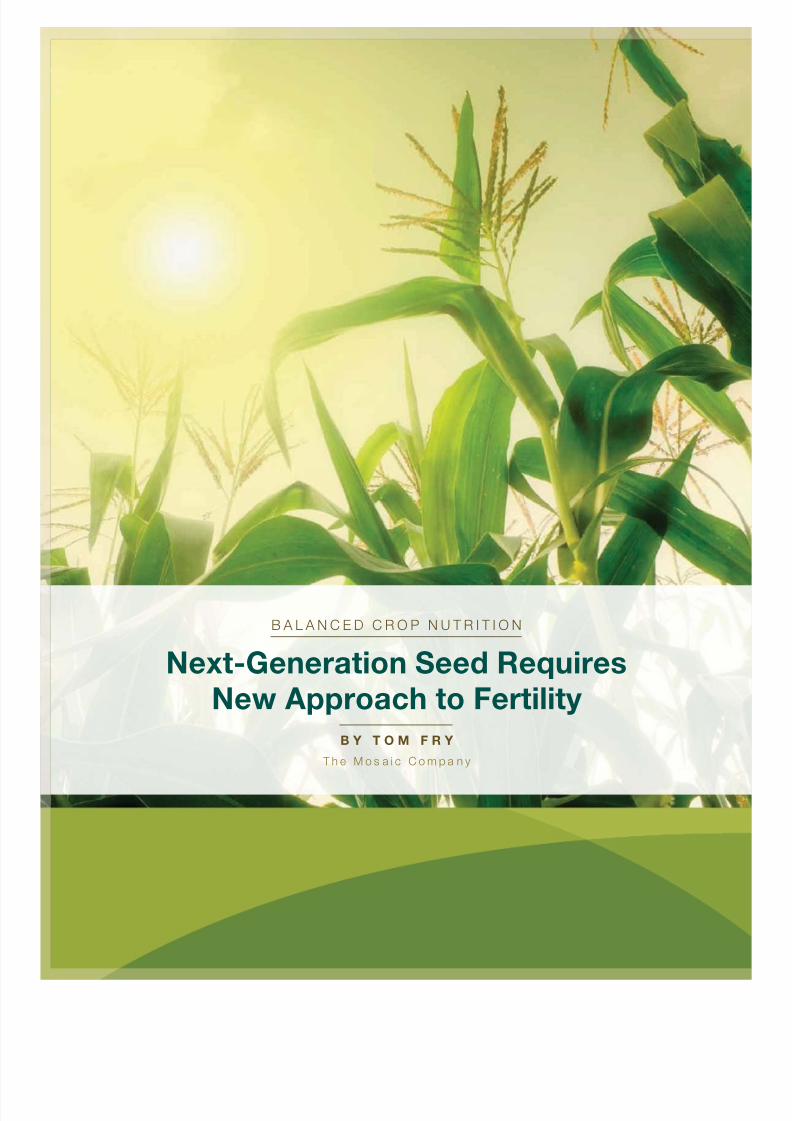
B A L A N C E D C R O P N U T R I T I O N
Next-Generation Seed Requires
New Approach to Fertility
B Y T O M F R Y
T h e M o s a i c C o m p a n y
8/8/2019 Hay Tham Khao
http://slidepdf.com/reader/full/hay-tham-khao 5/28
The Mosaic Company is working
to bring armers innovative ertilizer
products and inormation to provide
better understanding o balanced crop
nutrition. To this end, the company
surveyed armers, ertilizer dealers and
university soil scientists across Asia,South America and North America,
investigating their needs and wants or
ertilizers and plant nutrition services.
“Overwhelmingly, the results
showed armers wanted to go beyond
existing N, P and K ertilizers to
products that oer balanced nutri-
tion,” says Dean Fairchild, assistant
vice president o Agronomy or The
Mosaic Company. “Their priorities
were products to help manage needs
or nutrients such as sulur, zinc and
also boron,” relates Fairchild. Ater intensive research, Mosaic
scientists and engineers developed
a patented process to manuacture
a ertilizer granule that incorporates
nitrogen, phosphorus, sulur and zinc.
The product is MicroEssentials® SZ,™
and it is a major breakthrough in
dry-ertilizer technology. The unique
chemistry o this phosphorus-based
product delivers a balanced ratio
o essential nutrients or better nutri-
ent uptake by plants. In addition,
by including all nutrients in one
granule, distribution is uniorm, so
every plant receives the correct
amount o each nutrient.
The MicroEssentials amily o prod-
ucts delivers sulur and phosphorus
in the proper ratio or most crops, so
these two nutrients are more available
and easier or plants to use. Nitrogen
is provided in the readily available
ammonium orm to help get young
plants o to an early start. Finally,
MicroEssentials includes sulur in both
the elemental and sulate orms or
season-long availability.Studies show MicroEssentials
ertilizer enhances plant uptake o
phosphorus up to 30 percent and
improves zinc uptake by up to
45 percent as compared to a typical
blend. These improvements in nutrient
utilization mean a better return on the
investment in ertilizer. For more de-
tails, visit www.microessentials.com.
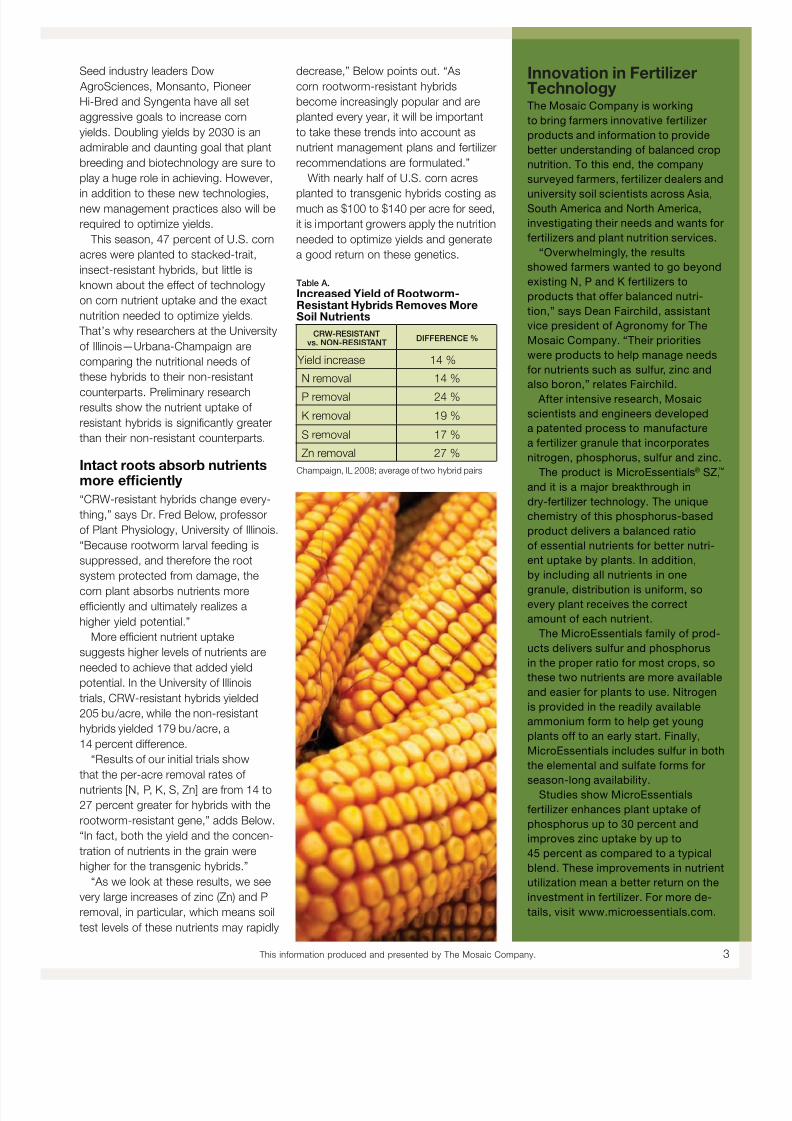
decrease,” Below points out. “As
corn rootworm-resistant hybrids
become increasingly popular and are
planted every year, it will be important
to take these trends into account as
nutrient management plans and ertilizer
recommendations are ormulated.”
With nearly hal o U.S. corn acres
planted to transgenic hybrids costing asmuch as $100 to $140 per acre or seed,
it is important growers apply the nutrition
needed to optimize yields and generate
a good return on these genetics.
Table A.Increased Yield o Rootworm-Resistant Hybrids Removes MoreSoil Nutrients
CRW-RESISTANTvs. NON-RESISTANT
DIFFERENCE %
Yield increase 14 %
N removal 14 %
P removal 24 %
K removal 19 %
S removal 17 %
Zn removal 27 %
Champaign, IL 2008; average o two hybrid pairs
Seed industry leaders Dow
AgroSciences, Monsanto, Pioneer
Hi-Bred and Syngenta have all set
aggressive goals to increase corn
yields. Doubling yields by 2030 is an
admirable and daunting goal that plant
breeding and biotechnology are sure to
play a huge role in achieving. However,
in addition to these new technologies,new management practices also will be
required to optimize yields.
This season, 47 percent o U.S. corn
acres were planted to stacked-trait,
insect-resistant hybrids, but little is
known about the eect o technology
on corn nutrient uptake and the exact
nutrition needed to optimize yields.
That’s why researchers at the University
o Illinois—Urbana-Champaign are
comparing the nutritional needs o
these hybrids to their non-resistant
counterparts. Preliminary researchresults show the nutrient uptake o
resistant hybrids is signifcantly greater
than their non-resistant counterparts.
Intact roots absorb nutrientsmore efciently
“CRW-resistant hybrids change every-
thing,” says Dr. Fred Below, proessor
o Plant Physiology, University o Illinois.
“Because rootworm larval eeding is
suppressed, and thereore the root
system protected rom damage, the
corn plant absorbs nutrients more
efciently and ultimately realizes a
higher yield potential.”
More efcient nutrient uptake
suggests higher levels o nutrients are
needed to achieve that added yield
potential. In the University o Illinois
trials, CRW-resistant hybrids yielded
205 bu /acre, while the non-resistant
hybrids yielded 179 bu /acre, a
14 percent dierence.
“Results o our initial trials show
that the per-acre removal rates o nutrients [N, P, K, S, Zn] are rom 14 to
27 percent greater or hybrids with the
rootworm-resistant gene,” adds Below.
“In act, both the yield and the concen-
tration o nutrients in the grain were
higher or the transgenic hybrids.”
“As we look at these results, we see
very large increases o zinc (Zn) and P
removal, in particular, which means soil
test levels o these nutrients may rapidly
Innovation in FertilizerTechnology
This inormation produced and presented by The Mosaic Company. 3
8/8/2019 Hay Tham Khao
http://slidepdf.com/reader/full/hay-tham-khao 6/28
By understanding how nutrients
work together, armers can optimize
production and investment in ertilizer
while minimizing the opportunity or
excess nutrients to negatively impact
the environment. Potassium (K) and
nitrogen (N) are two vital nutrients that
create greater benefts working together
than alone.
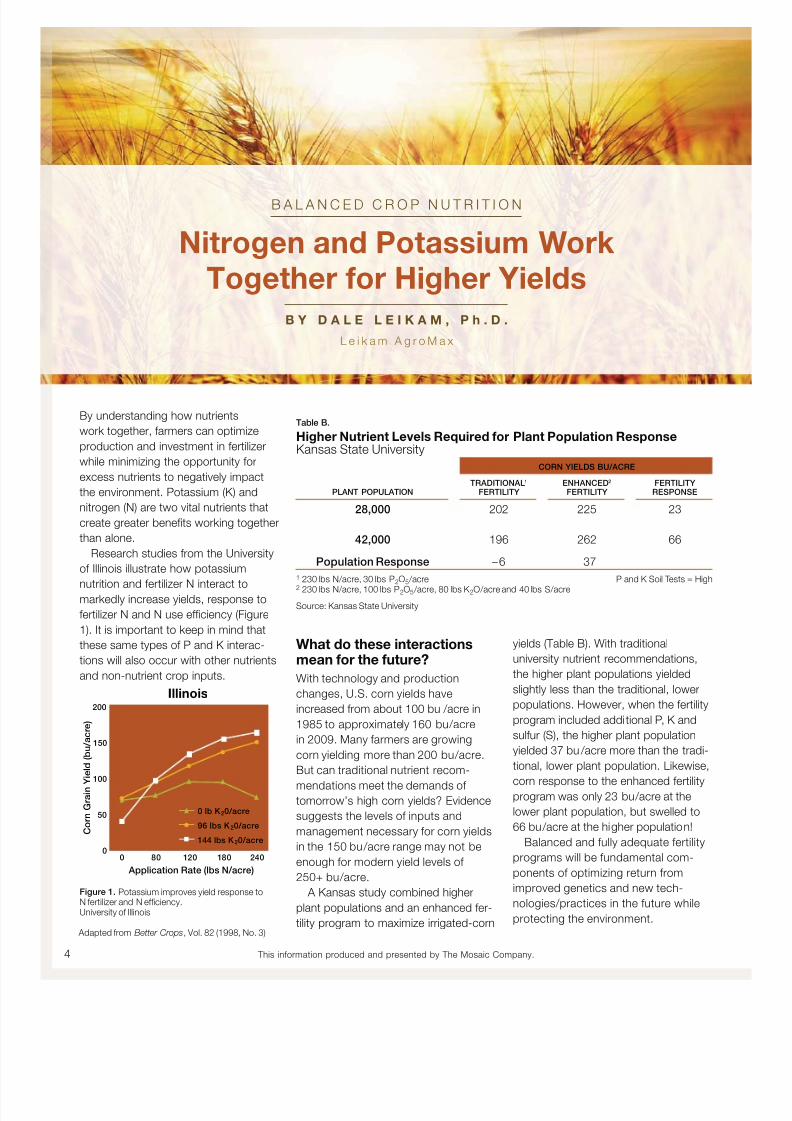
Research studies rom the University
o Illinois illustrate how potassium
nutrition and ertilizer N interact tomarkedly increase yields, response to
ertilizer N and N use efciency (Figure
1). It is important to keep in mind that
these same types o P and K interac-
tions will also occur with other nutrients
and non-nutrient crop inputs.
Illinois
Application Rate (lbs N/acre)
0 lb K20/acre
96 lbs K20/acre
144 lbs K20/acre C o r n G r a i n Y i e l d
( b u / a c r e )
200
150
100
50
00 80 120 180 240
Figure 1. Potassium improves yield response toN ertilizer and N efciency.University o Illinois
Adapted rom Better Crops, Vol. 82 (1998, No. 3)
What do these interactionsmean or the uture?
With technology and production
changes, U.S. corn yields have
increased rom about 100 bu /acre in
1985 to approximately 160 bu /acre
in 2009. Many armers are growing
corn yielding more than 200 bu /acre.
But can traditional nutrient recom-
mendations meet the demands o
tomorrow’s high corn yields? Evidence
suggests the levels o inputs and
management necessary or corn yields
in the 150 bu /acre range may not be
enough or modern yield levels o
250+ bu /acre.
A Kansas study combined higher
plant populations and an enhanced er-
tility program to maximize irrigated-corn
Table B.
Higher Nutrient Levels Required or Plant Population ResponseKansas State University
CORN YIELDS BU/ACRE
PLANT POPULATIONTRADITIONAL1
FERTILITYENHANCED2
FERTILITYFERTILITYRESPONSE
28,000 202 225 23
42,000 196 262 66
Population Response – 6 371 230 lbs N /acre, 30 lbs P
2O
5/acre P and K Soil Tests = High
2 230 lbs N /acre, 100 lbs P2O5/acre, 80 lbs K2O /acre and 40 lbs S /acre
Source: Kansas State University
yields (Table B). With traditional
university nutrient recommendations,
the higher plant populations yielded
slightly less than the traditional, lower
populations. However, when the ertility
program included additional P, K and
sulur (S), the higher plant population
yielded 37 bu /acre more than the tradi-
tional, lower plant population. Likewise,
corn response to the enhanced ertilityprogram was only 23 bu /acre at the
lower plant population, but swelled to
66 bu /acre at the higher population!
Balanced and ully adequate ertility
programs will be undamental com-
ponents o optimizing return rom
improved genetics and new tech-
nologies/practices in the uture while
protecting the environment.
B A L A N C E D C R O P N U T R I T I O N
Nitrogen and Potassium Work
Together or Higher Yields
B Y D A L E L E I K A M , P h . D .
L e i k a m A g r o M a x
4 This inormation produced and presented by The Mosaic Company.
8/8/2019 Hay Tham Khao
http://slidepdf.com/reader/full/hay-tham-khao 7/28
Survival in today’s competitive
economic environment depends
upon each investment ultimately
providing a positive return. In corn
production, ertility is responsible
or about 40 percent* o the crop’s
yield—and ertilizer is proven toprovide a positive return on invest-
ment (ROI). Use the ormulas below
the table to calculate the return rom
ertilizing your own corn crop.
Fertilizer Oers Perormance That Pays
Few investments oer this level o return
Optimizing Potassium Critical or Top YieldsSoil test trends coupled with environ-
mental actors indicate applying
potassium (K) ertilizer may be more
important than ever or optimum crop
yields. According to studies rom the
International Plant Nutrition Institute(IPNI), soil test K levels continue to de-
crease, and as a result, the percentage
o soils across North America in nega-
tive balance or K continues to rise.
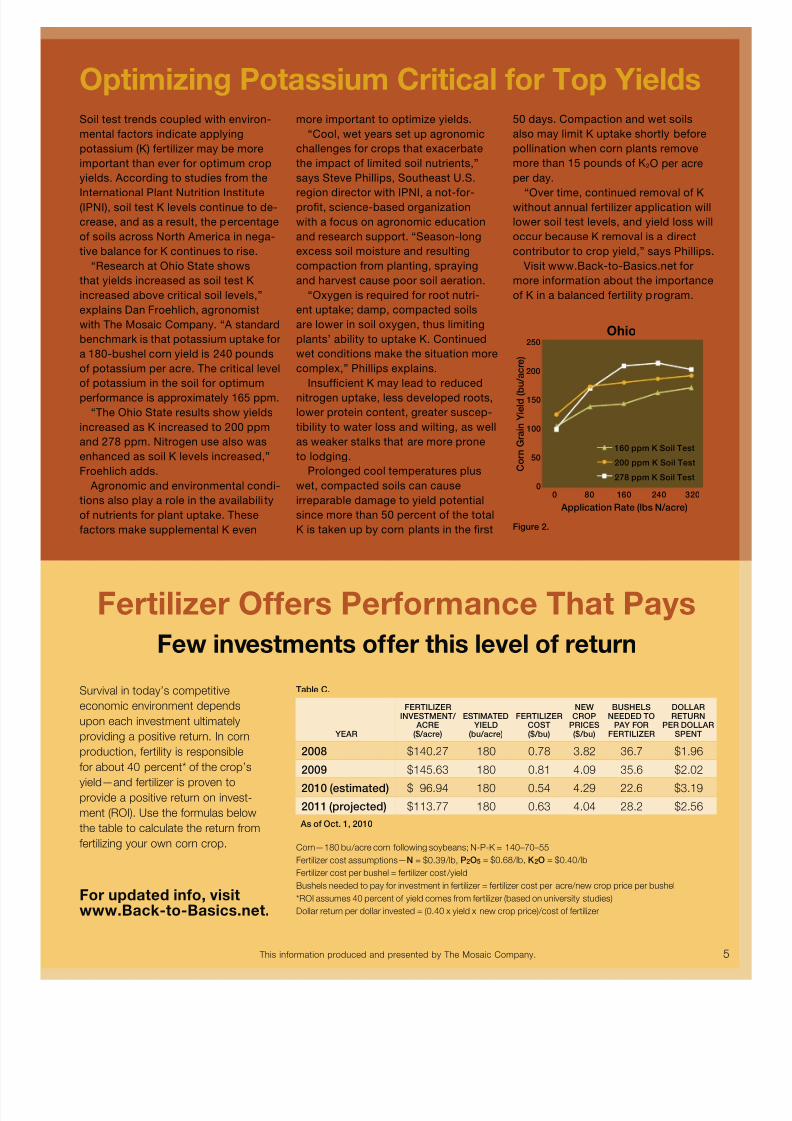
“Research at Ohio State shows
that yields increased as soil test K
increased above critical soil levels,”
explains Dan Froehlich, agronomist
with The Mosaic Company. “A standard
benchmark is that potassium uptake or
a 180-bushel corn yield is 240 pounds
o potassium per acre. The critical level
o potassium in the soil or optimum
perormance is approximately 165 ppm.
“The Ohio State results show yields
increased as K increased to 200 ppm
and 278 ppm. Nitrogen use also was
enhanced as soil K levels increased,”
Froehlich adds.
Agronomic and environmental condi-
tions also play a role in the availabili ty
o nutrients or plant uptake. These
actors make supplemental K even
more important to optimize yields.
“Cool, wet years set up agronomic
challenges or crops that exacerbate
the impact o limited soil nutrients,”
says Steve Phillips, Southeast U.S.
region director with IPNI, a not-or-proft, science-based organization
with a ocus on agronomic education
and research support. “Season-long
excess soil moisture and resulting
compaction rom planting, spraying
and harvest cause poor soil aeration.
“Oxygen is required or root nutri-
ent uptake; damp, compacted soils
are lower in soil oxygen, thus limiting
plants’ ability to uptake K. Continued
wet conditions make the situation more
complex,” Phillips explains.
Insufcient K may lead to reduced
nitrogen uptake, less developed roots,
lower protein content, greater suscep-
tibility to water loss and wilting, as well
as weaker stalks that are more prone
to lodging.
Prolonged cool temperatures plus
wet, compacted soils can cause
irreparable damage to yield potential
since more than 50 percent o the total
K is taken up by corn plants in the frst
50 days. Compaction and wet soils
also may limit K uptake shortly beore
pollination when corn plants remove
more than 15 pounds o K2O per acre
per day.
“Over time, continued removal o Kwithout annual ertilizer application will
lower soil test levels, and yield loss will
occur because K removal is a direct
contributor to crop yield,” says Phillips.
Visit www.Back-to-Basics.net or
more inormation about the importance
o K in a balanced ertility program.
Ohio
Application Rate (lbs N/acre)
C o r n G r a i n Y i e l d ( b
u / a c r e )
250
200
150
100
50
00 80 160 240 320
160 ppm K Soil Test
200 ppm K Soil Test
278 ppm K Soil Test
Figure 2.
Table C.
YEAR
FERTILIZERINVESTMENT/
ACRE($ /acre)
ESTIMATED YIELD
(bu /acre)
FERTILIZERCOST($ /bu)
NEWCROP
PRICES($ /bu)
BUSHELSNEEDED TO
PAY FORFERTILIZER
DOLLARRETURN
PER DOLLARSPENT
2008 $140.27 180 0.78 3.82 36.7 $1.96
2009 $145.63 180 0.81 4.09 35.6 $2.02
2010 (estimated) $ 96.94 180 0.54 4.29 22.6 $3.19
2011 (projected) $113.77 180 0.63 4.04 28.2 $2.56
As o Oct. 1, 2010
Corn—180 bu /acre corn ollowing soybeans; N-P-K = 140–70–55
Fertilizer cost assumptions—N = $0.39 /lb, P2O5 = $0.68 /lb, K2O = $0.40 /lb
Fertilizer cost per bushel = ertilizer cost /yield
Bushels needed to pay or investment in ertilizer = ertilizer cost per acre/new crop price per bushel
*ROI assumes 40 percent o yield comes rom ertilizer (based on university studies)
Dollar return per dollar invested = (0.40 x yield x new crop price)/cost o ertilizer
For updated ino, visitwww.Back-to-Basics.net.
This inormation produced and presented by The Mosaic Company. 5
8/8/2019 Hay Tham Khao
http://slidepdf.com/reader/full/hay-tham-khao 8/28
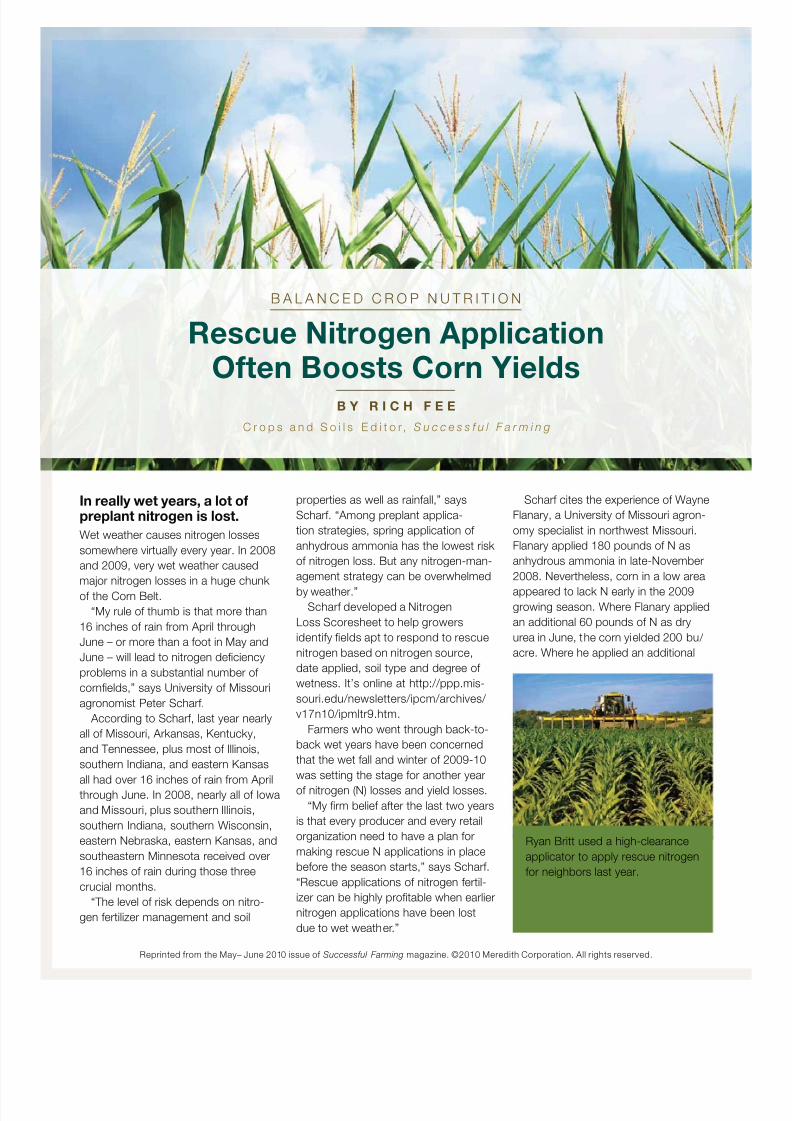
In really wet years, a lot opreplant nitrogen is lost.
Wet weather causes nitrogen losses
somewhere virtually every year. In 2008
and 2009, very wet weather caused
major nitrogen losses in a huge chunko the Corn Belt.
“My rule o thumb is that more than
16 inches o rain rom April through
June – or more than a oot in May and
June – will lead to nitrogen defciency
problems in a substantial number o
cornfelds,” says University o Missouri
agronomist Peter Schar.
According to Schar, last year nearly
all o Missouri, Arkansas, Kentucky,
and Tennessee, plus most o Illinois,
southern Indiana, and eastern Kansas
all had over 16 inches o rain rom Aprilthrough June. In 2008, nearly all o Iowa
and Missouri, plus southern Illinois,
southern Indiana, southern Wisconsin,
eastern Nebraska, eastern Kansas, and
southeastern Minnesota received over
16 inches o rain during those three
crucial months.
“The level o risk depends on nitro-
gen ertilizer management and soil
properties as well as rainall,” says
Schar. “Among preplant applica-
tion strategies, spring application o
anhydrous ammonia has the lowest risk
o nitrogen loss. But any nitrogen-man-
agement strategy can be overwhelmed
by weather.”
Schar developed a Nitrogen
Loss Scoresheet to help growers
identiy felds apt to respond to rescue
nitrogen based on nitrogen source,
date applied, soil type and degree o
wetness. It’s online at http://ppp.mis-
souri.edu/newsletters/ipcm/archives/
v17n10/ipmltr9.htm.
Farmers who went through back-to-
back wet years have been concerned
that the wet all and winter o 2009-10
was setting the stage or another yearo nitrogen (N) losses and yield losses.
“My frm belie ater the last two years
is that every producer and every retail
organization need to have a plan or
making rescue N applications in place
beore the season starts,” says Schar.
“Rescue applications o nitrogen ertil-
izer can be highly proftable when earlier
nitrogen applications have been lost
due to wet weather.”
Schar cites the experience o Wayne
Flanary, a University o Missouri agron-
omy specialist in northwest Missouri.
Flanary applied 180 pounds o N as
anhydrous ammonia in late-November
2008. Nevertheless, corn in a low area
appeared to lack N early in the 2009
growing season. Where Flanary applied
an additional 60 pounds o N as dry
urea in June, the corn yielded 200 bu /
acre. Where he applied an additional
B A L A N C E D C R O P N U T R I T I O N
Rescue Nitrogen ApplicationOten Boosts Corn Yields
B Y R I C H F E E
C r o p s a n d S o i l s E d i t o r , S u c c e s s f u l F a r m i n g
Ryan Britt used a high-clearance
applicator to apply rescue nitrogen
or neighbors last year.
Reprinted rom the May– June 2010 issue o Successful Farming magazine. ©2010 Meredith Corporation. All rights reserved.
8/8/2019 Hay Tham Khao
http://slidepdf.com/reader/full/hay-tham-khao 9/28
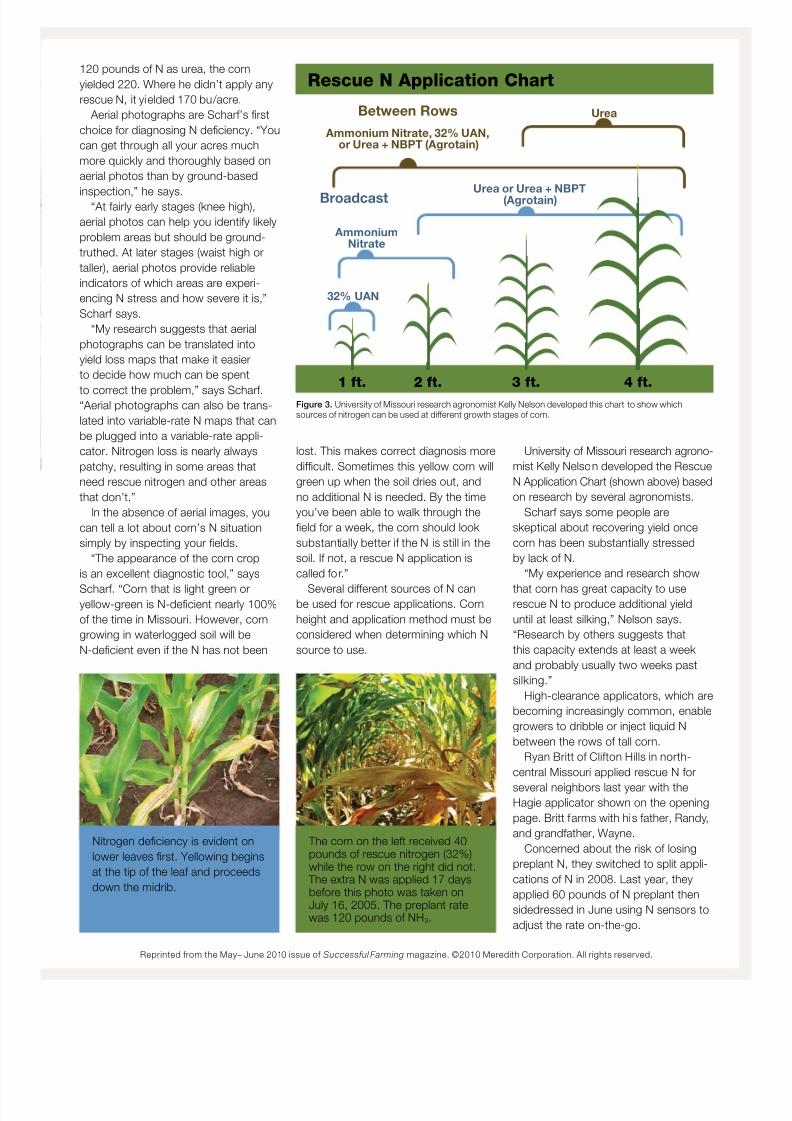
Figure 3. University o Missouri research agronomist Kelly Nelson developed this chart to show whichsources o nitrogen can be used at dierent growth stages o corn.
Rescue N Application Chart
1 ft. 2 ft. 3 ft. 4 ft.
Between Rows
Broadcast
Ammonium Nitrate, 32% UAN,or Urea + NBPT (Agrotain)
AmmoniumNitrate
Urea
32% UAN
Urea or Urea + NBPT(Agrotain)
120 pounds o N as urea, the corn
yielded 220. Where he didn’t apply any
rescue N, it yielded 170 bu /acre.
Aerial photographs are Schar’s frst
choice or diagnosing N defciency. “You
can get through all your acres much
more quickly and thoroughly based on
aerial photos than by ground-based
inspection,” he says.“At airly early stages (knee high),
aerial photos can help you identiy likely
problem areas but should be ground-
truthed. At later stages (waist high or
taller), aerial photos provide reliable
indicators o which areas are experi-
encing N stress and how severe it is,”
Schar says.
“My research suggests that aerial
photographs can be translated into
yield loss maps that make it easier
to decide how much can be spent
to correct the problem,” says Schar.“Aerial photographs can also be trans-
lated into variable-rate N maps that can
be plugged into a variable-rate appli-
cator. Nitrogen loss is nearly always
patchy, resulting in some areas that
need rescue nitrogen and other areas
that don’t.”
In the absence o aerial images, you
can tell a lot about corn’s N situation
simply by inspecting your felds.
“The appearance o the corn crop
is an excellent diagnostic tool,” says
Schar. “Corn that is light green or
yellow-green is N-defcient nearly 100%
o the time in Missouri. However, corn
growing in waterlogged soil will be
N-defcient even i the N has not been
lost. This makes correct diagnosis more
difcult. Sometimes this yellow corn will
green up when the soil dries out, and
no additional N is needed. By the time
you’ve been able to walk through the
feld or a week, the corn should look
substantially better i the N is still in the
soil. I not, a rescue N application is
called or.”
Several dierent sources o N canbe used or rescue applications. Corn
height and application method must be
considered when determining which N
source to use.
University o Missouri research agrono-
mist Kelly Nelson developed the Rescue
N Application Chart (shown above) based
on research by several agronomists.
Schar says some people are
skeptical about recovering yield once
corn has been substantially stressed
by lack o N.
“My experience and research show
that corn has great capacity to userescue N to produce additional yield
until at least silking,” Nelson says.
“Research by others suggests that
this capacity extends at least a week
and probably usually two weeks past
silking.”
High-clearance applicators, which are
becoming increasingly common, enable
growers to dribble or inject liquid N
between the rows o tall corn.
Ryan Britt o Cliton Hills in north-
central Missouri applied rescue N or
several neighbors last year with the
Hagie applicator shown on the opening
page. Britt arms with his ather, Randy,
and grandather, Wayne.
Concerned about the risk o losing
preplant N, they switched to split appli-
cations o N in 2008. Last year, they
applied 60 pounds o N preplant then
sidedressed in June using N sensors to
adjust the rate on-the-go.
Nitrogen defciency is evident on
lower leaves frst. Yellowing begins
at the tip o the lea and proceeds
down the midrib.
The corn on the let received 40pounds o rescue nitrogen (32%)while the row on the right did not.
The extra N was applied 17 daysbeore this photo was taken onJuly 16, 2005. The preplant ratewas 120 pounds o NH3.
Reprinted rom the May– June 2010 issue o Successful Farming magazine. ©2010 Meredith Corporation. All rights reserved.
8/8/2019 Hay Tham Khao
http://slidepdf.com/reader/full/hay-tham-khao 10/28
B A L A N C E D C R O P N U T R I T I O N
Unlocking the Secrets
to Higher Yields
A N I N T E R V I E W W I T H F R E D B E L O W , P h . D .
U n i v e r s i t y o I l l i n o i s a t U r b a n a - C h a m p a i g n
8/8/2019 Hay Tham Khao
http://slidepdf.com/reader/full/hay-tham-khao 11/28
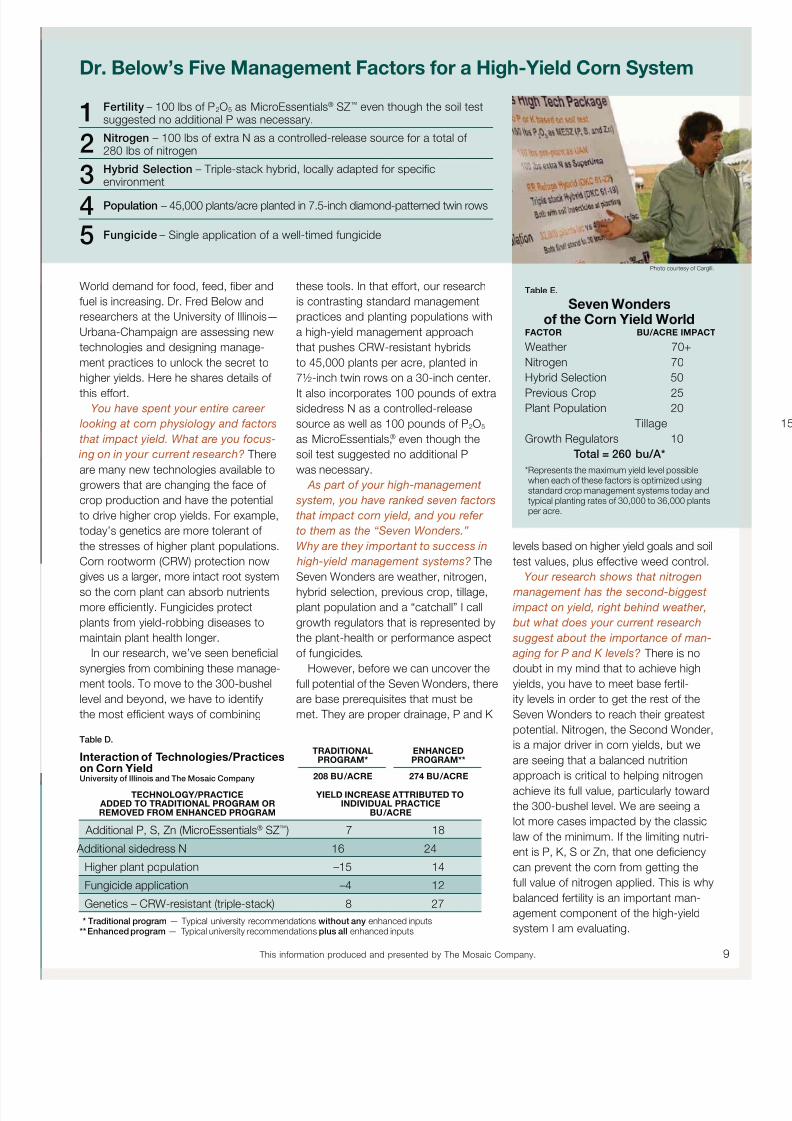
Table E.
Seven Wonderso the Corn Yield World
FACTOR BU/ACRE IMPACT
Weather 70+
Nitrogen 70
Hybrid Selection 50
Previous Crop 25Plant Population 20
Tillage
Growth Regulators 10
Total = 260 bu/A*
*Represents the maximum yield level possiblewhen each o these actors is optimized usingstandard crop management systems today andtypical planting rates o 30,000 to 36,000 plantsper acre.
World demand or ood, eed, fber and
uel is increasing. Dr. Fred Below and
researchers at the University o Illinois—
Urbana-Champaign are assessing new
technologies and designing manage-
ment practices to unlock the secret to
higher yields. Here he shares details o
this eort.You have spent your entire career
looking at corn physiology and factors
that impact yield. What are you focus-
ing on in your current research? There
are many new technologies available to
growers that are changing the ace o
crop production and have the potential
to drive higher crop yields. For example,
today’s genetics are more tolerant o
the stresses o higher plant populations.
Corn rootworm (CRW) protection now
gives us a larger, more intact root system
so the corn plant can absorb nutrients
more efciently. Fungicides protect
plants rom yield-robbing diseases to
maintain plant health longer.
In our research, we’ve seen benefcial
synergies rom combining these manage-
ment tools. To move to the 300-bushel
level and beyond, we have to identiy
the most efcient ways o combining
Table D.
Interaction o Technologies/Practiceson Corn YieldUniversity o Illinois and The Mosaic Company
TRADITIONALPROGRAM*
ENHANCEDPROGRAM**
208 BU /ACRE 274 BU /ACRE
TECHNOLOGY/PRACTICE ADDED TO TRADITIONAL PROGRAM ORREMOVED FROM ENHANCED PROGRAM
YIELD INCREASE ATTRIBUTED TOINDIVIDUAL PRACTICE
BU /ACRE
Additional P, S, Zn (MicroEssentials® SZ™) 7 18
Additional sidedress N 16 24
Higher plant population –15 14
Fungicide application –4 12
Genetics – CRW-resistant (triple-stack) 8 27
* Traditional program — Typical university recommendations without any enhanced inputs** Enhanced program — Typical university recommendations plus all enhanced inputs
these tools. In that eort, our research
is contrasting standard management
practices and planting populations with
a high-yield management approach
that pushes CRW-resistant hybrids
to 45,000 plants per acre, planted in
7½-inch twin rows on a 30-inch center.
It also incorporates 100 pounds o extrasidedress N as a controlled-release
source as well as 100 pounds o P2O5
as MicroEssentials,® even though the
soil test suggested no additional P
was necessary.
As part of your high-management
system, you have ranked seven factors
that impact corn yield, and you refer
to them as the “Seven Wonders.”
Why are they important to success in
high-yield management systems? The
Seven Wonders are weather, nitrogen,
hybrid selection, previous crop, tillage,
plant population and a “catchall” I call
growth regulators that is represented by
the plant-health or perormance aspect
o ungicides.
However, beore we can uncover the
ull potential o the Seven Wonders, there
are base prerequisites that must be
met. They are proper drainage, P and K
levels based on higher yield goals and soil
test values, plus eective weed control.
Your research shows that nitrogen
management has the second-biggest
impact on yield, right behind weather,
but what does your current research
suggest about the importance of man-
aging for P and K levels? There is no
doubt in my mind that to achieve high
yields, you have to meet base ertil-
ity levels in order to get the rest o the
Seven Wonders to reach their greatest
potential. Nitrogen, the Second Wonder,
is a major driver in corn yields, but we
are seeing that a balanced nutrition
approach is critical to helping nitrogenachieve its ull value, particularly toward
the 300-bushel level. We are seeing a
lot more cases impacted by the classic
law o the minimum. I the limiting nutri-
ent is P, K, S or Zn, that one defciency
can prevent the corn rom getting the
ull value o nitrogen applied. This is why
balanced ertility is an important man-
agement component o the high-yield
system I am evaluating.
Dr. Below’s Five Management Factors or a High-Yield Corn System
1 Fertility – 100 lbs o P2O5 as MicroEssentials® SZ™ even though the soil testsuggested no additional P was necessary.
2 Nitrogen – 100 lbs o extra N as a controlled-release source or a total o 280 lbs o nitrogen
3 Hybrid Selection – Triple-stack hybrid, locally adapted or specifcenvironment
4 Population – 45,000 plants/acre planted in 7.5-inch diamond-patterned twin rows
5 Fungicide – Single application o a well-timed ungicide
Photo courtesy o Cargill.
This inormation produced and presented by The Mosaic Company. 9
8/8/2019 Hay Tham Khao
http://slidepdf.com/reader/full/hay-tham-khao 12/28
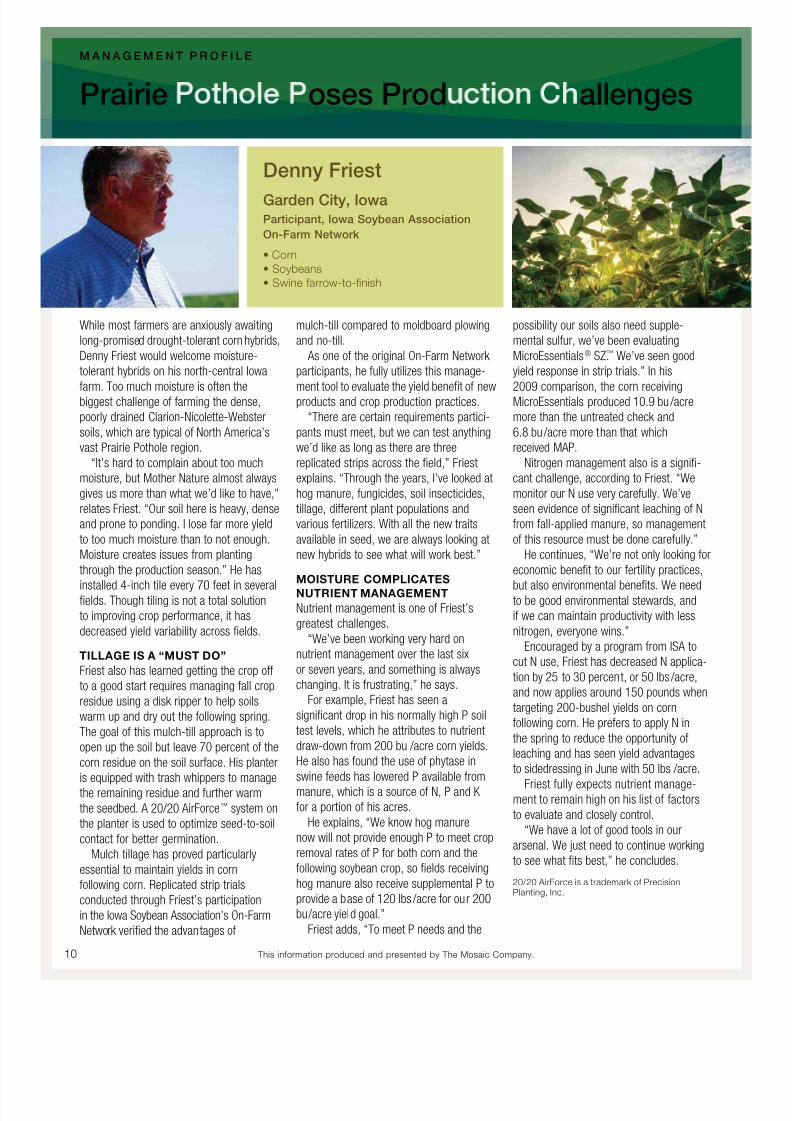
allengesPrairie oses Prod
M A N A G E M E N T P R O F I L E
possibility our soils also need supple-
mental sulur, we’ve been evaluating
MicroEssentials® SZ.™ We’ve seen good
yield response in strip trials.” In his
2009 comparison, the corn receivingMicroEssentials produced 10.9 bu /acre
more than the untreated check and
6.8 bu /acre more than that which
received MAP.
Nitrogen management also is a signif-
cant challenge, according to Friest. “We
monitor our N use very careully. We’ve
seen evidence o signifcant leaching o N
rom all-applied manure, so management
o this resource must be done careully.”
He continues, “We’re not only looking or
economic beneft to our ertility practices,
but also environmental benefts. We needto be good environmental stewards, and
i we can maintain productivity with less
nitrogen, everyone wins.”
Encouraged by a program rom ISA to
cut N use, Friest has decreased N applica-
tion by 25 to 30 percent, or 50 lbs /acre,
and now applies around 150 pounds when
targeting 200-bushel yields on corn
ollowing corn. He preers to apply N in
the spring to reduce the opportunity o
leaching and has seen yield advantages
to sidedressing in June with 50 lbs /acre.
Friest ully expects nutrient manage-
ment to remain high on his list o actors
to evaluate and closely control.
“We have a lot o good tools in our
arsenal. We just need to continue working
to see what fts best,” he concludes.
20/20 AirForce is a trademark o PrecisionPlanting, Inc.
mulch-till compared to moldboard plowing
and no-till.
As one o the original On-Farm Network
participants, he ully utilizes this manage-
ment tool to evaluate the yield beneft o newproducts and crop production practices.
“There are certain requirements partici-
pants must meet, but we can test anything
we’d like as long as there are three
replicated strips across the feld,” Friest
explains. “Through the years, I’ve looked at
hog manure, ungicides, soil insecticides,
tillage, dierent plant populations and
various ertilizers. With all the new traits
available in seed, we are always looking at
new hybrids to see what will work best.”
MOISTURE COMPLICATESNUTRIENT MANAGEMENT
Nutrient management is one o Friest’s
greatest challenges.
“We’ve been working very hard on
nutrient management over the last six
or seven years, and something is always
changing. It is rustrating,” he says.
For example, Friest has seen a
signifcant drop in his normally high P soil
test levels, which he attributes to nutrient
draw-down rom 200 bu /acre corn yields.
He also has ound the use o phytase in
swine eeds has lowered P available rommanure, which is a source o N, P and K
or a portion o his acres.
He explains, “We know hog manure
now will not provide enough P to meet crop
removal rates o P or both corn and the
ollowing soybean crop, so felds receiving
hog manure also receive supplemental P to
provide a base o 120 lbs /acre or our 200
bu /acre yield goal.”
Friest adds, “To meet P needs and the
While most armers are anxiously awaiting
long-promised drought-tolerant corn hybrids,
Denny Friest would welcome moisture-
tolerant hybrids on his north-central Iowa
arm. Too much moisture is oten thebiggest challenge o arming the dense,
poorly drained Clarion-Nicolette-Webster
soils, which are typical o North America’s
vast Prairie Pothole region.
“It’s hard to complain about too much
moisture, but Mother Nature almost always
gives us more than what we’d like to have,”
relates Friest. “Our soil here is heavy, dense
and prone to ponding. I lose ar more yield
to too much moisture than to not enough.
Moisture creates issues rom planting
through the production season.” He has
installed 4-inch tile every 70 eet in severalfelds. Though tiling is not a total solution
to improving crop perormance, it has
decreased yield variability across felds.
TILLAGE IS A “MUST DO”
Friest also has learned getting the crop o
to a good start requires managing all crop
residue using a disk ripper to help soils
warm up and dry out the ollowing spring.
The goal o this mulch-till approach is to
open up the soil but leave 70 percent o the
corn residue on the soil surace. His planter
is equipped with trash whippers to managethe remaining residue and urther warm
the seedbed. A 20/20 AirForce™ system on
the planter is used to optimize seed-to-soil
contact or better germination.
Mulch tillage has proved particularly
essential to maintain yields in corn
ollowing corn. Replicated strip trials
conducted through Friest’s participation
in the Iowa Soybean Association’s On-Farm
Network verifed the advantages o
Denny Friest
Garden City, IowaParticipant, Iowa Soybean Association
On-Farm Network
• Corn• Soybeans• Swine arrow-to-fnish
10 This inormation produced and presented by The Mosaic Company.
8/8/2019 Hay Tham Khao
http://slidepdf.com/reader/full/hay-tham-khao 13/28
• The roles o other essential nutrients
such as sulur, magnesium and zinc
in increasing crop yield and quality
• Why new insect-resistant, multi-
trait hybrids may beneft rom a new
approach to ertility
• How to identiy yield-robbing nutrient
defciencies through visual analysis
• How to identiy “hidden defciencies”
not visible to the eye
Visit www.Back-to-Basics.net
Order or bookmarkthese valuable tools
and online resources:
“Efcient Fertilizer Use” manual. This
comprehensive guide to proper ertilizeruses, soil pH, soil sampling and much
more is FREE! Order the CD-ROM, or
access the chapters online.
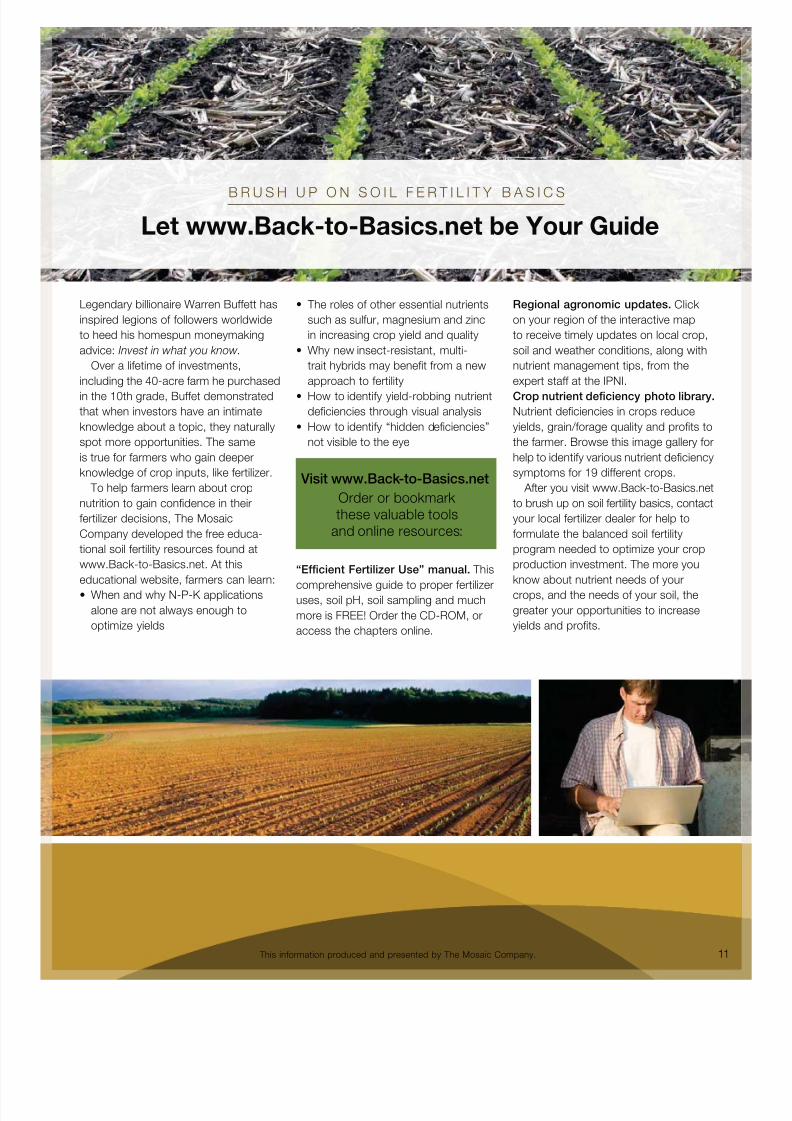
Legendary billionaire Warren Buett has
inspired legions o ollowers worldwide
to heed his homespun moneymaking
advice: Invest in what you know.
Over a lietime o investments,
including the 40-acre arm he purchased
in the 10th grade, Buet demonstrated
that when investors have an intimate
knowledge about a topic, they naturally
spot more opportunities. The same
is true or armers who gain deeper
knowledge o crop inputs, like ertilizer.
To help armers learn about crop
nutrition to gain confdence in their
ertilizer decisions, The Mosaic
Company developed the ree educa-
tional soil ertility resources ound at
www.Back-to-Basics.net. At this
educational website, armers can learn:• When and why N-P-K applications
alone are not always enough to
optimize yields
B R U S H U P O N S O I L F E R T I L I T Y B A S I C S
Let www.Back-to-Basics.net be Your Guide
Regional agronomic updates. Click
on your region o the interactive map
to receive timely updates on local crop,
soil and weather conditions, along with
nutrient management tips, rom the
expert sta at the IPNI.
Crop nutrient defciency photo library.
Nutrient defciencies in crops reduce
yields, grain/orage quality and profts to
the armer. Browse this image gallery or
help to identiy various nutrient defciency
symptoms or 19 dierent crops.
Ater you visit www.Back-to-Basics.net
to brush up on soil ertility basics, contact
your local ertilizer dealer or help to
ormulate the balanced soil ertility
program needed to optimize your crop
production investment. The more you
know about nutrient needs o yourcrops, and the needs o your soil, the
greater your opportunities to increase
yields and profts.
This inormation produced and presented by The Mosaic Company. 11
8/8/2019 Hay Tham Khao
http://slidepdf.com/reader/full/hay-tham-khao 14/28
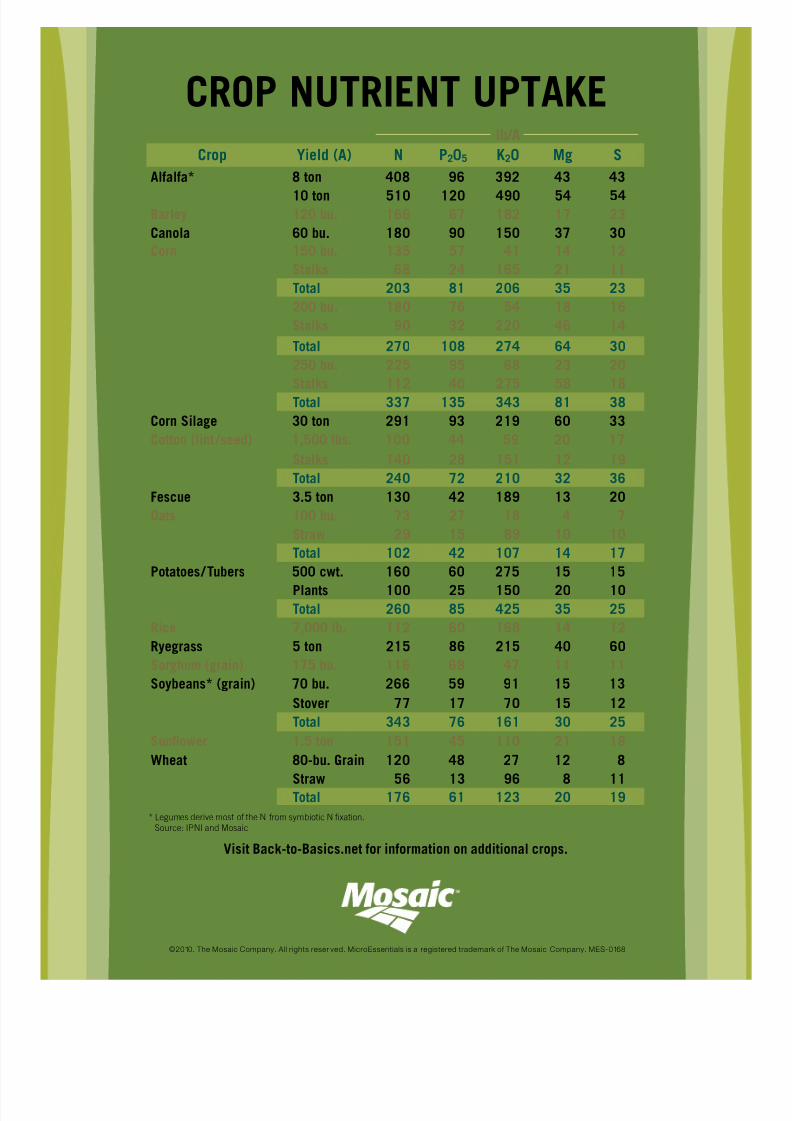
CROP NUTRIENT UPTAKElb/A
Crop Yield (A) N P205 K20 Mg S
Alala* 8 ton 408 96 392 43 43
10 ton 510 120 490 54 54Barley 120 bu. 166 67 182 17 23
Canola 60 bu. 180 90 150 37 30
Corn 150 bu. 135 57 41 14 12
Stalks 68 24 165 21 11
Total 203 81 206 35 23
200 bu. 180 76 54 18 16
Stalks 90 32 220 46 14
Total 270 108 274 64 30
250 bu. 225 95 68 23 20
Stalks 112 40 275 58 18Total 337 135 343 81 38
Corn Silage 30 ton 291 93 219 60 33
Cotton (lint /seed) 1,500 lbs. 100 44 59 20 17
Stalks 140 28 151 12 19
Total 240 72 210 32 36
Fescue 3.5 ton 130 42 189 13 20
Oats 100 bu. 73 27 18 4 7
Straw 29 15 89 10 10
Total 102 42 107 14 17
Potatoes/Tubers 500 cwt. 160 60 275 15 15
Plants 100 25 150 20 10
Total 260 85 425 35 25
Rice 7,000 lb. 112 60 168 14 12
Ryegrass 5 ton 215 86 215 40 60
Sorghum (grain) 175 bu. 116 68 47 11 11
Soybeans* (grain) 70 bu. 266 59 91 15 13
Stover 77 17 70 15 12
Total 343 76 161 30 25
Sunfower 1.5 ton 151 45 110 21 18
Wheat 80-bu. Grain 120 48 27 12 8
Straw 56 13 96 8 11Total 176 61 123 20 19
©2010. The Mosaic Company. All rights reser ved. MicroEssentials is a registered trademark o The Mosaic Company. MES-0168
* Legumes derive most of the N from symbiotic N fixation.
Source: IPNI and Mosaic
Visit Back-to-Basics.net for information on additional crops.
8/8/2019 Hay Tham Khao
http://slidepdf.com/reader/full/hay-tham-khao 15/28
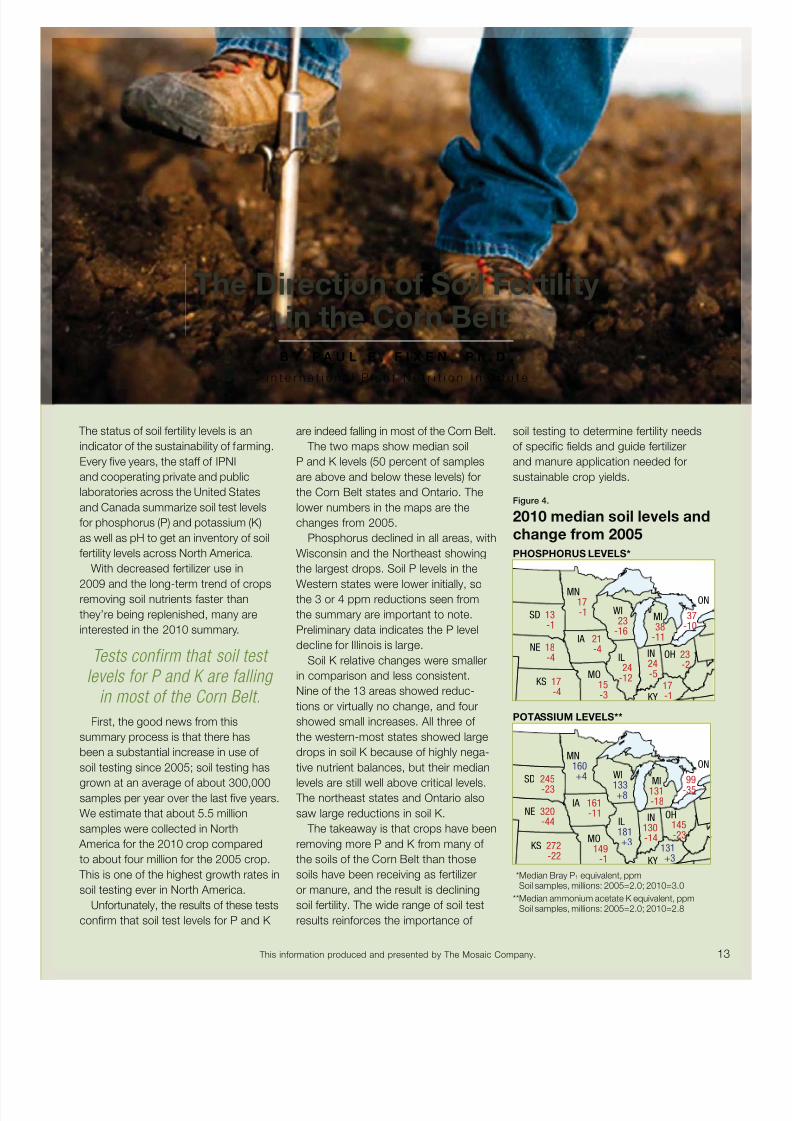
soil testing to determine ertility needs
o specifc felds and guide ertilizer
and manure application needed or
sustainable crop yields.
Figure 4.
2010 median soil levels and
change rom 2005PHOSPHORUS LEVELS*
SD 13-1
NE 18-4
IA 21-4
MO15-3
IN24-5
MI38-11
MN17-1 WI
23-16
IL24-12
OH 23-2
17
-1
KS 17-4
ON
37-10
KY
POTASSIUM LEVELS**
SD 245-23
NE 320-44
IA 161-11
MO149-1
IN130-14
MI131-18
MN160
+4 WI133+8
IL181+3
OH145-23
99-35
KS 272-22
ON
131
+3KY
*Median Bray P1 equivalent, ppmSoil samples, millions: 2005=2.0; 2010=3.0
**Median ammonium acetate K equivalent, ppmSoil samples, millions: 2005=2.0; 2010=2.8
are indeed alling in most o the Corn Belt.
The two maps show median soil
P and K levels (50 percent o samples
are above and below these levels) or
the Corn Belt states and Ontario. The
lower numbers in the maps are the
changes rom 2005.
Phosphorus declined in all areas, with
Wisconsin and the Northeast showing
the largest drops. Soil P levels in the
Western states were lower initially, sothe 3 or 4 ppm reductions seen rom
the summary are important to note.
Preliminary data indicates the P level
decline or Illinois is large.
Soil K relative changes were smaller
in comparison and less consistent.
Nine o the 13 areas showed reduc-
tions or virtually no change, and our
showed small increases. All three o
the western-most states showed large
drops in soil K because o highly nega-
tive nutrient balances, but their median
levels are still well above critical levels. The northeast states and Ontario also
saw large reductions in soil K.
The takeaway is that crops have been
removing more P and K rom many o
the soils o the Corn Belt than those
soils have been receiving as ertilizer
or manure, and the result is declining
soil ertility. The wide range o soil test
results reinorces the importance o
The status o soil ertility levels is an
indicator o the sustainability o arming.
Every fve years, the sta o IPNI
and cooperating private and public
laboratories across the United States
and Canada summarize soil test levels
or phosphorus (P) and potassium (K)
as well as pH to get an inventory o soil
ertility levels across North America.
With decreased ertilizer use in
2009 and the long-term trend o cropsremoving soil nutrients aster than
they’re being replenished, many are
interested in the 2010 summary.
Tests confirm that soil test
levels for P and K are falling
in most of the Corn Belt.
First, the good news rom this
summary process is that there has
been a substantial increase in use o
soil testing since 2005; soil testing has
grown at an average o about 300,000samples per year over the last fve years.
We estimate that about 5.5 million
samples were collected in North
America or the 2010 crop compared
to about our million or the 2005 crop.
This is one o the highest growth rates in
soil testing ever in North America.
Unortunately, the results o these tests
confrm that soil test levels or P and K
The Direction o Soil Fertilityin the Corn Belt
B Y P A U L E . F I X E N , P h . D .
I n t e r n a t i o n a l P l a n t N u t r i t i o n I n s t i t u t e
This inormation produced and presented by The Mosaic Company. 13
8/8/2019 Hay Tham Khao
http://slidepdf.com/reader/full/hay-tham-khao 16/28
- Alala removes approximately
6 pounds S per acre per ton pro-
duced. A 40 bu /acre wheat y ield willremove about 5 pounds S per acre.
• Sulur is mobile in the soil.
Excessive rainall or irrigation water
can move SO4-S through the soil,
particularly when soils are sandy.
Assessing the need or sulur
As more signs o sulur defciency are
seen in crops, a growing number o
producers will wonder i they need to
supplement S. To identiy where supple-
mental S will be benefcial, it’s important
to understand sulur’s role as a plant
nutrient.
Identiying areas with S defciency
oten begins with organic matter
content o the soil. Fields with low
organic matter and long histories o
orage/silage production or continuous
corn systems with no manure additions
would be more likely to exhibit S def-
ciency. Some nutrient defciencies can
be confrmed with a soil test, but with S
as with N, it is difcult to get a reliable
assessment o available S rom soil
chlorophyll production, which makes
the younger leaves o the plant appear
yellow, a symptom sometimes conusedwith N defciency.
Putting S out o balance
What has changed to bring about a
need or supplemental sulur in crop
production?
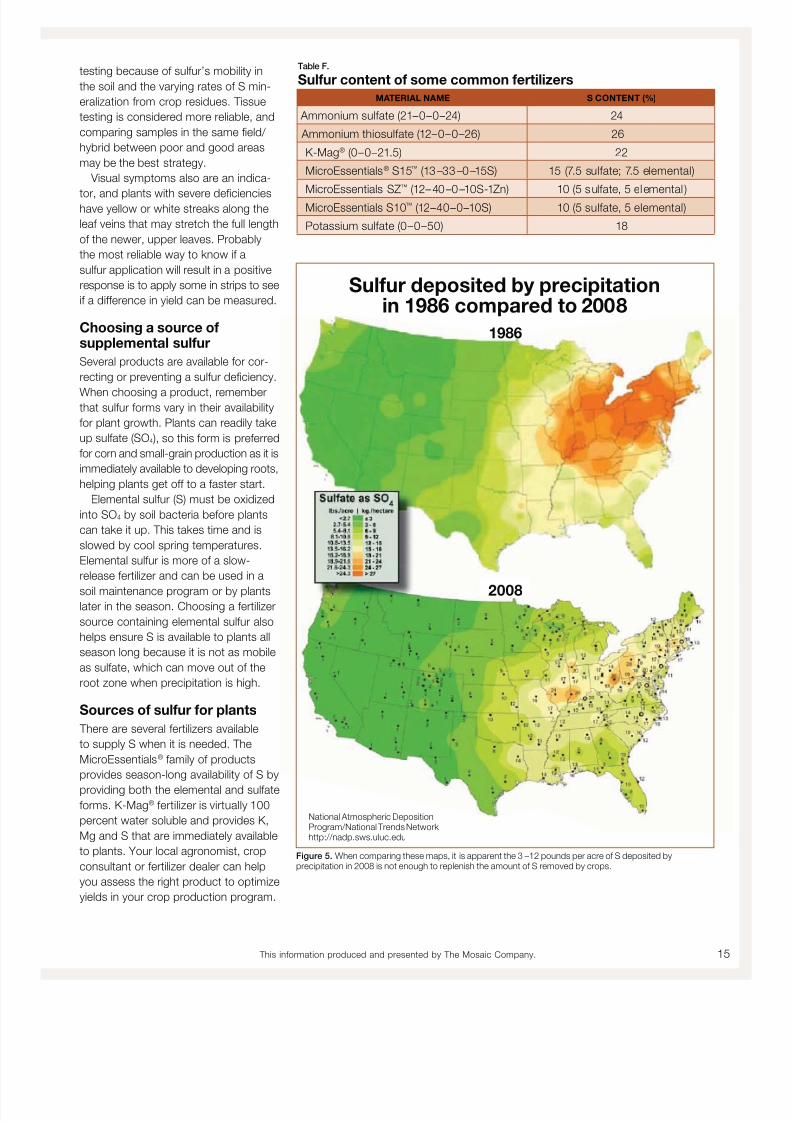
• Decreased S deposition rom rain/
air (Figure 5). Since the 1970 Clean
Air Act, emissions o sulur dioxide
have decreased dramatically, resulting
in reduced deposition rom rain/air.
• Changing ertilization practices.
A switch away rom ammonium sul-ate as a source o N and decreased
use o single superphosphate, which
contained some S, means we’re
adding less S to soils. Manure use
also has changed.
• Increased crop removal.
An increase in both grain and orage
yields results in more rapid depletion
o S rom soils.
- A 180 bu /acre corn crop removes
about 14 pounds S per acre.
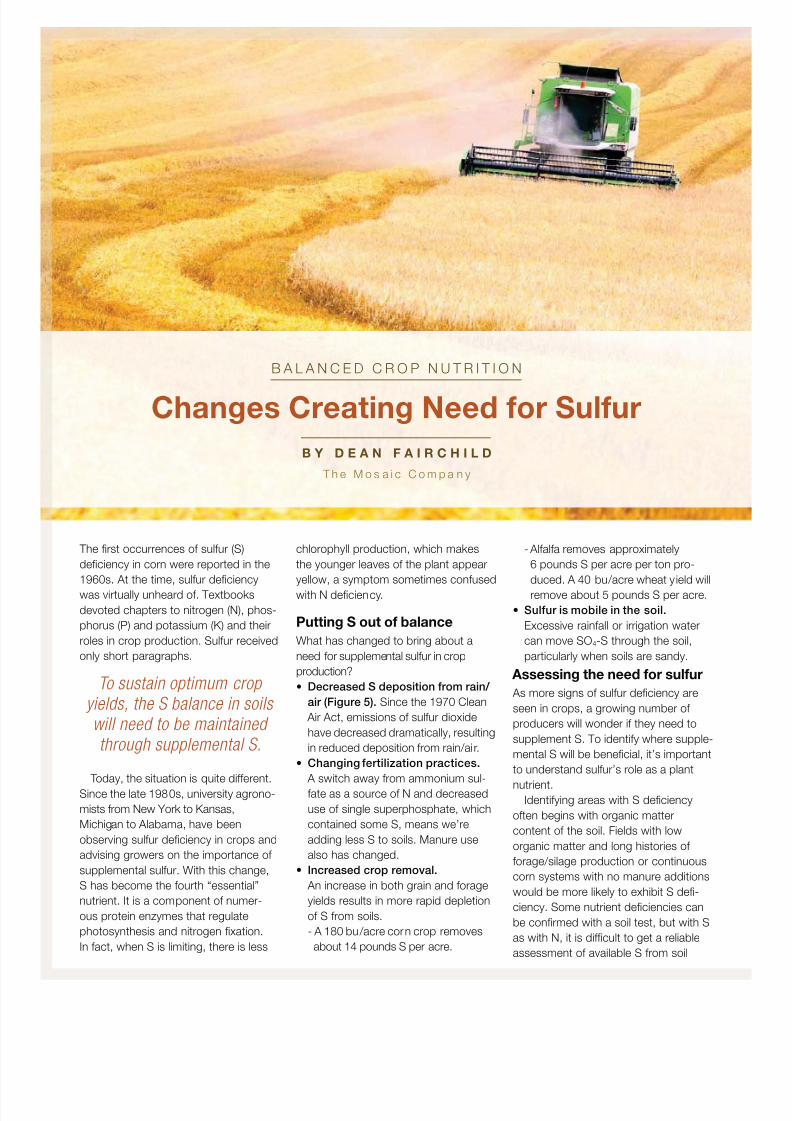
The frst occurrences o sulur (S)
defciency in corn were reported in the
1960s. At the time, sulur defciencywas virtually unheard o. Textbooks
devoted chapters to nitrogen (N), phos-
phorus (P) and potassium (K) and their
roles in crop production. Sulur received
only short paragraphs.
To sustain optimum crop
yields, the S balance in soils
will need to be maintained
through supplemental S.
Today, the situation is quite dierent.Since the late 1980s, university agrono-
mists rom New York to Kansas,
Michigan to Alabama, have been
observing sulur defciency in crops and
advising growers on the importance o
supplemental sulur. With this change,
S has become the ourth “essential”
nutrient. It is a component o numer-
ous protein enzymes that regulate
photosynthesis and nitrogen fxation.
In act, when S is limiting, there is less
B A L A N C E D C R O P N U T R I T I O N
Changes Creating Need or Sulur
B Y D E A N F A I R C H I L D
T h e M o s a i c C o m p a n y
8/8/2019 Hay Tham Khao
http://slidepdf.com/reader/full/hay-tham-khao 17/28
testing because o sulur’s mobility in
the soil and the varying rates o S min-
eralization rom crop residues. Tissue
testing is considered more reliable, and
comparing samples in the same feld/
hybrid between poor and good areas
may be the best strategy.
Visual symptoms also are an indica-
tor, and plants with severe defciencieshave yellow or white streaks along the
lea veins that may stretch the ull length
o the newer, upper leaves. Probably
the most reliable way to know i a
sulur application will result in a positive
response is to apply some in strips to see
i a dierence in yield can be measured.
Choosing a source osupplemental sulur
Several products are available or cor-
recting or preventing a sulur defciency.
When choosing a product, rememberthat sulur orms vary in their availability
or plant growth. Plants can readily take
up sulate (SO4), so this orm is preerred
or corn and small-grain production as it is
immediately available to developing roots,
helping plants get o to a aster start.
Elemental sulur (S) must be oxidized
into SO4 by soil bacteria beore plants
can take it up. This takes time and is
slowed by cool spring temperatures.
Elemental sulur is more o a slow-
release ertilizer and can be used in a
soil maintenance program or by plants
later in the season. Choosing a ertilizer
source containing elemental sulur also
helps ensure S is available to plants all
season long because it is not as mobile
as sulate, which can move out o the
root zone when precipitation is high.
Sources o sulur or plants
There are several ertilizers available
to supply S when it is needed. The
MicroEssentials® amily o products
provides season-long availability o S byproviding both the elemental and sulate
orms. K-Mag® ertilizer is virtually 100
percent water soluble and provides K,
Mg and S that are immediately available
to plants. Your local agronomist, crop
consultant or ertilizer dealer can help
you assess the right product to optimize
yields in your crop production program.
Table F.
Sulur content o some common ertilizers
MATERIAL NAME S CONTENT (%)
Ammonium sulate (21–0–0–24) 24
Ammonium thiosulate (12–0–0–26) 26
K-Mag® (0–0–21.5) 22
MicroEssentials® S15™ (13–33–0–15S) 15 (7.5 sulate; 7.5 elemental)
MicroEssentials SZ™
(12–40–0–10S-1Zn) 10 (5 sulate, 5 elemental )MicroEssentials S10™ (12–40–0–10S) 10 (5 sulate, 5 elemental)
Potassium sulate (0–0–50) 18
Sulur deposited by precipitationin 1986 compared to 2008
Figure 5. When comparing these maps, it is apparent the 3 –12 pounds per acre o S deposited byprecipitation in 2008 is not enough to replenish the amount o S removed by crops.
2008
1986
National Atmospheric DepositionProgram/National Trends Networkhttp://nadp.sws.uluc.edu
This inormation produced and presented by The Mosaic Company. 15

8/8/2019 Hay Tham Khao
http://slidepdf.com/reader/full/hay-tham-khao 18/28
:VTLZLLRHUZ^LYZPU[OLZ[HYZ
6[OLYZSVVR[V[OLZLH
>L»YLÄUKPUNV\YZPU[OLZVPS
Science is a world o
pioneers. Especially the
science o soil. With
more than 40% o crop
yields dependent on
the soil’s ertility, we’re
developing the balanced
ertility strategies to drive
yields even higher. This
initiative has made us a
leader in conservation,
environmental steward-
ship and sustainability.
And kept us in tireless
pursuit o the next great
answer to help the world
grow the ood it needs.
4VZHPJ*VJVT
©2010. The Mosaic Company. All rights reserved. Mosaic is a registered trademark o The Mosaic Company. MOSC-0072
8/8/2019 Hay Tham Khao
http://slidepdf.com/reader/full/hay-tham-khao 19/28
roductionLittle Is ” About Approach
M A N A G E M E N T P R O F I L E
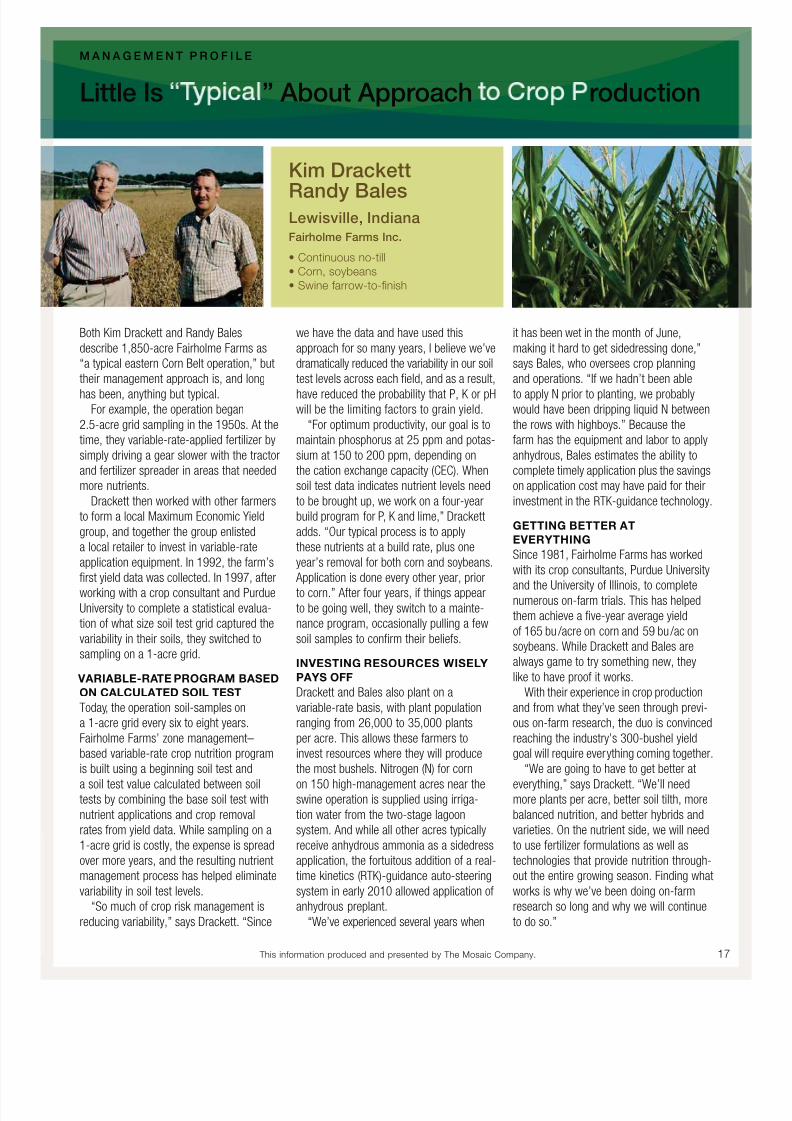
Kim Drackett
Randy BalesLewisville, IndianaFairholme Farms Inc.
• Continuous no-till• Corn, soybeans• Swine arrow-to-fnish
we have the data and have used this
approach or so many years, I believe we’ve
dramatically reduced the variability in our soil
test levels across each feld, and as a result,
have reduced the probability that P, K or pHwill be the limiting actors to grain yield.
“For optimum productivity, our goal is to
maintain phosphorus at 25 ppm and potas-
sium at 150 to 200 ppm, depending on
the cation exchange capacity (CEC). When
soil test data indicates nutrient levels need
to be brought up, we work on a our-year
build program or P, K and lime,” Drackett
adds. “Our typical process is to apply
these nutrients at a build rate, plus one
year’s removal or both corn and soybeans.
Application is done every other year, priorto corn.” Ater our years, i things appear
to be going well, they switch to a mainte-
nance program, occasionally pulling a ew
soil samples to confrm their belies.
INVESTING RESOURCES WISELY
PAYS OFF
Drackett and Bales also plant on a
variable-rate basis, with plant population
ranging rom 26,000 to 35,000 plants
per acre. This allows these armers to
invest resources where they will produce
the most bushels. Nitrogen (N) or corn
on 150 high-management acres near the
swine operation is supplied using irriga-
tion water rom the two-stage lagoon
system. And while all other acres typically
receive anhydrous ammonia as a sidedress
application, the ortuitous addition o a real-
time kinetics (RTK)-guidance auto-steering
system in early 2010 allowed application o
anhydrous preplant.
“We’ve experienced several years when
it has been wet in the month o June,
making it hard to get sidedressing done,”
says Bales, who oversees crop planning
and operations. “I we hadn’t been able
to apply N prior to planting, we probablywould have been dripping liquid N between
the rows with highboys.” Because the
arm has the equipment and labor to apply
anhydrous, Bales estimates the ability to
complete timely application plus the savings
on application cost may have paid or their
investment in the RTK-guidance technology.
GETTING BETTER AT
EVERYTHING
Since 1981, Fairholme Farms has worked
with its crop consultants, Purdue University
and the University o Illinois, to completenumerous on-arm trials. This has helped
them achieve a fve-year average yield
o 165 bu /acre on corn and 59 bu /ac on
soybeans. While Drackett and Bales are
always game to try something new, they
like to have proo it works.
With their experience in crop production
and rom what they’ve seen through previ-
ous on-arm research, the duo is convinced
reaching the industry’s 300-bushel yield
goal will require everything coming together.
“We are going to have to get better at
everything,” says Drackett. “We’ll need
more plants per acre, better soil tilth, more
balanced nutrition, and better hybrids and
varieties. On the nutrient side, we will need
to use ertilizer ormulations as well as
technologies that provide nutrition through-
out the entire growing season. Finding what
works is why we’ve been doing on-arm
research so long and why we will continue
to do so.”
Both Kim Drackett and Randy Bales
describe 1,850-acre Fairholme Farms as
“a typical eastern Corn Belt operation,” but
their management approach is, and long
has been, anything but typical.For example, the operation began
2.5-acre grid sampling in the 1950s. At the
time, they variable-rate-applied ertilizer by
simply driving a gear slower with the tractor
and ertilizer spreader in areas that needed
more nutrients.
Drackett then worked with other armers
to orm a local Maximum Economic Yield
group, and together the group enlisted
a local retailer to invest in variable-rate
application equipment. In 1992, the arm’s
frst yield data was collected. In 1997, aterworking with a crop consultant and Purdue
University to complete a statistical evalua-
tion o what size soil test grid captured the
variability in their soils, they switched to
sampling on a 1-acre grid.
VARIABLE-RATE PROGRAM BASED
ON CALCULATED SOIL TEST
Today, the operation soil-samples on
a 1-acre grid every six to eight years.
Fairholme Farms’ zone management–
based variable-rate crop nutrition program
is built using a beginning soil test and
a soil test value calculated between soil
tests by combining the base soil test with
nutrient applications and crop removal
rates rom yield data. While sampling on a
1-acre grid is costly, the expense is spread
over more years, and the resulting nutrient
management process has helped eliminate
variability in soil test levels.
“So much o crop risk management is
reducing variability,” says Drackett. “Since
This inormation produced and presented by The Mosaic Company. 17
8/8/2019 Hay Tham Khao
http://slidepdf.com/reader/full/hay-tham-khao 20/28
B A L A N C E D C R O P N U T R I T I O N
Managing P Soil Test Values
B Y G Y L E S W . R A N D A L L , P h . D .
U n v e r s i t y o M i n n e s o t a — W a s e c a
8/8/2019 Hay Tham Khao
http://slidepdf.com/reader/full/hay-tham-khao 21/28
P to be available in the soil.
Maintaining high STP values gives
growers the exibility to skip P ertiliza-
tion without sacrifcing yield. Moreover,
the risk o ailing to maximize yield
in exceptional years is reduced bymaintaining STP at high levels. Less-
than-high STP values can easily be yield
limiting, resulting in potential yield being
let in the feld. Finally, high STP gives
extra resource value to the land, provid-
ing better return on investment to both
the landowner and renter.
Visit www.Back-to-Basics.net or
more inormation on soil testing and
managing phosphorus.
Soil testing is the best tool armers have
or determining and managing phos-
phorus (P) levels in their felds. Testing
can confrm increases in soil test phos-
phorus (STP) resulting rom application
o P and also document how much
crop removal has decreased STP.
Unortunately, in the last decade or
two, STP has declined in many areaso the Corn Belt. The steady decline is
generally due to increasing yields, which
remove greater levels o P rom the soil,
coupled with P application rates that
oten have allen below crop nutrient
removal rates (Table G). This trend is
particularly evident or rented land when
the renter chooses to mine P rom the
soil rather than apply ertilizer or manure
P at a rate sufcient to maintain STP at
an optimum level.
Building P soil test valuesSince nutrients removed by the crop
need to be replaced by ertilizer or
manure P to maintain soil test P values,
armers oten ask, “How much phos-
phate will it take to raise my STP value
to the optimum level?” This is a difcult
question to answer as the amount o
P required depends on current and tar-
geted STP levels, subsoil P level, depth
o P2O5 incorporation and crop yields/
nutrient removal during the time rame
in which the STP is to be increased.
A common rule o thumb developed
by University o Illinois researchers
says 18 pounds P2O5 per acre will
increase Bray P1 by 1 ppm. In a 12-year
Minnesota study during the ’70s and
’80s, with corn yields averaging 150
bu /acre, Bray P1 STP was maintained
at 20 ppm with an annual 50-pounds-
P2O5-per-acre rate. STP increased 1
ppm per year when an additional 30
pounds P2O5 per acre were applied
annually. Thus, given the many variables
involved, annual soil testing is an excel-lent way to monitor changes in STP or
each particular situation.
Recent research indicates high soil
test P values may be necessary or
economically successul corn and
soybean production. A three-year study
in Minnesota compared yields o corn
and soybeans grown on low P-testing
soil and very high P-testing soil. A
50-pounds-P2O5-per-acre rate was
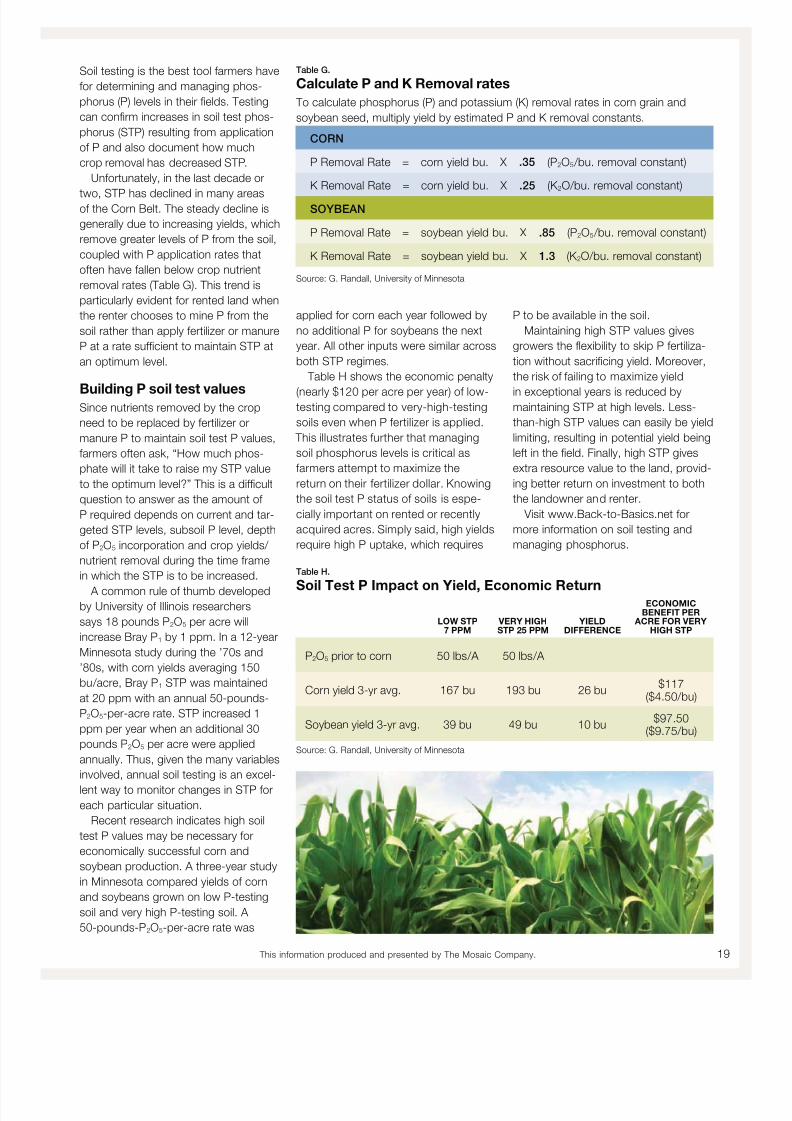
Table G.
Calculate P and K Removal rates
To calculate phosphorus (P) and potassium (K) removal rates in corn grain and
soybean seed, multiply yield by estimated P and K removal constants.
CORN
P Removal Rate = corn yield bu. X .35 (P2O5 /bu. removal constant)
K Removal Rate = corn yield bu. X .25 (K2O/bu. removal constant)
SOYBEAN
P Removal Rate = soybean yield bu. X .85 (P2O5 /bu. removal constant)
K Removal Rate = soybean yield bu. X 1.3 (K2O/bu. removal constant)
Source: G. Randall, University o Minnesota
applied or corn each year ollowed by
no additional P or soybeans the next
year. All other inputs were similar across
both STP regimes.
Table H shows the economic penalty
(nearly $120 per acre per year) o low-testing compared to very-high-testing
soils even when P ertilizer is applied.
This illustrates urther that managing
soil phosphorus levels is critical as
armers attempt to maximize the
return on their ertilizer dollar. Knowing
the soil test P status o soils is espe-
cially important on rented or recently
acquired acres. Simply said, high yields
require high P uptake, which requires
Table H.
Soil Test P Impact on Yield, Economic Return
LOW STP7 PPM
VERY HIGHSTP 25 PPM
YIELDDIFFERENCE
ECONOMICBENEFIT PER
ACRE FOR VERYHIGH STP
P2O5 prior to corn 50 lbs /A 50 lbs /A
Corn yield 3-yr avg. 167 bu 193 bu 26 bu$117
($4.50/bu)
Soybean yield 3-yr avg. 39 bu 49 bu 10 bu$97.50
($9.75/bu)
Source: G. Randall, University o Minnesota
This inormation produced and presented by The Mosaic Company. 19
8/8/2019 Hay Tham Khao
http://slidepdf.com/reader/full/hay-tham-khao 22/28
ance An “E g ” eaves Nothin
M A N A G E M E N T P R O F I L E
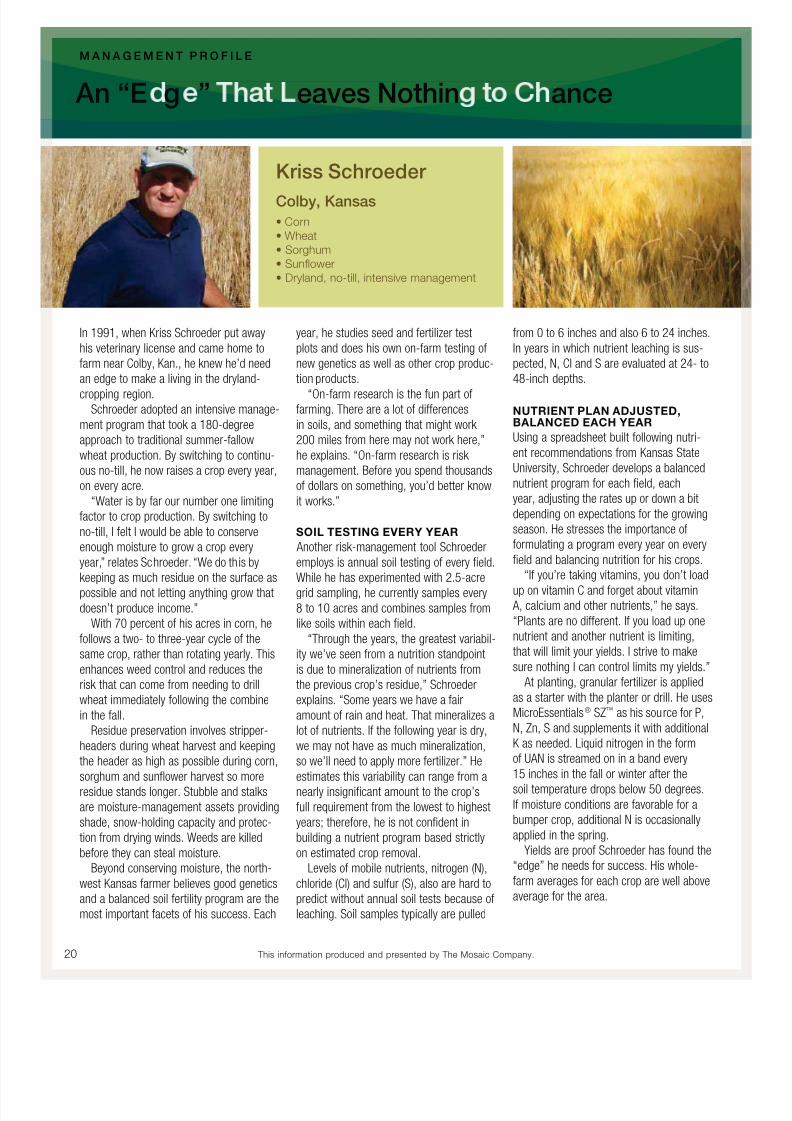
Kriss Schroeder
Colby, Kansas• Corn• Wheat• Sorghum• Sunower• Dryland, no-till, intensive management
rom 0 to 6 inches and also 6 to 24 inches.
In years in which nutrient leaching is sus-
pected, N, Cl and S are evaluated at 24- to
48-inch depths.
NUTRIENT PLAN ADJUSTED,BALANCED EACH YEAR
Using a spreadsheet built ollowing nutri-
ent recommendations rom Kansas State
University, Schroeder develops a balanced
nutrient program or each feld, each
year, adjusting the rates up or down a bit
depending on expectations or the growing
season. He stresses the importance o
ormulating a program every year on every
feld and balancing nutrition or his crops.
“I you’re taking vitamins, you don’t load
up on vitamin C and orget about vitamin
A, calcium and other nutrients,” he says.
“Plants are no dierent. I you load up one
nutrient and another nutrient is limiting,
that will limit your yields. I strive to make
sure nothing I can control limits my yields.”
At planting, granular ertilizer is applied
as a starter with the planter or drill. He uses
MicroEssentials® SZ™ as his source or P,
N, Zn, S and supplements it with additional
K as needed. Liquid nitrogen in the orm
o UAN is streamed on in a band every
15 inches in the all or winter ater thesoil temperature drops below 50 degrees.
I moisture conditions are avorable or a
bumper crop, additional N is occasionally
applied in the spring.
Yields are proo Schroeder has ound the
“edge” he needs or success. His whole-
arm averages or each crop are well above
average or the area.
year, he studies seed and ertilizer test
plots and does his own on-arm testing o
new genetics as well as other crop produc-
tion products.
“On-arm research is the un part oarming. There are a lot o dierences
in soils, and something that might work
200 miles rom here may not work here,”
he explains. “On-arm research is risk
management. Beore you spend thousands
o dollars on something, you’d better know
it works.”
SOIL TESTING EVERY YEAR
Another risk-management tool Schroeder
employs is annual soil testing o every feld.
While he has experimented with 2.5-acregrid sampling, he currently samples every
8 to 10 acres and combines samples rom
like soils within each feld.
“Through the years, the greatest variabil-
ity we’ve seen rom a nutrition standpoint
is due to mineralization o nutrients rom
the previous crop’s residue,” Schroeder
explains. “Some years we have a air
amount o rain and heat. That mineralizes a
lot o nutrients. I the ollowing year is dry,
we may not have as much mineralization,
so we’ll need to apply more ertilizer.” He
estimates this variability can range rom anearly insignifcant amount to the crop’s
ull requirement rom the lowest to highest
years; thereore, he is not confdent in
building a nutrient program based strictly
on estimated crop removal.
Levels o mobile nutrients, nitrogen (N),
chloride (Cl) and sulur (S), also are hard to
predict without annual soil tests because o
leaching. Soil samples typically are pulled
In 1991, when Kriss Schroeder put away
his veterinary license and came home to
arm near Colby, Kan., he knew he’d need
an edge to make a living in the dryland-
cropping region.Schroeder adopted an intensive manage-
ment program that took a 180-degree
approach to traditional summer-allow
wheat production. By switching to continu-
ous no-till, he now raises a crop every year,
on every acre.
“Water is by ar our number one limiting
actor to crop production. By switching to
no-till, I elt I would be able to conserve
enough moisture to grow a crop every
year,” relates Schroeder. “We do this by
keeping as much residue on the surace aspossible and not letting anything grow that
doesn’t produce income.”
With 70 percent o his acres in corn, he
ollows a two- to three-year cycle o the
same crop, rather than rotating yearly. This
enhances weed control and reduces the
risk that can come rom needing to drill
wheat immediately ollowing the combine
in the all.
Residue preservation involves stripper-
headers during wheat harvest and keeping
the header as high as possible during corn,
sorghum and sunower harvest so moreresidue stands longer. Stubble and stalks
are moisture-management assets providing
shade, snow-holding capacity and protec-
tion rom drying winds. Weeds are killed
beore they can steal moisture.
Beyond conserving moisture, the north-
west Kansas armer believes good genetics
and a balanced soil ertility program are the
most important acets o his success. Each
20 This inormation produced and presented by The Mosaic Company.
8/8/2019 Hay Tham Khao
http://slidepdf.com/reader/full/hay-tham-khao 23/28
Magnesium—Oten Forgotten, but Most Essential
• Increasing rates o needed K ertil-
izers will put greater stress on Mg
absorption. This places more K ionsin the soil solution to compete with
Mg ions or uptake by plant roots.
• Root uptake difculties brought on
by soil acidity, by soil ooding or
compaction, or by reduced-tillage
practices.
• Greater removal o Mg rom the
feld occurs due to increasing yields
and multiple cropping. (Nutrient
uptake values or individual crops
are presented on page 12.)
Higher crop yield and qualityMagnesium’s contributions to yield
and quality are both crop and site
specifc. Scientists in Minnesota, or
example, pay special attention to the
Mg status o orage crops to help avoid
an Mg shortage in the diet o ruminant
animals. Magnesium’s contributions to
crop quality are seldom visible since
it works behind the scenes regulating
enzyme systems, producing sugars or
helping with other vital crop activities.
University specialists in the Southeast
United States point out that a shortageo Mg is most likely or high-yield crops
growing on acidic, sandy soils o the
Coastal Plain.
Vegetable crops are oten responsive
to ertilizer Mg. For example, Mg
improved the protein content o potatoes
and reduced internal discoloration while
increasing frmness. Color disorders in
tomatoes were reduced by balancing
Mg and K in the ertilization program.
Yield response has been noted or
dierent crops growing on low-testing
soils: 1) Mg increased potato yield rom
6.7 to 8.7 tons per acre in Michigan;
2) 50 lbs/acre o Mg increased tomato
yield rom 16.5 to 20.3 tons/acre; and
3) Mg increased corn grain yield at three
locations on low-Mg coastal plain soils.
To learn more about the role o
magnesium in crop production,
visit www.Back-to-Basics.net.
Without photosynthesis, plant lie would
not exist. And without magnesium (Mg),
there would be no photosynthesis.Plants could not produce our ood, and
hunger would become our number one
concern.
Oten the “orgotten nutrient,” Mg is
the most essential o the 17 nutrients
needed or plant growth. It is a vital
team player working with other nutri-
ents and is essential or top-proft crop
production.
Contributions to plant growth
As the central ion in the chlorophyll
molecule, Mg is essential or photosyn-thesis. It works with phosphorus (P) to
transer energy needed within the plant
or growth, and it works with nitrogen
(N), sulur (S) and potassium (K) to build
quality protein. Seed ormation requires
both Mg and P.
Crop and soil needs or Mgare science based
Soil tests are the most reliable way
to determine Mg availability rom soil
reserves. The soil’s Mg status should
be updated whenever pH, P and Klevels are checked. Remember, crop
response to ertilizer Mg occurs most
oten on acidic, low-exchange-capacity
soils that are low in organic matter and
soil test Mg.
Plant analysis can help to detect a
shortage o Mg. Sample the whole plant
at the seedling stage or corn, small
grains or soybeans. As plants approach
their reproductive stage, specifc leaves
become a better measure o the Mg
status. For many crops, a rule o thumb
is to sample the youngest ully mature
leaves. I possible, collect a soil sample
at the same time and rom the same
area o the plant sample.
Increasing yields will requirehigher Mg levels
• Higher plant populations per acre will
require more nutrients to meet growth
needs.
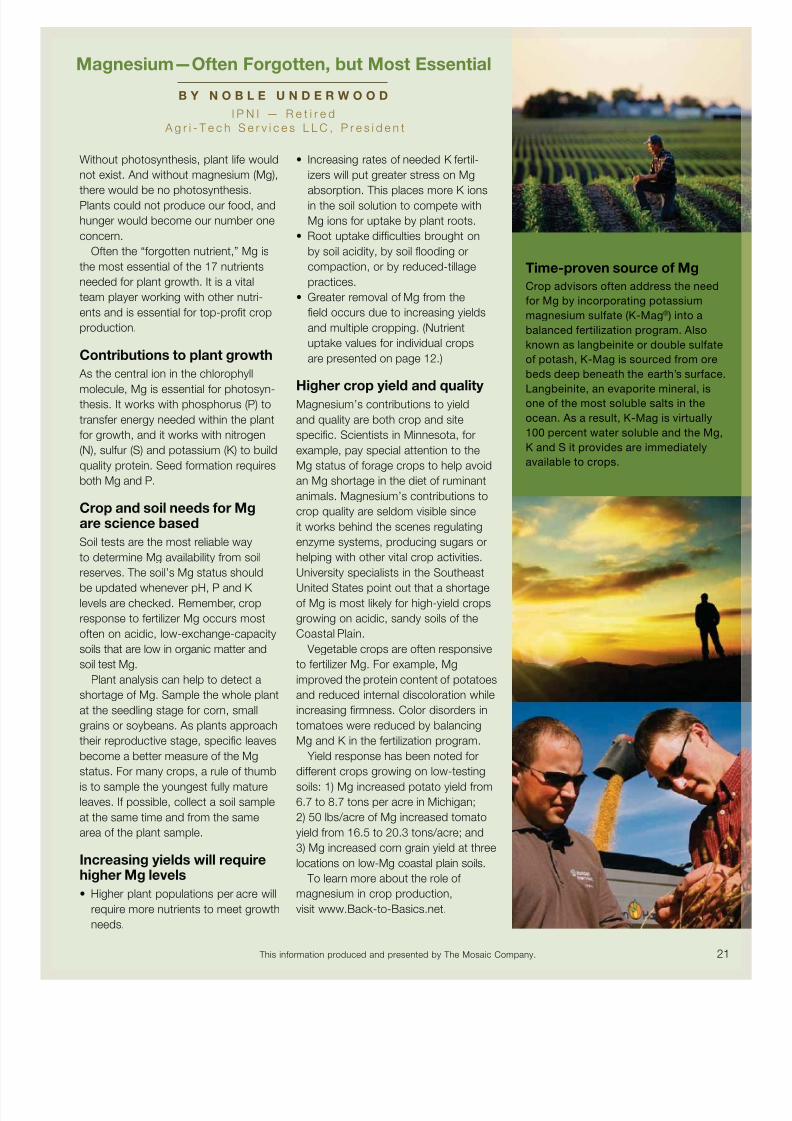
Time-proven source o Mg
Crop advisors oten address the need
or Mg by incorporating potassium
magnesium sulate (K-Mag® ) into a
balanced ertilization program. Also
known as langbeinite or double sulate
o potash, K-Mag is sourced rom ore
beds deep beneath the earth’s surace.
Langbeinite, an evaporite mineral, isone o the most soluble salts in the
ocean. As a result, K-Mag is virtually
100 percent water soluble and the Mg,
K and S it provides are immediately
available to crops.
B Y N O B L E U N D E R W O O D
I P N I — R e t i r e d A g r i - T e c h S e r v i c e s L L C , P r e s i d e n t
This inormation produced and presented by The Mosaic Company. 21
8/8/2019 Hay Tham Khao
http://slidepdf.com/reader/full/hay-tham-khao 24/28
B A L A N C E D C R O P N U T R I T I O N
Understanding Zinc Defciency
B Y D A N F R O E H L I C H , P h . D .
T h e M o s a i c C o m p a n y
8/8/2019 Hay Tham Khao
http://slidepdf.com/reader/full/hay-tham-khao 25/28
lower soil temperature and higher soil
moisture level. These conditions put
stress on a small root system, making
it difcult to uptake required Zn, as
well as P and Mg.
• Low organic matter. Zinc availability
also has been linked to soil organic
matter content. The soil test or Zn
usually increases as the soil organicmatter content increases. So, Zn
defciency symptoms will usually
appear frst on eroded portions o the
landscape where the organic matter
content is low.
• Early crop-planting windows.
Corn and certain vegetables are
being seeded earlier in the spring,
when soils are cool and moist. This
compounds the stress on seed-
lings caused by reduced tillage, and
makes a readily available supply o Zn
and other nutrients even more impor-tant to ensure early plant growth.
• Soils testing low in Zn and high
in P. Soil-test each feld to help
identiy where crops will respond to
Zn. Fields that test low in Zn and high
in soil pH and P need attention frst.
University scientists report that a low
Zn level, teamed with a high soil pH,
can increase crop uptake o P to an
excessive level. A shortage o Zn
severely impairs the plant’s ability to
regulate P accumulation. This triggers
excess uptake o P and the develop-ment o Zn defciency symptoms.
Getting ready or next year’scrops starts now
Soil and plant analysis labs provide
guidelines or sampling felds, evaluating
crop need or Zn and determining the
amount o ertilizer Zn needed to correct
a defciency.
Soil-sample felds careully, and
analyze the lab reports on a feld-by-
feld, crop-by-crop basis with your
agronomic advisor. Remember, a Zn
defciency is oten not visible at the high-
yield level. Thus, soil and plant analysis
are key detection tools. Knowing the
other conditions that create resis-
tance to root uptake o Zn will help to
determine when Zn should become a
member o the balanced nutrient team.
To learn more about zinc, visit
www.Back-to-Basics.net.
Zinc (Zn) has been put to work on arms
or decades. Fencing wire and nails are
galvanized with zinc to prevent rust.
Metal buckets are coated with zinc to
last longer. However, zinc’s most impor-
tant job is in the feld, as one o the 17
essential elements in plant growth.
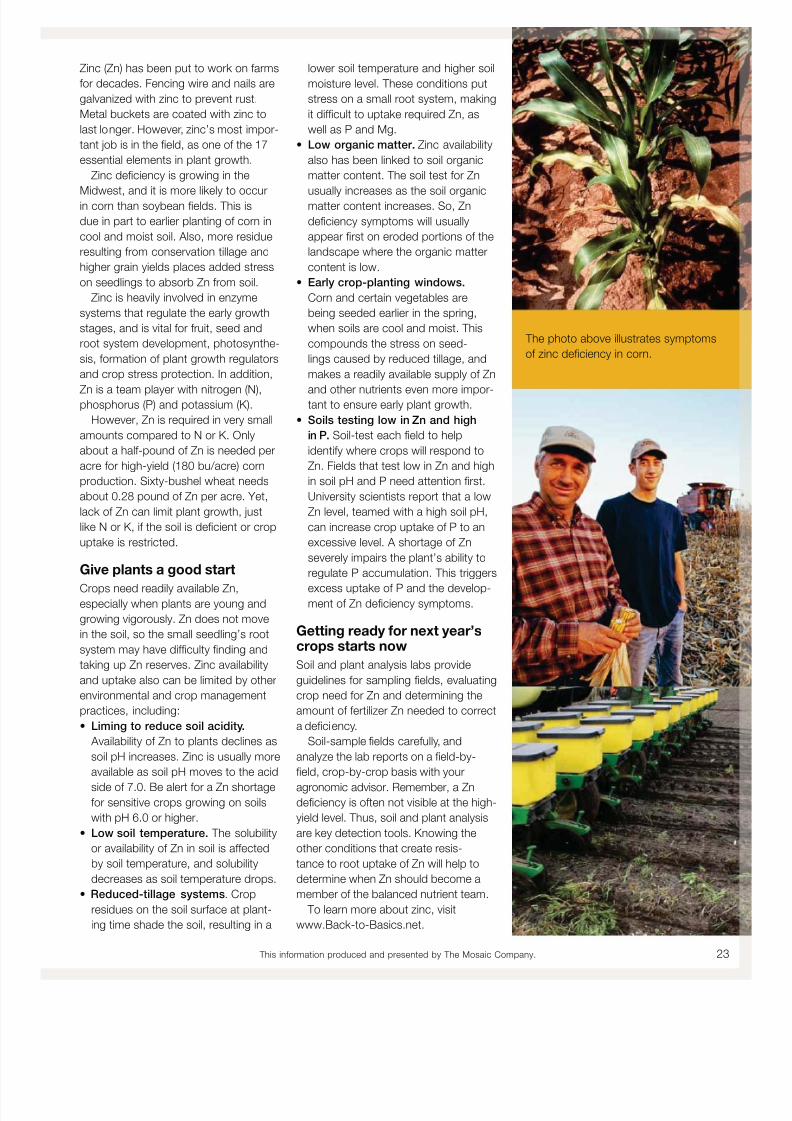
Zinc defciency is growing in the
Midwest, and it is more likely to occurin corn than soybean felds. This is
due in part to earlier planting o corn in
cool and moist soil. Also, more residue
resulting rom conservation tillage and
higher grain yields places added stress
on seedlings to absorb Zn rom soil.
Zinc is heavily involved in enzyme
systems that regulate the early growth
stages, and is vital or ruit, seed and
root system development, photosynthe-
sis, ormation o plant growth regulators
and crop stress protection. In addition,
Zn is a team player with nitrogen (N),phosphorus (P) and potassium (K).
However, Zn is required in very small
amounts compared to N or K. Only
about a hal-pound o Zn is needed per
acre or high-yield (180 bu/acre) corn
production. Sixty-bushel wheat needs
about 0.28 pound o Zn per acre. Yet,
lack o Zn can limit plant growth, just
like N or K, i the soil is defcient or crop
uptake is restricted.
Give plants a good start
Crops need readily available Zn,especially when plants are young and
growing vigorously. Zn does not move
in the soil, so the small seedling’s root
system may have difculty fnding and
taking up Zn reserves. Zinc availability
and uptake also can be limited by other
environmental and crop management
practices, including:
• Liming to reduce soil acidity.
Availability o Zn to plants declines as
soil pH increases. Zinc is usually more
available as soil pH moves to the acid
side o 7.0. Be alert or a Zn shortage
or sensitive crops growing on soils
with pH 6.0 or higher.
• Low soil temperature. The solubility
or availability o Zn in soil is aected
by soil temperature, and solubility
decreases as soil temperature drops.
• Reduced-tillage systems. Crop
residues on the soil surace at plant-
ing time shade the soil, resulting in a
The photo above illustrates symptoms
o zinc defciency in corn.
This inormation produced and presented by The Mosaic Company. 23
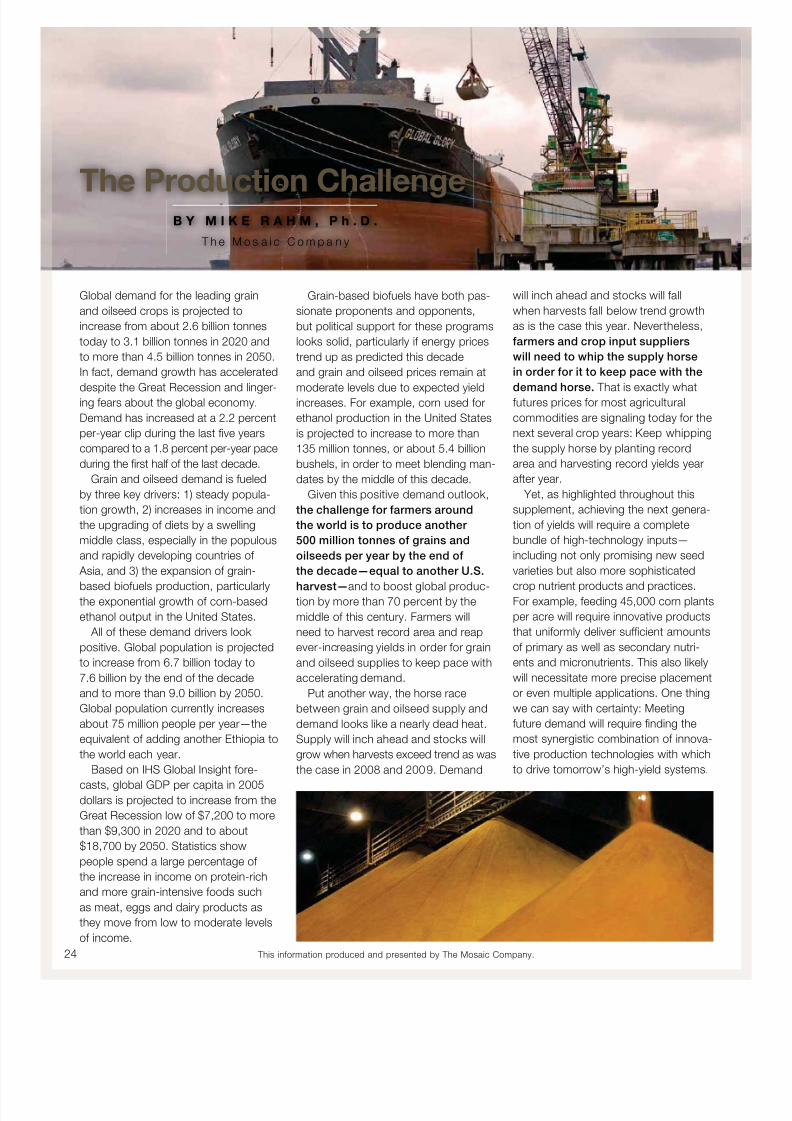
8/8/2019 Hay Tham Khao
http://slidepdf.com/reader/full/hay-tham-khao 26/28
Grain-based biouels have both pas-
sionate proponents and opponents,
but political support or these programs
looks solid, particularly i energy prices
trend up as predicted this decade
and grain and oilseed prices remain at
moderate levels due to expected yieldincreases. For example, corn used or
ethanol production in the United States
is projected to increase to more than
135 million tonnes, or about 5.4 billion
bushels, in order to meet blending man-
dates by the middle o this decade.
Given this positive demand outlook,
the challenge or armers around
the world is to produce another
500 million tonnes o grains and
oilseeds per year by the end o
the decade—equal to another U.S.
harvest—and to boost global produc-tion by more than 70 percent by the
middle o this century. Farmers will
need to harvest record area and reap
ever-increasing yields in order or grain
and oilseed supplies to keep pace with
accelerating demand.
Put another way, the horse race
between grain and oilseed supply and
demand looks like a nearly dead heat.
Supply will inch ahead and stocks will
grow when harvests exceed trend as was
the case in 2008 and 2009. Demand
Global demand or the leading grain
and oilseed crops is projected to
increase rom about 2.6 billion tonnes
today to 3.1 billion tonnes in 2020 and
to more than 4.5 billion tonnes in 2050.
In act, demand growth has accelerated
despite the Great Recession and linger-ing ears about the global economy.
Demand has increased at a 2.2 percent
per-year clip during the last fve years
compared to a 1.8 percent per-year pace
during the frst hal o the last decade.
Grain and oilseed demand is ueled
by three key drivers: 1) steady popula-
tion growth, 2) increases in income and
the upgrading o diets by a swelling
middle class, especially in the populous
and rapidly developing countries o
Asia, and 3) the expansion o grain-
based biouels production, particularlythe exponential growth o corn-based
ethanol output in the United States.
All o these demand drivers look
positive. Global population is projected
to increase rom 6.7 billion today to
7.6 billion by the end o the decade
and to more than 9.0 billion by 2050.
Global population currently increases
about 75 million people per year—the
equivalent o adding another Ethiopia to
the world each year.
Based on IHS Global Insight ore-
casts, global GDP per capita in 2005
dollars is projected to increase rom the
Great Recession low o $7,200 to more
than $9,300 in 2020 and to about
$18,700 by 2050. Statistics show
people spend a large percentage o
the increase in income on protein-rich
and more grain-intensive oods such
as meat, eggs and dairy products as
they move rom low to moderate levels
o income.
will inch ahead and stocks will all
when harvests all below trend growth
as is the case this year. Nevertheless,
armers and crop input suppliers
will need to whip the supply horse
in order or it to keep pace with the
demand horse. That is exactly whatutures prices or most agricultural
commodities are signaling today or the
next several crop years: Keep whipping
the supply horse by planting record
area and harvesting record yields year
ater year.
Yet, as highlighted throughout this
supplement, achieving the next genera-
tion o yields will require a complete
bundle o high-technology inputs—
including not only promising new seed
varieties but also more sophisticated
crop nutrient products and practices.For example, eeding 45,000 corn plants
per acre will require innovative products
that uniormly deliver sufcient amounts
o primary as well as secondary nutri-
ents and micronutrients. This also likely
will necessitate more precise placement
or even multiple applications. One thing
we can say with certainty: Meeting
uture demand will require fnding the
most synergistic combination o innova-
tive production technologies with which
to drive tomorrow’s high-yield systems.
;OL7YVK\J[PVU*OHSSLUNLB Y M I K E R A H M , P h . D .
T h e M o s a i c C o m p a n y
24 This inormation produced and presented by The Mosaic Company.

8/8/2019 Hay Tham Khao
http://slidepdf.com/reader/full/hay-tham-khao 27/28
With every new generation, population continues to grow. This means we need more food.
Today’s farmers are leading the way to meet the increasing food demands of the future.
MicroEssentials ® is the next generation of fertilizer designed to meet the needs of your
advanced farming operation. Demand more;
demand MicroEssentials. For more information,
go to MicroEssentials.com.
© 2010, The Mosaic Company. All rights reserved. MicroEssentials is a registered trademark of The Mosaic Company. MES-0169
The next generation of fertilizerfor the next generation of farming.
Every MicroEssentials
granule contains nitrogen,
phosphorus and sulfur. This
ensures uniform distribution
and better nutrient uptake.

8/8/2019 Hay Tham Khao
http://slidepdf.com/reader/full/hay-tham-khao 28/28