Embed Size (px)
Citation preview
HEIKKI NIEMINEN
Acoustic Properties of ArticularCartilage
Effect of Composition, Structure andMechanical Loading
JOKAKUOPIO 2007
KUOPION YLIOPISTON JULKAISUJA C. LUONNONTIETEET JA YMPÄRISTÖTIETEET 211KUOPIO UNIVERSITY PUBLICATIONS C. NATURAL AND ENVIRONMENTAL SCIENCES 211
Doctoral dissertation
To be presented by permission of the Faculty of Natural and Environmental Sciences
of the University of Kuopio for public examination in Auditorium ML3,
Medistudia building, University of Kuopio,
on Friday 11th May 2007, at 12 noon
Department of Physics, University of KuopioInstitute of Biomedicine, Anatomy, University of Kuopio
Department of Clinical Physiology and Nuclear MedicineKuopio University Hospital and
University of Kuopio
Distributor : Kuopio University Library P.O. Box 1627 FI-70211 KUOPIO FINLAND Tel. +358 17 163 430 Fax +358 17 163 410 http://www.uku.fi/kirjasto/julkaisutoiminta/julkmyyn.html
Series Editors: Professor Pertti Pasanen, Ph.D. Department of Environmental Sciences
Professor Jari Kaipio, Ph.D. Department of Physics
Author’s address: Department of Physics University of Kuopio P.O. Box 1627 FI-70211 KUOPIO FINLAND Tel. +358 50 338 9932 Fax +358 17 162 585 E-mail : [email protected]
Supervisors: Professor Jukka Jurvelin, Ph.D. Department of Physics University of Kuopio
Docent Juha Töyräs, Ph.D. Department of Clinical Neurophysiology Kuopio University Hospital
Reviewers: Dr. Bahaa Seedhom, Ph.D. Division of Bioengineering Academic Unit of Musculoskeletal Diseases Leeds Medical School Leeds University, UK
Assistant Professor Elisa Konofagou, Ph.D. Department of Biomechanical Engineering Columbia University, New York, USA
Opponent: Associate Professor Yongping Zheng, Ph.D. Department of Health Technology and Informatics Hong Kong Polytechnic University, Hong Kong
ISBN 978-951-27-0689-1ISBN 978-951-27-0784-3 (PDF)ISSN 1235-0486
KopijyväKuopio 2007Finland
Nieminen, Heikki. Acoustic Properties of Articular Cartilage: Effect of Composition, Structure andMechanical Loading. Kuopio University Publications C. Natural and Environmental Sciences 211. 2007.80 p.ISBN 978-951-27-0689-1ISBN 978-951-27-0784-3 (PDF)ISSN 1235-0486
ABSTRACTArticular cartilage is connective tissue that provides low friction surfaces where bones come into contactand, during locomotion and standing it distributes the loads applied to the joint, minimizing the stresseson the subchondral bone. Osteoarthrosis (OA) is a severe joint disease characterized by collagen disrup-tion, proteoglycan depletion and impaired mechanical properties. In OA, the joint cartilage is exposedto increased wear and this can lead to damaging bone-to-bone contact. The degenerative process causespain to the patient and, finally, dysfunction of the diseased joint. Diagnosis of OA at the initial stage isessential in order to slow down the degenerative process. Unfortunately, the current clinical techniquesare incapable of diagnosing early OA. Earlier studies have suggested that ultrasound may be used todetect OA changes in cartilage structure and composition. Further, mechanical indentation has beencombined with ultrasound measurements to enable determination of cartilage thickness and compres-sive strains, and in this way it is possible to obtain a more accurate determination of the mechanicalproperties of cartilage. However, it is not known whether the possible compression-related changes inacoustic parameters affect mechano-acoustically determined mechanical properties.
This study attempts to clarify the effects of structure and composition of articular cartilage and me-chanical loading on acoustic properties of the tissue. Acoustic properties of normal and enzymatically orspontaneously degenerated bovine articular cartilage were studied. Acoustic parameters, i.e. ultrasoundreflection at cartilage surface, speed and attenuation, were related to tissue structure, composition andmechanical properties, as assessed by reference histological, biochemical and mechanical measurements.Ultrasound speed and attenuation in human, bovine and porcine cartilage was also studied under me-chanical loading. Errors introduced into the mechano-acoustically determined mechanical propertiesthrough compression-related variation in ultrasound speed were evaluated. A novel model describingcompression-related variations of ultrasound speed in human patellar cartilage was established by re-lating ultrasound speed with compression-related variations in collagen orientation and composition.For reference, a sample-specific finite element (FE) model was constructed by implementing realisticorientation and composition of cartilage as revealed by histological analyses, Fourier transform infraredimaging and water content analyses.
The ultrasound reflection coefficient at the cartilage surface was found to be sensitive at detectingdegradation of superficial collagen. The ultrasound speed and attenuation were significantly relatedto composition, structure and degeneration of cartilage. Ultrasound speed and attenuation were alsoaffected by the mechanical stress and deformation to which cartilage was subjected. The variation inultrasound speed, although minor, was found to introduce errors into mechano-acoustically measuredstrain and elastic modulus. The model constructed in this thesis predicted compression-related variationof ultrasound speed with good accuracy, suggesting that variations in collagen orientation and watercontent in cartilage can determine changes in ultrasound speed during compression.
The results indicate that acoustic properties are related to the structure and composition of articularcartilage. Ultrasound measurements, when accurately measured in vivo, could be of benefit in thediagnostics of early OA. However, mechano-acoustic measurements of the mechanical properties ofarticular cartilage along the axis of ultrasound propagation may be subject to significant errors dueto compression-related variation in the ultrasound speed. Further studies are needed to reveal whethercompression-related errors in mechano-acoustic measurements of articular cartilage can be avoided.
Universal Decimal Classification: 534-8, 534.321.9, 534.7, 620.179.16, 620.179.17National Library of Medicine Classification: WE 300, WE 348, WE 103, QT 34, WN 208Medical Subject Headings: Cartilage, Articular/physiology; Cartilage, Articular/anatomy & histology; Osteoarthri-tis/diagnosis; Proteoglycans; Collagen; Acoustics; Ultrasonics; Ultrasonography; Mechanics; Biomechanics; Stress, Me-chanical; Elasticity; Materials Testing; Finite Element Analysis


To my parents, Marja-Leena and Risto

ACKNOWLEDGMENTS
This study was carried out during the years 2000-2007 in the Department of Physicsand Institute of Biomedicine, Anatomy, University of Kuopio, and in the Department ofClinical Physiology and Nuclear Medicine, Kuopio University Hospital and University ofKuopio.
There are numerous people without whom completing this project would have beenimpossible.
I wish to express my deepest gratitude to my primary supervisor, Professor JukkaS. Jurvelin, Ph.D., for his unselfish and devoted supervision throughout the years. Iwish to thank him also for his support and understanding especially during the difficulttimes. Working in his research group, Biophysics of Bone and Cartilage (BBC), has beena great honor.
I am indebted to my secondary supervisor, Docent Juha Töyräs, Ph.D., for his catch-ing enthusiasm and the never-ending ideas that have kept my work freshly germinating.His dedicated and humorous attitude has always been exemplary and highly inspiring.
I give my cordial thanks to the official pre-examiners, Dr. Bahaa Seedhom, Ph.D. andAssistant Professor Elisa Konofagou, Ph.D., for their constructive critique to improvemy thesis. I am grateful to Ewen MacDonald, D.Pharm., for the linguistic review.
It has been inspirational to work within a colourful research environment with highlyintelligent colleagues. My special thanks go to my "room-mate", Mikko Nissi, M.Sc.,whos joyful and positive attitude and constructive discussions have made working in theresearch group more than a pleasure. I am grateful to Professor Heikki Helminen, M.D.,Ph.D., for providing various resources and the warm and fartherly support throughoutthe project. I wish to thank Jani Hirvonen, M.Sc. (Eng.), and Matti Timonen, B.Sc., fortheir momentous contribution to software programming. I am highly grateful to PetroJulkunen, M.Sc. (Eng.), for his effort in the modeling of articular cartilage mechanics.I wish to thank Jarno Rieppo, M.D., for his essential contribution in the microscopytechniques. I am thankful for Mikko Lammi, Ph.D., and Kari Törrönen, M.Sc., for theirinvaluable help with biochemical analyses. I am grateful to Mrs. Eija Rahunen andMr. Kari Kotikumpu for the skillful preparation of histological samples. I wish to thankDocent Ilkka Kiviranta, M.D., Ph.D., and Atria Lihakunta Oyj (Kuopio, Finland) forproviding material for the study. I am thankful to Simo Saarakkala, Ph.D., for the re-warding "ultrasonic" discussions throughout this project. I wish to express my earnestthanks to the following, current and emeritus members, of the BBC-group: Mikko Haku-linen, Ph.D., Antti Kallioniemi, M.Sc. (Eng.), Erna Kaleva, M.Sc., Janne Karjalainen,M.Sc. (Eng.), Panu Kiviranta, B.M., Rami Korhonen, Ph.D., Jatta Kurkijärvi, M.Sc.,Mikko S. Laasanen, Ph.D., Eveliina Lammentausta, M.Sc., Pauno Lötjönen, physics stu-dent, Juho Marjanen, M.Sc., Ossi Riekkinen, M.Sc. and Tuomo Silvast, M.Sc. I wishto thank the Biomedical Ultrasound Group, University of Kuopio, for seamless collabo-ration. I am highly grateful to Dr. Derrick White, Ph.D., for his constructive criticismtowards my work.
I am highly grateful for financial support from the Technology Development Center(TEKES), Helsinki, Finland (project 40714/01); Kuopio University Hospital, Kuopio,
Finland (EVO, projects 5103 and 5173); Academy of Finland, Helsinki, Finland (projects205886 and 47471); The Graduate School for Musculoskeletal Diseases, Finland andEuropean Union (BMH4-CT97 to 2437); The Finnish Cultural Foundation of NorthernSavo, Kuopio, Finland; The Finnish Cultural Foundation, Helsinki, Finland; FinnishAcademy of Science and Letters, Helsinki, Finland; Foundation for Advanced Technologyof Eastern Finland, Kuopio, Finland; and The Foundation of Aleksanteri Mikkonen,Kuopio, Finland.
I wish to thank the numerous friends for sharing and support at all stages of theproject. Especially, I want to thank Petteri Hirvonen, Jukka Hynynen and Teemu Ruo-honen for helping to refresh my thoughts by replacing numbers by melodies.
There are measures that are incalculable. The support and love of my dear parents,Marja-Leena and Risto Nieminen, have been invaluable throughout my life and make meeternally grateful to them. Their belief in me and encouragement have been indispens-able and essential during this project, but most importantly, during the difficult times.I wish to express my warmest hug to my lovable and loving sister, Anni Nieminen, forbeing the sparkling delight and for always being there for me. I wish to thank my dearbrother, Miika Nieminen, and his family, for their joyous smiles, tickle-laughs and love,and Miika for "leading the way" into cartilage research. I owe my deepest gratitude toGod for showing me what is important in life, for giving me the strength and for creatingsuch a phenomenal tissue, articular cartilage, which has kept me busy during the pastyears.
Kuopio, 22th April 2007
Heikki Nieminen
LIST OF ABBREVIATIONS AND NOTATIONS
D deep region of cartilageePLM enhanced polarized light microscopyGAG glycosaminoglycanFE finite elementFFT fast Fourier transformFC femoral condyleFG femoral grooveFLC femoral lateral condyleFMC femoral medial condyleFTIRI Fourier transform infrared imagingLM light microscopyLPG lateral patellar grooveM middle region of cartilageOA osteoarthrosisPA parallel to articular surfacePAT lateral upper quadrant of patellaPBS phosphate-buffered salinePE perpendicular to articular surfacePG proteoglycanPGF patellar groove of femurPLM polarized light microscopyPP proximal phalanxPSF patellar surface of femurRad. radial region of cartilageRF radio-frequencyS superficial region of cartilageTang. tangential region of cartilageTLP tibial lateral plateauTMP tibial medial plateauTP tibial plateauTrans. transitional region of cartilage
a indenter diameterA amplitudeAIB apparent integrated backscatterA(f) amplitude spectrumBUA broadband ultrasound attenuationc ultrasound speedcISCM ultrasound speed determined using in situ calibration methodcp specific heat at constant pressurecv specific heat at constant volumeCH2O water content
CQI cartilage quality indexd diameterdi distance from the transducer to saline-cartilage interface at location ie void ratio, i.e. fluid volume to solid volume ratioE elastic modulus, i.e. Young’s modulusEdyn elastic modulus under dynamic compression, i.e. dynamic modulusEeq elastic modulus at mechanical equilibriumf frequencyfp peak frequencyG(f) power spectrumIRC integrated reflection coefficientj imaginary unitk wave numberKa adiabatic bulk modulusKi isothermal bulk modulush sample thicknessn number of samplesnBUA normalized broadband ultrasound attenuationp statistical significanceP loadr Pearson correlation coefficientrS Spearman’s correlation coefficientrxy cross-correlation coefficientR reflection coefficientRsm reflection coefficient at the sample-metallic plate interfaceRst reflection coefficient at the sample-transducer interfaceSD standard deviationSMankin Mankin scoreSEdyn sub-score corresponding to Edyn
SEeq sub-score corresponding to Eeq
SEM standard error of meanSH2O sub-score corresponding to CH2O
Shist sub-score corresponding to SMankin
t timeT transmission coefficientTOF time-of-flightu particle displacement amplitudeURI ultrasound roughness indexx distanceZ acoustical impedanceα attenuation coefficientαamp amplitude attenuation coefficientαabs absorption coefficientαint integrated attenuation coefficientαsc scattering coefficient
β mean collagen orientationδc measurement error in ultrasound speedδE error in mechano-acoustically determined elastic modulusδh measurement error in sample thicknessδε error in mechano-acoustically determined strainδTOF measurement error in time-of-flightΔc change in ultrasound speedΔf frequency rangeΔh absolute deformationΔT window lengthε strainεmeas mechano-acoustically measured strainεtrue true strainκ scale factorν Poisson’s ratioθ angle of propagation respective to surface normalρ densityω angular frequency

LIST OF ORIGINAL PUBLICATIONS
This thesis is based on the following original articles referred to by their Roman numerals:
I Nieminen H.J., Töyräs J., Rieppo J., Nieminen M.T., Hirvonen J., Korhonen R.and Jurvelin J.S., Real-time ultrasound analysis of articular cartilage degradationin vitro, Ultrasound in Medicine and Biology 28(4):519-525 (2002)
II Nieminen H.J., Saarakkala S., Laasanen M.S., Hirvonen J., Jurvelin J.S. and TöyräsJ., Ultrasound attenuation in normal and spontaneously degenerated articular car-tilage, Ultrasound in Medicine and Biology 30(4):493-500 (2004)
III Nieminen H.J., Töyräs J., Laasanen M.S. and Jurvelin J.S., Acoustic properties ofarticular cartilage under mechanical stress, Biorheology 43(3-4):523-535 (2006)
IV Nieminen H.J., Julkunen P., Töyräs J. and Jurvelin J.S., Ultrasound speed in artic-ular cartilage under mechanical compression, Ultrasound in Medicine and Biology,in press, 2007
The original articles have been reproduced with permission of the copyright holders.The thesis contains also previously unpublished data.

Contents
1 Introduction 17
2 Articular cartilage 192.1 Structure and composition . . . . . . . . . . . . . . . . . . . . . . . . . . . . . 192.2 Mechanical properties . . . . . . . . . . . . . . . . . . . . . . . . . . . . . . . . 202.3 Osteoarthrosis . . . . . . . . . . . . . . . . . . . . . . . . . . . . . . . . . . . . 21
3 Acoustic properties of articular cartilage 233.1 Ultrasound basics . . . . . . . . . . . . . . . . . . . . . . . . . . . . . . . . . . 233.2 Acoustic properties of cartilage . . . . . . . . . . . . . . . . . . . . . . . . . . . 233.3 Ultrasound and mechano-acoustic measurement techniques . . . . . . . . . . . 27
4 Aims of the present study 31
5 Materials and methods 335.1 Sample preparation . . . . . . . . . . . . . . . . . . . . . . . . . . . . . . . . . 335.2 Acoustic measurements . . . . . . . . . . . . . . . . . . . . . . . . . . . . . . . 345.3 Reference methods . . . . . . . . . . . . . . . . . . . . . . . . . . . . . . . . . 37
5.3.1 Mechanical testing . . . . . . . . . . . . . . . . . . . . . . . . . . . . . 375.3.2 Histological and biochemical analyses . . . . . . . . . . . . . . . . . . 38
5.4 Ultrasound analyses . . . . . . . . . . . . . . . . . . . . . . . . . . . . . . . . . 405.5 Model for ultrasound speed in cartilage during compression . . . . . . . . . . . 435.6 Error analyses . . . . . . . . . . . . . . . . . . . . . . . . . . . . . . . . . . . . 455.7 Statistical analyses . . . . . . . . . . . . . . . . . . . . . . . . . . . . . . . . . 46
6 Results 476.1 Effects of composition and structure on ultrasound properties of articular cartilage 476.2 Effects of mechanical loading on ultrasound properties of articular cartilage . . 48
7 Discussion 577.1 Effects of composition and structure on ultrasound properties of articular cartilage 577.2 Effects of mechanical loading on ultrasound properties of articular cartilage . . 59
15

16
8 Summary and conclusions 65
References 67
Appendix: Original publications
Chapter IIntroduction
Articular cartilage is connective tissue that provides low friction surfaces where bonescome into contact and during locomotion and standing it distributes the loads appliedto the joint, minimizing the stresses on the subchondral bone [102]. Cartilage exhibitsa nonhomogeneous structure and composition [26, 102]. The mechanical anisotropy andfibril reinforced poroviscoelasticity of cartilage provides high adaptivity to varying me-chanical stresses and integrity of the tissue essential for full functionality [51]. Cartilagedegeneration, osteoarthrosis (OA), is a common musculoskeletal disease with significantsocioeconomic consequences [154]. The progressive failure of cartilage leads to denuda-tion of cartilage from bone, which causes pain to the patient and, due to cartilage’slimited healing capacity, the outcome is often permanent disability of the diseased joint[25, 27, 40, 75]. This leads to total joint replacement, but these replacements unfor-tunately have a restricted lifespan [51]. Initial phase of OA is asymptomatic and theearliest signs, which are also regarded as the ”point of no return”, are softening andfibrillation of the superficial tissue [11, 25, 27, 45]. The diagnosis of the disease at anearlier stage could be beneficial since it might be possible to slow down the degenerationprocess [25]. However, current clinical techniques are insensitive and have a rather lim-ited capability to differentiate healthy cartilage from tissue with early or progressed OA.Even though traditional X-ray OA diagnostics is noninvasive, it is insensitive at detect-ing changes in cartilage and, thus, it has been exploited in detecting the joint narrowingtypical of advanced progression of OA [25]. Magnetic resonance imaging (MRI), also anoninvasive technique, provides tools for detection of lesions, composition and wear ofcartilage [38, 47], but is costly and clinical techniques lack the high resolution needed toreveal microstructural changes. Minimally invasive methods to diagnose OA have alsobeen developed. Arthroscopy is a qualitative and subjective technique enabling onlydetection of the visual signs of advanced degeneration. Optical coherence tomography(OCT) provides a method to reveal the microstructure of cartilage, but due to its limitedpenetration it is restricted to the superficial tissue [54]. Electromechanical spectroscopyhas been proposed to reveal electrokinetic streaming potentials [16, 44, 129]. However,further developments will still be required to relate the relationships between mechanicalstress and streaming potentials with early degeneration of cartilage [51]. Mechanicalindentation techniques have been used for the determination of mechanical properties
17
18
of cartilage [36, 94, 105]. However, these techniques require thickness information ofcartilage, which is not readily available, if one wishes to accurately calculate mechanicalproperties and therefore the method is prone to gross inaccuracies. Ultrasound imag-ing and quantitative ultrasound analyses of cartilage have been proposed to potentiallyreveal OA-like changes within the tissue [104, 130, 145]. However, there are still noclinical applications for ultrasonic cartilage imaging. Ultrasound has been proposed asrepresenting a useful technique for measuring cartilage thickness [1, 63, 98, 103, 125].Therefore, if it was possible to combine thickness information with mechanical inden-tation, then the mechanical properties of cartilage could be more accurately measured.Unfortunately, it has been claimed that the ultrasound speed in articular cartilage mayvary under mechanical compression [160] and, this may introduce measurement errorsin mechano-acoustically measured parameters. However, the true effect of compression-related changes in ultrasound speed on mechano-acoustically measured mechanical prop-erties of articular cartilage has never been quantified.
This thesis aimed at clarifying the relations between the acoustic properties of ar-ticular cartilage and cartilage structure and composition. The ultrasound properties ofcartilage were investigated in normal and spontaneously or enzymatically degeneratedcartilage. Particular attention was paid to how mechanical stress and deformation canaffect the ultrasound properties, and mechano-acoustically measured mechanical proper-ties, of cartilage. Thus, this study aimed to establish a model to relate the compositionand structure of cartilage under compression with variations in ultrasound speed.
Chapter IIArticular cartilage
2.1 Structure and composition
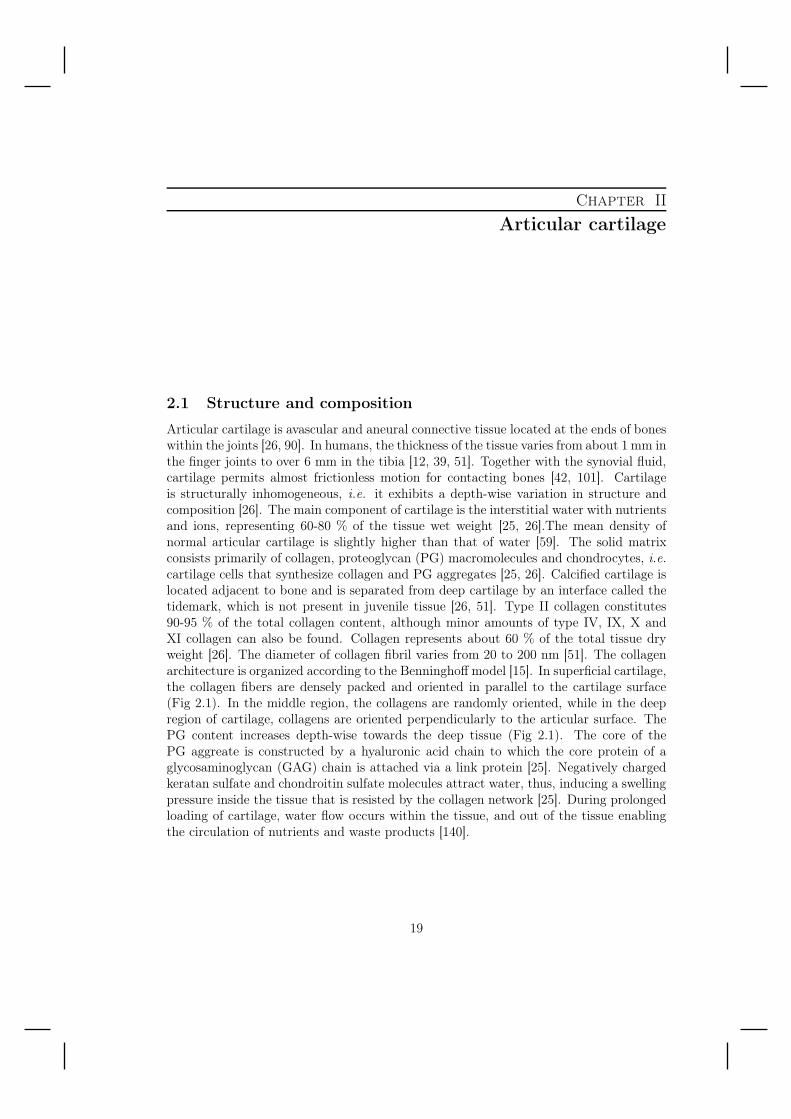
Articular cartilage is avascular and aneural connective tissue located at the ends of boneswithin the joints [26, 90]. In humans, the thickness of the tissue varies from about 1 mm inthe finger joints to over 6 mm in the tibia [12, 39, 51]. Together with the synovial fluid,cartilage permits almost frictionless motion for contacting bones [42, 101]. Cartilageis structurally inhomogeneous, i.e. it exhibits a depth-wise variation in structure andcomposition [26]. The main component of cartilage is the interstitial water with nutrientsand ions, representing 60-80 % of the tissue wet weight [25, 26].The mean density ofnormal articular cartilage is slightly higher than that of water [59]. The solid matrixconsists primarily of collagen, proteoglycan (PG) macromolecules and chondrocytes, i.e.cartilage cells that synthesize collagen and PG aggregates [25, 26]. Calcified cartilage islocated adjacent to bone and is separated from deep cartilage by an interface called thetidemark, which is not present in juvenile tissue [26, 51]. Type II collagen constitutes90-95 % of the total collagen content, although minor amounts of type IV, IX, X andXI collagen can also be found. Collagen represents about 60 % of the total tissue dryweight [26]. The diameter of collagen fibril varies from 20 to 200 nm [51]. The collagenarchitecture is organized according to the Benninghoff model [15]. In superficial cartilage,the collagen fibers are densely packed and oriented in parallel to the cartilage surface(Fig 2.1). In the middle region, the collagens are randomly oriented, while in the deepregion of cartilage, collagens are oriented perpendicularly to the articular surface. ThePG content increases depth-wise towards the deep tissue (Fig 2.1). The core of thePG aggreate is constructed by a hyaluronic acid chain to which the core protein of aglycosaminoglycan (GAG) chain is attached via a link protein [25]. Negatively chargedkeratan sulfate and chondroitin sulfate molecules attract water, thus, inducing a swellingpressure inside the tissue that is resisted by the collagen network [25]. During prolongedloading of cartilage, water flow occurs within the tissue, and out of the tissue enablingthe circulation of nutrients and waste products [140].
19
20 2.2. Mechanical properties
����������� ��
�������� ��
������ ��
�������������
������ �������������
����������������
������������
�������� �������
�������������
���� �����
Figure 2.1: Schematic representation of cartilage structure (left). The typical histological im-age obtained from enhanced polarized light microscopy (ePLM) reveals that collagen is orientedalong the surface at the superficial cartilage, whereas in deep layer it is oriented perpendicularto the cartilage surface. Fourier transform infrared imaging (FTIRI) reveals that PG contenttypically increases from the superficial cartilage towards deep tissue. As a complement of thesolid matrix, water content decreases from the superficial to deep cartilage. White and blacktriangles indicate the cartilage surface and cartilage-bone interface, respectively.
2.2 Mechanical properties
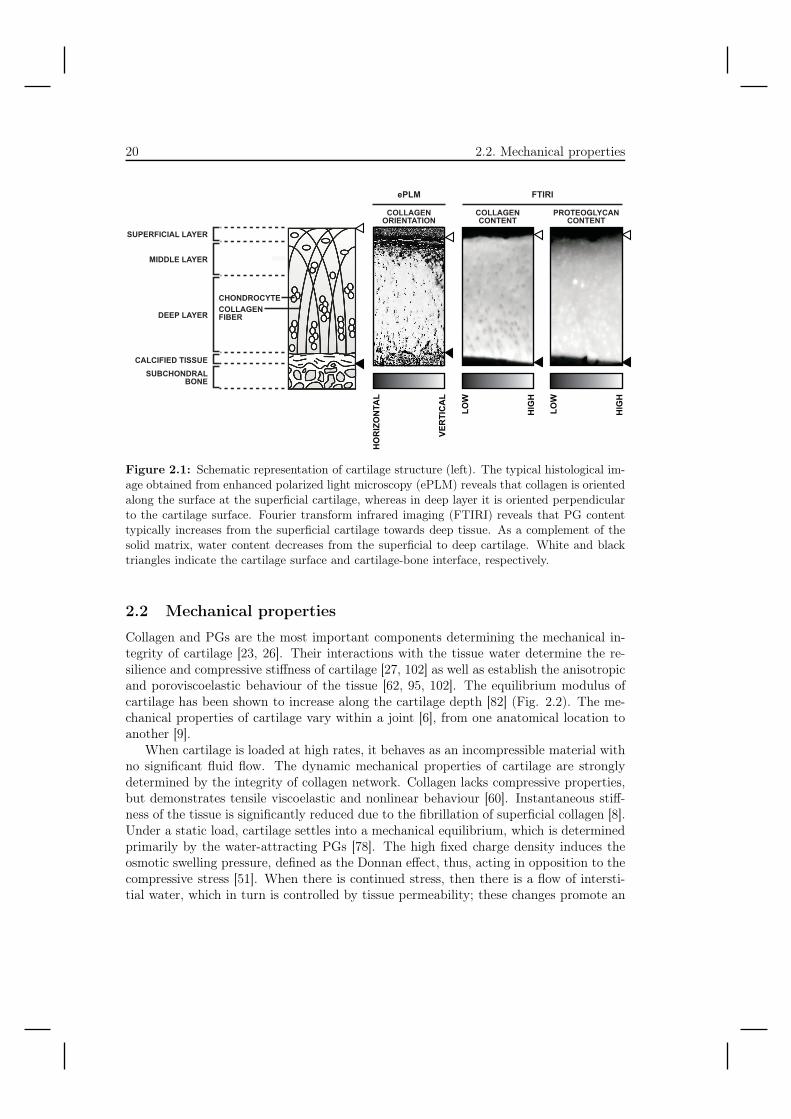
Collagen and PGs are the most important components determining the mechanical in-tegrity of cartilage [23, 26]. Their interactions with the tissue water determine the re-silience and compressive stiffness of cartilage [27, 102] as well as establish the anisotropicand poroviscoelastic behaviour of the tissue [62, 95, 102]. The equilibrium modulus ofcartilage has been shown to increase along the cartilage depth [82] (Fig. 2.2). The me-chanical properties of cartilage vary within a joint [6], from one anatomical location toanother [9].
When cartilage is loaded at high rates, it behaves as an incompressible material withno significant fluid flow. The dynamic mechanical properties of cartilage are stronglydetermined by the integrity of collagen network. Collagen lacks compressive properties,but demonstrates tensile viscoelastic and nonlinear behaviour [60]. Instantaneous stiff-ness of the tissue is significantly reduced due to the fibrillation of superficial collagen [8].Under a static load, cartilage settles into a mechanical equilibrium, which is determinedprimarily by the water-attracting PGs [78]. The high fixed charge density induces theosmotic swelling pressure, defined as the Donnan effect, thus, acting in opposition to thecompressive stress [51]. When there is continued stress, then there is a flow of intersti-tial water, which in turn is controlled by tissue permeability; these changes promote an
2. Articular cartilage 21
intrinsic rearrangement of cartilage matrix [21, 66, 67]. Removal of the very superficiallayer of the tissue has been shown to increase water flow and speed up the relaxationprocess significantly under mechanical loading [140].
The mechanics of cartilage may be described analytically in simplified cases, whereascomplex problems require numerical modelling. An analytical elastic single phasic modelwas first introduced by Hayes et al. for indentation of cartilage [53]. Subsequently, sin-gle phasic viscoelastic models were used to describe the viscoelastic nature of cartilageby describing cartilage as a combination of linear springs and dashpots [112]. Biphasicmodels realistically take into account the poroelasticity of the solid matrix, i.e. col-lagen network and PGs and the fluid flow that occurs during prolonged compression[51]. In addition, transversally isotropic biphasic models [34, 152] assume cartilage tobe isotropic in the depth-wise planes in parallel to the articular surface. In addition tothe biphasic model, the triphasic model [86] considers also the transport of ions throughthe matrix. Fibril-reinforced poroviscoelastic biphasic models take also into account thecollagen architecture. In addition, the newest models consider realistically the collagenmicrostructure as well as the distributions of fluid, collagen and PGs [60, 149]. Finiteelement applications of these complex models have been developed to characterize im-measurable properties of articular cartilage.
���������������� �������!"# �
���������� ������������������������� ���������������������
� �
� �
� �
� �
� �
� �
� �
� �
� �
� �
� �
� �
��$# �����%��&'(��!)"$�*�'+(���,-
�
��
���
���
��
����
&��
"-
��
���
���
�!"#
�
Figure 2.2: Characteristic values of Young’s modulus and Poisson’s ratio in bovine articularcartilage at different tissue depths. The data has been reproduced from the study by Laasanenet al. [82]. While the explanation for the depth-dependence of cartilage Poisson’s ratio remainsunresolved, it has been proposed that it is related to collagen content, orientation and cross-linking [74, 82].
2.3 Osteoarthrosis
Osteoarthrosis (OA) is a severe musculoskeletal disorder that causes pain and functionaldisability in patients. Consequently, it has a significant socio-economic impact [124,131, 154]. Due to the silent nature of OA during its initial stage, the diagnosis of earlyOA is difficult [25, 32]. The first signs, which are regarded as the ”point of no return”,
22 2.3. Osteoarthrosis
are softening of the tissue due to the fibrillation of collagen network and loss of PGs[11, 27, 45]. These initial signs may be accompanied by small superficial fissures [25].In advanced OA, the fissures penetrate through cartilage to the subchondral bone andthe mechanical integrity of the tissue is impaired due to the disruption of the collagennetwork. Collagen damage allows swelling of the tissue and loss of PGs [25, 97]. DuringOA progression, cartilage wear and tear and release of the cartilage fragments to thejoint space lead to thinning of the tissue and, consequently, to joint space narrowing.This is followed by increased contact of the bone ends evoking pain. In conjunction withthis, the consequent increased deformation of the bone ends leads to dysfunction andimmobility of the joint [27, 131]. Adult cartilage possesses poor ability to undergo self-repair, e.g. the turnover time of collagen exceeds the human lifespan, although limitedrepair may occur at lesions penetrating subchondral bone [131]. OA changes have alsobeen shown to associate with stiffening and thickening of subchondral bone as well aswith the formation of osteophytes [25, 27, 56, 118]. In advanced OA, cell death may alsooccur [19, 25]. If cartilage is damaged, the collagen network may not recover, althoughPG regeneration may occur [40, 75].
Chapter IIIAcoustic properties of articular cartilage
3.1 Ultrasound basics
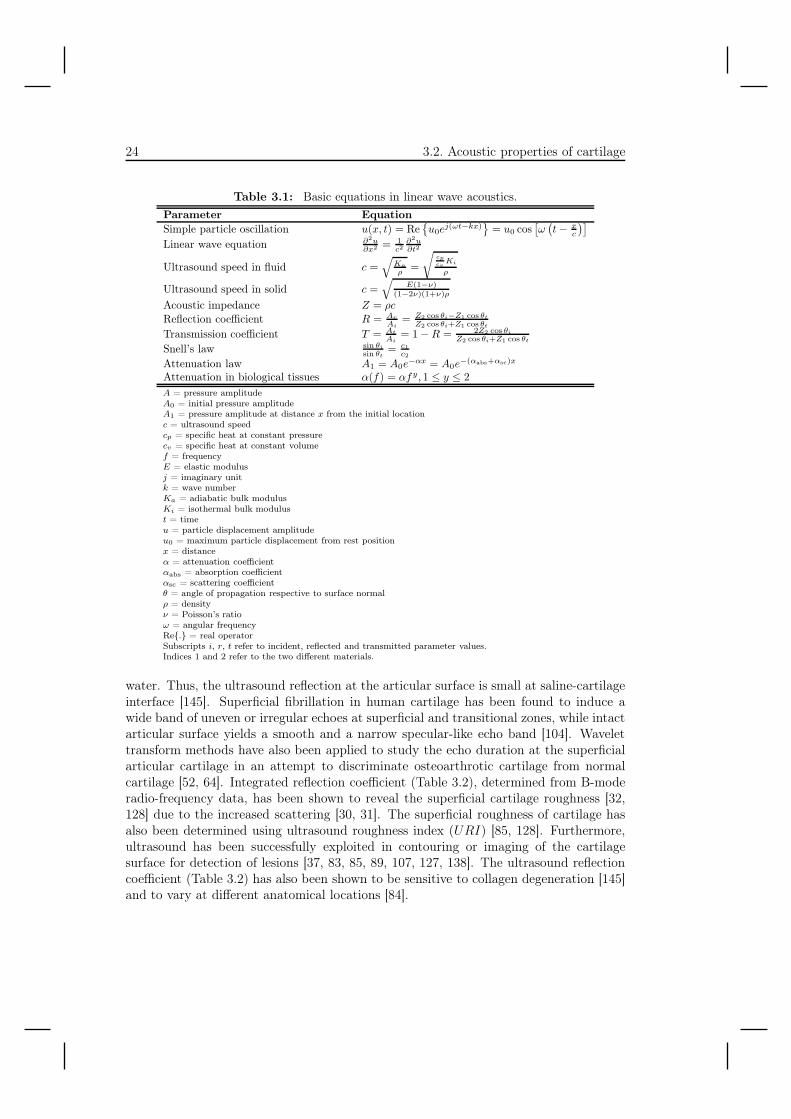
Ultrasound is a propagating acoustic vibration with a frequency > 20 kHz. Acousticwaves vibrate and travel longitudinally in gases, liquids and solids. In solids, there areseveral different types of waves, e.g. shear, Rayleigh and Lamb waves, which may alsocontribute to the wave propagation. Ideally, the simple particle oscillation in longitudinalacoustic vibration may be described with a sinusoidal waveform (Table 3.1, [137]) thatsatisfies the linear wave equation (Table 3.1, [70, 123, 137]). The wave propagationspeed in a homogeneous isotropic material is characterized by its density and mechanicalproperties (Table 3.1). In conjunction with material density, ultrasound speed definesthe acoustic impedance of the material (Table 3.1).
Within an inhomogeneous material ultrasound is subjected to reflections at acousticinterfaces of two materials with different acoustic impedances. If the discontinuities areof the size or smaller than the wavelength of the acoustic wave, the wave is significantlyscattered. At a specular reflection, part of the ultrasound energy is reflected accordingto the reflection coefficient of the acoustic interface (Table 3.1). The transmitted portionof the wave (Table 3.1) is then subjected to refraction according to Snell’s law (Table3.1). Attenuation of ultrasound is not induced only by scattering, but also absorption ofenergy [146]. In biological tissues, ultrasound energy is typically absorbed via relaxationprocesses, relative motion, bubble mechanisms or acoustic hysteresis [146, 148]. Attenu-ation follows the exponential law and the sum of absorption and scattering coefficientsgive the attenuation coefficient, which in biological materials is highly dependent on thefrequency, being either linear or nonlinear depending on the tissue [110, 147] (Table 3.1).
3.2 Acoustic properties of cartilage
Several studies have suggested that the ultrasonic properties of articular cartilage arerelated to the structural and mechanical properties of the tissue [2, 4, 32, 69, 89, 130, 134,144, 145, 155]. Ultrasound reflection and scattering have been shown to be sensitive tomorphology and the composition of the superficial layer of articular cartilage [3, 32, 33,115, 128, 145]. The density and ultrasound speed of articular cartilage are slightly higherthan those of water [59, 104] exhibiting an acoustic impedance relatively close to that of
23
24 3.2. Acoustic properties of cartilage
Table 3.1: Basic equations in linear wave acoustics.Parameter EquationSimple particle oscillation u(x, t) = Re
{u0e
j(ωt−kx)}
= u0 cos[ω
(t − x
c
)]Linear wave equation ∂2u
∂x2 = 1c2
∂2u∂t2
Ultrasound speed in fluid c =√
Ka
ρ =
√cpcv
Ki
ρ
Ultrasound speed in solid c =√
E(1−ν)(1−2ν)(1+ν)ρ
Acoustic impedance Z = ρc
Reflection coefficient R = Ar
Ai= Z2 cos θi−Z1 cos θt
Z2 cos θi+Z1 cos θt
Transmission coefficient T = At
Ai= 1 − R = 2Z2 cos θi
Z2 cos θi+Z1 cos θt
Snell’s law sin θi
sin θt= c1
c2
Attenuation law A1 = A0e−αx = A0e
−(αabs+αsc)x
Attenuation in biological tissues α(f) = αfy, 1 ≤ y ≤ 2A = pressure amplitudeA0 = initial pressure amplitudeA1 = pressure amplitude at distance x from the initial locationc = ultrasound speedcp = specific heat at constant pressurecv = specific heat at constant volumef = frequencyE = elastic modulusj = imaginary unitk = wave numberKa = adiabatic bulk modulusKi = isothermal bulk modulust = timeu = particle displacement amplitudeu0 = maximum particle displacement from rest positionx = distanceα = attenuation coefficientαabs = absorption coefficientαsc = scattering coefficientθ = angle of propagation respective to surface normalρ = densityν = Poisson’s ratioω = angular frequencyRe{.} = real operatorSubscripts i, r, t refer to incident, reflected and transmitted parameter values.Indices 1 and 2 refer to the two different materials.
water. Thus, the ultrasound reflection at the articular surface is small at saline-cartilageinterface [145]. Superficial fibrillation in human cartilage has been found to induce awide band of uneven or irregular echoes at superficial and transitional zones, while intactarticular surface yields a smooth and a narrow specular-like echo band [104]. Wavelettransform methods have also been applied to study the echo duration at the superficialarticular cartilage in an attempt to discriminate osteoarthrotic cartilage from normalcartilage [52, 64]. Integrated reflection coefficient (Table 3.2), determined from B-moderadio-frequency data, has been shown to reveal the superficial cartilage roughness [32,128] due to the increased scattering [30, 31]. The superficial roughness of cartilage hasalso been determined using ultrasound roughness index (URI) [85, 128]. Furthermore,ultrasound has been successfully exploited in contouring or imaging of the cartilagesurface for detection of lesions [37, 83, 85, 89, 107, 127, 138]. The ultrasound reflectioncoefficient (Table 3.2) has also been shown to be sensitive to collagen degeneration [145]and to vary at different anatomical locations [84].
3. Acoustic properties of articular cartilage 25
Table 3.2: Common ultrasound parameters used to study articular cartilage.Parameter EquationAmplitude attenuation† [145] αamp = 1
2h loge
[R2A1R1A2
(1 − R2
1
)]Frequency dependent attenuation [134] α(f) = 1
4h logeG0(f)G1(f)
Integrated attenuation [134] αint = 1Δf
∫Δf α(f)df
Amplitude reflection coefficient‡ [145] R = A1A0
Frequency dependent reflection coefficient‡ [32] R(f) = A1(f,z)A0(f,z)
Integrated reflection coefficient‡ [32, 33] IRC = 1Δf
∫Δf 10 log10
⟨|A1(f,z)|2|A0(f,z)|2
⟩df
Apparent integrated backscatter‡ [32, 33] AIB = 1Δf
∫Δf
10 log10
⟨|Ab(f,z)|2|A0(f,z)|2
⟩df
Broadband ultrasound attenuation [87, 114, 141] BUA = ddf
(10 log10
A0(f)A1(f)
)Normalized broadband ultrasound attenuation [114] nBUA = BUA
h
Ultrasound speed, direct [145] c = 2hTOF
Ultrasound speed, substitution method [113, 114] c = cs
(1 + TOF1−TOF2
TOF4−TOF3
)Ultrasound speed, in situ calibration method [111, 139] cISCM = 2Δh
ΔTOF
Ultrasound roughness index [128] URI =√
1m
∑mi=1 (di − 〈d〉)2
†Indices 1 and 2 refer to values obtained at saline-cartilage and cartilage-bone interfaces, respectively.‡Indices 0 and 1 refer to values obtained from perfect reflector and sample, respectively.A = peak-to-peak pressure amplitudeA(f, z) = amplitude spectrum of the pulse reflected at distance z from transducerAb(f, z) = amplitude spectrum of the pulse backscattered at distance z from transducercs = ultrasound speed in salinedi = distance from the transducer to saline-cartilage interface at location if = frequencyG0(f) = power spectrum of the pulse reflected at distance z from transducer without sampleG1(f) = power spectrum of the pulse reflected at distance z from transducer with sampleh = cartilage thicknessR = amplitude reflection coefficientTOF = time-of-flightTOF1 = time-of-flight of the pulse reflected from metal plate without the sampleTOF2 = time-of-flight of the pulse reflected from metal plate with the sampleTOF3 = time-of-flight of the pulse reflected from saline-cartilage interfaceTOF4 = time-of-flight of the pulse reflected from cartilage-saline interfaceΔf = frequency range corresponding to -6 dB levelΔh = absolute deformationΔTOF = change in TOF during deformation Δh〈.〉 = spatial average
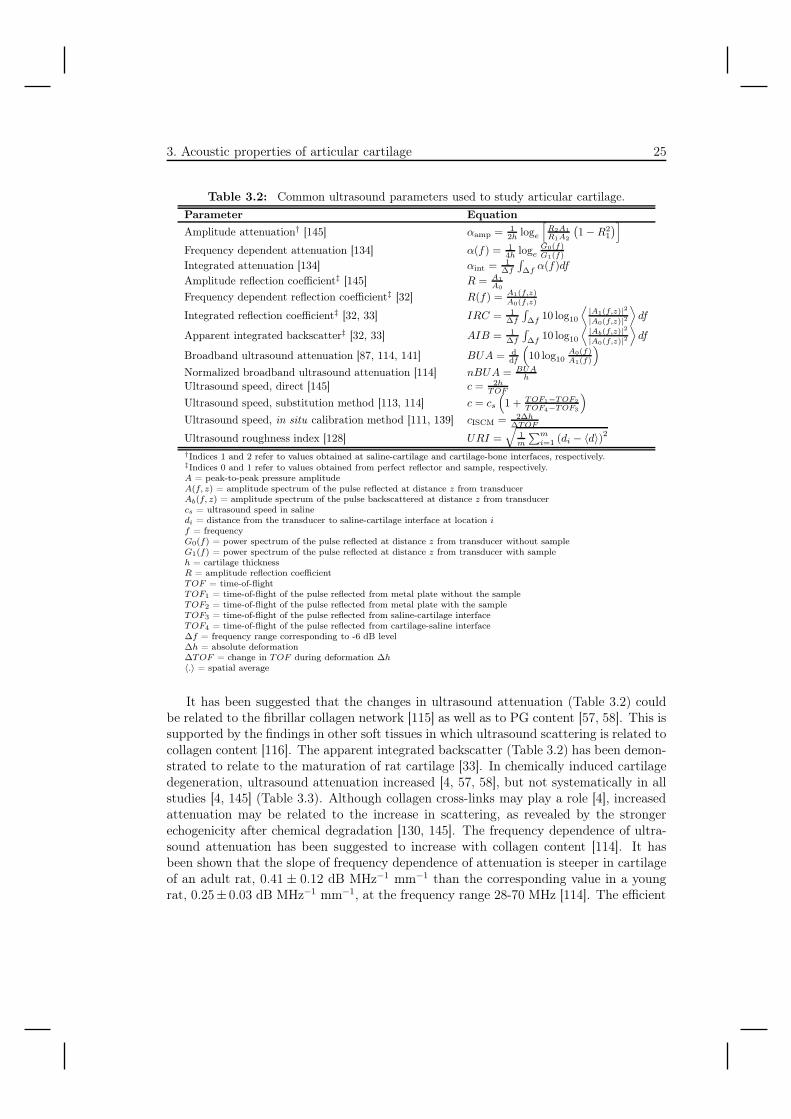
It has been suggested that the changes in ultrasound attenuation (Table 3.2) couldbe related to the fibrillar collagen network [115] as well as to PG content [57, 58]. This issupported by the findings in other soft tissues in which ultrasound scattering is related tocollagen content [116]. The apparent integrated backscatter (Table 3.2) has been demon-strated to relate to the maturation of rat cartilage [33]. In chemically induced cartilagedegeneration, ultrasound attenuation increased [4, 57, 58], but not systematically in allstudies [4, 145] (Table 3.3). Although collagen cross-links may play a role [4], increasedattenuation may be related to the increase in scattering, as revealed by the strongerechogenicity after chemical degradation [130, 145]. The frequency dependence of ultra-sound attenuation has been suggested to increase with collagen content [114]. It hasbeen shown that the slope of frequency dependence of attenuation is steeper in cartilageof an adult rat, 0.41 ± 0.12 dB MHz−1 mm−1 than the corresponding value in a youngrat, 0.25± 0.03 dB MHz−1 mm−1, at the frequency range 28-70 MHz [114]. The efficient
26 3.2. Acoustic properties of cartilage
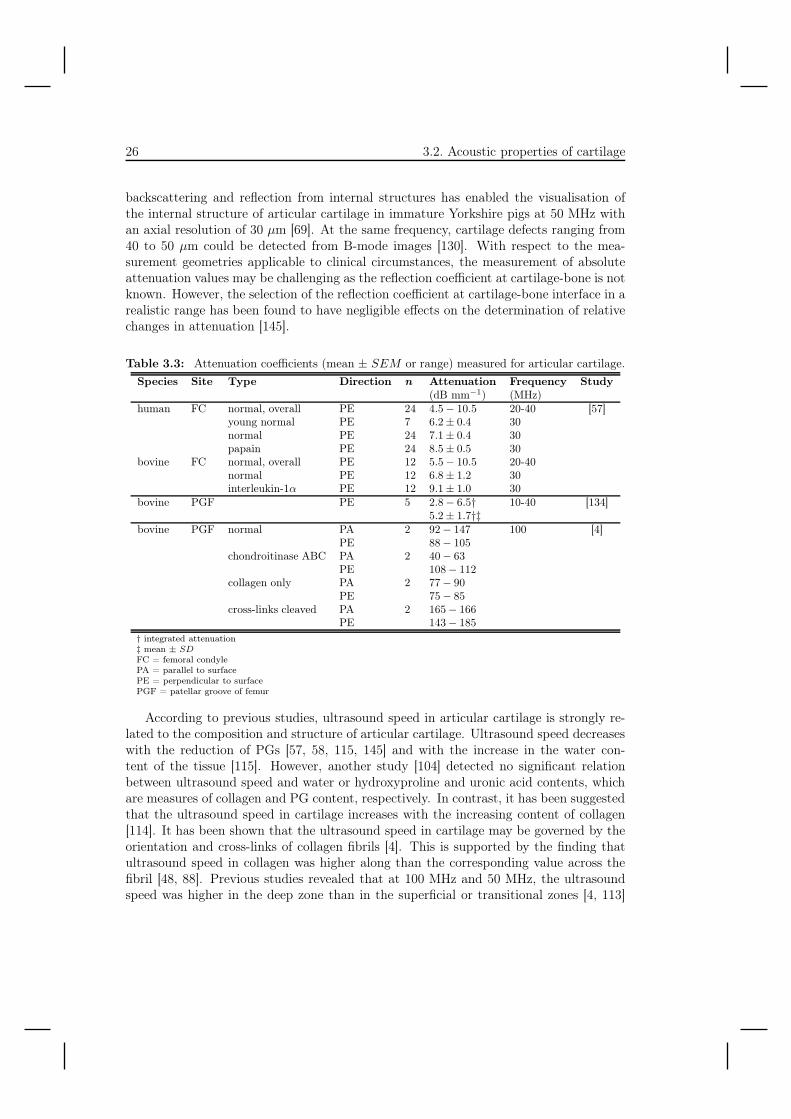
backscattering and reflection from internal structures has enabled the visualisation ofthe internal structure of articular cartilage in immature Yorkshire pigs at 50 MHz withan axial resolution of 30 μm [69]. At the same frequency, cartilage defects ranging from40 to 50 μm could be detected from B-mode images [130]. With respect to the mea-surement geometries applicable to clinical circumstances, the measurement of absoluteattenuation values may be challenging as the reflection coefficient at cartilage-bone is notknown. However, the selection of the reflection coefficient at cartilage-bone interface in arealistic range has been found to have negligible effects on the determination of relativechanges in attenuation [145].
Table 3.3: Attenuation coefficients (mean ± SEM or range) measured for articular cartilage.Species Site Type Direction n Attenuation Frequency Study
(dB mm−1) (MHz)human FC normal, overall PE 24 4.5 − 10.5 20-40 [57]
young normal PE 7 6.2 ± 0.4 30normal PE 24 7.1 ± 0.4 30papain PE 24 8.5 ± 0.5 30
bovine FC normal, overall PE 12 5.5 − 10.5 20-40normal PE 12 6.8 ± 1.2 30interleukin-1α PE 12 9.1 ± 1.0 30
bovine PGF PE 5 2.8 − 6.5† 10-40 [134]5.2 ± 1.7†‡
bovine PGF normal PA 2 92 − 147 100 [4]PE 88 − 105
chondroitinase ABC PA 2 40 − 63PE 108 − 112
collagen only PA 2 77 − 90PE 75 − 85
cross-links cleaved PA 2 165 − 166PE 143 − 185
† integrated attenuation‡ mean ± SDFC = femoral condylePA = parallel to surfacePE = perpendicular to surfacePGF = patellar groove of femur
According to previous studies, ultrasound speed in articular cartilage is strongly re-lated to the composition and structure of articular cartilage. Ultrasound speed decreaseswith the reduction of PGs [57, 58, 115, 145] and with the increase in the water con-tent of the tissue [115]. However, another study [104] detected no significant relationbetween ultrasound speed and water or hydroxyproline and uronic acid contents, whichare measures of collagen and PG content, respectively. In contrast, it has been suggestedthat the ultrasound speed in cartilage increases with the increasing content of collagen[114]. It has been shown that the ultrasound speed in cartilage may be governed by theorientation and cross-links of collagen fibrils [4]. This is supported by the finding thatultrasound speed in collagen was higher along than the corresponding value across thefibril [48, 88]. Previous studies revealed that at 100 MHz and 50 MHz, the ultrasoundspeed was higher in the deep zone than in the superficial or transitional zones [4, 113]
3. Acoustic properties of articular cartilage 27
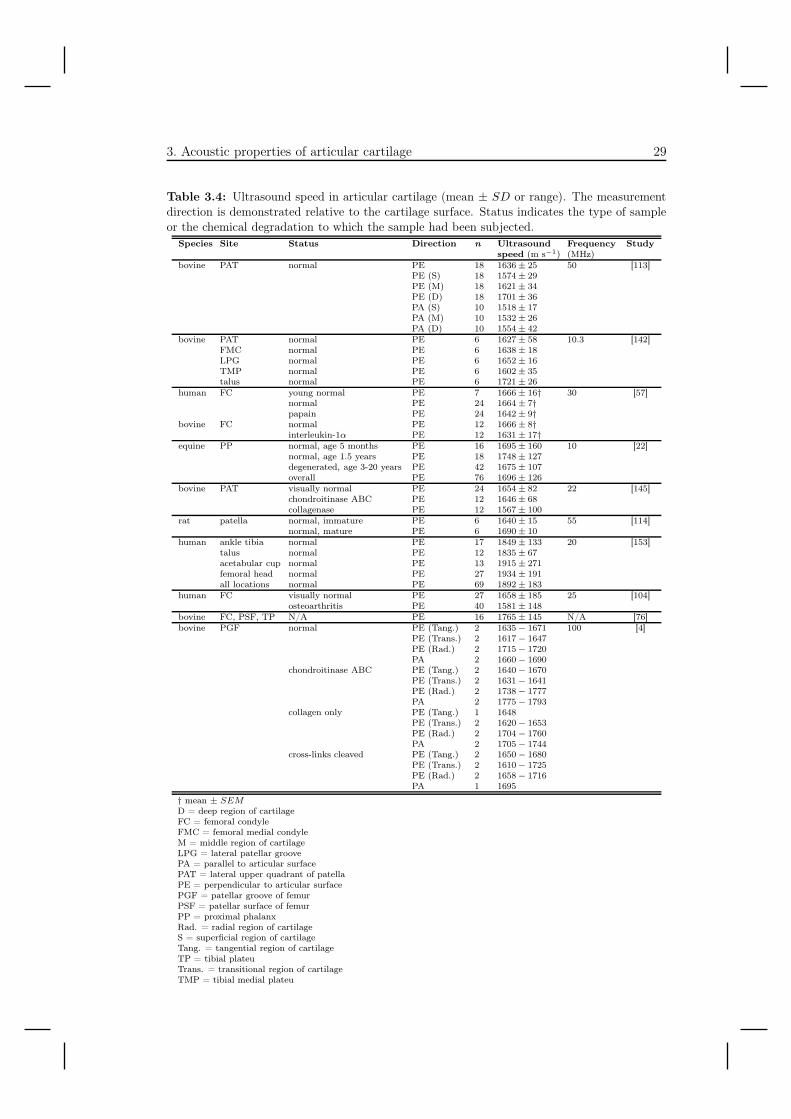
of bovine cartilage. The ultrasound speed was also significantly higher at all cartilagedepths when the ultrasound beam was aligned perpendicular to the articular surface[113]. Pellaumail et al. demonstrated a diverse depth-dependence in ultrasound speedfor immature rat cartilage, although no significant depth-dependence was revealed formature cartilage [114]. However, the overall ultrasound speed through the full thicknessrat cartilage was higher, 1690 ± 10 m s−1 for mature compared to 1640 ± 15 m s−1 inthe immature rat cartilage (Table 3.4). Previous studies have suggested that ultrasoundspeed in cartilage varies from one anatomical location to another (Table 3.4).
Ophir and Yadzi [111] introduced a method to determine ultrasound speed in a ma-terial under mechanical compression, using the assumption that the ultrasound speedin the material is constant during compression. This method was later used by Suh etal. [139] to measure ultrasound speed in articular cartilage with the in situ calibrationmethod. However, Zheng et al. [158, 160] have suggested that the ultrasound speed incartilage changes during mechanical compression. This finding may, therefore, introduceerrors into the determination of ultrasound speed when the in situ calibration methodis exploited. However, the magnitude of possible errors in ultrasound speed, i.e. thosedetermined using the in situ calibration method, has not been investigated.
3.3 Ultrasound and mechano-acoustic measurement techniques
The mechanical integrity of cartilage decreases significantly with the progress of osteo-arthrosis [27, 46]. Several mechanical indentation techniques have been developed todetect the tissue stiffness [7, 13, 14, 36, 55, 68, 79, 94, 100, 105, 135]. These methods mayprovide powerful quantitative techniques for early diagnostics of cartilage degeneration.Indentation techniques often are based on the theory of indentation of single phase elasticmaterials [53]. The indentation techniques require information on the thickness of thetissue, and if this parameter is unknown, this can lead to measurement inaccuracies inthe determination of the elastic modulus, especially with thin cartilage [53].
Ultrasound has been applied for the determination of cartilage thickness [1, 63, 98,103, 117, 125]. In an attempt to eliminate errors in measured elastic modulus in indenta-tion geometry due to the lacking thickness information, an ultrasound transducer as anindenter has been demonstrated to provide a tool for determination of the tissue thick-ness [65, 80, 81, 139, 155, 157]. A similar idea has recently been applied to undertakethe ultrasound measurement through a water jet that indents the soft tissue [92]. Thesemechano-acoustic techniques enable, not only determination of mechanical properties ofthe tissue, but also the acoustic properties that are known to be related to the integrityof articular cartilage [80, 81, 117]. If the indentation method is exploited in the deter-mination of elastic modulus of the material, the ultrasound speed is assumed to remainconstant and used to track the compressive displacements. For reliable determination ofthickness and, therefore, deformation information, it is important that ultrasound speedin the tissue is accurately known [80, 143].
Acoustic tracking of the internal structures of soft tissue under mechanical stress,i.e. ultrasound elastography [17, 18, 28, 77, 108, 109], has enabled the determinationof depth-wise elastic properties of articular cartilage [43, 156, 158–160]. However, it is
28 3.3. Ultrasound and mechano-acoustic measurement techniques
not known if compression-related changes in ultrasound speed, proposed by Zheng et al.[158, 160], affect the determined mechanical properties of articular cartilage in the axisof ultrasound propagation and mechanical compression [158].
3. Acoustic properties of articular cartilage 29
Table 3.4: Ultrasound speed in articular cartilage (mean ± SD or range). The measurementdirection is demonstrated relative to the cartilage surface. Status indicates the type of sampleor the chemical degradation to which the sample had been subjected.
Species Site Status Direction n Ultrasound Frequency Studyspeed (m s−1) (MHz)
bovine PAT normal PE 18 1636 ± 25 50 [113]PE (S) 18 1574 ± 29PE (M) 18 1621 ± 34PE (D) 18 1701 ± 36PA (S) 10 1518 ± 17PA (M) 10 1532 ± 26PA (D) 10 1554 ± 42
bovine PAT normal PE 6 1627 ± 58 10.3 [142]FMC normal PE 6 1638 ± 18LPG normal PE 6 1652 ± 16TMP normal PE 6 1602 ± 35talus normal PE 6 1721 ± 26
human FC young normal PE 7 1666 ± 16† 30 [57]normal PE 24 1664 ± 7†papain PE 24 1642 ± 9†
bovine FC normal PE 12 1666 ± 8†interleukin-1α PE 12 1631 ± 17†
equine PP normal, age 5 months PE 16 1695 ± 160 10 [22]normal, age 1.5 years PE 18 1748 ± 127degenerated, age 3-20 years PE 42 1675 ± 107overall PE 76 1696 ± 126
bovine PAT visually normal PE 24 1654 ± 82 22 [145]chondroitinase ABC PE 12 1646 ± 68collagenase PE 12 1567 ± 100
rat patella normal, immature PE 6 1640 ± 15 55 [114]normal, mature PE 6 1690 ± 10
human ankle tibia normal PE 17 1849 ± 133 20 [153]talus normal PE 12 1835 ± 67acetabular cup normal PE 13 1915 ± 271femoral head normal PE 27 1934 ± 191all locations normal PE 69 1892 ± 183
human FC visually normal PE 27 1658 ± 185 25 [104]osteoarthritis PE 40 1581 ± 148
bovine FC, PSF, TP N/A PE 16 1765 ± 145 N/A [76]bovine PGF normal PE (Tang.) 2 1635 − 1671 100 [4]
PE (Trans.) 2 1617 − 1647PE (Rad.) 2 1715 − 1720PA 2 1660 − 1690
chondroitinase ABC PE (Tang.) 2 1640 − 1670PE (Trans.) 2 1631 − 1641PE (Rad.) 2 1738 − 1777PA 2 1775 − 1793
collagen only PE (Tang.) 1 1648PE (Trans.) 2 1620 − 1653PE (Rad.) 2 1704 − 1760PA 2 1705 − 1744
cross-links cleaved PE (Tang.) 2 1650 − 1680PE (Trans.) 2 1610 − 1725PE (Rad.) 2 1658 − 1716PA 1 1695
† mean ± SEMD = deep region of cartilageFC = femoral condyleFMC = femoral medial condyleM = middle region of cartilageLPG = lateral patellar groovePA = parallel to articular surfacePAT = lateral upper quadrant of patellaPE = perpendicular to articular surfacePGF = patellar groove of femurPSF = patellar surface of femurPP = proximal phalanxRad. = radial region of cartilageS = superficial region of cartilageTang. = tangential region of cartilageTP = tibial plateuTrans. = transitional region of cartilageTMP = tibial medial plateu

30 3.3. Ultrasound and mechano-acoustic measurement techniques
Chapter IVAims of the present study
Ultrasound has been proposed to provide a potential tool for determining the integrity ofarticular cartilage. However, it is not clear how ultrasound propagation is related to thecomposition and structure of cartilage. It is also not well known in quantitative termshow the acoustic properties of articular cartilage are affected by mechanical loading andhow possible changes in acoustic properties affect mechano-acoustic determination ofmechanical properties of articular cartilage.
To clarify these issues, this thesis aimed to
• examine the interdependence of composition of articular cartilage and the acousticproperties of normal and degenerated cartilage
• study the interdependence of structure of articular cartilage and the acoustic prop-erties of normal and degenerated cartilage
• determine the effects of mechanical loading on acoustic properties of articular car-tilage
• relate the compression-related changes in ultrasound speed with the structure andcomposition of articular cartilage
• evaluate the feasibility of using ultrasound techniques for detecting and quantifyingcartilage degeneration
31

32
Chapter VMaterials and methods
This thesis consists of four independent studies. Studies I and II investigated the effectof composition and structure of articular cartilage on its acoustic properties. The mainfocus in studies III and IV was on the effect of mechanical loading on the acousticproperties of articular cartilage. A summary of the materials and methods is presentedin Table 5.1.
5.1 Sample preparation
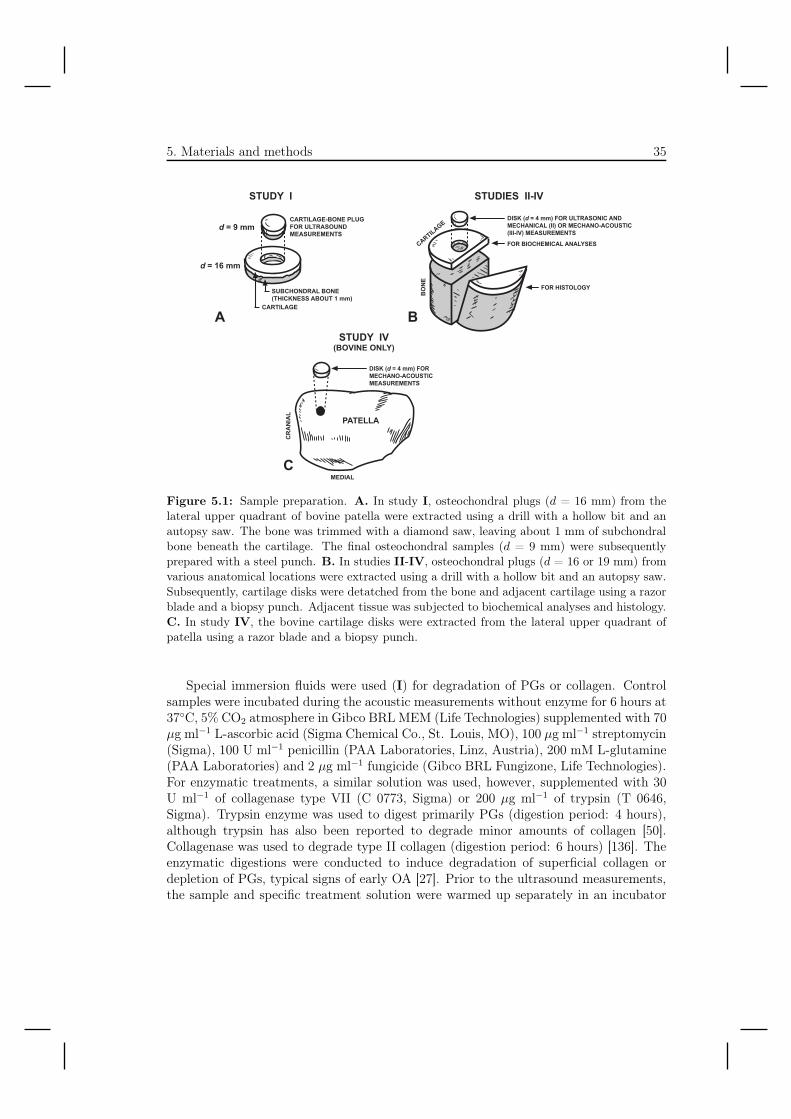
In study I, visually normal osteochondral samples (n = 18, d = 9 mm) were preparedfrom the lateral upper quadrant of 1 to 3 -year-old bovine patellae under sterile conditions(Fig. 5.1). The samples were acoustically measured during enzymatic treatments andbeing subdivided into three groups according to the treatment: control (n = 6), PG-depleted (n = 6) and collagen-degenerated (n = 6) groups.
For studies II-IV, cartilage disks (d = 4 mm) without subchondral bone were pre-pared under sterile conditions from various anatomical locations (Fig. 5.1). Samples withvisually various degenerative stages (II) were prepared from the lateral upper quadrantof bovine patella (n = 32). Visually healthy samples (III) were prepared from the lat-eral upper quadrant of human (n = 6), bovine (n = 6) and porcine (n = 6) patellae.Human cartilage samples (IV) represented cartilage at various stages of degeneration,as determined visually, and were prepared from different anatomical locations: femoralgroove (FG, n = 13), femoral lateral condyle (FLC, n = 13), femoral medial condyle(FMC, n = 13), lateral upper quadrant of patella (PAT, n = 11), tibial lateral plateau(TLP, n = 13) and tibial medial plateau (TMP, n = 13). Bovine samples (IV) (n =6) from lateral upper quadrant of patella were visually normal. The samples were keptmoist with Gibco BRL Dulbecco’s phosphate-buffered saline (PBS) (Life Technologies,Paisley, Scotland, UK) during all stages of preparation. The samples investigated instudies II-IV were stored at -20◦C prior to the measurements. Elastomer samples (n= 2, d = 4 mm) and degassed distilled water were used as reference material (III-IV).Human patellar samples in study III were included in the group PAT (n = 11) for studyIV.
33
34 5.2. Acoustic measurements
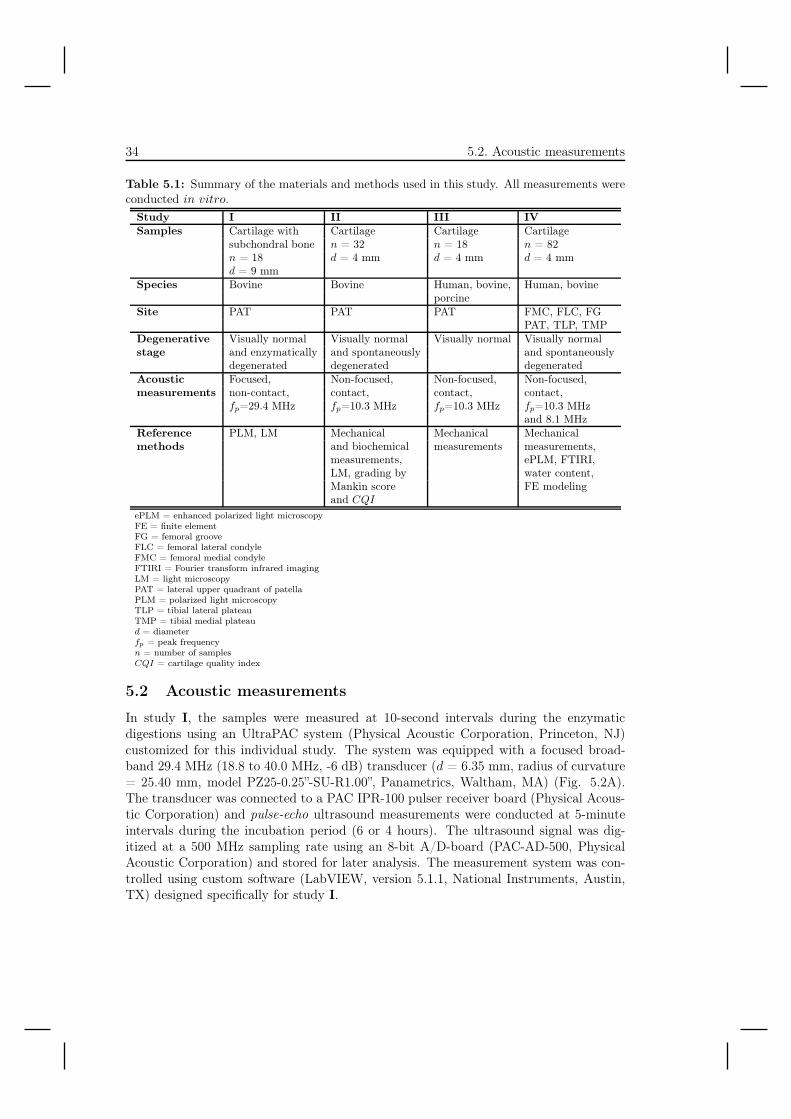
Table 5.1: Summary of the materials and methods used in this study. All measurements wereconducted in vitro.
Study I II III IVSamples Cartilage with Cartilage Cartilage Cartilage
subchondral bone n = 32 n = 18 n = 82n = 18 d = 4 mm d = 4 mm d = 4 mmd = 9 mm
Species Bovine Bovine Human, bovine, Human, bovineporcine
Site PAT PAT PAT FMC, FLC, FGPAT, TLP, TMP
Degenerative Visually normal Visually normal Visually normal Visually normalstage and enzymatically and spontaneously and spontaneously
degenerated degenerated degeneratedAcoustic Focused, Non-focused, Non-focused, Non-focused,measurements non-contact, contact, contact, contact,
fp=29.4 MHz fp=10.3 MHz fp=10.3 MHz fp=10.3 MHzand 8.1 MHz
Reference PLM, LM Mechanical Mechanical Mechanicalmethods and biochemical measurements measurements,
measurements, ePLM, FTIRI,LM, grading by water content,Mankin score FE modelingand CQI
ePLM = enhanced polarized light microscopyFE = finite elementFG = femoral grooveFLC = femoral lateral condyleFMC = femoral medial condyleFTIRI = Fourier transform infrared imagingLM = light microscopyPAT = lateral upper quadrant of patellaPLM = polarized light microscopyTLP = tibial lateral plateauTMP = tibial medial plateaud = diameterfp = peak frequencyn = number of samplesCQI = cartilage quality index
5.2 Acoustic measurements
In study I, the samples were measured at 10-second intervals during the enzymaticdigestions using an UltraPAC system (Physical Acoustic Corporation, Princeton, NJ)customized for this individual study. The system was equipped with a focused broad-band 29.4 MHz (18.8 to 40.0 MHz, -6 dB) transducer (d = 6.35 mm, radius of curvature= 25.40 mm, model PZ25-0.25”-SU-R1.00”, Panametrics, Waltham, MA) (Fig. 5.2A).The transducer was connected to a PAC IPR-100 pulser receiver board (Physical Acous-tic Corporation) and pulse-echo ultrasound measurements were conducted at 5-minuteintervals during the incubation period (6 or 4 hours). The ultrasound signal was dig-itized at a 500 MHz sampling rate using an 8-bit A/D-board (PAC-AD-500, PhysicalAcoustic Corporation) and stored for later analysis. The measurement system was con-trolled using custom software (LabVIEW, version 5.1.1, National Instruments, Austin,TX) designed specifically for study I.
5. Materials and methods 35
��(�'.���
������
��(�/���
��������������&���0����������'���-
������1���������������������������������
���� ���
��
��
���������0�&��(�2���-�����������������������&��-���������1�����&���1�3-������������
��������������� ���
������������
�����������1�3
�
�����
�����
�
�
��
���0�&��(�2���-���������1����������������
���� ���3&��3������� -
Figure 5.1: Sample preparation. A. In study I, osteochondral plugs (d = 16 mm) from thelateral upper quadrant of bovine patella were extracted using a drill with a hollow bit and anautopsy saw. The bone was trimmed with a diamond saw, leaving about 1 mm of subchondralbone beneath the cartilage. The final osteochondral samples (d = 9 mm) were subsequentlyprepared with a steel punch. B. In studies II-IV, osteochondral plugs (d = 16 or 19 mm) fromvarious anatomical locations were extracted using a drill with a hollow bit and an autopsy saw.Subsequently, cartilage disks were detatched from the bone and adjacent cartilage using a razorblade and a biopsy punch. Adjacent tissue was subjected to biochemical analyses and histology.C. In study IV, the bovine cartilage disks were extracted from the lateral upper quadrant ofpatella using a razor blade and a biopsy punch.
Special immersion fluids were used (I) for degradation of PGs or collagen. Controlsamples were incubated during the acoustic measurements without enzyme for 6 hours at37◦C, 5% CO2 atmosphere in Gibco BRL MEM (Life Technologies) supplemented with 70μg ml−1 L-ascorbic acid (Sigma Chemical Co., St. Louis, MO), 100 μg ml−1 streptomycin(Sigma), 100 U ml−1 penicillin (PAA Laboratories, Linz, Austria), 200 mM L-glutamine(PAA Laboratories) and 2 μg ml−1 fungicide (Gibco BRL Fungizone, Life Technologies).For enzymatic treatments, a similar solution was used, however, supplemented with 30U ml−1 of collagenase type VII (C 0773, Sigma) or 200 μg ml−1 of trypsin (T 0646,Sigma). Trypsin enzyme was used to digest primarily PGs (digestion period: 4 hours),although trypsin has also been reported to degrade minor amounts of collagen [50].Collagenase was used to degrade type II collagen (digestion period: 6 hours) [136]. Theenzymatic digestions were conducted to induce degradation of superficial collagen ordepletion of PGs, typical signs of early OA [27]. Prior to the ultrasound measurements,the sample and specific treatment solution were warmed up separately in an incubator
36 5.2. Acoustic measurements
��#!"�����#!"����$�!
"!# �"��14����"�,��
����5 #6��78����"�,��
6����!
�
$#�"#�!
�"�,��6����!
��#!"�����#!"����$�!
��!$��#!"����$�!
"!# �"���"�,��
���
��#!"�����#!"����$�!
����1�,�% �5��)��"�,���6����!"�����#!"������#!"����$�!
9
���
)��8
��
�#!8
��#"�� $�,�"#�
����1�,�% �5��)����������6
"!# �"��
��4$6���!"�4���
����5 #6��78���
����1�,�% �5��)�#6���"�,��
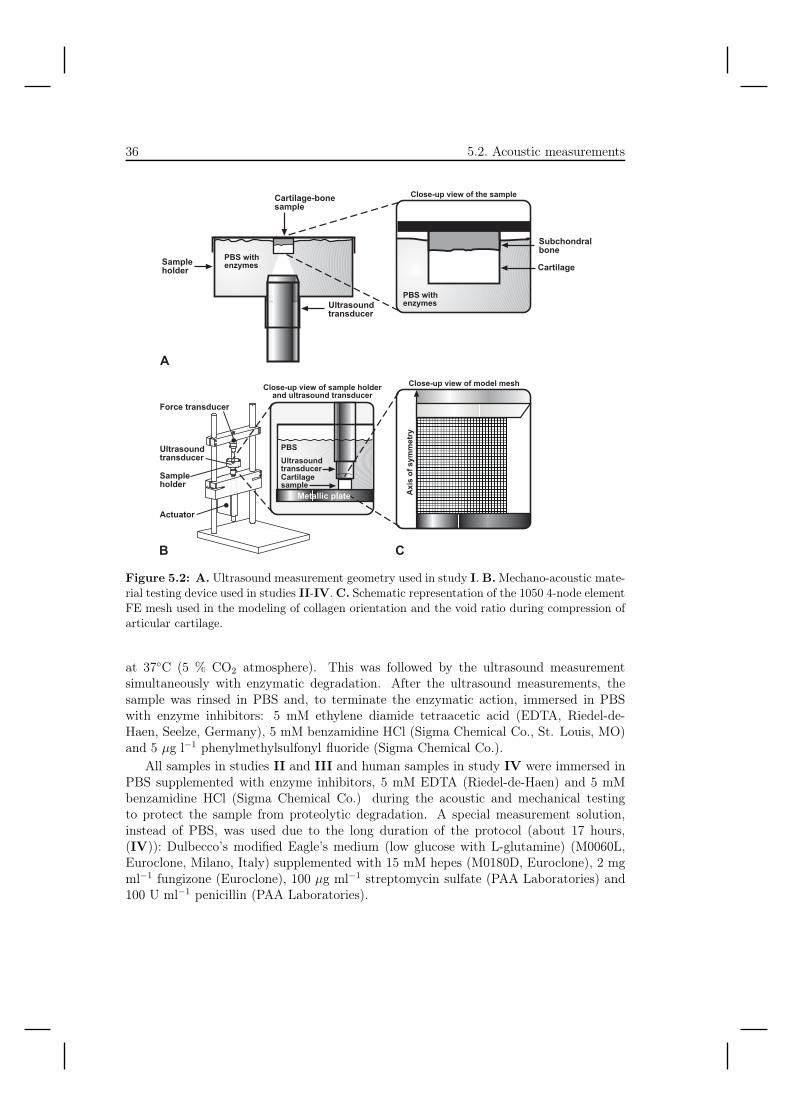
Figure 5.2: A. Ultrasound measurement geometry used in study I. B. Mechano-acoustic mate-rial testing device used in studies II-IV. C. Schematic representation of the 1050 4-node elementFE mesh used in the modeling of collagen orientation and the void ratio during compression ofarticular cartilage.
at 37◦C (5 % CO2 atmosphere). This was followed by the ultrasound measurementsimultaneously with enzymatic degradation. After the ultrasound measurements, thesample was rinsed in PBS and, to terminate the enzymatic action, immersed in PBSwith enzyme inhibitors: 5 mM ethylene diamide tetraacetic acid (EDTA, Riedel-de-Haen, Seelze, Germany), 5 mM benzamidine HCl (Sigma Chemical Co., St. Louis, MO)and 5 μg l−1 phenylmethylsulfonyl fluoride (Sigma Chemical Co.).
All samples in studies II and III and human samples in study IV were immersed inPBS supplemented with enzyme inhibitors, 5 mM EDTA (Riedel-de-Haen) and 5 mMbenzamidine HCl (Sigma Chemical Co.) during the acoustic and mechanical testingto protect the sample from proteolytic degradation. A special measurement solution,instead of PBS, was used due to the long duration of the protocol (about 17 hours,(IV)): Dulbecco’s modified Eagle’s medium (low glucose with L-glutamine) (M0060L,Euroclone, Milano, Italy) supplemented with 15 mM hepes (M0180D, Euroclone), 2 mgml−1 fungizone (Euroclone), 100 μg ml−1 streptomycin sulfate (PAA Laboratories) and100 U ml−1 penicillin (PAA Laboratories).
5. Materials and methods 37
In studies II-IV, the samples were measured at room temperature (typically 20◦C)using a mechano-acoustic material testing device (Fig. 5.2B), i.e. a mechanical test-ing system [145] empowered by the ultrasound system (UltraPAC, Physical AcousticCorporation) used in study I. The customization of this measurement system has beenpreviously described by Töyräs et al. [142]. The sample was positioned between a flatcontact transducer (V-116, Panametrics, Waltham, MA) (transducer tip dia. = 5.4 mm,element dia. = 3.2 mm, peak frequency: 10.3 MHz, 7.1-14.2 MHz, -3 dB [142]) and a pol-ished metallic plate (Fig. 5.2B). Different transducer (M-116, Panametrics) was used forbovine samples (transducer tip dia. = 5.4 mm, element dia. = 3.2 mm, peak frequency:8.1 MHz, 4.6-14.6 MHz, -6 dB) (IV). After placing the sample between the metallic plateand the ultrasound transducer, the first contact of the transducer with cartilage surfacewas monitored using a load cell (model 31, Honeywell Sensotec, Columbus, OH) at-tached to the ultrasound transducer. The axial positioning and mechanical compressionof the sample was conducted using a high-precision actuator (PM1A, Newport, Irvine,CA) (bidirectional repeatibility: 0.1 μm, accuracy of incremental motion: 0.05 μm). Instudy II, the samples were first acoustically tested and then subjected to mechanicalmeasurements. In studies III-IV, the samples were simultaneously subjected to acousticmeasurement and mechanical loading. Acoustic measurements in study II were con-ducted at 10 % pre-strain to ensure a uniform contact at the transducer-cartilage andcartilage-metal plate interfaces. This was followed by mechanical testing of the tissue.The compressive conditions, during which the acoustic measurements were conducted instudies III and IV, are described in Section 5.3.1.
5.3 Reference methods
Various reference methods were applied to relate composition, structure and mechanicalloading with the acoustic properties of articular cartilage.
5.3.1 Mechanical testing
Mechanical properties of articular cartilage were characterized in unconfined compressiongeometry (Fig. 5.2B) (II-IV). In study II, articular cartilage was mechanically testedafter acoustic measurements using a stress-relaxation protocol (pre-strain: 10 %, rampvelocity: 2 mm s−1, strain: 10 %, relaxation time: 2400 s). This was followed by 3cycles of sinusoidal loading at 1 Hz with 1 % strain amplitude. For the samples instudy III and human cartilage samples in study IV, 3 steps of subsequent 5 % stress-relaxation tests were conducted (pre-strain: 5 %, ramp velocity: 1 μm s−1, relaxationcriteria: 39 Pa min−1). The final stress-relaxation step of the measurement was followedby 3 cycles of sinusoidal loading at 1 Hz with 1 % strain amplitude. In study IV,bovine cartilage samples were used to test whether ultrasound speed in cartilage wasdependent on the applied strain-rate. A 10 % pre-strain was used for bovine samplesto ensure full contact. Following this stage, a 5 % strain step was applied (relaxationtime: 1000 s) and, subsequently, the strain was restored to the original pre-strain value(10 %, strain: 5 %, relaxation time: 3600 s). This test cycle was repeated 11 timesusing different strain rates (Table 5.2). The order of applied strain rates was randomised
38 5.3. Reference methods
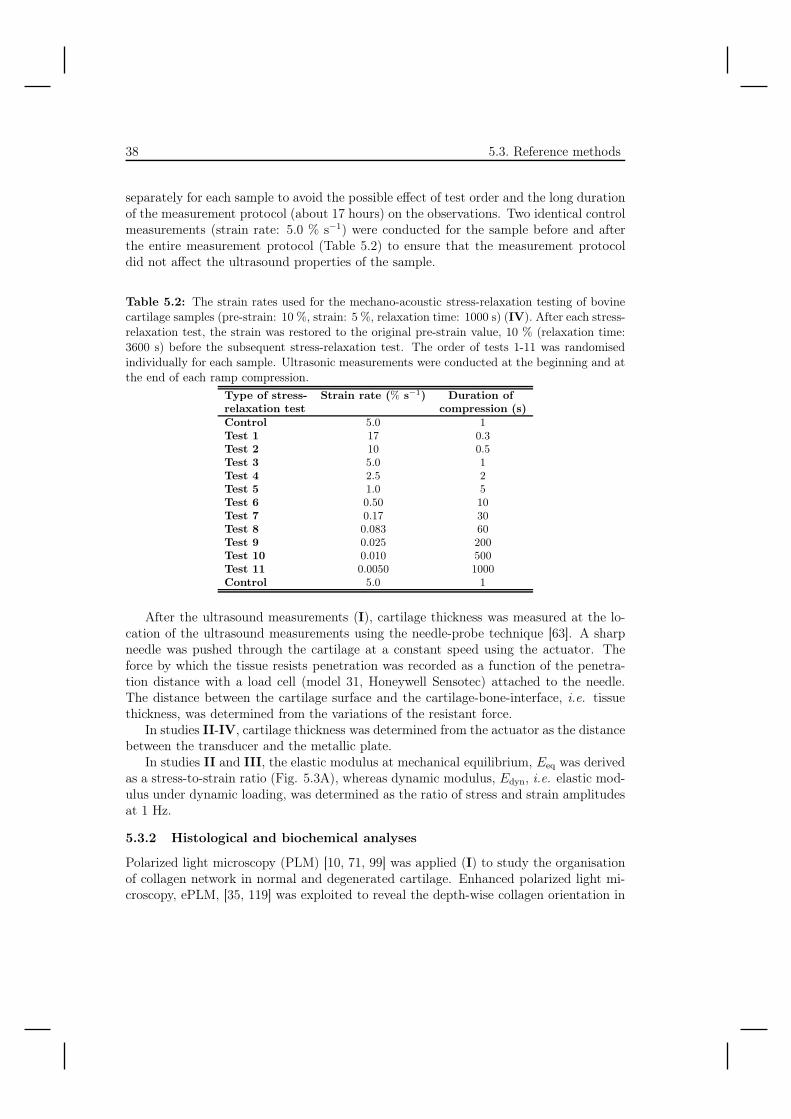
separately for each sample to avoid the possible effect of test order and the long durationof the measurement protocol (about 17 hours) on the observations. Two identical controlmeasurements (strain rate: 5.0 % s−1) were conducted for the sample before and afterthe entire measurement protocol (Table 5.2) to ensure that the measurement protocoldid not affect the ultrasound properties of the sample.
Table 5.2: The strain rates used for the mechano-acoustic stress-relaxation testing of bovinecartilage samples (pre-strain: 10 %, strain: 5 %, relaxation time: 1000 s) (IV). After each stress-relaxation test, the strain was restored to the original pre-strain value, 10 % (relaxation time:3600 s) before the subsequent stress-relaxation test. The order of tests 1-11 was randomisedindividually for each sample. Ultrasonic measurements were conducted at the beginning and atthe end of each ramp compression.
Type of stress- Strain rate (% s−1) Duration ofrelaxation test compression (s)Control 5.0 1Test 1 17 0.3Test 2 10 0.5Test 3 5.0 1Test 4 2.5 2Test 5 1.0 5Test 6 0.50 10Test 7 0.17 30Test 8 0.083 60Test 9 0.025 200Test 10 0.010 500Test 11 0.0050 1000Control 5.0 1
After the ultrasound measurements (I), cartilage thickness was measured at the lo-cation of the ultrasound measurements using the needle-probe technique [63]. A sharpneedle was pushed through the cartilage at a constant speed using the actuator. Theforce by which the tissue resists penetration was recorded as a function of the penetra-tion distance with a load cell (model 31, Honeywell Sensotec) attached to the needle.The distance between the cartilage surface and the cartilage-bone-interface, i.e. tissuethickness, was determined from the variations of the resistant force.
In studies II-IV, cartilage thickness was determined from the actuator as the distancebetween the transducer and the metallic plate.
In studies II and III, the elastic modulus at mechanical equilibrium, Eeq was derivedas a stress-to-strain ratio (Fig. 5.3A), whereas dynamic modulus, Edyn, i.e. elastic mod-ulus under dynamic loading, was determined as the ratio of stress and strain amplitudesat 1 Hz.
5.3.2 Histological and biochemical analyses
Polarized light microscopy (PLM) [10, 71, 99] was applied (I) to study the organisationof collagen network in normal and degenerated cartilage. Enhanced polarized light mi-croscopy, ePLM, [35, 119] was exploited to reveal the depth-wise collagen orientation in
5. Materials and methods 39
human articular cartilage (IV). In studies I and II, the PG distribution and content inarticular cartilage was examined under light microscopy (LM) from safranin-O stainedhistologic sections [72, 73].
To estimate the PG and collagen contents in cartilage, the contents of uronic acid(n = 32) and hydroxyproline (n = 28), respectively, were analyzed biochemically (II)[20, 132]. Fourier transform infrared microscopy imaging (FTIRI) was used to determinethe relative spatial and depth-wise distribution of collagen and PGs [120] (IV). Thewater content, CH2O, in cartilage was determined as follows (II, IV): After immersionof the sample in PBS, extra water was removed from the sample and the wet weight ofthe sample was determined (high precision balance Mettler AE 240, Mettler Toledo AG,Greifensee, Switzerland). The sample was freeze-dried and the dry weight of the samplewas measured. The water content was defined by dividing the difference between wetweight and dry weight by the wet weight. By exploiting FTIRI data and information ontotal water content, the spatial mass fractions of water, collagen and PGs were calcu-lated for four randomly selected human patellar cartilage samples (IV) by utilizing thefollowing assumptions: complement of water is solid matrix, of which 2/3 is collagen and1/3 is PGs [120].
To provide information on the structural integrity of cartilage (II), cartilage sam-ples were histologically graded as follows. Histologic sections, subjected to safranin-Ostaining, were ′′blind-coded′′ and observed under LM by three individual investigatorsaccording to the Mankin score [96]. The sample-specific Mankin score, SMankin, wascalculated as the mean of the three scores determined by these three investigators androunded to the closest integer. In this study, SMankin ranged from 0 to 10. The sampleswere then divided into three degenerative groups by SMankin: intact (n = 11, SMankin = 0),moderate degeneration (n = 11, SMankin = 1 to 3) and advanced degeneration groups(n = 10, SMankin = 4 to 10) [106].
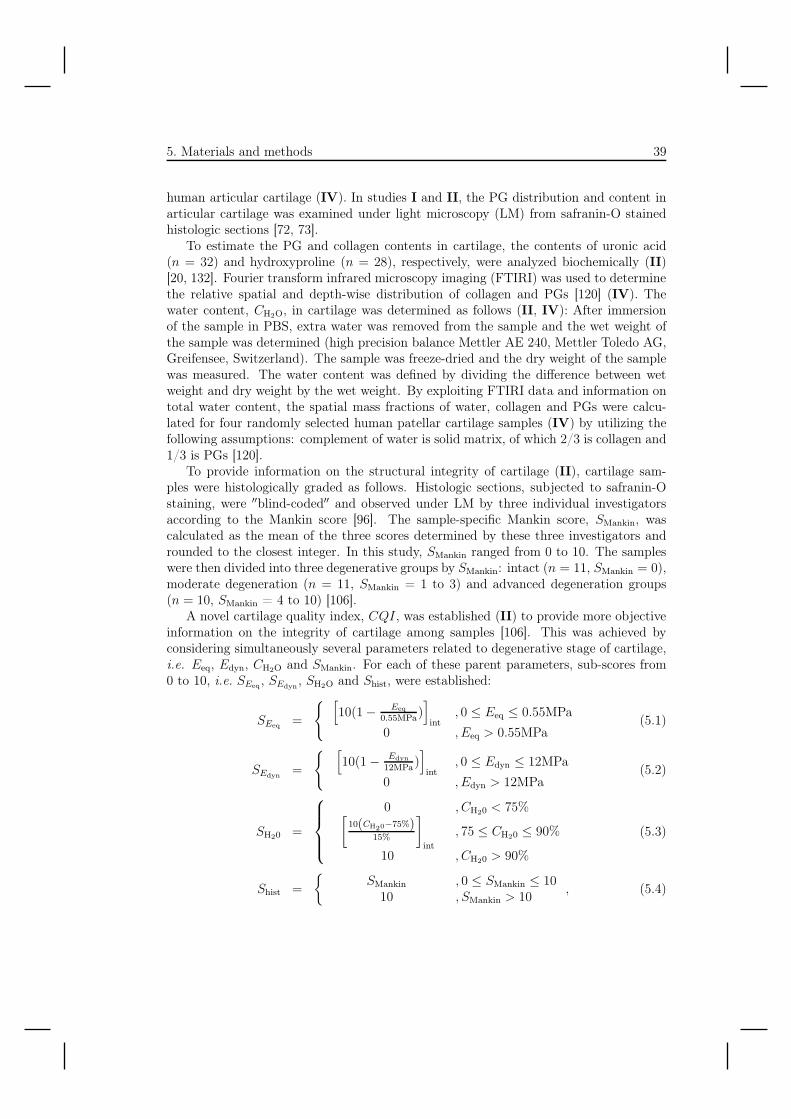
A novel cartilage quality index, CQI, was established (II) to provide more objectiveinformation on the integrity of cartilage among samples [106]. This was achieved byconsidering simultaneously several parameters related to degenerative stage of cartilage,i.e. Eeq, Edyn, CH2O and SMankin. For each of these parent parameters, sub-scores from0 to 10, i.e. SEeq, SEdyn , SH2O and Shist, were established:
SEeq =
{ [10(1 − Eeq
0.55MPa)]
int, 0 ≤ Eeq ≤ 0.55MPa
0 , Eeq > 0.55MPa(5.1)
SEdyn =
{ [10(1 − Edyn
12MPa)]
int, 0 ≤ Edyn ≤ 12MPa
0 , Edyn > 12MPa(5.2)
SH20 =
⎧⎪⎪⎨⎪⎪⎩
0 , CH20 < 75%[10(CH20−75%)
15%
]int
, 75 ≤ CH20 ≤ 90%
10 , CH20 > 90%
(5.3)
Shist =
{SMankin , 0 ≤ SMankin ≤ 10
10 , SMankin > 10, (5.4)
40 5.4. Ultrasound analyses
where operation [·]int stands for rounding of the value to the closest integer. Sub-score 0stands for the parent parameter value that is typical for healthy cartilage. Correspond-ingly, 10 stands for the value typical of cartilage with advanced degeneration. Finally,the sub-scores were added up to form CQI:
CQI = SEeq + SEdyn + SH2O + Shist. (5.5)
CQI, thus, gives integer values from 0 to 40 representing an estimate of the overallcartilage quality, i.e. 0 and 40 standing for perfectly healthy and severely degeneratedcartilage, respectively. It is important to note that this scoring system may apply onlyto young bovine patellar cartilage investigated with identical methods as used in studyII.
5.4 Ultrasound analyses
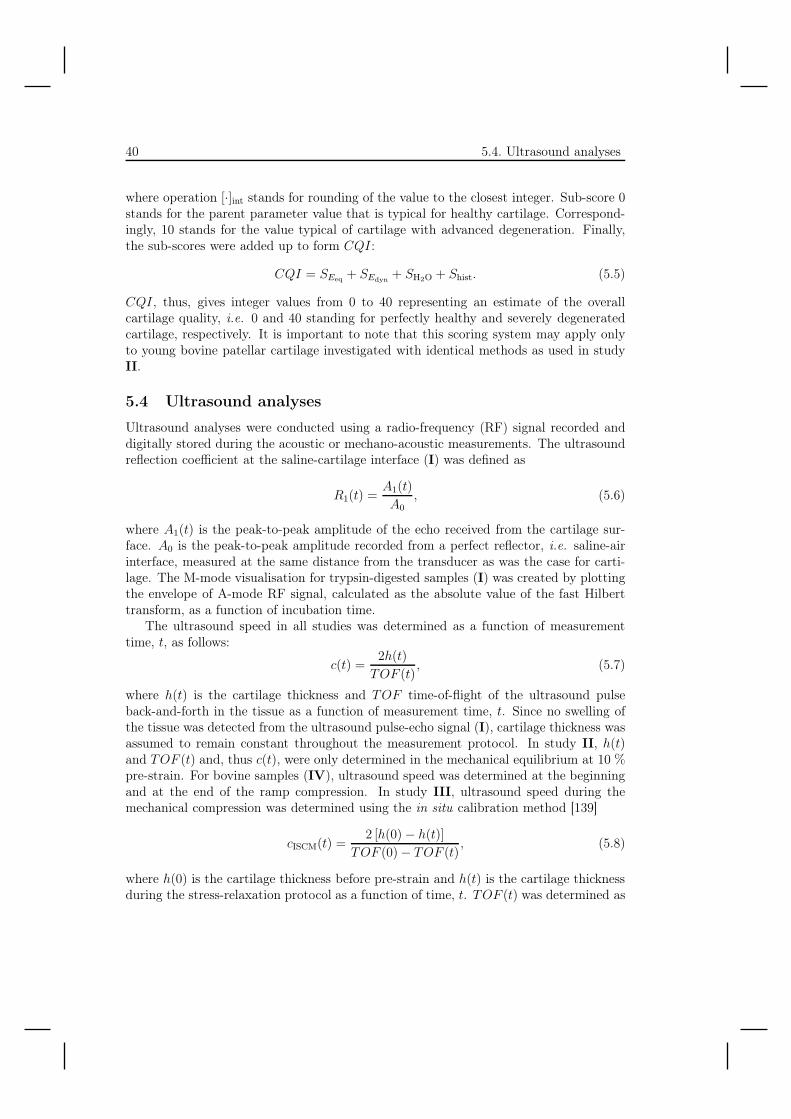
Ultrasound analyses were conducted using a radio-frequency (RF) signal recorded anddigitally stored during the acoustic or mechano-acoustic measurements. The ultrasoundreflection coefficient at the saline-cartilage interface (I) was defined as
R1(t) =A1(t)
A0, (5.6)
where A1(t) is the peak-to-peak amplitude of the echo received from the cartilage sur-face. A0 is the peak-to-peak amplitude recorded from a perfect reflector, i.e. saline-airinterface, measured at the same distance from the transducer as was the case for carti-lage. The M-mode visualisation for trypsin-digested samples (I) was created by plottingthe envelope of A-mode RF signal, calculated as the absolute value of the fast Hilberttransform, as a function of incubation time.
The ultrasound speed in all studies was determined as a function of measurementtime, t, as follows:
c(t) =2h(t)
TOF (t), (5.7)
where h(t) is the cartilage thickness and TOF time-of-flight of the ultrasound pulseback-and-forth in the tissue as a function of measurement time, t. Since no swelling ofthe tissue was detected from the ultrasound pulse-echo signal (I), cartilage thickness wasassumed to remain constant throughout the measurement protocol. In study II, h(t)and TOF (t) and, thus c(t), were only determined in the mechanical equilibrium at 10 %pre-strain. For bovine samples (IV), ultrasound speed was determined at the beginningand at the end of the ramp compression. In study III, ultrasound speed during themechanical compression was determined using the in situ calibration method [139]
cISCM(t) =2 [h(0) − h(t)]
TOF (0) − TOF (t), (5.8)
where h(0) is the cartilage thickness before pre-strain and h(t) is the cartilage thicknessduring the stress-relaxation protocol as a function of time, t. TOF (t) was determined as
5. Materials and methods 41
the time difference between the echoes reflecting from cartilage-saline and cartilage-boneinterfaces (I). In the time-domain, each acoustic interface was located at the zero-crossingpoint that preceded the first echo amplitude rising over the background noise level. Instudies II-IV, TOF (t) was the time difference between the two ultrasound echoes arisingfrom the cartilage-metallic plate interface after the pulse had travelled back-and-forth inthe sample m + 1
2and m + 3
2times (m = 1 or 2) (Fig. 5.3B). Cross-correlation method
[29] has been successfully used to determine TOF through full-thickness cartilage or intracking of ultrasound echo displacements inside articular cartilage under mechanicalcompression [156]. Thus, TOF (t) was determined using the cross-correlation function[29]:
rxy(k) =1
J−1
∑Jj=1(x(j) − x)(y(j + k) − y)√
1J−1
∑Jj=1(x(j) − x)2 1
J−1
∑Jj=1(y(j) − y)2
, (5.9)
where rxy(k) is the correlation coefficient and x and y represent the two different A-mode RF signal vectors containing either only the first or the second ultrasound echo,respectively. In each vector, the elements outside the echo of interest were set to zero.Variables j or k are the sample indices of vectors x and y or cross-correlation function rxy,respectively. J is the length of the vectors x and y, and it varied specifically accordingto sample thickness. TOF was determined as the time lag of the maximum of thecross-correlation function. The ultrasound echoes in vectors x and y were automaticallywindowed from the original A-mode RF signal vector by positioning the centre of a 300-sample window (duration: 0.6 μs) at the envelope maximum of the echo of interest (Fig.5.3B). The envelope was calculated as the absolute value of the fast Hilbert transform ofthe ultrasound pulse-echo signal. The window was chosen to be long enough to capturethe entire pulse within the window.
Amplitude attenuation coefficient, αamp (dB mm−1), (I) was estimated as [24, 145]
αamp(t) =4.343
h(t)loge
[R2A1(t)
R1(t)A2(t)
(1 − R2
1(t))]
, (5.10)
where A1(t) and A2(t) are the peak-to-peak amplitudes of the echoes received from thecartilage-saline and cartilage-bone interfaces, respectively. R1 is the reflection coefficientdefined in equation 5.6 and R2 = 0.374 is the reflection coefficient at the cartilage-boneinterface [145, 148]. R2 was assumed to be the same for all samples.
The amplitude attenuation coefficient (II-III), was determined as
αamp(t) =10
h(t)log10
RstRsmA1(t)
A2(t), (5.11)
where A1(t) and A2(t) are the peak-to-peak amplitudes of the echoes received from thecartilage-metallic plate interface after the pulse had travelled through the sample onceor three times, respectively, i.e. the first and the second echo (Fig. 5.3B). Rst and Rsm
are the ultrasound reflection coefficients at the sample-transducer and sample-metallicplate interfaces, respectively. The site-specific RstRsm was determined to be about 0.83for cartilage (III). However in study II, RstRsm was assumed to be 1.00. The effect ofthis assumption on results of study II has been estimated in Section 5.6.
42 5.4. Ultrasound analyses
��� ����
��
� ���&��-
�
,� #
��
�&3
- ��
�
������
������
�������
��
!$�
&�-
� ���&�-�
�,
�"$�
���
#&�
�-
������������
������� ��������
����� �
!
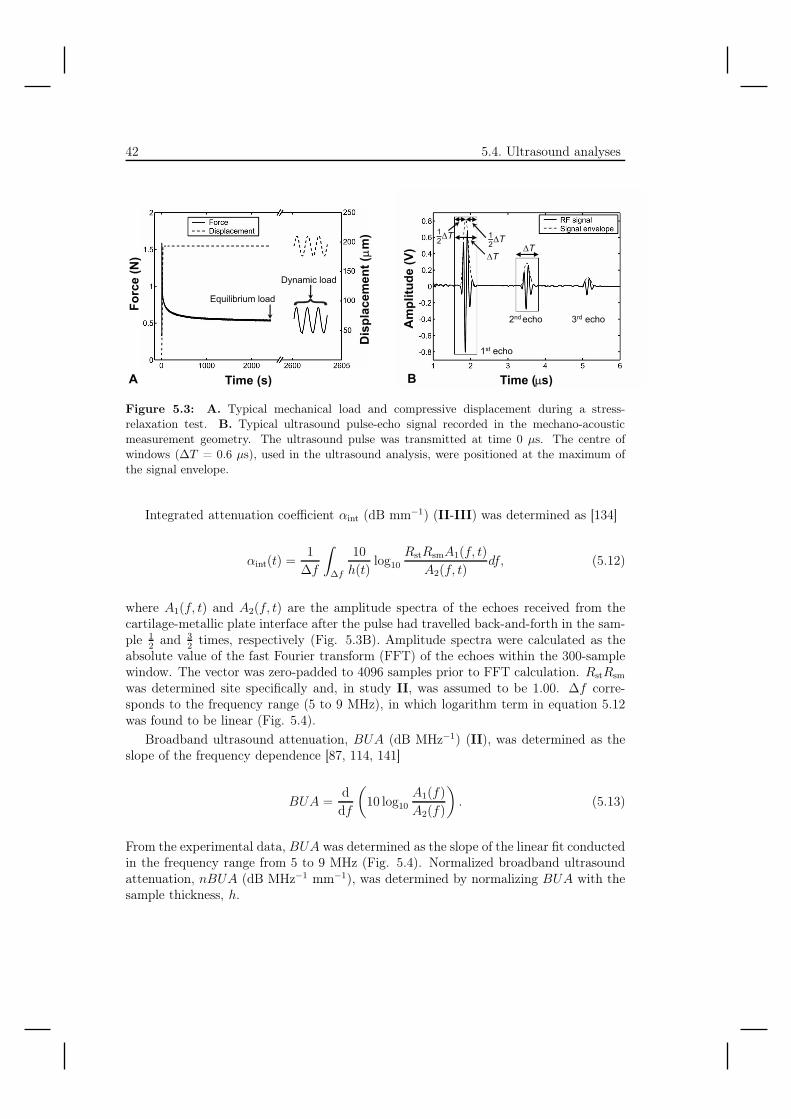
Figure 5.3: A. Typical mechanical load and compressive displacement during a stress-relaxation test. B. Typical ultrasound pulse-echo signal recorded in the mechano-acousticmeasurement geometry. The ultrasound pulse was transmitted at time 0 μs. The centre ofwindows (ΔT = 0.6 μs), used in the ultrasound analysis, were positioned at the maximum ofthe signal envelope.
Integrated attenuation coefficient αint (dB mm−1) (II-III) was determined as [134]
αint(t) =1
Δf
∫Δf
10
h(t)log10
RstRsmA1(f, t)
A2(f, t)df, (5.12)
where A1(f, t) and A2(f, t) are the amplitude spectra of the echoes received from thecartilage-metallic plate interface after the pulse had travelled back-and-forth in the sam-ple 1
2and 3
2times, respectively (Fig. 5.3B). Amplitude spectra were calculated as the
absolute value of the fast Fourier transform (FFT) of the echoes within the 300-samplewindow. The vector was zero-padded to 4096 samples prior to FFT calculation. RstRsm
was determined site specifically and, in study II, was assumed to be 1.00. Δf corre-sponds to the frequency range (5 to 9 MHz), in which logarithm term in equation 5.12was found to be linear (Fig. 5.4).
Broadband ultrasound attenuation, BUA (dB MHz−1) (II), was determined as theslope of the frequency dependence [87, 114, 141]
BUA =ddf
(10 log10
A1(f)
A2(f)
). (5.13)
From the experimental data, BUA was determined as the slope of the linear fit conductedin the frequency range from 5 to 9 MHz (Fig. 5.4). Normalized broadband ultrasoundattenuation, nBUA (dB MHz−1 mm−1), was determined by normalizing BUA with thesample thickness, h.
5. Materials and methods 43
�!�:���$8 &��7-
4
����
#��"
##��
�"#
��
&��
-
"��#� �$ �����������%����� ���&�'()*�
����%� ���& ��*�
�+#� �������������������,���� �$����������$ �������� ��-���*��'()
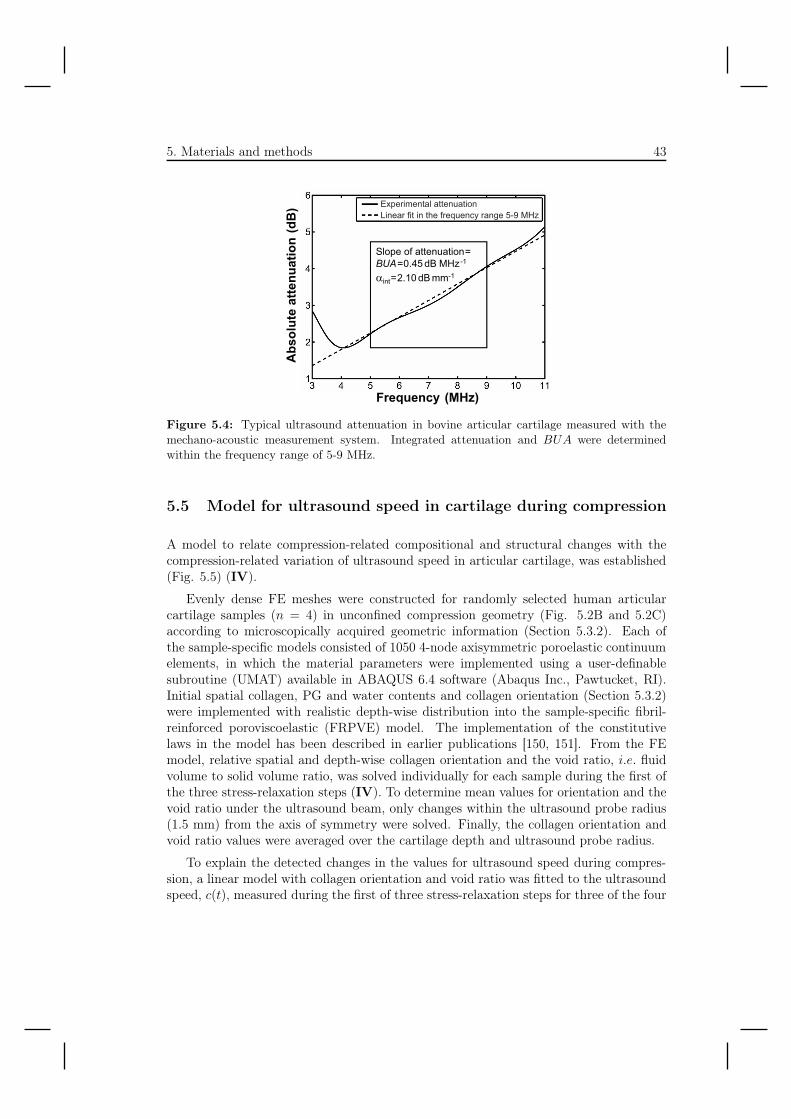
Figure 5.4: Typical ultrasound attenuation in bovine articular cartilage measured with themechano-acoustic measurement system. Integrated attenuation and BUA were determinedwithin the frequency range of 5-9 MHz.
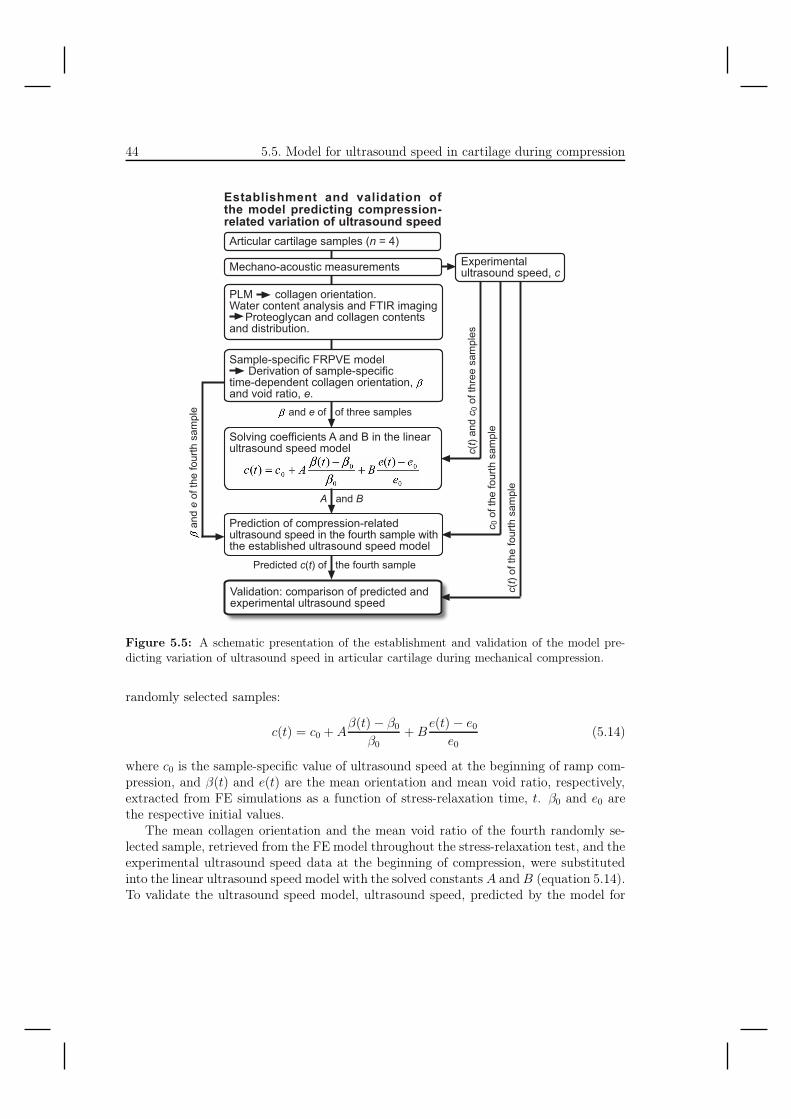
5.5 Model for ultrasound speed in cartilage during compression
A model to relate compression-related compositional and structural changes with thecompression-related variation of ultrasound speed in articular cartilage, was established(Fig. 5.5) (IV).
Evenly dense FE meshes were constructed for randomly selected human articularcartilage samples (n = 4) in unconfined compression geometry (Fig. 5.2B and 5.2C)according to microscopically acquired geometric information (Section 5.3.2). Each ofthe sample-specific models consisted of 1050 4-node axisymmetric poroelastic continuumelements, in which the material parameters were implemented using a user-definablesubroutine (UMAT) available in ABAQUS 6.4 software (Abaqus Inc., Pawtucket, RI).Initial spatial collagen, PG and water contents and collagen orientation (Section 5.3.2)were implemented with realistic depth-wise distribution into the sample-specific fibril-reinforced poroviscoelastic (FRPVE) model. The implementation of the constitutivelaws in the model has been described in earlier publications [150, 151]. From the FEmodel, relative spatial and depth-wise collagen orientation and the void ratio, i.e. fluidvolume to solid volume ratio, was solved individually for each sample during the first ofthe three stress-relaxation steps (IV). To determine mean values for orientation and thevoid ratio under the ultrasound beam, only changes within the ultrasound probe radius(1.5 mm) from the axis of symmetry were solved. Finally, the collagen orientation andvoid ratio values were averaged over the cartilage depth and ultrasound probe radius.
To explain the detected changes in the values for ultrasound speed during compres-sion, a linear model with collagen orientation and void ratio was fitted to the ultrasoundspeed, c(t), measured during the first of three stress-relaxation steps for three of the four
44 5.5. Model for ultrasound speed in cartilage during compression
. ������ ��� ����-�����#����/��%��0
1,'������������-���� ��������� 2��� ����������������������3456����-��-�����1 ����-���������������-������������������� �������
"��7��-����$$��������.�����&������������� ��� ��������#���������
1 ����������$����# ������* ��������� ��������#�����������$�� ������#���8���������������������� ��������#���������
��#"4� �6���#� "��� %"� �"# ��� �)#6��������,!�� $# ���$��,!��� ��1!��"#���%"! "# ����)���#!"�������,���
'������*�������������� ������ �+#� ���������� ��������#���9��
�/0��
����
���$
��� �
����
�#�
��
�����
���
�$���
��$�
� ��
����
#��
���������� �
��$��
���$�
� ��
����
#��
:���������;����#� ������$�# ������������+#� ����������� ��������#���
�/0��
$����
�$��
����
��#�
�
���������$����$��� ������#���
1 ���������/0��$�������$�� ������#��
"��#��*�#���$���361:��������������� �7�������$����#��*�#���$������*��#������������-���� ���������9����7���� ����9��
Figure 5.5: A schematic presentation of the establishment and validation of the model pre-dicting variation of ultrasound speed in articular cartilage during mechanical compression.
randomly selected samples:
c(t) = c0 + Aβ(t) − β0
β0+ B
e(t) − e0
e0(5.14)
where c0 is the sample-specific value of ultrasound speed at the beginning of ramp com-pression, and β(t) and e(t) are the mean orientation and mean void ratio, respectively,extracted from FE simulations as a function of stress-relaxation time, t. β0 and e0 arethe respective initial values.
The mean collagen orientation and the mean void ratio of the fourth randomly se-lected sample, retrieved from the FE model throughout the stress-relaxation test, and theexperimental ultrasound speed data at the beginning of compression, were substitutedinto the linear ultrasound speed model with the solved constants A and B (equation 5.14).To validate the ultrasound speed model, ultrasound speed, predicted by the model for
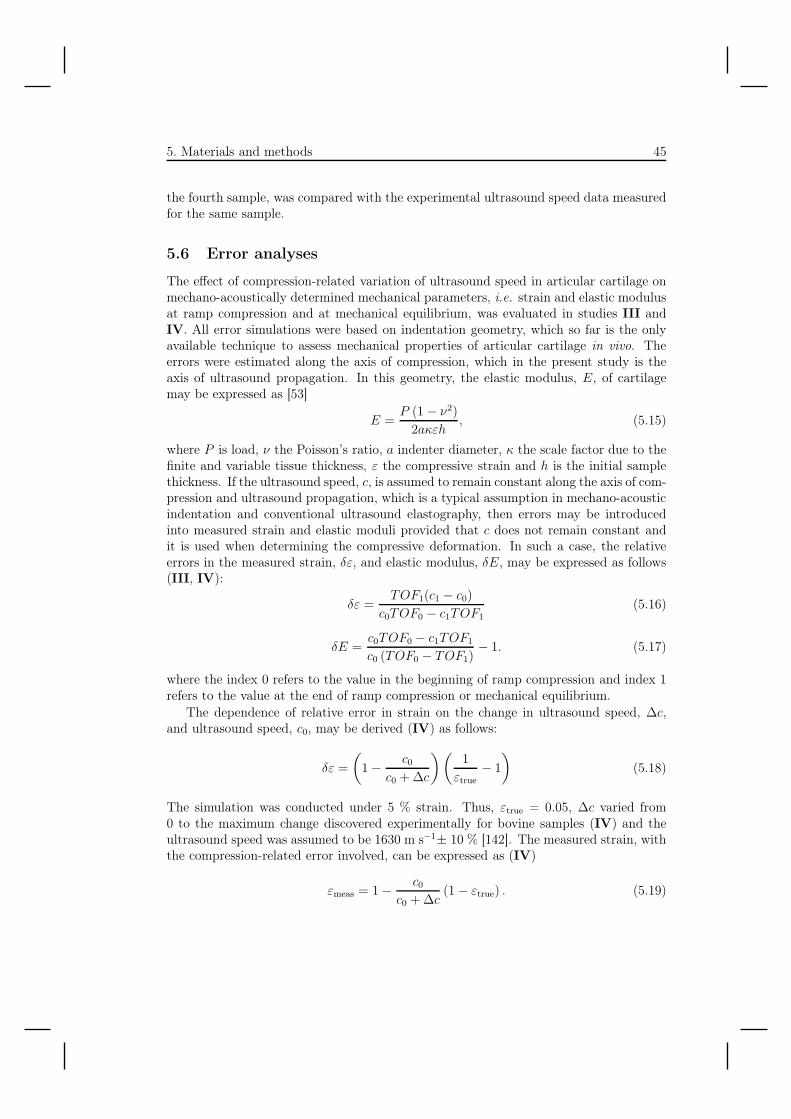
5. Materials and methods 45
the fourth sample, was compared with the experimental ultrasound speed data measuredfor the same sample.
5.6 Error analyses
The effect of compression-related variation of ultrasound speed in articular cartilage onmechano-acoustically determined mechanical parameters, i.e. strain and elastic modulusat ramp compression and at mechanical equilibrium, was evaluated in studies III andIV. All error simulations were based on indentation geometry, which so far is the onlyavailable technique to assess mechanical properties of articular cartilage in vivo. Theerrors were estimated along the axis of compression, which in the present study is theaxis of ultrasound propagation. In this geometry, the elastic modulus, E, of cartilagemay be expressed as [53]
E =P (1 − ν2)
2aκεh, (5.15)
where P is load, ν the Poisson’s ratio, a indenter diameter, κ the scale factor due to thefinite and variable tissue thickness, ε the compressive strain and h is the initial samplethickness. If the ultrasound speed, c, is assumed to remain constant along the axis of com-pression and ultrasound propagation, which is a typical assumption in mechano-acousticindentation and conventional ultrasound elastography, then errors may be introducedinto measured strain and elastic moduli provided that c does not remain constant andit is used when determining the compressive deformation. In such a case, the relativeerrors in the measured strain, δε, and elastic modulus, δE, may be expressed as follows(III, IV):
δε =TOF1(c1 − c0)
c0TOF0 − c1TOF1(5.16)
δE =c0TOF0 − c1TOF1
c0 (TOF0 − TOF1)− 1. (5.17)
where the index 0 refers to the value in the beginning of ramp compression and index 1refers to the value at the end of ramp compression or mechanical equilibrium.
The dependence of relative error in strain on the change in ultrasound speed, Δc,and ultrasound speed, c0, may be derived (IV) as follows:
δε =
(1 − c0
c0 + Δc
) (1
εtrue− 1
)(5.18)
The simulation was conducted under 5 % strain. Thus, εtrue = 0.05, Δc varied from0 to the maximum change discovered experimentally for bovine samples (IV) and theultrasound speed was assumed to be 1630 m s−1± 10 % [142]. The measured strain, withthe compression-related error involved, can be expressed as (IV)
εmeas = 1 − c0
c0 + Δc(1 − εtrue) . (5.19)
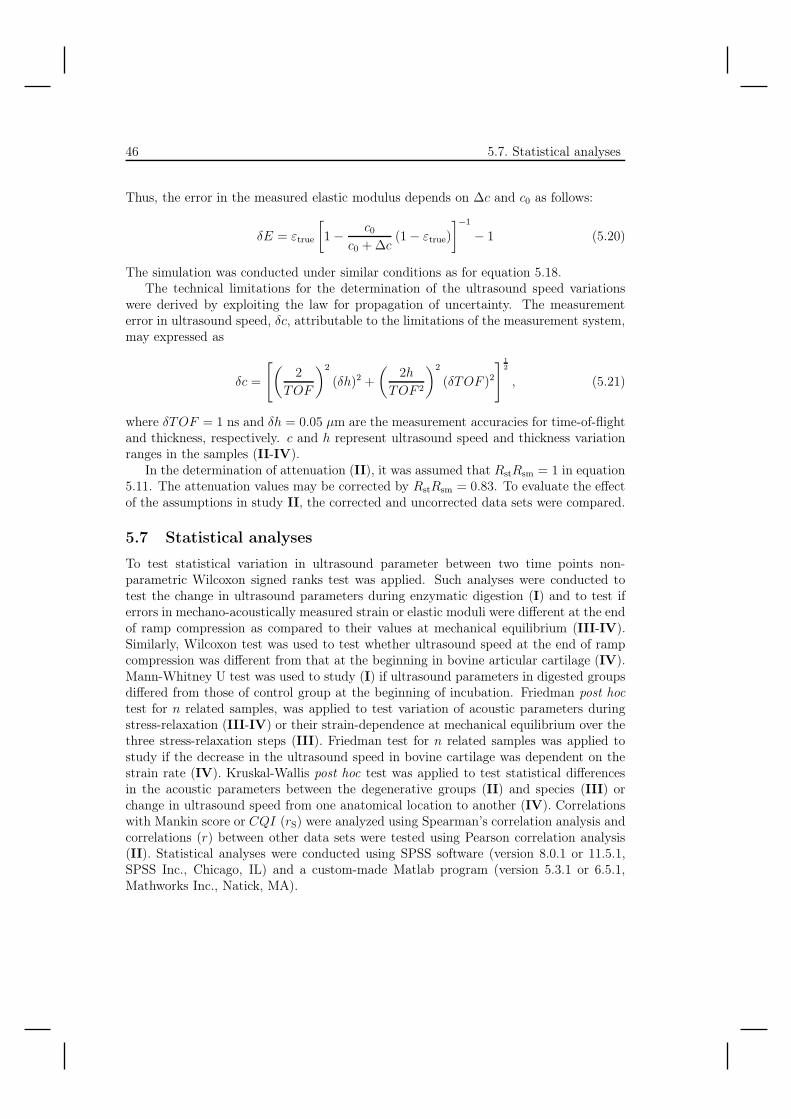
46 5.7. Statistical analyses
Thus, the error in the measured elastic modulus depends on Δc and c0 as follows:
δE = εtrue
[1 − c0
c0 + Δc(1 − εtrue)
]−1
− 1 (5.20)
The simulation was conducted under similar conditions as for equation 5.18.The technical limitations for the determination of the ultrasound speed variations
were derived by exploiting the law for propagation of uncertainty. The measurementerror in ultrasound speed, δc, attributable to the limitations of the measurement system,may expressed as
δc =
[(2
TOF
)2
(δh)2 +
(2h
TOF 2
)2
(δTOF )2
] 12
, (5.21)
where δTOF = 1 ns and δh = 0.05 μm are the measurement accuracies for time-of-flightand thickness, respectively. c and h represent ultrasound speed and thickness variationranges in the samples (II-IV).
In the determination of attenuation (II), it was assumed that RstRsm = 1 in equation5.11. The attenuation values may be corrected by RstRsm = 0.83. To evaluate the effectof the assumptions in study II, the corrected and uncorrected data sets were compared.
5.7 Statistical analyses
To test statistical variation in ultrasound parameter between two time points non-parametric Wilcoxon signed ranks test was applied. Such analyses were conducted totest the change in ultrasound parameters during enzymatic digestion (I) and to test iferrors in mechano-acoustically measured strain or elastic moduli were different at the endof ramp compression as compared to their values at mechanical equilibrium (III-IV).Similarly, Wilcoxon test was used to test whether ultrasound speed at the end of rampcompression was different from that at the beginning in bovine articular cartilage (IV).Mann-Whitney U test was used to study (I) if ultrasound parameters in digested groupsdiffered from those of control group at the beginning of incubation. Friedman post hoctest for n related samples, was applied to test variation of acoustic parameters duringstress-relaxation (III-IV) or their strain-dependence at mechanical equilibrium over thethree stress-relaxation steps (III). Friedman test for n related samples was applied tostudy if the decrease in the ultrasound speed in bovine cartilage was dependent on thestrain rate (IV). Kruskal-Wallis post hoc test was applied to test statistical differencesin the acoustic parameters between the degenerative groups (II) and species (III) orchange in ultrasound speed from one anatomical location to another (IV). Correlationswith Mankin score or CQI (rS) were analyzed using Spearman’s correlation analysis andcorrelations (r) between other data sets were tested using Pearson correlation analysis(II). Statistical analyses were conducted using SPSS software (version 8.0.1 or 11.5.1,SPSS Inc., Chicago, IL) and a custom-made Matlab program (version 5.3.1 or 6.5.1,Mathworks Inc., Natick, MA).
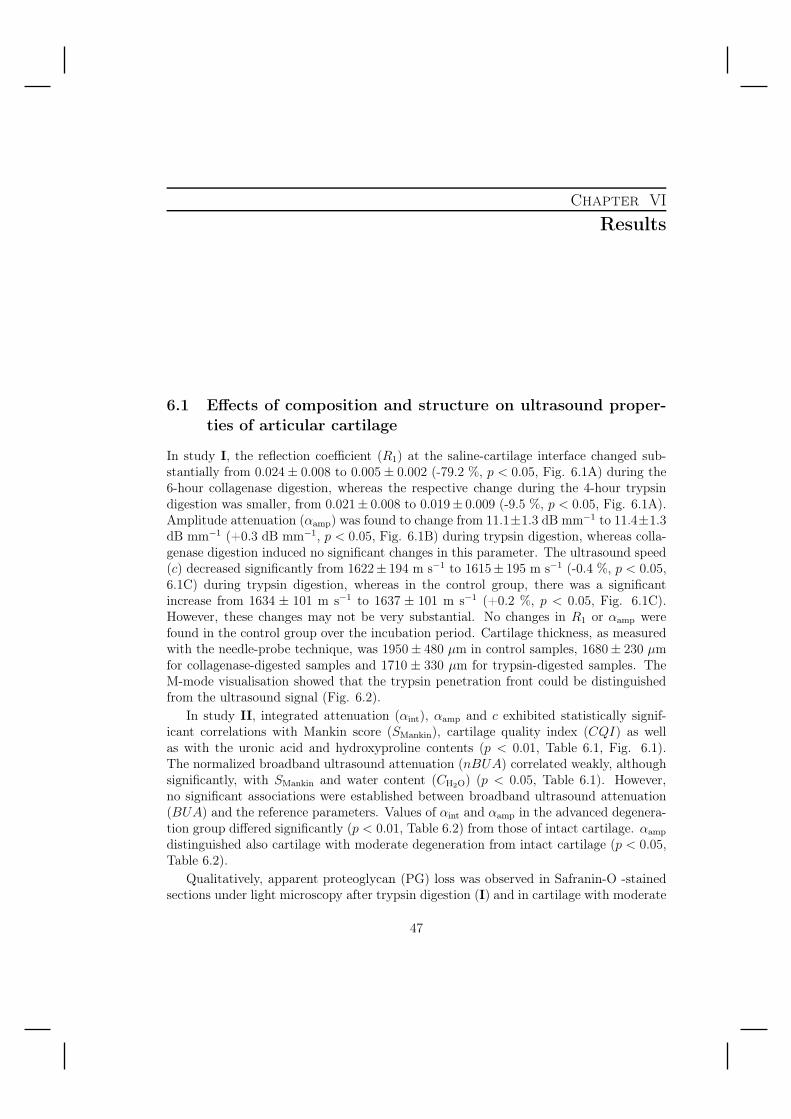
Chapter VIResults
6.1 Effects of composition and structure on ultrasound proper-ties of articular cartilage
In study I, the reflection coefficient (R1) at the saline-cartilage interface changed sub-stantially from 0.024 ± 0.008 to 0.005 ± 0.002 (-79.2 %, p < 0.05, Fig. 6.1A) during the6-hour collagenase digestion, whereas the respective change during the 4-hour trypsindigestion was smaller, from 0.021± 0.008 to 0.019± 0.009 (-9.5 %, p < 0.05, Fig. 6.1A).Amplitude attenuation (αamp) was found to change from 11.1±1.3 dB mm−1 to 11.4±1.3dB mm−1 (+0.3 dB mm−1, p < 0.05, Fig. 6.1B) during trypsin digestion, whereas colla-genase digestion induced no significant changes in this parameter. The ultrasound speed(c) decreased significantly from 1622± 194 m s−1 to 1615± 195 m s−1 (-0.4 %, p < 0.05,6.1C) during trypsin digestion, whereas in the control group, there was a significantincrease from 1634 ± 101 m s−1 to 1637 ± 101 m s−1 (+0.2 %, p < 0.05, Fig. 6.1C).However, these changes may not be very substantial. No changes in R1 or αamp werefound in the control group over the incubation period. Cartilage thickness, as measuredwith the needle-probe technique, was 1950± 480 μm in control samples, 1680± 230 μmfor collagenase-digested samples and 1710 ± 330 μm for trypsin-digested samples. TheM-mode visualisation showed that the trypsin penetration front could be distinguishedfrom the ultrasound signal (Fig. 6.2).
In study II, integrated attenuation (αint), αamp and c exhibited statistically signif-icant correlations with Mankin score (SMankin), cartilage quality index (CQI) as wellas with the uronic acid and hydroxyproline contents (p < 0.01, Table 6.1, Fig. 6.1).The normalized broadband ultrasound attenuation (nBUA) correlated weakly, althoughsignificantly, with SMankin and water content (CH2O) (p < 0.05, Table 6.1). However,no significant associations were established between broadband ultrasound attenuation(BUA) and the reference parameters. Values of αint and αamp in the advanced degenera-tion group differed significantly (p < 0.01, Table 6.2) from those of intact cartilage. αamp
distinguished also cartilage with moderate degeneration from intact cartilage (p < 0.05,Table 6.2).
Qualitatively, apparent proteoglycan (PG) loss was observed in Safranin-O -stainedsections under light microscopy after trypsin digestion (I) and in cartilage with moderate
47
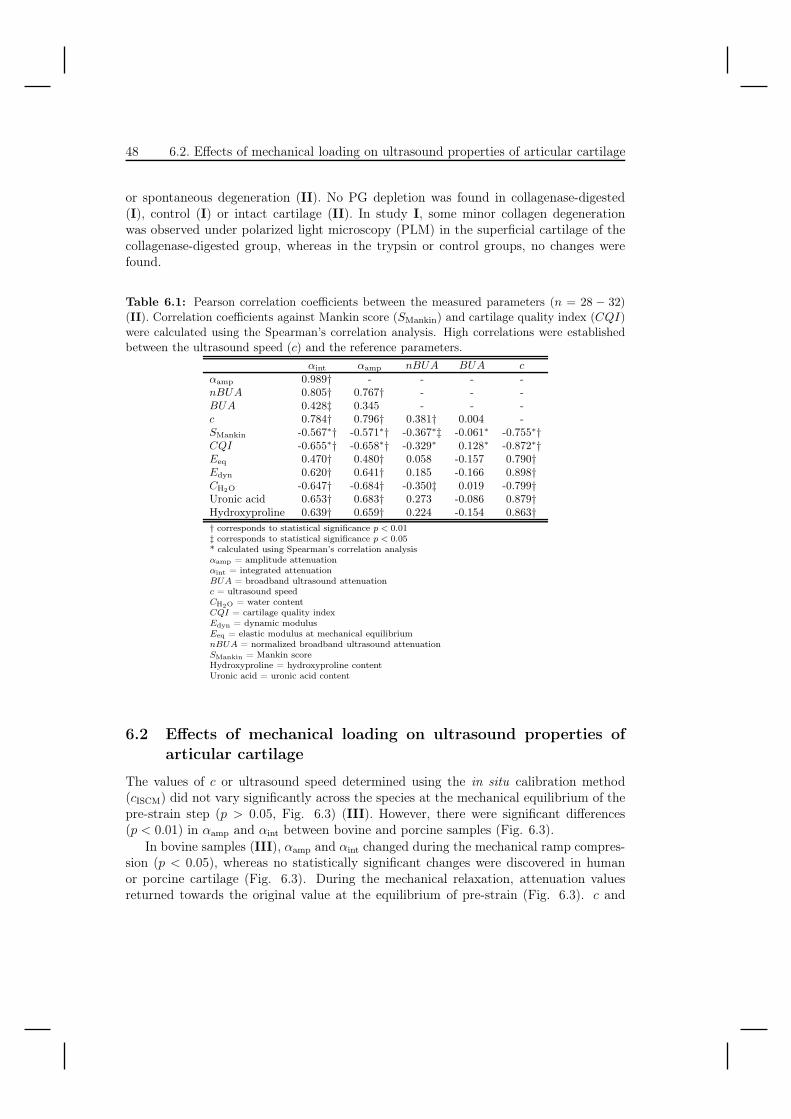
48 6.2. Effects of mechanical loading on ultrasound properties of articular cartilage
or spontaneous degeneration (II). No PG depletion was found in collagenase-digested(I), control (I) or intact cartilage (II). In study I, some minor collagen degenerationwas observed under polarized light microscopy (PLM) in the superficial cartilage of thecollagenase-digested group, whereas in the trypsin or control groups, no changes werefound.
Table 6.1: Pearson correlation coefficients between the measured parameters (n = 28 − 32)(II). Correlation coefficients against Mankin score (SMankin) and cartilage quality index (CQI)were calculated using the Spearman’s correlation analysis. High correlations were establishedbetween the ultrasound speed (c) and the reference parameters.
αint αamp nBUA BUA cαamp 0.989† - - - -nBUA 0.805† 0.767† - - -BUA 0.428‡ 0.345 - - -c 0.784† 0.796† 0.381† 0.004 -SMankin -0.567∗† -0.571∗† -0.367∗‡ -0.061∗ -0.755∗†CQI -0.655∗† -0.658∗† -0.329∗ 0.128∗ -0.872∗†Eeq 0.470† 0.480† 0.058 -0.157 0.790†Edyn 0.620† 0.641† 0.185 -0.166 0.898†CH2O -0.647† -0.684† -0.350‡ 0.019 -0.799†Uronic acid 0.653† 0.683† 0.273 -0.086 0.879†Hydroxyproline 0.639† 0.659† 0.224 -0.154 0.863†† corresponds to statistical significance p < 0.01‡ corresponds to statistical significance p < 0.05* calculated using Spearman’s correlation analysisαamp = amplitude attenuationαint = integrated attenuationBUA = broadband ultrasound attenuationc = ultrasound speedCH2O = water contentCQI = cartilage quality indexEdyn = dynamic modulusEeq = elastic modulus at mechanical equilibriumnBUA = normalized broadband ultrasound attenuationSMankin = Mankin scoreHydroxyproline = hydroxyproline contentUronic acid = uronic acid content
6.2 Effects of mechanical loading on ultrasound properties ofarticular cartilage
The values of c or ultrasound speed determined using the in situ calibration method(cISCM) did not vary significantly across the species at the mechanical equilibrium of thepre-strain step (p > 0.05, Fig. 6.3) (III). However, there were significant differences(p < 0.01) in αamp and αint between bovine and porcine samples (Fig. 6.3).
In bovine samples (III), αamp and αint changed during the mechanical ramp compres-sion (p < 0.05), whereas no statistically significant changes were discovered in humanor porcine cartilage (Fig. 6.3). During the mechanical relaxation, attenuation valuesreturned towards the original value at the equilibrium of pre-strain (Fig. 6.3). c and
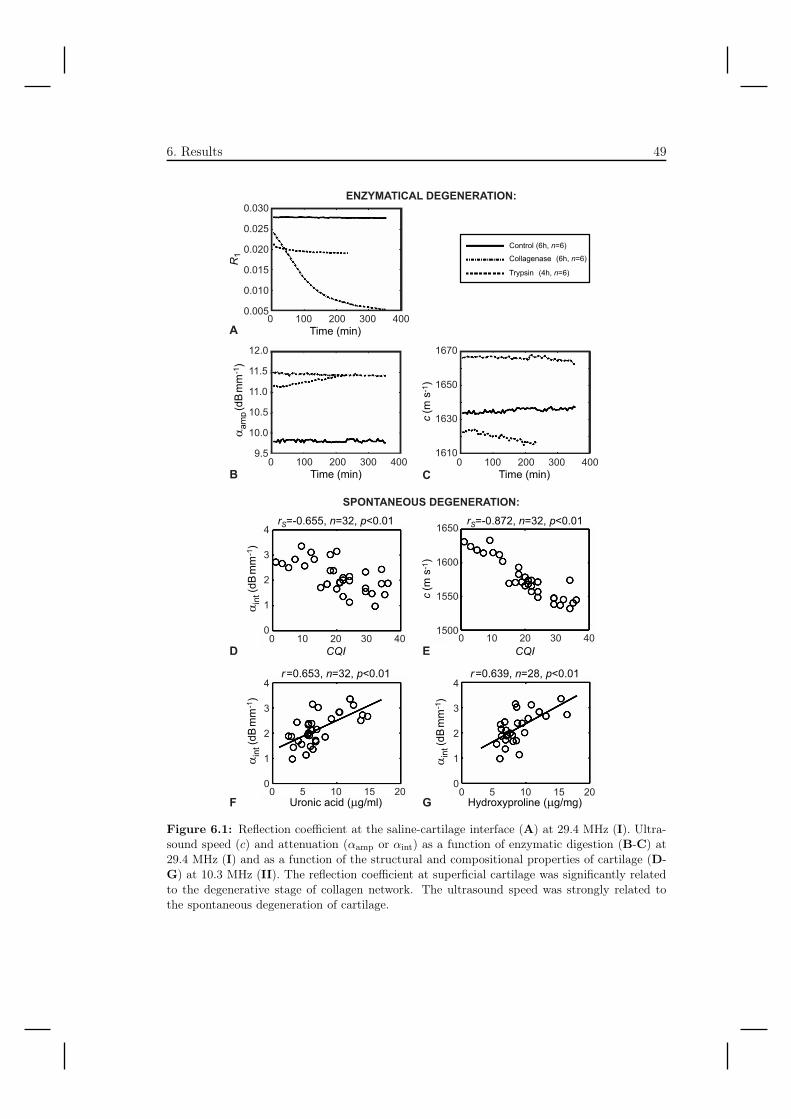
6. Results 49
/�-<��0
%� ���9 �%��9 �=� ��
���
���
�/�&
���
*�0
�%*� ���9 �%��9 �=� ��
/�-<�-0> ���� ����
%� ���9 �%�9 �=� ��
���
�%*
(�� �+�# �����
� �9 �%��9 �=� ��
�� ��������
�����
�������� �
�������
�?����-����� /��9��%�0
4 �#��� /��9��%�0
?��� ���/��9��%�0
���������������������������������������� ����������������������������������������
����������������������������������������� �����������������������������������������
�
�
�
�
�
�
�
�
�
�
�
�
�
�
�
����
����
����
����
�������������������������������������4����/���0
��������������������������������������4����/���0
���
����
����
����
�/�
��*�0
��#
�/�
&��
�*�0
�� �
�� �
�� �
�� �
�� �
� �
��
��
4����/���0��������������������������������������
� ���
� ���
� ���
� ���
� ���
� ���
��
�
� �
� �
��; ����������������<
����������������������<
�/�
��*�0
���
�/�&
���
*�0
���
�/�&
���
*�0
Figure 6.1: Reflection coefficient at the saline-cartilage interface (A) at 29.4 MHz (I). Ultra-sound speed (c) and attenuation (αamp or αint) as a function of enzymatic digestion (B-C) at29.4 MHz (I) and as a function of the structural and compositional properties of cartilage (D-G) at 10.3 MHz (II). The reflection coefficient at superficial cartilage was significantly relatedto the degenerative stage of collagen network. The ultrasound speed was strongly related tothe spontaneous degeneration of cartilage.
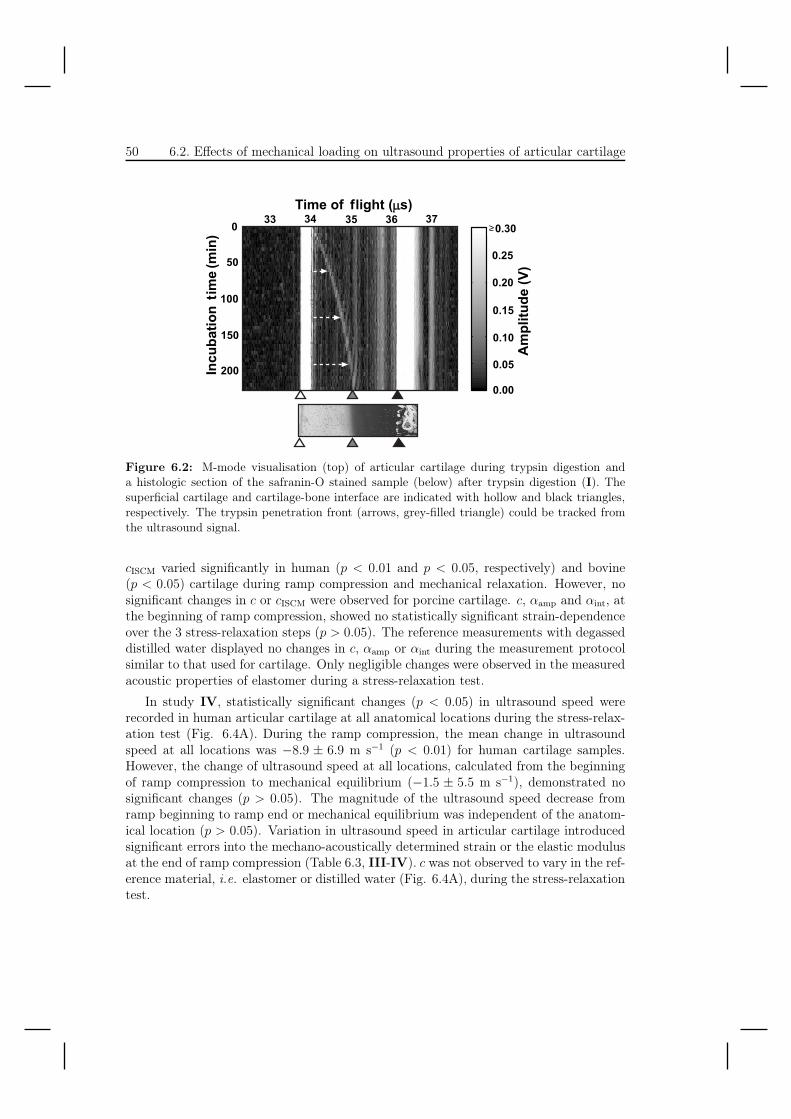
50 6.2. Effects of mechanical loading on ultrasound properties of articular cartilage
Figure 6.2: M-mode visualisation (top) of articular cartilage during trypsin digestion anda histologic section of the safranin-O stained sample (below) after trypsin digestion (I). Thesuperficial cartilage and cartilage-bone interface are indicated with hollow and black triangles,respectively. The trypsin penetration front (arrows, grey-filled triangle) could be tracked fromthe ultrasound signal.
cISCM varied significantly in human (p < 0.01 and p < 0.05, respectively) and bovine(p < 0.05) cartilage during ramp compression and mechanical relaxation. However, nosignificant changes in c or cISCM were observed for porcine cartilage. c, αamp and αint, atthe beginning of ramp compression, showed no statistically significant strain-dependenceover the 3 stress-relaxation steps (p > 0.05). The reference measurements with degasseddistilled water displayed no changes in c, αamp or αint during the measurement protocolsimilar to that used for cartilage. Only negligible changes were observed in the measuredacoustic properties of elastomer during a stress-relaxation test.
In study IV, statistically significant changes (p < 0.05) in ultrasound speed wererecorded in human articular cartilage at all anatomical locations during the stress-relax-ation test (Fig. 6.4A). During the ramp compression, the mean change in ultrasoundspeed at all locations was −8.9 ± 6.9 m s−1 (p < 0.01) for human cartilage samples.However, the change of ultrasound speed at all locations, calculated from the beginningof ramp compression to mechanical equilibrium (−1.5 ± 5.5 m s−1), demonstrated nosignificant changes (p > 0.05). The magnitude of the ultrasound speed decrease fromramp beginning to ramp end or mechanical equilibrium was independent of the anatom-ical location (p > 0.05). Variation in ultrasound speed in articular cartilage introducedsignificant errors into the mechano-acoustically determined strain or the elastic modulusat the end of ramp compression (Table 6.3, III-IV). c was not observed to vary in the ref-erence material, i.e. elastomer or distilled water (Fig. 6.4A), during the stress-relaxationtest.
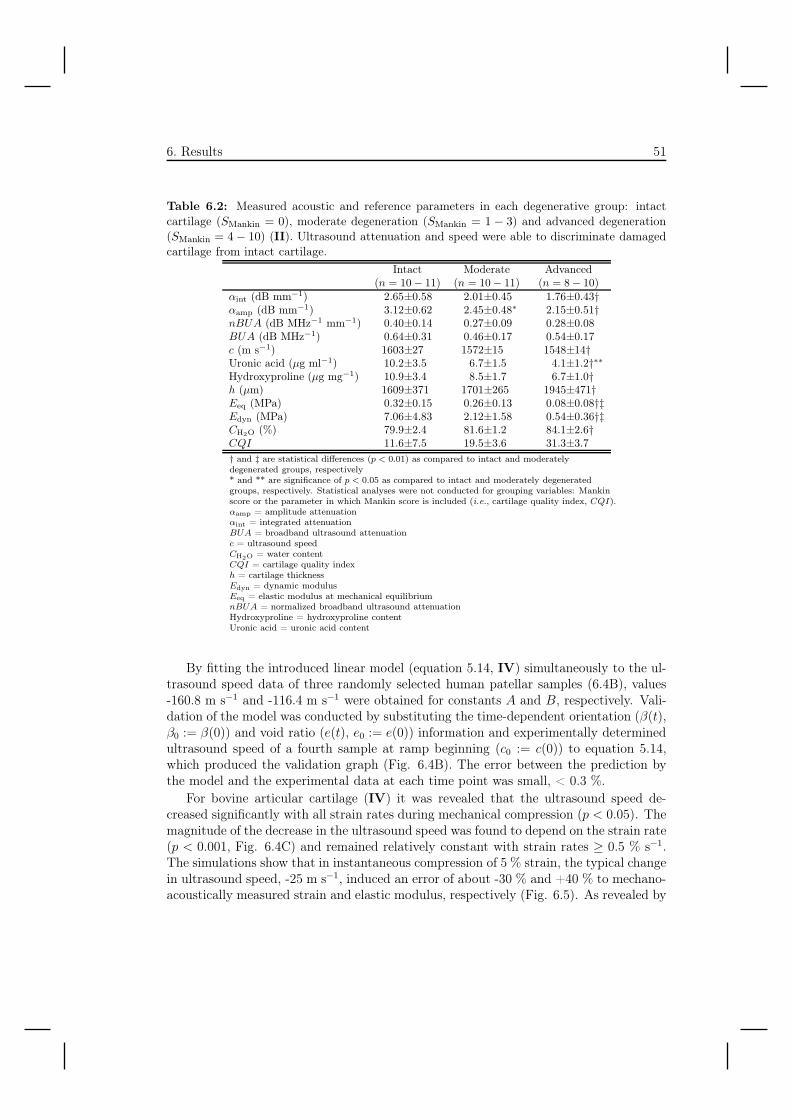
6. Results 51
Table 6.2: Measured acoustic and reference parameters in each degenerative group: intactcartilage (SMankin = 0), moderate degeneration (SMankin = 1 − 3) and advanced degeneration(SMankin = 4 − 10) (II). Ultrasound attenuation and speed were able to discriminate damagedcartilage from intact cartilage.
Intact Moderate Advanced(n = 10 − 11) (n = 10 − 11) (n = 8 − 10)
αint (dB mm−1) 2.65±0.58 2.01±0.45 1.76±0.43†αamp (dB mm−1) 3.12±0.62 2.45±0.48∗ 2.15±0.51†nBUA (dB MHz−1 mm−1) 0.40±0.14 0.27±0.09 0.28±0.08BUA (dB MHz−1) 0.64±0.31 0.46±0.17 0.54±0.17c (m s−1) 1603±27 1572±15 1548±14†Uronic acid (μg ml−1) 10.2±3.5 6.7±1.5 4.1±1.2†∗∗Hydroxyproline (μg mg−1) 10.9±3.4 8.5±1.7 6.7±1.0†h (μm) 1609±371 1701±265 1945±471†Eeq (MPa) 0.32±0.15 0.26±0.13 0.08±0.08†‡Edyn (MPa) 7.06±4.83 2.12±1.58 0.54±0.36†‡CH2O (%) 79.9±2.4 81.6±1.2 84.1±2.6†CQI 11.6±7.5 19.5±3.6 31.3±3.7† and ‡ are statistical differences (p < 0.01) as compared to intact and moderatelydegenerated groups, respectively* and ** are significance of p < 0.05 as compared to intact and moderately degeneratedgroups, respectively. Statistical analyses were not conducted for grouping variables: Mankinscore or the parameter in which Mankin score is included (i.e., cartilage quality index, CQI).αamp = amplitude attenuationαint = integrated attenuationBUA = broadband ultrasound attenuationc = ultrasound speedCH2O = water contentCQI = cartilage quality indexh = cartilage thicknessEdyn = dynamic modulusEeq = elastic modulus at mechanical equilibriumnBUA = normalized broadband ultrasound attenuationHydroxyproline = hydroxyproline contentUronic acid = uronic acid content
By fitting the introduced linear model (equation 5.14, IV) simultaneously to the ul-trasound speed data of three randomly selected human patellar samples (6.4B), values-160.8 m s−1 and -116.4 m s−1 were obtained for constants A and B, respectively. Vali-dation of the model was conducted by substituting the time-dependent orientation (β(t),β0 := β(0)) and void ratio (e(t), e0 := e(0)) information and experimentally determinedultrasound speed of a fourth sample at ramp beginning (c0 := c(0)) to equation 5.14,which produced the validation graph (Fig. 6.4B). The error between the prediction bythe model and the experimental data at each time point was small, < 0.3 %.
For bovine articular cartilage (IV) it was revealed that the ultrasound speed de-creased significantly with all strain rates during mechanical compression (p < 0.05). Themagnitude of the decrease in the ultrasound speed was found to depend on the strain rate(p < 0.001, Fig. 6.4C) and remained relatively constant with strain rates ≥ 0.5 % s−1.The simulations show that in instantaneous compression of 5 % strain, the typical changein ultrasound speed, -25 m s−1, induced an error of about -30 % and +40 % to mechano-acoustically measured strain and elastic modulus, respectively (Fig. 6.5). As revealed by
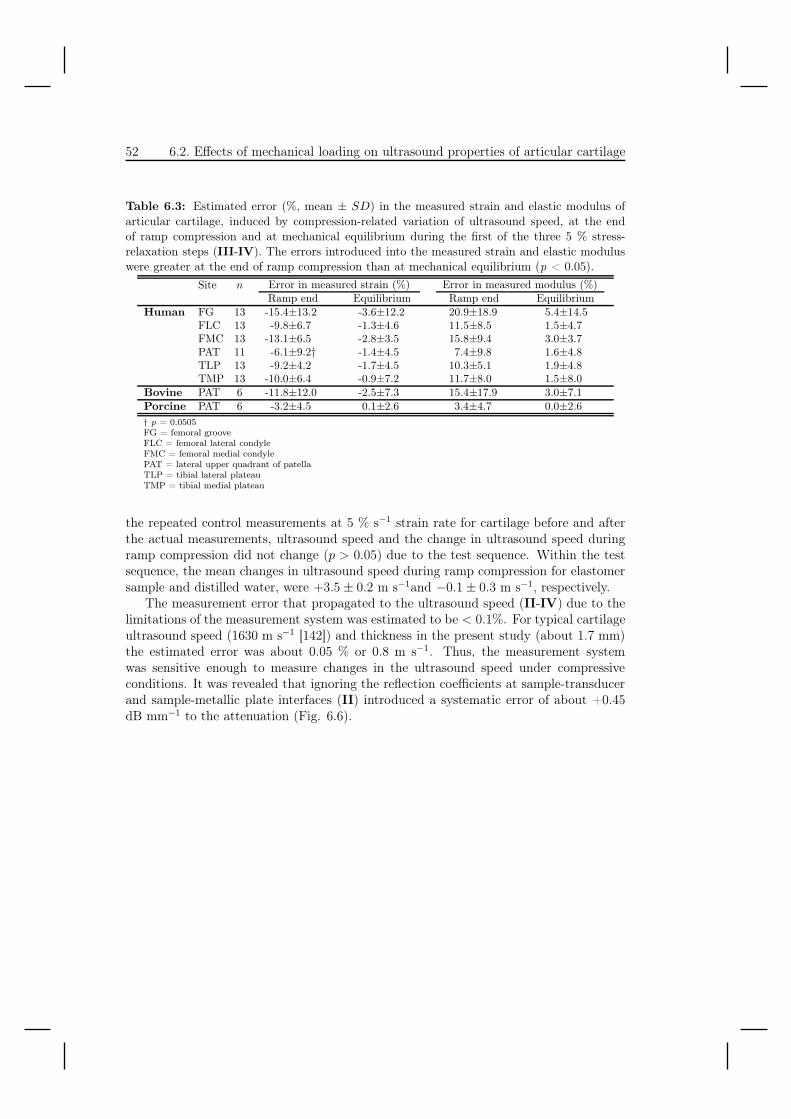
52 6.2. Effects of mechanical loading on ultrasound properties of articular cartilage
Table 6.3: Estimated error (%, mean ± SD) in the measured strain and elastic modulus ofarticular cartilage, induced by compression-related variation of ultrasound speed, at the endof ramp compression and at mechanical equilibrium during the first of the three 5 % stress-relaxation steps (III-IV). The errors introduced into the measured strain and elastic moduluswere greater at the end of ramp compression than at mechanical equilibrium (p < 0.05).
Site n Error in measured strain (%) Error in measured modulus (%)Ramp end Equilibrium Ramp end Equilibrium
Human FG 13 -15.4±13.2 -3.6±12.2 20.9±18.9 5.4±14.5FLC 13 -9.8±6.7 -1.3±4.6 11.5±8.5 1.5±4.7FMC 13 -13.1±6.5 -2.8±3.5 15.8±9.4 3.0±3.7PAT 11 -6.1±9.2† -1.4±4.5 7.4±9.8 1.6±4.8TLP 13 -9.2±4.2 -1.7±4.5 10.3±5.1 1.9±4.8TMP 13 -10.0±6.4 -0.9±7.2 11.7±8.0 1.5±8.0
Bovine PAT 6 -11.8±12.0 -2.5±7.3 15.4±17.9 3.0±7.1Porcine PAT 6 -3.2±4.5 0.1±2.6 3.4±4.7 0.0±2.6† p = 0.0505FG = femoral grooveFLC = femoral lateral condyleFMC = femoral medial condylePAT = lateral upper quadrant of patellaTLP = tibial lateral plateauTMP = tibial medial plateau
the repeated control measurements at 5 % s−1 strain rate for cartilage before and afterthe actual measurements, ultrasound speed and the change in ultrasound speed duringramp compression did not change (p > 0.05) due to the test sequence. Within the testsequence, the mean changes in ultrasound speed during ramp compression for elastomersample and distilled water, were +3.5 ± 0.2 m s−1and −0.1 ± 0.3 m s−1, respectively.
The measurement error that propagated to the ultrasound speed (II-IV) due to thelimitations of the measurement system was estimated to be < 0.1%. For typical cartilageultrasound speed (1630 m s−1 [142]) and thickness in the present study (about 1.7 mm)the estimated error was about 0.05 % or 0.8 m s−1. Thus, the measurement systemwas sensitive enough to measure changes in the ultrasound speed under compressiveconditions. It was revealed that ignoring the reflection coefficients at sample-transducerand sample-metallic plate interfaces (II) introduced a systematic error of about +0.45dB mm−1 to the attenuation (Fig. 6.6).
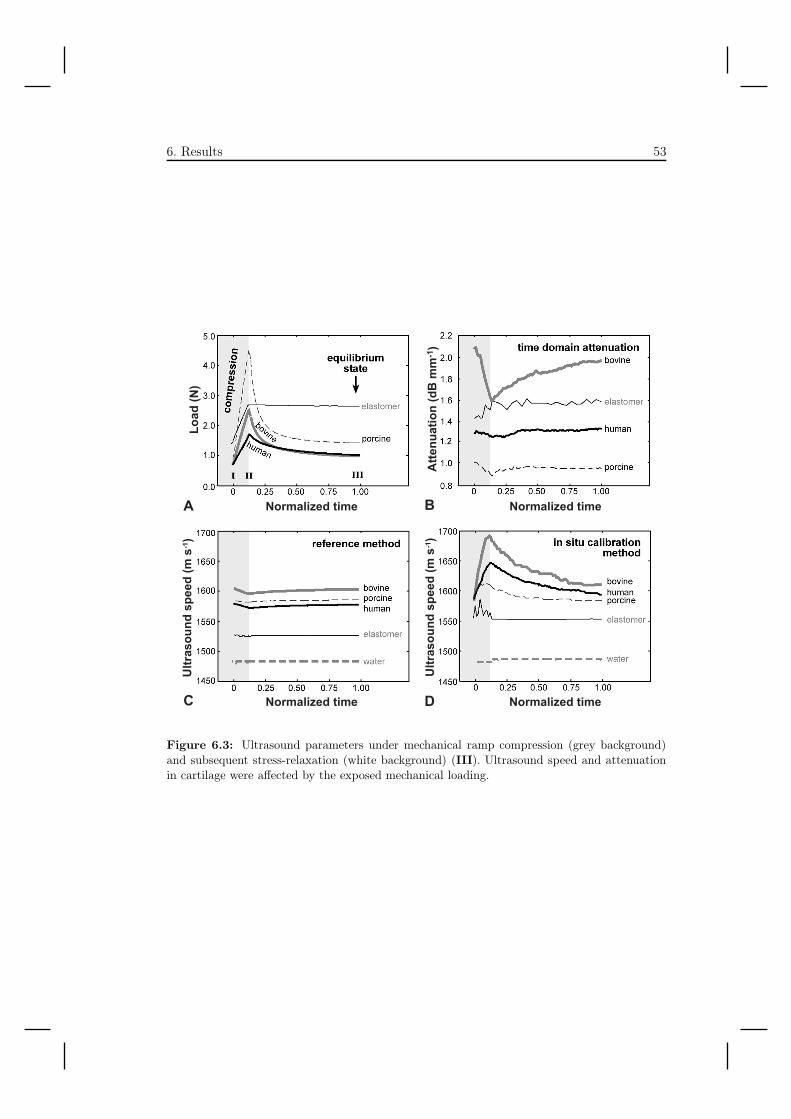
6. Results 53
Figure 6.3: Ultrasound parameters under mechanical ramp compression (grey background)and subsequent stress-relaxation (white background) (III). Ultrasound speed and attenuationin cartilage were affected by the exposed mechanical loading.
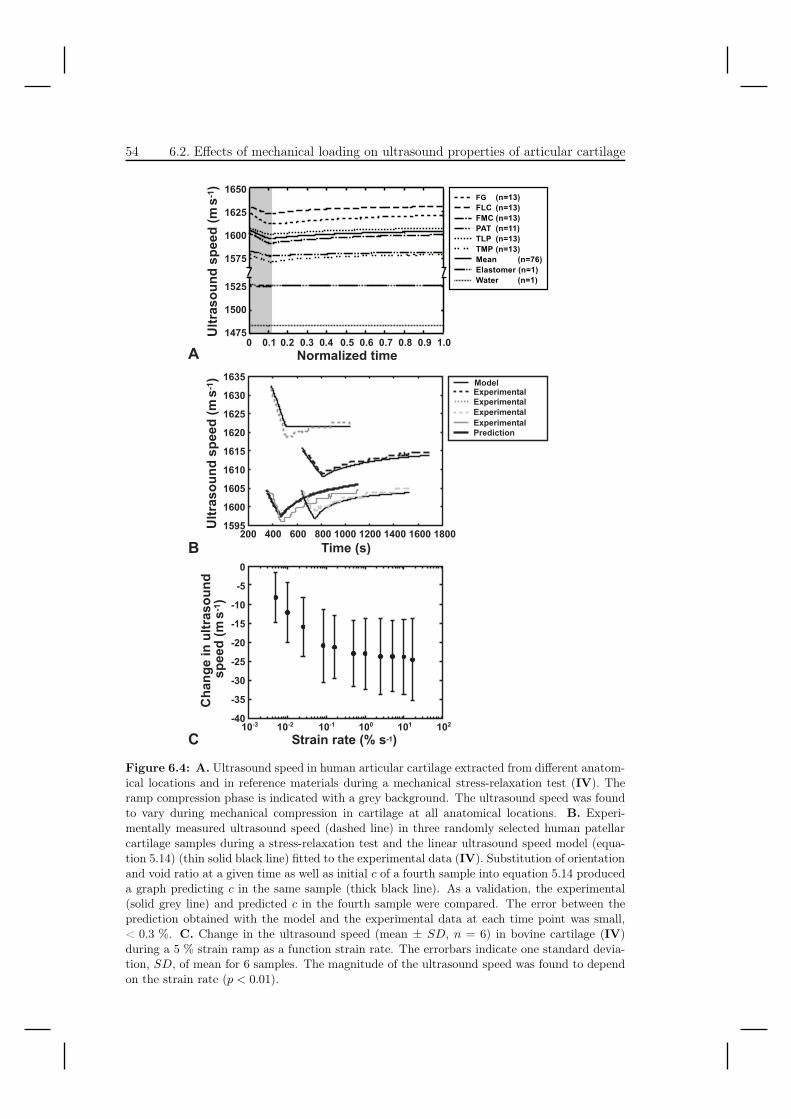
54 6.2. Effects of mechanical loading on ultrasound properties of articular cartilage
'+1= '+1' '++ '+'
+
1>
1'+
1'>
1=+
1=>
1?+
1?>
12+
�#!" ��!"#��&@��1'-'+='+1?
6
"��
�� �
���#
!"��
��
���
,��
��&
���
1'-
��#
!"��
��
���
,��
��&
���
1'-
��!�"� 7���# ��
'.>+
'.=>
'.++
'>A>
'>=>
'>++
'2A>+����+B'��+B=���+B?��+B2���+B>��+B.��+BA��+BC��+B/��'B+
=++���2++���.++���C++�'+++�'=++�'2++�'.++�'C++� ���&�-
'.?>
'.?+
'.=>
'.=+
'.'>
'.'+
'.+>
'.++
'>/>
������9,�! ���#"��9,�! ���#"��9,�! ���#"��9,�! ���#"��!�� $# ��
��#
!"��
��
���
,��
��&
���
1'-
�
Figure 6.4: A. Ultrasound speed in human articular cartilage extracted from different anatom-ical locations and in reference materials during a mechanical stress-relaxation test (IV). Theramp compression phase is indicated with a grey background. The ultrasound speed was foundto vary during mechanical compression in cartilage at all anatomical locations. B. Experi-mentally measured ultrasound speed (dashed line) in three randomly selected human patellarcartilage samples during a stress-relaxation test and the linear ultrasound speed model (equa-tion 5.14) (thin solid black line) fitted to the experimental data (IV). Substitution of orientationand void ratio at a given time as well as initial c of a fourth sample into equation 5.14 produceda graph predicting c in the same sample (thick black line). As a validation, the experimental(solid grey line) and predicted c in the fourth sample were compared. The error between theprediction obtained with the model and the experimental data at each time point was small,< 0.3 %. C. Change in the ultrasound speed (mean ± SD, n = 6) in bovine cartilage (IV)during a 5 % strain ramp as a function strain rate. The errorbars indicate one standard devia-tion, SD, of mean for 6 samples. The magnitude of the ultrasound speed was found to dependon the strain rate (p < 0.01).
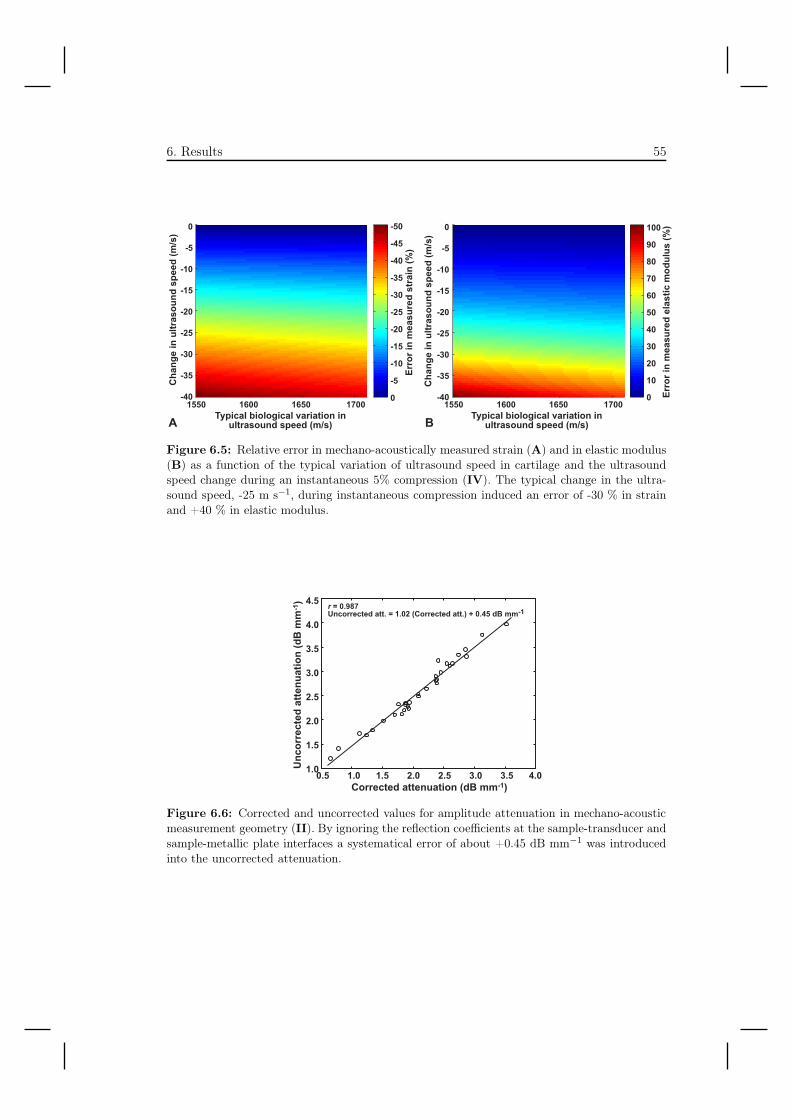
6. Results 55
Figure 6.5: Relative error in mechano-acoustically measured strain (A) and in elastic modulus(B) as a function of the typical variation of ultrasound speed in cartilage and the ultrasoundspeed change during an instantaneous 5% compression (IV). The typical change in the ultra-sound speed, -25 m s−1, during instantaneous compression induced an error of -30 % in strainand +40 % in elastic modulus.
�!!�$#���"##���"# ���&�����1'-
��
$�!!
�$#�
��"
##��
�"#
��
�&�
���
�1'
-
+B>�������'B+������'B>�������=B+�������=B>�������?B+�������?B>������2B+
2B>
2B+
?B>
?B+
=B>
=B+
'B>
'B+
��(�+B/CA��$�!!�$#���"##B�(�'B+=�&�!!�$#���"##B-�D�+B2>������1'
Figure 6.6: Corrected and uncorrected values for amplitude attenuation in mechano-acousticmeasurement geometry (II). By ignoring the reflection coefficients at the sample-transducer andsample-metallic plate interfaces a systematical error of about +0.45 dB mm−1 was introducedinto the uncorrected attenuation.

56 6.2. Effects of mechanical loading on ultrasound properties of articular cartilage
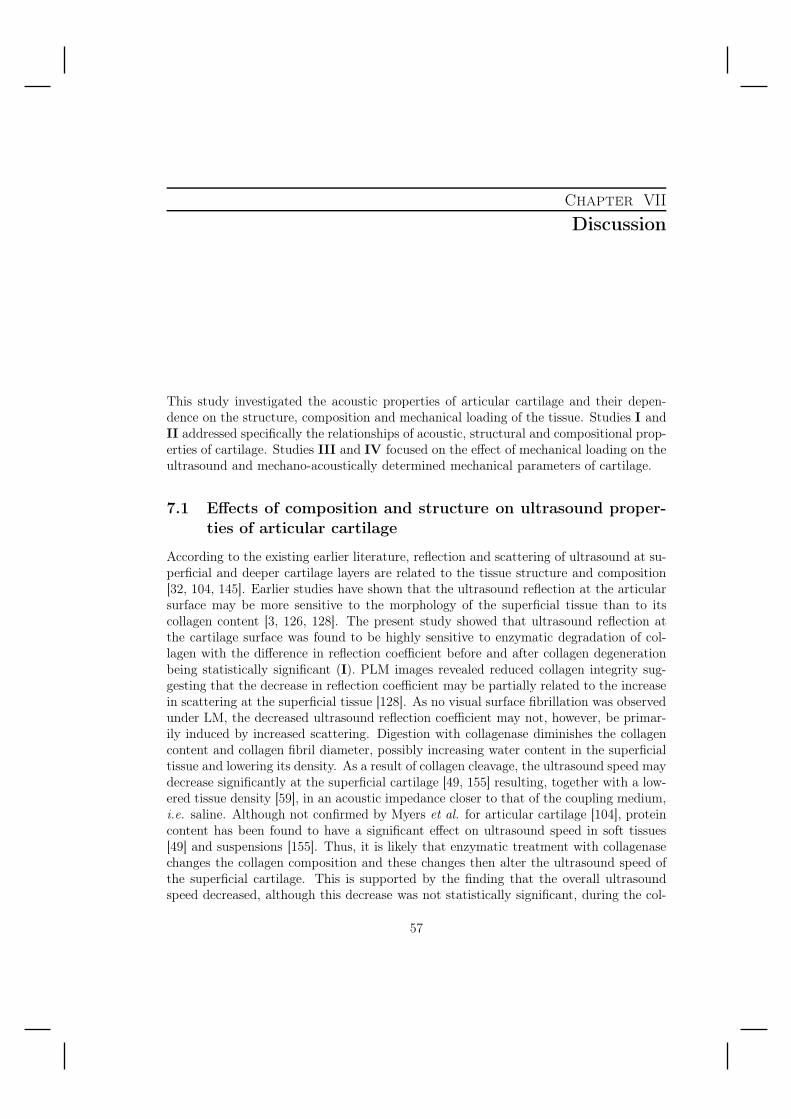
Chapter VIIDiscussion
This study investigated the acoustic properties of articular cartilage and their depen-dence on the structure, composition and mechanical loading of the tissue. Studies I andII addressed specifically the relationships of acoustic, structural and compositional prop-erties of cartilage. Studies III and IV focused on the effect of mechanical loading on theultrasound and mechano-acoustically determined mechanical parameters of cartilage.
7.1 Effects of composition and structure on ultrasound proper-ties of articular cartilage
According to the existing earlier literature, reflection and scattering of ultrasound at su-perficial and deeper cartilage layers are related to the tissue structure and composition[32, 104, 145]. Earlier studies have shown that the ultrasound reflection at the articularsurface may be more sensitive to the morphology of the superficial tissue than to itscollagen content [3, 126, 128]. The present study showed that ultrasound reflection atthe cartilage surface was found to be highly sensitive to enzymatic degradation of col-lagen with the difference in reflection coefficient before and after collagen degenerationbeing statistically significant (I). PLM images revealed reduced collagen integrity sug-gesting that the decrease in reflection coefficient may be partially related to the increasein scattering at the superficial tissue [128]. As no visual surface fibrillation was observedunder LM, the decreased ultrasound reflection coefficient may not, however, be primar-ily induced by increased scattering. Digestion with collagenase diminishes the collagencontent and collagen fibril diameter, possibly increasing water content in the superficialtissue and lowering its density. As a result of collagen cleavage, the ultrasound speed maydecrease significantly at the superficial cartilage [49, 155] resulting, together with a low-ered tissue density [59], in an acoustic impedance closer to that of the coupling medium,i.e. saline. Although not confirmed by Myers et al. for articular cartilage [104], proteincontent has been found to have a significant effect on ultrasound speed in soft tissues[49] and suspensions [155]. Thus, it is likely that enzymatic treatment with collagenasechanges the collagen composition and these changes then alter the ultrasound speed ofthe superficial cartilage. This is supported by the finding that the overall ultrasoundspeed decreased, although this decrease was not statistically significant, during the col-
57
58 Effects of composition and structure on ultrasound properties of articular cartilage
lagen degeneration test (-4 m s−1, -0.2 %). Since the effect of collagenase during the6-hour digestion was confined to the superficial cartilage, the changes in acoustic prop-erties were restricted to only the superficial tissue. This may have only a small effecton the average ultrasound speed through the cartilage thickness, but a more significanteffect on the acoustic impedance and, furthermore, a greater impact on the reflectioncoefficient at cartilage surface.
A small decrease in the reflection coefficient at the superficial cartilage was observedduring the trypsin digestion. The decrease in the reflection coefficient may not be ex-plained by the cleavage of PGs, but by the minor collagen degradation [50] that canbe induced by trypsin. Since superficial cartilage is poor in PGs, cleavage of PGs maynot affect the acoustic impedance of the cartilage surface significantly and, thus, maynot determine the reflective properties of cartilage at the cartilage-saline interface to thesame extent as changes in collagen. Trypsin induced a higher decrease in ultrasoundspeed (p < 0.05, -7 m s−1, -0.4 %) than collagenase. The effect of trypsin digestion onultrasound speed may be more impressive due to the effective cleavage of PGs: trypsindigestion occurred at over 50 % of the total cartilage thickness, whereas collagenase diges-tion was confined only to the superficial tissue. The association of collagen degenerationand ultrasound reflection at the superficial cartilage is in agreement with earlier studies[3, 32, 128, 145], in which ultrasound reflection has been related to the morphologicaland compositional changes, typical of osteoarthrosis. Thus, measurement of ultrasoundreflection coefficient has clear diagnostic potential since it can reveal the integrity ofarticular surface.
Ultrasound speed was found to strongly relate to the composition of the tissue inosteoarthrotic cartilage (II). Relatively high correlations were established between ul-trasound speed and the uronic acid, hydroxyproline and water contents. These param-eters are related to compositional changes which are characteristic of osteoarthrosis. Inosteoarthrotic cartilage, PGs are depleted and the collagen architecture becomes dis-rupted, which results in tissue swelling [27, 97] and increase in the water content. Anyincrease in the water content should, according to acoustic mixture laws [5, 41, 133],change the ultrasound speed in cartilage towards that of water, i.e. ultrasound speedshould decrease. These findings are supported by earlier studies suggesting that ul-trasound speed in osteoarthrotic cartilage is lower (1581 ± 148 m s−1) than in normalcartilage (1658±185 m s−1) [104]. However, in that study, the ultrasound speed was notrelated to the uronic acid or hydroxyproline contents. In the present study, ultrasoundspeed was found to relate not only to the compositional parameters, but also to struc-tural integrity, i.e. Mankin score. However, it is not clear if associations of ultrasoundspeed against uronic acid, hydroxyproline and water contents reveal a primary relation,as variation in different components are interconnected via cartilage degeneration.
Although ultrasound speed results are consistent in studies I and II, there are somediscrepancies in the attenuation results. In study I, attenuation increased with time dur-ing the degeneration of PGs, while no significant changes were observed during collagendegradation or control incubation. This is consistent with an earlier investigation [57]where ultrasound attenuation was found to increase after enzymatic degradation of PGs.However in study I, attenuation decreased in parallel with the degenerative process.
7. Discussion 59
Several explanations can be suggested for this discordance. First, the structural andcompositional changes induced enzymatically may be restricted only to the superficialcartilage and differ significantly from those occurring in spontaneous osteoarthrosis [122].Digestive enzymes may induce a highly localized acoustic interface that may reflect ul-trasound [117, 145, 156] and, thus, block part of ultrasound energy from propagating tothe cartilage-bone interface by reflecting or scattering the ultrasound. This explanationis supported by the finding in the M-mode visualisation during trypsin digestion (I), inwhich a new acoustic echo was noted to be induced inside the cartilage. Second, thecollagen architecture may be more profoundly damaged in spontaneous osteoarthrosisinducing significant swelling and a more extensive increase in the water content [97] ascompared to that achieved during superficial enzymatic treatments. This may result infewer scatterers per unit length and subsequently result in smaller attenuation coefficientsin osteoarthrotic cartilage. It is possible that absorption is affected by both, enzymaticand spontaneous degeneration, thereby inducing changes in attenuation. According tothe present results (II), attenuation, if it were possible to be measured accurately, couldprovide clinically useful information on the integrity of cartilage.
The normalized slope of frequency dependency of attenuation, nBUA, was found tocorrelate weakly although significantly (p < 0.05) with Mankin score, cartilage qualityindex and water content (II). However, BUA did not associate with any reference pa-rameter. The slope of attenuation may not be a clinically feasible parameter, at least inthe frequency range used in the present study, due to its poor capability to differentiatedegenerated cartilage from intact tissue.
7.2 Effects of mechanical loading on ultrasound properties ofarticular cartilage
Ultrasound speed (III-IV) and attenuation (III) in bovine and human cartilage variedduring the mechanical stress-relaxation test. The attenuation values decreased underthe ramp compression but became restored to close to the value prior to the rampcompression during mechanical relaxation towards the equilibrium.
The decrease in the ultrasound speed may be explained by the changes in the composi-tion and structure of cartilage. In study III, changes in ultrasound speed were suggestedto be related to the compression-related variations in the collagen architecture. Ultra-sound speed has earlier been found to be higher along than the corresponding speedacross collagen fibrils [48, 88]. During mechanical compression, the collagen orientationchanges to a more horizontal alignment. Thus ultrasound, in the present measurementgeometry (III-IV), propagates more effectively across the collagen fibrils than along thefibrils. In study III, we proposed that orientational changes affect ultrasound speed notonly during ramp compression but also during mechanical equilibration. As revealedby the finite element model (IV), variations in collagen orientation may not explainthe variation in ultrasound speed during mechanical relaxation, during which changes incollagen orientation were found to be small. However, the water content was found tovary significantly. In study IV, we hypothesized that during mechanical relaxation theultrasound speed is affected not only by orientational changes but even more significantly
60 7.2. Effects of mechanical loading on ultrasound properties of articular cartilage
by changes in water content. This explanation is supported by the quantitative findings(IV) that relate variations in collagen orientation and water content to experimentallydetermined ultrasound speed. Compression of cartilage induces water flow, which in-duces a relative increase in the solid matrix content [121]. According to acoustic mixturelaws [5, 41, 133], the ultrasound speed should consequently increase. During instanta-neous loading, cartilage is incompressible, i.e. no significant water flow occurs. Thus,the decrease of ultrasound speed cannot be attributable to changes in the water con-tent. This is in agreement with the explanation suggesting that the collagen orientationcontrols the variation of ultrasound speed during instantaneous loading. The differencebetween the predicted variation of ultrasound speed (IV) and the experimentally deter-mined ultrasound was small at all time points, < 0.3 %. It should be noted that duringmechanical loading of articular cartilage there may be simultaneous changes in severalphysical phenomena, e.g. fluid pressure, solid stress and strain, water flow, temperaturevariation, and these can all affect the ultrasound speed in cartilage. However, their effecton the measured ultrasound speed may be minor compared to those of collagen orien-tation and water content. Agemura et al. [4] concluded that ultrasound speed may behigher across than along collagen fibers, which is in disagreement with the earlier findingsin which the ultrasound speed in the collagen was found to be higher in a direction alongthe fibril than it was across the fibril [48, 88]. Agemura et al. based their explanation onthe depth-wise dependence of the ultrasound speed in articular cartilage and suggestedthat intermolecular cross-linking and depth-wise collagen orientation might control ul-trasound speed. However, they did not speculate about the effect of collagen densityon their findings, which may account for the differences between the conclusions of thedifferent studies. This is supported by the finding that collagen density may dramaticallyaffect the measured ultrasound speed, as protein content has been found to influence theultrasound speed in soft tissues [49].
The detected increase in the ultrasound speed during the relaxation phase is in agree-ment with an earlier study by Zheng et al. [160] in which the ultrasound speed in bovinearticular cartilage was studied under compression in situ. In contrast to the presentstudy, that study [160] revealed ultrasound speed changes to be less than 0.03 % duringthe mechanical ramp compression, whereas our study (III) showed a decrease of about0.6 % in the ultrasound speed in bovine articular cartilage. The results may differ due tothe differences in samples and measurement geometry. In studies III and IV, samples(d = 4 mm) were detached from bone and measurements were conducted under 5 %strain during unconfined compression (in vitro). In contrast, in the study by Zheng etal. samples (d = 6.32 ± 0.08 mm) were attached to bone and a smaller strain (about3.4 %) was used in in situ geometry, resulting in smaller orientational changes in thecollagen architecture.
In the present study, the ultrasound attenuation was affected more sensitively by me-chanical loading in bovine articular cartilage than was determined in human or porcinecartilage. The observed change in ultrasound attenuation during ramp compressionmay be explained by the changes in the cartilage architecture. As the acoustic waveis a moving mechanical disturbance, it is possible that the mechanical and structuralanisotropy also produces acoustic anisotropy. Physically, either absorption and/or scat-
7. Discussion 61
tering of ultrasound decreased during ramp compression, especially in bovine cartilage.The re-arrangement of collagen fibers, known to act as significant scatterers of ultrasound[32, 114, 116], may decrease ultrasound scattering and thus reduce the measured attenu-ation. Although only visually perfect contact at transducer-cartilage and cartilage-metalplate interfaces was accepted, it is not clear if changes in stress can affect scattering,reflection or transmission conditions at these interfaces. However, no trend was foundbetween the peak stresses and the change in attenuation, suggesting that the appliedstress does not primarily control compression-related changes of ultrasound attenuationin this measurement geometry.
In study III, the in situ calibration method (equation 5.8), which assumes that thereis a strain-independent ultrasound speed in the measured material, was used to determinethe ultrasound speed under mechanical compression. As a reference, a direct ultrasoundspeed measurement was also applied (equation 5.7). The in situ calibration method wasfound to be prone to systematic errors due to compression-related change of ultrasoundspeed, especially at the end of ramp compression. However, the measured values at themechanical equilibrium were closer to the values obtained using the direct ultrasoundspeed measurement. In clinical applications, ultrasound speed measurement using the insitu calibration method may be acceptable if measurements are conducted at mechanicalequilibrium. However for practical reasons, ultrasound speed should be measured duringinstantaneous compression. The use of mechanical equilibrium would be impractical asthe mechanical equilibration of the tissue in vivo is time-consuming (may take more thanone hour [93]) and a rigid in vivo measurement system with clamping of the investigatedjoint would be required for precise measurements. Under practical situations, the in situcalibration method may not be accurate enough to differentiate cartilage with advanceddegeneration (II, ultrasound speed: 1548±14 m s−1) from intact cartilage (II, ultrasoundspeed: 1603 ± 27 m s−1).
The dependence of ultrasound speed on cartilage compression, determined using thein situ calibration method, was opposite to that determined using the direct measure-ment (III). This discrepancy is related to the differential nature of the in situ calibrationmeasurement and to the assumption that the ultrasound speed remains constant dur-ing compression. If the ultrasound speed is not dependent on compression, then themethod yields correct speed values. However, if the ultrasound speed changes, then thetime-of-flight after compression is affected and the difference in time-of-flight, due tocompression, is subjected to uncertainty (equation 5.8). Thus, a decrease in the ultra-sound speed results in smaller time-of-flight difference and, consequently, to the observedincrease of ultrasound speed, as determined using in situ calibration method. As calcu-lation of strain is based on a differential measurement, a similar problem applies to thestrain estimation. If the ultrasound speed is not dependent on compression, the strainmay be successfully determined by dividing the time-of-flight change due to compres-sion by the time-of-flight through the sample prior to compression (Appendix, III-IV).This does not depend on the absolute ultrasound speed within the sample. However, ifultrasound speed changes, e.g. decreases, the difference in time-of-flight, due to com-pression, is unexpectedly small, resulting in underestimated deformation and, therefore,underestimated strain.
62 7.2. Effects of mechanical loading on ultrasound properties of articular cartilage
Studies III and IV revealed that mechano-acoustic techniques depend critically onthe constancy of the ultrasound speed under mechanical loading. At the end of rampcompression at a low strain rate, the compression-related variation of ultrasound speedin human, bovine or porcine cartilage was found to induce significant errors in the de-termined strain or elastic modulus where a constant ultrasound speed was assumed.However, the errors were smaller at mechanical equilibrium. Simulations (equations 5.19and 5.20, IV) revealed that a typical decrease in ultrasound speed, -25 m s−1, underinstant compression (IV) may result in an error of about -30 % and +40 % in mechano-acoustically measured strain and elastic modulus, respectively (Fig. 6.5). In the worstcase scenario, the errors in measured strain and elastic modulus can be even higher, about-50 % and +100 %, respectively. This poses a demanding challenge for mechano-acousticor elastographic measurements of elastic properties along the axis of compression, espe-cially under a high rate compression. As softening of cartilage is related to the earlydegenerative changes [11, 27, 45], a depth-wise elastographic characterization of tissuestrains and elastic modulus could provide clinically invaluable information on the de-generative status of the tissue. However, cartilage exhibits a depth-wise variation in itsstructure, composition [25, 26] and mechanical competence [61, 80, 91]. The ultrasoundspeed and attenuation have been shown to vary in a depth-wise manner [4, 113]. There-fore it is possible that compression-related variation of ultrasound speed may behavedifferently at different depths of cartilage. The applied strain may also depend on theapplied strain. Nevertheless, it is possible that these issues do not preclude the clinicaluse of mechano-acoustic indentation techniques as these methods have been shown tosensitively distinguish between healthy and degenerated tissue [80]. A method to elim-inate compression-induced errors in measured elastic properties of articular cartilageneeds to be devised.
The reader should recall that the measured ultrasound speed and attenuation pa-rameters in studies I-IV are mean values in full thickness cartilage. The results onattenuation and reflection coefficient (I-III) may be clearly related to the frequency inuse in the measurements. However, the effect of frequency on ultrasound speed may beminor. It should be noted that a variation in the ultrasound speed under mechanicalcompression may also depend on the measurement protocol, e.g. applied strain, andgeometry, i.e. ultrasound speed may vary differently under in situ or in vivo (inden-tation) loading as compared to the in vitro (unconfined) geometry used in the presentstudy. The error analysis, using the principle for propagation of uncertainty, revealedthat the small error in the measured ultrasound speed (< 0.1 %), due to the techni-cal limitations of the system, does permit acceptable accuracy for determination of thechanges in ultrasound speed. In study II, the reflection coefficients (= 1, i.e. perfectreflection) at sample-transducer and sample-metallic plate interfaces may introduce asystematic error into the measured absolute attenuation values. However, this may notaffect the interpretation of the results of study II. It should be noted that the amount ofsamples in studies I-IV was limited and the measurements were conducted in laboratorycircumstances.
Further studies should be conducted to reveal how substantial are the relations be-tween measured acoustic parameters and cartilage structure and composition in vivo.
7. Discussion 63
The effect of selected measurement protocol, geometry or ultrasound frequency on theserelations also needs attention. As indentation geometry is at present the only in vivofeasible geometry which can be used for the determination of cartilage mechanical param-eters, it is important to determine whether compression-related changes in ultrasoundspeed take place in vivo and if they significantly affect the mechano-acoustically deter-mined mechanical parameters of articular cartilage.

64 7.2. Effects of mechanical loading on ultrasound properties of articular cartilage
Chapter VIIISummary and conclusions
Ultrasound techniques provide unique possibilities to characterize the integrity of ar-ticular cartilage and may provide tools for clinical diagnostics of early osteoarthrosis.Mechano-acoustic determination of mechanical properties of cartilage, however, may beaffected by compression-related changes in the ultrasound speed during mechanical in-dentation. The most important findings of this thesis may summarized as follows:
• The reflection coefficient at cartilage surface is strongly related to the integrity ofthe superficial collagen network. The reflection coefficient may provide a usefulparameter for clinical use as the measurement of absolute values of this parameteris technically straightforward.
• Ultrasound speed and attenuation are significantly related to structure, compo-sition and the degenerative stage of the tissue and, therefore, may be clinicallyfeasible for use in the diagnostics of osteoarthrosis. However, in vivo measurementof absolute values may be more challenging.
• Broadband ultrasound attenuation or normalized broadband ultrasound attenua-tion may not suitable for clinical use and the measurement of absolute values ischallenging.
• The ultrasound speed in articular cartilage is affected by the mechanical com-pression of the tissue. The results of the present study suggest that variation inultrasound speed is controlled by collagen orientation during instantaneous com-pression and also by the water content and collagen orientation during mechanicalrelaxation and at equilibrium.
• The ultrasound speed, as determined using the in situ calibration method, is atpresent, the only available method for measuring the ultrasound speed in articularcartilage bonded to underlying bone. However, the method is prone to errors thatare induced by the compression-related changes in the ultrasound speed of articularcartilage during mechanical compression.
65
66
• The assumption that there is a constant ultrasound speed during mechanical com-pression may impair the accuracy of the mechano-acoustic measurements of carti-lage mechanical properties.
To conclude, the ultrasound properties of articular cartilage are significantly andspecifically related to tissue composition and structure as well as to mechanical loading.Ultrasound may hold clinical potential for revealing the changes typically encounteredin early osteoarthrosis. However, before arthroscopic ultrasound techniques can be suc-cessfully applied in the clinic, several technical challenges will have to be resolved.
References
1. C. Adam, F. Eckstein, S. Milz, E. Schulte, C. Becker, and R. Putz. The distributionof cartilage thickness in the knee-joints of old-aged individuals-measurement by A-mode ultrasound. Clin Biomech, 13(1):1–10, 1998.
2. M. E. Adams and C. J. Wallace. Quantitative imaging of osteoarthritis. SeminArthritis Rheum, 20(6 Suppl 2):26–39, 1991.
3. R. S. Adler, D. K. Dedrick, T. J. Laing, E. H. Chiang, C. R. Meyer, P. H. Bland, andJ. M. Rubin. Quantitative assessment of cartilage surface roughness in osteoarthritisusing high frequency ultrasound. Ultrasound Med Biol, 18(1):51–58, 1992.
4. D. H. Agemura, Jr. O’Brien, W. D., J. E. Olerud, L. E. Chun, and D. E. Eyre.Ultrasonic propagation properties of articular cartilage at 100 MHz. J Acoust SocAm, 87(4):1786–1791, 1990.
5. R. E. Apfel. Prediction of tissue composition from ultrasonic measurements andmixture rules. J Acoust Soc Am, 79(1):148–152, 1986.
6. R. C. Appleyard, D. Burkhardt, P. Ghosh, R. Read, M Cake, M. V. Swain, and G. A.Murrell. Topographical analysis of the structural, biochemical and dynamic biome-chanical properties of cartilage in an ovine model of osteoarthritis. OsteoarthritisCartilage, 11:65–77, 2003.
7. R. C. Appleyard, M. V. Swain, S. Khanna, and G. A. Murrell. The accuracy andreliability of a novel handheld dynamic indentation probe for analysing articularcartilage. Phys Med Biol, 46(2):541–550., 2001.
8. C. G. Armstrong and V. C. Mow. Variations in the intrinsic mechanical propertiesof human articular cartilage with age, degeneration, and water content. J BoneJoint Surg Am, 64(1):88–94, 1982.
9. J. P. Arokoski, M. M. Hyttinen, H. J. Helminen, and J. S. Jurvelin. Biomechanicaland structural characteristics of canine femoral and tibial cartilage. J Biomed MaterRes, 48(2):99–107, 1999.
67
68
10. J. P. Arokoski, M. M. Hyttinen, T. Lapveteläinen, P. Takacs, B. Kosztaczky,L. Modis, V. Kovanen, and H. Helminen. Decreased birefringence of the super-ficial zone collagen network in the canine knee (stifle) articular cartilage after longdistance running training, detected by quantitative polarised light microscopy. AnnRheum Dis, 55(4):253–264, 1996.
11. J. P. Arokoski, J. S. Jurvelin, U. Väätäinen, and H. J. Helminen. Normal andpathological adaptations of articular cartilage to joint loading. Scand J Med SciSports, 10(4):186–198, 2000.
12. G. A. Ateshian, L. J. Soslowsky, and V. C. Mow. Quantitation of articular surfacetopography and cartilage thickness in knee joints using stereophotogrammetry. JBiomech, 24(8):761–776, 1991.
13. K. A. Athanasiou, A. Agarwal, A. Muffoletto, F. J. Dzida, G. Constantinides, andM. Clem. Biomechanical properties of hip cartilage in experimental animal models.Clin Orthop, (316):254–266, 1995.
14. K. A. Athanasiou, G. Constantinides, and D. R. Lanctot. Articular cartilage eval-uator and method for using the same. United States Patent, page 5673 5708, 1995.
15. A. Benninghoff. Form und bau der gelenkknorpel in ihren beziehungen zur funktion.erste mitteilung: die modellierenden und formerhaltenden faktoren des knorpelre-liefs. Z Anat, 76:43–63, 1925.
16. S. I. Berkenblit, E. H. Frank, E. P. Salant, and A. J. Grodzinsky. Nondestructivedetection of cartilage degeneration using electromechanical surface spectroscopy. JBiomech Eng, 116(4):384–392, 1994.
17. G.P. Berry, J.C. Bamber, N.R. Miller, C.G. Armstrong, and P.E. Barbone. Towardsan acoustic model-based poroelastic imaging method: I. theoretical foundation.Ultrasound Med Biol, 32(4):547–567, 2006.
18. G.P. Berry, J.C. Bamber, N.R. Miller, P.E. Barbone, N.L. Bush, and C.G. Arm-strong. Towards an acoustic model-based poroelastic imaging method: II. experi-mental investigation. Ultrasound Med Biol, 32(12):1869–1885, 2006.
19. F.J. Blanco, R. Guitian, E. Vaguez-Martul, F.J. de Toro, and F. Galdo. Osteoarthri-tis chondrocytes die by apoptosis. Arthritis rheum, 41(2):284–289, 1998.
20. N. Blumenkrantz and G. Asboe-Hansen. New method for quantitative determina-tion of uronic acids. Anal Biochem, 54(2):484–489, 1973.
21. P.L. Briant, J.H. Rylander, S.L. Bevill, and T.P. Andriacchi. Effects of alteredloading on collagen matrix deformation in articular cartilage. Trans Orthop ResSoc, 32:607, 2007.
8. Summary and conclusions 69
22. H. Brommer, M. S. Laasanen, P.A.J. Brama, P.R. van Weeren, A. Barneveld, H. J.Helminen, and J. S. Jurvelin. Influence of age, site and degenerative state on thespeed of sound in equine articular cartilage. Am J Vet Res, 66:1175–1180, 2005.
23. N. D. Broom and C. A. Poole. Articular cartilage collagen and proteoglycans. theirfunctional interdependency. Arthritis Rheum, 26(9):1111–1119, 1983.
24. A. E. Brown. Rationale and summary of methods for determining ultrasonic prop-erties of materials at Lawrence Livermore National Laboratory. National TechnicalInformation Service, U.S. Department of Commerce, Springfield, 1997.
25. J. A. Buckwalter and J. Martin. Degenerative joint disease. Clin Symp, 47(2):1–32,1995.
26. J.A. Buckwalter and H.J. Mankin. Articular cartilage, part I: Tissue design andchonrocyte-matrix interactions. J Bone Joint Surg Am, 79(4):600–611, 1997.
27. J.A. Buckwalter and H.J. Mankin. Articular cartilage, part II: Degeneration andosteoarthritis, repair, regeneration, and transplantation. J Bone Joint Surg Am,79(4):612–632, 1997.
28. I. Cespedes, J. Ophir, H. Ponnekanti, and N. Maklad. Elastography: elasticityimaging using ultrasound with application to muscle and breast in vivo. UltrasonImaging, 15(2):73–88, 1993.
29. R. E. Challis and R. I. Kitney. Biomedical signal processing (in four parts). part 1.time-domain methods. Med Biol Eng Comput, 28(6):509–524, 1990.
30. E. H. Chiang, R. S. Adler, C. R. Meyer, J. M. Rubin, D. K. Dedrick, and T. J. Laing.Quantitative assessment of surface roughness using backscattered ultrasound: theeffects of finite surface curvature. Ultrasound Med Biol, 20(2):123–135, 1994.
31. E. H. Chiang, T. J. Laing, C. R. Meyer, J. L. Boes, J. M. Rubin, and R. S.Adler. Ultrasonic characterization of in vitro osteoarthritic articular cartilage withvalidation by confocal microscopy. Ultrasound Med Biol, 23(2):205–213, 1997.
32. E. Chérin, A. Saïed, P. Laugier, P. Netter, and G. Berger. Evaluation of acousticalparameter sensitivity to age-related and osteoarthritic changes in articular cartilageusing 50-MHz ultrasound. Ultrasound Med Biol, 24(3):341–354, 1998.
33. E. Chérin, A. Saïed, B. Pellaumail, D. Loeuille, P. Laugier, P. Gillet, P. Netter,and G. Berger. Assessment of rat articular cartilage maturation using 50-Mhzquantitative ultrasonography. Osteoarthritis Cartilage, 9:178–186, 2001.
34. B. Cohen, W. M. Lai, and V. C. Mow. A transversely isotropic biphasic modelfor unconfined compression of growth plate and chondroepiphysis. J Biomech Eng,120(4):491–496, 1998.
70
35. E. Collett. Polarized Light: Fundamentals and Applications. Marcel Dekker Inc.,New York, 1993.
36. J. H. Dashefsky. Arthroscopic measurement of chondromalacia of patella cartilageusing a microminiature pressure transducer. Arthroscopy, 3(2):80–85, 1987.
37. D. G. Disler, E. Raymond, D. A. May, J. S. Wayne, and T. R. McCauley. Articularcartilage defects: in vitro evaluation of accuracy and interobserver reliability fordetection and grading with US. Radiology, 215(3):846–851, 2000.
38. F. Eckstein, D. Burstein, and T.M. Link. Quantitative MRI of cartilage and bone:degenerative changes in osteoarthritis. NMR Biomed., 19:822–854, 2006.
39. F. Eckstein, H. Sittek, S. Milz, E. Schulte, B. Kiefer, M. Reiser, and R. Putz. Thepotential of magnetic resonance imaging (MRI) for quantifying articular cartilagethickness - a methodological study. Clin Biomech, 10(8):434–440, 1995.
40. E. B. Evans, G. W. N. Eggers, J. K. Butler, and J. Blumel. Experimental immobi-lization and remobilization of rat knee joints. J Bone Joint Surg Am, 42-A(5):737–758, 1960.
41. E.C. Everbach. Tissue composition determination via measurement of the acousticnonlinearity parameter. Yale University, New Haven, 1989.
42. H. Forster and Fisher J. The influence of loading time and lubricant on the frictionof articular cartilage. Proc Inst Mech Eng, page 162, 1996.
43. M. Fortin, M. D. Buschmann, M. J. Bertrand, F. S. Foster, and J. Ophir. Dynamicmeasurement of internal solid displacement in articular cartilage using ultrasoundbackscatter. J Biomech, 36(3):443–447, 2003.
44. E. H. Frank and A. J. Grodzinsky. Cartilage electromechanics-I. Electrokinetictransduction and the effects of electrolyte pH and ionic strength. J Biomech,20(6):615–627, 1987.
45. M. A. Freeman. Is collagen fatigue failure a cause of osteoarthrosis and prostheticcomponent migration? A hypothesis. J Orthop Res, 17(1):3–8, 1999.
46. M. I. Froimson, A. Ratcliffe, T. R. Gardner, and V. C. Mow. Differences inpatellofemoral joint cartilage material properties and their significance to the etiol-ogy of cartilage surface fibrillation. Osteoarthritis Cartilage, 5(6):377–386, 1997.
47. G. E. Gold, D. Burstein, B. Dardzinski, P. Lang, F. Boada, and T. Mosher. MRIof articular cartilage in OA: novel pulse sequences and compositional/functionalmarkers. Osteoarthritis Cartilage, 14 Suppl 1:76–86, 2006.
48. S. A. Goss and Jr. O’Brien, W. D. Direct ultrasonic velocity measurement ofmammalian collagen threads. J Acoust Soc Am, 85:507–511, 1979.
8. Summary and conclusions 71
49. S. A. Goss and Jr. O’Brien, W. D. Dependence of the ultrasonic properties ofbiological tissue of constituent proteins. J Acoust Soc Am, 67(3):1041–1044, 1980.
50. Jr. Harris, E. D., H. G. Parker, E. L. Radin, and S. M. Krane. Effects of proteolyticenzymes on structural and mechanical properties of cartilage. Arthritis Rheum,15(5):497–503, 1972.
51. E. M. Hasler, W. Herzog, J. Z. Wu, W. Muller, and U. Wyss. Articular cartilagebiomechanics: theoretical models, material properties, and biosynthetic response.Crit Rev Biomed Eng, 27(6):415–488, 1999.
52. K. Hattori, Y. Takakura, M. Ishimura, T. Habata, K. Uematsu, N. Tomita, andK. Ikeuch. Quantitative arthroscopic ultrasound evaluation of living human carti-lage. Clin Biomech, 19:213–216, 2004.
53. W. C. Hayes, L. M. Keer, G. Herrmann, and L. F. Mockros. A mathematicalanalysis for indentation tests of articular cartilage. J Biomech, 5(5):541–551, 1972.
54. J. M. Herrmann, C. Pitris, B. E. Bouma, S. A. Boppart, C. A. Jesser, D. L. Stam-per, J. G. Fujimoto, and M. E. Brezinski. High resolution imaging of normal andosteoarthritic cartilage with optical coherence tomography. J Rheumatol, 26(3):627–635, 1999.
55. R. Y. Hori and L. F. Mockros. Indentation tests of human articular cartilage. JBiomech, 9(4):259–268, 1976.
56. A. Hulth. Does osteoarthrosis depend on growth of the mineralized layer of carti-lage? Clin Orthop, (287):19–24, 1993.
57. G. A. Joiner, E. R. Bogoch, K. P. Pritzker, M. D. Buschmann, A. Chevrier, andF. S. Foster. High frequency acoustic parameters of human and bovine articularcartilage following experimentally-induced matrix degradation. Ultrason Imaging,23(2):106–116, 2001.
58. G. A. Joiner, E. R. Bogoch, K. P. Pritzker, M. D. Buschmann, and F. S. Foster.Changes in acoustic parameters at 30 Mhz of human and bovine cartilage followingexperimentally-induced matrix degradation to simulate early osteoarthritis. IEEEUltrasonics Symposium, 2:1337–1340, 2000.
59. D. Joseph, W. Y. Gu, X. G. mao, W. M. Lai, and V. C. Mow. True density ofnormal and enzymatically treated bovine articular cartilage. Trans. Orthop. Res.Soc., 24:642, 1-4.2.1999 1999.
60. P. Julkunen, P. Kiviranta, W. Wilson, J. S. Jurvelin, and R. K. Korho-nen. Characterization of articular cartilage by combining microscopic anal-ysis with a fibril-reinforced finite element model. J Biomech, (in press,doi:10.1016/j.jbiomech.2006.07.026), 2007.
72
61. J. S. Jurvelin, M. D. Buschmann, and E. B. Hunziker. Optical and mechanicaldetermination of Poisson’s ratio of adult bovine humeral articular cartilage. JBiomech, 30(3):235–241, 1997.
62. J. S. Jurvelin, M. D. Buschmann, and E. B. Hunziker. Mechanical anisotropy of thehuman knee articular cartilage in compression. Proc Inst Mech Eng, 217:215–219,2003.
63. J. S. Jurvelin, T. Räsänen, P. Kolmonen, and T. Lyyra. Comparison of optical,needle probe and ultrasonic techniques for the measurement of articular cartilagethickness. J Biomech, 28(2):231–235, 1995.
64. E. Kaleva, S. Saarakkala, J. Töyräs, H. J. Nieminen, and J. S. Jurvelin. Comparisonof time domain, frequency domain and wavelet ultrasound analysis for diagnosingcartilage degeneration. Trans Orthop Res Soc, 32:705, 2007.
65. G. N. Kawchuk and P. D. Elliott. Validation of displacement measurements obtainedfrom ultrasonic images during indentation testing. Ultrasound Med Biol, 24(1):105–111, 1998.
66. M. J. Kääb, K. Ito, J. M. Clark, and H. P. Notzli. Deformation of articular cartilagecollagen structure under static and cyclic loading. J Orthop Res, 16(6):743–751,1998.
67. M. J. Kääb, K. Ito, B. Rahn, J. M. Clark, and H. P. Notzli. Effect of mechanical loadon articular cartilage collagen structure: A scanning electron-microscopic study.Cells Tissues Organs, 167:106–120, 2000.
68. G. E. Kempson, M. A. Freeman, and S. A. Swanson. The determination of a creepmodulus for articular cartilage from indentation tests of the human femoral head.J Biomech, 4(4):239–250, 1971.
69. H. K. Kim, P. S. Babyn, K. A. Harasiewicz, H. K. Gahunia, K. P. Pritzker, andF. S. Foster. Imaging of immature articular cartilage using ultrasound backscattermicroscopy at 50 MHz. J Orthop Res, 13(6):963–970, 1995.
70. L.E. Kinsler and A.R. Frey. Fundamentals of acoustics. John Wiley & Sons, Inc.,New York, 1950.
71. K. Király, M. M. Hyttinen, T. Lapveteläinen, M. Elo, I. Kiviranta, J. Dobai,L. Modis, H. J. Helminen, and J. P. Arokoski. Specimen preparation and quan-tification of collagen birefringence in unstained sections of articular cartilage usingimage analysis and polarizing light microscopy. Histochem J, 29(4):317–327, 1997.
72. K. Király, M. Lammi, J. Arokoski, T. Lapveteläinen, M. Tammi, H. Helminen, andI. Kiviranta. Safranin O reduces loss of glycosaminoglycans from bovine articu-lar cartilage during histological specimen preparation. Histochem J, 28(2):99–107,1996.
8. Summary and conclusions 73
73. K. Király, T. Lapveteläinen, J. Arokoski, K. Törrönen, L. Modis, I. Kiviranta,and H. J. Helminen. Application of selected cationic dyes for the semiquantitativeestimation of glycosaminoglycans in histological sections of articular cartilage bymicrospectrophotometry. Histochem J, 28(8):577–590, 1996.
74. I. Kiviranta, J. Rieppo, R. K. Korhonen, P. Julkunen, J. Töyräs, and J.S. Jurvelin.Collagen network primarily controls Poisson’s ratio of bovine articular cartilage incompression. J Orthop Res, 24(4):690–699, 2006.
75. I. Kiviranta, M. Tammi, J. Jurvelin, J. Arokoski, A. M. Säämänen, and H. J.Helminen. Articular cartilage thickness and glycosaminoglycan distribution in theyoung canine knee joint after remobilization of the immobilized limb. J Orthop Res,12(2):161–167, 1994.
76. P. Kolmonen, T. Lyyra, and J.S. Jurvelin. Experimental comparison of acousticand mechanical properties of bovine knee articular cartilage. Trans Orthop Res Soc,19:513, 1995.
77. E. E. Konofagou, T. P. Harrigan, J. Ophir, and T. A. Krouskop. Poroelastography:imaging the poroelastic properties of tissues. Ultrasound Med Biol, 27(10):1387–1397, 2001.
78. R. K. Korhonen, M. S. Laasanen, J. Töyräs, R. Lappalainen, H. J. Helminen, andJ. S. Jurvelin. Fibril reinforced poroelastic model predicts specifically mechanicalbehavior of normal, proteoglycan depleted and collagen degraded articular cartilage.J Biomech, 36(9):1373–1379, 2003.
79. R. K. Korhonen, S. Saarakkala, J. Töyräs, M. S. Laasanen, I. Kiviranta, and J. S.Jurvelin. Experimental and numerical validation for the novel configuration of anarthroscopic indentation instrument. Phys Med Biol, 48(11):1565–1576, 2003.
80. M. S. Laasanen, J. Töyräs, J. Hirvonen, S. Saarakkala, R. K. Korhonen, M. T.Nieminen, I. Kiviranta, and J. S. Jurvelin. Novel mechano-acoustic technique andinstrument for diagnosis of cartilage degeneration. Physiol Meas, 23:491–503, 2002.
81. M. S. Laasanen, J. Töyräs, J. Hirvonen, S. Saarakkala, R. K. Korhonen, M. T.Nieminen, I. Kiviranta, and J. S. Jurvelin. Ultrasound indentation of bovine kneearticular cartilage in situ. J Biomech, 36:1259–1267, 2003.
82. M. S. Laasanen, J. Töyräs, R. K. Korhonen, J. Rieppo, S. Saarakkala, M. T. Niem-inen, J. Hirvonen, and J. S. Jurvelin. Biomechanical properties of knee articularcartilage. Biorheology, 40(1-3):133–140, 2003.
83. M. S. Laasanen, J. Töyräs, A. Vasara, M. M. Hyttinen, S. Saarakkala, J. Hirvonen,J. S. Jurvelin, and I. Kiviranta. Mechano-acoustic diagnosis of cartilage degenera-tion and repair. J Bone Joint Surg Am, 85-A:78–84, 2003.

74
84. M.S. Laasanen, S. Saarakkala, J. Töyräs, J. Rieppo, and J.S. Jurvelin. Site-specificultrasound reflection properties and superficial collagen content of bovine knee ar-ticular cartilage. Phys Med Biol, 50:3221–3233, 2005.
85. M.S. Laasanen, J. Töyräs, A. Vasara, S. Saarakkala, M.M. Hyttinen, I. Kiviranta,and Jurvelin J.S. Quantitative ultrasound imaging of spontaneous repair of porcinecartilage. Osteoarthritis Cartilage, 14(3):258–263, 2006.
86. W. M. Lai, J. S. Hou, and V. C. Mow. A triphasic theory for the swelling anddeformation behaviors of articular cartilage. J Biomech Eng, 113(3):245–258, 1991.
87. C. M. Langton, S. B. Palmer, and R. W. Porter. The measurement of broadbandultrasonic attenuation in cancellous bone. Eng Med, 13(2):89–91, 1984.
88. S. Lees, J.D. Heeley, J.M. Ahern, and M.G. Oravecz. Axial phase velocity in rat tailtendon fibers at 100 MHz by ultrasonic microscopy. IEEE Trans Sonics Ultrason,30(2):85–90, 1983.
89. F. Lefebvre, N. Graillat, E. Chérin, G. Berger, and A. Saïed. Automatic three-dimensional reconstruction and characterization of articular cartilage from high-resolution ultrasound acquisitions. Ultrasound Med Biol, 24(9):1369–1381, 1998.
90. J. Leidy. On the intimate structure and history of the articular cartilages. Am JMed Sci, 34:277–295, 1849.
91. L. P. Li, M. D. Buschmann, and A. Shirazi-Adl. Alterations in mechanical be-haviour of articular cartilage due to changes in depth varying material properties- a nonhomogeneous poroelastic model study. Comput Methods Biomech BiomedEngin, 5(1):45–52, 2002.
92. M.H. Lu, Y. P. Zheng, and Q.H. Huang. A novel noncontact ultrasound indentationsystem for measurement of tissue material properties using water jet compression.Ultrasound Med Biol, 31(6):817–826, 2005.
93. X.L. Lu, C. Miller, X. E. Guo, and V. C. Mow. Triphasic indentation of articularcartilage: determination of both mechanical properties and fixed charge density.Trans Orthop Res Soc, 31:294, 2006.
94. T. Lyyra, J. Jurvelin, P. Pitkänen, U. Väätäinen, and I. Kiviranta. Indentationinstrument for the measurement of cartilage stiffness under arthroscopic control.Med Eng Phys, 17(5):395–399, 1995.
95. A. F. Mak. Unconfined compression of hydrated viscoelastic tissues: a biphasicporoviscoelastic analysis. Biorheology, 23(4):371–383, 1986.
96. H. J. Mankin, H. Dorfman, L. Lippiello, and A. Zarins. Biochemical and metabolicabnormalities in articular cartilage from osteo-arthritic human hips. II. Correlationof morphology with biochemical and metabolic data. J Bone Joint Surg Am,53(3):523–537, 1971.
8. Summary and conclusions 75
97. A. Maroudas and M. Venn. Chemical composition and swelling of normal andosteoarthrotic femoral head cartilage. II. swelling. Ann Rheum Dis, 36(5):399–406.,1977.
98. V. E. Modest, M. C. Murphy, and R. W. Mann. Optical verification of a techniquefor in situ ultrasonic measurement of articular cartilage thickness. J Biomech,22(2):171–176, 1989.
99. L. Modis. Organization of the extracellular matrix: a polarization microscopic ap-proach. CRC Press, Boca Raton, 1991.
100. V. C. Mow, M. C. Gibbs, W. M. Lai, W. B. Zhu, and K. A. Athanasiou. Biphasicindentation of articular cartilage II. A numerical algorithm and an experimentalstudy. J Biomech, 22(8-9):853–861, 1989.
101. V. C. Mow, A. Ratcliffe, and A. R. Poole. Cartilage and diarthrodial joints asparadigms for hierarchical materials and structures. Biomaterials, 13(2):67–97,1992.
102. V. C. Mow, W. Zhu, and A. Ratcliffe. Structure and function of articular carti-lage and meniscus. In V. C. Mow and W. C. Hayes, editors, Basic orthopaedicbiomechanics, pages 143–198. Raven Press, Ltd, New York, 1991.
103. S. Myers, K. Dines, M. Albrecht, D. Brandt, E. Wu, and K. Brandt. Assessment byhigh frequency ultrasound (HFU) of the thickness and subsurface characteristics ofnormal and osteoarthritic human cartilage. Trans Orthop Res Soc, 18:215, 1994.
104. S. L. Myers, K. Dines, D. A. Brandt, K. D. Brandt, and M. E. Albrecht. Experi-mental assessment by high frequency ultrasound of articular cartilage thickness andosteoarthritic changes. J Rheumatol, 22(1):109–116, 1995.
105. M. Q. Niederauer, S. Cristante, G. M. Niederauer, R. P. Wilkes, S. M. Singh, D. F.Messina, M. A. Walter, B. D. Boyan, J. C. DeLee, and G. Niederauer. A novelinstrument for quantitatively measuring the stiffness of articular cartilage. TransOrthop Res Soc, 23:905, 1998.
106. M. Nissi, J. Töyräs, M. S. Laasanen, J. Rieppo, S. Saarakkala, R. Lappalainen, J. S.Jurvelin, and M. T. Nieminen. Proteoglycan and collagen sensitive MRI evaluationof normal and degenerated articular cartilage. J Orthop Res, 22(3):557–564, 2004.
107. H. Nötzli, A. Wilson, F. Forster, and J. Clark. Automated ultrasound measurementscan map contour and thickness of articular cartilage. Trans Orthop Res Soc, 18:409,1994.
108. J. Ophir, S. K. Alam, B. Garra, F. Kallel, E. Konofagou, T. Krouskop, andT. Varghese. Elastography: ultrasonic estimation and imaging of the elastic prop-erties of tissues. Proc Inst Mech Eng [H], 213(3):203–233, 1999.
76
109. J. Ophir, I. Cespedes, H. Ponnekanti, Y. Yazdi, and X. Li. Elastography: a quan-titative method for imaging the elasticity of biological tissues. Ultrason Imaging,13(2):111–134, 1991.
110. J. Ophir and P. Jaeger. Spectral shifts of ultrasonic propagation through mediawith nonlinear dispersive attenuation. Ultrason Imaging, 4(3):282–289, 1982.
111. J. Ophir and Y. Yazdi. A transaxial compression technique (TACT) for localizedpulse-echo estimation of sound speed in biological tissues. Ultrason Imaging, 12:35–46, 1990.
112. J. R. Parsons and J. Black. The viscoelastic shear behavior of normal rabbit artic-ular cartilage. J Biomech, 10(1):21–29, 1977.
113. S.G. Patil, Y.P. Zheng, J.Y. Wu, and J. Shi. Measurement of depth-dependenceand anisotropy of ultrasound speed of bovine articular cartilage in vitro. UltrasoundMed Biol, 30:953–961, 2004.
114. B. Pellaumail, V. Dewailly, A. Watrin, D. Loeuille, P. Netter, G. Berger, andA. Saïed. Attenuation coefficient and speed of sound in immature and mature ratcartilage: a study in the 30-70 MHz frequency range. IEEE Ultrasonics Symposium,pages 1361–1365, 1999.
115. B. Pellaumail, A. Watrin, D. Loeuille, P. Netter, G. Berger, P. Laugier, andA. Saied. Effect of articular cartilage proteoglycan depletion on high frequencyultrasound backscatter. Osteoarthritis Cartilage, 10(7):535–541, 2002.
116. J. Pohlhammer and Jr. O’Brien, W. D. Dependence of the ultrasonic scatter coeffi-cient on collagen concentration in mammalian tissues. J Acoust Soc Am, 69(1):283–285, 1981.
117. L. Qin, Y. Zheng, C. Leung, A. Mak, W. Choy, and K. Chan. Ultrasound detec-tion of trypsin-treated articular cartilage: its association with cartilaginous proteo-glycans assessed by histological and biochemical methods. J Bone Miner Metab,20(5):281–287, 2002.
118. E. L. Radin and R. M. Rose. Role of subchondral bone in the initiation andprogression of cartilage damage. Clin Orthop, (213):34–40, 1986.
119. J. Rieppo, J. Hallikainen, J. S. Jurvelin, H. J. Helminen, and M. M. Hyttinen.Novel quantitative polarization microscopic assessment of cartilage and bone colla-gen birefringence, orientation and anisotropy. Trans Orthop Res Soc, 28:570, 2003.
120. J. Rieppo, M. M. Hyttinen, R. Lappalainen, J. S. Jurvelin, and H. J. Helminen. Spa-tial determination of water, collagen and proteoglycan contents by Fourier trans-form infrared imaging and digital densitometry. Trans Orthop Res Soc, 28:1021,2004.
8. Summary and conclusions 77
121. J. Rieppo, P. Julkunen, H. J. Helminen, and J. S. Jurvelin. Changes in compositionof articular cartilage under static loading conditions: quantitative analysis withFT-IRIS and FE model. Trans Orthop Res Soc, 32:626, 2007.
122. J. Rieppo, J. Töyräs, M. T. Nieminen, V. Kovanen, M. M. Hyttinen, R. Korhonen,J. S. Jurvelin, and H. J. Helminen. Structure-function relationships in enzymaticallymodified articular cartilage. Cells Tissues Organs, 175:121–132, 2003.
123. J.L. Rose and B.B. Goldberg. Basic physics in diagnostic ultrasound. John Wiley& Sons, New York, 1979.
124. J. Rothfuss, W. Mau, H. Zeidler, and M.H. Brenner. Socioeconomic evaluationof rheumatoid arthritis and osteoarthritis: a literature review. Semin ArthritisRheum, 26(5):771–779, 1997.
125. P. D. Rushfeldt, R. W. Mann, and W. H. Harris. Improved techniques for mea-suring in vitro the geometry and pressure distribution in the human acetabulum-I.Ultrasonic measurement of acetabular surfaces, sphericity and cartilage thickness.J Biomech, 14(4):253–260, 1981.
126. S. Saarakkala. Pre-clinical ultrasound diagnostics of articular cartilage and sub-chondral bone. University of Kuopio, Kuopio, Finland, 2007.
127. S. Saarakkala, M.S. Laasanen, J.S. Jurvelin, and J. Töyräs. Quantitative ultrasoundimaging detects degenerative changes in articular cartilage surface and subchondralbone. Phys Med Biol, 20(20):5333–5346, 2006.
128. S. Saarakkala, J. Töyräs, J. Hirvonen, M.S. Laasanen, R. Lappalainen, and J.S.Jurvelin. Ultrasonic quantitation of superficial degradation of articular cartilage.Ultrasound Med Biol, 30(6):783–792, 2004.
129. J. R. Sachs and A. J. Grodzinsky. Electromechanical spectroscopy of cartilage usinga surface probe with applied mechanical displacement. J Biomech, 28(8):963–976,1995.
130. A. Saïed, E. Chérin, H. Gaucher, P. Laugier, P. Gillet, J. Floquet, P. Netter, andG. Berger. Assessment of articular cartilage and subchondral bone: subtle andprogressive changes in experimental osteoarthritis using 50 MHz echography invitro. J Bone Miner Res, 12(9):1378–1386, 1997.
131. H. Sandmark. Knee osteoarthrosis in relation to physical workload and lifestylefactors - epidemiological studies. National Institute for Working Life, Stockholm,1999.
132. D. E. Schwartz, Y. Choi, L. J. Sandell, and W. R. Hanson. Quantitative analysisof collagen, protein and DNA in fixed, paraffin-embedded and sectioned tissue.Histochem J, 17(6):655–663, 1985.
78
133. C.M. Sehgal. Quantitative relationship between tissue composition and scatteringof ultrasound. J Acoust Soc Am, 94(4):1944–1952, 1993.
134. D. A. Senzig, F. K. Forster, and J. E. Olerud. Ultrasonic attenuation in articularcartilage. J Acoust Soc Am, 92(2 Pt 1):676–681, 1992.
135. D.E.T. Shepherd and B.B. Seedhom. A technique for measuring the compressivemodulus of articular cartilage under physiological loading rates with preliminaryresults. Proc Inst Mech Eng, 211:155–165, 1997.
136. W. D. Shingleton, D. J. Hodges, P. Brick, and T. E. Cawston. Collagenase: a keyenzyme in collagen turnover. Biochem Cell Biol, 74(6):759–775, 1996.
137. P.J. Shull, editor. Nondestructive evaluation: theory, techniques and applications.Marcel Dekker Inc., New York, 2002.
138. M. P. Spriet, C. A. Girard, S. F. Foster, K. Harasiewicz, D. W. Holdsworth, andS. Laverty. Validation of a 40MHz B-scan ultrasound biomicroscope for the evalu-ation of osteoarthritis lesions in an animal model. Osteoarthritis Cartilage, 13:171–179, 2005.
139. J. K. Suh, I. Youn, and F. H. Fu. An in situ calibration of an ultrasound transducer:a potential application for an ultrasonic indentation test of articular cartilage. JBiomech, 34(10):1347–1353, 2001.
140. P. A. Torzilli. Mechanical response of articular cartilage to an oscillating load. MechRes Comm, 11:75–82, 1984.
141. J.G. Truscott and R. Strelitzki. Challenges in the ultrasonic measurement of bone.In F.A. Duck, A.C. Baker, and H.C. Starritt, editors, Ultrasound in medicine,Medical Science Series, pages 287–306. Institute of Physics Publishing, London,1998.
142. J. Töyräs, M. S. Laasanen, S. Saarakkala, M. Lammi, J. Rieppo, J. Kurkijärvi,R. Lappalainen, and J. S. Jurvelin. Speed of sound in normal and degeneratedbovine articular cartilage. Ultrasound Med Biol, 29:447–454, 2003.
143. J. Töyräs, T. Lyyra-Laitinen, M. Niinimäki, R. Lindgren, M. T. Nieminen, I. Kivi-ranta, and J. S. Jurvelin. Estimation of the Young’s modulus of articular cartilageusing an arthroscopic indentation instrument and ultrasonic measurement of tissuethickness. J Biomech, 34(2):251–256, 2001.
144. J. Töyräs, H. J. Nieminen, M. S. Laasanen, M. T. Nieminen, R. K. Korhonen,J. Rieppo, J. Hirvonen, H. J. Helminen, and J. S. Jurvelin. Ultrasonic characteri-zation of articular cartilage. Biorheology, 39:161–169, 2002.
145. J. Töyräs, J. Rieppo, M. T. Nieminen, H. J. Helminen, and J. S. Jurvelin. Char-acterization of enzymatically induced degradation of articular cartilage using highfrequency ultrasound. Phys Med Biol, 44(11):2723–2733, 1999.
8. Summary and conclusions 79
146. P. N. T. Wells. Physical Principles of Ultrasonic Diagnosis. Academic Press, Lon-don, 1969.
147. P. N. T. Wells. Review: absorption and dispersion of ultrasound in biological tissue.Ultrasound Med Biol, 1(4):369–376, 1975.
148. P. N. T. Wells. Biomedical ultrasonics. Academic Press, London, 1977.
149. W. Wilson, J. M. Huyghe, and C. C. van Donkelaar. A composition-based cartilagemodel for the assessment of compositional changes during cartilage damage andadaptation. Osteoarthritis Cartilage, 14(6):554–560, 2006.
150. W. Wilson, C. C. van Donkelaar, B. van Rietbergen, K. Ito, and R. Huiskes.Stresses in the local collagen network of articular cartilage: a poroviscoelastic fibril-reinforced element study. J Biomech, 37:357–366, 2004.
151. W. Wilson, C. C. van Donkelaar, B. van Rietbergen, K. Ito, and R. Huiskes. Er-ratum to ”Stresses in the local collagen network of articular cartilage: a porovis-coelastic fibril-reinforced finite element study” [Journal of Biomechanics 37 (2004)357-366] and ”A fibril-reinforced poroviscoelastic swelling model for articular carti-lage” [Journal of Biomechanics 38 (2005) 1195-1204]. J Biomech, 38(10):2138–2140,2005.
152. W. Wilson, B. van Rietbergen, C. C. van Donkelaar, and R. Huiskes. Pathwaysof load-induced cartilage damage causing cartilage degeneration in the knee aftermeniscectomy. J Biomech, 36(6):845–851, 2003.
153. J. Q. Yao and B. B. Seedhom. Ultrasonic measurement of the thickness of humanarticular cartilage in situ. Rheumatology (Oxford), 38(12):1269–1271, 1999.
154. E. Yelin and L. F. Callahan. The economic cost and social and psychological impactof musculoskeletal conditions. National Arthritis Data Work Groups. ArthritisRheum, 38(10):1351–1362, 1995.
155. I. Youn, F.H. Fu, and J-K. Suh. Determination of the mechanical properties ofarticular cartilage using a high-frequency ultrasonic indentation technique. TransOrthop Res Soc, 23:162, 1999.
156. Y. P. Zheng, C. X. Ding, J. Bai, A. F. Mak, and L. Qin. Measurement of thelayered compressive properties of trypsin-treated articular cartilage: an ultrasoundinvestigation. Med Biol Eng Comput, 39(5):534–541, 2001.
157. Y. P. Zheng and A. F. Mak. An ultrasound indentation system for biomechanicalproperties assessment of soft tissues in-vivo. IEEE Trans Biomed Eng, 43(9):912–918, 1996.
158. Y.P. Zheng, S.L. Bridal, J. Shi, A. Saied, M.H. Lu, B. Jaffre, A.F.T. Mak, andP. Laugier. High resolution ultrasound elastomicroscopy imaging of soft tissues:system development and feasibility. Phys Med Biol, 49:3925–3938, 2004.
80
159. Y.P. Zheng, A.F.T. Mak, K.P. Lau, and L. Qin. An ultrasonic measurement forin vitro depth-dependent equilibrium strains of articular cartilage in compression.Phys Med Biol, 47:3165–3180, 2002.
160. Y.P. Zheng, H.J. Niu, A.F.T. Mak, and Y.P. Huang. Ultrasonic measurement ofdepth-dependent transient behaviors of articular cartilage under compression. JBiomech, 39(9):1830–1837, 2005.
Kuopio University Publications C. Natural and Environmental Sciences C 196. Heijari, Juha. Seed origin, forest fertilization and chemical elicitor influencing wood characteristics and biotic resistance of Scots pine. 2006. 39 p. Acad. Diss. C 197. Hakulinen, Mikko. Prediction of density, structure and mechanical properties of trabecular bone using ultrasound and X-ray techniques. 2006. 84 p. Acad. Diss. C 198. Al Natsheh, Anas. Quantum Mechanics Study of Molecular Clusters Composed of Atmospheric Nucleation Precursors. 2006. 55 p. Acad. Diss. C 199. Tarvainen, Tanja. Computational Methods for Light Transport in Optical Tomography. 2006. 123 p. Acad. Diss. C 200. Heikkinen, Päivi. Studies on Cancer-related Effects of Radiofrequency Electromagnetic Fields. 2006. 165 p. Acad. Diss. C 201. Laatikainen, Tarja. Pesticide induced responses in ectomycorrhizal fungi and symbiont Scots pine seedlings. 2006. 180 p. Acad. Diss. C 202. Tiitta, Markku. Non-destructive methods for characterisation of wood material. 2006. 70 p. Acad. Diss. C 203. Lehesranta, Satu. Proteomics in the Detection of Unintended Effects in Genetically Modified Crop Plants. 2006. 71 p. Acad. Diss. C 204. Boman, Eeva. Radiotherapy forward and inverse problem applying Boltzmann transport equation. 2007. 138 p. Acad. Diss. C 205. Saarakkala, Simo. Pre-Clinical Ultrasound Diagnostics of Articular Cartilage and Subchondral Bone. 2007. 96 p. Acad. Diss. C 206. Korhonen, Samuli-Petrus. FLUFF-BALL, a Fuzzy Superposition and QSAR Technique - Towards an Automated Computational Detection of Biologically Active Compounds Using Multivariate Methods. 2007. 154 p. Acad. Diss. C 207. Matilainen, Merja. Identification and characterization of target genes of the nuclear reseptors VDR and PPARs: implementing in silico methods into the analysis of nuclear receptor regulomes. 2007. 112 p. Acad. Diss. C 208. Anttonen, Mikko J. Evaluation of Means to Increase the Content of Bioactive Phenolic Compounds in Soft Fruits. 2007. 93 p. Acad. Diss. C 209. Pirkanniemi, Kari. Complexing agents: a study of short term toxicity, catalytic oxidative degradation and concentrations in industrial waste waters. 2007. 83 p. Acad. Diss. C 210. Leppänen, Teemu. Effect of fiber orientation on cockling of paper. 2007. 96 p. Acad. Diss.