Embed Size (px)
Citation preview

LANGUAGE USE, PROFICIENCY AND ATTITUDES IN HONG KONG
JOHN BACON-SHONE KINGSLEY BOLTON K.K LUKE
香港居民語言應用、語言能力及語言態度研究


Language Use, Proficiency and Attitudes in Hong Kong
������������������ �
Professor John Bacon-Shone 1
Professor Kingsley Bolton1, 2
Professor K.K Luke2
Funder: Public Policy Research Funding Scheme, Central Policy Unit, HKSARG
Publisher: Social Sciences Research Centre The University of Hong Kong
ISBN: 978-962-7558-00-2
Version: 2015-08-25
License: This work is licensed under the Creative Commons Attribution-Noncommercial- Share Alike 4.0 International License. See the license at http://creativecommons.org/licenses/by-nc-sa/4.0/
Note: HKSARG, its authorised users, assigns and successors-in-title have an irrevocable, non-exclusive, perpetual, transferrable, sub-licensable, royalty-free and worldwide licence to use this report.
Social Sciences Research Centre, The University of Hong Kong, Hong Kong1
Nanyang Technological University, Singapore2
! 1

Abstract
This study builds on the detailed empirical research of the three investigators, who have been collaborating on researching the Hong Kong linguistic situation since the early 1980s. This research utilises social survey methodology to investigate which languages are used within the community. In more technical terms, this has involved carrying out ‘sociolinguistic surveys’ (surveys of languages in society) to investigate which languages are learnt, and which are used, by whom to whom, across a range of settings (or ‘domains’) in Hong Kong society. Previously, three such surveys have been conducted, in 1983, 1993, and 2003. The 1983 sociolinguistic survey used face-to-face interviews with a total of 1240 respondents (Bolton and Luke 1999). This was followed, in 1993 and 2003, by two telephone surveys conducted by the Social Sciences Research Centre of The University of Hong Kong, where a total of 886 respondents were interviewed in the 1993 survey, and 1060 in the 2003 (Bacon-Shone and Bolton 1998, 2008). One broad aim of all three surveys was to describe patterns of language acquisition, language use, and attitudes to language policies in Hong Kong. This study carried out a sociolinguistic survey of Hong Kong in 2014 together with detailed reanalysis of the 2011 census data across the 18 districts and 412 constituency areas, which yields useful and applicable results relating to ethnic/linguistic minorities, multilingualism, multiculturalism, and language planning, of direct interest to public policy in Hong Kong. It also calibrates for the first time, using expert assessment, self-reported claims of proficiency in oral English and Putonghua and written English and simplified Chinese.
! 2

ƴ�
·ŸŭĿò�:iŪů��ŐĦƐ×0¸.ýŷþĔ5Ų�WkĵŸŭljŸŭ(ł�Ō@ăĆP��ņƵNj.ýŷł���c�þĔ-PĔ�WÔ�ijƫ�ł�þĔăĆljăĆ�ò��ƪĂÕþĔ��cł�¡ƞ�/Ʀ�F�å�-d4ljŸŭĢƹ��ŐĦ:3%NjOƓ�3�WĎĴ¤ŁNjë>fU}1�:G�Ŧœ�ł�þĔăĆdž1983Nj1993Nj 2003LJljZ�GăĆdž1983LJ(b.b��ƚăĆPĀNj.1240iÊã�W�ŸŭdžBolton and Luke 1999LJljZsęZ:GăĆNjî�(aRƛ��PĀNj&q.886ię1060iÊã�WŸŭdžBacon-Shone and Bolton 1998, 2008)lj:GăĆŸŭ����ÍĽNj.þ[@óLjþ[ª4Lj(ęÊã.þĔʼnƋ�Ĉ�XPbd*�Ī�IÔ��&ƥlj`ŸŭÉŧ�Ð*Njƾ�Ēe:GŸŭ�d7Nj�20143�WZ³Gł�þĔăĆNjp20113¯ŮĆÍĽ (ƩƃTŷ18Đę412´Đ) d��öūij&ƥlj x.�Ížǂ / þĔLj�EþĔLj�¦[Ò-þĔŦŧÐƁkĵ�ņƵNjIJ�ñ_ýŷ�rıʼnƋlj`GŸŭ"ðG(Ʋ¥�+ĘƣNjIJŠ �ƛÓ��âą.ė[¯þLjŮ�RLjÜ÷ė[-ĕ��[�Ŗŵħ�dƏjlj
! 3

Table of Contents
Table of Contents 4 Acknowledgements 6 Research team 6 Executive Summary 7 Wʼnǃ� 9 Chapter 1 Introduction 11 Chapter 2 Methodology 13
2.1 Telephone survey 13 2.1.1 Fieldwork dates 13 2.1.2 Response rate 14 2.1.3 Weighting 14 2.1.4 Quality assurance 16
2.2 Oral proficiency tests 16 2.3 Written proficiency test 16 2.4 2011 Census data 16
2.4.1 Maps using Census data 17 Chapter 3 Findings from the telephone survey 18
3.1 Knowledge and use of spoken languages 18 3.1.1 ‘Mother tongue’ and languages known before school 19 3.1.2 Languages known now and used in the home 19 3.1.3 Languages used with friends 20 3.1.4 Languages at work 20
3.2 Use of written languages at work 21 3.3 Self-reported language proficiency 21 3.4 Language mixing 22 3.5 Languages in secondary school 23
3.5.1 Languages at school (student responses) 23 3.5.2 Languages at school (adult responses) 24
3.6 Language use for the media and Internet 25 3.7 Language attitudes 27 3.8 Use of languages in everyday life 29 3.9 Choice of variety of English 30 3.10 English language exposure abroad 30 3.11 Languages spoken now by age group 31
Chapter 4 Language maps 37 4.1 Introduction 37 4.2 Language maps for languages/dialects in Hong Kong 38
Chapter 5 Findings from the oral and written assessments 93 5.1 Background 93 5.2 Oral English 93 5.3 Oral Putonghua 95 5.4 Written English 96 5.5. Written Simplified Chinese 97
Chapter 6 Policy recommendations 99 Chapter 7 Public engagement 101 References 102 Appendix A Telephone survey questionnaire 104
! 4

Appendix B Oral language assessment questions 114 Appendix C Written language assessment questions 115 Appendix D Demographics of the survey sample 116
! 5

Acknowledgements
The text of this report was written by John Bacon-Shone and Kingsley Bolton.
The statistical analysis was done by John Bacon-Shone.
The questionnaire was designed by John Bacon-Shone, Kingsley Bolton , KK Luke and Siu-lun Lee.
The maps were created by Gwyneth Bacon-Shone.
The fieldwork was supervised by Sonny Chan and Dicky Yip.
The fieldwork was done by the SSRC team of telephone interviewers.
The oral and written language assessments were done by Kingsley Bolton and Xiaoling He.
The responses were provided by the Hong Kong public aged 12 and above.
The digital boundaries for the District Council Constituency Areas (DCCA) were provided by Lands Department with the kind support of the Electoral Commission.
The analysis of the 2011 Census data was facilitated by the Self-help Tabulation Service of the Census and Statistics Department of the HKSARG.
Research funding was from the Public Policy Research Funding Scheme of the Central Policy Unit, HKSARG Ref: 2013.A8.006.14A . 3
Research team
The research team that carried out this research comprises a group of language experts who have many years experience of researching language issues in Hong Kong. More specifically, the group includes Professor John Bacon-Shone (Director of the Social Sciences Research Centre, The University of Hong Kong), Professor Kingsley Bolton (Honorary Professor, The University of Hong Kong; Professor of English Linguistics, NTU Singapore), Professor Kang Kwong Luke (Former HKU Professor, Professor of Linguistics, NTU Singapore), Dr Xiaoling He (Lecturer in Chinese, NTU Singapore), and Dr Siu-lun Lee (Yale-China Chinese Language Centre, The Chinese University of Hong Kong).
Details of the funding scheme can be found here: http://www.cpu.gov.hk/en/public_policy_research/3
index.html! 6

Executive Summary
This report concerns a research project (funded by the Public Policy Research Funding Scheme of the Central Policy Unit, HKSARG) carried out by the Social Sciences Research Centre of The University of Hong Kong which involved (i) the conduct of a community-wide language survey from August 2014 – January 2015; and (ii) the detailed analysis of language data from the 2011 Census of the HKSAR. The results of the project have the potential to contribute to a much greater understanding of patterns of language acquisition, language use and multilingualism within the Hong Kong community.
Key results from this project include:
• Confirmation that Cantonese remains the key language for oral communication in many settings in Hong Kong;
• Strong evidence that the Hong Kong community is becoming increasingly trilingual, as a strong majority of young people claim knowledge of all three of Hong Kong’s major spoken languages;
• Data that shows that English remains an important language of the workplace, especially for written communication;
• Results that highlight the diverse multilingualism of Hong Kong society with at least 27 major and minor languages;
• Language maps that show groups of language speakers are distributed unevenly across the HKSAR;
• That nearly all of Hong Kong’s younger citizens who speak South Asian languages also speak English, and many also speak Cantonese, in contrast with older South Asian language speakers, many of whom speak neither Cantonese, nor Putonghua nor English.
Policy recommendations:
• That the HKSAR government should continue to promote its stated policy of ‘trilingualism and biliteracy’ in the HKSAR, with the implications of continuing economic benefits of communication with the Mainland and the rest of the world in English and Putonghua and the social and cultural benefits of the continuing strength of Cantonese.
• That the government consider ways in which high-level proficiency in both oral and written English and simplified written Chinese might be more effectively promoted through Hong Kong’s education system, given the evidence in this report that the numbers estimated to be high-level performers in these three varieties is noticeably low with the implication that although the number of trilingual in Hong Kong are increasing, the number with high level proficiency is still relatively small, which hampers the high level of communication needed in executive level communication in business and government
• That the government consider framing ‘biliteracy’ to encompass literacy in both traditional and simplified Chinese characters, with the implication that Simplified characters are important for national communication but there are currently relatively low levels of proficiency at present, while Traditional characters remain essential to preservation of Hong Kong culture.
• That the government redouble its efforts to provide appropriate Chinese-as-a-Second-Language programmes for second language Chinese speakers, such as South Asian language speakers and
! 7

immigrants, so as to allow these residents full access to the community, with the implication that although many younger South Asians have a command of spoken Cantonese, there remains a serious challenge is providing adequate and relevant teaching in literacy in written Chinese to the whole community as well as oral Cantonese to older members.
• That the government cease the inaccurate labeling of resident South Asian language speaking students as non-Chinese speaking (NCS) students and instead use the more accurate and less discriminatory term of ‘Second Language Chinese speaking’ (SLCS) students with the implication that this label is highly misleading and potentially discriminatory and the term ‘Second Language Chinese speaking’ (SLCS) is not only linguistically accurate, but also non- discriminatory, exclusionary and discouraging.
• That the government require that all research funded with government money should normally be made fully public, as is already the case for research funded from the Public Policy Research Funding scheme of the Central Policy Unit and most research funded by Food and Health Bureau, but not currently the case for research funded by the Standing Committee on Language Education and Research (SCOLAR) for language research that they fund from the Language Fund. Other jurisdictions have long recognised that publicly funded research is a public good that needs maximum publicity and access to ensure the maximum benefit to the community.
• That ethnic minority residents be recognised as constituting distinct language speaking groups with different characteristics living in different localities, as the language maps in this report illustrate with the implication that full recognition of the cultural and social capital from minorities will enhance Hong Kong’s position as China's leading financial and services centre, a great place to live and as Asia's world city.
• That future Censuses collect data on all the spoken and written languages of the HKSAR with the implication that only if the HKSARG records a full list of these languages will we have a full record of multilingualism in Hong Kong and show how competitive it is with the multilingualism that London is so proud of.
• That the government and society in the HKSAR fully value the multilingualism of the community as a valuable resource, rather than regarding this as a problem. The implication is that multilingualism and multiculturalism represent key Hong Kong values and should contribute to 'the Hong Kong advantage' regionally and globally.
! 8

���� `ŸŭĿòíýŷÂĐʼnŻ�ƯʼnƋŏDŽrıʼnƋŸŭĎĮÉŧDžĎĮNjýŷ�@ł�Ō@Ÿŭ��ƂWljŸŭ£ÃÈƬnjdž�LJ201438�ë 201531�§^�W�TŷzþĔăĆNJędžsLJľĽ
ýŷÂĐʼnŻ20113¯ŮĆ�pþĔ���ÍĽdūij�&ƥlj`ŸŭĿò�¢Nx�Į_��
?Tb,�Åýŷ�þĔ@óœĀLj(ęþĔÌ4-�þıĩ�5Ųlj
`ŸŭĿò�V�1NÈƬnj
• śßÿ�RƎA�ýŷû��¥�Nj¯nƨ��V�þĔNJ
• �±S�ĵĽŀĂNjýŷł�2ƅ:þÒNjĜ��Í�3à�Ă.:EýŷV�Ì4¯þ
��jħ��żƔNJ
• ÍĽŀĂėþƎA��d����þĔNjƙ���ÜbþPbNJ
• ¢NŀĂë��27EV�Ö�ÍžŅþĔ{�ýŷÌ4NjĚŀýŷł��þĔÌ4Pb��
FzNJ
• þĔ,�ŀĂ�cþĔ�Ì4ÓŅ��ŴƧ,&Ŏ�ýŷÕ,ĐNJ
• mŔh�3à�ÑïŝþÙ�ýŷÊã��ėþNj����"��ÿ�RljyČNjû�ĸ3
g�ïŝþÙĬŰ�Þôÿ�RNj���ôŮ�RÖėþlj
ʼnƋĝŜnj
• ýŷÂĐʼnŻªĒê�ýŷtWŰj�DŽK[:þDžʼnƋNJ�PbŠ ėþ-Ů�Rp£,
ęv�Õ,ĥƈNjäË�UŽċìNJĨ�PbŠ ƽþ�Ì4NjŞł�-[ÒËê/Ĺlj
• ʼnŻ�ƟƄJÆ?�Ą,� ýŷ�ØōÙįNjÐÛėþ¯þ-Übþ�]°Nj(ętÿ�
[ĕ�ù�ßīlj�ĵĽŀĂNj. :ńþ[���Ŗŵħ��ā�Lư�=Ó�ƣÉÍòYŀƑĠ ── ŊA:þ�ýŷ�ª4�ğŮęNjw�āëLưª4]°Ĭ�ÍòƎAĸ�lj x�ƶģ
�ęʼnŻ�ƂWŚb�h½��LŚGƨ�lj
! 9

• ʼnŻ�đƍÁjƸƃƤ�-ĕ�ùķ÷�S�DŽ¬þ[�SDžƻű ── ĕ�ù�T)zƨ�
PbfU/Ʀ��d4Njw=�`ŷł�.ĕ�ù�Ŗŵħ�y.ĸĠljĨ�NjƤ�ù�ýŷ[ÒPb���d4ªÇË��lj
• ʼnŻ½oƝŃS��[d�ZsþĔ�ĬNjƢJïŝþÙĬ-źãNjÐƁ(�[d�Z
sþĔ�ĞħNj(ƊƉ6�ơ�ł� ── ŗõ#�3à�ïŝǂĬ�ôÿ�RNjw�NjÐƁ�[
Übþ@óM�<ïŝǂłŅNjÈƬÿ�R¯þĞħ<ĸ3g�ïŝǂĬƎA�#�ç��lj
• ʼnŻ�ªl�@�ïŝþÙİãň�DŽéúþ@!DždžNCSLJNjIªÌ4?Ėśę?�ĤƜ
\Ú�4Ŷ ── (�[d�ZsþĔ�@!džSLCSLJljéúþ@!džNCSLJ�ô��ŹĻ-ƭ�ƿ
¼1&NjIDŽ(�[d�ZsþĔ�@!DždžSLCSLJ�º�þĔ@�?�ĖśNjIő��C1ƿ
¼LjÎƼÖ�ƺŇBlj
• ʼnŻª�¾h�íʼnŻĎ¿ĎĮ�ŸŭĿòNj��Ũ5Ų�ªrţ}Tr0�Ÿŭ¢Nlj
í�ƯʼnƋŏDŽrıʼnƋŸŭĎĮÉŧDžĎĮ�Ÿŭę�®Ýíæ¨ęş!ŕĎĮ�ŸŭfƖ�·C�Njw=�íþ[ØōęŸŭ¹ġƀ»�džþ¹�LJŠ þ[ņ¿ĎĮ�þĔŸŭ©$� F��Îlj�6č�õǀĐ#��ßī�rıĎĮ�Ÿŭ��Ŀrƌ;¶Nj½�'�ĭ��ųÄę8rţ«Ƙ�ƆƷNj(Çĵ�'�ĭ�,ﵳ�lj
• {J`âą��þĔ,�hŀĂNj�Ížǂİã��c�,Đĺ1ć��c!DÂƮ�ĊÂ
þĔžŅNj 9ª��śß ── ļ&ſj�ÍžŅ[Ò-ł�Ď`x�ĮǁƠýŷd��)¡ø�
¿ơ²ġ��Ljċƒ�İ�-!D�áÊ(ęŝƇ)Œ���, lj
• ýŷÂĐʼnŻ�è�W¯ŮĆ�Njª¤Ł��h�¯þęÜbþ�Ì4ÍĽ ── çũ�
.ýŷþĔ5Ų�ĉ�żƔNjQ�}ĉ,�Åýŷ��FþĔĶŋNjIJ?�Ą,pƕƳ(ę�6)Œ���Ř(�Ɨ��FþĔĶŋŬy|ĸNjIJ��öÐLýŷ�)Œ��ƱřSlj
• ýŷÂĐʼnŻ-ł�ªļ&ťšł��c�Ì4�EþĔ�ĶŋNjIJ¼H��ŢĎŤIé½
�Àu�~�lj�þĔ�¦[Ò�Ķŋ×�ýŷ���ÏēNjIJ�ĮýŷĝěĐƞ-Tüċìlj
! 10

Chapter 1 Introduction
This study, funded as a Public Policy Project by the Central Policy Unit of the Hong Kong SAR Government, builds on the detailed empirical research of the three investigators, who have been collaborating on researching the Hong Kong linguistic situation since the early 1980s. This research has utilised a social survey methodology to investigate which languages are used within the community. In more technical terms, this has involved carrying out ‘sociolinguistic surveys’ (surveys of languages in society) to investigate which languages are learnt, and which are used, by whom to whom, across a range of settings (or ‘domains’) in Hong Kong society. Previously, three such surveys have been conducted, in 1983, 1993, and 2003. The 1983 sociolinguistic survey used face-to-face interviews with a total of 1240 respondents (Bolton and Luke 1999). This was followed – in 1993 and 2003 – by two telephone surveys conducted by the Social Sciences Research Centre (SSRC) of The University of Hong Kong, where a total of 886 respondents were interviewed in the 1993 survey, and 1060 in the 2003 (Bacon-Shone and Bolton 1998, 2008). One broad aim of all three surveys was to describe patterns of language acquisition, language use, and attitudes to language policies in Hong Kong. This present project involves a sociolinguistic survey of Hong Kong in 2014 together with the detailed reanalysis of the 2011 census data, which yields useful and applicable results relating to language use, proficiency and attitudes, of direct interest to public policy in Hong Kong.
The three stated objectives of this study are:
1. To survey and report on the claimed proficiency of Hong Kong citizens in the major languages of the society, i.e. Cantonese, Putonghua and English.
2. To enable the continued monitoring of trends in language acquisition/learning and language use in Hong Kong society.
3. To survey and report on the use of minority languages and minority dialects within the Hong Kong community.
For a jurisdiction like Hong Kong that relies heavily on trade and communication with the outside world, especially Mainland China, North America, Europe and the rest of Asia, language proficiency is a critical economic policy issue. Two decades ago, it was argued that one element in the 'Hong Kong advantage' was that the city provided an English- using environment for international businesses. Over the last fifteen years, Putonghua has gained in importance, and the HKSAR increasingly functions in three languages. For Hong Kong to perform well linguistically and to meet this trilingual challenge requires both an understanding of trends in language proficiencies and use, and an understanding of the community's attitudes towards languages and language education.
The importance of language questions in Hong Kong is not restricted to the economic domain, but is also relevant to issues of culture and identity in Asia's world city. Hong Kong is not only an important international hub, but is also a community with strong feelings of language loyalty, where the Cantonese dialect/language enjoys a high status in many areas of language use. The status of Putonghua in Hong Kong society has risen markedly in recent years, although it is in question whether to what extent increasing Putonghua proficiency is driven by national identity or economic benefit. In this context, one may argue that, in short, there are few issues of greater policy importance for Hong Kong than trends in language use, proficiency and attitudes, and the linkage between such matters and questions of local and national identity. Here, we would argue that the findings of this survey are crucial to such questions, especially as the language results from census data provide no information about language use in the workplace and the personal domain, or concerning language attitudes. In fact, a detailed study of the languages of the workplace was carried out by two members of the current research team in 2012-13 on behalf of Standing
! 11

Committee on Language Education and Research (SCOLAR) . The results of this present study relating to 4
patterns of multilingual language behaviour in the workplace agree rather closely with the results of this earlier survey (Bacon-Shone and Bolton 2014).
A second question of considerable interest is the language profile for minority languages and dialects in Hong Kong. Because the small number of minority language respondents in the survey restricts the analysis of their language use, we are utilizing census data in this present study to examine the claimed proficiency for nearly all languages spoken within each district council constituency area and for some key language combinations by age.
Linguistic research through language surveys has had a long history that, historically, included the Linguistic Survey of India, which produced 11 volumes of research in the late nineteenth and early twentieth century. More recently, a substantial number of linguistic surveys were carried out in Africa and the Middle East in the 1960s and 1970s, where decisions concerning the use of official languages were seen as vitally important in a number of developing societies (Cooper 1980). In Hong Kong, language survey questions have a long history, as the first questions on language abilities in Chinese date from the 1911 census, and questions on the claimed knowledge of English and Chinese have regularly been included in censuses throughout the past 50 years. There is recent Census data for Hong Kong (Census and Statistics Department 2011), and, as mentioned above, the authors of this current proposal have themselves carried out detailed language surveys at ten-year intervals since 1983. Elsewhere in the world, the importance of language-use surveys in policy development has been shown in many countries where multilingualism is seen as a key issue in economic and social development. Even in the European Union, the monitoring of the languages used by its citizens has been regarded as a key policy issue, related to the goals of greater social integration, mobility and economic development. The Eurobarometer surveys conducted by the European Commission in recent years include some of the largest international surveys of language use outside national censuses (Eurobarometer 2006).
Unfortunately, the secretariat of SCOLAR has so far declined to make the full report public online or allow 4
the researchers to make it public online, without providing any rationale, although they have now made the executive summary public. Clearly this is surprising for research funded by public money, which SCOLAR itself stated was valuable to the community.
! 12
Chapter 2 Methodology
2.1 Telephone survey
The telephone survey used a standardised questionnaire administered by telephone to a broadly representative sample of the Hong Kong population. The sample frame was constructed using fixed line telephone numbers (random numbers seeded from the telephone directories to ensure coverage of the many ex-directory numbers). Although fixed-line penetration has now dropped in Hong Kong below 85%, mobile coverage of those aged 60+ is still limited, meaning that fixed-line provides both greater comparability with the 1993 and 2003 rounds of the survey and greater generalisability for this survey to the whole population aged 12+. Individuals were sampled within households using the last birthday rule to reduce non-contact bias. The designed sample size was 2000 respondents aged 12+. This sample size ensures that there is at least 80% power to detect a change of 5% difference since 2003 in any prevalence rate. It also yields a 95% confidence interval width of at worst +/-2% for the whole population and +/-5% for subgroups of size 400 (i.e. 20% sub-populations). Telephone surveys in Hong Kong generally yield greater interviewer quality (thanks to closer supervision) and much lower costs than face-to-face interviews. In this survey, we undertook audio recording (with consent), both for enhanced quality control and also to yield anonymous language samples that can be used for validating the proficiency assessments (see below).
The questionnaire was designed to last at most 20 minutes (this is long, but past experience suggested this is feasible as respondents find the survey content interesting), covering the following areas:
1. Self-reports concerning patterns of language learning at school and elsewhere 2. Self-reports concerning the language(s) used at home, school and work 3. Self-reported language proficiency in English, Putonghua, and Cantonese; 4. Attitudes to English as well as Cantonese and Putonghua 5. Attitudes to the use of particular languages in education 6. Knowledge and use of minority languages and dialects 7. Demographic information such as age, education, gender, marital status, occupation, personal
income and years in Hong Kong.
Data from the above areas are analysed in detail in Chapter 3.
The questionnaire was designed to be trilingual in Cantonese, English and Putonghua, which should cover nearly all the resident population, while allowing use of the normal SSRC pool of telephone interviewers, who are all trilingual. However, as noted later, this causes some bias against other languages by excluding respondents who do not speak any of these three core languages.
2.1.1 Fieldwork dates
Fieldwork for the telephone survey was done from 7pm to 10pm on weekdays between August 2014 and January 2015.
! 13

2.1.2 Response rate
Table2.1Finalstatusoftelephonecontacts
A total of 39,999 telephone numbers were attempted. However, 6,762 households were not available at that time, 992 households refused and 202 answered only part of the questionnaire. Ultimately, a total of 2,049 respondents were successfully interviewed by using the CATI in the survey. The overall contact rate was 30.2% and response rate was 63.2% . Table 2.1 shows the detailed breakdown of final telephone contact 5 6
status. Note that there were 32 potential respondents (versus 2,049 successful interviews) who could not be interviewed because they could not speak Cantonese, English or Putonghua, suggesting a bias of the order of 1.5%.
2.1.3 Weighting
As telephone surveys are known to have some age and gender bias, the results have been weighted to match the Census and Statistics Department (C&SD) data for age and gender in Q4, 2014. Table 2.2 shows the age and gender distribution of survey respondents and Table 2.3 shows the weights used in order to match the C&SD data.
Type Finalstatusofcontact Numberofcases
1 Success 2,049
2 Par<alCase 202
3 Refusal 992
4 Notavailable 6,762
5 Business/Faxlines 2,029
6 Languageproblem(NoEng.,Cant.orPut.) 32
7 Fax/dataline 1,231
8 Disconnectednumber 16,354
9 Noanswer 9,642
Total 39,999
Contact rate = the number of answered telephone calls divided by the total number of calls attempted, sum of (type1 5
to 6)/ Total = (2049+202+992+6762+2029+32)/39999 = 30.2%.
Response rate = the number of successful interviews divided by the sum of the numbers of successful interviews, 6
partial cases and refusal cases, (type 1) / (type 1 + type 2 + type 3) = 2049/(2049+202+992)=63.2%.! 14
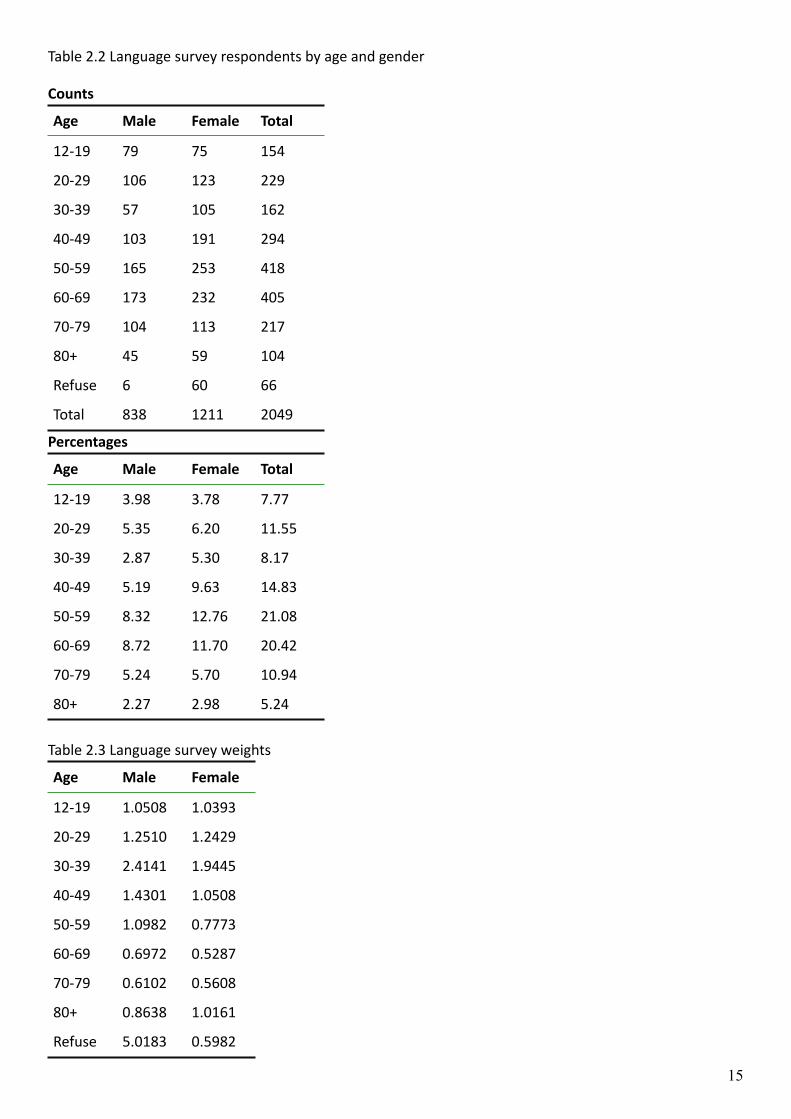
Table2.2Languagesurveyrespondentsbyageandgender
Counts
Percentages
Table2.3Languagesurveyweights
Age Male Female Total
12-19 79 75 154
20-29 106 123 229
30-39 57 105 162
40-49 103 191 294
50-59 165 253 418
60-69 173 232 405
70-79 104 113 217
80+ 45 59 104
Refuse 6 60 66
Total 838 1211 2049
Age Male Female Total
12-19 3.98 3.78 7.77
20-29 5.35 6.20 11.55
30-39 2.87 5.30 8.17
40-49 5.19 9.63 14.83
50-59 8.32 12.76 21.08
60-69 8.72 11.70 20.42
70-79 5.24 5.70 10.94
80+ 2.27 2.98 5.24
Age Male Female
12-19 1.0508 1.0393
20-29 1.2510 1.2429
30-39 2.4141 1.9445
40-49 1.4301 1.0508
50-59 1.0982 0.7773
60-69 0.6972 0.5287
70-79 0.6102 0.5608
80+ 0.8638 1.0161
Refuse 5.0183 0.5982
! 15

2.1.4 Quality assurance
All interviewers studied the questionnaire instructions and successfully completed a practice interview before making phone calls. The supervisor reviewed the interviews to see whether the interviewers were employing proper question-asking and probing techniques and conducting the interview in a professional manner. General problems were also noted and instructions were clarified for every interviewer. The telephone survey followed the normal SSRC quality assurance procedures, which included the following procedures: (i) The data collected were subjected to range checking and logical checking, and unclear and illogical answers were re-coded as invalid; (ii) Questionnaires with more than half of the questions unanswered were regarded as incomplete questionnaires and excluded from analysis; (iii) Any missing answers were excluded from analysis; and (iv) Quality checking procedures were applied to at least 10% of the data collected prior to analysis and use, to ensure that the data were valid.
2.2 Oral proficiency tests
The main questionnaire was followed by two simple tests of aural/oral English and of Putonghua proficiency administered on the telephone, for respondents who claimed any non-zero proficiency, with audio recordings to allow expert assessment.
The proficiency tests are explained and analysed in Chapter 5 in detail, with a comparison between self-report and assessed proficiency. The comparison of such data is highly innovative for surveys of this type, and should enable us to fine-tune our judgments concerning patterns of proficiency in such ‘second’ or ‘minority’ languages across the whole community. Here, however, it might be emphasised that the researchers themselves are well aware of the difficulties and limitations in assessing language proficiency over the telephone. Obviously, in a survey of this type, there is neither space nor time for a large-scale language proficiency test, or test battery, but what we have designed and implemented here is an economically scaled calibration tool that can be matched (albeit in coarse-grained fashion) against self-reported language proficiency in English and Putonghua. Members of the research team are very much aware of the limitations of such an approach, in terms of reliability and validity, but would nevertheless argue that such a tool is applicable and useful, as is further explained in Chapter 5 below.
2.3 Written proficiency test
Finally, respondents were asked if they would agree to a simple test of written English and Simplified Chinese, conducted by online survey questions. If they agreed, they were sent a unique link via SMS, to allow linkage of the results back to their self-reported proficiency and demographics. Similar to the oral proficiency, there are concerns about validity, but again, the focus here is on calibrating the self-assessments, rather than using these assessments directly.
2.4 2011 Census data
The 2011 Census data is used in this report for comparison and reference with the survey data. Some of the differences will reflect that the survey was done 4 years later and some will reflect that the Census data coverage is residents aged 5 and above who are not mute and only reflects up to four languages or dialects spoken by each resident, while the telephone survey coverage is residents aged 12 and above who speak Cantonese, English or Putonghua. In comparison, the 2011 UK Census recorded up to six languages, rather
! 16
than just four. Unfortunately, there is no data on languages spoken in Hong Kong other than the 27 languages reported below, as the Census groups them under other Asian, other European or other languages in the Census data. London boasts that over 250 languages are spoken there, based on a survey of school children (Baker & Eversley 2000), making it the most linguistically diverse city in the world but it could be that Hong Kong is just as linguistically diverse.
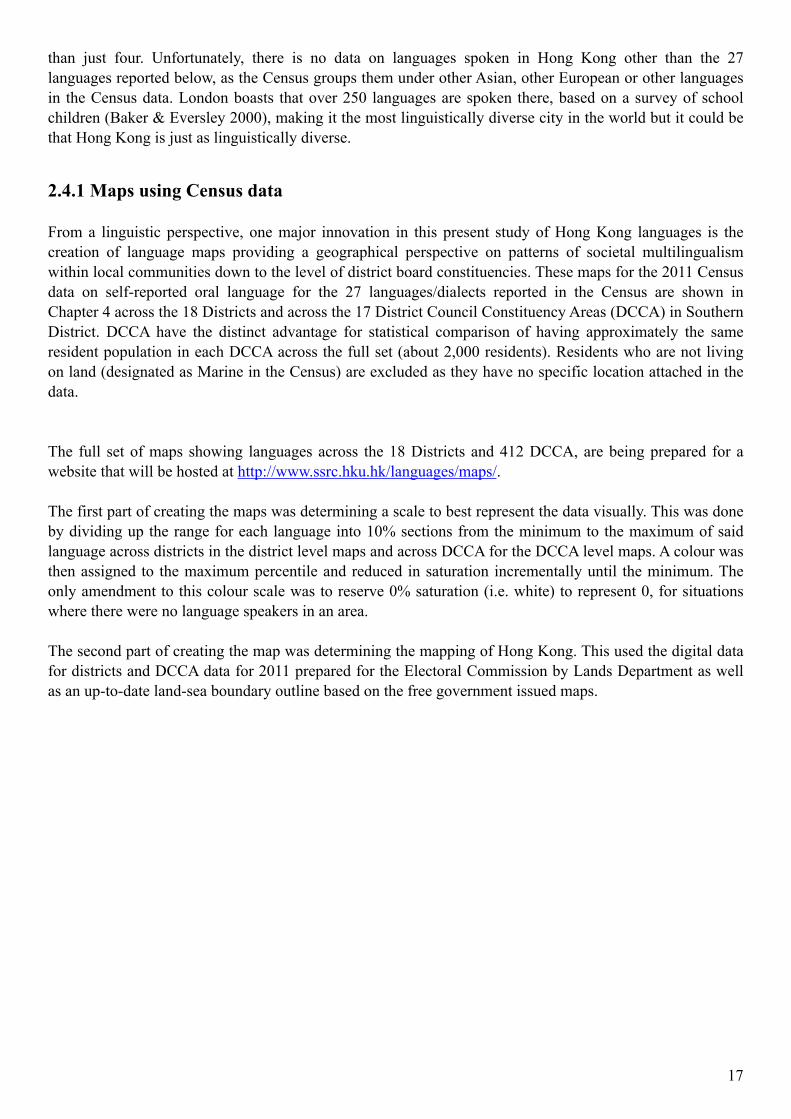
2.4.1 Maps using Census data
From a linguistic perspective, one major innovation in this present study of Hong Kong languages is the creation of language maps providing a geographical perspective on patterns of societal multilingualism within local communities down to the level of district board constituencies. These maps for the 2011 Census data on self-reported oral language for the 27 languages/dialects reported in the Census are shown in Chapter 4 across the 18 Districts and across the 17 District Council Constituency Areas (DCCA) in Southern District. DCCA have the distinct advantage for statistical comparison of having approximately the same resident population in each DCCA across the full set (about 2,000 residents). Residents who are not living on land (designated as Marine in the Census) are excluded as they have no specific location attached in the data.
The full set of maps showing languages across the 18 Districts and 412 DCCA, are being prepared for a website that will be hosted at http://www.ssrc.hku.hk/languages/maps/.
The first part of creating the maps was determining a scale to best represent the data visually. This was done by dividing up the range for each language into 10% sections from the minimum to the maximum of said language across districts in the district level maps and across DCCA for the DCCA level maps. A colour was then assigned to the maximum percentile and reduced in saturation incrementally until the minimum. The only amendment to this colour scale was to reserve 0% saturation (i.e. white) to represent 0, for situations where there were no language speakers in an area.
The second part of creating the map was determining the mapping of Hong Kong. This used the digital data for districts and DCCA data for 2011 prepared for the Electoral Commission by Lands Department as well as an up-to-date land-sea boundary outline based on the free government issued maps.
! 17

Chapter 3 Findings from the telephone survey
Appendix A contains the telephone survey questionnaire used for this study. The discussion of the results has been re-organised in order to improve the logical flow.
3.1 Knowledge and use of spoken languages
Table 3.1 below shows the survey results for knowledge of spoken languages at different times and in different domains of use.
Table3.1Knowledgeanduseofspokenlanguagesbypercentage
Note:Thenamesgiventolanguageshereandthroughoutthereportarebasedonthenamesusedinthe2011Census.
A number of very interesting findings may be highlighted in Table 3.1. These include the results relating to languages learnt in childhood, languages known now, the languages of the home, the languages used between friends, the languages of the workplace, self-reported language proficiency, language mixing,
Languagesspoken
Mothertongue
Beforeschool
Now Familymembers
Domes@chelpers
Friends Workcolleagues
Workclients
Cantonese 89.1% 83.2% 99.6% 97.4% 52.9% 98.2% 97.3% 94.3%
ChiuChau 0.8% 4.4% 5.8% 1.9% 0.0% 1.0% 0.1% 0.4%
Fukien 0.8% 3.1% 4.1% 1.8% 0.0% 1.4% 0.0% 0.1%
Hakka 0.9% 5.1% 6.8% 1.9% 0.0% 1.6% 0.1% 0.3%
Putonghua 4.7% 14.0% 68.0% 6.6% 3.4% 14.4% 15.0% 37.8%
Shanghainese 0.3% 1.6% 2.3% 0.8% 0.0% 0.7% 0.1% 0.0%
SzeYap 0.2% 1.3% 1.6% 0.2% 0.0% 0.1% 0.0% 0.0%
OtherChinese 1.8% 5.6% 6.5% 2.2% 0.0% 1.4% 0.4% 0.3%
English 0.6% 9.5% 62.2% 10.9% 61.8% 21.9% 33.2% 48.1%
French 0.0% 0.0% 1.8% 0.0% 0.0% 0.2% 0.1% 0.1%
German 0.0% 0.0% 0.7% 0.0% 0.0% 0.0% 0.0% 0.0%
Portuguese 0.0% 0.0% 0.0% 0.0% 0.0% 0.0% 0.0% 0.0%
Spanish 0.0% 0.1% 0.9% 0.1% 0.0% 0.0% 0.1% 0.0%
OtherEuropean 0.0% 0.0% 0.2% 0.0% 0.0% 0.0% 0.0% 0.0%
Filipino 0.0% 0.1% 0.1% 0.0% 0.3% 0.0% 0.0% 0.0%
Indonesian 0.0% 0.8% 1.2% 0.5% 1.8% 0.4% 0.1% 0.1%
Japanese 0.0% 0.2% 5.2% 0.1% 0.0% 0.5% 0.0% 0.3%
Korean 0.0% 0.0% 0.9% 0.0% 0.0% 0.1% 0.0% 0.0%
Malay 0.0% 0.1% 0.2% 0.0% 0.0% 0.0% 0.0% 0.0%
Thai 0.1% 0.1% 0.5% 0.0% 0.0% 0.1% 0.0% 0.0%
Nepalese 0.1% 0.1% 0.1% 0.1% 0.0% 0.1% 0.1% 0.0%
Urdu 0.0% 0.0% 0.0% 0.0% 0.0% 0.0% 0.0% 0.0%
Hindi 0.1% 0.1% 0.3% 0.1% 0.0% 0.0% 0.0% 0.0%
OtherAsian 0.0% 0.1% 2.5% 0.0% 0.0% 0.0% 0.0% 0.0%
Otherlanguages 0.2% 0.0% 0.1% 0.0% 0.0% 0.0% 0.0% 0.0%
! 18
languages at school, languages in the media, language attitudes and exposure to English through experience overseas.
3.1.1 ‘Mother tongue’ and languages known before school
A large body of international research in the field of bilingual studies has shown very clearly that the term ‘mother tongue’ is multiply ambiguous and often misleading. One reason for this is that the expression is open to many interpretations, including (i) the language of one’s mother; (ii) one’s most familiar language; or even (iii) the language one believes that one is most proficient in. In addition, the term carries a high ideological load, as it may also be interpreted as referring to that language that most clearly expresses the perceived identity (and ‘language loyalty’) of the individual. In the telephone survey, if respondents queried the term, the interviewers were given guidance to explain ‘mother tongue’ as referring to ‘one’s most familiar language’, but there is no guarantee that all or even most respondents interpreted the question thus.
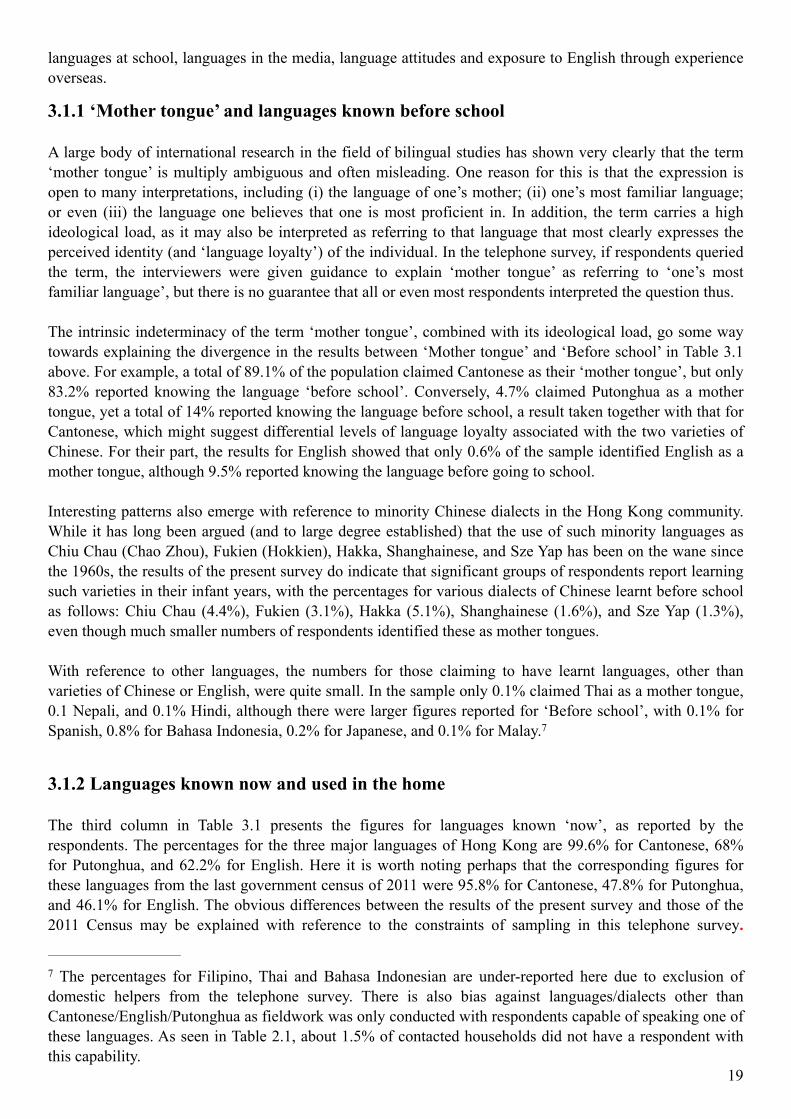
The intrinsic indeterminacy of the term ‘mother tongue’, combined with its ideological load, go some way towards explaining the divergence in the results between ‘Mother tongue’ and ‘Before school’ in Table 3.1 above. For example, a total of 89.1% of the population claimed Cantonese as their ‘mother tongue’, but only 83.2% reported knowing the language ‘before school’. Conversely, 4.7% claimed Putonghua as a mother tongue, yet a total of 14% reported knowing the language before school, a result taken together with that for Cantonese, which might suggest differential levels of language loyalty associated with the two varieties of Chinese. For their part, the results for English showed that only 0.6% of the sample identified English as a mother tongue, although 9.5% reported knowing the language before going to school.
Interesting patterns also emerge with reference to minority Chinese dialects in the Hong Kong community. While it has long been argued (and to large degree established) that the use of such minority languages as Chiu Chau (Chao Zhou), Fukien (Hokkien), Hakka, Shanghainese, and Sze Yap has been on the wane since the 1960s, the results of the present survey do indicate that significant groups of respondents report learning such varieties in their infant years, with the percentages for various dialects of Chinese learnt before school as follows: Chiu Chau (4.4%), Fukien (3.1%), Hakka (5.1%), Shanghainese (1.6%), and Sze Yap (1.3%), even though much smaller numbers of respondents identified these as mother tongues.
With reference to other languages, the numbers for those claiming to have learnt languages, other than varieties of Chinese or English, were quite small. In the sample only 0.1% claimed Thai as a mother tongue, 0.1 Nepali, and 0.1% Hindi, although there were larger figures reported for ‘Before school’, with 0.1% for Spanish, 0.8% for Bahasa Indonesia, 0.2% for Japanese, and 0.1% for Malay. 7
3.1.2 Languages known now and used in the home
The third column in Table 3.1 presents the figures for languages known ‘now’, as reported by the respondents. The percentages for the three major languages of Hong Kong are 99.6% for Cantonese, 68% for Putonghua, and 62.2% for English. Here it is worth noting perhaps that the corresponding figures for these languages from the last government census of 2011 were 95.8% for Cantonese, 47.8% for Putonghua, and 46.1% for English. The obvious differences between the results of the present survey and those of the 2011 Census may be explained with reference to the constraints of sampling in this telephone survey.
The percentages for Filipino, Thai and Bahasa Indonesian are under-reported here due to exclusion of 7
domestic helpers from the telephone survey. There is also bias against languages/dialects other than Cantonese/English/Putonghua as fieldwork was only conducted with respondents capable of speaking one of these languages. As seen in Table 2.1, about 1.5% of contacted households did not have a respondent with this capability.
! 19

Nevertheless, despite this, the ranking of the three major languages does broadly agree with that of the last Census, as may be seen here.
The figures for languages known now also provide a broad overview of the degree and types of multilingualism in Hong Kong society. With reference to minority Chinese dialects, relatively large percentages claim a knowledge of Hakka (6.8%), Chiu Chau (5.8%), and Fukien (4.1%), with smaller totals for Shanghainese (2.3%) and Sze Yap (1.6%). Other language groups achieving visibility include speakers of French (1.8%), German (0.7%), Spanish (0.9%), Filipino (0.1%), Bahasa Indonesia (1.2%), Japanese (5.2%), Korean (0.9%), Malay (0.2%), Thai (0.5%), Nepali (1%), and Hindi (0.3%). However, as Chapter 4 shows, the 2011 Census data reveal a more complete and complex picture for multilingualism in the HKSAR.
With reference to use within the home, two results are most relevant, those relating to the use of language among ‘Family members’ and those for ‘Domestic helpers’. The question concerning the ‘Family’ asked interviewees to indicate which languages were ‘regularly’ used to speak with family members at home, and more than one answer was possible. Cantonese was reported as an important language of family communication in 97.4% of cases, compared with 6.6% for Putonghua, and, interestingly, 10.9% for English. This latter figure is particularly interesting given that many local linguists have argued that English has little presence in the home domain, which they argue is dominated by Cantonese (Li 1999). The reason why English is now showing up as one of the languages of the home will be an interesting topic for further investigation, but one can speculate concerning a number of possible factors, including (a) returnee families coming back to Hong Kong after sojourns in English-speaking countries abroad; (b) the growth of a middle class with an orientation towards bilingual and bicultural identity; and (c) the widespread employment of English-speaking domestic helpers in the community (see below).
As far as other Chinese languages regularly used in the home, the numbers are rather small, with Chiu Chau (1.9%), Fukien (1.8%), Hakka (1.9%), Shanghainese (0.8%), and Sze Yap (0.2%) evidently having some limited use. In addition, there were also reports of such other home languages as Spanish (0.1%), Bahasa Indonesia (0.5%), Japanese (0.1%), Nepali (0.1%), and Hindi (0.1%).
Respondents were also asked which languages they used with their domestic helpers, if indeed they had helpers in the home. The responses to these questions included 61.8% for English, 52.9% for Cantonese, 3.4% for Putonghua, and much smaller totals for Filipino and Bahasa Indonesia.
3.1.3 Languages used with friends
The main languages in the domain of friendship were again Cantonese, English and Putonghua. For this question, respondents were again asked about which languages were ‘regularly’ used with friends. The totals for the three languages were as follows: Cantonese (98.2%), English (21.9%), and Putonghua (14.4%). Only very small totals were reported for other languages, as may be seen from Table 3.1.
3.1.4 Languages at work
This question quizzed respondents on their regular language use with both colleagues and clients. With colleagues Cantonese (97.3%) was again in first place, which was followed by English (33.2%) and by Putonghua (15%). However the figures for communicating at work with clients were somewhat different with Cantonese at 94.3%, English at 48.1%, and Putonghua at 37.8%, evidently reflecting the greater utility of both English and Putonghua in dealing with workplace clients.
! 20

3.2 Use of written languages at work
Table 3.2 below sets out the results of those questions that asked the sample about the different forms of written language used in the domain of work. The numbers of respondents answering these questions were drawn from a sub-set of the sample, i.e. those working, and those who used languages for writing and reading, with n=492 for writing internal documents at work (‘Internal work writing’), n=433 for writing documents for external use (‘External work writing’), and n=473 (for ‘Reading at work’).
Table3.2Useofwricenlanguagesatworkfordifferentpurposes
As may be seen from Table 3.2 above, English still has a major currency in the workplace (Bacon-Shone and Bolton 2014). The largest percentages were reported for English for internal communications (85.8%), external communications (85.5%) and for reading at work (86.9%). The corresponding totals for materials in traditional characters were 65.4%, 70%, and 77.8%. Much smaller percentages were reported for simplified Chinese, with totals of 11.2%, 15.9%, and 86.9%, as well as very small percentages for other European and Asian languages.
3.3 Self-reported language proficiency
Table 3.3 shows the self-reported language proficiency for Oral Cantonese, Oral Putonghua, Oral English, Written Traditional Chinese, Written Simplified Chinese and Written English. This shows high levels of proficiency for Oral Cantonese (92.1% quite well or better) and written Traditional Chinese (78.3% quite well or better), moderate proficiency for Written English (46% quite well or better), Oral Putonghua (45.7% quite well or better), Oral English (41.6% quite well or better) and Written Simplified Chinese (31.6% quite well or better). These results are revisited in Chapter 4, using the external validation from the oral and written samples.
WriCenlanguage Internalworkwri@ng Externalworkwri@ng Readingatwork
Tradi<onalChinese 65.4% 70.0% 77.8%
SimplifiedChinese 11.2% 15.9% 20.7%
English 85.8% 85.5% 86.9%
OtherEuropean 0.0% 0.2% 0.8%
OtherAsian 0.4% 0.5% 1.1%
! 21

Table3.3 Self-reportedproficiency forOralCantonesePutonghua&English,WricenTradi<onalChinese,SimplifiedChinese&English
The questionnaire also included other items related to the bilingual proficiency of respondents with reference to Chinese-English bilingualism. One question asked whether individuals considered themselves to be ‘someone who knows both Chinese and English’ (Bilingual 1 question). The second question used a more subtle question, asking if individuals considered themselves to be ‘bilingual’, with the matrix of the question posed in Chinese and ‘bilingual’ inserted in a ‘mixed fashion’ (Bilingual 2 question). The responses to the Bilingual 1 question were as follows: 57.6% of the sample answered ‘yes’, that they did consider themselves to know both languages. The responses to the Bilingual 2 question were: 22.1% answered ‘yes’; 14.4% ‘partly’; 5.4 ‘don’t know’; with 52% not understanding the question. These results are set out in Tables 3.4 and 3.5.
Table 3.4 Knowing both English and Chinese and whether ‘bilingual’
3.4 Language mixing
A number of items in the questionnaire concerned language mixing, in relation to the mixing of Cantonese and English (by self and others), as well as the mixing of Cantonese and Putonghua (by self and others). The results for these questions are set out in Tables 3.5 and 3.6 below. As in previous surveys, it was expected that the reported mixing of others would result in higher rates than oneself, and so it turned out to be consistently, for both Cantonese-English and Cantonese-Putonghua mixing.
Proficiency OralCantonese
OralPutonghua
OralEnglish
WriCenTradi@onalChinese
WriCenSimplifiedChinese
WriCenEnglish
Notatall 0.2% 10.6% 20.8% 4.1% 25.3% 22.4%
Afewsentences 0.6% 12.6% 12.5% 2.7% 10.7% 9.8%
Alicle 7.1% 31.1% 25.1% 14.8% 32.4% 21.9%
Quitewell 26.7% 26.8% 24.7% 28.2% 18.2% 25.4%
Well 19.4% 12.6% 12.7% 21.1% 8.1% 14.4%
Verywell 46.0% 6.3% 4.2% 29.0% 5.3% 6.2%
Level KnowingbothEnglishandChinese Whether‘bilingual’
Yes 57.6% 22.1%
No 42.4% 14.4%
Partly -- 6.1%
Don'tKnow -- 5.4%
Don'tUnderstand -- 52.0%
! 22
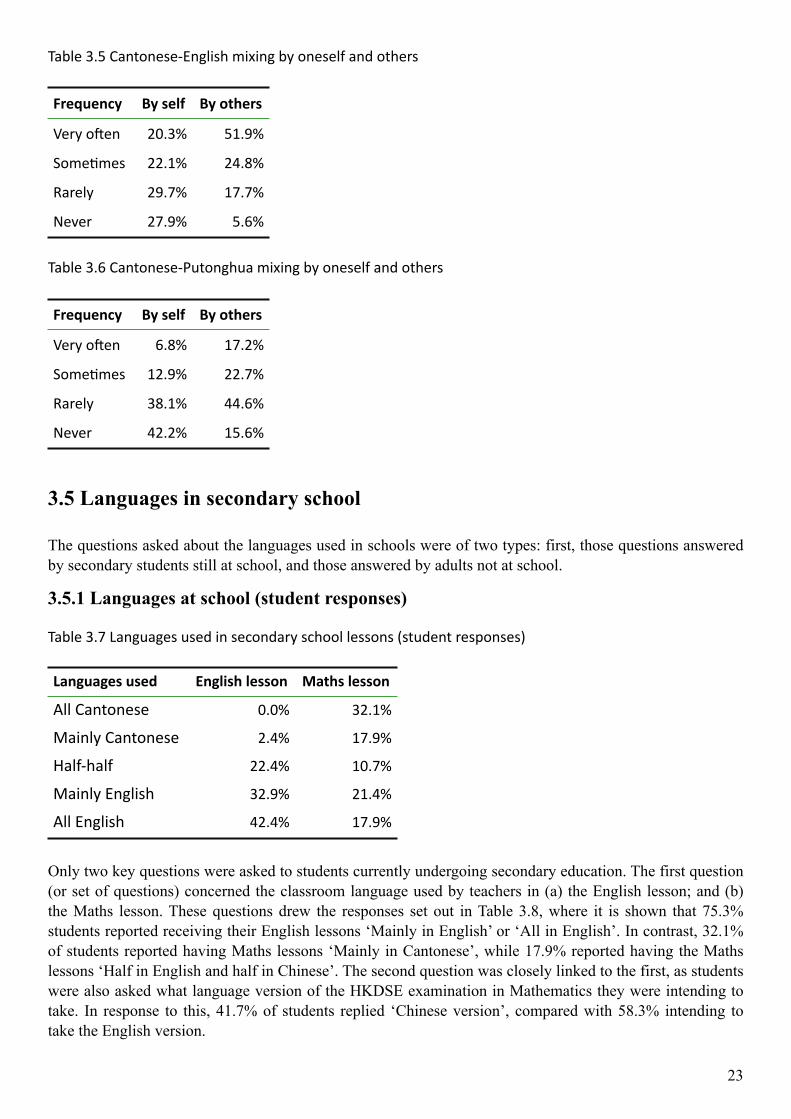
Table3.5Cantonese-Englishmixingbyoneselfandothers
Table3.6Cantonese-Putonghuamixingbyoneselfandothers
3.5 Languages in secondary school
The questions asked about the languages used in schools were of two types: first, those questions answered by secondary students still at school, and those answered by adults not at school.
3.5.1 Languages at school (student responses)
Table3.7Languagesusedinsecondaryschoollessons(studentresponses)
Only two key questions were asked to students currently undergoing secondary education. The first question (or set of questions) concerned the classroom language used by teachers in (a) the English lesson; and (b) the Maths lesson. These questions drew the responses set out in Table 3.8, where it is shown that 75.3% students reported receiving their English lessons ‘Mainly in English’ or ‘All in English’. In contrast, 32.1% of students reported having Maths lessons ‘Mainly in Cantonese’, while 17.9% reported having the Maths lessons ‘Half in English and half in Chinese’. The second question was closely linked to the first, as students were also asked what language version of the HKDSE examination in Mathematics they were intending to take. In response to this, 41.7% of students replied ‘Chinese version’, compared with 58.3% intending to take the English version.
Frequency Byself Byothers
Veryoken 20.3% 51.9%
Some<mes 22.1% 24.8%
Rarely 29.7% 17.7%
Never 27.9% 5.6%
Frequency Byself Byothers
Veryoken 6.8% 17.2%
Some<mes 12.9% 22.7%
Rarely 38.1% 44.6%
Never 42.2% 15.6%
Languagesused Englishlesson Mathslesson
AllCantonese 0.0% 32.1%
MainlyCantonese 2.4% 17.9%
Half-half 22.4% 10.7%
MainlyEnglish 32.9% 21.4%
AllEnglish 42.4% 17.9%
! 23

Table3.8DSEMathslanguage
3.5.2 Languages at school (adult responses)
In addition to those questions aimed at current students, there were also a number of questions answered by members of the general population, concerning various issues related to the medium of instruction (MOI) adopted by secondary schools. As shown in Table 3.9, around 47% of respondents had attended Chinese as the Medium of Instruction (CMI) schools, compared with a total of around 30% for English as the Medium of Instruction (EMI) schools. In addition, 23.5% of the sample reported having attended both types of schools. Respondents were also asked to choose what type of school they would send their own children to. The results for this question are set out in Table 3.10.
Table3.9Themediumofinstruc<onatyoursecondaryschool
Table3.10PreferredMOIforownchildrenifmakingthechoicetoday
In a related question, respondents were asked whether Chinese language and literature should be taught in ‘Cantonese’, ‘Putonghua’ or ‘Both’. The results for this question are set out in Table 3.11 below. As may be seen from the table, some 30% favoured Cantonese, and only 8% opted for Putonghua, while the majority of around 61% chose both.
Language Percentages
Chinese 41.7%
English 58.3%
Total 100.0%
MOI Percentages
CMI 46.6%
EMI 29.9%
Both 23.5%
ESF/Interna<onal 0.1%
MOI Percentages
CMI 35.3%
EMI 47.9%
Both 13.2%
ESF/Interna<onal 3.6%
! 24

Table3.11ChineselanguageandliteratureshouldbetaughtinCantonese,Putonghuaorboth
In relation to their English learning experiences, respondents were asked about the type of English that they learnt at school, which is shown in Table 3.12.
Table3.12VarietyofEnglishlearntatsecondaryschool
3.6 Language use for the media and Internet
A number of questions in the survey focused on patterns of language use related to the use of languages in the media, including such ‘old’ media as books, newspapers, television and the cinema, as well as the new media as the Internet. Table 3.13 sets out the results for the frequency of use of selected media with reference to the choice of language.
Table3.13FrequencyoflanguageuseformediaandInternet
Languagetaughtin Percentages
Cantonese 30.5%
Putonghua 8.4%
Both 61.1%
VarietyofEnglish Percentages
Bri<sh 78.2%
HongKong 12.8%
NorthAmerican 8.0%
Others 1.0%
Frequencyofuse VeryoQen Some@mes Rarely Never
Englishinmovies 26.2% 24.1% 26.3% 18.4%
EnglishTV 20.7% 34.6% 30.0% 14.7%
PutonghuaTV 13.7% 26.9% 39.7% 19.8%
English newspaper/mag
6.2% 16.0% 32.0% 45.8%
Englishbooks 8.5% 17.3% 30.8% 43.4%
TradChinesebooks 48.7% 25.1% 16.8% 9.4%
SimpChinesebooks 7.3% 18.9% 40.4% 33.5%
UseInternet 59.6% 9.7% 8.3% 22.4%
Englishweb 25.3% 22.9% 26.9% 24.9%
TradChineseweb 73.5% 13.7% 8.9% 3.8%
SimplChineseweb 10.2% 21.7% 42.4% 25.8%
! 25

What is noticeable from Table 3.13 above is that there is evidence that many in the survey reported exposure to English in the cinema, with some 50.3% reporting ‘Very often’ or ‘Sometimes’ watching English-language movies; with similar figures of 55.3% for English-language television, 22.2% for newspapers and magazines, and 25.8% for English-language books. In contrast, a total of 40.6% of the sample stated that they ‘Very often’ or ‘Sometimes’ watched Putonghua-medium television, and 26.2% reported reading books in simplified Chinese characters at a similar level of frequency. This latter percentage, however, was much smaller than the comparable figure of 73.8% for books utilizing traditional Chinese characters.
When it came to Internet usage, the figures for ‘Very often’ or ‘Sometimes’ for the main three language options chosen by Hong Kong people were (i) the traditional Chinese web, 87.2%; (ii) the English web, 48.2%; and (iii) the simplified Chinese web, 31.9%.
Taken cumulatively (with information from other sections of the survey) there is strong evidence that Hong Kong people routinely utilise a locally-distinctive pattern of media usage where Cantonese and traditional characters continue to play a major role while English and Putonghua play minor yet significant roles as well. The data the survey elicited on web searching tends to confirm this judgment, as seen in Table 3.14, with 60.4% reporting they used Google (trilingual) for web searches, compared with 37.8% using Yahoo (primarily traditional Chinese), 1.5% using Baidu (simplified Chinese), 0.1% using Bing (trilingual), and 0.1% using Sogou (simplified Chinese).
Table3.14Searchenginemostokenusedforwebsearching
Respondents were also asked about their language behaviour when using email, conducting web searches, and sending SMSs. The results are set out in Table 3.15 below.
Table3.15PercentagesusingdifferentlanguagesforEmail,WebsearchandSMS
Here it is noticeable that there is a greater use of Chinese for all three purposes, which is most pronounced in the figures for SMS messaging. In addition, however, it is also worth noting that between 23.3% and 28.6% also report using both English and Chinese for such purposes.
Searchengine Percentages
Google 60.4%
Yahoo 37.8%
Baidu 1.5%
Bing 0.1%
Sogou 0.1%
Languages Email Search SMS
Chinese 45.4% 53.0% 64.2%
English 31.3% 18.3% 12.3%
English&Chinese 23.3% 28.6% 23.5%
Other 0.1% 0.1% 0.0%
! 26

3.7 Language attitudes
The survey also included a substantial number of questions relating language attitudes of various kinds. These included items concerning the perceived status of particular languages, the difficulty of various languages, and the extent to which the Cantonese language was seen to be under threat in contemporary Hong Kong.
3.7.1 Perceived status of various languages
Table 3.16 below presents the results for community perceptions of the status of the three major languages of Hong Kong society in terms of modernity, business utility, cultural importance, and likely future status.
Table3.16TheperceivedstatusofHongKong’sthreemajorlanguages
The results in Table 3.16 indicate that Cantonese has a high perceived status as the ‘most modern’ (69.3%) and ‘First language of Hong Kong culture’ (81.4%). Interestingly, however, only a small overall majority (57.6%) expressed confidence that Cantonese would remain the first language of Hong Kong society ‘in future’. This latter issue was also explored in another question, which directly asked respondents whether they believed that Cantonese was ‘endangered’ in any way at present. Table 3.17 presents the results relating to the question of whether respondents regarded Cantonese as an ‘endangered’ language.
Table3.17HowseriouslyendangeredisCantoneseatpresent?
The results for this question may be interpreted in a number of ways. A total of 54.9% of the sample evidently believed that Cantonese was under little or no threat, but it is also the case that a total of 45.2% (‘Moderately’, ‘A lot’, ‘Critically’) believed that the survival of the language was endangered to some extent. A somewhat related question also asked whether it would be acceptable ‘if the next Chief Executive of Hong Kong speaks Putonghua but not Cantonese’. The answer to this question was 17.3% for ‘Yes’, and 82.7% for ‘No’.
Language MostmodernlanguageinHongKongsociety
Firstlanguageofbusiness
FirstlanguageofHongKong
culture
FirstlanguageofHongKongsocietyin
future
Putonghua 9.6% 17.3% 6.5% 26.5%
Cantonese 69.3% 23.6% 81.4% 57.6%
English 16.1% 50.1% 7.6% 10.8%
Don'tKnow 4.9% 9.0% 4.4% 5.0%
Level Percentages
Notatall 23.1%
Alicle 31.8%
Moderately 30.1%
Alot 11.7%
Cri<cally 3.4%
! 27

Table3.18AcceptableifnextChiefExecu<vespeaksPutonghuabutnotCantonese
3.7.2 Perceived difficulty of various languages
The survey also included questions related to the perceived difficulty of various languages. As may be seen from Table 3.19, Cantonese (62.6%) was judged to be the easiest spoken language to learn, followed by English (16.4%) and Putonghua (16.2%).
Table3.19Easiestspokenlanguagetolearn
When it came to written varieties of language, English appears to fare significantly better, and the running order, in terms of descending levels of ease, was Traditional Chinese (51.7%), English (31.3%), and Simplified Chinese (9.3%), as illustrated by Table 3.20.
Table3.20Easiestwricenlanguagetolearn
3.7.3 Perceptions concerning the identity of respondents
As in previous surveys, respondents were asked questions concerning their own perceived identities. The results for this question are set out in Table 3.21 below.
Response Percentages
Yes 17.3%
No 82.7%
Language Percentages
Putonghua 16.2%
Cantonese 62.6%
English 16.4%
Don'tKnow 4.8%
Total 100.0%
Language Percentages
Tradi<onalChinese 51.7%
SimplifiedChinese 9.3%
English 31.3%
Nodifference 7.7%
! 28

Table3.21Whatwouldyousayyouriden<tyis?
In this context, the issue of identity is interesting as a potentially important variable in explaining certain language preferences, a tendency that may be examined through further statistical analysis.
3.8 Use of languages in everyday life
A number of questions were included in the survey relating to the ‘everyday’ language habits of Hong Kong people. Such questions were considered useful because, potentially, they might reveal various tensions between policy and practice, while at the same time revealing some of the complexities of multilingual behaviour in Hong Kong. Table 3.22 illustrates that while Chinese is the dominant language used for an ATM, English is used almost as often as Chinese when it comes to cheques.
Table3.22Theuseoflanguagesinrou<nebankservices
Other questions revealed that even naming practices in Hong Kong society has a bilingual or multilingual dimension. Some 64.1% of respondents reported having an English name, which 66.4% reported using very frequently (‘Always’ and ‘Most of the time’). A total of 25.8% of respondents stated that their English name was inscribed on their official identity cards.
Table 3.23 Use of English names
Iden@ty Percentages
Chinese 24.4%
HongKongChinese 36.9%
HongKong 34.6%
Bri<shHongKong 1.9%
Other 2.3%
Language OnanATM Foramountonacheque
Forsignatureonacheque
Chinese 80.6% 51.5% 46.9%
English 19.3% 48.5% 49.1%
Chinese&English 3.9%
Level HaveanEnglishname EnglishnameisonHKIDcard
Yes 64.1% 25.8%
No 35.9% 74.2%
! 29

Table 3.24 Frequency of using English name
3.9 Choice of variety of English
Respondents were asked about their preferred variety of English in two ways. First they were asked which accent of English they preferred to adopt when speaking themselves. To this question, 61.9% responded ‘British accent’, and 15.6% replied ‘American accent’. A further 22.5%, however, stated that they preferred a ‘Hong Kong accent’. Respondents we also asked which variety of English should serve as the target model for secondary students. Here the responses indicated a percentage of 57% for British English, 7.8% for ‘American English’, and 31.8% for ‘International English’ (however that might be interpreted) as indicated by Table 3.25.
Table 3.25 Choice of English for accent and schools
In addition, interviewees were also asked whether, in their opinion, there was such a variety as a ‘unique style of Hong Kong English’. In answer, a total of 82.8% answered ‘yes’ as illustrated in Table 3.26.
Table 3.26 UniqueHongKongstyleofEnglishexists
3.10 English language exposure abroad
Another factor contributing to the development of English proficiency in the Hong Kong community is closely connected to the cosmopolitan character of many Hong Kongers who regularly travel overseas, who
Frequency Percentages
Always 53.9%
Mostofthe<me 12.5%
Some<mes 15.8%
Rarely 15.6%
Never 2.3%
Total 100.0%
Level Preferredaccent Englishforsecondaryschools
Bri<sh 61.9% 57.0%
American 15.6% 7.8%
HongKong 22.5% 3.4%
Interna<onal 31.8%
HongKongEnglishexists Percentages
Yes 82.8%
No 17.2%
! 30

have relatives in English-speaking countries, and many of whom may have lived in English-speaking countries such as the Australia, New Zealand, the UK, the US, etc. As may be seen from Tables 3.27-29 below, some 35% of our sample reported having close relatives in English-speaking countries, while 19% had lived in such countries themselves. Among these, the mean length of stay in such places was 4.7 years.
Table3.27Closerela<vesinEnglish-speakingcountry?
Table3.28LivedinEnglish-speakingcountry?
Table3.29Longeststayabroad(inyears)
3.11 Languages spoken now by age group
Another important finding that came out of the survey related to varying abilities (based on self-report) across age ranges. Table 3.30 shows how the percentage of respondents that can speak each language changes across age groups. It is important to note that, as this is a cross-sectional survey, we cannot be certain as to which differences are due to learning with age which are due to cohort differences and which due to immigration, except that learning can only lead to increased knowledge, not decreased, so any decreases in ability with age must be be mainly due to cohort differences (e.g. English) or immigration (e.g. Cantonese).
Level Percentages
Yes 35.4%
No 64.6%
Level Percentages
Yes 19.10%
No 80.90%
Lengthofstay Dura@oninyears
Minimum 0.1
LowerQuar<le 0.7
Median 2.0
UpperQuar<le 6.0
Maximum 45.0
Mean 4.7
StandardDevia<on 6.1
! 31

Table 3.30 Ability to speak languages/dialects now by age group
Agegroup 12-19 20-29 30-39 40-49 50-59 60-69 70-79 80+
Cantonese 100.0% 99.7% 98.5% 99.4% 99.2% 100.0% 99.2% 100.0%
ChiuChau 3.1% 1.4% 1.2% 6.1% 7.9% 6.2% 10.2% 5.1%
Fukien 1.2% 2.4% 4.1% 4.6% 2.4% 4.9% 8.7% 6.1%
Hakka 6.2% 5.2% 3.8% 5.2% 5.5% 9.5% 11.0% 7.1%
Putonghua 91.9% 93.1% 80.3% 77.2% 66.0% 57.2% 47.2% 31.3%
Shanghainese 0.0% 0.7% 1.8% 1.2% 1.8% 4.5% 3.9% 4.0%
SzeYap 0.6% 0.0% 0.0% 1.2% 2.1% 1.6% 4.7% 4.0%
OtherChinese 2.5% 4.9% 7.4% 7.2% 4.0% 7.4% 11.0% 9.1%
English 96.9% 97.2% 81.8% 76.9% 61.7% 46.1% 21.3% 16.2%
French 3.1% 5.2% 2.6% 1.2% 1.3% 1.2% 0.8% 0.0%
German 1.9% 2.1% 0.6% 0.6% 0.5% 0.4% 0.8% 0.0%
Spanish 1.2% 3.5% 0.6% 0.6% 0.8% 0.4% 0.8% 0.0%
OtherEuropean 0.0% 0.3% 1.2% 0.0% 0.0% 0.4% 0.8% 0.0%
Filipino 0.0% 0.3% 0.0% 0.0% 0.0% 0.4% 0.0% 0.0%
Indonesian 0.6% 0.3% 1.2% 0.6% 0.5% 1.2% 3.9% 4.0%
Japanese 13.0% 10.4% 12.4% 2.9% 4.2% 2.9% 1.6% 1.0%
Korean 4.3% 3.1% 0.6% 0.3% 0.3% 0.0% 0.0% 0.0%
Malay 0.0% 0.0% 0.0% 0.3% 0.3% 0.0% 0.8% 1.0%
Thai 1.9% 0.0% 0.6% 0.3% 0.8% 0.8% 0.0% 0.0%
Nepalese 0.0% 0.0% 0.6% 0.3% 0.3% 0.0% 0.0% 0.0%
Hindi 0.0% 0.0% 2.6% 0.3% 0.3% 0.0% 0.0% 0.0%
OtherAsian 2.5% 1.0% 4.4% 2.0% 2.4% 3.3% 3.1% 2.0%
Other 0.0% 0.0% 0.6% 0.0% 0.3% 0.0% 0.8% 0.0%
! 32

Figure 3.1 shows the language ability now by age group for the major languages/dialects, which shows clearly that, in future, most Hong Kong educated people will be able to speak Cantonese, Putonghua and English. What is evidently the case is that a clear majority of the younger generations now growing up have a trilingual repertoire of languages.
Figure 3.1 Ability to speak major languages/dialects by age group (2014 survey)
We now compare these findings from the 2014 survey with the Census data for 1991 and 2011. Figure 3.2 shows the overall percentages who speak each language/dialect by age group in 2011 and Figure 3.3 for the 3 major languages in 1991 . This shows that in 1991 and 2011, over 90% of all age groups could speak 8
Cantonese and that the majority of young people could speak English, while the proportion who can speak other Chinese dialects increases across the age groups. However, the proportion who could speak Putonghua was less than 30% for all age groups in 1991, rising to over 50% for those under 40 in 2001 and over 90% for young people in 2014, showing a sea change in less than 25 years.
Figure 3.2 Ability to speak major languages/dialects by age group (2011 Census)
!"!!
#$"!!
$!"!!
%$"!!
&!!"!!
&#'&( #!'#( )!')( *!'*( $!'$( +!'+( %!'%( ,!-
./0120343
.5678.5/797:630;/::/<7120=57/>5/0=5/60343>?38@/AB153C8.560343D0=E645
!"!
#$"!
$!"!
%$"!
&!!"!
F&$'&(F F#$'#(F F)$')(F F*$'*(F F$$'$(F F+$-F
./0120343D0=E645<7120=57/>D8G46/0>8G46/0D7C2A3/0D/418G46/0B153C8.560343
Unfortunately, the list of South Asian and European languages recorded in the Census changed between 8
1991 and 2001, so we only show the 3 major languages for 1991 for comparison33

Figure 3.3 Ability to speak Cantonese, Putonghua and English by age group (1991 Census)
Figure 3.4 shows the overall percentages who speak combinations of Cantonese/English/Putonghua by age group in 2011 while Figure 3.5 shows the results in 1991. This shows that the majority of young people in 2011are trilingual, while for the older people, Cantonese (without English or Putonghua) is dominant. It is noteworthy that there are so few (below 1%, except for the 65+ age group, where it is 2.1%) residents in 2011 who speak not one of the three languages, Cantonese, English or Putonghua. This explains why the line in the figure below for this group is nearly invisible and provides support for the methodological decision to conduct this survey only in the three major languages in Hong Kong.
Figure 3.4 Ability to speak Cantonese/English/Putonghua combinations by age (2011 Census)
However, back in 1991, trilinguals were relatively rare, comprising less than 20% of the population for all age groups, with Cantonese monolinguals or Cantonese bilinguals dominant for all age groups."
!"!
#$"!
$!"!
%$"!
&!!"!
F&$'&(F F#$'#(F F)$')(F F*$'*(F F$$'$(F F+$-F
./0120343D0=E645<7120=57/
!"!
&%"$
)$"!
$#"$
%!"!
F&$'&(F F#$'#(F F)$')(F F*$'*(F F$$'$(F F+$-F
./0120343
./01-D0=
./01-D0=-<71
./01-<71D0=E645H28.-D-<<7120=57/<71-D0=
34

Figure 3.5 Ability to speak Cantonese/English/Putonghua combinations by age (1991 Census)
Figure 3.6 shows the overall percentages who speak combinations of Cantonese/English/Putonghua amongst those who speak another Chinese dialect by age group in 2011. This shows that the majority of young people who speak another Chinese dialect, also speak Cantonese, English and Putonghua, while the majority of middle-aged people who speak another Chinese dialect also speak Cantonese and Putonghua but not English and the majority of older people who speak another Chinese dialect also speak Cantonese but not English or Putonghua .
Figure 3.6 Ability to speak Cantonese/English/Putonghua/Chinese dialect combinations by age (2011 Census)
Figure 3.7 shows the overall percentages who speak combinations of Cantonese/English/Putonghua amongst those who speak a South Asian language by age group in 2011. This shows that among young South Asian language speakers, nearly all speak English, but nearly half speak both Cantonese and English. Only among the older South Asian speakers is there a majority who do not speak English, Cantonese or Putonghua (and hence could not respond to our language survey). This chart alone provides compelling evidence that labeling young people who speak South Asian languages as non Chinese speaking (NCS) students is simply fallacious and that they should be instead identified correctly as second language Chinese speaking (SLCS)
!"!
&%"$
)$"!
$#"$
%!"!
F&$'&(F F#$'#(F F)$')(F F*$'*(F F$$'$(F F+$-F
./0120343
./01-D0=
./01-D0=-<71
./01-<71D0=E645H28.-D-<<7120=57/<71-D0=
!"!
&%"$
)$"!
$#"$
%!"!
F&$'&(F F#$'#(F F)$')(F F*$'*(F F$$'$(F F+$-F
./01-.582153C
./01-D0=-.582153C
./01-D0=-<71-.582153C
./01-<71-.582153CD-.582153C.582153C820EI<71-.582153C<71-D0=-.582153C
35

students. Unfortunately, the 2011 Census does not provide information on languages for reading and writing, making it impossible to compare with the results from our survey, but the 2016 By-Census is designed to collect this information on the entire sample, which will facilitate better policy decisions on the written language needs of the resident population.
Figure 3.7 Ability to speak Cantonese/English/Putonghua/South Asian language combinations by age (2011 Census)
!"!!!
##"$!!
*$"!!!
+%"$!!
(!"!!!
F&$'&(F F#$'#(F F)$')(F F*$'*(F F$$'$(F F+$-F
.->G
.D->G
.D<->G
.<->GD->G>G820EI<->G<D->G
36

Chapter 4 Language maps
4.1 Introduction
This chapter shows maps that illustrate the percentage of the population aged 5+ who reported that they could speak these languages/dialects. This question was included in the Census long form, which was used for 10% of households (over 200k households, over 600k respondents) and the calculations apply the person weights, to ensure that they are representative of the 2011 Census population (excluding Marine). This analysis used the Self-Help Tabulation Service, with the assistance of Census and Statistics staff, in order to access the full 10% sample of households.
Table 4.1 provides the overall, minimum and maximum percentages of people aged 5 or above who reported being able to speak each of the 27 languages recorded in the 2011 Census overall, across the 18 districts and across the 412 constituency areas and where in Hong Kong to find the highest proportion of speakers of each language/dialect.
This shows, for example, that although no district has less than 85% of Cantonese speakers, there are constituency areas when only about half of residents are Cantonese speakers and other constituency areas where less than 1% are not Cantonese speakers. Similarly, while no district has less than 36% of residents being English speakers, there are constituency areas with as low as 22% or as high as 93% being English speakers.
This table also shows that in addition to the three major languages of Hong Kong, from Census data we can also identify twenty-four minor languages that were spoken by at least 1,000 residents in Hong Kong in 2011. These include previously well recognised minority Chinese languages, as well as a wide range of other languages from Asia and across the globe, including Hindi, Thai, Urdu, Korean, Japanese, French, Spanish, German, and Italian.
It is noteworthy that language diversity is higher than commonly assumed, with nine languages/dialects that are spoken by at least one tenth of residents in at least one constituency area and fifteen languages/dialects spoken by at least one twentieth of residents in at least one constituency area.
It is also interesting to note that: • Kam Ping in Eastern district has the highest proportion of both Putonghua and Fukien speakers • the Peak has the highest proportion of both English and Filipino speakers • Discovery Bay has the highest proportion of both French and German speakers • Mid Levels East has the highest proportion of Italian and Spanish speakers • Jordan has the highest proportion of Bengali and Urdu speakers (in East and West Jordan respectively) • Tsim Sha Tsui has the highest proportion of Hindi and Japanese speakers (in East and West TST
respectively).
! 37

Table 4.1 Range of languages/dialects across Districts and Constituency Areas
For each of the 27 languages/dialects, there is one map showing the 18 Districts (excluding Marine) and one map showing the 17 Constituency Areas in Southern District, so there are a total of 54 maps presented here. The full set of 513 (27 x 19) maps will be made available at http://www.ssrc.hku.hk/languages/maps/, when ready, to allow everyone to see the full range of language diversity in Hong Kong across all 412 Constituency Areas.
4.2 Language maps for languages/dialects in Hong Kong
Language Overall MinDistricts MaxDistricts MinDCCA MaxDCCA DCCAwithMax
Cantonese 95.839% 84.93% 98.42% 56.34% 99.76% TaiPo:FuMingSun
Putonghua 47.852% 42.58% 52.93% 30.97% 64.19% Eastern:KamPing
English 46.070% 35.83% 69.50% 21.68% 93.17% Central&Western:Peak
Hakka 4.731% 1.07% 10.67% 0.32% 27.40% North:ShaTa
ChiuChau 3.768% 1.86% 6.74% 0.50% 11.64% KowloonCity:LungShing
Fukien 3.497% 1.15% 8.97% 0.00% 30.81% Eastern:KamPing
Indonesian 2.430% 1.83% 4.00% 0.29% 7.80% WanChai:CausewayBay
Filipino 1.655% 0.48% 6.63% 0.00% 18.40% Central&Western:Peak
SzeYap 1.537% 0.68% 4.32% 0.00% 8.66% ShamShuiPo:NamCheongC
Japanese 1.527% 1.08% 2.98% 0.09% 8.15% YauTsimMong:TsimShaTsuiW
Shanghainese 1.130% 0.64% 2.43% 0.00% 6.53% TsuenWan:FukLoi
French 0.596% 0.20% 2.93% 0.00% 11.42% Islands:DiscoveryBay
Hindi 0.488% 0.10% 2.12% 0.00% 13.22% YauTsimMong:TsimShaTsuiE
Thai 0.329% 0.18% 0.87% 0.00% 3.68% KowloonCity:LungShing
Urdu 0.244% 0.03% 0.81% 0.00% 3.80% YauTsimMong:JordanW
Spanish 0.237% 0.08% 1.32% 0.00% 3.10% Central&Western:MidLevelsE
Nepali 0.236% 0.00% 2.25% 0.00% 9.85% YauTsimMong:YauMaTei
German 0.227% 0.06% 0.93% 0.00% 5.27% Islands:DiscoveryBay
Korean 0.211% 0.09% 0.57% 0.00% 2.04% Islands:TungChungN
Vietnamese 0.093% 0.04% 0.20% 0.00% 1.52% TuenMun:SanHui
Malay 0.093% 0.05% 0.28% 0.00% 1.23% North:YuTai
Italian 0.073% 0.02% 0.51% 0.00% 1.77% Central&Western:MidLevelsE
Dutch 0.044% 0.01% 0.15% 0.00% 1.01% SaiKung:PakShaWan
Portuguese 0.027% 0.00% 0.12% 0.00% 0.71% Southern:BaysArea
Russian 0.026% 0.00% 0.10% 0.00% 0.46% Southern:Pokfulam
Bengali 0.026% 0.01% 0.10% 0.00% 0.94% YauTsimMong:JordanE
Sinhalese 0.016% 0.00% 0.06% 0.00% 0.53% SaiKung:HangHauW
! 38

HONG KONG
98.418
84.929
Islands
Tuen Mun
Yuen Long
North
Tai Po
Tsuen Wan
Sha Tin
Sai KungWong Tai Sin
Kwun TongKowloon City
Yau Tsim Mong
Sham Shui PoKwai Tsing
Central & WesternWanchai Eastern
Southern
Cantonese

SOUTHERN
Ap Lei Chau Estate123456
Ap Lei Chau NorthLei Tung ILei Tung IISouth Horizons EastSouth Horizons West
Tin WanAberdeen
Wah Fu I
Chi Fu
Wong Chuk Hang
Bays AreaShek Yue Stanley & Shek O
Wah Fu II
Wah Kwai
1 2
3
45
6
Pokfulam
99.76
56.34
Cantonese

HONG KONG
Islands
Tuen Mun
Yuen Long
North
Tai Po
Tsuen Wan
Sha Tin
Sai KungWong Tai Sin
Kwun TongKowloon City
Yau Tsim Mong
Sham Shui PoKwai Tsing
Central & WesternWanchai Eastern
Southern
Putonghua
52.933
42.584

SOUTHERN
Ap Lei Chau Estate123456
Ap Lei Chau NorthLei Tung ILei Tung IISouth Horizons EastSouth Horizons West
Tin WanAberdeen
Wah Fu I
Chi Fu
Wong Chuk Hang
Bays AreaShek Yue Stanley & Shek O
Wah Fu II
Wah Kwai
1 2
3
45
6
Pokfulam
Putonghua
64.19
30.97

HONG KONG
Islands
Tuen Mun
Yuen Long
North
Tai Po
Tsuen Wan
Sha Tin
Sai KungWong Tai Sin
Kwun TongKowloon City
Yau Tsim Mong
Sham Shui PoKwai Tsing
Central & WesternWanchai Eastern
Southern
Hakka
10.675
1.066

SOUTHERN
Ap Lei Chau Estate123456
Ap Lei Chau NorthLei Tung ILei Tung IISouth Horizons EastSouth Horizons West
Tin WanAberdeen
Wah Fu I
Chi Fu
Wong Chuk Hang
Bays AreaShek Yue Stanley & Shek O
Wah Fu II
Wah Kwai
1 2
3
45
6
Pokfulam
Hakka
27.40
0.32

HONG KONG
Islands
Tuen Mun
Yuen Long
North
Tai Po
Tsuen Wan
Sha Tin
Sai KungWong Tai Sin
Kwun TongKowloon City
Yau Tsim Mong
Sham Shui PoKwai Tsing
Central & WesternWanchai Eastern
Southern
Chiu Chau
6.740
1.862

SOUTHERN
Ap Lei Chau Estate123456
Ap Lei Chau NorthLei Tung ILei Tung IISouth Horizons EastSouth Horizons West
Tin WanAberdeen
Wah Fu I
Chi Fu
Wong Chuk Hang
Bays AreaShek Yue Stanley & Shek O
Wah Fu II
Wah Kwai
1 2
3
45
6
Pokfulam
Chiu Chau
11.64
0.50

HONG KONG
Islands
Tuen Mun
Yuen Long
North
Tai Po
Tsuen Wan
Sha Tin
Sai KungWong Tai Sin
Kwun TongKowloon City
Yau Tsim Mong
Sham Shui PoKwai Tsing
Central & WesternWanchai Eastern
Southern
Fukien
8.974
1.151

SOUTHERN
Ap Lei Chau Estate123456
Ap Lei Chau NorthLei Tung ILei Tung IISouth Horizons EastSouth Horizons West
Tin WanAberdeen
Wah Fu I
Chi Fu
Wong Chuk Hang
Bays AreaShek Yue Stanley & Shek O
Wah Fu II
Wah Kwai
1 2
3
45
6
Pokfulam
Fukien
30.81
0.00

HONG KONG
Islands
Tuen Mun
Yuen Long
North
Tai Po
Tsuen Wan
Sha Tin
Sai KungWong Tai Sin
Kwun TongKowloon City
Yau Tsim Mong
Sham Shui PoKwai Tsing
Central & WesternWanchai Eastern
Southern
Sze Yap
4.316
0.682
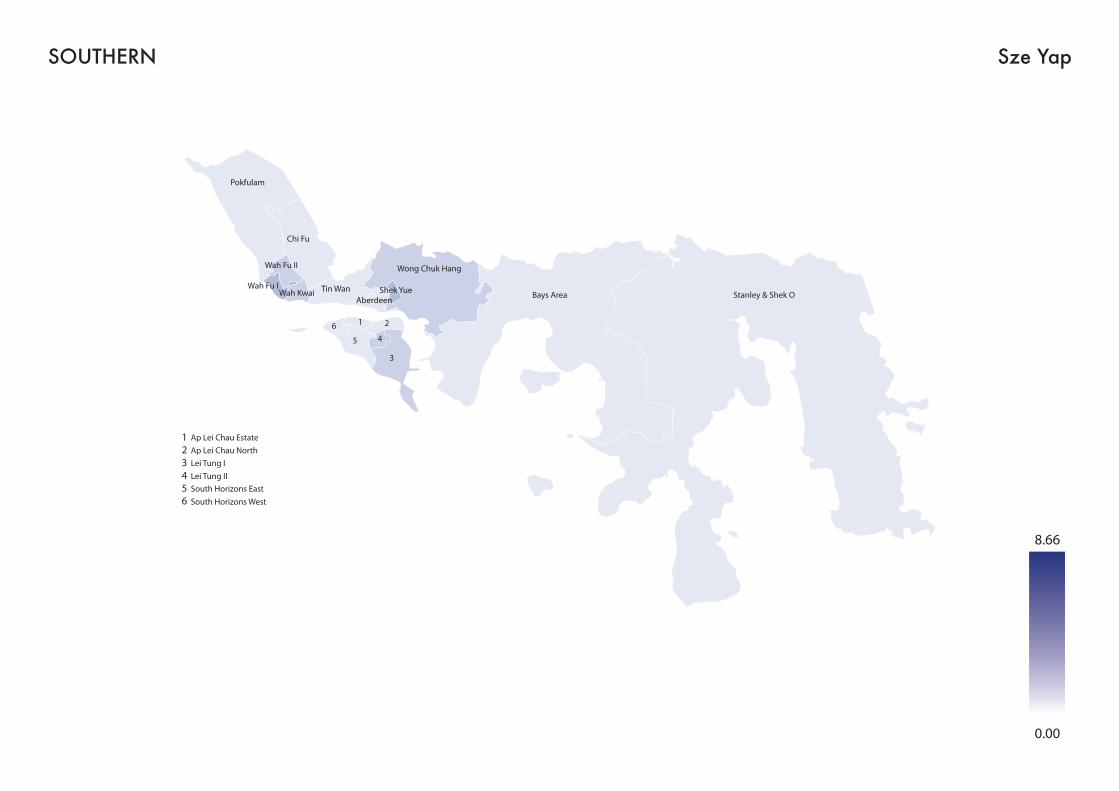
SOUTHERN
Ap Lei Chau Estate123456
Ap Lei Chau NorthLei Tung ILei Tung IISouth Horizons EastSouth Horizons West
Tin WanAberdeen
Wah Fu I
Chi Fu
Wong Chuk Hang
Bays AreaShek Yue Stanley & Shek O
Wah Fu II
Wah Kwai
1 2
3
45
6
Pokfulam
Sze Yap
8.66
0.00

HONG KONG
2.430
0.682
Islands
Tuen Mun
Yuen Long
North
Tai Po
Tsuen Wan
Sha Tin
Sai KungWong Tai Sin
Kwun TongKowloon City
Yau Tsim Mong
Sham Shui PoKwai Tsing
Central & WesternWanchai Eastern
Southern
Shanghainese

SOUTHERN
Ap Lei Chau Estate123456
Ap Lei Chau NorthLei Tung ILei Tung IISouth Horizons EastSouth Horizons West
Tin WanAberdeen
Wah Fu I
Chi Fu
Wong Chuk Hang
Bays AreaShek Yue Stanley & Shek O
Wah Fu II
Wah Kwai
1 2
3
45
6
Pokfulam
6.53
0.00
Shanghainese

HONG KONG
Islands
Tuen Mun
Yuen Long
North
Tai Po
Tsuen Wan
Sha Tin
Sai KungWong Tai Sin
Kwun TongKowloon City
Yau Tsim Mong
Sham Shui PoKwai Tsing
Central & WesternWanchai Eastern
Southern
English
69.505
35.835
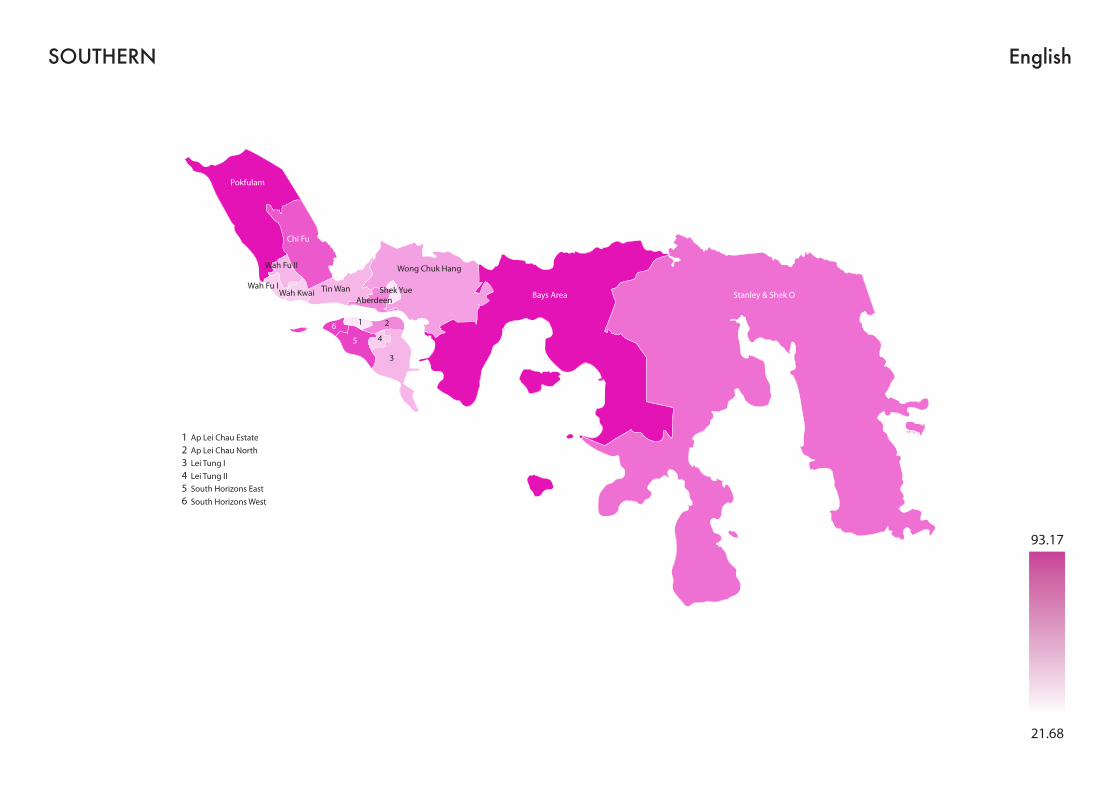
SOUTHERN
Ap Lei Chau Estate123456
Ap Lei Chau NorthLei Tung ILei Tung IISouth Horizons EastSouth Horizons West
Tin WanAberdeen
Wah Fu I
Chi Fu
Wong Chuk Hang
Bays AreaShek Yue Stanley & Shek O
Wah Fu II
Wah Kwai
1 2
3
45
6
Pokfulam
English
93.17
21.68

HONG KONG
Islands
Tuen Mun
Yuen Long
North
Tai Po
Tsuen Wan
Sha Tin
Sai KungWong Tai Sin
Kwun TongKowloon City
Yau Tsim Mong
Sham Shui PoKwai Tsing
Central & WesternWanchai Eastern
Southern
Bengali
0.104
0.009

SOUTHERN
Ap Lei Chau Estate123456
Ap Lei Chau NorthLei Tung ILei Tung IISouth Horizons EastSouth Horizons West
Tin WanAberdeen
Wah Fu I
Chi Fu
Wong Chuk Hang
Bays AreaShek Yue Stanley & Shek O
Wah Fu II
Wah Kwai
1 2
3
45
6
Pokfulam
Bengali
0.94
0.00

HONG KONG
Islands
Tuen Mun
Yuen Long
North
Tai Po
Tsuen Wan
Sha Tin
Sai KungWong Tai Sin
Kwun TongKowloon City
Yau Tsim Mong
Sham Shui PoKwai Tsing
Central & WesternWanchai Eastern
Southern
Filipino
6.627
0.476

SOUTHERN
Ap Lei Chau Estate123456
Ap Lei Chau NorthLei Tung ILei Tung IISouth Horizons EastSouth Horizons West
Tin WanAberdeen
Wah Fu I
Chi Fu
Wong Chuk Hang
Bays AreaShek Yue Stanley & Shek O
Wah Fu II
Wah Kwai
1 2
3
45
6
Pokfulam
Filipino
18.40
0.00

HONG KONG
Islands
Tuen Mun
Yuen Long
North
Tai Po
Tsuen Wan
Sha Tin
Sai KungWong Tai Sin
Kwun TongKowloon City
Yau Tsim Mong
Sham Shui PoKwai Tsing
Central & WesternWanchai Eastern
Southern
Hindi
2.122
0.103

SOUTHERN
Ap Lei Chau Estate123456
Ap Lei Chau NorthLei Tung ILei Tung IISouth Horizons EastSouth Horizons West
Tin WanAberdeen
Wah Fu I
Chi Fu
Wong Chuk Hang
Bays AreaShek Yue Stanley & Shek O
Wah Fu II
Wah Kwai
1 2
3
45
6
Pokfulam
Hindi
13.22
0.00

HONG KONG
Islands
Tuen Mun
Yuen Long
North
Tai Po
Tsuen Wan
Sha Tin
Sai KungWong Tai Sin
Kwun TongKowloon City
Yau Tsim Mong
Sham Shui PoKwai Tsing
Central & WesternWanchai Eastern
Southern
Indonesian
4.003
1.829

SOUTHERN
Ap Lei Chau Estate123456
Ap Lei Chau NorthLei Tung ILei Tung IISouth Horizons EastSouth Horizons West
Tin WanAberdeen
Wah Fu I
Chi Fu
Wong Chuk Hang
Bays AreaShek Yue Stanley & Shek O
Wah Fu II
Wah Kwai
1 2
3
45
6
Pokfulam
Indonesian
7.80
0.29

HONG KONG
Islands
Tuen Mun
Yuen Long
North
Tai Po
Tsuen Wan
Sha Tin
Sai KungWong Tai Sin
Kwun TongKowloon City
Yau Tsim Mong
Sham Shui PoKwai Tsing
Central & WesternWanchai Eastern
Southern
Japanese
2.981
1.079

SOUTHERN
Ap Lei Chau Estate123456
Ap Lei Chau NorthLei Tung ILei Tung IISouth Horizons EastSouth Horizons West
Tin WanAberdeen
Wah Fu I
Chi Fu
Wong Chuk Hang
Bays AreaShek Yue Stanley & Shek O
Wah Fu II
Wah Kwai
1 2
3
45
6
Pokfulam
Japanese
8.15
0.09

HONG KONG
Islands
Tuen Mun
Yuen Long
North
Tai Po
Tsuen Wan
Sha Tin
Sai KungWong Tai Sin
Kwun TongKowloon City
Yau Tsim Mong
Sham Shui PoKwai Tsing
Central & WesternWanchai Eastern
Southern
Korean
0.572
0.092

SOUTHERN
Ap Lei Chau Estate123456
Ap Lei Chau NorthLei Tung ILei Tung IISouth Horizons EastSouth Horizons West
Tin WanAberdeen
Wah Fu I
Chi Fu
Wong Chuk Hang
Bays AreaShek Yue Stanley & Shek O
Wah Fu II
Wah Kwai
1 2
3
45
6
Pokfulam
Korean
2.04
0.00

HONG KONG
Islands
Tuen Mun
Yuen Long
North
Tai Po
Tsuen Wan
Sha Tin
Sai KungWong Tai Sin
Kwun TongKowloon City
Yau Tsim Mong
Sham Shui PoKwai Tsing
Central & WesternWanchai Eastern
Southern
Nepali
2.247
0.000

SOUTHERN
Ap Lei Chau Estate123456
Ap Lei Chau NorthLei Tung ILei Tung IISouth Horizons EastSouth Horizons West
Tin WanAberdeen
Wah Fu I
Chi Fu
Wong Chuk Hang
Bays AreaShek Yue Stanley & Shek O
Wah Fu II
Wah Kwai
1 2
3
45
6
Pokfulam
Nepali
9.85
0.00

HONG KONG
Islands
Tuen Mun
Yuen Long
North
Tai Po
Tsuen Wan
Sha Tin
Sai KungWong Tai Sin
Kwun TongKowloon City
Yau Tsim Mong
Sham Shui PoKwai Tsing
Central & WesternWanchai Eastern
Southern
Urdu
0.813
0.034

SOUTHERN
Ap Lei Chau Estate123456
Ap Lei Chau NorthLei Tung ILei Tung IISouth Horizons EastSouth Horizons West
Tin WanAberdeen
Wah Fu I
Chi Fu
Wong Chuk Hang
Bays AreaShek Yue Stanley & Shek O
Wah Fu II
Wah Kwai
1 2
3
45
6
Pokfulam
Urdu
3.80
0.00

HONG KONG
Islands
Tuen Mun
Yuen Long
North
Tai Po
Tsuen Wan
Sha Tin
Sai KungWong Tai Sin
Kwun TongKowloon City
Yau Tsim Mong
Sham Shui PoKwai Tsing
Central & WesternWanchai Eastern
Southern
Sinhalese
0.060
0.000

SOUTHERN
Ap Lei Chau Estate123456
Ap Lei Chau NorthLei Tung ILei Tung IISouth Horizons EastSouth Horizons West
Tin WanAberdeen
Wah Fu I
Chi Fu
Wong Chuk Hang
Bays AreaShek Yue Stanley & Shek O
Wah Fu II
Wah Kwai
1 2
3
45
6
Pokfulam
Sinhalese
0.53
0.00

HONG KONG
Islands
Tuen Mun
Yuen Long
North
Tai Po
Tsuen Wan
Sha Tin
Sai KungWong Tai Sin
Kwun TongKowloon City
Yau Tsim Mong
Sham Shui PoKwai Tsing
Central & WesternWanchai Eastern
Southern
Thai
0.872
0.175

SOUTHERN
Ap Lei Chau Estate123456
Ap Lei Chau NorthLei Tung ILei Tung IISouth Horizons EastSouth Horizons West
Tin WanAberdeen
Wah Fu I
Chi Fu
Wong Chuk Hang
Bays AreaShek Yue Stanley & Shek O
Wah Fu II
Wah Kwai
1 2
3
45
6
Pokfulam
Thai
3.68
0.00

HONG KONG
Islands
Tuen Mun
Yuen Long
North
Tai Po
Tsuen Wan
Sha Tin
Sai KungWong Tai Sin
Kwun TongKowloon City
Yau Tsim Mong
Sham Shui PoKwai Tsing
Central & WesternWanchai Eastern
Southern
Vietnamese
0.201
0.038

SOUTHERN
Ap Lei Chau Estate123456
Ap Lei Chau NorthLei Tung ILei Tung IISouth Horizons EastSouth Horizons West
Tin WanAberdeen
Wah Fu I
Chi Fu
Wong Chuk Hang
Bays AreaShek Yue Stanley & Shek O
Wah Fu II
Wah Kwai
1 2
3
45
6
Pokfulam
Vietnamese
1.52
0.00

HONG KONG
Islands
Tuen Mun
Yuen Long
North
Tai Po
Tsuen Wan
Sha Tin
Sai KungWong Tai Sin
Kwun TongKowloon City
Yau Tsim Mong
Sham Shui PoKwai Tsing
Central & WesternWanchai Eastern
Southern
Malay
0.284
0.048

SOUTHERN
Ap Lei Chau Estate123456
Ap Lei Chau NorthLei Tung ILei Tung IISouth Horizons EastSouth Horizons West
Tin WanAberdeen
Wah Fu I
Chi Fu
Wong Chuk Hang
Bays AreaShek Yue Stanley & Shek O
Wah Fu II
Wah Kwai
1 2
3
45
6
Pokfulam
Malay
1.23
0.00

HONG KONG
Islands
Tuen Mun
Yuen Long
North
Tai Po
Tsuen Wan
Sha Tin
Sai KungWong Tai Sin
Kwun TongKowloon City
Yau Tsim Mong
Sham Shui PoKwai Tsing
Central & WesternWanchai Eastern
Southern
French
2.934
0.205

SOUTHERN
Ap Lei Chau Estate123456
Ap Lei Chau NorthLei Tung ILei Tung IISouth Horizons EastSouth Horizons West
Tin WanAberdeen
Wah Fu I
Chi Fu
Wong Chuk Hang
Bays AreaShek Yue Stanley & Shek O
Wah Fu II
Wah Kwai
1 2
3
45
6
Pokfulam
French
11.42
0.00

HONG KONG
Islands
Tuen Mun
Yuen Long
North
Tai Po
Tsuen Wan
Sha Tin
Sai KungWong Tai Sin
Kwun TongKowloon City
Yau Tsim Mong
Sham Shui PoKwai Tsing
Central & WesternWanchai Eastern
Southern
German
0.932
0.062

SOUTHERN
Ap Lei Chau Estate123456
Ap Lei Chau NorthLei Tung ILei Tung IISouth Horizons EastSouth Horizons West
Tin WanAberdeen
Wah Fu I
Chi Fu
Wong Chuk Hang
Bays AreaShek Yue Stanley & Shek O
Wah Fu II
Wah Kwai
1 2
3
45
6
Pokfulam
German
5.27
0.00

HONG KONG
Islands
Tuen Mun
Yuen Long
North
Tai Po
Tsuen Wan
Sha Tin
Sai KungWong Tai Sin
Kwun TongKowloon City
Yau Tsim Mong
Sham Shui PoKwai Tsing
Central & WesternWanchai Eastern
Southern
Italian
0.513
0.021

SOUTHERN
Ap Lei Chau Estate123456
Ap Lei Chau NorthLei Tung ILei Tung IISouth Horizons EastSouth Horizons West
Tin WanAberdeen
Wah Fu I
Chi Fu
Wong Chuk Hang
Bays AreaShek Yue Stanley & Shek O
Wah Fu II
Wah Kwai
1 2
3
45
6
Pokfulam
Italian
1.77
0.00

HONG KONG
Islands
Tuen Mun
Yuen Long
North
Tai Po
Tsuen Wan
Sha Tin
Sai KungWong Tai Sin
Kwun TongKowloon City
Yau Tsim Mong
Sham Shui PoKwai Tsing
Central & WesternWanchai Eastern
Southern
Portuguese
0.118
0.002

SOUTHERN
Ap Lei Chau Estate123456
Ap Lei Chau NorthLei Tung ILei Tung IISouth Horizons EastSouth Horizons West
Tin WanAberdeen
Wah Fu I
Chi Fu
Wong Chuk Hang
Bays AreaShek Yue Stanley & Shek O
Wah Fu II
Wah Kwai
1 2
3
45
6
Pokfulam
Portuguese
0.71
0.00

HONG KONG
Islands
Tuen Mun
Yuen Long
North
Tai Po
Tsuen Wan
Sha Tin
Sai KungWong Tai Sin
Kwun TongKowloon City
Yau Tsim Mong
Sham Shui PoKwai Tsing
Central & WesternWanchai Eastern
Southern
Spanish
1.317
0.083

SOUTHERN
Ap Lei Chau Estate123456
Ap Lei Chau NorthLei Tung ILei Tung IISouth Horizons EastSouth Horizons West
Tin WanAberdeen
Wah Fu I
Chi Fu
Wong Chuk Hang
Bays AreaShek Yue Stanley & Shek O
Wah Fu II
Wah Kwai
1 2
3
45
6
Pokfulam
Spanish
3.10
0.00

HONG KONG
Islands
Tuen Mun
Yuen Long
North
Tai Po
Tsuen Wan
Sha Tin
Sai KungWong Tai Sin
Kwun TongKowloon City
Yau Tsim Mong
Sham Shui PoKwai Tsing
Central & WesternWanchai Eastern
Southern
Dutch
0.152
0.005

SOUTHERN
Ap Lei Chau Estate123456
Ap Lei Chau NorthLei Tung ILei Tung IISouth Horizons EastSouth Horizons West
Tin WanAberdeen
Wah Fu I
Chi Fu
Wong Chuk Hang
Bays AreaShek Yue Stanley & Shek O
Wah Fu II
Wah Kwai
1 2
3
45
6
Pokfulam
Dutch
1.01
0.00

HONG KONG
Islands
Tuen Mun
Yuen Long
North
Tai Po
Tsuen Wan
Sha Tin
Sai KungWong Tai Sin
Kwun TongKowloon City
Yau Tsim Mong
Sham Shui PoKwai Tsing
Central & WesternWanchai Eastern
Southern
Russian
0.097
0.004

SOUTHERN
Ap Lei Chau Estate123456
Ap Lei Chau NorthLei Tung ILei Tung IISouth Horizons EastSouth Horizons West
Tin WanAberdeen
Wah Fu I
Chi Fu
Wong Chuk Hang
Bays AreaShek Yue Stanley & Shek O
Wah Fu II
Wah Kwai
1 2
3
45
6
Pokfulam
Russian
0.46
0.00

Chapter 5 Findings from the oral and written assessments
5.1 Background
The oral assessments were offered to all respondents who reported any self-proficiency in oral English or oral Putonghua, other than none. The assessments were intended to be questions that should be understood (and be answerable), and were calibrated according to the initial self-reports of respondents. If the interviewer believed that the respondents understood the question, they were prompted to ask a second question at the next level up of difficulty (unless already at the highest level). Conversely, if they were judged not to understand the question, the second question was the next level down of difficulty (unless already at the lowest level).
The written assessments were similarly intended to be questions that should be understood (and be answerable), given the self-assessment, but as the questions were asked online, there was no attempt to ask a second question. As the response rates were not high for the written assessments and we have excluded those who reported no proficiency, we have not focused on the distribution of the assessments, but instead on the assessments conditional on the self-assessment, on the assumption that any bias will be much lower when comparing people at the same level of self-assessment.
5.2 Oral English
A total of 1,619 respondents were asked if they would agree to do the oral English assessment and 1,333 (82%) agreed.
How this assessment worked was as follows: If an individual respondent volunteered for the test, a simple oral test was given to that respondent over the telephone, and the conversation was recorded. Later, the two assessors (Professor Bolton and Dr He) rated the oral performance of individual speakers, using the same six point scale as was used for self-reports of proficiency, to enable the comparison seen below in Table 5.1. Table 5.1 shows for each level of self-reported proficiency above ‘Not at all’, the percentage rated at each level of proficiency in oral English for 175 randomly selected respondents to the oral assessment of oral English.
As can be seen, the relationship is strong and the Spearman’s rank correlation is 0.813 (p<0.0001). For self-reported proficiency of ‘A little’, about half are rated ‘A little’, for self-reported ‘Quite well’, most are rated ‘A little’ or ‘Quite well’ and for self-reported ‘Well’, most are rated ‘Quite well’ or ‘Well’ and for self-reported ‘Very well’, most are rated ‘Well’ or ‘Very well’. In short, the linkage is very strong, but the rated proficiency is often slightly lower than the self-report.
! 93

Table 5.1 Assessed proficiency for each level of self-reported proficiency for oral English
Note: results showing perfect consistency between self-report and assessment are shown in bold
As mentioned above, one finding that emerged here, based on the assessment calibration, was that respondents tended to over-report their performance in oral English. Table 5.2 shows the calibrated oral English proficiency projected to the Hong Kong population aged 12 and above, using the conditional proficiency results shown in Table 5.1 combined with the self-reported proficiency results for all respondents reported in Chapter 3. We have assumed that all the respondents who reported ‘Not at all’ or ‘A 9
few sentences’ are really at that level in the assessed proficiency. This provides an estimated proficiency that has been calibrated by the expert assessment and does not have the weakness of being wholly dependent on self-reported assessment, as (to the best of our knowledge) all previous language surveys of the Hong Kong population have had.
Table 5.2 Calibrated oral English proficiency for Hong Kong residents aged 12 and above
Table 5.2 above provides an assessment of oral English across the resident population aged 12 and above after calibration of proficiency by experts. One inference from this is that about 27% of the community have a broad functional proficiency in oral English for communication purposes. The second inference is that around 6% speak English well and only around 1.5% are high-level speakers of English with ‘native-like’
Self-reported
Assessed A few sentences
A little Quite well
Well Very well Total
Not at all . 25.0% 3.5% 0.0% 1.4% 15
A few sentences
. 48.1% 10.3% 0.0% 0.0% 28
A little . 25.0% 37.9% 19.1% 8.2% 34
Quite well . 1.9% 48.3% 57.1% 21.9% 43
Well . 0.0% 0.0% 23.8% 31.5% 28
Very well . 0.0% 0.0% 0.0% 37.0% 27
Total 0 52 29 21 73 175
Level Percentages
Not at all 27.9%
A few sentences 27.1%
A little 18.4%
Quite well 20.6%
Well 4.4%
Very well 1.5%
This calculation uses Bayes law to combine the conditional probabilities and prior probabilities (i.e. self-9
report percentages for the survey sample) to find the probabilities for the proficiency levels after taking into account the assessment.
! 94

command of the language. These latter figures may explain some of the ongoing concerns about the standard of English in Hong Kong, although they do not reflect any decrease in standards over time. At the same time, however, based on our survey of languages in the workplace, it is important to note that the demand from many industry sectors is not for a ‘native-like’ proficiency in English, but for ‘effective communication’ (Bacon-Shone and Bolton 2014). Please also see Table 3.1 and Section 3.14 which show that oral English is reported as being used by significant proportions of those employed with colleagues (33%) and clients (48%).
5.3 Oral Putonghua
A total of 1,818 respondents were asked if they would agree to do the oral Putonghua assessment and 1,572 (86%) agreed.
Table 5.3 similarly shows for each level of self-reported proficiency above ‘Not at all’, the percentage rated at each level of proficiency for oral Putonghua for 170 randomly selected respondents to the oral assessment of oral Putonghua. As can be seen, the relationship is strong and the Spearman’s rank correlation is 0.733 (p<0.0001). For self-reported proficiency of ‘A few sentences’, most are rated as ‘Not at all’ or ‘A few sentences’, for self-report of ‘A little’, most are rated ‘A little’ or ‘Quite well’, for self-report of ‘Quite well’, most are rated ‘Well’ or ‘Very well’ and for self-rating of ‘Well’ or ‘Very well’, most are rated ‘Very well’. In short, the linkage is strong, but the objective assessment is higher than the self-report except at the lowest levels.
Table 5.3 Assessed proficiency for each level of self-reported proficiency for oral Putonghua
In contrast to the results for oral English, in the case of oral Putonghua, there is evidence that respondents tended to under-report their proficiency in the language. Table 5.4 shows the calibrated oral Putonghua proficiency, using the same methodology as for oral English.
Self-reported
Assessed Not at all A few sentences
A little Quite well
Well Very well Total
Not at all . 41.7% 13.2% 0.0% 0.0% 0.0% 14
A few sentences
. 25.0% 13.2% 0.0% 0.0% 0.0% 12
A little . 8.3% 26.5% 0.0% 0.0% 0.0% 19
Quite well . 0.0% 22.1% 10.5% 11.1% 3.2% 20
Well . 16.7% 13.2% 31.6% 11.1% 12.9% 26
Very well . 8.3% 11.8% 57.9% 77.8% 83.9% 79
Total 0 12 68 19 9 62 170
! 95

Table 5.4 Calibrated oral Putonghua proficiency for Hong Kong residents aged 12 and above
One important inference here is that the proportion of Putonghua speakers with high-level proficiency in the languages is much greater (35%) than for English (1.5%). Again, Table 3.1 shows that oral Putonghua is reported as being used by smaller, but significant, proportions of those employed with colleagues (15%) and clients (38%).
5.4 Written English
A total of 1,590 respondents were asked if they would agree to written English assessment and 387 (24%) agreed to do this, while 93 (24%) actually completed the online survey form for written English.
Table 5.5 similarly shows for each level of self-reported proficiency above ‘Not at all’, the percentage rated at each level of proficiency for written English for all 93 respondents who completed the assessment of written English. As can be seen, the relationship is strong and the Spearman’s rank correlation is 0.791 (p<0.0001). For self-reported proficiency of ‘A little’, most are rated ‘A few sentences’ or ‘A little’, for self-report of ‘Quite well’, most are rated ‘A little’, for self-report of ‘Well’, most are rated ‘Well’ and for self-report of ‘Very well’, most are rated ‘Very well’. In short, the linkage is strong, but the objective assessment is lower than the self-report at the lower levels.
Table 5.5 Assessed proficiency for each level of self-reported proficiency for written English
Level Percentages
Not at all 20.0%
A few sentences 7.2%
A little 9.2%
Quite well 11.3%
Well 16.9%
Very well 35.4%
Self-reported
Assessed Not at all A few sentences
A little Quite well
Well Very well Total
A few sentences
. . 44.4% 10.3% 3.5% 6.2% 10
A little . . 55.6% 69.2% 6.9% 0.0% 34
Quite well . . 0.0% 20.5% 20.7% 6.2% 15
Well . . 0.0% 0.0% 65.5% 18.8% 22
Very well . . 0.0% 0.0% 3.5% 68.8% 12
Total 0 0 9 39 29 16 93
! 96

Table 5.6 shows the calibrated written English proficiency, using the same methodology as for oral English.
Table 5.6 Calibrated oral written English proficiency (Hong Kong residents aged 12 and above)
Table 5.6 shows that 24% of the population are calibrated to have written English proficiency of at least ‘Quite well’. Table 3.2 shows that 86% of those working use English for reading or writing. This is consistent with the workplace study mentioned above, which showed that for most industries, English continues to be used widely, but again, the emphasis for most industries is generally on ‘effective communication’ rather than ‘native-like’ competence.
5.5. Written Simplified Chinese
A total of 1,530 respondents were asked if they would agree to Simplified Chinese assessment and 387 (25%) agreed to do this, while 79 (20%) actually completed the online survey form for written Chinese. As can be seen, the relationship is quite strong and the Spearman’s rank correlation is 0.531 (p<0.0001). For self-reported proficiency of ‘A few sentences’, most are rated ‘A few sentences’ or ‘A little’, for self-report of ‘A little’, most are rated ‘A little’, for self-report of ‘Quite well’, most are rated ‘A little’, for a self-report of ‘Well’, most are rated as ‘Well’ or ‘Very well’ and for self-report of ‘Very well’, most are rated ‘Very well’. In short, the linkage is quite strong, but weaker than the other assessments.
Table 5.7 Assessed proficiency for each level of self-reported proficiency for written Simplified Chinese
Level Percentages
Not at all 22.3%
A few sentences 23.0%
A little 30.7%
Quite well 8.6%
Well 10.6%
Very well 4.7%
Self-reported
Assessed Not at all A few sentences
A little Quite well
Well Very well Total
Not at all . 0.0% 0.0% 4.4% 0.0% 0.0% 1
A few sentences
. 33.3% 6.3% 4.4% 0.0% 0.0% 6
A little . 33.3% 71.9% 56.5% 0.0% 0.0% 39
Quite well . 11.1% 15.6% 17.4% 0.0% 11.1% 11
Well . 11.1% 6.3% 13.0% 50.0% 11.1% 10
Very well . 11.1% 0.0% 4.4% 50.0% 77.8% 12
Total 0 9 32 23 6 9 79
! 97
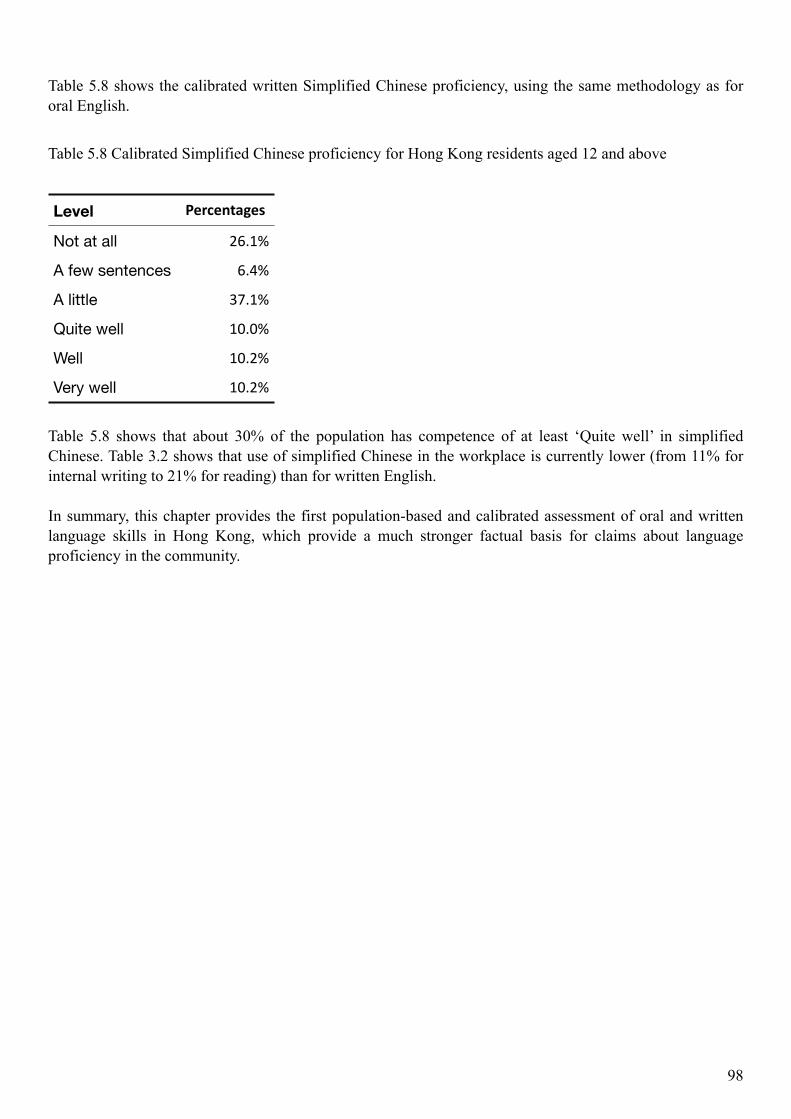
Table 5.8 shows the calibrated written Simplified Chinese proficiency, using the same methodology as for oral English.
Table 5.8 Calibrated Simplified Chinese proficiency for Hong Kong residents aged 12 and above
Table 5.8 shows that about 30% of the population has competence of at least ‘Quite well’ in simplified Chinese. Table 3.2 shows that use of simplified Chinese in the workplace is currently lower (from 11% for internal writing to 21% for reading) than for written English.
In summary, this chapter provides the first population-based and calibrated assessment of oral and written language skills in Hong Kong, which provide a much stronger factual basis for claims about language proficiency in the community.
Level Percentages
Not at all 26.1%
A few sentences 6.4%
A little 37.1%
Quite well 10.0%
Well 10.2%
Very well 10.2%
! 98

Chapter 6 Policy recommendations
1. That the HKSAR government should continue to promote its stated policy of ‘trilingualism and biliteracy’ in the HKSAR, with the implications of continuing economic benefits of communication with the Mainland and the rest of the world in English and Putonghua and the social and cultural benefits of the continuing strength of Cantonese.
2. That the government consider ways in which high-level proficiency in both oral and written English and simplified written Chinese might be more effectively promoted through Hong Kong’s education system, given the evidence in this report that the numbers estimated to be high-level performers in these three varieties is noticeably low with the implication that although the number of trilingual in Hong Kong are increasing, the number with high level proficiency is still relatively small, which hampers the high level of communication needed in executive level communication in business and government
3. That the government consider framing ‘biliteracy’ to encompass literacy in both traditional and simplified Chinese characters, with the implication that Simplified characters are important for national communication but there are currently relatively low levels of proficiency at present, while Traditional characters remain essential to preservation of Hong Kong culture.
4. That the government redouble its efforts to provide appropriate Chinese-as-a-Second-Language programmes for second language Chinese speakers, such as South Asian language speakers and immigrants, so as to allow these residents full access to the community, with the implication that although many younger South Asians have a command of spoken Cantonese, there remains a serious challenge is providing adequate and relevant teaching in literacy in written Chinese to the whole community as well as oral Cantonese to older members.
5. That the government cease the inaccurate labeling of resident South Asian language speaking students as non-Chinese speaking (NCS) students and instead use the more accurate and less discriminatory term of ‘Second Language Chinese speaking’ (SLCS) students with the implication that this label is highly misleading and potentially discriminatory and the term ‘Second Language Chinese speaking’ (SLCS) is not only linguistically accurate, but also non- discriminatory, exclusionary and discouraging.
6. That the government require that all research funded with government money should normally be made fully public, as is already the case for research funded from the Public Policy Research Funding scheme of the the Central Policy Unit and most research funded by Food and Health Bureau, but not currently the case for research funded by the Standing Committee on Language Education and Research (SCOLAR) for language research that they fund from the Language Fund. Other jurisdictions have long recognised that publicly funded research is a public good that needs maximum publicity and access to ensure the maximum benefit to the community.
7. That ethnic minority residents be recognised as constituting distinct language speaking groups with different characteristics living in different localities, as the language maps in this report illustrate with the implication that full recognition of the cultural and social capital from minorities will enhance Hong Kong’s position as China's leading financial and services centre, a great place to live and as Asia's world city.
8. That future Censuses collect data on all the spoken and written languages of the HKSAR with the implication that only if the HKSARG records a full list of these languages will we have a full record of
! 99

multilingualism in Hong Kong and show how competitive it is with the multilingualism that London is so proud of.
9. That the government and society in the HKSAR fully value the multilingualism of the community as a valuable resource, rather than regarding this as a problem. The implication is that multilingualism and multiculturalism represent key Hong Kong values and should contribute to 'the Hong Kong advantage' regionally and globally.
! 100

Chapter 7 Public engagement
The research team considers public engagement to be a critical element of this project, hence our plan from the start to make this document a public document with Creative Commons licensing (see page 1), to make the full set of maps available on a website, and to engage with the public through the media. Our primary contact point is through the Languages page on the SSRC website, i.e.
http://www.ssrc.hku.hk/languages/
which contains this document as a downloadable pdf file and will have the full set of maps.
We plan a press conference in August 2015, to cover the full contents of this report.
! 101

References
BACON-SHONE, J., FUNG, W., KUK, Y., LAM, K., LI, W., NG, K. & SHEN, S. 1990. Household telephone surveys in Hong Kong. In: Proceedings of the ASA Section on Survey Research Methods, 1990. 393-395.
BACON-SHONE, J. & BOLTON, K. 1997. Report on the second sociolinguistic survey of Hong Kong, Hong Kong: The University of Hong Kong.
BACON-SHONE, J. & BOLTON, K. 1998. Charting multilingualism: Language censuses and language surveys in Hong Kong. In: PENNINGTON, C. M. (ed.) Language in Hong Kong at Century’s End, Hong Kong: Hong Kong University Press. 43-90.
BACON-SHONE, J. & BOLTON, K. 2014. A study on the use of language in the workplace of Hong Kong, Standing Committee on Language and Research (SCOLAR), HKSARG.
BACON-SHONE, J. & LAU, L. 2006. Mobile vs. fixed-line surveys in Hong Kong. In: Second International Conference on Telephone Survey Methodology.
BACON-SHONE, J. & BOLTON, K. 2008. Bilingualism and multilingualism in the HKSAR: Language surveys and Hong Kong's changing linguistic profile. In: BOLTON, K. & YANG, H. (eds.) Language and Society in Hong Kong, Hong Kong: Hong Kong Open University Press.
BAKER, P. & EVERSLEY, J. (eds.) 2000. Multilingual Capital. The Languages of London’s School Children and Their Relevance to Economic, Social and Educational Policies, London: Battlebridge.
BOLTON, K. 2000. The sociolinguistics of Hong Kong and the space for Hong Kong English. World Englishes, 19, 265-285.
BOLTON, K. 2002a. Chinese Englishes: from Canton jargon to global English. World Englishes, 21, 181-199.
BOLTON, K. (ed.) 2002b. Hong Kong English: Autonomy and Creativity. Hong Kong: Hong Kong University Press.
BOLTON, K. 2003. Chinese Englishes: A Sociolinguistic History. Cambridge: Cambridge University Press.
BOLTON, K. 2008. English in Asia, Asian Englishes, and the issue of proficiency. English Today, 24, 3-12.
BOLTON, K. & LUKE, K. 1999. Language and society in Hong Kong: the social survey of languages in the 1980's, Social Sciences Research Centre.
! 102

CENSUS AND STATISTICS DEPARTMENT 2011. Hong Kong 2011 Population Census, Hong Kong, Census and Statistics Department, Hong Kong Special Administrative Region, People's Republic of China.
COOPER, ROBERT L. 1980. Sociolinguistic surveys: the state of the art. Applied Linguistics, Volume 1(2), 113-128.
EUROBAROMETER, S. 2006. Europeans and their languages. European Commission.
KWAN-TERRY, A. & LUKE, K. 1997. Tradition, trial, and error: standard and vernacular literacy in China, Hong Kong, Singapore, and Malaysia. In: TABOURET-KELLER, A, LE PAGE, R. B., GARDNER-CHLOROS, P & VARRO, G. A. (eds.), Vernacular Literacy: A Re-Evaluation, Oxford: Oxford University Press, 271-315.
LAU, K. 2005. Mobile phone surveys in Hong Kong: methodological issues and comparisons with conventional phone surveys. Hong Kong: University of Hong Kong.
LI, D.C.S. 1999. The functions and status of English in Hong Kong: A Post-1997 update. English World-Wide 20 (1), 67-110.
LUKE, K. 1998. Why two languages might be better than one: Motivations of language mixing in Hong Kong. In: PENNINGTON, C. M. (ed.) Language in Hong Kong at Century’s End, Hong Kong: Hong Kong University Press,145-159.
LUKE, K. & PAVLIDOU, T. 2002. Telephone Calls: Unity and Diversity in Conversational Structure across Languages and Cultures. Amsterdam: John Benjamins.
LUKE, K. & RICHARDS, J. 1982. English in Hong Kong: functions and status. English World-Wide, 3, 47-64.
! 103

Appendix A Telephone survey questionnaire
<Introduction> Hello! I'm (surname), interviewer of the Social Sciences Research Centre, University of Hong Kong. Your telephone number is selected by random sampling. We would like to invite you to participate in a social survey of languages in Hong Kong that will last for about 15 minutes. The information you give will be kept strict confidence and only for the purpose of collective data analysis. If you have any queries about the contents of the survey, please call the HKUSSRC at 3917-1600 or about your rights as research participant, please call the Ethics Committee of HKU at 2241-5267. To assure the quality of the interview, the following conversation will be recorded for quality assurance only.
<Selecting respondent> [v3] How many family members at or above the age of 12 are living in this home?
[v4] Among all those who are at home, may I speak to the one who will next have a birthday? <Need parental approval if under 18> (Interviewer: explain the respondent selection method by using ‘Next Birthday’ rule if respondent questions) If the respondent is over 18, please ask him/her to answer the phone.
(Interviewer: Repeat the introduction) We would like to invite you to take part in the survey. Do you agree to participate in this survey? If the selected respondent is under 18, we need to obtain parent/guardian consent before conducting the interview with him/her. May I speak to a parent or guardian? Hello! I'm (surname), interviewer of the Social Sciences Research Centre, University of Hong Kong. Your telephone number is selected by random sampling. We would like to invite you to participate in a social survey of languages in Hong Kong that will last for about 15 minutes. The information you give will be kept strict confidence and only for the purpose of collective data analysis. If you have any queries about the contents of the survey, please call the HKUSSRC at 3917-1600 or about your rights as research participant, please call the Ethics Committee of HKU at 2241-5267. To assure the quality of the interview, the following conversation will be recorded for quality assurance only.May I have your consent to your children’s participation in this survey? If agree, interview starts If disagree, Interview ends, thank respondent.
[V5] Which languages and dialects are regularly spoken by your family members at home? [Can choose more than one answer; no need to read out choices, if asked, regularly means at least once per month] Please choose all that apply: Cantonese Chiu Chau Fukien Hakka Putonghua Shanghainese Sze Yap (San Wui, Hoi Ping, Yan Ping, Toi Shan) Other Chinese dialects English French
! 104

German Portuguese Spanish Other European languages Filipino Indonesian Japanese Korean Malay Thai Nepalese Urdu Hindi Other Asian languages Other
[V6] Do you have a foreign domestic helper in your household? Please choose only one of the following: Yes No [V7] Which languages and dialects do you use when speaking to them? [V8] What languages and dialects do you use regularly when speaking with any of your friends?
[V9] Do you work currently? Please choose only one of the following: Yes No, student No, homemaker No, unemployed No, retired Other [V10] What is your current occupation? Managers and administrators Professionals Associate professionals Clerks Service workers and shop sales workers Craft and related workers Plant and machine operators and assemblers Elementary occupations Skilled agricultural and fishery workers Other
[V11] Which languages and dialects do you use when speaking with bosses and colleagues at work? [V12] Which languages and dialects do you use when speaking to clients and customers at work?
! 105
[V13] At work, does your position require you to produce written correspondence,reports, notes, memos, emails etc. for internal communications within your workplace?
[V14] Which languages do you normally use for such purposes? Please choose all that apply: Traditional Chinese Simplified Chinese English French German Portuguese Spanish Other European languages Filipino Indonesian Japanese Korean Malay Thai Other Asian languages Other [V15] At work, when you write internal communications in Chinese, how often do you write in simplified Chinese characters? Please choose only one of the following: All of the time Most of the time Some of the time Rarely Never
[V16] At work, does your position require you to produce written correspondence,reports, notes, memos, emails etc for external communications with clients and customers? Please choose only one of the following: Yes No [V17] Which language(s) do you normally use for such purposes?
[V18] At work, when you write external communications in Chinese, how often do you write in simplified Chinese characters? [V19] At work, does your position require you to read instructions, manuals, correspondence, reports, notes, memos, etc?
[V20] In which languages are these materials normally written? [Can choose more than one answers; no need to read out choices]
[V21] At work, how often do you read simplified Chinese characters?[Read out choices]
! 106

[V22] You are studying...? Please choose only one of the following: Primary school Secondary school Tertiary / post secondary education Other, please specify [V23]{For secondary school pupils}In the English lesson, which language(s) does your teacher (if he/she is Chinese) speak? Please choose only one of the following: All Cantonese Mainly Cantonese, with some English Half Cantonese and half English Mainly English, with some Cantonese All English Other [V24] In the Maths lesson, which language(s) does your teacher (if he/she is Chinese) speak? [V25] In which language do you expect to take your DSE Maths exam? Please choose only one of the following: Chinese English Other [V26] How often do you listen to the English language dialogue when watching movies in the cinema? [Read out choices] Please choose only one of the following: Very often Sometimes Rarely Never Other [V27] How often do you watch English language programmes on TV?
[V27a] How often do you watch Putonghua language programmes on TV? [V28] How often do you read English language newspapers and/or magazines?[Read out choices if necessary; e.g. respondents are not used to the response format] Please choose only one of the following:
[V29] How often do you read English language books?
[V29a] How often do you read Chinese language books in traditional characters?
[V29b] How often do you read Chinese language books in simplified characters?
[V30] How often do you use the internet using either computer or smartphone?
! 107

[V31] How often do you read English webpages on the internet?[Read out choices if necessary; e.g. respondents are not used to the response format]
[V32] How often do you read Traditional Chinese webpages on the internet? [V33] How often do you read Simplified Chinese webpages on the internet?
[V34] Which language(s) do you mainly use for email?[No need to read out choices; do so only when respondents can't answer] [V35] Which language(s) do you mainly choose for web searching?[No need to read out choices; do so only when respondents can't answer]
[V36] Which search engine do you most often use for web searching? Please choose only one of the following: Google Yahoo Baidu Bing/Microsoft Ask AOL Qihoo Sogou Other [V37] Which language(s) do you mainly use for sending SMS on your mobile phone? [No need to read out choices; do so only when respondents can't answer] Please choose only one of the following: Chinese English English & Chinese Other languages Other
[V50] I would now like to ask about what type of school you would choose for your children, if you were making the choice today (read out choices) CMI (Chinese medium of instruction) EMI (English medium of instruction) ESF/International Overseas school Other [V50.1] In Hong Kong schools, do you think the subject of Chinese language and literature should be taught in Cantonese alone, Putonghua alone or both together? Please choose only one of the following: Cantonese alone Putonghua alone both together Other
! 108

<Language attitudes> [V51] In your opinion, which written language, Traditional Chinese, Simplified Chinese or English, is easiest to learn? Please choose only one of the following: Traditional Chinese Simplified Chinese English No difference Other
For the next few questions, please choose among Cantonese, Putonghua or English. But if you don't know, please say so. [V52] In your opinion, which spoken language is easiest to learn? [V53]The most modern language to use in Hong Kong society is: [V54] The first language of Hong Kong society in future should be:
[V55] The first language of business should be: [V56] The first language of Hong Kong culture should be: [v56.1] How seriously do you think Cantonese is endangered now as the main language of Hong Kong (Not at all, a little, moderately, a lot, critical)?
Now I am going to ask you some questions about your everyday life.
[V57] When you use an ATM, which language do you most often choose to appear on the screen? [V58] When you sign a cheque, which language do you most often use to sign your name? Please choose only one of the following: Chinese English Mixed Chinese and English Others [V59] In which language do you most often write in the amount on a cheque?
[V60] Do you have an English name? [English name: Ann, Paul; English translated Chinese name excluded] [V61] How often do you use your English name? [Read out choices] [V62] Is your English name on your HK identity card?
[V63] Do you think there is a unique Hong Kong style of English? [V64] When you speak English which accent would you most like to have? [Read out choices] Please choose only one of the following: British American Hong Kong
! 109

Other [V65] Which type of English do you think should be taught in secondary schools? [Read out choices]
[V66] Would it be acceptable to Hong Kong people if the next Chief Executive spoke Putonghua but not Cantonese? [V67] What would you say your identity is? [Read out choices] Please choose only one of the following: Chinese Hong Kong Chinese Hong Kong person British Hong Kong Other <Demographics and language proficiency> [V68] Sex {Fill in by interviewer; please don't ask unless unsure} Please choose only one of the following: Male Female Other
[V69] Where is your place of birth? Please choose only one of the following: Hong Kong Mainland China Macau Taiwan Singapore / India / Malaysia Other Asian countries UK North America Australasia Others, please specify
[V70] In which year did you arrive in Hong Kong?
[V71] Where is your ancestral home? Please choose only one of the following: Hong Kong Macau Taiwan Guangdong Province Fujian Province Shanghai (and Jiangsu and Zhejiang Provinces) Beijing (and Hebei Province) Another place in the PRC Other [V72] What highest level of education have you attended? Please choose only one of the following:
! 110
No schooling Kindergarten Primary education only Lower secondary (Form 1-3) Upper secondary (Form 4-5) Matriculation (Form 6-7) Tertiary (non-degree) Tertiary (degree) Other type of education
[V73] What was the medium of instruction at your secondary school? [V74] Which type of English were you taught at secondary school? Please choose only one of the following: British English North American English Hong Kong English Other varieties Other [V75] Which language would you say is your mother tongue? [Mother tongue: most familiar language] [V78] Before you went to school, which languages could you speak? [Can choose more than one answers; no need to read out choices] [V79] Now, which languages can you speak? [Can choose more than one answers; no need to read out choices] I would like to ask you some questions about your language proficiency using the scale (not at all, a few sentences, a little, quite well, well, very well) [V801] Oral Putonghua [v38] Oral Cantonese [V811] Oral English
[V41] Written Traditional Chinese [V42] Written Simplified Chinese [V43] Written English [V82] Do you consider yourself to be someone who knows both English and Chinese? [V83] Do you consider yourself to be a 'bilingual'? [Don't explain the meaning of bilingual] Yes No Partly Uncertain Does not understand the meaning of 'bilingual'
! 111

Other [V84] How often do you hear people mixing English and Cantonese? [Read out choices]
[V85] How often do you yourself mix English and Cantonese?[Read out choices if necessary; e.g. respondents are not used to the response format] [V86] How often do you hear people mixing Putonghua and Cantonese?[Read out choices if necessary; e.g. respondents are not used to the response format]
[V87] How often do you yourself mix Putonghua and Cantonese?[Read out choices if necessary; e.g. respondents are not used to the response format] [V88] Do you have any close relatives already living in an English-speaking country? [Close relatives: parents, spouse, siblings, children] [V90] Have you ever lived abroad in an English speaking country?
[V91] Where did you live? [Can choose more than one answers] Australia Canada New Zealand Singapore U.K. U.S.A. Other [V92] What was the longest period you were abroad in years? [Exclude temporary breaks such as holiday] [V93] How old are you? [V94] Do you have any children? [V95] What is/was the medium of instruction of your children's secondary school? [No need to read out choices; do so only when respondents can't answer][If more than 1 child, ask the eldest one][ask for the latest school]
[V96] What is your marital status? Please choose only one of the following: Never married Now married Widowed Divorced/Separated Other
[V97] Which district are you living in? Please choose only one of the following: Central and Western Wanchai Eastern Southern
! 112

Yau Tsim Mong Sham Shui Po Kowloon City Wong Tai Sin Kwun Tong Kwai Tsing Tsuen Wan Tuen Mun Yuen Long North Tai Po Shatin Sai Kung Islands Other
[V98] What is your average monthly household income?[No need to read out choices; do so only when respondents can't answer] Please choose only one of the following: under $2,000 $2,000 - $3,999 $4,000 - $5,999 $6,000 - $7,999 $8,000 - $9,999 $10,000 - $14,999 $15,000 - $19,999 $20,000 - $24,999 $25,000 - $29,999 $30,000 - $39,999 $40,000 - $59,999 above or equal to $60,000 Other
[V99] Which social class do you feel closest to? [Read out choices] Please choose only one of the following: Working class Middle class Upper class Other
Which language did you use to complete this interview? Please choose only one of the following: Cantonese Putonghua English Others, please specify
! 113

Appendix B Oral language assessment questions
[V100] <English oral assessment>I would like to ask you an open-ended question about life in Hong Kong. Would you be prepared to answer me in English and let me record your answer?
[V100a] Please tell me where you live.
[V100b] Do you live alone or with other people?
[V100c] What were you doing just before we phoned you?
[V100d] What are you planning to do this Sunday?
[V100e] Can you say what is the most important part of Hong Kong culture for you?
[v107]<Putonghua oral assessment>I would like to ask you an open-ended question about life in Hong Kong. Would you be prepared to answer me in Putonghua and let me record your answer?
[V107a] �U�"�? ,���?8? (‘What is your name and where do you live?’
[V107b] ��P?�? KU��J��? (‘Where do you live and who lives with you?’ )
[V107c] E�C' ��18-� �3�P?�?5U�? (‘Tell me where you would like to go on holidays – and why?’)
[V107d] �S4 B%.ND0 06? (‘How is Putonghua useful to you in Hong Kong?’)
[V107e] E <���S48O#��&A. (‘Please offer suggestions to a tourist coming to Hong Kong’)
! 114

Appendix C Written language assessment questions
Would you be prepared to answer 2 very short online questions to assess your written English and simplified Chinese, with the link sent to you by email?
Welcome to the online part of the Language Survey of SSRC.
A1. According to our record you have answered in our database, we would like to invite you to answer a written question in English and/ or Simplified Chinese.
B. English Questions B1. Please tell me where you live (Please submit in ENGLISH)
B2. Do you live alone or with other people? (Please submit in ENGLISH)
B3. What were you doing just before we phoned you? (Please submit in ENGLISH)
B4. What are you planning to do this Sunday? (Please submit in ENGLISH)
B5. Can you say what is the most important part of Hong Kong culture for you? (Please submit in ENGLISH)
C1. I �F' ���Q (E6=T�* ( ;T�* �9) (Please submit in Chinese)
C2. ����L,�����? (E6=T�* ( ;T�* �9) (Please submit in Chinese)
C3. ')7G> ��, ���? (E6=T�* ( ;T�* �9) (Please submit in Chinese)
C4. M�+1! ):��? (E6=T�* ( ;T�* �9) (Please submit in Chinese)
C5. $ 2H, /R@8S4*�,�? (E6=T�* ( ;T�* �9) (Please submit in Chinese)
Thank you very much for your participation
! 115

Appendix D Demographics of the survey sample
Table 1 Age Group
Table 2 Gender
Table 3 Birth place
Level Count Percentages
12-19 154 7.52
20-29 231 11.27
30-39 161 7.86
40-49 293 14.30
50-59 419 20.45
60-69 404 19.72
70-79 217 10.59
80+ 104 5.08
Refusal 66 3.22
Total 2049 100.00
Level Count Percentages
Male 839 40.95
Female 1210 59.05
Total 2049 100.00
Level Count Percentages
HongKong 1319 64.37
Mainland 623 30.41
Macau 30 1.46
Taiwan 8 0.39
SE/SAsia 14 0.68
OtherAsia 18 0.88
N o r t hAmerica 8 0.39
Australasia 2 0.10
Other 27 1.32
Total 2049 100.00
! 116

Table 4 Years in Hong Kong (if not born here)
Table 5 Ancestral Home
Table 6 Highest level of Education attained
Minimum 0
Lower Quartile 21
Median 36
Upper Quartile 54
Maximum 84
Mean 33
Standard Deviation 18
Level Count Percentages
HongKong 45 2.20
Macau 2 0.10
Taiwan 9 0.44
Guangdong 1631 79.60
Fujian 120 5.86
Shanghai 76 3.71
Beijing 5 0.24
O t h e rMainland 76 3.71
Other 85 4.15
Total 2049 100.00
None 68 3.32
KG 2 0.10
Primary 292 14.25
LowerSec 306 14.93
UpperSec 528 25.77
Matric 154 7.52
T e r < a r y(ND) 152 7.42
Ter<ary(D) 540 26.35
Other 7 0.34
Total 2049 100.00
! 117

Table 7 Have children?
Table 8 Marital status
Table 9 District
Level Count Percentages
Yes 1337 66.52
No 673 33.48
Total 2010 100.00
Level Count Percentages
Nevermarried 545 27.31
Nowmarried 1269 63.58
Widowed 119 5.96
Divorced/Separated 63 3.16
Total 1996 100.00
Level Count Percentages
C e n t r a l &Western 70 3.47
WanChai 33 1.64
Eastern 201 9.97
Southern 74 3.67
ShamShuiPo 82 4.07
KowloonCity 91 4.51
WongTaiSin 109 5.40
KwunTong 115 5.70
YauTsimMong 188 9.32
KwaiTsing 151 7.49
TsuenWan 94 4.66
TuenMun 110 5.45
YuenLong 141 6.99
North 92 4.56
TaiPo 89 4.41
ShaTin 215 10.66
SaiKung 116 5.75
Islands 46 2.28
Total 2017 100.00
! 118

Table 10 Household Income
Table 11 Social class
Level Count Percentages
<$2k 176 10.53
$2-4k 64 3.83
$4-6k 39 2.33
$6-8k 35 2.10
$8-10k 35 2.10
$10-15k 163 9.76
$15-20k 134 8.02
$20-25k 180 10.77
$25-30k 115 6.88
$30-40k 231 13.82
$40-60k 270 16.16
$60k+ 229 13.70
Total 1671 100.00
Level Count Percentages
Working 1120 58.00
Middle 799 41.38
Upper 12 0.62
Total 1931 100.00
! 119