Embed Size (px)
Citation preview

Identification of odour
zur Erlangung des akademischen Grades einer Doktorin der technischen
Diese Arbeit wurde am Institut für Analytische Chemie und Lebensmittelchemie in der
Arbeitsgruppe “Lebensmittelchemie und Humansensorik” unter der Betreuung von
ao.Univ.-Prof. DI Dr.techn. Erich Leitner
DIin Helene Hopfer
Identification of odour-active compounds in polyolefins
DISSERTATION
zur Erlangung des akademischen Grades einer Doktorin der technischen
Wissenschaften
erreicht an der
Technischen Universität Graz
Diese Arbeit wurde am Institut für Analytische Chemie und Lebensmittelchemie in der
Arbeitsgruppe “Lebensmittelchemie und Humansensorik” unter der Betreuung von
Dr.techn. Erich Leitner durchgeführt. März 2010
active compounds in polyolefins
zur Erlangung des akademischen Grades einer Doktorin der technischen
Diese Arbeit wurde am Institut für Analytische Chemie und Lebensmittelchemie in der
Arbeitsgruppe “Lebensmittelchemie und Humansensorik” unter der Betreuung von
März 2010

Equipped with the five senses, (wo)man explores the universe around her/him and calls the
adventure Science. Edwin Powell Hubble

Statutory Declaration I
Statutory Declaration
I declare that I have authored this thesis independently, that I have not used other than the
declared sources / resources, and that I have explicitly marked all material which has been quoted
either literally or by content from the used sources.
…………………………… ………………………………………………..
date (signature)
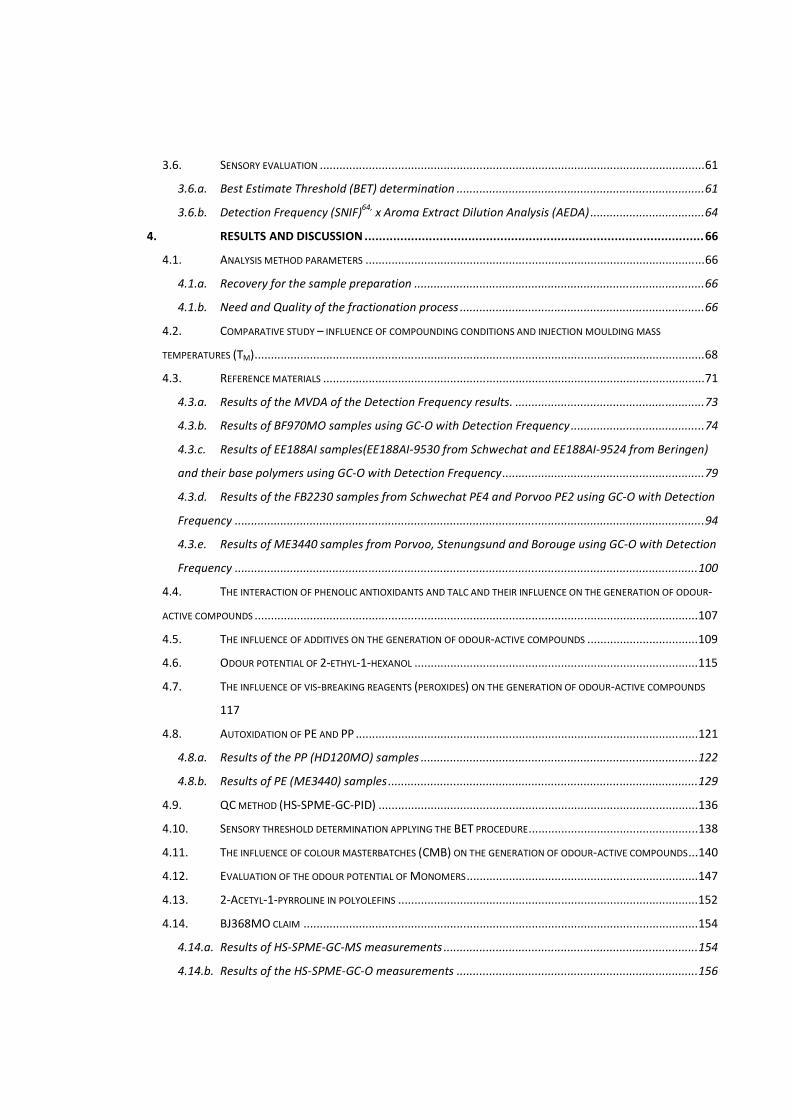
Table of Contents
1. INTRODUCTION ................................................................................................................. 1
1.1. AIMS AND TARGETS ............................................................................................................................ 3
2. BACKGROUND AND BASICS ................................................................................................ 4
2.1. ODOUR AND ODOUR PERCEPTION ......................................................................................................... 4
2.2. ODOUR ANALYSIS ............................................................................................................................... 5
2.3. POLYOLEFINS (PROCESS CHAIN) ............................................................................................................ 7
2.4. DEGRADATION AND OXIDATION OF POLYOLEFINS .................................................................................... 14
2.4.a. Degradation mechanisms of PE17
............................................................................................... 14
2.4.b. Degradation mechanisms of PP,17
............................................................................................... 17
2.5. ODOUR-ACTIVE COMPOUNDS IDENTIFIED IN POLYOLEFINS ........................................................................ 20
2.5.a. Identification of odour-active compounds in polyolefins with Retention Indices (RI) ................. 26
3. MATERIALS AND METHODS .............................................................................................. 29
3.1. POLYOLEFIN SAMPLES ....................................................................................................................... 29
3.2. SAMPLE PREPARATION TECHNIQUES .................................................................................................... 40
3.2.a. Simultaneous Distillation/Extraction (SDE) ................................................................................. 40
3.2.b. Solid Phase Extraction (SPE) ........................................................................................................ 41
3.2.c. Solid Phase Microextraction (SPME) ........................................................................................... 43
3.2.d. Derivatization ............................................................................................................................. 44
3.3. GAS CHROMATOGRAPHY (GC) ........................................................................................................... 48
3.3.a. GC-MS of pellets and plaques with SPME ................................................................................... 49
3.3.b. GC-MS of fractioned extracts ...................................................................................................... 51
3.3.c. GC-MS measurements of derivatised samples............................................................................ 52
3.3.d. GC-FID-Olfactometry and GC-NPD-Olfactometry (GC-O) ............................................................ 54
3.3.e. Comprehensive Gas Chromatography with time of flight mass spectrometry (GCxGC-TOF-MS)
measurements at LECO ............................................................................................................................ 55
3.3.f. Quantification of 2-acetyl-1-pyrroline in a PP sample by a standard addition procedure using
HS-SPME-GC-NPD .................................................................................................................................... 56
3.4. OTHERS ......................................................................................................................................... 58
3.4.a. Fourier-Transform Infrared Spectroscopy (FTIR) ......................................................................... 58
3.4.b. Near Infrared Spectroscopy (NIR) with multivariate calibration ................................................ 59
3.5. MULTIVARIATE DATA ANALYSIS (MVDA) ............................................................................................. 59
3.5.a. MasStat© ................................................................................................................................... 60
3.5.b. The Unscrambler© ..................................................................................................................... 61
3.6. SENSORY EVALUATION ...................................................................................................................... 61
3.6.a. Best Estimate Threshold (BET) determination ............................................................................ 61
3.6.b. Detection Frequency (SNIF)64,
x Aroma Extract Dilution Analysis (AEDA) ................................... 64
4. RESULTS AND DISCUSSION ............................................................................................... 66
4.1. ANALYSIS METHOD PARAMETERS ........................................................................................................ 66
4.1.a. Recovery for the sample preparation ......................................................................................... 66
4.1.b. Need and Quality of the fractionation process ........................................................................... 66
4.2. COMPARATIVE STUDY – INFLUENCE OF COMPOUNDING CONDITIONS AND INJECTION MOULDING MASS
TEMPERATURES (TM) .......................................................................................................................................... 68
4.3. REFERENCE MATERIALS ..................................................................................................................... 71
4.3.a. Results of the MVDA of the Detection Frequency results. .......................................................... 73
4.3.b. Results of BF970MO samples using GC-O with Detection Frequency ......................................... 74
4.3.c. Results of EE188AI samples(EE188AI-9530 from Schwechat and EE188AI-9524 from Beringen)
and their base polymers using GC-O with Detection Frequency .............................................................. 79
4.3.d. Results of the FB2230 samples from Schwechat PE4 and Porvoo PE2 using GC-O with Detection
Frequency ................................................................................................................................................ 94
4.3.e. Results of ME3440 samples from Porvoo, Stenungsund and Borouge using GC-O with Detection
Frequency .............................................................................................................................................. 100
4.4. THE INTERACTION OF PHENOLIC ANTIOXIDANTS AND TALC AND THEIR INFLUENCE ON THE GENERATION OF ODOUR-
ACTIVE COMPOUNDS ........................................................................................................................................ 107
4.5. THE INFLUENCE OF ADDITIVES ON THE GENERATION OF ODOUR-ACTIVE COMPOUNDS .................................. 109
4.6. ODOUR POTENTIAL OF 2-ETHYL-1-HEXANOL ....................................................................................... 115
4.7. THE INFLUENCE OF VIS-BREAKING REAGENTS (PEROXIDES) ON THE GENERATION OF ODOUR-ACTIVE COMPOUNDS
117
4.8. AUTOXIDATION OF PE AND PP ......................................................................................................... 121
4.8.a. Results of the PP (HD120MO) samples ..................................................................................... 122
4.8.b. Results of PE (ME3440) samples ............................................................................................... 129
4.9. QC METHOD (HS-SPME-GC-PID) .................................................................................................. 136
4.10. SENSORY THRESHOLD DETERMINATION APPLYING THE BET PROCEDURE .................................................... 138
4.11. THE INFLUENCE OF COLOUR MASTERBATCHES (CMB) ON THE GENERATION OF ODOUR-ACTIVE COMPOUNDS ... 140
4.12. EVALUATION OF THE ODOUR POTENTIAL OF MONOMERS ....................................................................... 147
4.13. 2-ACETYL-1-PYRROLINE IN POLYOLEFINS ............................................................................................ 152
4.14. BJ368MO CLAIM ......................................................................................................................... 154
4.14.a. Results of HS-SPME-GC-MS measurements .............................................................................. 154
4.14.b. Results of the HS-SPME-GC-O measurements .......................................................................... 156

4.15. THE INFLUENCE OF THE CATALYST TYPE - METALLOCENE-PP (M-PP) COMPARED TO CONVENTIONAL ZIEGLER-
NATTA-PP (ZN-PP) ........................................................................................................................................ 158
5. CONCLUSION AND OUTLOOK ......................................................................................... 161
5.1. IDENTIFIED ODOUR-ACTIVE COMPOUNDS DETECTED IN PE AND PP SAMPLES ............................................. 161
5.2. THE INFLUENCE OF PROCESSING ON THE GENERATION OF ODOUR-ACTIVE COMPOUNDS – IS AN ODOUR
EVALUATION ON PELLETS VALID FOR THE JUDGEMENT OF PROCESSED PARTS? ............................................................... 161
5.3. THE INFLUENCE OF PROCESSING LOCATIONS ON THE GENERATION OF ODOUR-ACTIVE COMPOUNDS – IS THERE A
TYPICAL PLANT SMELL? ..................................................................................................................................... 162
5.4. THE INFLUENCE OF ADDITIVES ON THE GENERATION OF ODOUR-ACTIVE COMPOUNDS – WHAT DO TALC, UV
STABILIZATION AND COLOUR CONTRIBUTE TO THE ODOUR? ...................................................................................... 163
5.5. THE INFLUENCE OF THE CATALYST ON THE GENERATION OF ODOUR-ACTIVE COMPOUNDS – WHAT DOES 2-ETHYL-
1-HEXANOL CONTRIBUTE TO THE ODOUR? ............................................................................................................ 163
5.6. THE INFLUENCE OF VISBREAKING ON THE GENERATION OF ODOUR-ACTIVE COMPOUNDS – DO PEROXIDES ALWAYS
SMELL BAD? 164
5.7. THE CRUX WITH MEASURING “NOTHING” – HOW WELL DO DIFFERENT METHODS MEASURE THE THINGS WE WANT
TO KNOW? 164
REFERENCES ....................................................................................................................................... IV
APPENDIX .........................................................................................................................................X
PUBLICATIONS DURING PHD ................................................................................................................. XII
CURRICULUM VITAE ........................................................................................................................... XIV
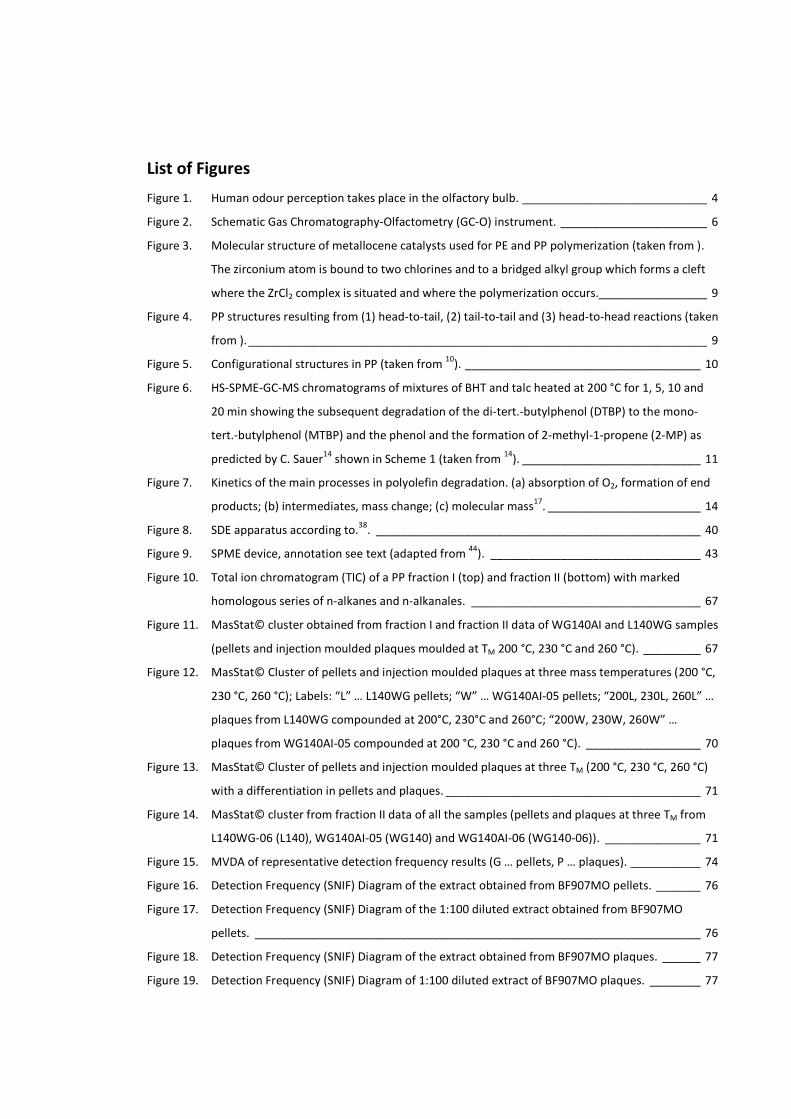
List of Figures
Figure 1. Human odour perception takes place in the olfactory bulb. _____________________________ 4
Figure 2. Schematic Gas Chromatography-Olfactometry (GC-O) instrument. _______________________ 6
Figure 3. Molecular structure of metallocene catalysts used for PE and PP polymerization (taken from ).
The zirconium atom is bound to two chlorines and to a bridged alkyl group which forms a cleft
where the ZrCl2 complex is situated and where the polymerization occurs._________________ 9
Figure 4. PP structures resulting from (1) head-to-tail, (2) tail-to-tail and (3) head-to-head reactions (taken
from ). ________________________________________________________________________ 9
Figure 5. Configurational structures in PP (taken from 10
). _____________________________________ 10
Figure 6. HS-SPME-GC-MS chromatograms of mixtures of BHT and talc heated at 200 °C for 1, 5, 10 and
20 min showing the subsequent degradation of the di-tert.-butylphenol (DTBP) to the mono-
tert.-butylphenol (MTBP) and the phenol and the formation of 2-methyl-1-propene (2-MP) as
predicted by C. Sauer14
shown in Scheme 1 (taken from 14
). ____________________________ 11
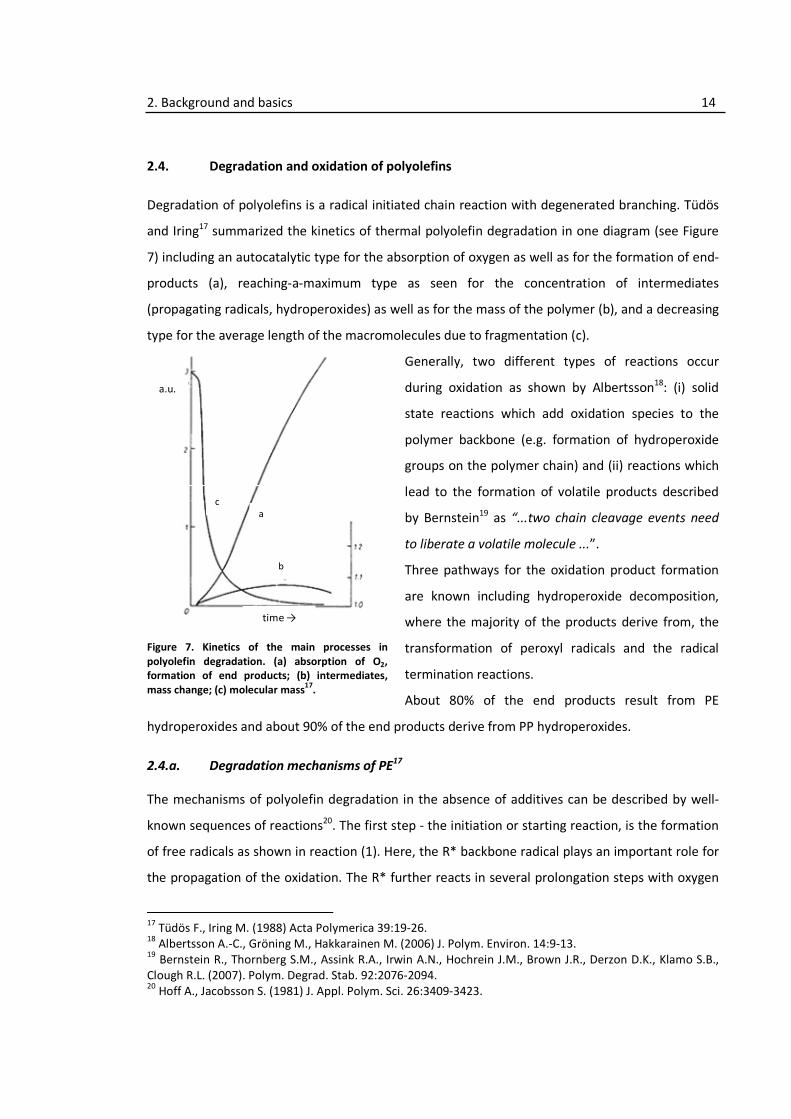
Figure 7. Kinetics of the main processes in polyolefin degradation. (a) absorption of O2, formation of end
products; (b) intermediates, mass change; (c) molecular mass17
. ________________________ 14
Figure 8. SDE apparatus according to.38
. ___________________________________________________ 40
Figure 9. SPME device, annotation see text (adapted from 44
). _________________________________ 43
Figure 10. Total ion chromatogram (TIC) of a PP fraction I (top) and fraction II (bottom) with marked
homologous series of n-alkanes and n-alkanales. ____________________________________ 67
Figure 11. MasStat© cluster obtained from fraction I and fraction II data of WG140AI and L140WG samples
(pellets and injection moulded plaques moulded at TM 200 °C, 230 °C and 260 °C). _________ 67
Figure 12. MasStat© Cluster of pellets and injection moulded plaques at three mass temperatures (200 °C,
230 °C, 260 °C); Labels: “L” … L140WG pellets; “W” … WG140AI-05 pellets; “200L, 230L, 260L” …
plaques from L140WG compounded at 200°C, 230°C and 260°C; “200W, 230W, 260W” …
plaques from WG140AI-05 compounded at 200 °C, 230 °C and 260 °C). __________________ 70
Figure 13. MasStat© Cluster of pellets and injection moulded plaques at three TM (200 °C, 230 °C, 260 °C)
with a differentiation in pellets and plaques. ________________________________________ 71
Figure 14. MasStat© cluster from fraction II data of all the samples (pellets and plaques at three TM from
L140WG-06 (L140), WG140AI-05 (WG140) and WG140AI-06 (WG140-06)). _______________ 71
Figure 15. MVDA of representative detection frequency results (G … pellets, P … plaques). ___________ 74
Figure 16. Detection Frequency (SNIF) Diagram of the extract obtained from BF907MO pellets. _______ 76
Figure 17. Detection Frequency (SNIF) Diagram of the 1:100 diluted extract obtained from BF907MO
pellets. ______________________________________________________________________ 76
Figure 18. Detection Frequency (SNIF) Diagram of the extract obtained from BF907MO plaques. ______ 77
Figure 19. Detection Frequency (SNIF) Diagram of 1:100 diluted extract of BF907MO plaques. ________ 77

Figure 20. Detection Frequency (SNIF) Diagram of extract obtained from EE188AI-9530 (Schwechat)
pellets. ______________________________________________________________________ 82
Figure 21. Detection Frequency (SNIF) Diagram of 1:100 diluted extract obtained from EE188AI
(Schwechat) pellets. ____________________________________________________________ 83
Figure 22. Detection Frequency (SNIF) Diagram of extract obtained from EE188AI (Schwechat) plaques. 83
Figure 23. Detection Frequency (SNIF) Diagram of 1:100 diluted (in green) and 1:1000 diluted (in red)
extract obtained from EE188AI (Schwechat) plaques. _________________________________ 84
Figure 24. Detection Frequency (SNIF) Diagram of extract obtained from EE188AI (Beringen) pellets. ___ 84
Figure 25. Detection Frequency (SNIF) Diagram of 1:100 diluted extract obtained from EE188AI (Beringen)
pellets. ______________________________________________________________________ 85
Figure 26. Detection Frequency (SNIF) Diagram of extract obtained from EE188AI (Beringen) plaques. __ 85
Figure 27. Detection Frequency (SNIF) Diagram of 1:100 diluted (in green) and 1:1000 diluted (in red)
extract obtained from EE188AI (Beringen) plaques. __________________________________ 86
Figure 28. SNIF diagram comparison of the EE188AI pellets from Schwechat (on top in green) and Beringen
(at the bottom in blue). _________________________________________________________ 86
Figure 29. Detection Frequency (SNIF) Diagram of extract obtained from BS2581 pellets._____________ 87
Figure 30. Detection Frequency (SNIF) diagram of extract obtained from BS2581 plaques. ____________ 87
Figure 31. Detection Frequency (SNIF) diagram of extract obtained from BE677AI pellets. ____________ 88
Figure 32. Detection Frequency (SNIF) diagram of extract obtained from BE677AI plaques. ___________ 88
Figure 33. Detection Frequency (SNIF) diagram of extract obtained from EF015AE pellets. ____________ 89
Figure 34. Detection Frequency (SNIF) diagram of extract obtained from EF015AE plaques. ___________ 89
Figure 35. Detection Frequency (SNIF) diagram of the extract obtained from FB2230 (Schwechat) pellets. 95
Figure 36. Detection Frequency (SNIF) diagram of the 1:100 diluted extract obtained from FB2230
(Schwechat) pellets. ____________________________________________________________ 95
Figure 37. Detection Frequency (SNIF) diagram of the extract obtained from FB2230 (Schwechat) plaques.
____________________________________________________________________________ 96
Figure 38. Detection Frequency (SNIF) diagram of the 1:100 diluted extract obtained from FB2230
(Schwechat) plaques. ___________________________________________________________ 96
Figure 39. Detection Frequency (SNIF) diagram of the extract obtained from FB2230 (Porvoo) pellets. __ 97
Figure 40. Detection Frequency (SNIF) diagram of the 1:100 diluted extract obtained from FB2230 (Porvoo)
pellets. ______________________________________________________________________ 97
Figure 41. Detection Frequency (SNIF) diagram comparison of the FB2230 pellets from Schwechat (on top
in green) and Porvoo (at the bottom in blue). _______________________________________ 98
Figure 42. MasStat© Cluster Analysis using the HS-SPME-GC-MS data from the three ME3440 samples
from Provoo, Stenungsund and Borouge (Note: y-axis scale is 1/10 of x-axis!! (0.05 vs. 0.5). _ 101
Figure 43. HS-SPME-GC-MS chromatograms for the ME3440 samples with marked compounds which are
responsible for the differentiation in the MasStat© cluster. ___________________________ 101
Figure 44. Detection Frequency (SNIF) diagram of the extract obtained from ME3440 (Porvoo) pellets. 102
Figure 45. Detection Frequency (SNIF) diagram of the 1:10 diluted extract obtained from ME3440 (Porvoo)
pellets. _____________________________________________________________________ 102
Figure 46. Detection Frequency (SNIF) diagram of the extract obtained from ME3440 (Stenungsund)
pellets. _____________________________________________________________________ 103
Figure 47. Detection Frequency (SNIF) diagram of the 1:10 diluted extract obtained from ME3440
(Stenungsund) pellets. _________________________________________________________ 103
Figure 48. Detection Frequency (SNIF) diagram of the extract obtained from ME3440 (Borouge) pellets. 104
Figure 49. Detection Frequency (SNIF) diagram of the 1:10 diluted extract obtained from ME3440
(Borouge) pellets. _____________________________________________________________ 104
Figure 50. Detection Frequency (SNIF) diagram comparison of the ME3440 pellets from Porvoo (at the
bottom in blue), Stenungsund (in the middle in blue) and Borouge (on top in red). ________ 105
Figure 51. GC-FID chromatogram (in blue) with overlaid O-signal (in red) indicating the high odour activity
of the unknown compound in MB471WG-9014 extract between 11.5 – 12.7min retention time.
___________________________________________________________________________ 109
Figure 52. GC-MS chromatogram of the MB471WG-9014 sample extract with the labelled tert.-
butylphenols (6 and 7) and the area of interest (red circle) analyzed on the non-polar HP-5
column. _____________________________________________________________________ 109
Figure 53. MasStat© Cluster from HS-SPME-GC-MS data analyzing the influence of additives on odour
generation. __________________________________________________________________ 112
Figure 54. Cluster of the reference pellets and plaques produced thereof. The direction of Injection
moulding is indicated. _________________________________________________________ 112
Figure 55. Cluster of the references from Linz and Monza with differing influence of the Injection
moulding. ___________________________________________________________________ 112
Figure 56. Cluster of the reference and the samples with increased compounding temperature (TC=260
°C).Note that the influence of the Injection moulding is lost for the TC=260 °C samples. ____ 113
Figure 57. Cluster of the reference and the samples with changed base polymer. Note that the influence of
the Injection moulding is the same. ______________________________________________ 113
Figure 58. Cluster of the reference and the samples without talc. Note that the influence of the Injection
moulding is lost for the samples without talc. ______________________________________ 113
Figure 59. Cluster of the reference and the samples without colour masterbatch (CMB). Note that the
influence of the Injection moulding is lost for the samples without CMB. ________________ 113
Figure 60. Cluster of the reference and the samples without epicote. Note that the influence of the
Injection moulding is the same for both samples. ___________________________________ 114
Figure 61. Cluster of the reference and the samples with reduced heat stabilization. Note that the
influence of the Injection moulding is the same for both samples. ______________________ 114
Figure 62. Cluster of the reference and the samples without scratch resistance additives. Note that the
influence of the Injection moulding is the same for both samples. ______________________ 114
Figure 63. Cluster of the reference and the samples without UV stabilization. Note that the influence of the
Injection moulding is lost for the samples without UV stabilization. _____________________ 114
Figure 64. GC-MS chromatograms of the four samples. The upper two show significant amounts of 2-ethyl-
1-hexanol (2-EH) due to the use of the new catalyst RCL05P, the lower two were produced with
the old catalyst BCF20P.________________________________________________________ 116
Figure 65. Chemical structure of Tx101. ____________________________________________________ 117
Figure 66. Chemical structure of Tx301. ____________________________________________________ 117
Figure 67. MasStat© Cluster of HS-SPME-GC-MS data obtained from the peroxide samples. Samples with
TX101 in red, samples with Tx301 in green and the reference without peroxide in brown. __ 119
Figure 68. HS-SPME-GC-MS chromatograms of the analyzed data showing clear differences between the
two peroxide systems Tx101 and Tx301. __________________________________________ 120
Figure 69. Summary of Detection Frequency (SNIF) diagrams for HD120MO without peroxide (in green),
with Tx101 and a MFR of 50g/10min (in red) and with Tx301 and a MFR of 50g/10min (in blue).
___________________________________________________________________________ 121
Figure 70. MasStat© Cluster obtained from the HS-SPME-GC-MS data of the unstabilized (unstab.) and
stabilized PP samples stored for 0 (ref), 1 (1d), 3 (3d) and 7 (7d) days at 80 °C in normal
atmosphere (air) or in reduced oxygen atmosphere (N2). _____________________________ 124
Figure 71. HS-SPME-GC-MS chromatograms of unstabilized PP samples stored @80 °C up to 7 days in
normal atmosphere. __________________________________________________________ 124
Figure 72. HS-SPME-GC-MS chromatograms of stabilized PP samples stored @80 °C up to 7 days in normal
atmosphere. _________________________________________________________________ 125
Figure 73. Detection Frequency (SNIF) diagrams of unstabilized PP samples stored @80 °C in air for (a) 0
days, (b) 1 day (top right) and (c) 3 days (bottom left). _______________________________ 125
Figure 74. Detection Frequency (SNIF) diagrams of unstabilized PP samples stored @80 °C in reduced
oxygen atmosphere for (a) 0 days, (b) 1 day, (c) 3 days and (d) 7 days. __________________ 126
Figure 75. Detection Frequency (SNIF) diagrams of stabilized PP samples stored @ 80 °C in air for (a) 0
days, (b) 1 day, (c) 3 days and (d) 7 days. __________________________________________ 126
Figure 76. Detection Frequency (SNIF) diagrams of stabilized PP samples stored @ 80 °C in reduced oxygen
atmosphere for (a) 0 days, (b) 1 day, (c) 3 days and (d) 7 days. _________________________ 127
Figure 77. Multivariate calibration and cross-validation curves for (a) all PP (HD120MO) samples, (b)
stabilized samples in a reduced oxygen atmosphere, (c) stabilized samples in air, (d) unstabilized
samples in a reduced oxygen atmosphere and (e) unstabilized samples in air. ____________ 128
Figure 78. MasStat© Cluster obtained from the HS-SPME-GC-MS data of the unstabilized (unstab.) and
stabilized (stab.) PE samples stored for 0 (ref), 1 (1d), 3 (3d) and 7 (7d) days at 80 °C in normal
atmosphere (air) or in reduced oxygen atmosphere (N2). _____________________________ 131
Figure 79. HS-SPME-GC-MS chromatograms of unstabilized PE samples stored @80 °C up to 7 days in
normal atmosphere (air). _______________________________________________________ 131
Figure 80. HS-SPME-GC-MS chromatograms of stabilized PE samples stored @80 °C up to 7 days in normal
atmosphere (air). _____________________________________________________________ 132
Figure 81. Detection Frequency (SNIF) diagrams of unstabilized PE samples stored @ 80 °C in air for (a) 0
days, (b) 1 day, (c) 3 days and (d) 7 days. __________________________________________ 132
Figure 82. Detection Frequency (SNIF) diagrams of unstabilized PE samples stored @ 80 °C in a reduced
oxygen atmosphere for (a) 0 days, (b) 1 day, (c) 3 days and (d) 7 days. __________________ 133
Figure 83. Detection Frequency (SNIF) diagrams of stabilized PE samples stored @ 80 °C in air for (a) 0
days, (b) 1 day, (c) 3 days and (d) 7 days. __________________________________________ 133
Figure 84. Detection Frequency (SNIF) diagrams of stabilized PE samples stored @ 80 °C in a reduced
oxygen atmosphere for (a) 0 days, (b) 1 day, (c) 3 days and (d) 7 days. __________________ 134
Figure 85. Multivariate calibration and cross-validation curves for (a) all PE (ME3440) samples, (b)
stabilized samples in reduced oxygen atmosphere, (c) stabilized samples in air, (d) unstabilized
samples in a reduced oxygen atmosphere and (e) unstabilized samples in air. ____________ 135
Figure 86. Proposed HS-SPME-GC-PID set-up. _______________________________________________ 136
Figure 87. ChromStat© Cluster of QC samples separated by the material _________________________ 137
Figure 88. ChromStat© Cluster of QC samples showing separation of different lots of the same material
ME3440-05. _________________________________________________________________ 138
Figure 89. MasStat© cluster from the HS-SPME-GC-MS data of the coloured (RA130E-8427), the non-
coloured (RA130E natural) and the CMB (CMB126 grey) samples. ______________________ 141
Figure 90. HS-SPME-GC-MS chromatograms of the coloured (RA130E-8427), the non-coloured (RA130E
natural) and the CMB (CMB126 grey) samples. _____________________________________ 142
Figure 91. Detection Frequency (Total SNIF) diagrams of the CMB126 (in red) and the natural RA130E
pellets (in brown) using the 2 g and the 500 mg GC-O results. _________________________ 142
Figure 92. Detection Frequency (Total SNIF) diagrams of the coloured RA130E pellets (in blue) using the 2 g
and the 500 mg GC-O results. ___________________________________________________ 143
Figure 93. MasStat© cluster from the HS-SPME-GC-MS data of the coloured (EE188HP-1048), the non-
coloured (EE188HP natural) and the CMB (CMB347 beige) pellet and plaque samples. _____ 145
Figure 94. HS-SPME-GC-MS chromatograms of the coloured (EE188HP-1048), the non-coloured (EE188HP
natural) and the CMB (CMB347 beige) pellets and plaque samples. _____________________ 145
Figure 95. Detection Frequency (Total SNIF) diagrams of the CMB126 (in red) and the natural RA130E
pellets (in brown) using the 2 g and the 500 mg GC-O results. _________________________ 146
Figure 96. Detection Frequency (Total SNIF) diagrams of the coloured RA130E pellets (in blue) using the 2 g
and the 500 mg GC-O results. ___________________________________________________ 146
Figure 97. HS-SPME-GC-MS chromatograms of monomer sample 63001 (before purification) and 63103
(after purification) from Kallo and the air sample from Linz. ___________________________ 149
Figure 98. Mean areas and standard deviations for selected compounds calculated from 5 measurements
for the 63001 and the 63103 samples. ____________________________________________ 149
Figure 99. GC-MS measurements with extracted m/z 44 typical for the odour-active saturated aldehydes
for the 63001 and 63103 samples. _______________________________________________ 150
Figure 100. HS-SPME-GC-NPD chromatograms for the 63001 and 63103 samples. __________________ 150
Figure 101. Detection Frequency (SNIF) diagram of the propylene monomer sample 63001 (before
purification; in blue) and 63103 (after purification; in red) from Kallo. __________________ 151
Figure 102. Detection Frequency (SNIF) diagram of the 1st
propylene monomer sample before purification
(in blue) and after purification (in red) from Kallo. ___________________________________ 151
Figure 103. HS-SPME-GC-NPD chromatograms of the PP pellet, the PP box and the standard addition
samples. ____________________________________________________________________ 153
Figure 104. MasStat© cluster from all samples (labels as described in Table 3). _____________________ 155
Figure 105. HS-SPME-GC-MS chromatograms of BJ368MO pellets (BO168) (in black), competitor box with
label from France (BO170) (in blue) and BJ368MO box without label from Belgium (BO172) (in
red). _______________________________________________________________________ 156
Figure 106. HS-SPME-GC-MS chromatograms of the air measurements during the injection moulding of the
BJ368MO and the competitor material at cavity 10. _________________________________ 156
Figure 107. Detection Frequency (SNIF) diagrams of BJ368MO pellets (in red), BJ368MO injection moulded
and labelled box from France (in blue) and the injection moulded and labelled competitor box
from France (in green). Blue markings show differences in the odour pattern of the two boxes.
___________________________________________________________________________ 158
Figure 108. Detection Frequency (SNIF) diagram of the metallocene-PP (m-PP) pellets (in blue on top) and
plaques (in green, at the bottom). _______________________________________________ 159
Figure 109. Extracted HS-SPME-GC-MS chromatogram with the m/z of 44, a typical m/z for saturated
aldehydes of the metallocene-PP (m-PP) pellets (in black, on top) and plaques (in green, at the
bottom). ____________________________________________________________________ 159

Figure 110. HS-SPME-GC-MS chromatograms of the metallocene-PP (m-PP) pellets (in black) and plaques (in
green) compared to the Ziegler-Natta PP (ZN-PP) EE188AI-9530 pellets (in turquoise) and
plaques (in lilac). ._____________________________________________________________ 160
List of Tables
Table 1. Typical mass temperatures (TM) for processing of PE and PP materials. ___________________ 13
Table 2. List of identified odour-active compounds in PE and PP samples in numerous publications with
their sensory threshold values determined in water taken from 32
. ______________________ 21
Table 3. List of all polyolefin samples which were analyzed during the thesis. _____________________ 30
Table 4. Apparatus parameter for the SPME-GC-MS measurements using the GC-GCD system. ______ 49
Table 5. Apparatus parameter for the SPME-GC-MS measurements using the 7890 GC-MS system. ___ 50
Table 6. Apparatus parameter for the GC-MS measurements of the liquid fractioned extracts using the
GC-MS system. ________________________________________________________________ 51
Table 7. Apparatus parameter for the GC-MS measurements of the NMH derivatised liquid fractioned
extracts using the GC-MS system. _________________________________________________ 52
Table 8. Apparatus parameter for the GC-MS measurements of the PFBHA derivatised liquid fractioned
extracts using the GC-MS system. _________________________________________________ 53
Table 9. Apparatus parameter for the GC-O measurements of the liquid extracts. _________________ 54
Table 10. GCxGC-TOF-MS parameters for measurements of the liquid fraction II samples. ___________ 56
Table 11. Parameter for the quantification of 2-acetyl-1-pyrroline in a PP sample. __________________ 57
Table 12. Odour descriptors and odour thresholds in water and oil from the literature32
for the
compounds which sensory threshold values were determined. _________________________ 63
Table 13. Composition of the test mixture for the GC-O system. ________________________________ 65
Table 14. Detailed recipe for the L140WG-06 and the WG140AI-05 samples. ______________________ 68
Table 15. Material data sheets for the representative grades. __________________________________ 72
Table 16. Odour-active compounds in BF907MO pellets (pel) and plaques (pla) (RIexp … experimental
Retention Indices, s.d. … standard deviation, RIlit … literature Retention Indices determined with
pure standards (om) or taken from literature sources 67,68
). ____________________________ 78
Table 17. List of identified odour-active compounds detected in EE188AI samples from Beringen and
Schwechat in extract obtained from pellets(pel) and plaques(pla). (RIexp … experimental
Retention Indices, s.d. … standard deviation, RIlit … literature Retention Indices determined with
pure standards (om) or taken from literature sources 67,68
). ____________________________ 90
Table 18. List of odour-active compounds present in the base polymers BS2581, BE677AI, EF015AE and in
the corresponding compound PP EE188AI from Beringen in pellets (pel) and plaques (pla) (RIexp
… experimental Retention Indices, s.d. … standard deviation, RIlit … literature Retention Indices
determined with pure standards (om) or taken from literature sources 67,68
). ______________ 92
Table 19. List of odour-active compounds present in the FB2230 from Schwechat and Porvoo (pel ...
pellets; pla ... plaques; RIexp … experimental Retention Indices, s.d. … standard deviation, RIlit …
literature Retention Indices determined with pure standards (om) or taken from literature
sources 68
). ___________________________________________________________________ 98
Table 20. List of odour-active compounds present in the ME3440 pellets from Porvoo (Po), Stenungsund
(St) and Borouge (Bo). (RIexp … experimental Retention Indices, s.d. … standard deviation, RIlit …
literature Retention Indices determined with pure standards (om) or taken from literature
sources 67,68
). _________________________________________________________________ 105
Table 21. 2-Ethyl-1-hexanol mean concentrations and standard deviation in the samples determined by
GC-MS. _____________________________________________________________________ 116
Table 22. List of peroxide samples analyzed in the study. Samples in italic were used in the GC-O analyses.
___________________________________________________________________________ 118
Table 23. Differences in selected compounds representative for the use of Tx301 and Tx101. Tx101 was
used as reference, values are expressed as difference to the use of Tx101. _______________ 120
Table 24. Sensory threshold values determined as group BET in water (s.d. ... standard deviation). ___ 139
Table 25. Sensory threshold values determined as group BET in miglyol (s.d. ... standard deviation). __ 139
Table 26. Limits of Detection (LOD) and Limit of Quantification (LOQ) and the standard deviation of
regression (SDR) for the 2-acetyl-1-pyrroline quantification with HS-SPME-GC-NPD and standard
addition. ____________________________________________________________________ 153
Table 27. 2-acetyl-1-pyrroline concentration in the BJ368MO pellets and the injection moulded box
determined by standard addition and HS-SPME-GC-NPD (n=3). ________________________ 153
List of Schemes
Scheme 1. Reaction pathway of phenolic antioxidant degradation in the presence of talc proposed by
Sauer14
. ______________________________________________________________________ 12
Scheme 2. Reaction mechanism of carbonyls with PFBHA. _______________________________________ 46
Scheme 3. Mechanism of hydrazone formation from carbonyls and NMH. __________________________ 47
Scheme 4. Mechanism of the catalytic activity of BF3 on the cyclization of hydrazones to pyrazolines
(according to 17
). _______________________________________________________________ 47
Abbreviations
AED atomic emission detector
amu atomic mass units
at atactic
BF3 Boron trifluoride
BSTFA N,O-bis(trimethylsilyl)trifluoroacetamide
DCM dichloromethane
DEE diethyl ether
DVB/CAR/PDMS Divinylbenzene/Carboxen/Polydimethylsiloxane
ECD electron-capture detector
FID flame ionisation detector
FPD flame photometric detector
FT film thickness of the GC column
GC gas chromatography
ID inner diameter of the GC column
IS Internal Standard
it isotactic
MS mass spectrometry
MWD molecular weight distribution
MVDA multivariate data analysis
NMH N-methylhydrazine
NPD nitrogen phosphorus detector
ODP olfactory detection port
OR odour receptor
PAHs polycyclic aromatic hydrocarbons
PCA principal component analysis
PE-HD high density polyethylene
PE-LD low density polyethylene
PE-LLD linear low density polyethylene
PFBHA O-(2,3,4,5,6-Pentafluorobenzyl)hydroxylamine hydrochloride
PP polypropylene
SDE simultaneous distillation/extraction
SIM selected ion monitoring
SPE solid phase extraction
SPME Solid Phase Microextraction

st syndiotactic
TC compounding temperature
TM mass temperature
TMelt melting temperature
TMH 3,5,5-trimethyl-1-hexanal
Kurzfassung
Im Rahmen dieser Dissertation wurden geruchsaktive Verbindungen in Polyolefinen (Polyethylen
(PE) und Polypropylen (PP)) mit Hilfe der Gaschromatographie (GC) gekoppelt mit
Massenspektrometrie (MS) und Olfaktometrie (O), wo die menschliche Nase als Detektor
verwendet wird, identifiziert.
Untersucht wurden sowohl PE und PP Materialien aus jenen Anwendungsbereichen, in denen
Geruch eine wichtige Materialeigenschaft darstellt. Dazu zählen Lebensmittelverpackungen,
Trinkwasserrohre und Komponenten des Automobilinnenraums.
Für die Bildung von geruchsaktiven Verbindungen in Polyolefinen wurden zahlreiche
Einflussfaktoren identifiziert. Den größten Einfluss auf die Bildung von Geruchskomponenten in PE
und PP haben Verarbeitungsschritte wie Compoundierung, Extrusion und Spritzguß.
Einen weiteren wichtigen Faktor stellen die verwendeten Additive dar. Hier konnten v.a. Füllstoffe,
Farb-Masterbatches und Antioxidantien als Geruchstreiber identifiziert werden.
Weiters wurde durch Untersuchungen an Monomeren, Comonomeren und Verdünnern auch für
diese Prozessstoffe ein zum Teil erhebliches Geruchspotential ermittelt.
Die Mehrheit der identifizierten Substanzen besitzt eine funktionelle Carbonylgruppe. Dabei
handelt es sich sowohl um gesättigte als auch ein- und mehrfach ungesättigte aliphatische
Aldehyde und Ketone, die alle sehr niedrige sensorische Geruchsschwellenwerte im ppb Bereich
oder darunter aufweisen.
Neben diesen Carbonylverbindungen wurden auch diverse niedersiedende Alkohole,
Karbonsäuren, Laktone und aromatische Substanzen wie Kresol und 2-Acetyl-1-pyrrolin als
geruchsaktive Komponenten bestimmt.
In einem weiteren Teil der Arbeit wurden die sensorischen Geruchsschwellenwerte der am
häufigsten identifizierten Verbindungen mit einem Sensorikpanel in Wasser und Öl bestimmt.
Erst durch diese Schwellenwerte ist es möglich die identifizierten Verbindungen aufgrund ihres
Beitrags zum Gesamtgeruch zu reihen.
Dadurch konnte festegestellt werden, dass der Geruch von Polyolefinen v.a. durch die 1-Alken-3-
one und die einfach ungesättigten Aldehyde mit einer Kettenlänge zwischen 6 und 10 C-Atomen
bestimmt wird. Diese Verbindungen sind bekannte Oxidationsprodukte von PE and PP Materialien.

Abstract
In this work odour-active compounds were identified in polyolefins (namely polyethylene (PE) and
polypropylene (PP)) by means of gas chromatography (GC) coupled to different detection systems
such as mass spectrometry (MS) and olfactometry (O) where the human nose acts as the detector.
The majority of the odour-active compounds are carbonyls, i.e. both saturated and mono- and
diunsaturated aldehydes and ketones showing very low sensory odour threshold values in the
lower and sub-µg per kg range.
Other identified odour-active compounds include alcohols, carboxylic acids, lactones and aromatic
compounds such as cresol and 2-acetyl-1-pyrroline.
Various PE and PP materials were investigated from different application areas, where odour is an
important material property. This is the case for food packaging materials, drinking water pipes
and the automotive interior.
The formation of odour-active compounds in polyolefins is strongly influenced by various process
steps; the biggest influencing factor is the processing including compounding, extrusion and
injection moulding.
Next, additives are also influencing the odour of the polyolefinic product; especially fillers,
antioxidants and colour master batches contribute to the odour of polyolefinic products.
Last, also monomers, co-monomers and diluents show an odour potential.
Sensory odour threshold values of the most abundant odour-active compounds in polyolefins
were determined with a sensory panel in water and oil. With these values it is possible to rank the
many compounds for their contribution to the overall odour.
Finally, the 1-alken-3-ones and the mono-unsaturated aldehydes with chain lengths between 5
and 10 C-atoms were identified as major contributors to the odour of polyolefins. These
compounds are known oxidation products of PE and PP materials.

Acknowledgements
Completing a PhD is truly a marathon event, and I would not have been able to complete this
journey without the aid and support of countless people over the past four years.
I must first express my sincere gratitude towards my supervisor, Professor Erich Leitner: I started
as a novice in Analytical Chemistry and thanks to him and his never-ending support, ability to
teach and collegiality I am here today.
I would like to thank my second examiner, Professor Reinhold W. Lang, who immediately accepted
my inquiry although I switched my field of research and who supported and accompanied me
through my master studies.
I am deeply grateful to Wolfgang Stockreiter: Providing samples is one thing, but sharing thoughts
and being present for countless discussions and meetings, often on short notice, is definitely
beyond a typical business cooperation – many thanks for this great support!
My acknowledgements to Nina Haar: Nina, it was a real pleasure and honour to work with you. I
will definitely miss your attitude and many thanks for keeping me on track!
A special mention of my fellow PhD student and office mate Drin Eva Schrampf who made our
conference trips memorable and daily office life a real pleasure and who introduced me to MVDA.
To all the other colleagues of the research group I am deeply indebted: Univ.Dozin Drin Barbara
Siegmund for sharing her ideas and thoughts and for having a role model at hand; Claudia
Koraiman, Sigrid Hager and DIin Lilli Zefferer for helping out with GC-O analyses and highly
appreciated coffee breaks.
A special thank you to the students I was able to work with; their work is part of this thesis: Edith
Renöckl, who looked into monomer purity, Hanne Furbo working on derivatization of carbonyls
during her IAESTE internship and Josefine Mohlin, who determined sensory threshold values with
GC-O.
Finally, I would like to thank my parents for having confidence in me. And for the one who was
there for me and still is after all these years – Thomas, this is for you!
This work was funded by the Austrian Promotion Agency (FFG) in a BRIDGE project (no.
814233/11968) and was carried out in cooperation with Borealis Polyolefine GmbH.
1. Introduction 1
1. Introduction
Nowadays, plastics are used in nearly every aspect of our daily lives. They are used for packaging,
in the mobility area for automotive interior and exterior parts, in the building and construction
area for transportation of drinking and waste water and natural gas, for products such as toys,
computers and cutlery, personal hygiene and medical devices (infusion hose, ...).
The group of polyolefins is the largest group of plastics used nowadays. The most prominent
members of polyolefins are polyethylene of various densities (PE) and polypropylene (PP) which
account to nearly 50% of all plastics produced in Europe according to recent numbers1.
The increased application of plastics materials in all areas of the daily life is mostly determined by
their properties in combination with their light weight. Besides mechanical strength, Young’s
Modulus and chemical stability, additional requirements have to be met in applications where the
plastics are in direct contact with the end consumer (food contact materials, interior automotive
parts and drinking water pipes), especially as consumers become more and more aware and
sensitive. These additional requirements include low/no migration, low/no emission or a low
odour rating.
In the context of Food Safety this is a topic of enormous relevance and importance not only for
legislative bodies but also for consumers as shown for the discussion about endocrine disruptors
present in plastics.
Especially volatiles are of interest as those substances have the possibility to migrate out of the
plastic and being emitted to the environment. These volatiles can be formed (a) during processing
and use due to the non-inert nature of polymers which are affected by the environment (oxygen,
temperature, UV-light, mechanical stress), (b) derive from the polymerization from solvents
and/or process additives or (c) from interactions of the polymer with additives and/or printings
and labels.
One special sub-group of volatiles are odour-active compounds which are not necessarily harmful
to the human health but always irritating and annoying.
Odour-active compounds show a large variety in their type of functional group (including acids,
esters, alcohols, carbonyls, thiols, amines, aromatics, ...), in their sensory thresholds (i.e. that
concentration where a compound becomes noticeable) ranging from sub-ng per litre up to several
1 Plastics Europe, 2009: The Compelling Facts About Plastics 2009 - An analysis of European plastics
production, demand and recovery for 2008. Available on www.plasticseurope.org (accessed 12-14-2009).
1. Introduction 2
mg per litres and in their odour quality (fruity, fatty, pungent, musty, roasty, …), which is
determined mostly at which odour receptor(s) the compound binds to.
Odour-active compounds in plastics are problematic as they do not only smell but more important
they can also modify or change the odour and/or flavour of the product which are in contact with
the plastic (e.g. packaged food and beverages, drinking water stored in plastic drinking water
pipes).
Some plastics are more sensitive in terms of the generation of volatiles and odour-active
compounds either due to their type of production (the use of solvents and/or process additives
which might cause odour problems e.g. rest urethane in PUR foams) or their chemical structure.
Currently, odour is measured mostly by the use of sensory panels consisting of a group of persons
which are constantly trained to evaluate and judge the odour of products.
However, in many cases of material development the evaluation of odour quality and intensity is
not sufficient. For understanding and further avoiding the formation of odour-active compounds
during the production, an identification of the single odour causing substances is necessary.
Answers to these questions a sensory panel cannot give, and an analytical method is needed.
However, when working with analytical methods such as gas chromatography (GC) coupled to
conventional detectors such as mass spectrometry (MS) or flame ionization detector (FID) one
needs to overcome the problem that these detectors cannot tell whether a compound is odour-
active or not. This information always has to come from a human being.
In this work the results of a three year project about the identification of odour-active compounds
in PE and PP materials are presented. By combining the sensory approach using a panel and
analytical methods as gas chromatography it is possible to determine which compounds make up
the overall odour of polyolefins and to what extent each individual substance contributes to the
overall odour.
After establishing a basic knowledge about what kind of odour-active compounds are present in
the polyolefins the question arises where these compounds come from and how they are
generated.
For this, a look at the whole process chain of polyolefins is needed to identify the possible origins
including the raw material-the comonomers and monomers, the polymerization step, the
additivation, the compounding and the processing step.
1. Introduction 3
1.1. Aims and targets
This work was carried out in cooperation with Borealis Polyolefine GmbH as business partner.
Borealis mid- and long-term visions and missions deal with the reduction of impurities within their
products. One critical impurity for several business areas within the company is odour.
Together with the cooperation partner several targets and aims were set:
• status-quo evaluation of today’s Borealis PE and PP products for odour-active compounds
present.
• study of influencing parameters on the odour generation along the whole polyolefin
process chain including the raw materials, polymerization techniques, additives and
processing.
• classification of the odour-active compounds in terms of their odour relevancy by
determination of their sensory thresholds.
• identification of the crucial steps in the production of PE and PP on the odour formation.
• establishment of a basic knowledge and awareness of odour-active compounds present in
PE and PP.
• establishment of analytical methods for odour measurement.
Answering these questions basic knowledge about the problematic of odour and its measurement
should be established. Further, one should be able to work on odour reduction measures.
2. Background and basics 4
2. Background and basics
2.1. Odour and odour perception
To call a substance odour-active several prerequisites have to be met:
• an odour-active compound needs to be volatile at atmospheric pressure
• the compound needs to bind to one or more odour receptor cell types
• compounds with a molecular mass over 300 g/mol do not show odour-activity as they are
not able to bind to odour receptor cells.
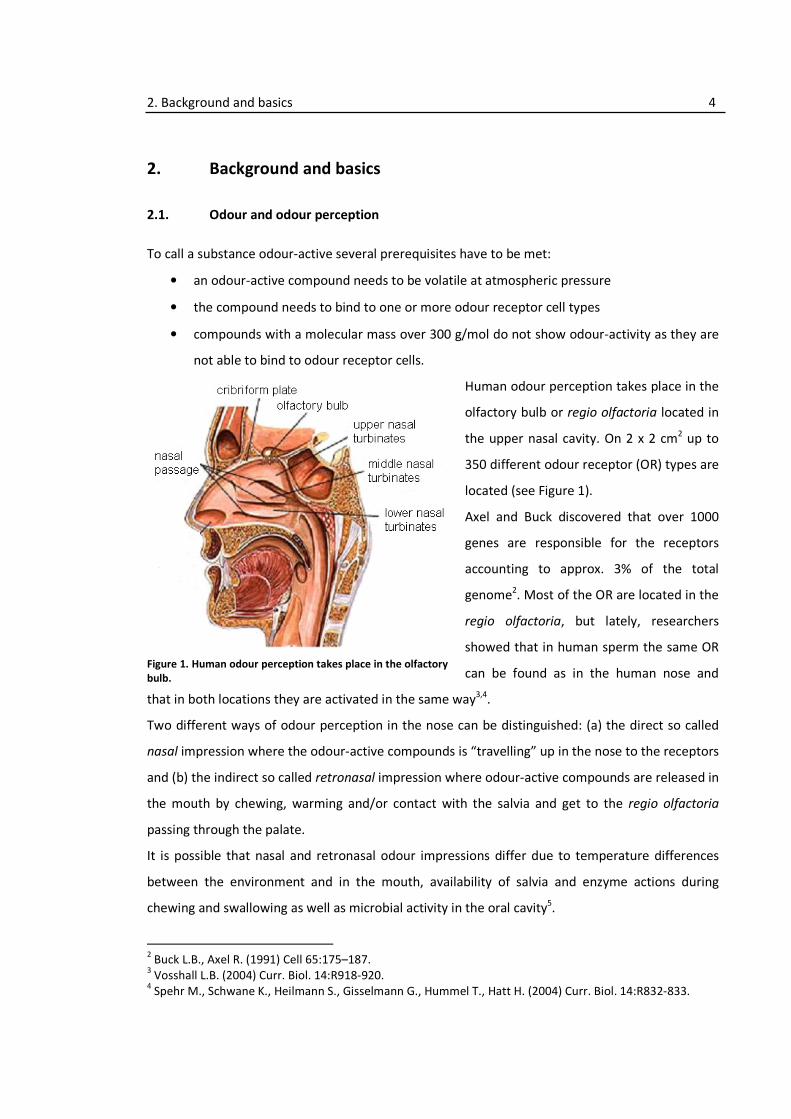
Human odour perception takes place in the
olfactory bulb or regio olfactoria located in
the upper nasal cavity. On 2 x 2 cm2 up to
350 different odour receptor (OR) types are
located (see Figure 1).
Axel and Buck discovered that over 1000
genes are responsible for the receptors
accounting to approx. 3% of the total
genome2. Most of the OR are located in the
regio olfactoria, but lately, researchers
showed that in human sperm the same OR
can be found as in the human nose and
that in both locations they are activated in the same way3,4.
Two different ways of odour perception in the nose can be distinguished: (a) the direct so called
nasal impression where the odour-active compounds is “travelling” up in the nose to the receptors
and (b) the indirect so called retronasal impression where odour-active compounds are released in
the mouth by chewing, warming and/or contact with the salvia and get to the regio olfactoria
passing through the palate.
It is possible that nasal and retronasal odour impressions differ due to temperature differences
between the environment and in the mouth, availability of salvia and enzyme actions during
chewing and swallowing as well as microbial activity in the oral cavity5.
2 Buck L.B., Axel R. (1991) Cell 65:175–187.
3 Vosshall L.B. (2004) Curr. Biol. 14:R918-920.
4 Spehr M., Schwane K., Heilmann S., Gisselmann G., Hummel T., Hatt H. (2004) Curr. Biol. 14:R832-833.
Figure 1. Human odour perception takes place in the olfactory
bulb.
2. Background and basics 5
2.2. Odour analysis
Currently, odour is measured mostly by the use of sensory panels consisting of a group of persons
which are constantly trained to evaluate and judge the odour of products. To overcome the
subject statement of a single panellist it is required (a) to always work with a group of people
where all of them fulfil certain requirements in terms of their sensitivity and ability to describe
odours, (b) to use objective test questions (no asking for personal preferences but whether there
are differences) and (c) to apply appropriate test procedures to ensure a statistically secured
result.
Members of sensory panels do not necessarily smell “better” than normal people; during the
training sessions they train their ability to describe odours in a objective way (instead of “I don’t
like it” they say “This has a green and rotten odour”).
In this work the sensory panel was used for the determination of sensory threshold values in a
polyolefin-like matrix.
There are different definitions of sensory threshold values6; the detection threshold is the lowest
concentration at which a panellist detects an odour compared to a blank sample, but cannot
further describe the odour. At higher concentrations one is able to describe the odour, that
concentration is called the recognition threshold. At a certain concentration one is not able to
detect a difference in the intensity any more; this concentration is the terminal threshold.
In the literature one finds many sensory thresholds values but in most cases these values are
either determined in air or water. Sensory threshold values are strongly dependent on the matrix,
as it is easy to understand that from a polar matrix non-polar compounds are more easily released
than from a non-polar one. As water is a rather polar matrix and PE and PP are non-polar the
sensory threshold values for the identified odour-active compounds were determined in a
polyolefin-like matrix.
The work of sensory panels is useful for many areas in the food industry, however, this approach
has also major some drawbacks:
• A certain amount of people is needed for a statistically approved result
5 Starkenmann C., Le Calv B., Niclass Y., Cayeux I., Beccucci S., Troccaz M. (2008) J. Agric. Food Chem.
56:9575-9580. 6 ASTM E679 - 04 (2004) Standard Practice for Determination of Odor and Taste Thresholds By a Forced-
Choice Ascending Concentration Series Method of Limits.
2. Background and basics 6
• A constant and regular training at the start-up and during the work of the panel is needed
comparable to the constant calibration of an analytical instrument to be able to work with
the analytical instrument “human sensory panel”.
• Sensory tests and trainings are time and personnel consuming; a minimum of one training
session per week is recommended.
• As sensory panels can only judge the overall odour of a product no further information
about the composition of the odour and the concentration of each odour-active compound
in this mixture can be determined.
As the needed information whether a compound is odour-active or not, only a human is able to
give, humans need to act as a detector, but instead of judging the overall odour of the product,
the panellist detects single odour-active compounds after a separation of the mixture facilitated
by a chromatographic technique. Due to the volatile nature of odour-active compounds, gas
chromatography (GC) is the method of choice. The coupling of a GC with a human panellist acting
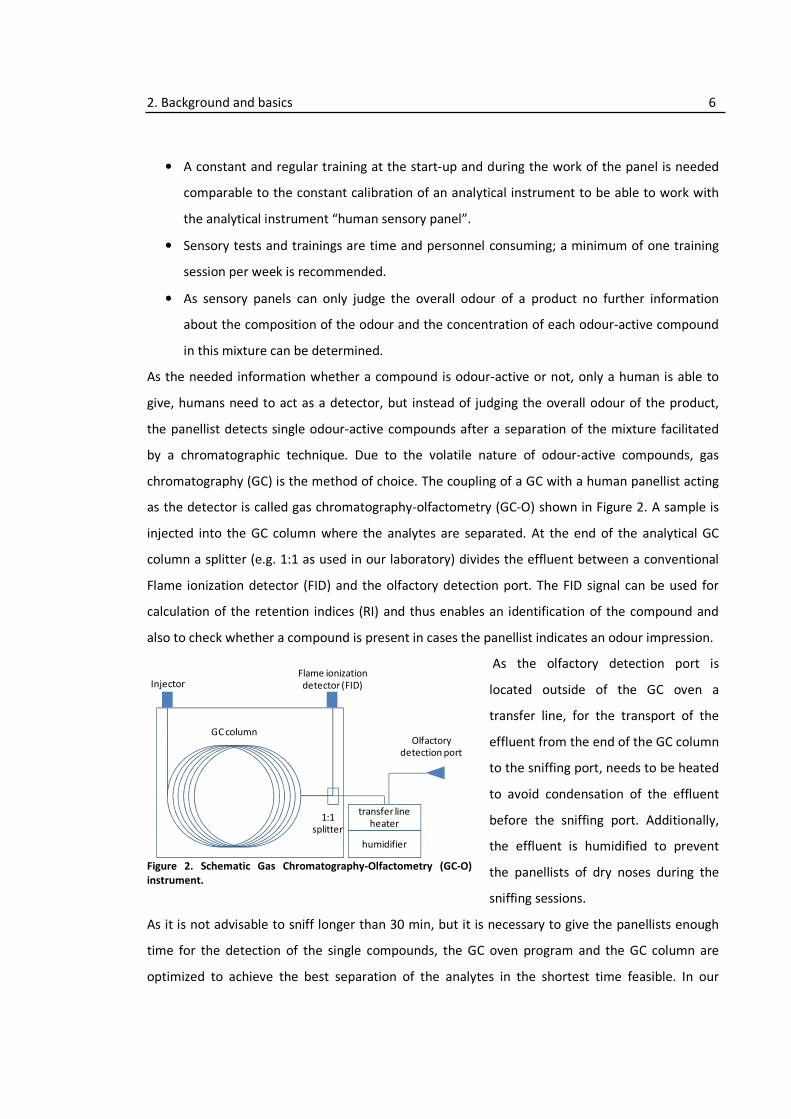
as the detector is called gas chromatography-olfactometry (GC-O) shown in Figure 2. A sample is
injected into the GC column where the analytes are separated. At the end of the analytical GC
column a splitter (e.g. 1:1 as used in our laboratory) divides the effluent between a conventional
Flame ionization detector (FID) and the olfactory detection port. The FID signal can be used for
calculation of the retention indices (RI) and thus enables an identification of the compound and
also to check whether a compound is present in cases the panellist indicates an odour impression.
As the olfactory detection port is
located outside of the GC oven a
transfer line, for the transport of the
effluent from the end of the GC column
to the sniffing port, needs to be heated
to avoid condensation of the effluent
before the sniffing port. Additionally,
the effluent is humidified to prevent
the panellists of dry noses during the
sniffing sessions.
As it is not advisable to sniff longer than 30 min, but it is necessary to give the panellists enough
time for the detection of the single compounds, the GC oven program and the GC column are
optimized to achieve the best separation of the analytes in the shortest time feasible. In our
Figure 2. Schematic Gas Chromatography-Olfactometry (GC-O)
instrument.
humidifier
Olfactory detection port
Flame ionization detector (FID)Injector
GC column
1:1 splitter
transfer line heater
2. Background and basics 7
analyses we used a 30 m long GC column with a film thickness of 0.25 µm in combination with a
heating rate of 10 °C/min. With these parameters the odour-active analytes elute within the first
20 min.
2.3. Polyolefins (process chain)
The group of polyolefins (i.e. polymers with repeating units having only C- and H-atoms) is one of
the most important one among the commercial plastics. When looking at the whole process chain
in polyolefin production it is possible to separate the whole process in several steps:
(1) monomer generation and treatment
(2) polymerization
(3) post-polymerization process including additivation
(4) processing (i.e. injection moulding, extrusion, blow-moulding, ...).
Looking into these different steps one is able to identify several parameters which influence the
properties of the polyolefin end product.
(1) When it comes to monomers, for ethylene and propylene mainly petroleum sources are used.
Either natural gas is used in a high temperature cracking process to produce the ethylene from
ethane and propane or the gasoline fraction from the primary oil distillation is cracked and
further distilled to purify the ethylene from lower alkanes and olefins7. For the propylene the
C3 fraction (propylene and propane) is separated from other gases by fractional distillation.
Later propane is separated from the propylene in an additional distillation step.
Prior to the monomer entering the polymerization reactor it needs to be purified from
impurities which deteriorate the polymerization process and/or the catalytic activity (e.g.
carbon monoxide, acetylene, methyl acetylene, oxygen and water)7.
(2) For the PE polymerization 4 different processes exist. While PE with low density (PE-LD) is
produced in a catalyst-free process at high pressures, three processes exist for the production
of PE with high density (PE-HD) working at reduced pressures using the Ziegler-Natta process
with highly active MgCl2 supported Ti catalysts, the Philips process with metal oxides catalysts
and the metallocene process where the catalysts consist of a transition metal compound,
usually zirconium or titanium, incorporated into a cyclopentadiene-based structure.
7 Brydson J.A. (1999) Polyethylene in: Plastics Materials: Seventh Edition, Elsevier Butterworth-Heinemann,
Oxford, UK, 205-246.
2. Background and basics 8
PP is produced by Ziegler-Natta and metallocene processes, a free radical process would lead
to only amorphous PP lacking the desired properties of PP.
The high pressure process for PE-LD is initiated by benzyl peroxides or azodi-isobutyronitril at
high pressure (100 – 300 MPa) and temperatures (80 – 300 °C). The obtained polymer contains
both short and long chain branches. Special attention must be given to the process control to
prevent a runaway reaction. Typically, 10 to 30 % of the monomer is converted into the
polymer in a continuous (narrow-bore tubes or stirred reactors) or batch process (autoclave).
PE-LD densities are between 0.915 to 0.94 g/cm3 with about 40 to 50 % crystallinity8.
PE-HD (densities 0.942 - 0.965 g/cm3 and 60 to 80 % crystallinity) and PP are produced by
Ziegler-Natta catalysts at low pressures (0.1 to 5 MPa) and temperature below 100°C in the
absence of oxygen, water, ethanol and alkali. Ziegler-Natta catalysts enable multi-site reactions
leading to a broad molecular weight distribution (MWD). Today’s Ziegler-Natta catalysts are
highly active with conversion rates of 95 %. These catalysts are MgCl2 supported
heterogeneous TiCl3 types which are present in a different phase from the reactor mixture. The
fixation on the inert support material enables a feeding into the reactor and a better process
control. In combination with a Lewis base (e.g. benzoic acid) as an electron donor and a second
Lewis base (e.g. methyl-p-toluate) as an external donor the catalyst activity and the
stereospecificity are dramatically increased and the post reactor removal of catalyst residues is
eliminated10.
Another catalyst for production of PE-HD is the Phillips‘ type: The supported metal oxide
(typically 5 % CrO3 on finely divides silica-alumina) catalysts works between 130 to 160 °C
between 3 and 4 MPa. The process shows a high stereo-specificity7.
The most modern catalyst systems are metallocenes for the production of linear low density PE
(PE-LLD) and syndiotactic PP9. Metallocenes are single-site catalysts, i.e. the monomer only
reacts at a single site on the catalysts molecule. Metallocenes are compounds in which two
cyclopentadienyl or substituted cyclopentadienyl ligands are π-bonded to a metal atom. The
stereochemistry of such compounds resembles a distorted tetrahedron. The metal centre can
be a zirconium, hafnium or titanium (see Figure 3)10. For the formation of the active centre on
the metal atom in the cleft between the bridged alkyl groups cocatalysts are needed (e.g.
8 Oberbach K. (2001) Saechtling Kunststoff Taschenbuch, 28th edition, Hanser, Munich, Germany.
9 Imuta J.-I., Kashiwa N. (2000) Recent Progress on single-site catalysts, in: Handbook of polyolefins (Vasile
C., ed.) Marcel Dekker, New York, USA, 71-88.
2. Background and basics 9
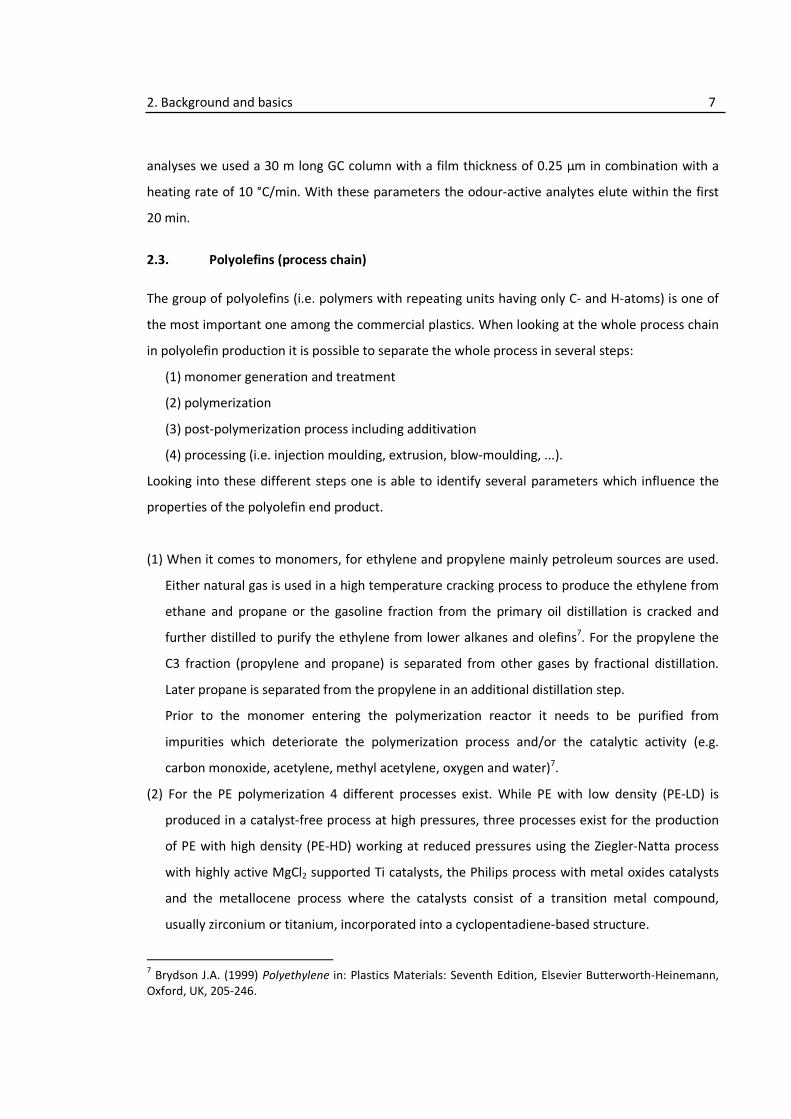
aluminoxane, boron compounds). A typical example is given in Figure 3 showing a Cp2ZrCl2 with
works with methyl aluminoxane (MAO) as cocatalyst.
By using this type of catalyst a greater control of the
composition distribution, the MWD, the comonomer
incorporation and stereo-regularity is achieved. With
metallocenes PE and PP types can be realised which are
not possible with Ziegler-Natta such as PE-LLD by using
1-octene as comonomer, syndiotactic PP, long chain
branched polyolefins and cycloolefin polymers.
Comonomers are used both for PE and PP to control
the degree of short chain branches and to retard the
growth of large crystal structures7. For PE propylene, 1-
butene and 1-octene are used to enhance the creep,
environmental stress cracking and thermal cracking properties compared to the corresponding
homopolymer. For PP usually ethylene is used as comonomer.
PP is available as syndiotactic and isotactic homopolymer, random, impact and block-
copolymer depending on the catalyst used and on the comonomer. Its densities vary between
0.855 g/cm3 for the amorphous type and 0.946 g/cm3 for a crystalline type.
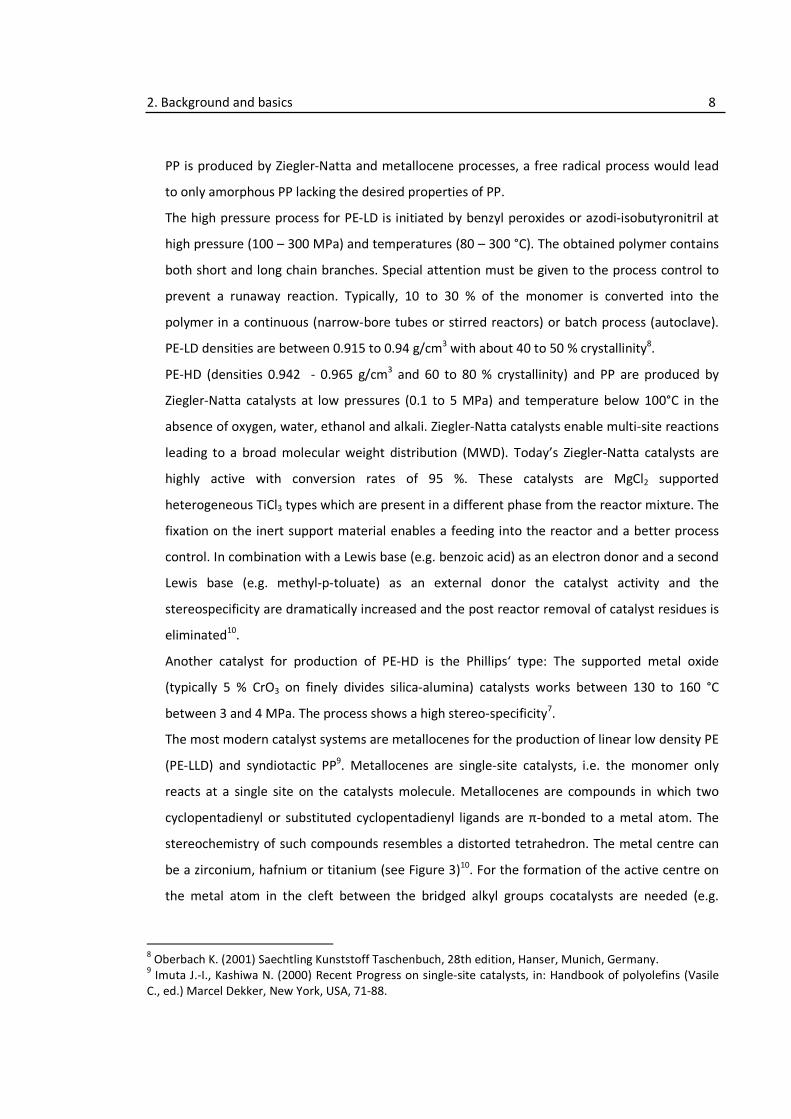
For PP due to its methyl side chain during
polymerization two monomer units can
combine (a) head-to-head, (b) tail-to-tail
or (c) head-to-tail with the latter one being
the most usual one (see Figure 4).
For the configuration three different
structures are possible: (i) syndiotactic (st) (i.e. the methyl groups are located on the opposite
side of the polymer backbone), (ii) isotactic (it) (i.e. the methyl groups are located on the same
side of the polymer backbone) and (iii) atactic (at) (i.e. the methyl groups are located randomly
on both sides of the polymer backbone) (see Figure 5).
10
Maier C., Haber T. (1998) Polypropylene: The Definitive User's Guide and Databook (Plastics Design
Library), William Andrew, Norwich, USA. 11
Schneider B., Doskocilova D. (2000) Structures of polyoelfins, in: Handbook of polyolefins (Vasile C., ed.)
Marcel Dekker, New York, USA, 161-222.
Figure 3. Molecular structure of metallocene
catalysts used for PE and PP polymerization
(taken from 10
). The zirconium atom is bound to
two chlorines and to a bridged alkyl group
which forms a cleft where the ZrCl2 complex is
situated and where the polymerization occurs.
Figure 4. PP structures resulting from (1) head-to-tail, (2) tail-
to-tail and (3) head-to-head reactions (taken from 11
).
2. Background and basics 10
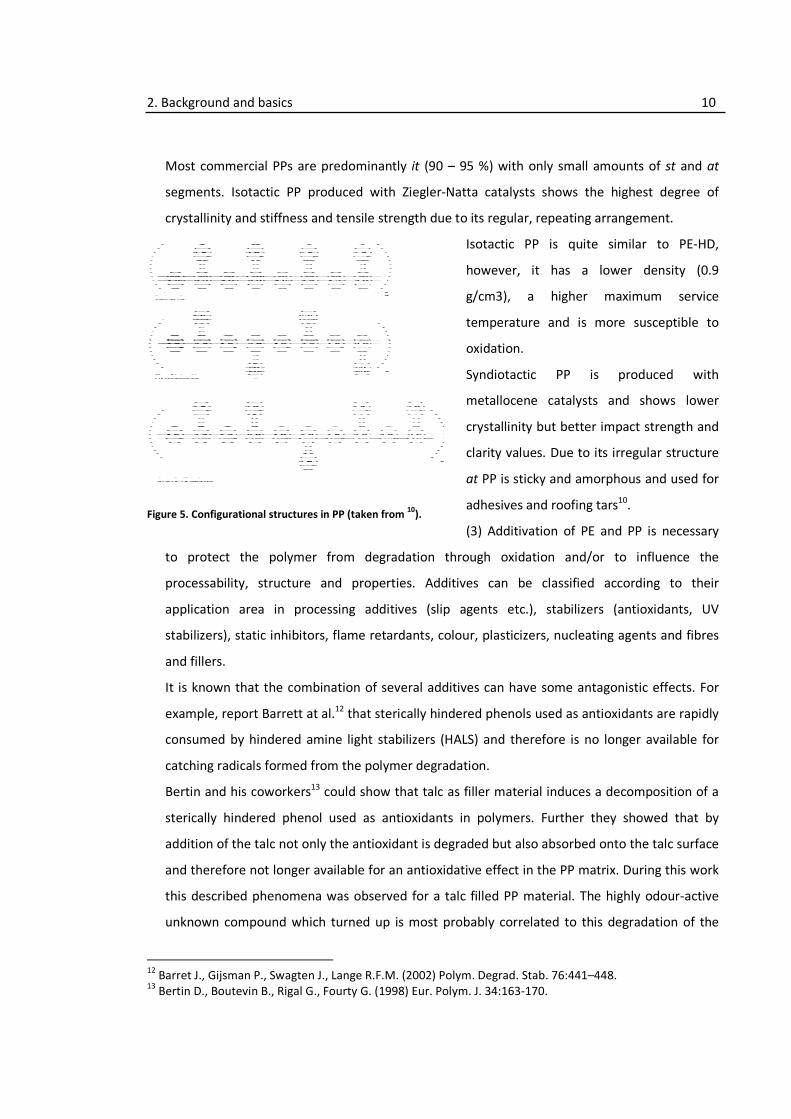
Most commercial PPs are predominantly it (90 – 95 %) with only small amounts of st and at
segments. Isotactic PP produced with Ziegler-Natta catalysts shows the highest degree of
crystallinity and stiffness and tensile strength due to its regular, repeating arrangement.
Isotactic PP is quite similar to PE-HD,
however, it has a lower density (0.9
g/cm3), a higher maximum service
temperature and is more susceptible to
oxidation.
Syndiotactic PP is produced with
metallocene catalysts and shows lower
crystallinity but better impact strength and
clarity values. Due to its irregular structure
at PP is sticky and amorphous and used for
adhesives and roofing tars10.
(3) Additivation of PE and PP is necessary
to protect the polymer from degradation through oxidation and/or to influence the
processability, structure and properties. Additives can be classified according to their
application area in processing additives (slip agents etc.), stabilizers (antioxidants, UV
stabilizers), static inhibitors, flame retardants, colour, plasticizers, nucleating agents and fibres
and fillers.
It is known that the combination of several additives can have some antagonistic effects. For
example, report Barrett at al.12 that sterically hindered phenols used as antioxidants are rapidly
consumed by hindered amine light stabilizers (HALS) and therefore is no longer available for
catching radicals formed from the polymer degradation.
Bertin and his coworkers13 could show that talc as filler material induces a decomposition of a
sterically hindered phenol used as antioxidants in polymers. Further they showed that by
addition of the talc not only the antioxidant is degraded but also absorbed onto the talc surface
and therefore not longer available for an antioxidative effect in the PP matrix. During this work
this described phenomena was observed for a talc filled PP material. The highly odour-active
unknown compound which turned up is most probably correlated to this degradation of the
12
Barret J., Gijsman P., Swagten J., Lange R.F.M. (2002) Polym. Degrad. Stab. 76:441–448. 13
Bertin D., Boutevin B., Rigal G., Fourty G. (1998) Eur. Polym. J. 34:163-170.
Figure 5. Configurational structures in PP (taken from 10
).
2. Background and basics 11
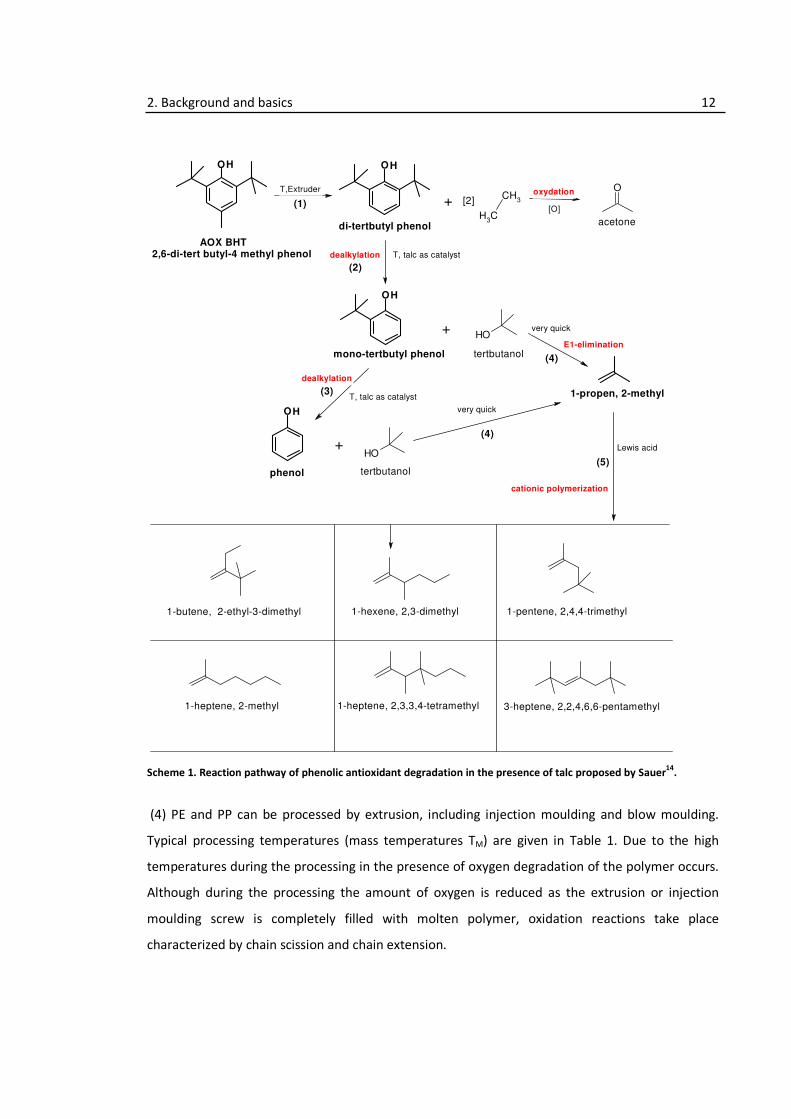
phenolic antioxidant in the presence of talc. Sauer14 proposed a reaction pathway as shown in
Scheme 1.
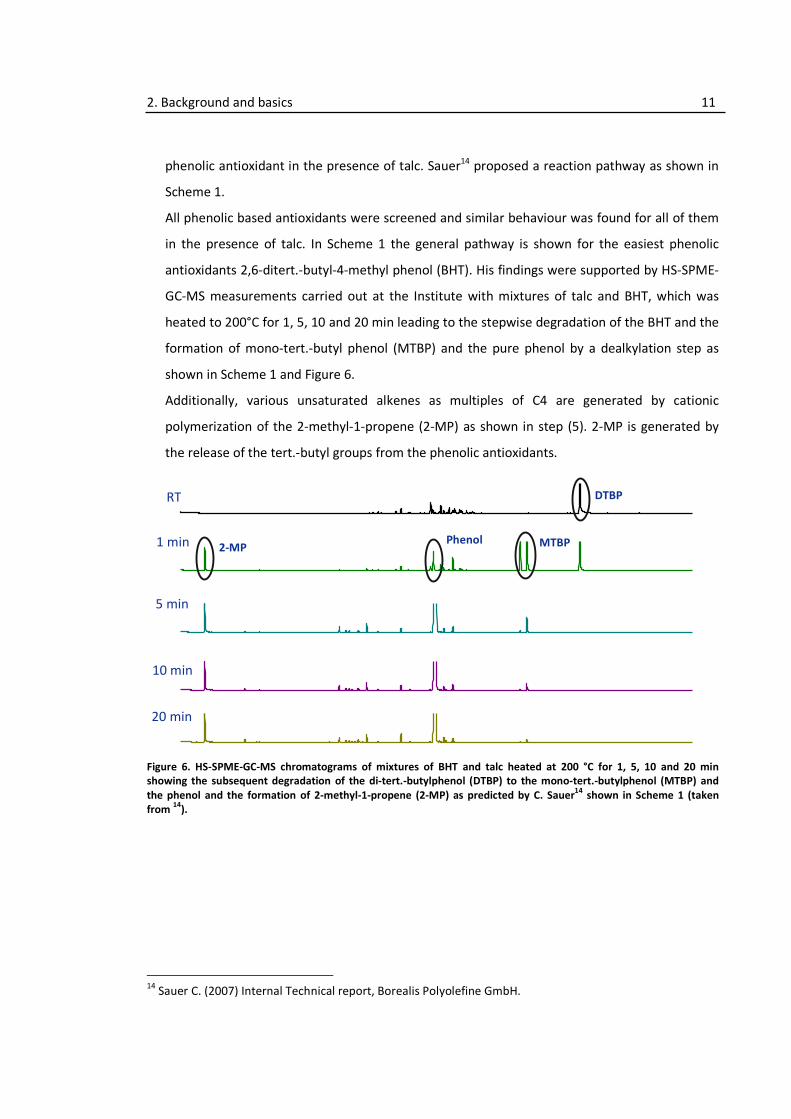
All phenolic based antioxidants were screened and similar behaviour was found for all of them
in the presence of talc. In Scheme 1 the general pathway is shown for the easiest phenolic
antioxidants 2,6-ditert.-butyl-4-methyl phenol (BHT). His findings were supported by HS-SPME-
GC-MS measurements carried out at the Institute with mixtures of talc and BHT, which was
heated to 200°C for 1, 5, 10 and 20 min leading to the stepwise degradation of the BHT and the
formation of mono-tert.-butyl phenol (MTBP) and the pure phenol by a dealkylation step as
shown in Scheme 1 and Figure 6.
Additionally, various unsaturated alkenes as multiples of C4 are generated by cationic
polymerization of the 2-methyl-1-propene (2-MP) as shown in step (5). 2-MP is generated by
the release of the tert.-butyl groups from the phenolic antioxidants.
RT
1 min
5 min
10 min
20 min
DTBP
MTBPPhenol 2-MP
Figure 6. HS-SPME-GC-MS chromatograms of mixtures of BHT and talc heated at 200 °C for 1, 5, 10 and 20 min
showing the subsequent degradation of the di-tert.-butylphenol (DTBP) to the mono-tert.-butylphenol (MTBP) and
the phenol and the formation of 2-methyl-1-propene (2-MP) as predicted by C. Sauer14
shown in Scheme 1 (taken
from 14
).
14
Sauer C. (2007) Internal Technical report, Borealis Polyolefine GmbH.
2. Background and basics 12
Scheme 1. Reaction pathway of phenolic antioxidant degradation in the presence of talc proposed by Sauer14
.
(4) PE and PP can be processed by extrusion, including injection moulding and blow moulding.
Typical processing temperatures (mass temperatures TM) are given in Table 1. Due to the high
temperatures during the processing in the presence of oxygen degradation of the polymer occurs.
Although during the processing the amount of oxygen is reduced as the extrusion or injection
moulding screw is completely filled with molten polymer, oxidation reactions take place
characterized by chain scission and chain extension.
OH OH
OH
OH
OH
OH
CH3
CH3
O
+T,Extruder
(1)
T, talc as catalyst
(2)
+
tertbutanol
1-propen, 2-methyl
AOX BHT2,6-di-tert butyl-4 methyl phenol
di-tertbutyl phenol
very quick
mono-tertbutyl phenol
(3)T, talc as catalyst
phenol
+
very quick
(4)
(4)
(5)tertbutanol
dealkylation
[2]
acetone
1-butene, 2-ethyl-3-dimethyl
oxydation
[O]
1-hexene, 2,3-dimethyl 1-pentene, 2,4,4-trimethyl
1-heptene, 2-methyl 1-heptene, 2,3,3,4-tetramethyl 3-heptene, 2,2,4,6,6-pentamethyl
dealkylation
E1-elimination
Lewis acid
cationic polymerization

2. Background and basics 13
During the processing the
availability of the oxygen
is restricted and only two
ways are known how
oxygen is entering the
machine: (a) oxygen is
absorbed onto the
polymer surface where more oxygen is absorbed on powder than on granules due to the higher
specific surface area. (b) oxygen is dissolved in the amorphous phase of the polymer15. Epacher15
investigated the process stability of PE-HD depending on the oxygen content. The group showed
by polarography measurements that about 20 – 25 ppm oxygen is absorbed and more oxygen was
estimated to be dissolved in the polymer (40 – 70 ppm). Different oxygen levels in the processing
machine were realised by working in (a) inert atmosphere realized by degassing of the polymer
powder and replacing the oxygen by argon and (b) changing the oxygen content in a wide range
realized by increasing the number of degassing cycles and exchanging the atmosphere.
It could be proven that the amount of absorbed oxygen can be controlled by the number of
degassing cycles or by introducing oxygen into the hopper of the machine. In their final findings
they concluded that the stability of the PE-HD (measured as the degree of yellowness and the
viscosity) decreases with increasing oxygen content and therefore processing must be excluded
from all processing steps to the highest degree possible. It was also shown that the stabilization of
the PE-HD is not able to completely eliminate the deterioration of the oxygen on the polymer.
A similar conclusion is drawn by Andersson and his group16. They analyzed the degradation of PE-
LD, PE-LLD and PE-HD during film extrusion and found out that the antioxidants were not able to
prevent the oxidation of the polymer in the air gap (in film extrusion the polymer is vertically
extruded through a orifice into a water bath; the distance between the exit of the orifice and the
water bath is called the air gap and is the place where the molten polymer is exposed to
atmospheric oxygen and oxidation takes place).
Both publications prove that processing is a significant contributor to the formation of oxygen
species and therefore oxygen related odour-active compounds could be reduced by reducing the
oxidation reactions during processing.
15
Epacher E., Tolveth J., Kröhnke C., Pukansky B. (2000) Polymer 41:8401-8409. 16
Andersson T., Stalbom B., Wesslen B. (2004) J. Appl. Polym. Sci. 91:1525-1537.
Table 1. Typical mass temperatures (TM) for processing of PE and PP materials.
typical TM8
[°C]
injection
moulding
blow
moulding
film and pipe
extrusion
cable
coatings
PE-LD 160 – 260 140 210 230
PE-HD 260 – 300 160 – 190 230 – 250 250 – 270
PE-LLD - - 250 – 380 210 – 235
PP 250 – 270 220 - 270 -
2. Background and basics 14
2.4. Degradation and oxidation of polyolefins
Degradation of polyolefins is a radical initiated chain reaction with degenerated branching. Tüdös
and Iring17 summarized the kinetics of thermal polyolefin degradation in one diagram (see Figure
7) including an autocatalytic type for the absorption of oxygen as well as for the formation of end-
products (a), reaching-a-maximum type as seen for the concentration of intermediates
(propagating radicals, hydroperoxides) as well as for the mass of the polymer (b), and a decreasing
type for the average length of the macromolecules due to fragmentation (c).
Generally, two different types of reactions occur
during oxidation as shown by Albertsson18: (i) solid
state reactions which add oxidation species to the
polymer backbone (e.g. formation of hydroperoxide
groups on the polymer chain) and (ii) reactions which
lead to the formation of volatile products described
by Bernstein19 as “...two chain cleavage events need
to liberate a volatile molecule ...”.
Three pathways for the oxidation product formation
are known including hydroperoxide decomposition,
where the majority of the products derive from, the
transformation of peroxyl radicals and the radical
termination reactions.
About 80% of the end products result from PE
hydroperoxides and about 90% of the end products derive from PP hydroperoxides.
2.4.a. Degradation mechanisms of PE17
The mechanisms of polyolefin degradation in the absence of additives can be described by well-
known sequences of reactions20. The first step - the initiation or starting reaction, is the formation
of free radicals as shown in reaction (1). Here, the R* backbone radical plays an important role for
the propagation of the oxidation. The R* further reacts in several prolongation steps with oxygen
17
Tüdös F., Iring M. (1988) Acta Polymerica 39:19-26. 18
Albertsson A.-C., Gröning M., Hakkarainen M. (2006) J. Polym. Environ. 14:9-13. 19
Bernstein R., Thornberg S.M., Assink R.A., Irwin A.N., Hochrein J.M., Brown J.R., Derzon D.K., Klamo S.B.,
Clough R.L. (2007). Polym. Degrad. Stab. 92:2076-2094. 20
Hoff A., Jacobsson S. (1981) J. Appl. Polym. Sci. 26:3409-3423.
Figure 7. Kinetics of the main processes in
polyolefin degradation. (a) absorption of O2,
formation of end products; (b) intermediates,
mass change; (c) molecular mass17
.
time →
b
ac
a.u.
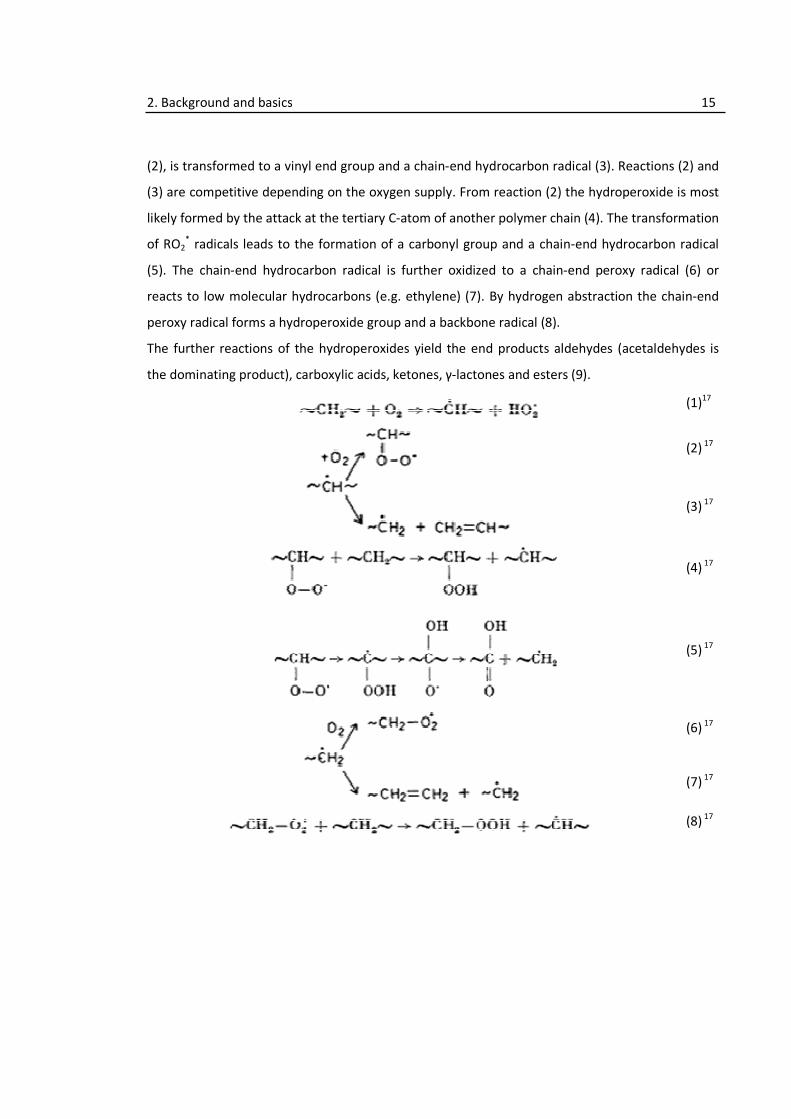
2. Background and basics
(2), is transformed to a vinyl end group and a chain
(3) are competitive depending on the oxygen supply. From reaction (2) the hydroperoxide is most
likely formed by the attack at the tertiary C
of RO2* radicals leads to the formation of a carbony
(5). The chain-end hydrocarbon radical is further oxidized to a
reacts to low molecular hydrocarbons (e.g. ethylene)
peroxy radical forms a hydroperoxide grou
The further reactions of the hydroperoxides
the dominating product),
Background and basics
(2), is transformed to a vinyl end group and a chain-end hydrocarbon radical (
titive depending on the oxygen supply. From reaction (2) the hydroperoxide is most
likely formed by the attack at the tertiary C-atom of another polymer chain
ads to the formation of a carbonyl group and a chain
end hydrocarbon radical is further oxidized to a chain
ar hydrocarbons (e.g. ethylene) (7). By hydrogen abstraction the chain
peroxy radical forms a hydroperoxide group and a backbone radical (8).
of the hydroperoxides yield the end products aldehydes
the dominating product), carboxylic acids, ketones, γ-lactones and esters
15
end hydrocarbon radical (3). Reactions (2) and
titive depending on the oxygen supply. From reaction (2) the hydroperoxide is most
atom of another polymer chain (4). The transformation
l group and a chain-end hydrocarbon radical
chain-end peroxy radical (6) or
(7). By hydrogen abstraction the chain-end
p and a backbone radical (8).
yield the end products aldehydes (acetaldehydes is
lactones and esters (9).
(1)17
(2) 17
(3) 17
(4) 17
(5) 17
(6) 17
(7) 17
(8) 17
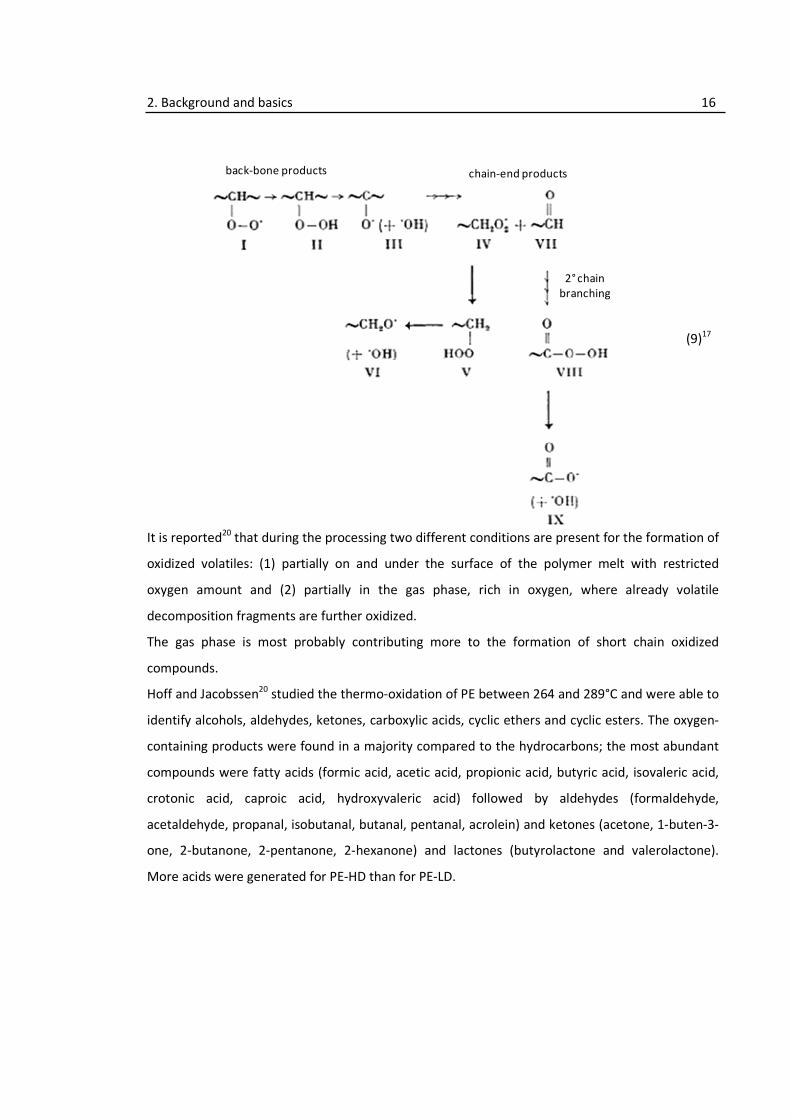
2. Background and basics 16
(9)17
It is reported20 that during the processing two different conditions are present for the formation of
oxidized volatiles: (1) partially on and under the surface of the polymer melt with restricted
oxygen amount and (2) partially in the gas phase, rich in oxygen, where already volatile
decomposition fragments are further oxidized.
The gas phase is most probably contributing more to the formation of short chain oxidized
compounds.
Hoff and Jacobssen20 studied the thermo-oxidation of PE between 264 and 289°C and were able to
identify alcohols, aldehydes, ketones, carboxylic acids, cyclic ethers and cyclic esters. The oxygen-
containing products were found in a majority compared to the hydrocarbons; the most abundant
compounds were fatty acids (formic acid, acetic acid, propionic acid, butyric acid, isovaleric acid,
crotonic acid, caproic acid, hydroxyvaleric acid) followed by aldehydes (formaldehyde,
acetaldehyde, propanal, isobutanal, butanal, pentanal, acrolein) and ketones (acetone, 1-buten-3-
one, 2-butanone, 2-pentanone, 2-hexanone) and lactones (butyrolactone and valerolactone).
More acids were generated for PE-HD than for PE-LD.
back-bone products chain-end products
2° chain
branching
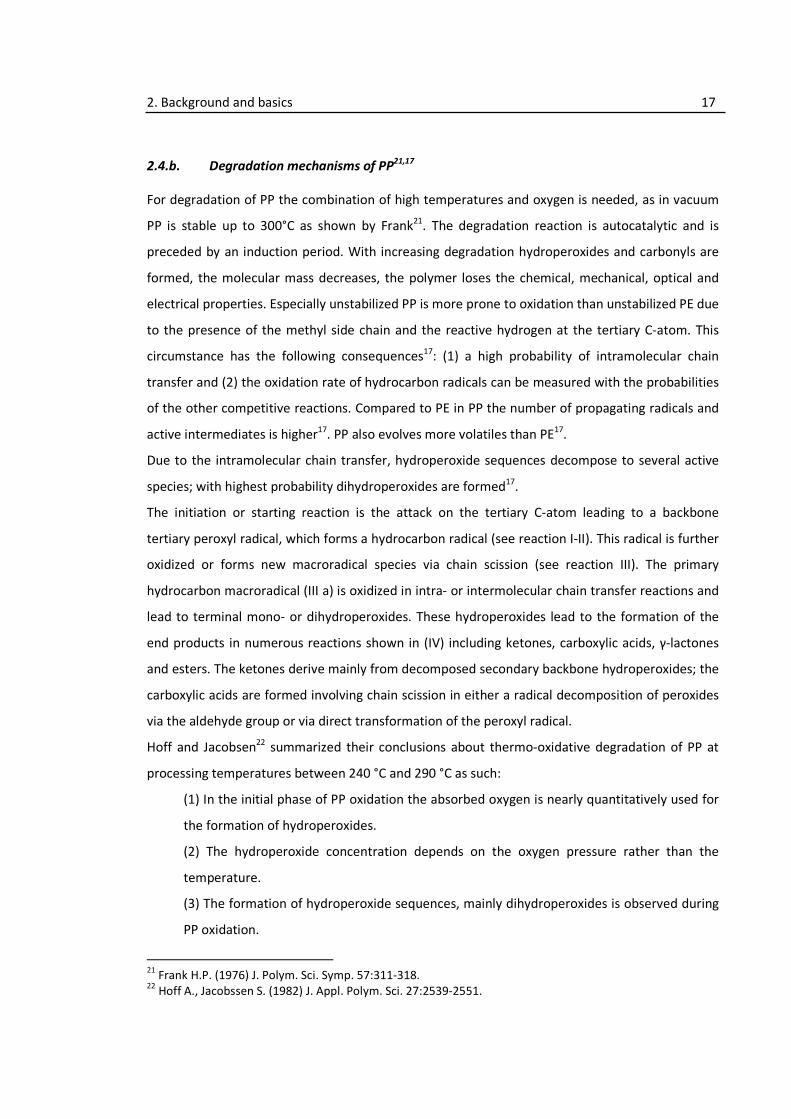
2. Background and basics 17
2.4.b. Degradation mechanisms of PP21,17
For degradation of PP the combination of high temperatures and oxygen is needed, as in vacuum
PP is stable up to 300°C as shown by Frank21. The degradation reaction is autocatalytic and is
preceded by an induction period. With increasing degradation hydroperoxides and carbonyls are
formed, the molecular mass decreases, the polymer loses the chemical, mechanical, optical and
electrical properties. Especially unstabilized PP is more prone to oxidation than unstabilized PE due
to the presence of the methyl side chain and the reactive hydrogen at the tertiary C-atom. This
circumstance has the following consequences17: (1) a high probability of intramolecular chain
transfer and (2) the oxidation rate of hydrocarbon radicals can be measured with the probabilities
of the other competitive reactions. Compared to PE in PP the number of propagating radicals and
active intermediates is higher17. PP also evolves more volatiles than PE17.
Due to the intramolecular chain transfer, hydroperoxide sequences decompose to several active
species; with highest probability dihydroperoxides are formed17.
The initiation or starting reaction is the attack on the tertiary C-atom leading to a backbone
tertiary peroxyl radical, which forms a hydrocarbon radical (see reaction I-II). This radical is further
oxidized or forms new macroradical species via chain scission (see reaction III). The primary
hydrocarbon macroradical (III a) is oxidized in intra- or intermolecular chain transfer reactions and
lead to terminal mono- or dihydroperoxides. These hydroperoxides lead to the formation of the
end products in numerous reactions shown in (IV) including ketones, carboxylic acids, γ-lactones
and esters. The ketones derive mainly from decomposed secondary backbone hydroperoxides; the
carboxylic acids are formed involving chain scission in either a radical decomposition of peroxides
via the aldehyde group or via direct transformation of the peroxyl radical.
Hoff and Jacobsen22 summarized their conclusions about thermo-oxidative degradation of PP at
processing temperatures between 240 °C and 290 °C as such:
(1) In the initial phase of PP oxidation the absorbed oxygen is nearly quantitatively used for
the formation of hydroperoxides.
(2) The hydroperoxide concentration depends on the oxygen pressure rather than the
temperature.
(3) The formation of hydroperoxide sequences, mainly dihydroperoxides is observed during
PP oxidation.
21
Frank H.P. (1976) J. Polym. Sci. Symp. 57:311-318. 22
Hoff A., Jacobssen S. (1982) J. Appl. Polym. Sci. 27:2539-2551.
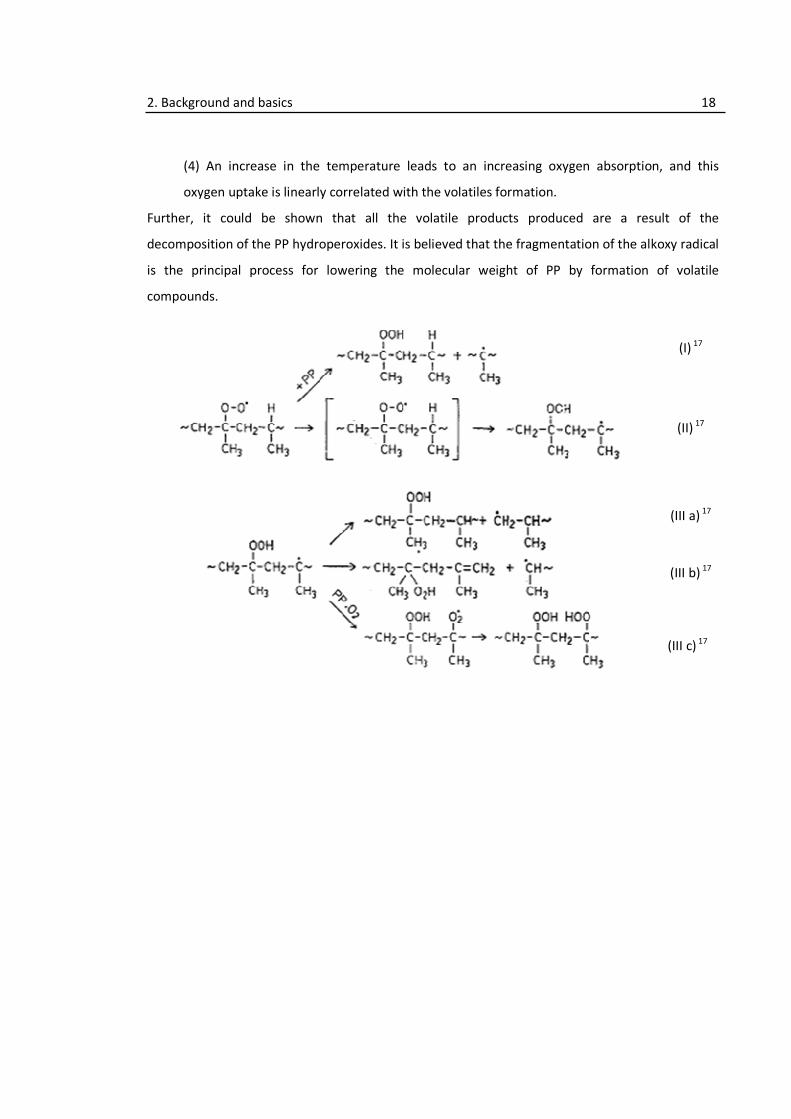
2. Background and basics 18
(4) An increase in the temperature leads to an increasing oxygen absorption, and this
oxygen uptake is linearly correlated with the volatiles formation.
Further, it could be shown that all the volatile products produced are a result of the
decomposition of the PP hydroperoxides. It is believed that the fragmentation of the alkoxy radical
is the principal process for lowering the molecular weight of PP by formation of volatile
compounds.
(I) 17
(II) 17
(III a) 17
(III b) 17
(III c) 17

2. Background and basics 19
(IV) 17
Similar to PE, the majority of the volatiles are oxygen-containing compounds such as aldehydes
(formaldehyde, acetaldehyde, propanal, 2-methylacrolein), ketones (acetone, 2-butanone, 2-
pentanone, 1-hydroxy-2-propanone, methyl cyclopropyl ketone, acetylacetone), alcohols
(methanol, 2-methyl-2-propen-1-ol), acids (formic acid, acetic acid) and ethers (methyl formiate).
Acetic acid was shown not to form directly from the PP hydroperoxide decomposition but from
further reactions of oxidized products. Especially ketones are believed to be plausible precursors,
as ketones are among the main products of thermal oxidation in PP.
For the formation of carbonyls as final oxidation product from thermal oxidation of PP Richaud et
al.23 performed a kinetic study and were able to prove that carbonyls are the final product in the
oxidation process starting with the building-up of hydroperoxides.
23
Richaud E., Farcas F., Fayolle B., Audouin L., Verdu J. (2007) Polym. Degrad. Stab. 92:118-124.

2. Background and basics 20
2.5. Odour-active compounds identified in polyolefins
For polyolefins such as PE and PP several authors25-31 identified the numerous odour-active
compounds in the polymer itself formed during processing and compounding. More publications
were found dealing with multi-layer samples (e.g. PE-aluminium-cardboard), but these findings
were not included as it was not clear which compound comes from the polyolefin layer and which
not.
A list of all identified substances including aldehydes, ketones, carboxylic acids, esters, lactones,
aromatic compounds, alcohols and hydrocarbons and, if available, the sensory threshold values
determined in water for each compound are given in Table 2. Among these reported compounds
the aldehydes and ketones show the lowest values. By further differentiation among those two
groups the compounds with a chain length of 6 to 8 C-atoms show the lowest threshold values in
the homologous series and the 1-alkene-3-ones show the lowest sensory threshold values overall.
Normal concentrations of odour-active carbonyls are in the lower µg per kg range and below, but
can dramatically increase after severe thermal treatment as shown by Bravo 26. In this work PE was
heated in glass vessels for 15 min at 250 °C.
Other reported sources for odour problems with plastic products are interactions of the polymer
with additives and/or printings where e.g. ink components migrate through the polymer into the
product and react there to odour-active compounds24.
However, most publications deal only with a qualitative identification and do not give actual
concentrations most probably due to the problems associated with the quantification of odour-
active compounds in polyolefins such as the low concentration range, co-elution and interferences
with non-odour-active compounds and the difficulties to use more selective detection systems. If
reported the concentrations of identified compounds are also listed. The concentrations given are
taken from three publications, whereas the by Bravo26 determined concentrations after a heavy
degradation of PE samples. The values given by Rebeyrolle-Bernard29 are marked as g/kg, but after
consideration of the sample preparation the values are most probably given as µg/kg.
24
Piringer O., Rüter M. (2000) in: Plastic Packaging Materials for Food (Piringer O., Baner A.L., ed.), 407-426,
Wiley-VCH, Weinheim.
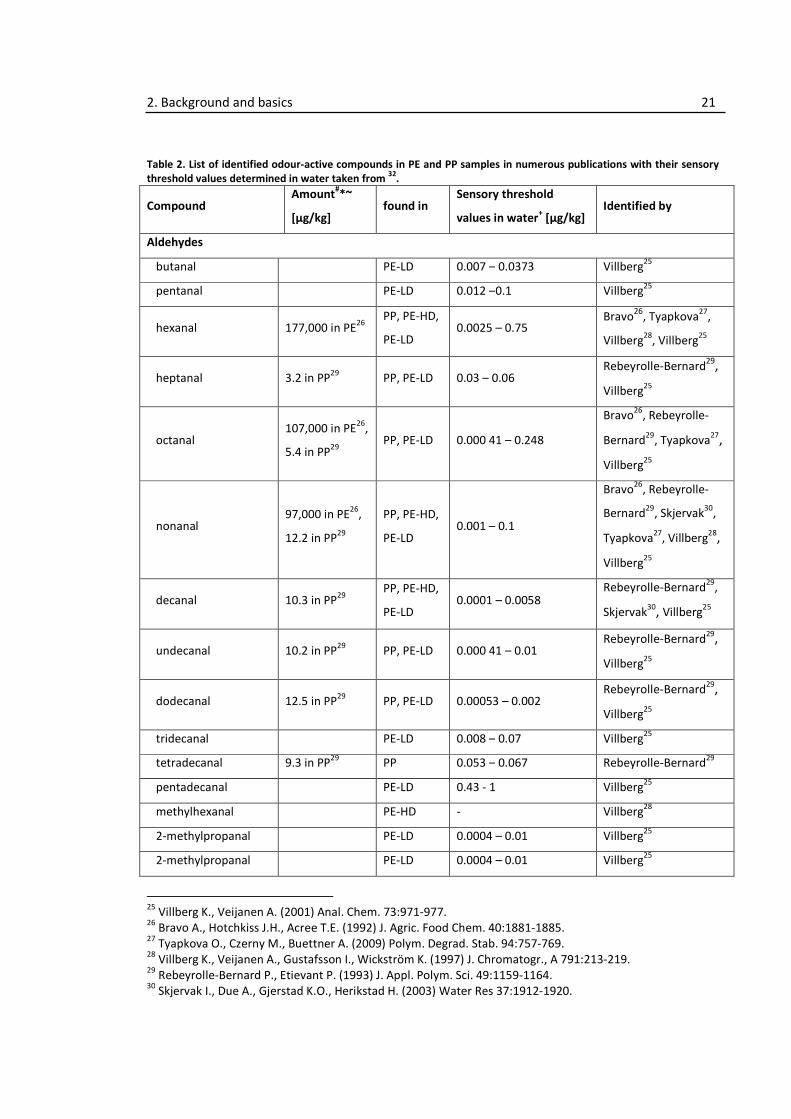
2. Background and basics 21
Table 2. List of identified odour-active compounds in PE and PP samples in numerous publications with their sensory
threshold values determined in water taken from 32
.
Compound Amount
#*~
[µg/kg] found in
Sensory threshold
values in water+ [µg/kg]
Identified by
Aldehydes
butanal PE-LD 0.007 – 0.0373 Villberg25
pentanal PE-LD 0.012 –0.1 Villberg25
hexanal 177,000 in PE26
PP, PE-HD,
PE-LD 0.0025 – 0.75
Bravo26
, Tyapkova27
,
Villberg28
, Villberg25
heptanal 3.2 in PP29
PP, PE-LD 0.03 – 0.06 Rebeyrolle-Bernard
29,
Villberg25
octanal 107,000 in PE
26,
5.4 in PP29
PP, PE-LD 0.000 41 – 0.248
Bravo26
, Rebeyrolle-
Bernard29
, Tyapkova27,
Villberg25
nonanal 97,000 in PE
26,
12.2 in PP29
PP, PE-HD,
PE-LD 0.001 – 0.1
Bravo26
, Rebeyrolle-
Bernard29
, Skjervak30
,
Tyapkova27
, Villberg28,
Villberg25
decanal 10.3 in PP29
PP, PE-HD,
PE-LD 0.0001 – 0.0058
Rebeyrolle-Bernard29
,
Skjervak30, Villberg
25
undecanal 10.2 in PP29
PP, PE-LD 0.000 41 – 0.01 Rebeyrolle-Bernard
29,
Villberg25
dodecanal 12.5 in PP29
PP, PE-LD 0.00053 – 0.002 Rebeyrolle-Bernard
29,
Villberg25
tridecanal PE-LD 0.008 – 0.07 Villberg25
tetradecanal 9.3 in PP29
PP 0.053 – 0.067 Rebeyrolle-Bernard29
pentadecanal PE-LD 0.43 - 1 Villberg25
methylhexanal PE-HD - Villberg28
2-methylpropanal PE-LD 0.0004 – 0.01 Villberg25
2-methylpropanal PE-LD 0.0004 – 0.01 Villberg25
25
Villberg K., Veijanen A. (2001) Anal. Chem. 73:971-977. 26
Bravo A., Hotchkiss J.H., Acree T.E. (1992) J. Agric. Food Chem. 40:1881-1885. 27
Tyapkova O., Czerny M., Buettner A. (2009) Polym. Degrad. Stab. 94:757-769. 28
Villberg K., Veijanen A., Gustafsson I., Wickström K. (1997) J. Chromatogr., A 791:213-219. 29
Rebeyrolle-Bernard P., Etievant P. (1993) J. Appl. Polym. Sci. 49:1159-1164. 30
Skjervak I., Due A., Gjerstad K.O., Herikstad H. (2003) Water Res 37:1912-1920.

2. Background and basics 22
Compound Amount
#*~
[µg/kg] found in
Sensory threshold
values in water+ [µg/kg]
Identified by
2-methylpropanal PE-LD 0.0004 – 0.01 Villberg25
4-methylpentanal PE-LD 0.39 Villberg25
2,3-dimethylhexanal PE-LD - Villberg25
2,3-dimethylpentanal PE-LD - Villberg25
2-ethylbutanal PE-LD 0.041 – 0.081 Villberg25
(E)-2-propenal
(acrolein) PE-LD 0.11 Villberg
(E)-2-butenal PE 0.525 Villberg25
(E)-2-pentenal PE 0.31 – 1.5 Villberg25
(E)-2-hexenal PE 0.03 Villberg25
(E)-2-octenal PE-HD 0.000 34 – 0.02 Villberg28
(E)-2-nonenal 11,000 in PE26
PE, PP 0.000 08 – 0.000 4 Bravo26
, Tyapkova27
(Z)-2-nonenal PP 0.000 02 Tyapkova27
(Z)-4-nonenal PP - Tyapkova27
(E)-2-decenal PP 0.0003 – 0.25 Tyapkova27
2-methyl-2-propenal PE-LD - Villberg25
2-ethylpropenal PE-LD - Villberg25
8-nonenal PE-HD - Sanders31
(E,E)-2,4-heptadienal PE-HD 0.058 – 0.8 Villberg28
2,4-undecadienal PE-HD 0.000 01 Villberg28
(E,Z)-2,6-nonadienal PP 0.000 0018 – 0.000 14 Tyapkova27
(E)-4,5-epoxy-(E)2-
decenal PP 0.00012 – 0.005 Tyapkova
27
Ketones
propanone (acetone PE, PP 0.832 – 10,000
2-pentanone PE-LD 0.01 - 4 Villberg25
3-hexanone PE-LD 0.041 – 0.081 Villberg25
2-heptanone PE-LD 0.001 – 4.6 Villberg25
3-heptanone PE-LD 0.0075 – 0.16 Villberg25
2-decanone PE-HD 0.003 – 0.041 Skjervak30
31
Sanders R.A., Zyzak D.V., Morsch T.R., Zimmerman S.P., Searles P.M., Srothers M.A., Eberhart B.L., Woo
A.K. (2005) J. Agric. Food Chem. 53:1713-1716.
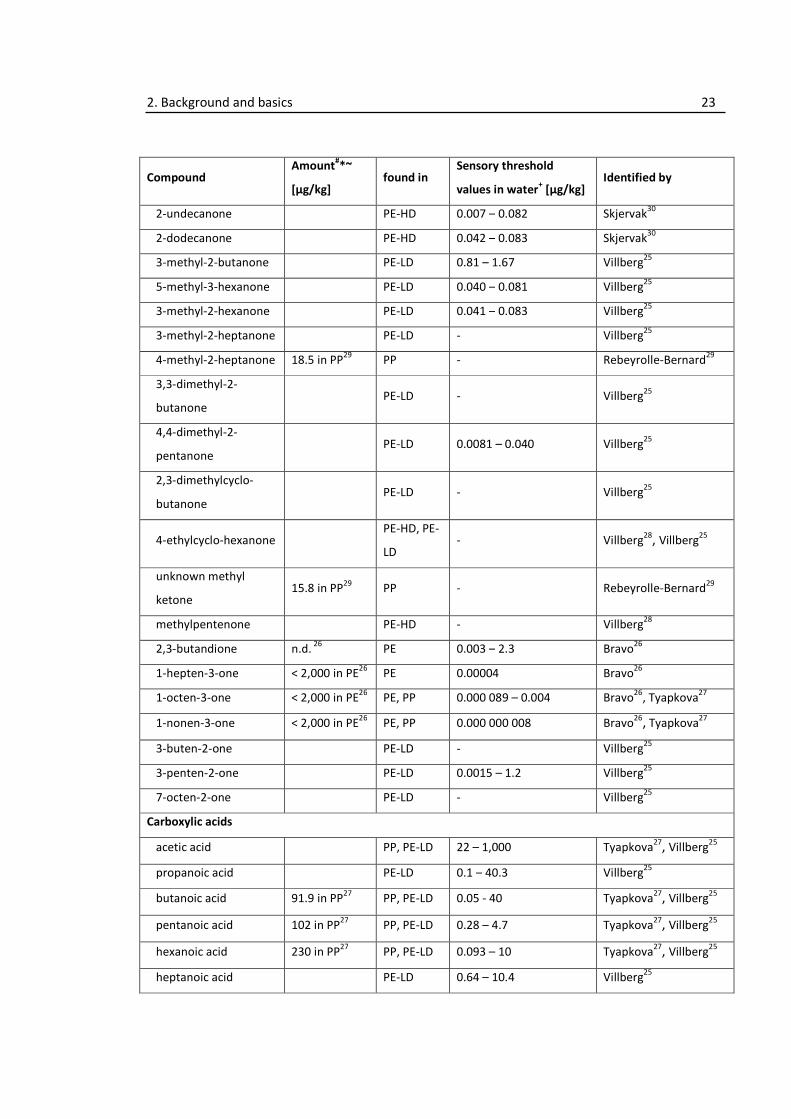
2. Background and basics 23
Compound Amount
#*~
[µg/kg] found in
Sensory threshold
values in water+ [µg/kg]
Identified by
2-undecanone PE-HD 0.007 – 0.082 Skjervak30
2-dodecanone PE-HD 0.042 – 0.083 Skjervak30
3-methyl-2-butanone PE-LD 0.81 – 1.67 Villberg25
5-methyl-3-hexanone PE-LD 0.040 – 0.081 Villberg25
3-methyl-2-hexanone PE-LD 0.041 – 0.083 Villberg25
3-methyl-2-heptanone PE-LD - Villberg25
4-methyl-2-heptanone 18.5 in PP29
PP - Rebeyrolle-Bernard29
3,3-dimethyl-2-
butanone PE-LD - Villberg
25
4,4-dimethyl-2-
pentanone PE-LD 0.0081 – 0.040 Villberg
25
2,3-dimethylcyclo-
butanone PE-LD - Villberg
25
4-ethylcyclo-hexanone PE-HD, PE-
LD - Villberg
28, Villberg25
unknown methyl
ketone 15.8 in PP
29 PP - Rebeyrolle-Bernard
29
methylpentenone PE-HD - Villberg28
2,3-butandione n.d. 26
PE 0.003 – 2.3 Bravo26
1-hepten-3-one < 2,000 in PE26
PE 0.00004 Bravo26
1-octen-3-one < 2,000 in PE26
PE, PP 0.000 089 – 0.004 Bravo26
, Tyapkova27
1-nonen-3-one < 2,000 in PE26
PE, PP 0.000 000 008 Bravo26, Tyapkova
27
3-buten-2-one PE-LD - Villberg25
3-penten-2-one PE-LD 0.0015 – 1.2 Villberg25
7-octen-2-one PE-LD - Villberg25
Carboxylic acids
acetic acid PP, PE-LD 22 – 1,000 Tyapkova27, Villberg
25
propanoic acid PE-LD 0.1 – 40.3 Villberg25
butanoic acid 91.9 in PP27
PP, PE-LD 0.05 - 40 Tyapkova27, Villberg
25
pentanoic acid 102 in PP27
PP, PE-LD 0.28 – 4.7 Tyapkova27, Villberg
25
hexanoic acid 230 in PP27
PP, PE-LD 0.093 – 10 Tyapkova27, Villberg
25
heptanoic acid PE-LD 0.64 – 10.4 Villberg25
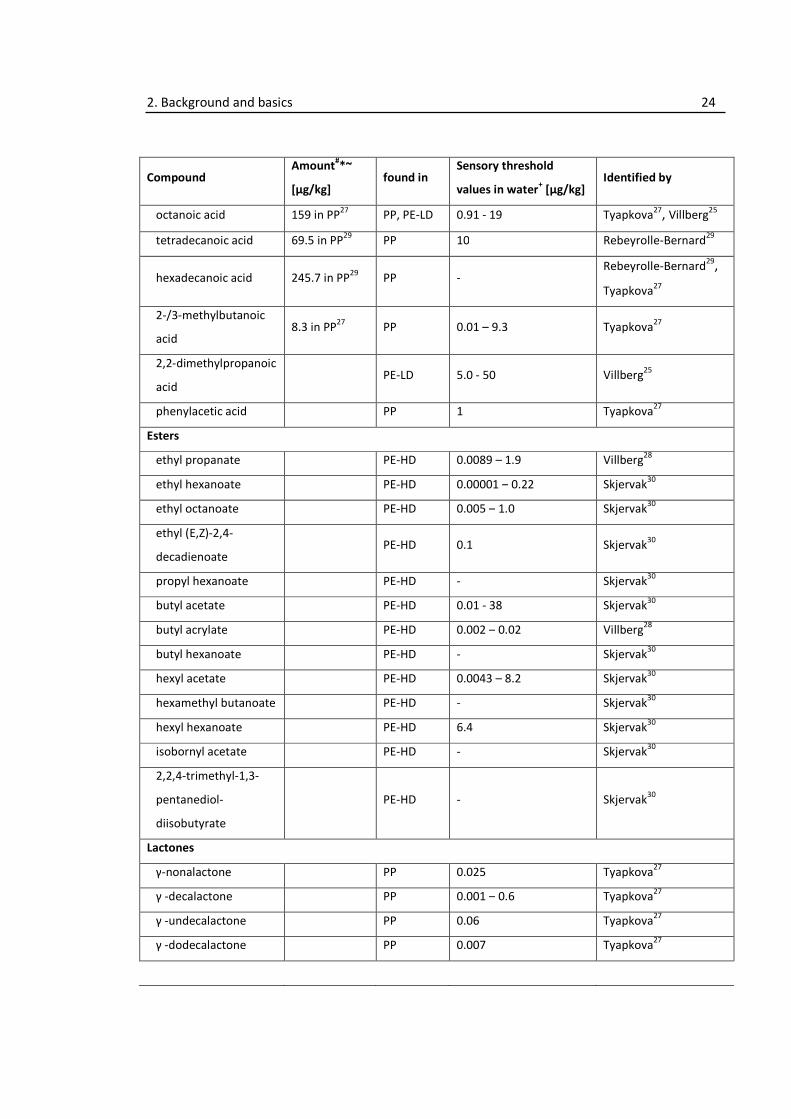
2. Background and basics 24
Compound Amount
#*~
[µg/kg] found in
Sensory threshold
values in water+ [µg/kg]
Identified by
octanoic acid 159 in PP27
PP, PE-LD 0.91 - 19 Tyapkova27, Villberg
25
tetradecanoic acid 69.5 in PP29
PP 10 Rebeyrolle-Bernard29
hexadecanoic acid 245.7 in PP29
PP - Rebeyrolle-Bernard
29,
Tyapkova27
2-/3-methylbutanoic
acid 8.3 in PP
27 PP 0.01 – 9.3 Tyapkova
27
2,2-dimethylpropanoic
acid PE-LD 5.0 - 50 Villberg
25
phenylacetic acid PP 1 Tyapkova27
Esters
ethyl propanate PE-HD 0.0089 – 1.9 Villberg28
ethyl hexanoate PE-HD 0.00001 – 0.22 Skjervak30
ethyl octanoate PE-HD 0.005 – 1.0 Skjervak30
ethyl (E,Z)-2,4-
decadienoate PE-HD 0.1 Skjervak
30
propyl hexanoate PE-HD - Skjervak30
butyl acetate PE-HD 0.01 - 38 Skjervak30
butyl acrylate PE-HD 0.002 – 0.02 Villberg28
butyl hexanoate PE-HD - Skjervak30
hexyl acetate PE-HD 0.0043 – 8.2 Skjervak30
hexamethyl butanoate PE-HD - Skjervak30
hexyl hexanoate PE-HD 6.4 Skjervak30
isobornyl acetate PE-HD - Skjervak30
2,2,4-trimethyl-1,3-
pentanediol-
diisobutyrate
PE-HD - Skjervak30
Lactones
γ-nonalactone PP 0.025 Tyapkova27
γ -decalactone PP 0.001 – 0.6 Tyapkova27
γ -undecalactone PP 0.06 Tyapkova27
γ -dodecalactone PP 0.007 Tyapkova27
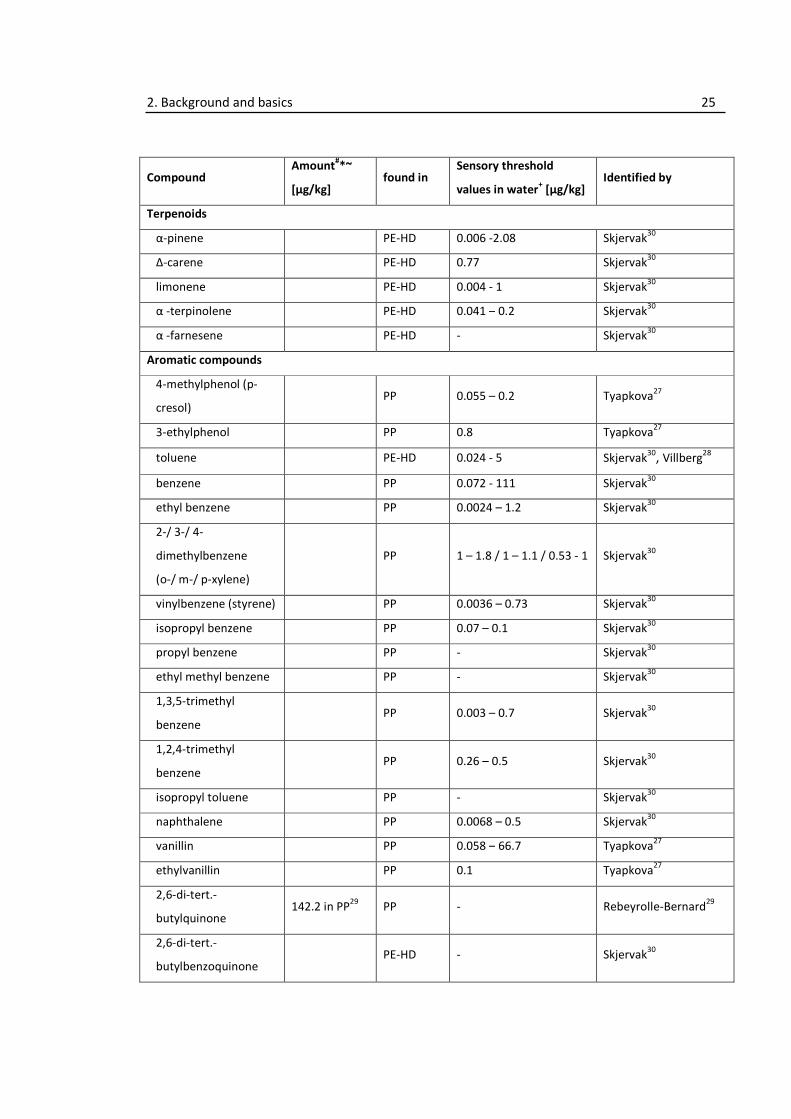
2. Background and basics 25
Compound Amount
#*~
[µg/kg] found in
Sensory threshold
values in water+ [µg/kg]
Identified by
Terpenoids
α-pinene PE-HD 0.006 -2.08 Skjervak30
Δ-carene PE-HD 0.77 Skjervak30
limonene PE-HD 0.004 - 1 Skjervak30
α -terpinolene PE-HD 0.041 – 0.2 Skjervak30
α -farnesene PE-HD - Skjervak30
Aromatic compounds
4-methylphenol (p-
cresol) PP 0.055 – 0.2 Tyapkova
27
3-ethylphenol PP 0.8 Tyapkova27
toluene PE-HD 0.024 - 5 Skjervak30, Villberg
28
benzene PP 0.072 - 111 Skjervak30
ethyl benzene PP 0.0024 – 1.2 Skjervak30
2-/ 3-/ 4-
dimethylbenzene
(o-/ m-/ p-xylene)
PP 1 – 1.8 / 1 – 1.1 / 0.53 - 1 Skjervak30
vinylbenzene (styrene) PP 0.0036 – 0.73 Skjervak30
isopropyl benzene PP 0.07 – 0.1 Skjervak30
propyl benzene PP - Skjervak30
ethyl methyl benzene PP - Skjervak30
1,3,5-trimethyl
benzene PP 0.003 – 0.7 Skjervak
30
1,2,4-trimethyl
benzene PP 0.26 – 0.5 Skjervak
30
isopropyl toluene PP - Skjervak30
naphthalene PP 0.0068 – 0.5 Skjervak30
vanillin PP 0.058 – 66.7 Tyapkova27
ethylvanillin PP 0.1 Tyapkova27
2,6-di-tert.-
butylquinone 142.2 in PP
29 PP - Rebeyrolle-Bernard
29
2,6-di-tert.-
butylbenzoquinone PE-HD - Skjervak
30
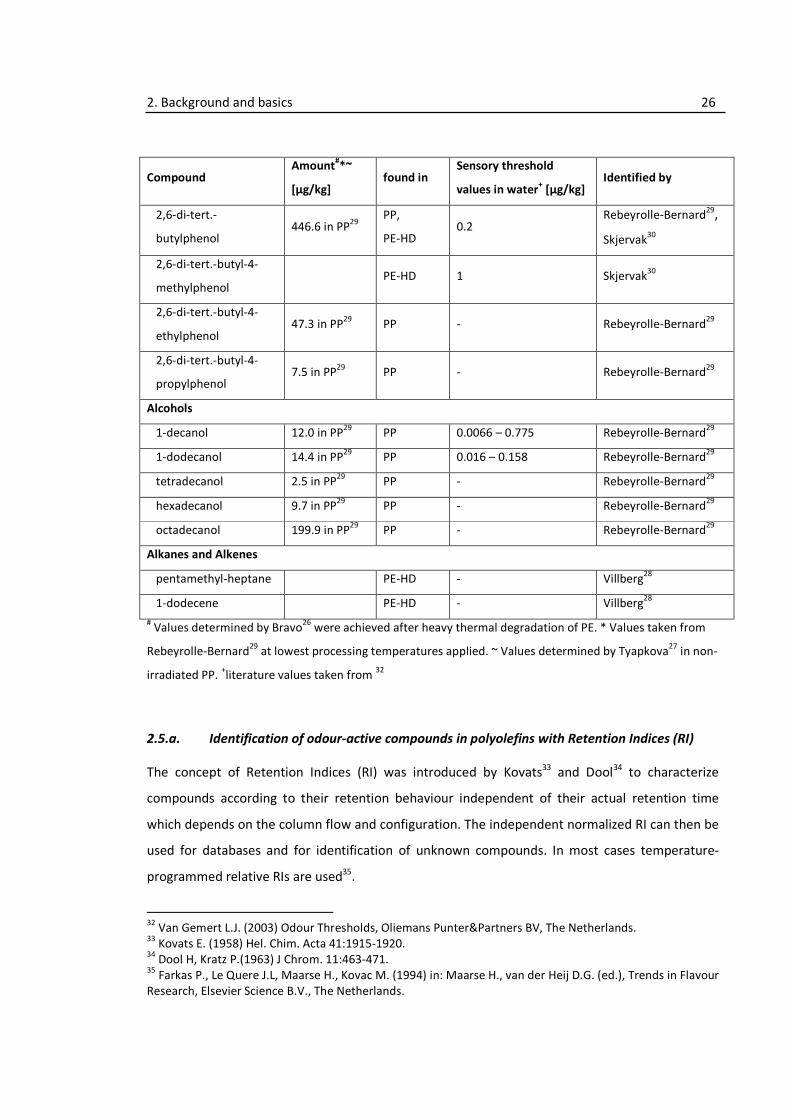
2. Background and basics 26
Compound Amount
#*~
[µg/kg] found in
Sensory threshold
values in water+ [µg/kg]
Identified by
2,6-di-tert.-
butylphenol 446.6 in PP
29
PP,
PE-HD 0.2
Rebeyrolle-Bernard29,
Skjervak30
2,6-di-tert.-butyl-4-
methylphenol PE-HD 1 Skjervak
30
2,6-di-tert.-butyl-4-
ethylphenol 47.3 in PP
29 PP - Rebeyrolle-Bernard
29
2,6-di-tert.-butyl-4-
propylphenol 7.5 in PP
29 PP - Rebeyrolle-Bernard
29
Alcohols
1-decanol 12.0 in PP29
PP 0.0066 – 0.775 Rebeyrolle-Bernard29
1-dodecanol 14.4 in PP29
PP 0.016 – 0.158 Rebeyrolle-Bernard29
tetradecanol 2.5 in PP29
PP - Rebeyrolle-Bernard29
hexadecanol 9.7 in PP29
PP - Rebeyrolle-Bernard29
octadecanol 199.9 in PP29
PP - Rebeyrolle-Bernard29
Alkanes and Alkenes
pentamethyl-heptane PE-HD - Villberg28
1-dodecene PE-HD - Villberg28
# Values determined by Bravo
26 were achieved after heavy thermal degradation of PE. * Values taken from
Rebeyrolle-Bernard29
at lowest processing temperatures applied. ~ Values determined by Tyapkova27
in non-
irradiated PP. +literature values taken from
32
2.5.a. Identification of odour-active compounds in polyolefins with Retention Indices (RI)
The concept of Retention Indices (RI) was introduced by Kovats33 and Dool34 to characterize
compounds according to their retention behaviour independent of their actual retention time
which depends on the column flow and configuration. The independent normalized RI can then be
used for databases and for identification of unknown compounds. In most cases temperature-
programmed relative RIs are used35.
32
Van Gemert L.J. (2003) Odour Thresholds, Oliemans Punter&Partners BV, The Netherlands. 33
Kovats E. (1958) Hel. Chim. Acta 41:1915-1920. 34
Dool H, Kratz P.(1963) J Chrom. 11:463-471. 35
Farkas P., Le Quere J.L, Maarse H., Kovac M. (1994) in: Maarse H., van der Heij D.G. (ed.), Trends in Flavour
Research, Elsevier Science B.V., The Netherlands.
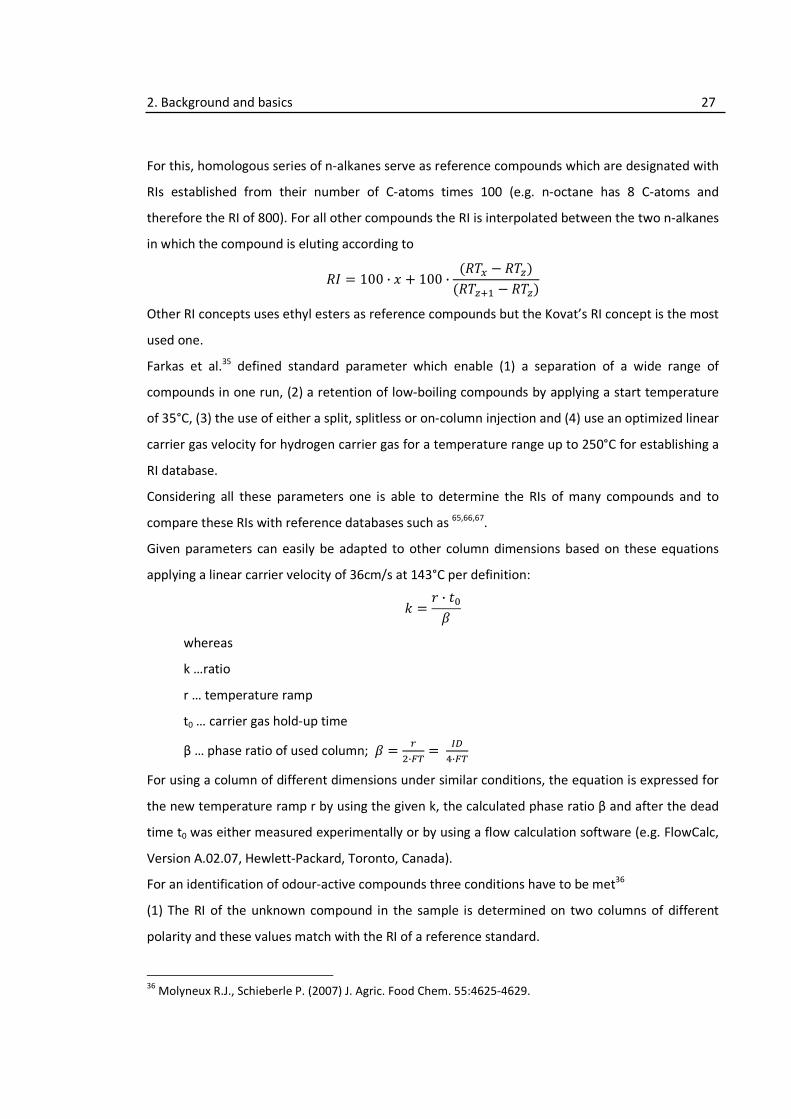
2. Background and basics 27
For this, homologous series of n-alkanes serve as reference compounds which are designated with
RIs established from their number of C-atoms times 100 (e.g. n-octane has 8 C-atoms and
therefore the RI of 800). For all other compounds the RI is interpolated between the two n-alkanes
in which the compound is eluting according to
�� � 100 · � � 100 ·�� � � �
� �� � � �
Other RI concepts uses ethyl esters as reference compounds but the Kovat’s RI concept is the most
used one.
Farkas et al.35 defined standard parameter which enable (1) a separation of a wide range of
compounds in one run, (2) a retention of low-boiling compounds by applying a start temperature
of 35°C, (3) the use of either a split, splitless or on-column injection and (4) use an optimized linear
carrier gas velocity for hydrogen carrier gas for a temperature range up to 250°C for establishing a
RI database.
Considering all these parameters one is able to determine the RIs of many compounds and to
compare these RIs with reference databases such as 65,66,67.
Given parameters can easily be adapted to other column dimensions based on these equations
applying a linear carrier velocity of 36cm/s at 143°C per definition:
� �� · ��
�
whereas
k …ratio
r … temperature ramp
t0 … carrier gas hold-up time
β … phase ratio of used column; � ��
�·���
��
�·��
For using a column of different dimensions under similar conditions, the equation is expressed for
the new temperature ramp r by using the given k, the calculated phase ratio β and after the dead
time t0 was either measured experimentally or by using a flow calculation software (e.g. FlowCalc,
Version A.02.07, Hewlett-Packard, Toronto, Canada).
For an identification of odour-active compounds three conditions have to be met36
(1) The RI of the unknown compound in the sample is determined on two columns of different
polarity and these values match with the RI of a reference standard.
36
Molyneux R.J., Schieberle P. (2007) J. Agric. Food Chem. 55:4625-4629.

2. Background and basics 28
(2) The mass spectra of the compound is clear and matches with the reference spectra
(3) The odour impression of the unknown compound is the same as the impression of the
reference in a certain concentration.
Only if all three conditions are met, an odour-active compound is successfully identified.
For this reason, RIs are a valuable and crucial tool for the identification of odour-active
compounds, especially in cases where other identification criteria fail e.g. no clear and distinct
mass spectra or the lack of a pure reference standard.

3. Materials and Methods 29
3. Materials and Methods
3.1. Polyolefin samples
In Table 3 a list of all analyzed polyolefin samples with their lot number, type and other
information is given together with the corresponding analytical program.

3. Materials and Methods 30
Table 3. List of all polyolefin samples which were analyzed during the thesis.
No. Sample description Lot no. Sample form Type Additional information Section
BO29 MB471WG-9014 28006474 pellets PP compound PP, with talc 4.4
BO30 MB471WG-9014-01 28006470 pellets PP compound PP, with talc 4.4
BO32 L140WG-06 4130003102 plaques (TM=200°C) PP compound grade 4.2
BO33 L140WG-06 4130003102 plaques (TM=260°C) PP compound grade 4.2
BO34 WG140 AI-06 4080000771 pellets PP compound grade 4.2
BO35 WG140 AI-05 4080000770 pellets PP compound grade 4.2
BO36 L140WG-06 4130003102 pellets PP compound grade 4.2
BO37 L140WG-06 4130003102 plaques (TM=230 °C) PP compound grade 4.2
BO38 WG140AI-05 4080000770 plaques (TM=200 °C) PP compound grade 4.2
BO39 WG140AI-05 4080000770 plaques (TM=230 °C) PP compound grade 4.2
BO40 WG140AI-05 4080000770 plaques (TM=260 °C) PP compound grade 4.2
BO41 BF970MO 3170005751 pellets PP compound grade, PP5, Schwechat 4.3
BO42 BF970MO 3170005751 plaques (TM=230 °C) PP compound grade, PP5, Schwechat 4.3
BO43 FB2230 2400000618 pellets PE reactor grade, PE4, Schwechat 4.3
BO44 FB2230 2400000618 plaques (TM=230 °C) PE reactor grade, PE4, Schwechat 4.3
BO45 RJ900MO B6869 pellets PP visbroken, catalyst BCF02P, MFI=100 g/10
min 4.6
BO46 RE450MO B6870 pellets PP catalyst BCF02P, MFI=13 g/10 min 4.6
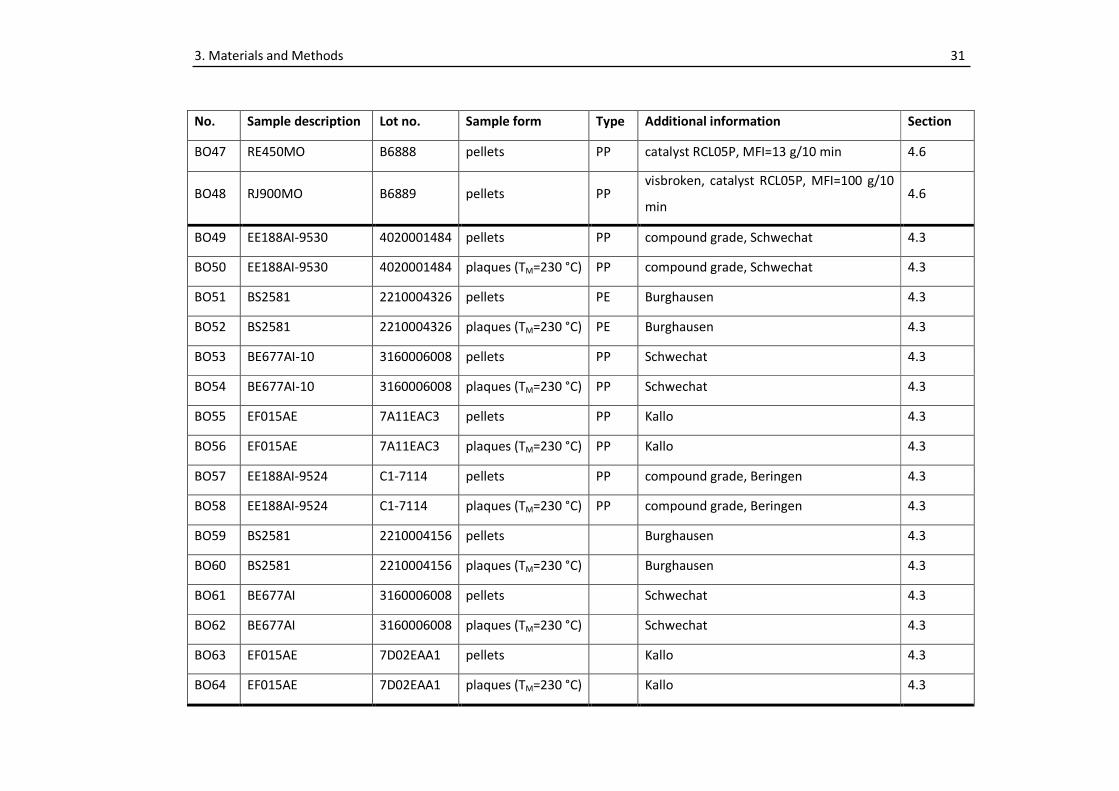
3. Materials and Methods 31
No. Sample description Lot no. Sample form Type Additional information Section
BO47 RE450MO B6888 pellets PP catalyst RCL05P, MFI=13 g/10 min 4.6
BO48 RJ900MO B6889 pellets PP visbroken, catalyst RCL05P, MFI=100 g/10
min 4.6
BO49 EE188AI-9530 4020001484 pellets PP compound grade, Schwechat 4.3
BO50 EE188AI-9530 4020001484 plaques (TM=230 °C) PP compound grade, Schwechat 4.3
BO51 BS2581 2210004326 pellets PE Burghausen 4.3
BO52 BS2581 2210004326 plaques (TM=230 °C) PE Burghausen 4.3
BO53 BE677AI-10 3160006008 pellets PP Schwechat 4.3
BO54 BE677AI-10 3160006008 plaques (TM=230 °C) PP Schwechat 4.3
BO55 EF015AE 7A11EAC3 pellets PP Kallo 4.3
BO56 EF015AE 7A11EAC3 plaques (TM=230 °C) PP Kallo 4.3
BO57 EE188AI-9524 C1-7114 pellets PP compound grade, Beringen 4.3
BO58 EE188AI-9524 C1-7114 plaques (TM=230 °C) PP compound grade, Beringen 4.3
BO59 BS2581 2210004156 pellets Burghausen 4.3
BO60 BS2581 2210004156 plaques (TM=230 °C) Burghausen 4.3
BO61 BE677AI 3160006008 pellets Schwechat 4.3
BO62 BE677AI 3160006008 plaques (TM=230 °C) Schwechat 4.3
BO63 EF015AE 7D02EAA1 pellets Kallo 4.3
BO64 EF015AE 7D02EAA1 plaques (TM=230 °C) Kallo 4.3
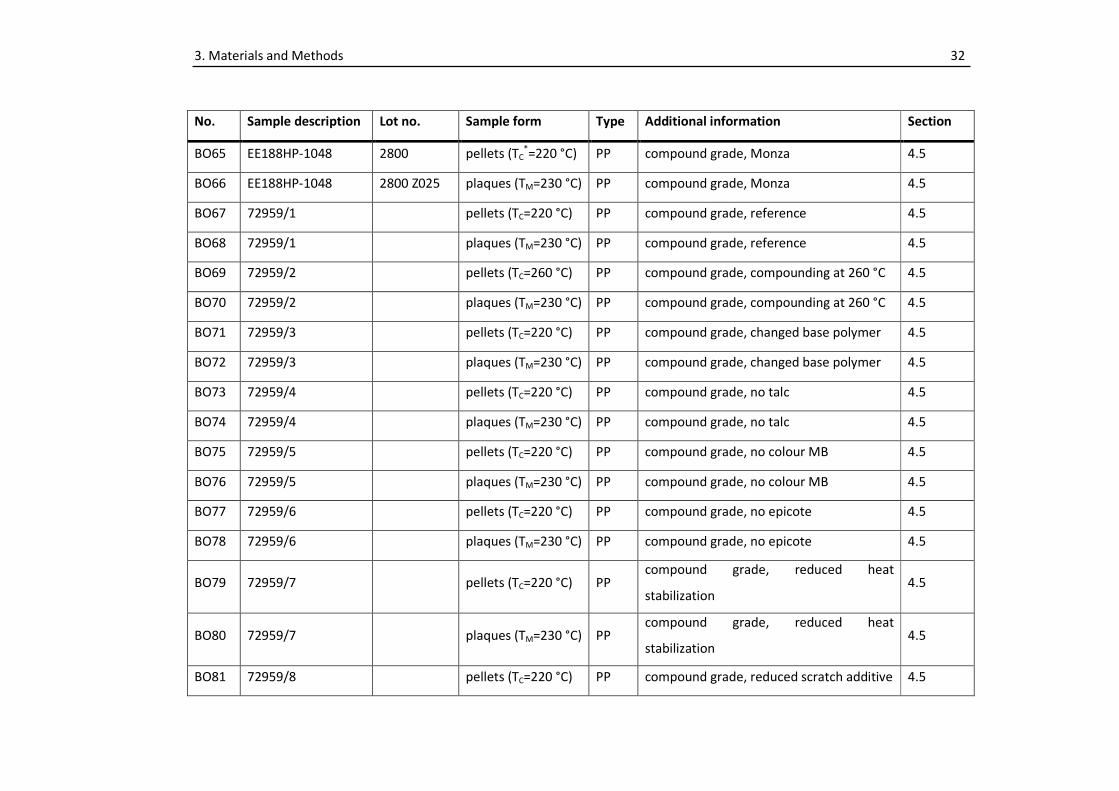
3. Materials and Methods 32
No. Sample description Lot no. Sample form Type Additional information Section
BO65 EE188HP-1048 2800 pellets (TC*=220 °C) PP compound grade, Monza 4.5
BO66 EE188HP-1048 2800 Z025 plaques (TM=230 °C) PP compound grade, Monza 4.5
BO67 72959/1 pellets (TC=220 °C) PP compound grade, reference 4.5
BO68 72959/1 plaques (TM=230 °C) PP compound grade, reference 4.5
BO69 72959/2 pellets (TC=260 °C) PP compound grade, compounding at 260 °C 4.5
BO70 72959/2 plaques (TM=230 °C) PP compound grade, compounding at 260 °C 4.5
BO71 72959/3 pellets (TC=220 °C) PP compound grade, changed base polymer 4.5
BO72 72959/3 plaques (TM=230 °C) PP compound grade, changed base polymer 4.5
BO73 72959/4 pellets (TC=220 °C) PP compound grade, no talc 4.5
BO74 72959/4 plaques (TM=230 °C) PP compound grade, no talc 4.5
BO75 72959/5 pellets (TC=220 °C) PP compound grade, no colour MB 4.5
BO76 72959/5 plaques (TM=230 °C) PP compound grade, no colour MB 4.5
BO77 72959/6 pellets (TC=220 °C) PP compound grade, no epicote 4.5
BO78 72959/6 plaques (TM=230 °C) PP compound grade, no epicote 4.5
BO79 72959/7 pellets (TC=220 °C) PP compound grade, reduced heat
stabilization 4.5
BO80 72959/7 plaques (TM=230 °C) PP compound grade, reduced heat
stabilization 4.5
BO81 72959/8 pellets (TC=220 °C) PP compound grade, reduced scratch additive 4.5
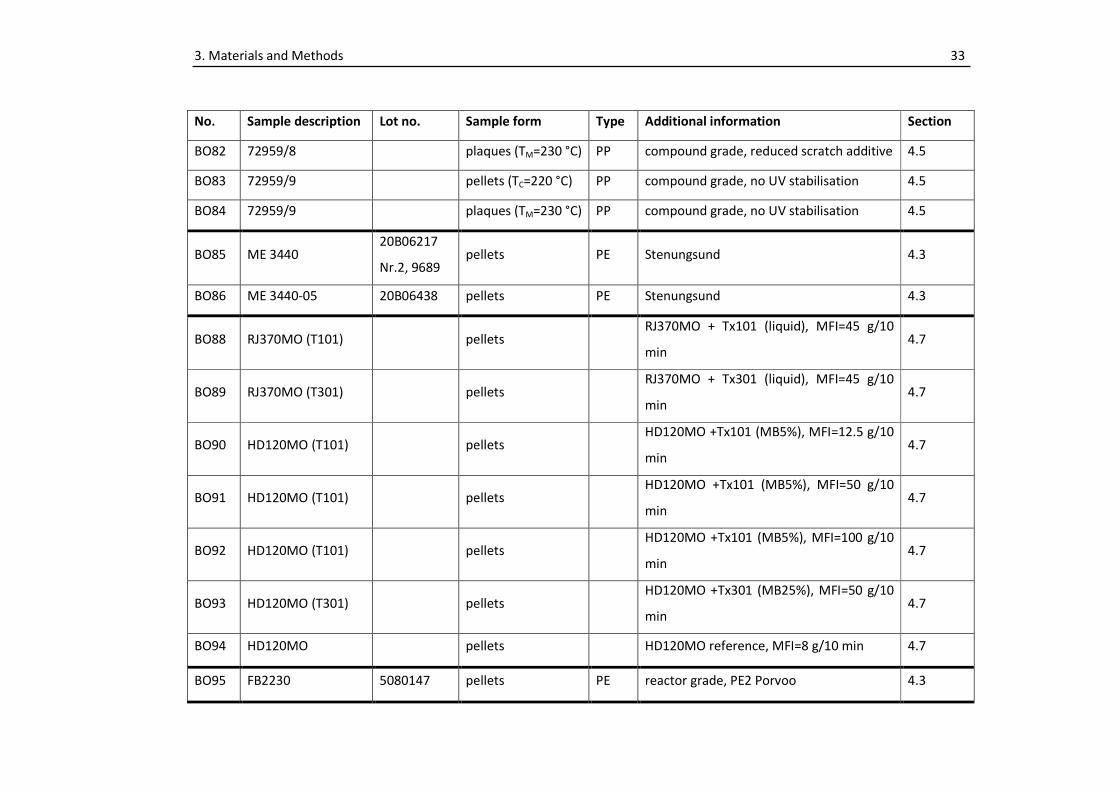
3. Materials and Methods 33
No. Sample description Lot no. Sample form Type Additional information Section
BO82 72959/8 plaques (TM=230 °C) PP compound grade, reduced scratch additive 4.5
BO83 72959/9 pellets (TC=220 °C) PP compound grade, no UV stabilisation 4.5
BO84 72959/9 plaques (TM=230 °C) PP compound grade, no UV stabilisation 4.5
BO85 ME 3440 20B06217
Nr.2, 9689 pellets PE Stenungsund 4.3
BO86 ME 3440-05 20B06438 pellets PE Stenungsund 4.3
BO88 RJ370MO (T101) pellets RJ370MO + Tx101 (liquid), MFI=45 g/10
min 4.7
BO89 RJ370MO (T301) pellets RJ370MO + Tx301 (liquid), MFI=45 g/10
min 4.7
BO90 HD120MO (T101) pellets HD120MO +Tx101 (MB5%), MFI=12.5 g/10
min 4.7
BO91 HD120MO (T101) pellets HD120MO +Tx101 (MB5%), MFI=50 g/10
min 4.7
BO92 HD120MO (T101) pellets HD120MO +Tx101 (MB5%), MFI=100 g/10
min 4.7
BO93 HD120MO (T301) pellets HD120MO +Tx301 (MB25%), MFI=50 g/10
min 4.7
BO94 HD120MO pellets HD120MO reference, MFI=8 g/10 min 4.7
BO95 FB2230 5080147 pellets PE reactor grade, PE2 Porvoo 4.3
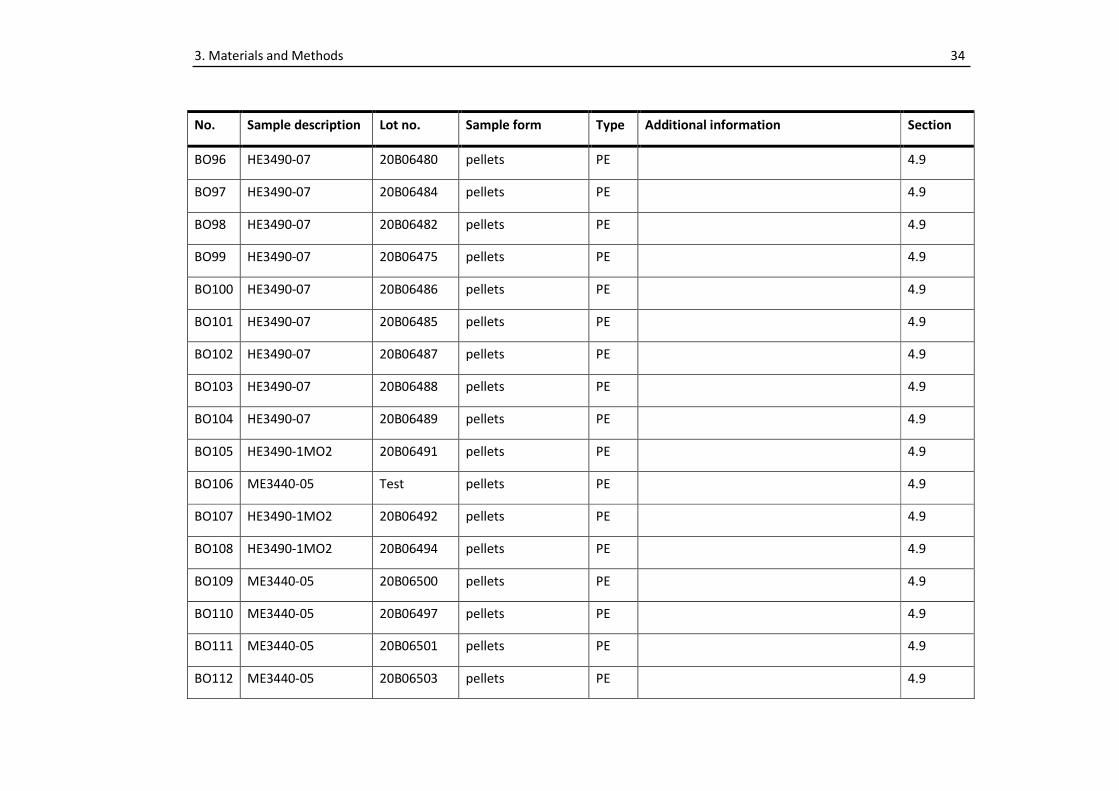
3. Materials and Methods 34
No. Sample description Lot no. Sample form Type Additional information Section
BO96 HE3490-07 20B06480 pellets PE 4.9
BO97 HE3490-07 20B06484 pellets PE 4.9
BO98 HE3490-07 20B06482 pellets PE 4.9
BO99 HE3490-07 20B06475 pellets PE 4.9
BO100 HE3490-07 20B06486 pellets PE 4.9
BO101 HE3490-07 20B06485 pellets PE 4.9
BO102 HE3490-07 20B06487 pellets PE 4.9
BO103 HE3490-07 20B06488 pellets PE 4.9
BO104 HE3490-07 20B06489 pellets PE 4.9
BO105 HE3490-1MO2 20B06491 pellets PE 4.9
BO106 ME3440-05 Test pellets PE 4.9
BO107 HE3490-1MO2 20B06492 pellets PE 4.9
BO108 HE3490-1MO2 20B06494 pellets PE 4.9
BO109 ME3440-05 20B06500 pellets PE 4.9
BO110 ME3440-05 20B06497 pellets PE 4.9
BO111 ME3440-05 20B06501 pellets PE 4.9
BO112 ME3440-05 20B06503 pellets PE 4.9
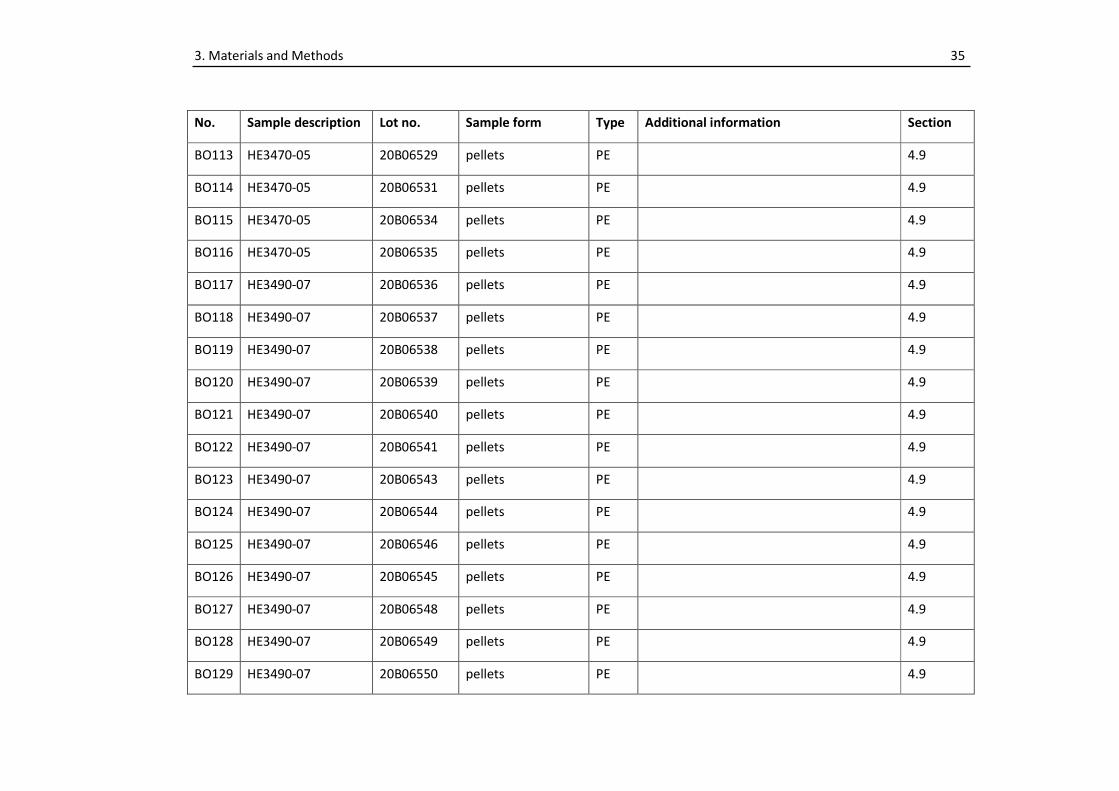
3. Materials and Methods 35
No. Sample description Lot no. Sample form Type Additional information Section
BO113 HE3470-05 20B06529 pellets PE 4.9
BO114 HE3470-05 20B06531 pellets PE 4.9
BO115 HE3470-05 20B06534 pellets PE 4.9
BO116 HE3470-05 20B06535 pellets PE 4.9
BO117 HE3490-07 20B06536 pellets PE 4.9
BO118 HE3490-07 20B06537 pellets PE 4.9
BO119 HE3490-07 20B06538 pellets PE 4.9
BO120 HE3490-07 20B06539 pellets PE 4.9
BO121 HE3490-07 20B06540 pellets PE 4.9
BO122 HE3490-07 20B06541 pellets PE 4.9
BO123 HE3490-07 20B06543 pellets PE 4.9
BO124 HE3490-07 20B06544 pellets PE 4.9
BO125 HE3490-07 20B06546 pellets PE 4.9
BO126 HE3490-07 20B06545 pellets PE 4.9
BO127 HE3490-07 20B06548 pellets PE 4.9
BO128 HE3490-07 20B06549 pellets PE 4.9
BO129 HE3490-07 20B06550 pellets PE 4.9
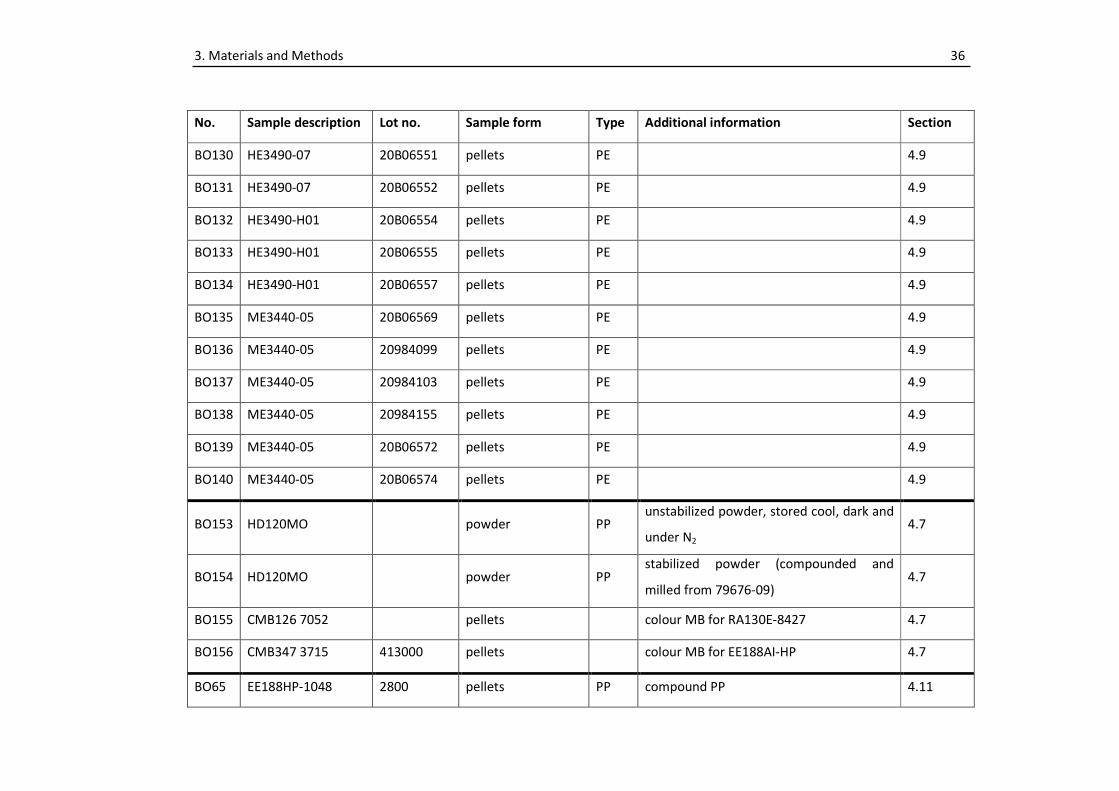
3. Materials and Methods 36
No. Sample description Lot no. Sample form Type Additional information Section
BO130 HE3490-07 20B06551 pellets PE 4.9
BO131 HE3490-07 20B06552 pellets PE 4.9
BO132 HE3490-H01 20B06554 pellets PE 4.9
BO133 HE3490-H01 20B06555 pellets PE 4.9
BO134 HE3490-H01 20B06557 pellets PE 4.9
BO135 ME3440-05 20B06569 pellets PE 4.9
BO136 ME3440-05 20984099 pellets PE 4.9
BO137 ME3440-05 20984103 pellets PE 4.9
BO138 ME3440-05 20984155 pellets PE 4.9
BO139 ME3440-05 20B06572 pellets PE 4.9
BO140 ME3440-05 20B06574 pellets PE 4.9
BO153 HD120MO powder PP unstabilized powder, stored cool, dark and
under N2 4.7
BO154 HD120MO powder PP stabilized powder (compounded and
milled from 79676-09) 4.7
BO155 CMB126 7052 pellets colour MB for RA130E-8427 4.7
BO156 CMB347 3715 413000 pellets colour MB for EE188AI-HP 4.7
BO65 EE188HP-1048 2800 pellets PP compound PP 4.11
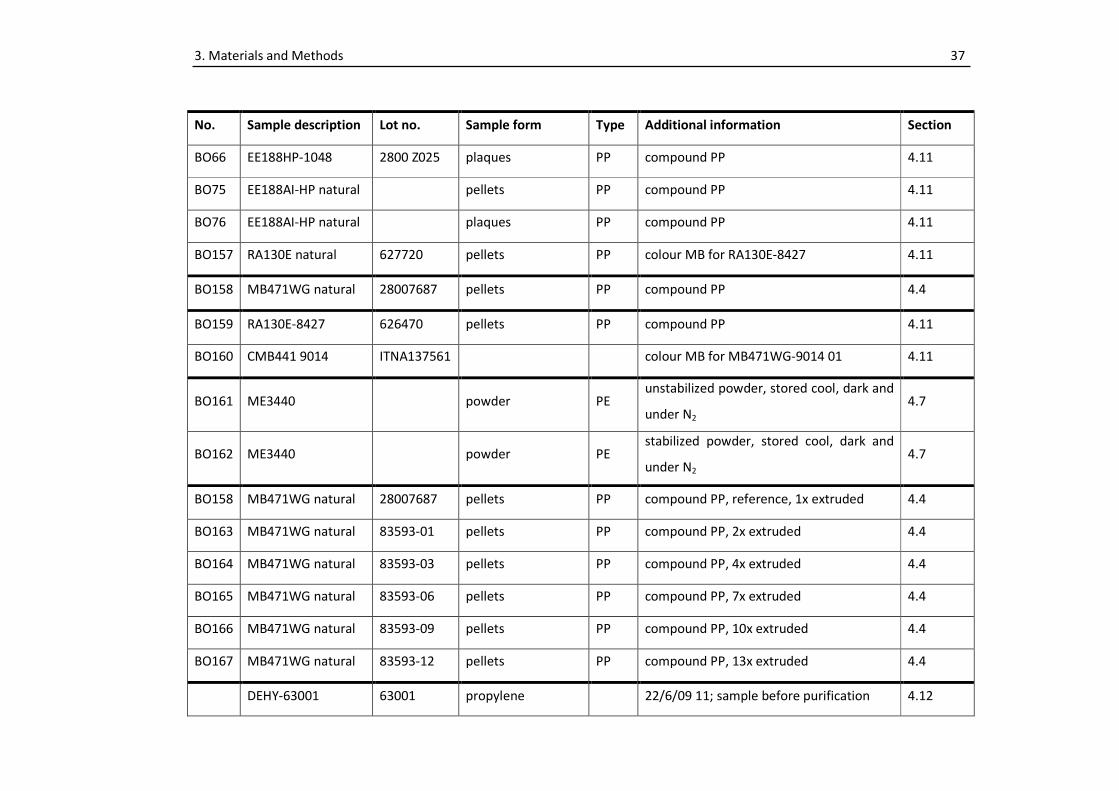
3. Materials and Methods 37
No. Sample description Lot no. Sample form Type Additional information Section
BO66 EE188HP-1048 2800 Z025 plaques PP compound PP 4.11
BO75 EE188AI-HP natural pellets PP compound PP 4.11
BO76 EE188AI-HP natural plaques PP compound PP 4.11
BO157 RA130E natural 627720 pellets PP colour MB for RA130E-8427 4.11
BO158 MB471WG natural 28007687 pellets PP compound PP 4.4
BO159 RA130E-8427 626470 pellets PP compound PP 4.11
BO160 CMB441 9014 ITNA137561 colour MB for MB471WG-9014 01 4.11
BO161 ME3440 powder PE unstabilized powder, stored cool, dark and
under N2 4.7
BO162 ME3440 powder PE stabilized powder, stored cool, dark and
under N2 4.7
BO158 MB471WG natural 28007687 pellets PP compound PP, reference, 1x extruded 4.4
BO163 MB471WG natural 83593-01 pellets PP compound PP, 2x extruded 4.4
BO164 MB471WG natural 83593-03 pellets PP compound PP, 4x extruded 4.4
BO165 MB471WG natural 83593-06 pellets PP compound PP, 7x extruded 4.4
BO166 MB471WG natural 83593-09 pellets PP compound PP, 10x extruded 4.4
BO167 MB471WG natural 83593-12 pellets PP compound PP, 13x extruded 4.4
DEHY-63001 63001 propylene 22/6/09 11; sample before purification 4.12
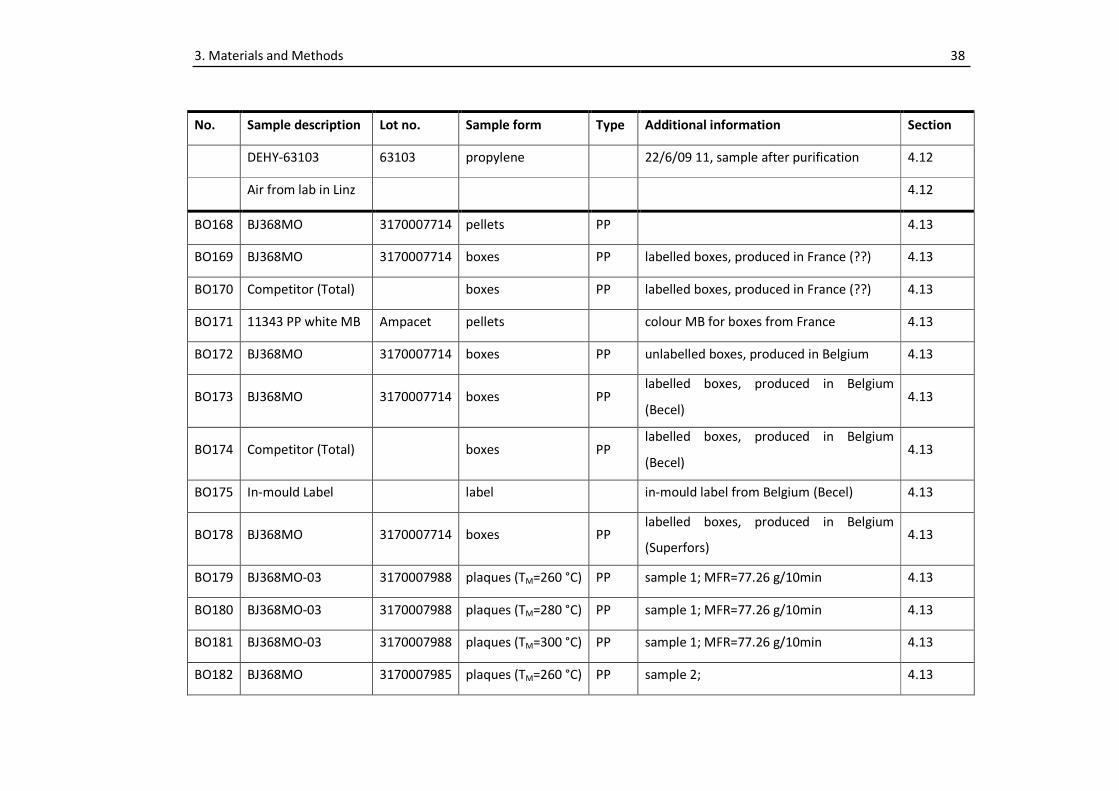
3. Materials and Methods 38
No. Sample description Lot no. Sample form Type Additional information Section
DEHY-63103 63103 propylene 22/6/09 11, sample after purification 4.12
Air from lab in Linz 4.12
BO168 BJ368MO 3170007714 pellets PP 4.13
BO169 BJ368MO 3170007714 boxes PP labelled boxes, produced in France (??) 4.13
BO170 Competitor (Total) boxes PP labelled boxes, produced in France (??) 4.13
BO171 11343 PP white MB Ampacet pellets colour MB for boxes from France 4.13
BO172 BJ368MO 3170007714 boxes PP unlabelled boxes, produced in Belgium 4.13
BO173 BJ368MO 3170007714 boxes PP labelled boxes, produced in Belgium
(Becel) 4.13
BO174 Competitor (Total) boxes PP labelled boxes, produced in Belgium
(Becel) 4.13
BO175 In-mould Label label in-mould label from Belgium (Becel) 4.13
BO178 BJ368MO 3170007714 boxes PP labelled boxes, produced in Belgium
(Superfors) 4.13
BO179 BJ368MO-03 3170007988 plaques (TM=260 °C) PP sample 1; MFR=77.26 g/10min 4.13
BO180 BJ368MO-03 3170007988 plaques (TM=280 °C) PP sample 1; MFR=77.26 g/10min 4.13
BO181 BJ368MO-03 3170007988 plaques (TM=300 °C) PP sample 1; MFR=77.26 g/10min 4.13
BO182 BJ368MO 3170007985 plaques (TM=260 °C) PP sample 2; 4.13
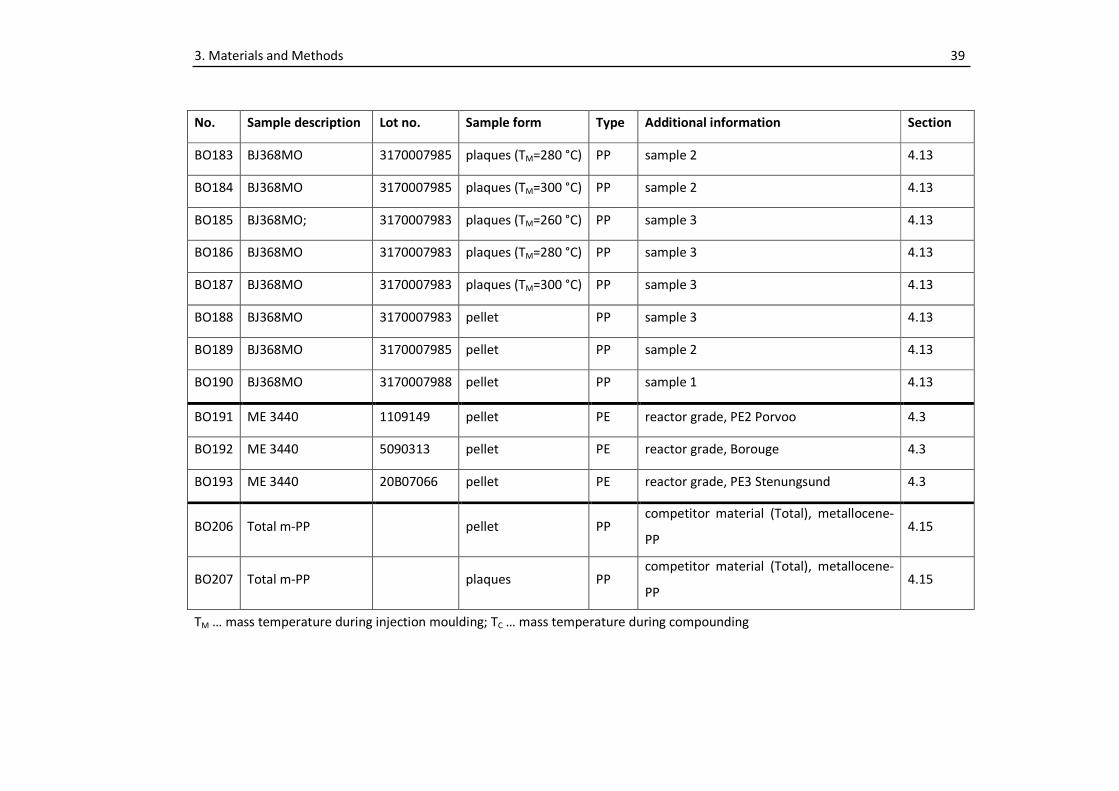
3. Materials and Methods 39
No. Sample description Lot no. Sample form Type Additional information Section
BO183 BJ368MO 3170007985 plaques (TM=280 °C) PP sample 2 4.13
BO184 BJ368MO 3170007985 plaques (TM=300 °C) PP sample 2 4.13
BO185 BJ368MO; 3170007983 plaques (TM=260 °C) PP sample 3 4.13
BO186 BJ368MO 3170007983 plaques (TM=280 °C) PP sample 3 4.13
BO187 BJ368MO 3170007983 plaques (TM=300 °C) PP sample 3 4.13
BO188 BJ368MO 3170007983 pellet PP sample 3 4.13
BO189 BJ368MO 3170007985 pellet PP sample 2 4.13
BO190 BJ368MO 3170007988 pellet PP sample 1 4.13
BO191 ME 3440 1109149 pellet PE reactor grade, PE2 Porvoo 4.3
BO192 ME 3440 5090313 pellet PE reactor grade, Borouge 4.3
BO193 ME 3440 20B07066 pellet PE reactor grade, PE3 Stenungsund 4.3
BO206 Total m-PP pellet PP competitor material (Total), metallocene-
PP 4.15
BO207 Total m-PP plaques PP competitor material (Total), metallocene-
PP 4.15
TM … mass temperature during injection moulding; TC … mass temperature during compounding
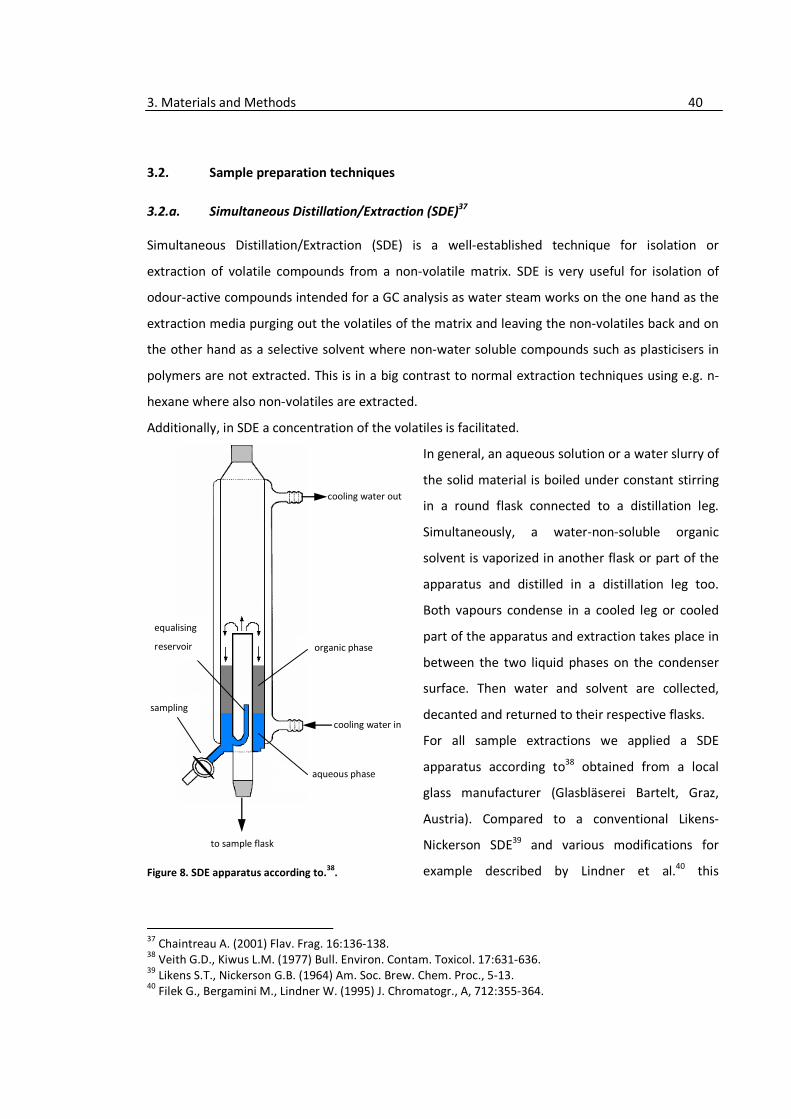
3. Materials and Methods 40
3.2. Sample preparation techniques
3.2.a. Simultaneous Distillation/Extraction (SDE)37
Simultaneous Distillation/Extraction (SDE) is a well-established technique for isolation or
extraction of volatile compounds from a non-volatile matrix. SDE is very useful for isolation of
odour-active compounds intended for a GC analysis as water steam works on the one hand as the
extraction media purging out the volatiles of the matrix and leaving the non-volatiles back and on
the other hand as a selective solvent where non-water soluble compounds such as plasticisers in
polymers are not extracted. This is in a big contrast to normal extraction techniques using e.g. n-
hexane where also non-volatiles are extracted.
Additionally, in SDE a concentration of the volatiles is facilitated.
In general, an aqueous solution or a water slurry of
the solid material is boiled under constant stirring
in a round flask connected to a distillation leg.
Simultaneously, a water-non-soluble organic
solvent is vaporized in another flask or part of the
apparatus and distilled in a distillation leg too.
Both vapours condense in a cooled leg or cooled
part of the apparatus and extraction takes place in
between the two liquid phases on the condenser
surface. Then water and solvent are collected,
decanted and returned to their respective flasks.
For all sample extractions we applied a SDE
apparatus according to38 obtained from a local
glass manufacturer (Glasbläserei Bartelt, Graz,
Austria). Compared to a conventional Likens-
Nickerson SDE39 and various modifications for
example described by Lindner et al.40 this
37
Chaintreau A. (2001) Flav. Frag. 16:136-138. 38
Veith G.D., Kiwus L.M. (1977) Bull. Environ. Contam. Toxicol. 17:631-636. 39
Likens S.T., Nickerson G.B. (1964) Am. Soc. Brew. Chem. Proc., 5-13. 40
Filek G., Bergamini M., Lindner W. (1995) J. Chromatogr., A, 712:355-364.
Figure 8. SDE apparatus according to.38
.
to sample flask
cooling water out
cooling water in
aqueous phase
organic phase
sampling
equalising
reservoir
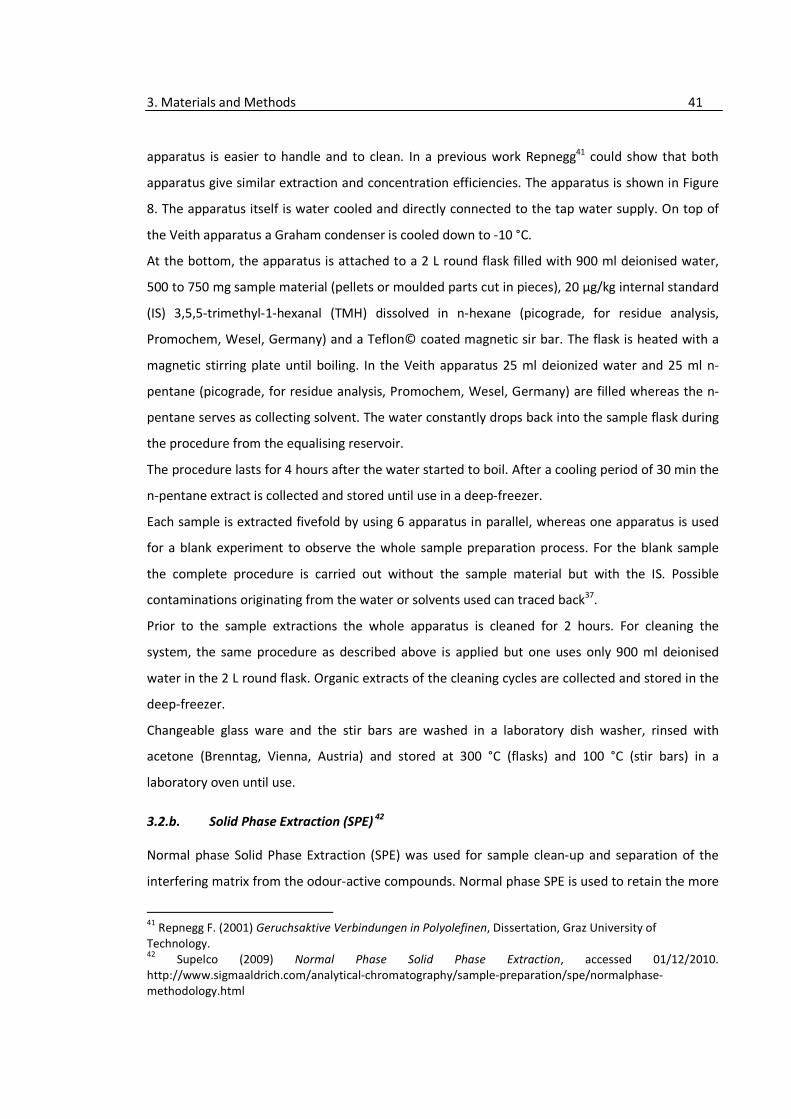
3. Materials and Methods 41
apparatus is easier to handle and to clean. In a previous work Repnegg41 could show that both
apparatus give similar extraction and concentration efficiencies. The apparatus is shown in Figure
8. The apparatus itself is water cooled and directly connected to the tap water supply. On top of
the Veith apparatus a Graham condenser is cooled down to -10 °C.
At the bottom, the apparatus is attached to a 2 L round flask filled with 900 ml deionised water,
500 to 750 mg sample material (pellets or moulded parts cut in pieces), 20 µg/kg internal standard
(IS) 3,5,5-trimethyl-1-hexanal (TMH) dissolved in n-hexane (picograde, for residue analysis,
Promochem, Wesel, Germany) and a Teflon© coated magnetic sir bar. The flask is heated with a
magnetic stirring plate until boiling. In the Veith apparatus 25 ml deionized water and 25 ml n-
pentane (picograde, for residue analysis, Promochem, Wesel, Germany) are filled whereas the n-
pentane serves as collecting solvent. The water constantly drops back into the sample flask during
the procedure from the equalising reservoir.
The procedure lasts for 4 hours after the water started to boil. After a cooling period of 30 min the
n-pentane extract is collected and stored until use in a deep-freezer.
Each sample is extracted fivefold by using 6 apparatus in parallel, whereas one apparatus is used
for a blank experiment to observe the whole sample preparation process. For the blank sample
the complete procedure is carried out without the sample material but with the IS. Possible
contaminations originating from the water or solvents used can traced back37.
Prior to the sample extractions the whole apparatus is cleaned for 2 hours. For cleaning the
system, the same procedure as described above is applied but one uses only 900 ml deionised
water in the 2 L round flask. Organic extracts of the cleaning cycles are collected and stored in the
deep-freezer.
Changeable glass ware and the stir bars are washed in a laboratory dish washer, rinsed with
acetone (Brenntag, Vienna, Austria) and stored at 300 °C (flasks) and 100 °C (stir bars) in a
laboratory oven until use.
3.2.b. Solid Phase Extraction (SPE) 42
Normal phase Solid Phase Extraction (SPE) was used for sample clean-up and separation of the
interfering matrix from the odour-active compounds. Normal phase SPE is used to retain the more
41
Repnegg F. (2001) Geruchsaktive Verbindungen in Polyolefinen, Dissertation, Graz University of
Technology. 42
Supelco (2009) Normal Phase Solid Phase Extraction, accessed 01/12/2010.
http://www.sigmaaldrich.com/analytical-chromatography/sample-preparation/spe/normalphase-
methodology.html
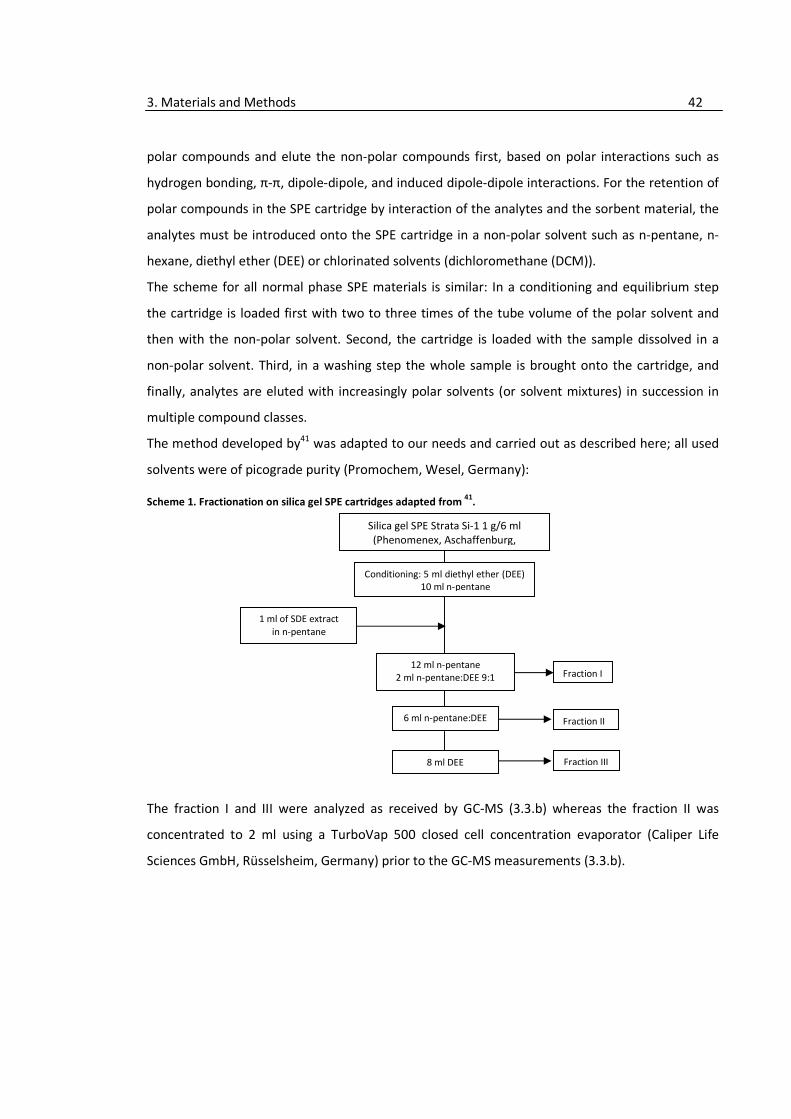
3. Materials and Methods 42
Fraction II
Fraction III
Silica gel SPE Strata Si-1 1 g/6 ml
(Phenomenex, Aschaffenburg,
1 ml of SDE extract
in n-pentane
Conditioning: 5 ml diethyl ether (DEE) 10 ml n-pentane
Fraction I 12 ml n-pentane
2 ml n-pentane:DEE 9:1
6 ml n-pentane:DEE
8 ml DEE
polar compounds and elute the non-polar compounds first, based on polar interactions such as
hydrogen bonding, π-π, dipole-dipole, and induced dipole-dipole interactions. For the retention of
polar compounds in the SPE cartridge by interaction of the analytes and the sorbent material, the
analytes must be introduced onto the SPE cartridge in a non-polar solvent such as n-pentane, n-
hexane, diethyl ether (DEE) or chlorinated solvents (dichloromethane (DCM)).
The scheme for all normal phase SPE materials is similar: In a conditioning and equilibrium step
the cartridge is loaded first with two to three times of the tube volume of the polar solvent and
then with the non-polar solvent. Second, the cartridge is loaded with the sample dissolved in a
non-polar solvent. Third, in a washing step the whole sample is brought onto the cartridge, and
finally, analytes are eluted with increasingly polar solvents (or solvent mixtures) in succession in
multiple compound classes.
The method developed by41 was adapted to our needs and carried out as described here; all used
solvents were of picograde purity (Promochem, Wesel, Germany):
Scheme 1. Fractionation on silica gel SPE cartridges adapted from 41
.
The fraction I and III were analyzed as received by GC-MS (3.3.b) whereas the fraction II was
concentrated to 2 ml using a TurboVap 500 closed cell concentration evaporator (Caliper Life
Sciences GmbH, Rüsselsheim, Germany) prior to the GC-MS measurements (3.3.b).

3. Materials and Methods 43
In previous works (Siegmund43, Repnegg41) it was shown that in fraction I most of the linear and
branched alkanes and alkenes are eluted, in fraction II the odour-active carbonyls are collected
and in fraction III all other compounds such as alcohols and acids are eluted.
3.2.c. Solid Phase Microextraction (SPME)
Solid Phase Microextraction (SPME) is an alternative approach to sampling and extraction invented
by J. Pawliszyn44. The SPME device (see Figure 9) looks very similar to a conventional liquid syringe
and consists of a thin supporting fibre (a) implemented in a fibre tubing (b) which can be retrieved
into the piercing support needle (c) by using a plunger (d).
The advantages of SPME compared to other sampling
techniques are that SPME is (1) solvent-free, (2) time-saving, (3)
easy to introduce into the gas chromatography (GC) inlet and (4)
able to simultaneously sample, extract and concentrate the
analytes on the fibre44. In addition, SPME can be used either
manually or with an autosampler.
Once, the analytes are ad- or absorbed onto the SPME fibre, the
SPME device can be directly injected into the GC.
We used SPME both for GC-MS and GC-O analyses.
In all experiments a 2 cm StableFlex SPME fibre with a 50/30 µm
coating of Divinylbenzene and Carboxen on a
Polydimethylsiloxane fibre (DVB/CAR/PDMS) from Supelco
(Bellafonte, USA) was used. Based on previous analyses and the
supplier’s information this fibre is useful for [ … analytes with a
molecular mass between 40 and 275 g/mol. … 2 cm StableFlex
fibre is recommended for trace compound analysis.]45.
For GC analysis using SPME it is recommended to use an inlet liner with a reduced inner diameter
to improve the peaks shape and height46. Additionally, the use of the 0.75 mm ID instead of the
43
Siegmund B. (1997) Untersuchung und Optimierung der Aromaeigenschaften eines Convenience-Food
Produkts, Dissertation, Graz University of Technology. 44
Pawliszyn J. (1997) Solid Phase Microextraction Theory and Practise, Wiley-VCH, New York, USA. 45
Supelco (2009) Product information, accessed on 01/12/2010. http://www.sigmaaldrich.com/analytical-
chromatography/analytical-products.html?TablePage=18156565 46
Supelco Technical note T397136A (1997) Reduce Inlet Liner ID for Sharper Peaks by SPME/GC, accessed
01/12/2010,
Figure 9. SPME device, annotation
see text (adapted from 44
).
(a)
(b)
(c)
(d)
3. Materials and Methods 44
conventional 2 mm ID inlet liner increases the linear velocity through the liner and introduces the
analytes in a narrow band onto the analytical column which is of extreme influence for highly
volatile compounds.
In all analyses we used the 0.75 mm ID inlet liner (Supelco, Bellafonte, USA) for the SPME
measurements. Different temperature programs for the compound extraction were applied
ranging from 40 °C to 50 °C with an extraction time between 10 min to 20 min. In all experiments a
thermostating time of 5 min and desorption time in the inlet liner of 10 min were used.
3.2.d. Derivatization47
Derivatization is a common technique in analytical chemistry and here especially for
chromatography. For analysis of odour-active compounds in various more or less complicated
matrices like foods, beverages or packaging materials it is used due to several reasons:
• to achieve a selective detection of analytes of interest in a more or less complicated
matrix.
• to further improve the selectivity by insertion of a heteroatom-containing derivatization
group in combination with a heteroatom-sensitive detector like a nitrogen-phosphorus
detector (NPD), an electron-capture detector (ECD), a flame photometric detector (FPD),
an atomic emission detector (AED) or mass spectrometry in selected ion monitoring mode
(MS-SIM).
• to improve and lower detection limits by shifting analytes of interest to another retention
area and/or a higher mass area with less interferences.
In contrast to post-chromatographic derivatization in liquid chromatography (i.e. derivatization
after chromatographic separation and prior to detection) for gas chromatography (GC) pre-
chromatographic derivatization (i.e. derivatization prior to GC separation) is applied mainly for
• enhancing the volatility of low volatile compounds.
• decreasing the polarity and therefore enhancing the detectability/elution of compounds
such as organic acids or sugars.
• increasing the stability of thermal labile compounds which otherwise would be degraded
in the gas chromatographic inlet.
• improving the separation of co-eluting compounds by shifting them further apart.
http://www.sigmaaldrich.com/etc/medialib/docs/Supelco/Application_Notes/4676.Par.0001.File.tmp/4676.
pdf 47
Knapp D.R. (1979), Handbook of Analytical Derivatization reactions, Wiley-Interscience, New York, USA.

3. Materials and Methods 45
• improving the detectability by use of element-specific detectors (NPD, FPD, ECD, AED) by
insertion of hetero-atoms (nitrogen, phosphorus, halogens) or using MS in SIM mode as
“larger” mass fragments enable easier identification due to less interferences.
• separating optical active isomers by a selective reaction of the derivatization reagent of
one of the isomers or by reaction with both enantiomers but giving better resolution of
the isomers.
• selectively separating analytes of interest from a complex mixture (e.g. matrix) as shown
for partially hydrogenated nitrogen-containing polycyclic aromatic hydrocarbons (PAHs) by
derivatization with trifluoroacetyl chloride48.
The most common used derivatization reagent for carbonyls is O-(2,3,4,5,6-
Pentafluorobenzyl)hydroxylamine hydrochloride (PFBHA). PFBHA reacts with carbonyls to the
corresponding oximes and forms syn and anti isomers which are usually separated in the GC run
(shown in Scheme 2).
A great number of publications about the use of PFBHA for derivatization of carbonyls can be
found but most of them deal only with the saturated aldehydes. Schmarr and his group49
determined alkanales, (E)-2-alkenales, (E,E)-2,4-alkadienales, aromatic aldehydes such as
benzaldehyde and others as well as various ketones as their PFBHA derivatives by HS-SPME and
GC-MSxMS in wines but admitted problems with the derivatization of unsaturated ketones such as
the 1-alken-3ones due to their prolonged reaction time needed for a quantitatively conversion
(personal communication).
We showed50 that PFBHA is not able to derivatize 1-alken-3-ones in an appropriate time whereas
the alkanales, the (E)-2-alkenales and the (E,E)-2,4-alkadienales could be derivatised within 30 min
at 80 °C.
48
Wood K.V., Schmidt C.E., Cooks R.G., Batts B.D. (1984) Anal. Chem. 56:1335-1338. 49
Schmarr H.G., Potouridis T., Ganß S., Sang W., Köpp B., Bokuz U., Fischer U. (2008) Anal. Chim. Acta
617:119–131. 50
Hopfer, H.; Haar, N.; Koraimann C., Leitner, E. (2009) 100 – 103; in: Proceedings of the EURO FOOD CHEM
XV (H. Sorensen, S. Sorensen, A.D. Sorensen, J.C. Sorensen, K.E. Andersen, C. Bjergegaard, P. Moller, ed.),
Faculty of Life Sciences, University of Copenhagen, Denmark
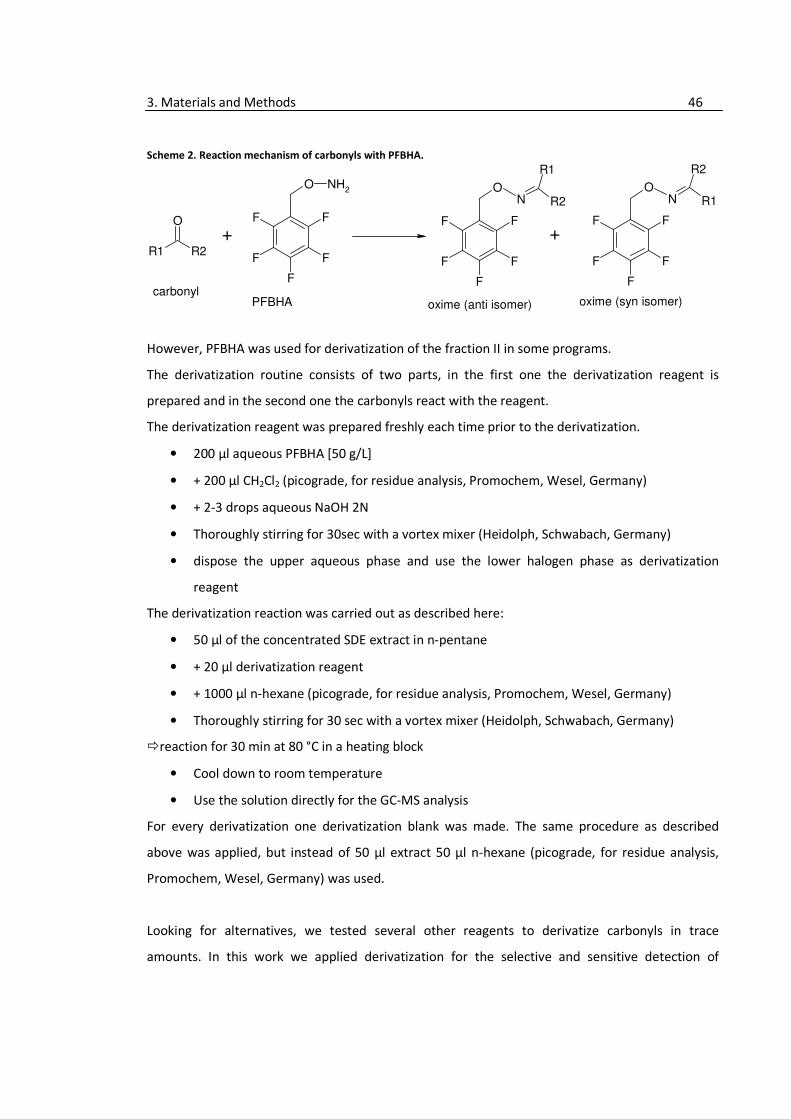
3. Materials and Methods 46
Scheme 2. Reaction mechanism of carbonyls with PFBHA.
O NH2
F
F
F
F
F
R1 R2
O
O
F
F
F
F
F
N
R1
R2O
F
F
F
F
F
N
R2
R1
+
carbonylPFBHA
+
oxime (anti isomer) oxime (syn isomer)
However, PFBHA was used for derivatization of the fraction II in some programs.
The derivatization routine consists of two parts, in the first one the derivatization reagent is
prepared and in the second one the carbonyls react with the reagent.
The derivatization reagent was prepared freshly each time prior to the derivatization.
• 200 µl aqueous PFBHA [50 g/L]
• + 200 µl CH2Cl2 (picograde, for residue analysis, Promochem, Wesel, Germany)
• + 2-3 drops aqueous NaOH 2N
• Thoroughly stirring for 30sec with a vortex mixer (Heidolph, Schwabach, Germany)
• dispose the upper aqueous phase and use the lower halogen phase as derivatization
reagent
The derivatization reaction was carried out as described here:
• 50 µl of the concentrated SDE extract in n-pentane
• + 20 µl derivatization reagent
• + 1000 µl n-hexane (picograde, for residue analysis, Promochem, Wesel, Germany)
• Thoroughly stirring for 30 sec with a vortex mixer (Heidolph, Schwabach, Germany)
�reaction for 30 min at 80 °C in a heating block
• Cool down to room temperature
• Use the solution directly for the GC-MS analysis
For every derivatization one derivatization blank was made. The same procedure as described
above was applied, but instead of 50 µl extract 50 µl n-hexane (picograde, for residue analysis,
Promochem, Wesel, Germany) was used.
Looking for alternatives, we tested several other reagents to derivatize carbonyls in trace
amounts. In this work we applied derivatization for the selective and sensitive detection of
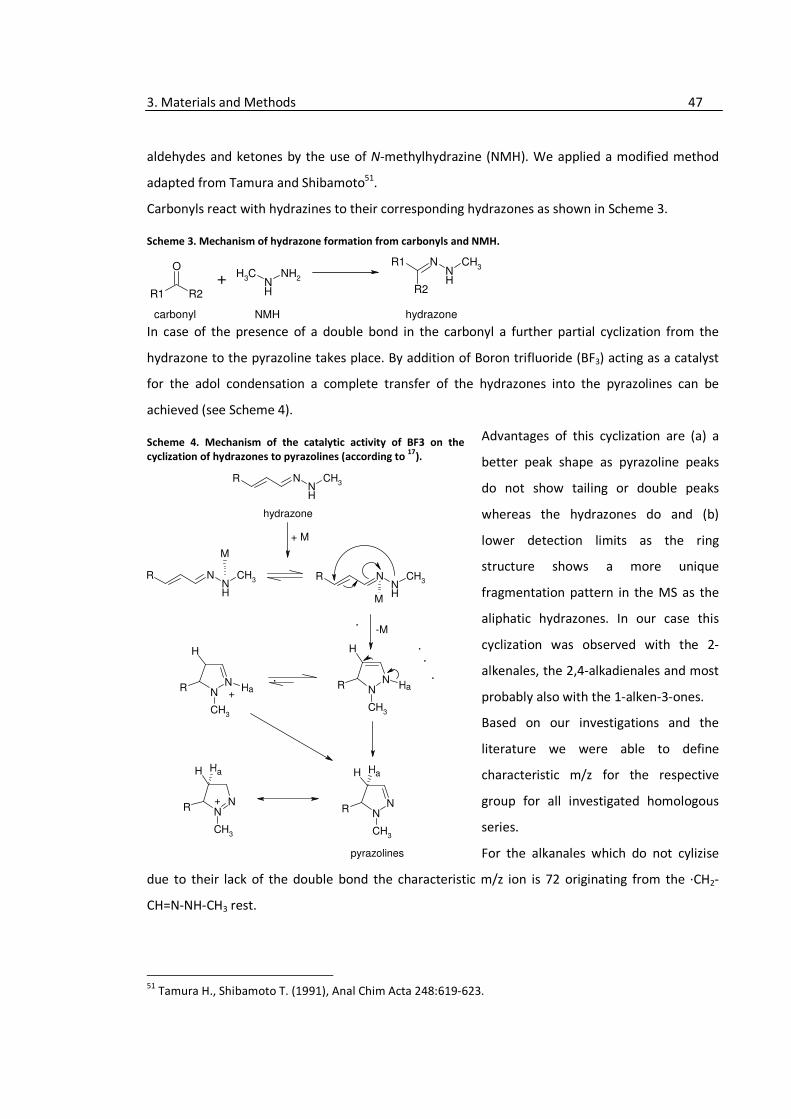
3. Materials and Methods 47
aldehydes and ketones by the use of N-methylhydrazine (NMH). We applied a modified method
adapted from Tamura and Shibamoto51.
Carbonyls react with hydrazines to their corresponding hydrazones as shown in Scheme 3.
Scheme 3. Mechanism of hydrazone formation from carbonyls and NMH.
In case of the presence of a double bond in the carbonyl a further partial cyclization from the
hydrazone to the pyrazoline takes place. By addition of Boron trifluoride (BF3) acting as a catalyst
for the adol condensation a complete transfer of the hydrazones into the pyrazolines can be
achieved (see Scheme 4).
Advantages of this cyclization are (a) a
better peak shape as pyrazoline peaks
do not show tailing or double peaks
whereas the hydrazones do and (b)
lower detection limits as the ring
structure shows a more unique
fragmentation pattern in the MS as the
aliphatic hydrazones. In our case this
cyclization was observed with the 2-
alkenales, the 2,4-alkadienales and most
probably also with the 1-alken-3-ones.
Based on our investigations and the
literature we were able to define
characteristic m/z for the respective
group for all investigated homologous
series.
For the alkanales which do not cylizise
due to their lack of the double bond the characteristic m/z ion is 72 originating from the ∙CH2-
CH=N-NH-CH3 rest.
51
Tamura H., Shibamoto T. (1991), Anal Chim Acta 248:619-623.
Scheme 4. Mechanism of the catalytic activity of BF3 on the
cyclization of hydrazones to pyrazolines (according to 17
).
R1 R2
OCH
3NH
NH2
NNH
CH3
R1
R2+
carbonyl NMH hydrazone
NNH
CH3
R
NNH
CH3
R NNH
CH3
R
NN
H
R
CH3
HN
N
H
R
CH3
H
NN
H
R
CH3
H
NN
H
R
CH3
H
hydrazone
+ M
M
M
-M
aa+
aa
+
pyrazolines
3. Materials and Methods 48
The (E)-2-alkenales show a characteristic fragment of 83 m/z due to the aromatic 5-ring. We could
find the characteristic m/z of 109 for the 2,4-alkadienales and for the 1-alken-3-ones the
prominent m/z of 97 but could not clear the structure behind until now.
However, for the analysis of the compounds and for the GC-MS measurements in SIM mode the
explicit structure is not needed.
The applied derivatization routine is described here:
• An aliquot of fraction II (1 or 0.5 ml) in n-pentane or 1 ml standard solution
• + NMH (10 µl for 0.5 ml or 20 µl for 1 ml solution)
• Thoroughly stirring for 30 sec with a vortex mixer (Heidolph, Schwabach, Germany)
�reaction for 60 min at 40 °C in a heating block
• Cool down to room temperature
• + BF3-etherate (10 µl for 0.5 ml and 20 µl for 1 ml solution)
• Thoroughly stirring for 30 sec with a vortex mixer (Heidolph, Schwabach, Germany)
�reaction for 30 min at 40 °C
• Cool down to room temperature
• Use the solution directly for the GC-MS analysis
For every derivatization one derivatization blank was made. The same procedure as described
above was applied, but instead of the extract the same volume n-hexane (picograde, for residue
analysis, Promochem, Wesel, Germany) was used.
3.3. Gas Chromatography (GC)
Gas Chromatography (GC) is the method for the analysis of volatile and odour-active compounds
as in the GC the mobile phase is a gas and analytes are separated in their gaseous state. We
applied GC with various sample preparation techniques (liquid injection of the organic SPE extract,
liquid injection of the fractioned SPE extract, liquid injection of the derivatised fractions, SPME
injection of pellets and plaques), separation techniques (HP-5 column, DB-WAX column) and
detection systems (flame ionisation detection (FID), nitrogen phosphorous detection (NPD), mass
spectroscopy (MS)).
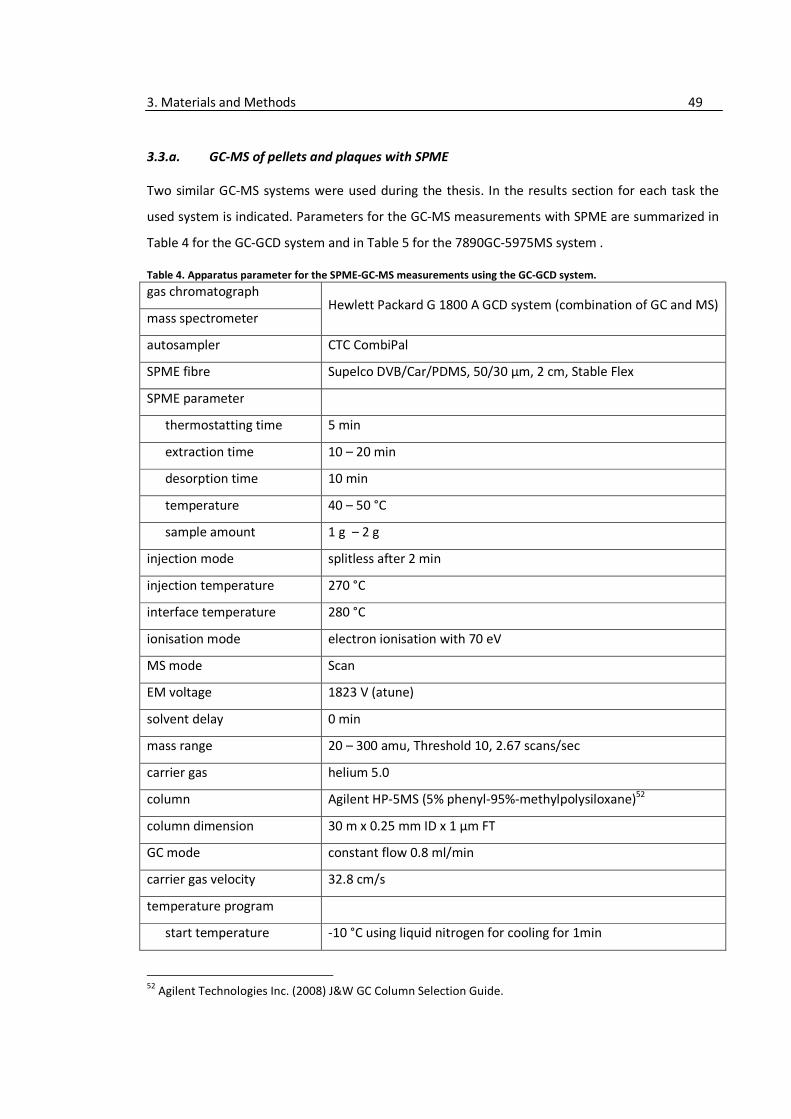
3. Materials and Methods 49
3.3.a. GC-MS of pellets and plaques with SPME
Two similar GC-MS systems were used during the thesis. In the results section for each task the
used system is indicated. Parameters for the GC-MS measurements with SPME are summarized in
Table 4 for the GC-GCD system and in Table 5 for the 7890GC-5975MS system .
52
Agilent Technologies Inc. (2008) J&W GC Column Selection Guide.
Table 4. Apparatus parameter for the SPME-GC-MS measurements using the GC-GCD system.
gas chromatograph Hewlett Packard G 1800 A GCD system (combination of GC and MS)
mass spectrometer
autosampler CTC CombiPal
SPME fibre Supelco DVB/Car/PDMS, 50/30 µm, 2 cm, Stable Flex
SPME parameter
thermostatting time 5 min
extraction time 10 – 20 min
desorption time 10 min
temperature 40 – 50 °C
sample amount 1 g – 2 g
injection mode splitless after 2 min
injection temperature 270 °C
interface temperature 280 °C
ionisation mode electron ionisation with 70 eV
MS mode Scan
EM voltage 1823 V (atune)
solvent delay 0 min
mass range 20 – 300 amu, Threshold 10, 2.67 scans/sec
carrier gas helium 5.0
column Agilent HP-5MS (5% phenyl-95%-methylpolysiloxane)52
column dimension 30 m x 0.25 mm ID x 1 µm FT
GC mode constant flow 0.8 ml/min
carrier gas velocity 32.8 cm/s
temperature program
start temperature -10 °C using liquid nitrogen for cooling for 1min
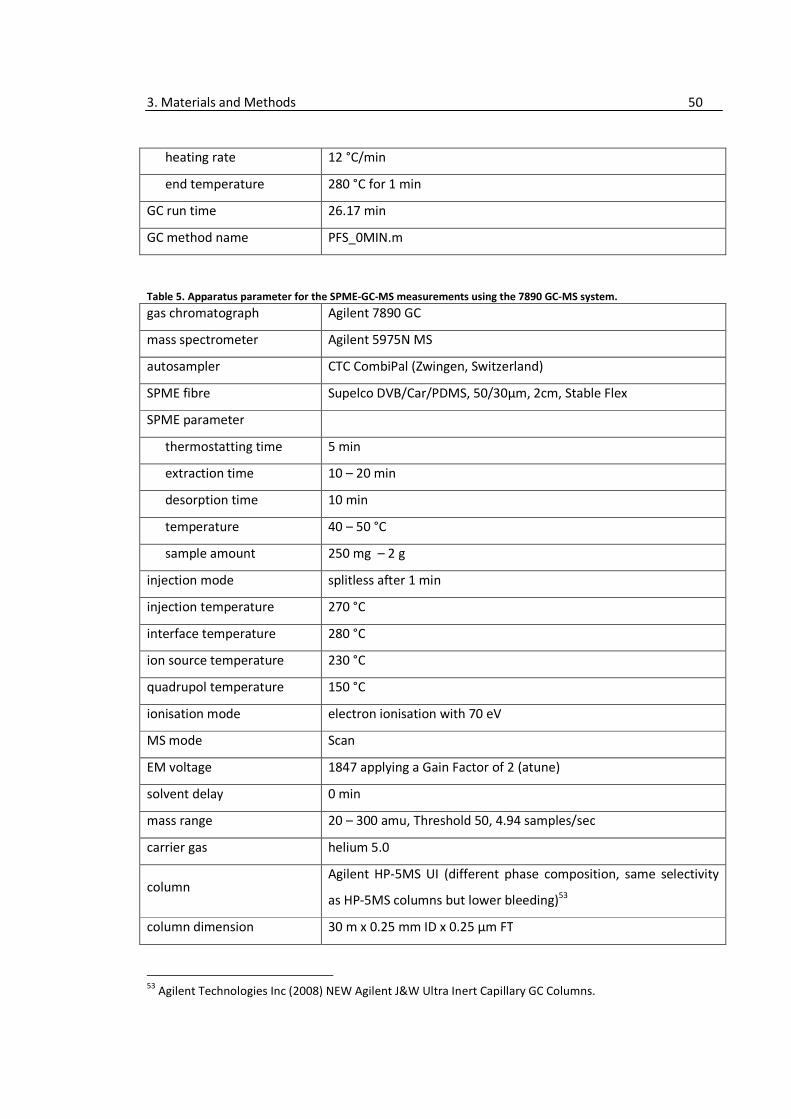
3. Materials and Methods 50
Table 5. Apparatus parameter for the SPME-GC-MS measurements using the 7890 GC-MS system.
gas chromatograph Agilent 7890 GC
mass spectrometer Agilent 5975N MS
autosampler CTC CombiPal (Zwingen, Switzerland)
SPME fibre Supelco DVB/Car/PDMS, 50/30µm, 2cm, Stable Flex
SPME parameter
thermostatting time 5 min
extraction time 10 – 20 min
desorption time 10 min
temperature 40 – 50 °C
sample amount 250 mg – 2 g
injection mode splitless after 1 min
injection temperature 270 °C
interface temperature 280 °C
ion source temperature 230 °C
quadrupol temperature 150 °C
ionisation mode electron ionisation with 70 eV
MS mode Scan
EM voltage 1847 applying a Gain Factor of 2 (atune)
solvent delay 0 min
mass range 20 – 300 amu, Threshold 50, 4.94 samples/sec
carrier gas helium 5.0
column Agilent HP-5MS UI (different phase composition, same selectivity
as HP-5MS columns but lower bleeding)53
column dimension 30 m x 0.25 mm ID x 0.25 µm FT
53
Agilent Technologies Inc (2008) NEW Agilent J&W Ultra Inert Capillary GC Columns.
heating rate 12 °C/min
end temperature 280 °C for 1 min
GC run time 26.17 min
GC method name PFS_0MIN.m

3. Materials and Methods 51
GC mode constant flow 0.8 ml/min
carrier gas velocity 31.2 cm/sec
temperature program
start temperature -10 °C using liquid nitrogen for cooling for 1 min
heating rate 8 °C/min
end temperature 260 °C for 1 min
GC run time 35.75 min
GC method name PFS_0MIN_SOLVENT.m
3.3.b. GC-MS of fractioned extracts
Table 6. Apparatus parameter for the GC-MS measurements of the liquid fractioned extracts using the GC-MS system.
Gas chromatograph Hewlett Packard HP5890A GC
mass spectrometer Hewlett Packard HP5975 MS
autosampler Hewlett Packard HP7673 Autosampler
syringe Hamilton 10 µl
injection volume 1 µl
injection mode splitless after 1 min
injection temperature 250 °C
interface temperature 280 °C
ionisation mode electron ionisation with 70 eV
MS mode Scan
EM voltage 2353 V (atune)
solvent delay 3.5 min
mass range 40 – 290 amu; Threshold 10, 2.98 scans/sec
carrier gas helium 5.0
column Agilent HP-5MS (5% phenyl-95%-methylpolysiloxane)52
column dimension 30 m x 0.25 mm ID x 0.25 µm FT
GC mode constant flow 0.8 ml/min
carrier gas velocity 33 cm/s
temperature program
start temperature 35 °C for 0 min
heating rate 5.3 °C/min
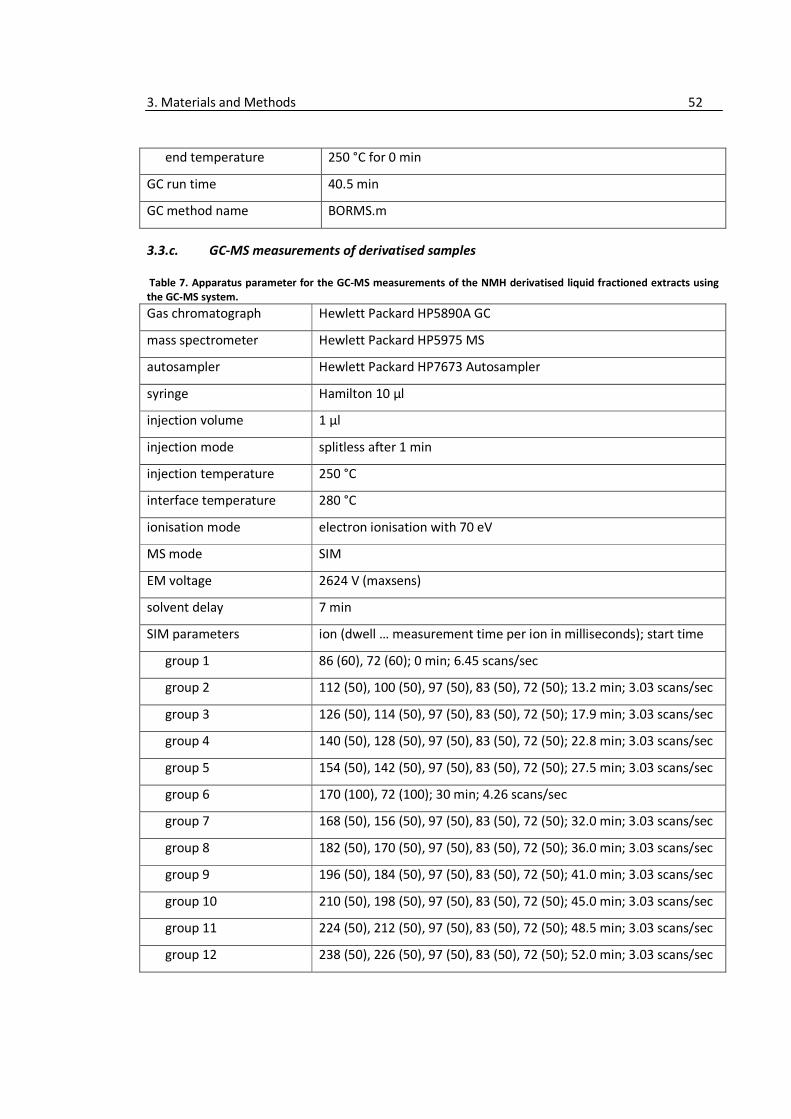
3. Materials and Methods 52
end temperature 250 °C for 0 min
GC run time 40.5 min
GC method name BORMS.m
3.3.c. GC-MS measurements of derivatised samples
Table 7. Apparatus parameter for the GC-MS measurements of the NMH derivatised liquid fractioned extracts using
the GC-MS system.
Gas chromatograph Hewlett Packard HP5890A GC
mass spectrometer Hewlett Packard HP5975 MS
autosampler Hewlett Packard HP7673 Autosampler
syringe Hamilton 10 µl
injection volume 1 µl
injection mode splitless after 1 min
injection temperature 250 °C
interface temperature 280 °C
ionisation mode electron ionisation with 70 eV
MS mode SIM
EM voltage 2624 V (maxsens)
solvent delay 7 min
SIM parameters ion (dwell … measurement time per ion in milliseconds); start time
group 1 86 (60), 72 (60); 0 min; 6.45 scans/sec
group 2 112 (50), 100 (50), 97 (50), 83 (50), 72 (50); 13.2 min; 3.03 scans/sec
group 3 126 (50), 114 (50), 97 (50), 83 (50), 72 (50); 17.9 min; 3.03 scans/sec
group 4 140 (50), 128 (50), 97 (50), 83 (50), 72 (50); 22.8 min; 3.03 scans/sec
group 5 154 (50), 142 (50), 97 (50), 83 (50), 72 (50); 27.5 min; 3.03 scans/sec
group 6 170 (100), 72 (100); 30 min; 4.26 scans/sec
group 7 168 (50), 156 (50), 97 (50), 83 (50), 72 (50); 32.0 min; 3.03 scans/sec
group 8 182 (50), 170 (50), 97 (50), 83 (50), 72 (50); 36.0 min; 3.03 scans/sec
group 9 196 (50), 184 (50), 97 (50), 83 (50), 72 (50); 41.0 min; 3.03 scans/sec
group 10 210 (50), 198 (50), 97 (50), 83 (50), 72 (50); 45.0 min; 3.03 scans/sec
group 11 224 (50), 212 (50), 97 (50), 83 (50), 72 (50); 48.5 min; 3.03 scans/sec
group 12 238 (50), 226 (50), 97 (50), 83 (50), 72 (50); 52.0 min; 3.03 scans/sec
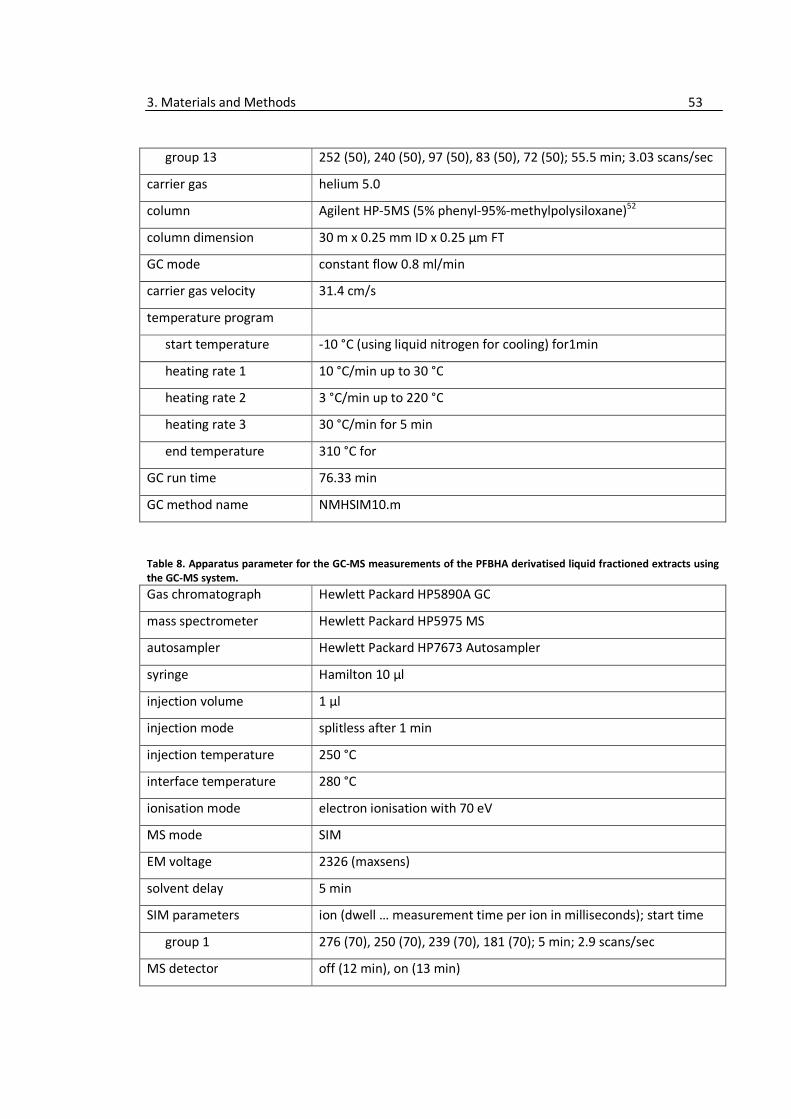
3. Materials and Methods 53
group 13 252 (50), 240 (50), 97 (50), 83 (50), 72 (50); 55.5 min; 3.03 scans/sec
carrier gas helium 5.0
column Agilent HP-5MS (5% phenyl-95%-methylpolysiloxane)52
column dimension 30 m x 0.25 mm ID x 0.25 µm FT
GC mode constant flow 0.8 ml/min
carrier gas velocity 31.4 cm/s
temperature program
start temperature -10 °C (using liquid nitrogen for cooling) for1min
heating rate 1 10 °C/min up to 30 °C
heating rate 2 3 °C/min up to 220 °C
heating rate 3 30 °C/min for 5 min
end temperature 310 °C for
GC run time 76.33 min
GC method name NMHSIM10.m
Table 8. Apparatus parameter for the GC-MS measurements of the PFBHA derivatised liquid fractioned extracts using
the GC-MS system.
Gas chromatograph Hewlett Packard HP5890A GC
mass spectrometer Hewlett Packard HP5975 MS
autosampler Hewlett Packard HP7673 Autosampler
syringe Hamilton 10 µl
injection volume 1 µl
injection mode splitless after 1 min
injection temperature 250 °C
interface temperature 280 °C
ionisation mode electron ionisation with 70 eV
MS mode SIM
EM voltage 2326 (maxsens)
solvent delay 5 min
SIM parameters ion (dwell … measurement time per ion in milliseconds); start time
group 1 276 (70), 250 (70), 239 (70), 181 (70); 5 min; 2.9 scans/sec
MS detector off (12 min), on (13 min)
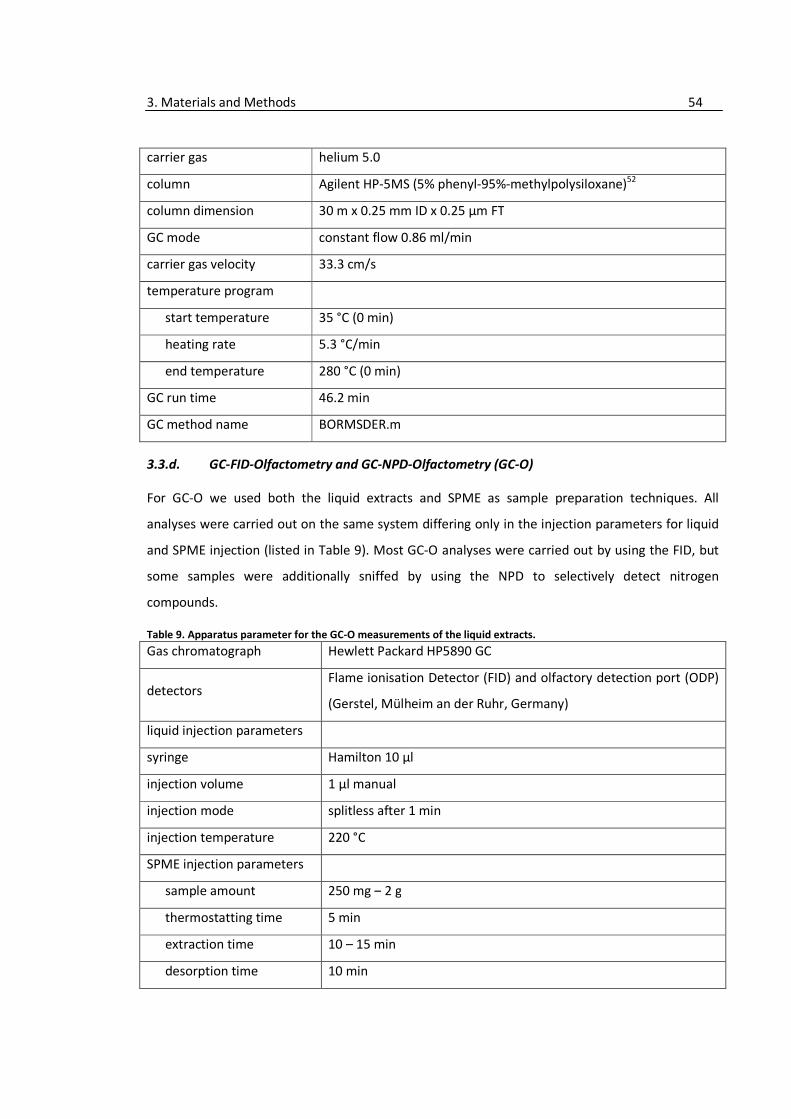
3. Materials and Methods 54
carrier gas helium 5.0
column Agilent HP-5MS (5% phenyl-95%-methylpolysiloxane)52
column dimension 30 m x 0.25 mm ID x 0.25 µm FT
GC mode constant flow 0.86 ml/min
carrier gas velocity 33.3 cm/s
temperature program
start temperature 35 °C (0 min)
heating rate 5.3 °C/min
end temperature 280 °C (0 min)
GC run time 46.2 min
GC method name BORMSDER.m
3.3.d. GC-FID-Olfactometry and GC-NPD-Olfactometry (GC-O)
For GC-O we used both the liquid extracts and SPME as sample preparation techniques. All
analyses were carried out on the same system differing only in the injection parameters for liquid
and SPME injection (listed in Table 9). Most GC-O analyses were carried out by using the FID, but
some samples were additionally sniffed by using the NPD to selectively detect nitrogen
compounds.
Table 9. Apparatus parameter for the GC-O measurements of the liquid extracts.
Gas chromatograph Hewlett Packard HP5890 GC
detectors Flame ionisation Detector (FID) and olfactory detection port (ODP)
(Gerstel, Mülheim an der Ruhr, Germany)
liquid injection parameters
syringe Hamilton 10 µl
injection volume 1 µl manual
injection mode splitless after 1 min
injection temperature 220 °C
SPME injection parameters
sample amount 250 mg – 2 g
thermostatting time 5 min
extraction time 10 – 15 min
desorption time 10 min
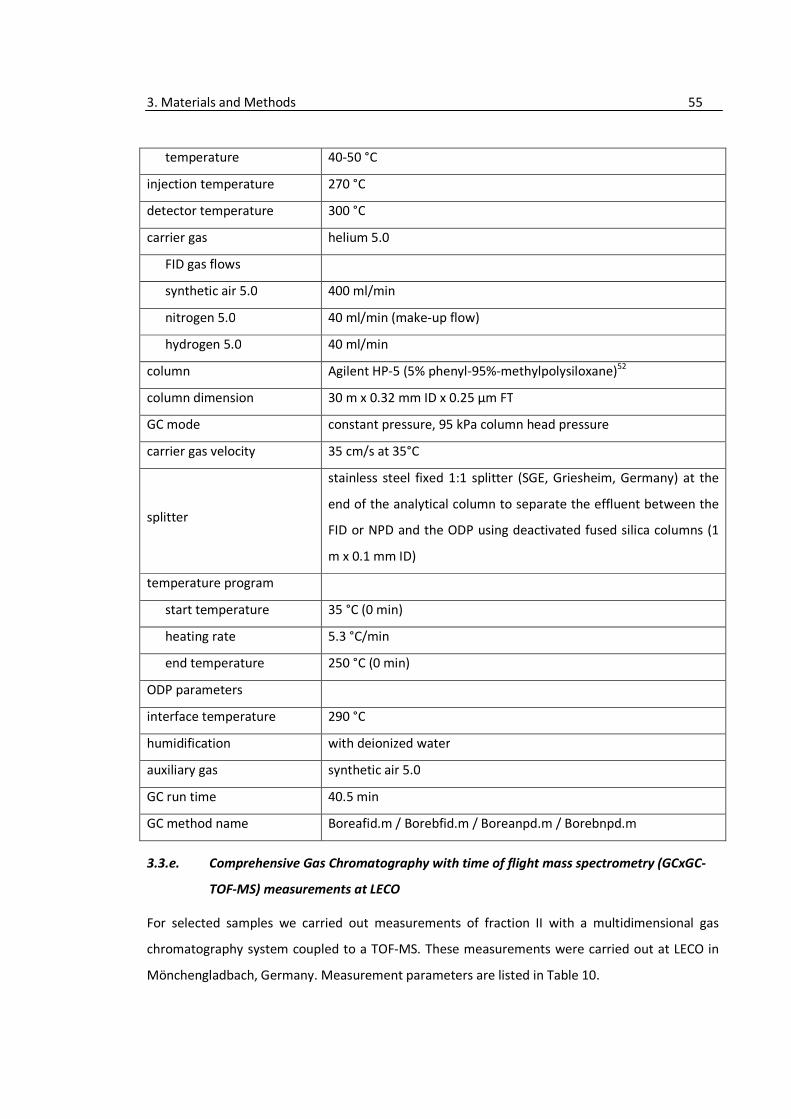
3. Materials and Methods 55
temperature 40-50 °C
injection temperature 270 °C
detector temperature 300 °C
carrier gas helium 5.0
FID gas flows
synthetic air 5.0 400 ml/min
nitrogen 5.0 40 ml/min (make-up flow)
hydrogen 5.0 40 ml/min
column Agilent HP-5 (5% phenyl-95%-methylpolysiloxane)52
column dimension 30 m x 0.32 mm ID x 0.25 µm FT
GC mode constant pressure, 95 kPa column head pressure
carrier gas velocity 35 cm/s at 35°C
splitter
stainless steel fixed 1:1 splitter (SGE, Griesheim, Germany) at the
end of the analytical column to separate the effluent between the
FID or NPD and the ODP using deactivated fused silica columns (1
m x 0.1 mm ID)
temperature program
start temperature 35 °C (0 min)
heating rate 5.3 °C/min
end temperature 250 °C (0 min)
ODP parameters
interface temperature 290 °C
humidification with deionized water
auxiliary gas synthetic air 5.0
GC run time 40.5 min
GC method name Boreafid.m / Borebfid.m / Boreanpd.m / Borebnpd.m
3.3.e. Comprehensive Gas Chromatography with time of flight mass spectrometry (GCxGC-
TOF-MS) measurements at LECO
For selected samples we carried out measurements of fraction II with a multidimensional gas
chromatography system coupled to a TOF-MS. These measurements were carried out at LECO in
Mönchengladbach, Germany. Measurement parameters are listed in Table 10.
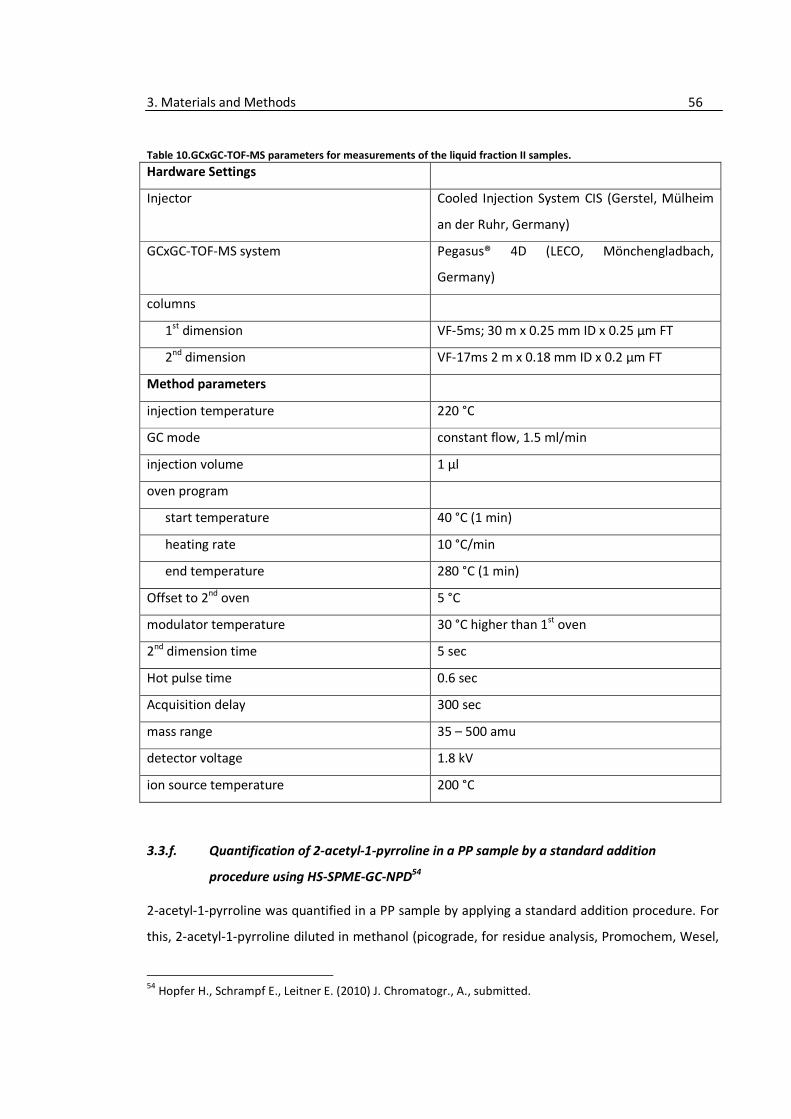
3. Materials and Methods 56
Table 10.GCxGC-TOF-MS parameters for measurements of the liquid fraction II samples.
Hardware Settings
Injector Cooled Injection System CIS (Gerstel, Mülheim
an der Ruhr, Germany)
GCxGC-TOF-MS system Pegasus® 4D (LECO, Mönchengladbach,
Germany)
columns
1st dimension VF-5ms; 30 m x 0.25 mm ID x 0.25 µm FT
2nd dimension VF-17ms 2 m x 0.18 mm ID x 0.2 µm FT
Method parameters
injection temperature 220 °C
GC mode constant flow, 1.5 ml/min
injection volume 1 µl
oven program
start temperature 40 °C (1 min)
heating rate 10 °C/min
end temperature 280 °C (1 min)
Offset to 2nd oven 5 °C
modulator temperature 30 °C higher than 1st oven
2nd dimension time 5 sec
Hot pulse time 0.6 sec
Acquisition delay 300 sec
mass range 35 – 500 amu
detector voltage 1.8 kV
ion source temperature 200 °C
3.3.f. Quantification of 2-acetyl-1-pyrroline in a PP sample by a standard addition
procedure using HS-SPME-GC-NPD54
2-acetyl-1-pyrroline was quantified in a PP sample by applying a standard addition procedure. For
this, 2-acetyl-1-pyrroline diluted in methanol (picograde, for residue analysis, Promochem, Wesel,
54
Hopfer H., Schrampf E., Leitner E. (2010) J. Chromatogr., A., submitted.
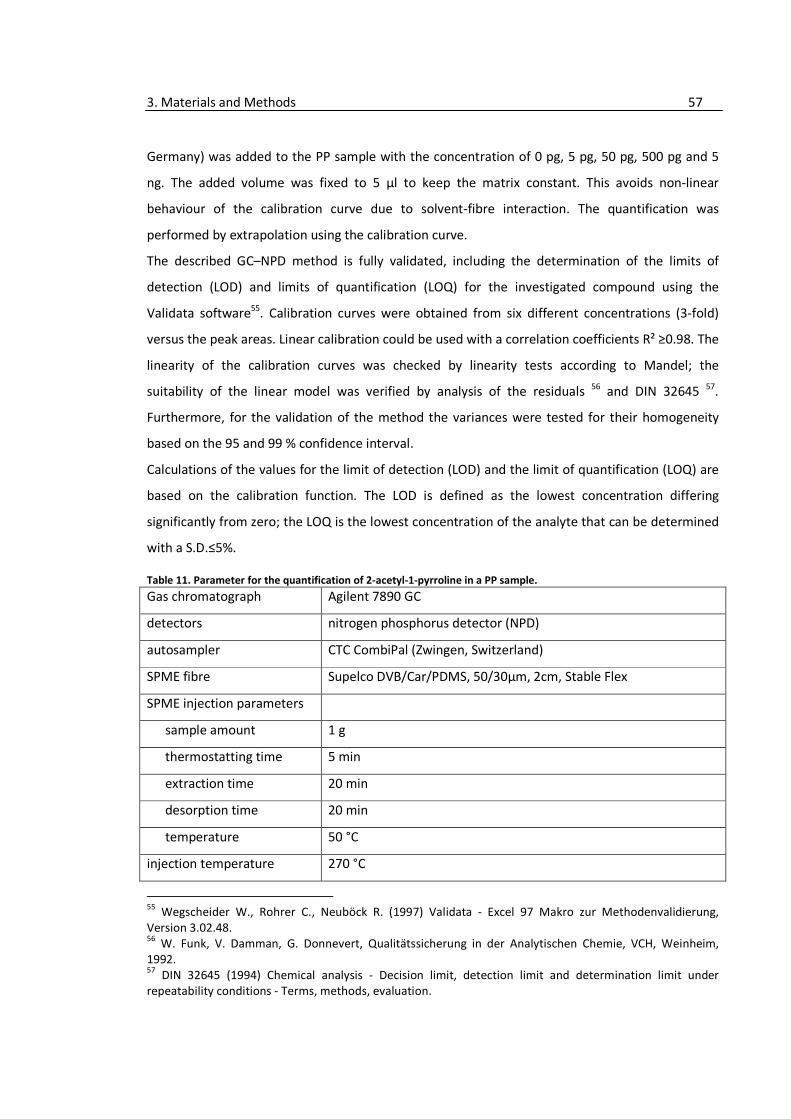
3. Materials and Methods 57
Germany) was added to the PP sample with the concentration of 0 pg, 5 pg, 50 pg, 500 pg and 5
ng. The added volume was fixed to 5 µl to keep the matrix constant. This avoids non-linear
behaviour of the calibration curve due to solvent-fibre interaction. The quantification was
performed by extrapolation using the calibration curve.
The described GC–NPD method is fully validated, including the determination of the limits of
detection (LOD) and limits of quantification (LOQ) for the investigated compound using the
Validata software55. Calibration curves were obtained from six different concentrations (3-fold)
versus the peak areas. Linear calibration could be used with a correlation coefficients R² ≥0.98. The
linearity of the calibration curves was checked by linearity tests according to Mandel; the
suitability of the linear model was verified by analysis of the residuals 56 and DIN 32645 57.
Furthermore, for the validation of the method the variances were tested for their homogeneity
based on the 95 and 99 % confidence interval.
Calculations of the values for the limit of detection (LOD) and the limit of quantification (LOQ) are
based on the calibration function. The LOD is defined as the lowest concentration differing
significantly from zero; the LOQ is the lowest concentration of the analyte that can be determined
with a S.D.≤5%.
Table 11. Parameter for the quantification of 2-acetyl-1-pyrroline in a PP sample.
Gas chromatograph Agilent 7890 GC
detectors nitrogen phosphorus detector (NPD)
autosampler CTC CombiPal (Zwingen, Switzerland)
SPME fibre Supelco DVB/Car/PDMS, 50/30µm, 2cm, Stable Flex
SPME injection parameters
sample amount 1 g
thermostatting time 5 min
extraction time 20 min
desorption time 20 min
temperature 50 °C
injection temperature 270 °C
55
Wegscheider W., Rohrer C., Neuböck R. (1997) Validata - Excel 97 Makro zur Methodenvalidierung,
Version 3.02.48. 56
W. Funk, V. Damman, G. Donnevert, Qualitätssicherung in der Analytischen Chemie, VCH, Weinheim,
1992. 57
DIN 32645 (1994) Chemical analysis - Decision limit, detection limit and determination limit under
repeatability conditions - Terms, methods, evaluation.
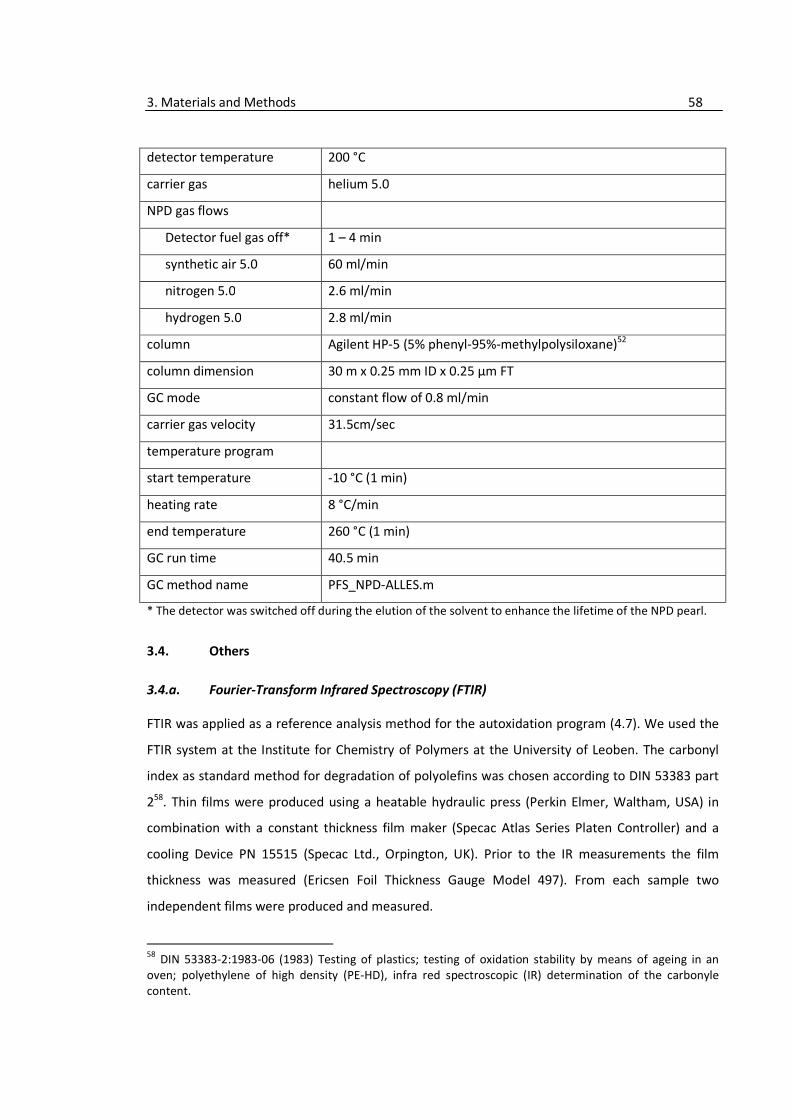
3. Materials and Methods 58
detector temperature 200 °C
carrier gas helium 5.0
NPD gas flows
Detector fuel gas off* 1 – 4 min
synthetic air 5.0 60 ml/min
nitrogen 5.0 2.6 ml/min
hydrogen 5.0 2.8 ml/min
column Agilent HP-5 (5% phenyl-95%-methylpolysiloxane)52
column dimension 30 m x 0.25 mm ID x 0.25 µm FT
GC mode constant flow of 0.8 ml/min
carrier gas velocity 31.5cm/sec
temperature program
start temperature -10 °C (1 min)
heating rate 8 °C/min
end temperature 260 °C (1 min)
GC run time 40.5 min
GC method name PFS_NPD-ALLES.m
* The detector was switched off during the elution of the solvent to enhance the lifetime of the NPD pearl.
3.4. Others
3.4.a. Fourier-Transform Infrared Spectroscopy (FTIR)
FTIR was applied as a reference analysis method for the autoxidation program (4.7). We used the
FTIR system at the Institute for Chemistry of Polymers at the University of Leoben. The carbonyl
index as standard method for degradation of polyolefins was chosen according to DIN 53383 part
258. Thin films were produced using a heatable hydraulic press (Perkin Elmer, Waltham, USA) in
combination with a constant thickness film maker (Specac Atlas Series Platen Controller) and a
cooling Device PN 15515 (Specac Ltd., Orpington, UK). Prior to the IR measurements the film
thickness was measured (Ericsen Foil Thickness Gauge Model 497). From each sample two
independent films were produced and measured.
58
DIN 53383-2:1983-06 (1983) Testing of plastics; testing of oxidation stability by means of ageing in an
oven; polyethylene of high density (PE-HD), infra red spectroscopic (IR) determination of the carbonyle
content.
3. Materials and Methods 59
The FTIR system “Spectrum One” was from Perkin Elmer (Waltham, USA).
A blank run was recorded at the beginning of each measurement day. All samples were measured
in 20 scans from 4000 to 500 cm-1 with a resolution of 4cm-1.
We calculated from all samples the so called Carbonyl Index (CI) according to 58. The CI is the ratio
of the peak height or peak area of the carbonyl νC=O peak at 1715 cm-1 to the δCH2 and δ aCH3
peak at 1456 cm-1. The more the polyolefin material is oxidized the higher the amount of carbonyl
groups gets and the lower the number of CH2 and CH3 groups gets. Thus, an increasing CI indicates
increasing oxidation.
3.4.b. Near Infrared Spectroscopy (NIR) with multivariate calibration
For the autoxidation program (4.7) we used the near infrared spectroscopy (NIR) with a
subsequent multivariate data analysis after we failed with the IR as a reference method. We used
the Thermo FT-NIR Antaris II system with an InGaAs detector. All samples were analysed as
powders using a spinning sample cup in a wave number range from 10,000 to 4,000 cm-1 applying
diffuse reflectance. 32 scans were recorded with a resolution of 8 cm-1. The achieved data was
used for a multivariate data analysis using the The Unscrambler software (Version 9.7) (Camo,
Norway).
3.5. Multivariate data analysis (MVDA)59
Multivariate data analysis (MVDA) is a useful tool for large quantities of data where the actual
information is scattered and hidden by non-usable junk, comparable to the background noise in a
MS system. Similar to the human brain, MVDA is able to filter the important information and to
classify it according to the given question. Additionally, MVDA presents this information in a way
which is easier for us to understand. Instead of n-dimensional matrices, data is shown graphically
so that similarities and underlying pattern are easier to recognise (e.g. Principal Component
Analysis (PCA) or Cluster Analysis).
MVDA is especially applied for analyses where large quantities of data are generated such as
spectroscopy. For example, recording a NIR spectrum in a wave number range from 1000 to 1700
nm with a resolution of 1 nm for one measurement 700 data points are recorded. Knowing that
for 20 samples at least 3 repeating measurements are normally recorded, one ends with 700 x 20 x
3 = 42,000 data points, a typical data set for MVDA.
59
Kessler W. (2007) Multivariate Datenanalyse für die Pharma-, Bio- und Prozessanalytik, Wiley-VCH,
Weinheim, Germany.

3. Materials and Methods 60
So for applying MVDA, one measures N objects with M properties or variables and gets a NxM
matrix.
Based on different data treatment methods one is able to get only qualitatively answers (e.g. how
different or how similar are my samples?) or in case of NIR also quantitatively answers can be
given by establishing a multivariate calibration model.
3.5.a. MasStat©
In this work we used MVDA solely for quantitative answers. In most cases we used the MasStat©
program from Analyt MTC (Version 3.02, Müllheim, Germany) for a qualitative cluster analysis of
GC-MS data. Important to mention is that it is recommended to use an automated sampler for the
GC-MS system to avoid large deviations in the retention time of the compounds in order to obtain
clear separated sample clusters. As the program is looking for differences in the recorded mass
ions based on intensity and/or retention time, one is interested to have the replica measurements
as similar as possible so that the program really uses only the differences between the samples
and not between the replica measurements of one sample. However, to ensure that the depicted
differences are really sample-driven, it is important to check if the shown information is really
present also in the original data.
For all programs MasStat© was used as described here:
1) Load all measured samples into the program
2) Indicate in the first run only which samples are replica measurements
3) Exclude prominent background and noise ions such as air (m/z 28 and 32) and siloxanes
(73, 77, 131, 147, 155, 207, 231, 271, 286)
4) Apply “normalized all peaks” instead of “raw data” to normalize all chromatograms and MS
spectra.
5) Steadily increase the number of ions used for the cluster analysis until no further change
can be observed (generally between 5 and 10).
6) Ask the system which ions make up the difference between the most extreme samples
(those with the biggest distance in between) and do this for all the other samples as well.
7) Use these ions for a check in the GC-MS analysis program and see which compounds these
ions have.
8) If the checked ions bear real sample differences, keep them, otherwise exclude those from
the cluster analysis.
3. Materials and Methods 61
In the ideal end one gets a sample cluster and is able to tell which compounds are responsible for
the differences.
3.5.b. The Unscrambler©
The software The Unscrambler© from Camo (Version 9.7, Oslo, Norway) was used for the MVDA
of the NIR measurements used in the autoxidation program (4.7) for the NIR data analysis.
All data was pre-treated with multiplicative scatter correction to minimise non-specific scatter
phenomena. Outlier detection was applied using Principal Component Analysis (PCA).
3.6. Sensory evaluation
3.6.a. Best Estimate Threshold (BET) determination
The question which odour-active compound is more “smelly” is answered by determination of
sensory threshold values. The sensory threshold values were determined applying the Best
Estimate Threshold (BET) procedure according to ASTM E6796.
The used sensory test panel consisted of 13 well trained panellists (26−45 years, 8 females, 5
males), whose ability to recognize the basic tastes sweet, sour, salty, and bitter was tested as a
basic requirement to act as panellist according to DIN 1096160.
The panellists were trained in several sessions prior to the threshold determination with the
substances of interests listed in Table 12 to get the panellists more familiar with the odours. For
this purpose, substances listed in Table 12 were first presented on filter paper strips dipped into
ethanolic solutions (1 vol%) and panellists were asked to describe the odour. The obtained
descriptors were collected and discussed with the panel.
Secondly, substances were presented in water (1 mg/L, 10 µg/L for 1-Hexen-3-one) and panellists
were asked again to describe the odour and to evaluate the perceived intensity compared to the
previous sample (0 … no difference in intensity, + … more intense, - … less intense than previous
sample). Differences between the descriptors obtained from the compounds in ethanolic solution
presented on strips and in the water were discussed with the panel.
For the determination of the sensory detection threshold the so called “Best Estimate Threshold”
(BET) procedure was applied according to ASTM 6796. BET values for each panellist as well as a
group BET were determined first in water.
60
DIN 10961:1996-08 (1996) Training of assessors for sensory analysis.
3. Materials and Methods 62
In a second stage, thresholds of those substances with lowest thresholds in water were
additionally determined in miglyol, a oil matrix consisting only of saturated fatty acids. The
maximum volume added to the matrix for the threshold determination was 50 µl of the
appropriate dilution. The threshold determination was carried out for the water values in plastic
cups and approx. 50 ml were presented to the panellists. For the values in miglyol blue coloured
standard olive oil testing glasses were used and approx. 5 ml of test solution was presented to the
panellists. The panellists were informed about the tested compound which was written on the
evaluation protocol as this should increase sensitivity according to O'Mahony61.
To determine the odour threshold of one compound, a series of six three-alternative forced choice
(3-AFC) tests was presented to the panellists at one time. Each triangle test contained two
odorant-free samples and one sample spiked with the compound of interest. According to the
ASTM standard6, the concentration of the odour compound was increased stepwise (factor 4-5)
with each triangle test. The panellists were asked to identify the differing sample for each triangle.
In addition, they were asked to describe the noticed difference in order to obtain information
about differences between detection and recognition threshold levels.
In every test session only one series of six 3-AFC tests was presented to the panellists. The BET for
the single panellists was calculated as the geometric mean from the highest concentration that
was not recognized as differing from the others and the lowest concentration that was identified
as differing from the other samples in the triangle. The group BET was derived by geometrical
averaging of the individual BET values. Information about the deviation of the determined BET
value was accessed by calculating the standard log deviation.
61
O'Mahony M. (1995) Food Qual. Prefer 6:227–238.

3. Materials and Methods 63
Table 12. Odour descriptors and odour thresholds in water and oil from the literature32
for the compounds which
sensory threshold values were determined.
Compound odour descriptors
previously reported odour
threshold in water b
or oil c (μg/L)
(E)-2-heptenal green, fatty, old oil-rancid, stink bug,
nuts, pungent 13 - 51 b
heptanal green, soapy, fatty, fresh, stink bug 3 – 550 b
octanal green, soapy, fatty, cardboard, metallic 0.41 – 250 b
decanal soapy, plastic, green, fruity-orange,
cleaning/washing detergent, fatty 0.1 – 245 b
nonanal
mouldy-cellar-earthy, cardboard, a bit
fruity, dusty, old chair/house, fatty, goat
stable
2.53 – 260 b
(E)-2-octenal (smashed) stink bug, green, fatty,
rancid, dusty, plastic 0.2 - 20 b
γ-octalactone coconut, sweet 7 - 14 b
(E)-2-decenal soapy, green, stink bug, pungent,
rancid, fatty 0.3 - 250 b
2,3-butandione butter, yoghurt, sour cream, milk, fatty,
sour milk 0.3 - 2300 b; 3 - 10 c
(E)-2-nonenal green, rancid, cucumber, stink bug,
fatty 0.08 - 0.4 b; 45 – 900 c
1-octen-3-one mushroom, forest soil-earthy, green,
road painting-zebra crossing 0.005 - 0.01 b; 3 - 10 c
1-hexen-3-one plastic, unpleasant-pungent, warm
burnt plastic, (carpet) glue, solvent 0.02 - 0.024 b; 5 c
a The descriptors were acquired from the panel in the training phase. Descriptors are listed in decreasing
number of entries given by the panellists. b Odour threshold in water
32.
c Odour threshold in different oils if
available32
.
3. Materials and Methods 64
3.6.b. Detection Frequency (SNIF)64,62
x Aroma Extract Dilution Analysis (AEDA)63
An evaluation of the odour-active compounds was accomplished by 4-6 trained panellists (5
females, 1 male, 25-45 years). All panellists are members of the in-house sensory panel and
specially trained for odour evaluation and description. Each sample is sniffed in one run by a single
panellist until all odour-active substances are eluted. A maximum of three runs per person and day
are carried out. Dilutions (1:100 and 1:1000 if necessary) are evaluated by three and, one judge,
respectively. Panellists were asked to state the odour impression which was recorded by activating
a microphone via the software (Gerstel ODP, Mülheim an der Ruhr, Germany).
A combination of Detection Frequency (surface of Nasal Impact SNIF) adapted from Linssen64 and
Pollien62 and the Aroma Extract Dilution Analysis (AEDA) adapted from Ulrich and Grosch63 has
been developed. All obtained olfactory chromatograms are graphically overlaid and normalized.
Compounds with SNIF-values of 80% and 100% for the pure extracts and all compounds detected
by one judge in the diluted samples are used for identification. The identification of the odour-
active compounds is made by comparison of experimental and literature Kováts' Retention Indices
(RI)34,35 with values from institute’s own RI database and internet databases65,66,67. For the
calculation of linear RI an n-alkane mix was analysed the same way as the samples. For comparison
and identification the RI of the odour-active compounds were calculated at the beginning of the
odour impression. Pre-tests showed that the comparability with reference databases is best when
RI are calculated at the starting time of odour impression. This is of enormous influence for highly
odour-active compounds eluting for a long time where RI span over 50 indices. A substance was
taken into account if the database value did not differ from the experimental value more than ± 5.
A periodically check of the GC-O system with a test mixture was carried out. With this mixture (1)
it was assured that the obtained RI are valid, (2) that the system itself (injector, column) does not
have polar sites which absorb analytes, and (3) that the GC is properly heating.
The mix was used both for liquid and SPME injections, where in the first case 1µl of a 10mg/L
solution and in the latter one 100ng in a HS vials were injected. In Table 13 the mixture
composition is listed together with the literature and measured RI. All values do not differ from
62
Pollien P., Ott A., Montigon F., Baumgartner M., Munoz-Box R., Chaintreau A. (1997) J Agr Food Chem
45:2630-2637. 63
Grosch W. (1994) Flav. Fragr. 9:147-158. 64
Linssen J.P.H., Janssens J.L.G.M., Roozen J.P., Posthumus M.A. (1993) Food Chem. 46:367-371. 65
Acree T., Arn H.(2004) Flavornet and human odor space, www.flavornet.org. Accessed 08/28/2009. 66
Mottram R., The LRI and Odour Database, www.odour.org.uk. Accessed 08/28/2009. 67
El-Sayed AM (2009) The Pherobase: Database of Insect Pheromones and Semiochemicals,
www.pherobase.com. Accessed 08/28/2009.
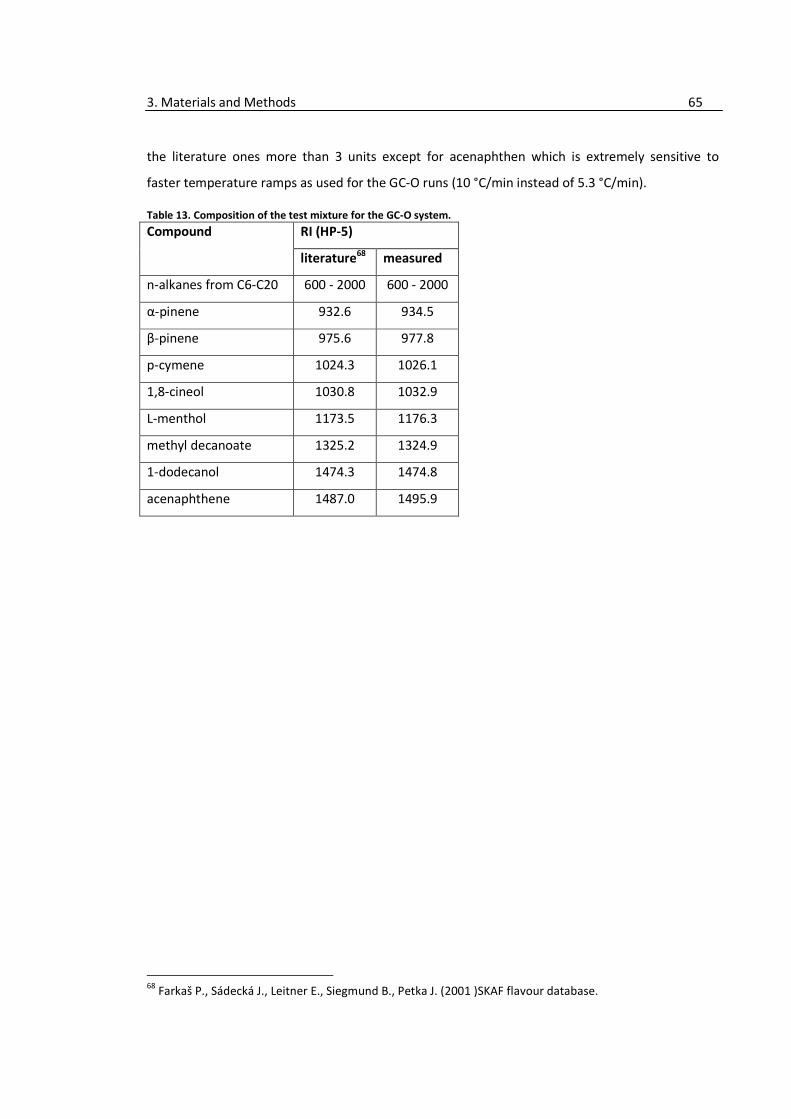
3. Materials and Methods 65
the literature ones more than 3 units except for acenaphthen which is extremely sensitive to
faster temperature ramps as used for the GC-O runs (10 °C/min instead of 5.3 °C/min).
Table 13. Composition of the test mixture for the GC-O system.
Compound RI (HP-5)
literature68
measured
n-alkanes from C6-C20 600 - 2000 600 - 2000
α-pinene 932.6 934.5
β-pinene 975.6 977.8
p-cymene 1024.3 1026.1
1,8-cineol 1030.8 1032.9
L-menthol 1173.5 1176.3
methyl decanoate 1325.2 1324.9
1-dodecanol 1474.3 1474.8
acenaphthene 1487.0 1495.9
68
Farkaš P., Sádecká J., Leitner E., Siegmund B., Petka J. (2001 )SKAF flavour database.
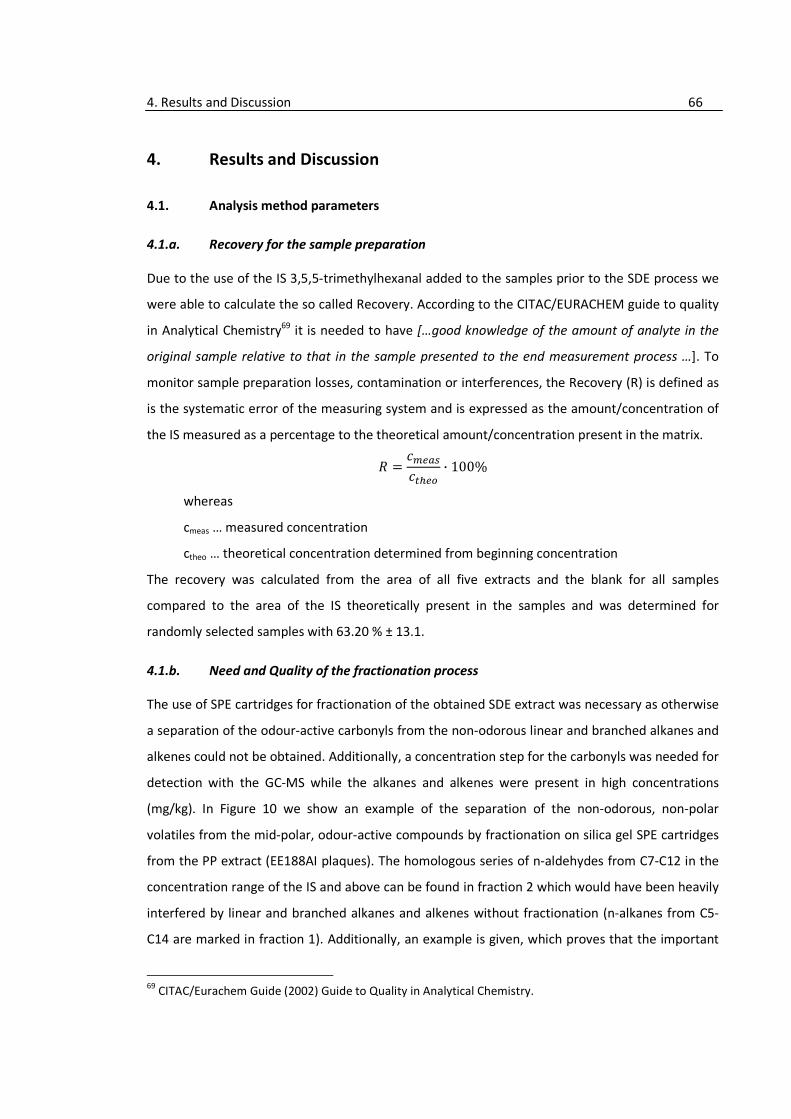
4. Results and Discussion 66
4. Results and Discussion
4.1. Analysis method parameters
4.1.a. Recovery for the sample preparation
Due to the use of the IS 3,5,5-trimethylhexanal added to the samples prior to the SDE process we
were able to calculate the so called Recovery. According to the CITAC/EURACHEM guide to quality
in Analytical Chemistry69 it is needed to have […good knowledge of the amount of analyte in the
original sample relative to that in the sample presented to the end measurement process …]. To
monitor sample preparation losses, contamination or interferences, the Recovery (R) is defined as
is the systematic error of the measuring system and is expressed as the amount/concentration of
the IS measured as a percentage to the theoretical amount/concentration present in the matrix.
� ��� !"
�#$ %· 100%
whereas
cmeas … measured concentration
ctheo … theoretical concentration determined from beginning concentration
The recovery was calculated from the area of all five extracts and the blank for all samples
compared to the area of the IS theoretically present in the samples and was determined for
randomly selected samples with 63.20 % ± 13.1.
4.1.b. Need and Quality of the fractionation process
The use of SPE cartridges for fractionation of the obtained SDE extract was necessary as otherwise
a separation of the odour-active carbonyls from the non-odorous linear and branched alkanes and
alkenes could not be obtained. Additionally, a concentration step for the carbonyls was needed for
detection with the GC-MS while the alkanes and alkenes were present in high concentrations
(mg/kg). In Figure 10 we show an example of the separation of the non-odorous, non-polar
volatiles from the mid-polar, odour-active compounds by fractionation on silica gel SPE cartridges
from the PP extract (EE188AI plaques). The homologous series of n-aldehydes from C7-C12 in the
concentration range of the IS and above can be found in fraction 2 which would have been heavily
interfered by linear and branched alkanes and alkenes without fractionation (n-alkanes from C5-
C14 are marked in fraction 1). Additionally, an example is given, which proves that the important
69
CITAC/Eurachem Guide (2002) Guide to Quality in Analytical Chemistry.
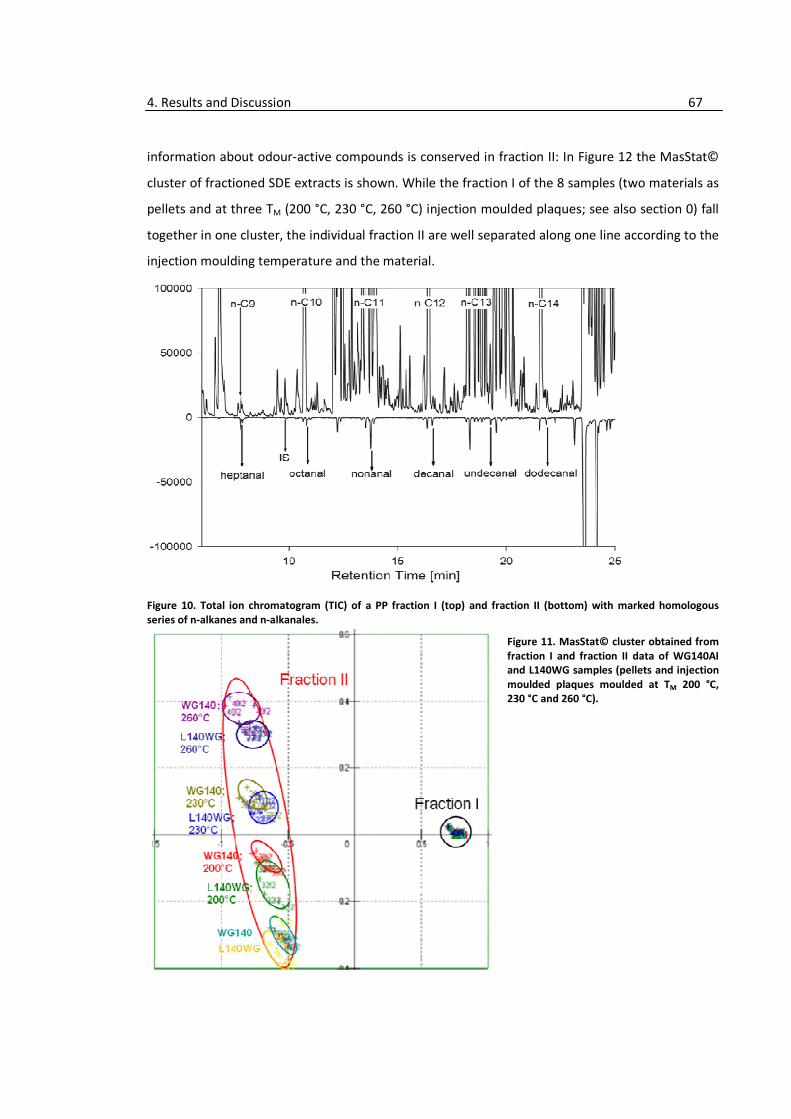
4. Results and Discussion 67
information about odour-active compounds is conserved in fraction II: In Figure 12 the MasStat©
cluster of fractioned SDE extracts is shown. While the fraction I of the 8 samples (two materials as
pellets and at three TM (200 °C, 230 °C, 260 °C) injection moulded plaques; see also section 0) fall
together in one cluster, the individual fraction II are well separated along one line according to the
injection moulding temperature and the material.
Figure 10. Total ion chromatogram (TIC) of a PP fraction I (top) and fraction II (bottom) with marked homologous
series of n-alkanes and n-alkanales.
Figure 11. MasStat© cluster obtained from
fraction I and fraction II data of WG140AI
and L140WG samples (pellets and injection
moulded plaques moulded at TM 200 °C,
230 °C and 260 °C).
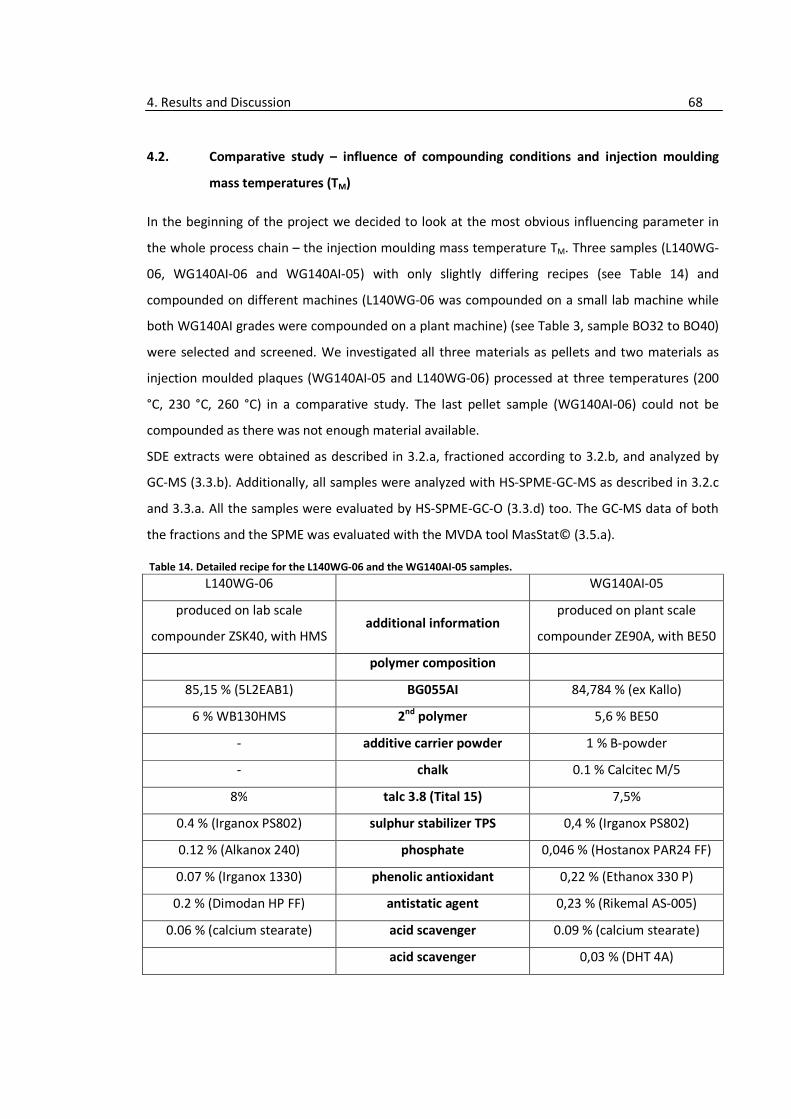
4. Results and Discussion 68
4.2. Comparative study – influence of compounding conditions and injection moulding
mass temperatures (TM)
In the beginning of the project we decided to look at the most obvious influencing parameter in
the whole process chain – the injection moulding mass temperature TM. Three samples (L140WG-
06, WG140AI-06 and WG140AI-05) with only slightly differing recipes (see Table 14) and
compounded on different machines (L140WG-06 was compounded on a small lab machine while
both WG140AI grades were compounded on a plant machine) (see Table 3, sample BO32 to BO40)
were selected and screened. We investigated all three materials as pellets and two materials as
injection moulded plaques (WG140AI-05 and L140WG-06) processed at three temperatures (200
°C, 230 °C, 260 °C) in a comparative study. The last pellet sample (WG140AI-06) could not be
compounded as there was not enough material available.
SDE extracts were obtained as described in 3.2.a, fractioned according to 3.2.b, and analyzed by
GC-MS (3.3.b). Additionally, all samples were analyzed with HS-SPME-GC-MS as described in 3.2.c
and 3.3.a. All the samples were evaluated by HS-SPME-GC-O (3.3.d) too. The GC-MS data of both
the fractions and the SPME was evaluated with the MVDA tool MasStat© (3.5.a).
Table 14. Detailed recipe for the L140WG-06 and the WG140AI-05 samples.
L140WG-06 WG140AI-05
produced on lab scale
compounder ZSK40, with HMS additional information
produced on plant scale
compounder ZE90A, with BE50
polymer composition
85,15 % (5L2EAB1) BG055AI 84,784 % (ex Kallo)
6 % WB130HMS 2nd
polymer 5,6 % BE50
- additive carrier powder 1 % B-powder
- chalk 0.1 % Calcitec M/5
8% talc 3.8 (Tital 15) 7,5%
0.4 % (Irganox PS802) sulphur stabilizer TPS 0,4 % (Irganox PS802)
0.12 % (Alkanox 240) phosphate 0,046 % (Hostanox PAR24 FF)
0.07 % (Irganox 1330) phenolic antioxidant 0,22 % (Ethanox 330 P)
0.2 % (Dimodan HP FF) antistatic agent 0,23 % (Rikemal AS-005)
0.06 % (calcium stearate) acid scavenger 0.09 % (calcium stearate)
acid scavenger 0,03 % (DHT 4A)
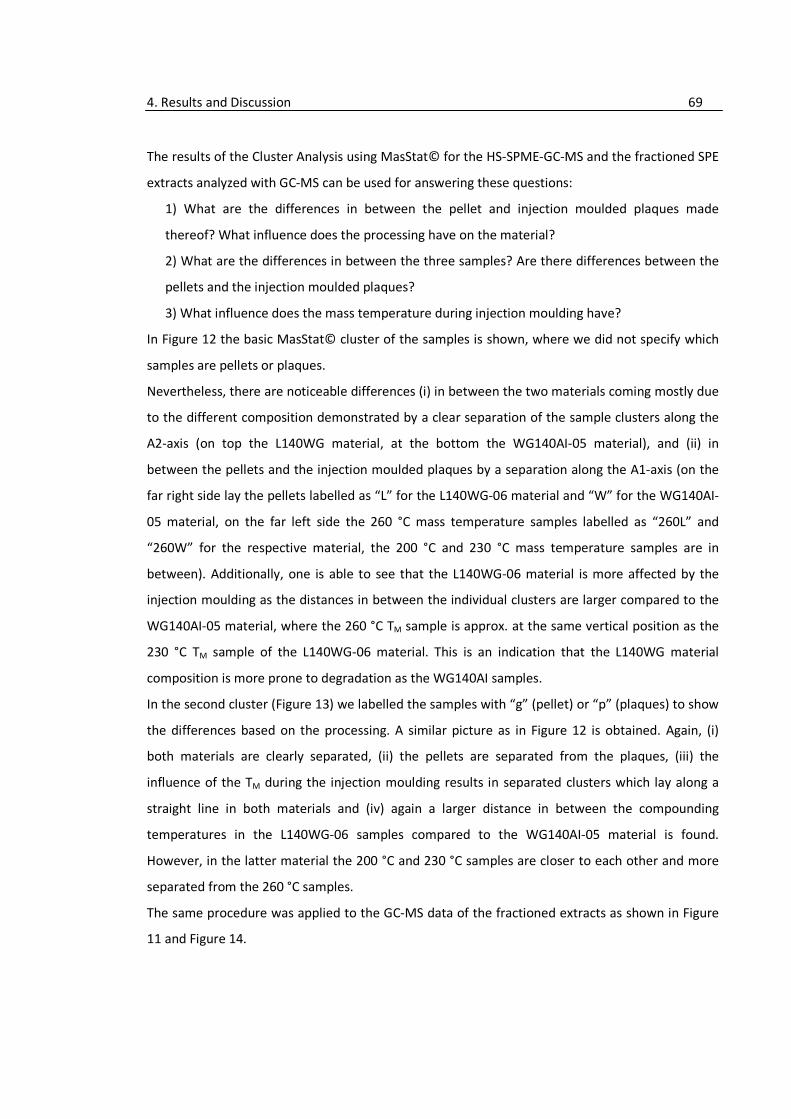
4. Results and Discussion 69
The results of the Cluster Analysis using MasStat© for the HS-SPME-GC-MS and the fractioned SPE
extracts analyzed with GC-MS can be used for answering these questions:
1) What are the differences in between the pellet and injection moulded plaques made
thereof? What influence does the processing have on the material?
2) What are the differences in between the three samples? Are there differences between the
pellets and the injection moulded plaques?
3) What influence does the mass temperature during injection moulding have?
In Figure 12 the basic MasStat© cluster of the samples is shown, where we did not specify which
samples are pellets or plaques.
Nevertheless, there are noticeable differences (i) in between the two materials coming mostly due
to the different composition demonstrated by a clear separation of the sample clusters along the
A2-axis (on top the L140WG material, at the bottom the WG140AI-05 material), and (ii) in
between the pellets and the injection moulded plaques by a separation along the A1-axis (on the
far right side lay the pellets labelled as “L” for the L140WG-06 material and “W” for the WG140AI-
05 material, on the far left side the 260 °C mass temperature samples labelled as “260L” and
“260W” for the respective material, the 200 °C and 230 °C mass temperature samples are in
between). Additionally, one is able to see that the L140WG-06 material is more affected by the
injection moulding as the distances in between the individual clusters are larger compared to the
WG140AI-05 material, where the 260 °C TM sample is approx. at the same vertical position as the
230 °C TM sample of the L140WG-06 material. This is an indication that the L140WG material
composition is more prone to degradation as the WG140AI samples.
In the second cluster (Figure 13) we labelled the samples with “g” (pellet) or “p” (plaques) to show
the differences based on the processing. A similar picture as in Figure 12 is obtained. Again, (i)
both materials are clearly separated, (ii) the pellets are separated from the plaques, (iii) the
influence of the TM during the injection moulding results in separated clusters which lay along a
straight line in both materials and (iv) again a larger distance in between the compounding
temperatures in the L140WG-06 samples compared to the WG140AI-05 material is found.
However, in the latter material the 200 °C and 230 °C samples are closer to each other and more
separated from the 260 °C samples.
The same procedure was applied to the GC-MS data of the fractioned extracts as shown in Figure
11 and Figure 14.
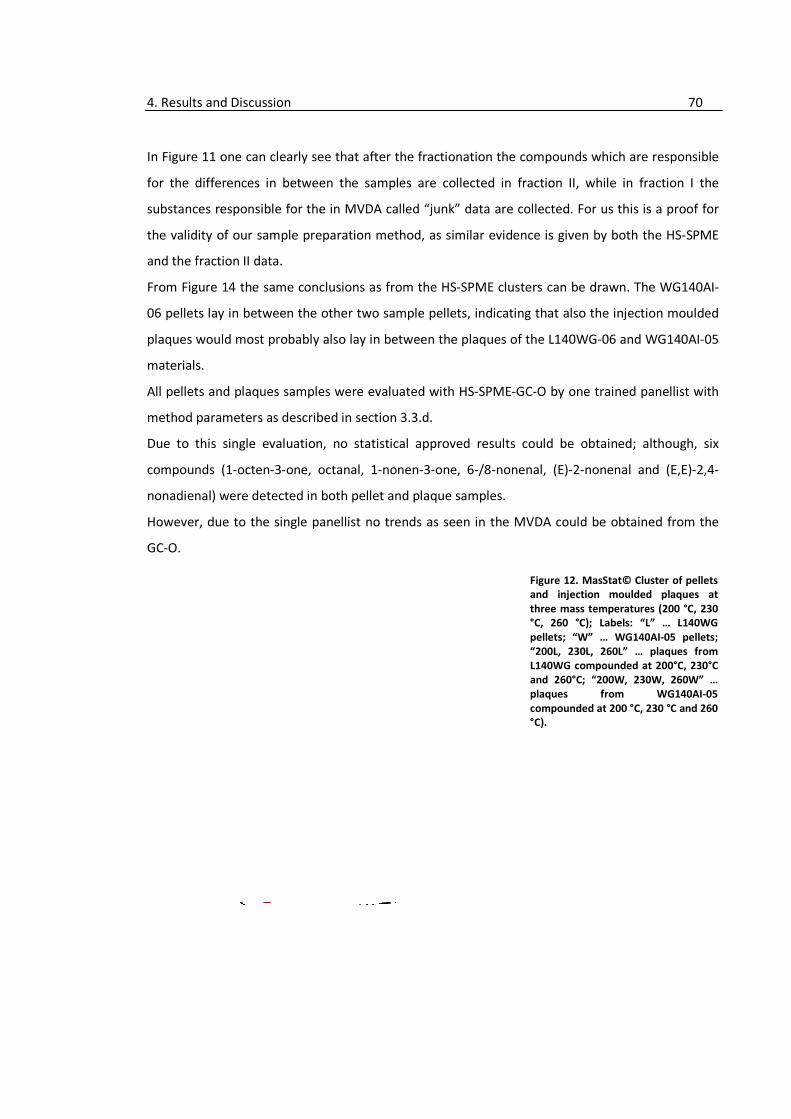
4. Results and Discussion 70
In Figure 11 one can clearly see that after the fractionation the compounds which are responsible
for the differences in between the samples are collected in fraction II, while in fraction I the
substances responsible for the in MVDA called “junk” data are collected. For us this is a proof for
the validity of our sample preparation method, as similar evidence is given by both the HS-SPME
and the fraction II data.
From Figure 14 the same conclusions as from the HS-SPME clusters can be drawn. The WG140AI-
06 pellets lay in between the other two sample pellets, indicating that also the injection moulded
plaques would most probably also lay in between the plaques of the L140WG-06 and WG140AI-05
materials.
All pellets and plaques samples were evaluated with HS-SPME-GC-O by one trained panellist with
method parameters as described in section 3.3.d.
Due to this single evaluation, no statistical approved results could be obtained; although, six
compounds (1-octen-3-one, octanal, 1-nonen-3-one, 6-/8-nonenal, (E)-2-nonenal and (E,E)-2,4-
nonadienal) were detected in both pellet and plaque samples.
However, due to the single panellist no trends as seen in the MVDA could be obtained from the
GC-O.
Figure 12. MasStat© Cluster of pellets
and injection moulded plaques at
three mass temperatures (200 °C, 230
°C, 260 °C); Labels: “L” … L140WG
pellets; “W” … WG140AI-05 pellets;
“200L, 230L, 260L” … plaques from
L140WG compounded at 200°C, 230°C
and 260°C; “200W, 230W, 260W” …
plaques from WG140AI-05
compounded at 200 °C, 230 °C and 260
°C).
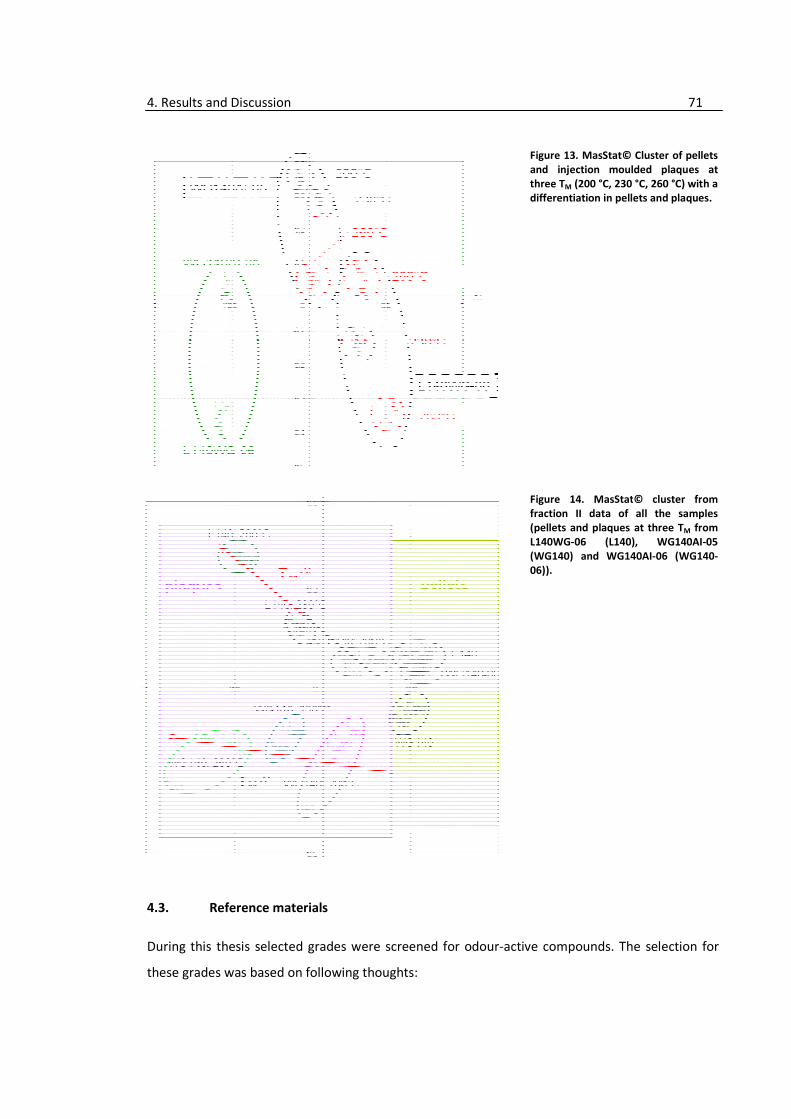
4. Results and Discussion 71
Figure 13. MasStat© Cluster of pellets
and injection moulded plaques at
three TM (200 °C, 230 °C, 260 °C) with a
differentiation in pellets and plaques.
Figure 14. MasStat© cluster from
fraction II data of all the samples
(pellets and plaques at three TM from
L140WG-06 (L140), WG140AI-05
(WG140) and WG140AI-06 (WG140-
06)).
4.3. Reference materials
During this thesis selected grades were screened for odour-active compounds. The selection for
these grades was based on following thoughts:
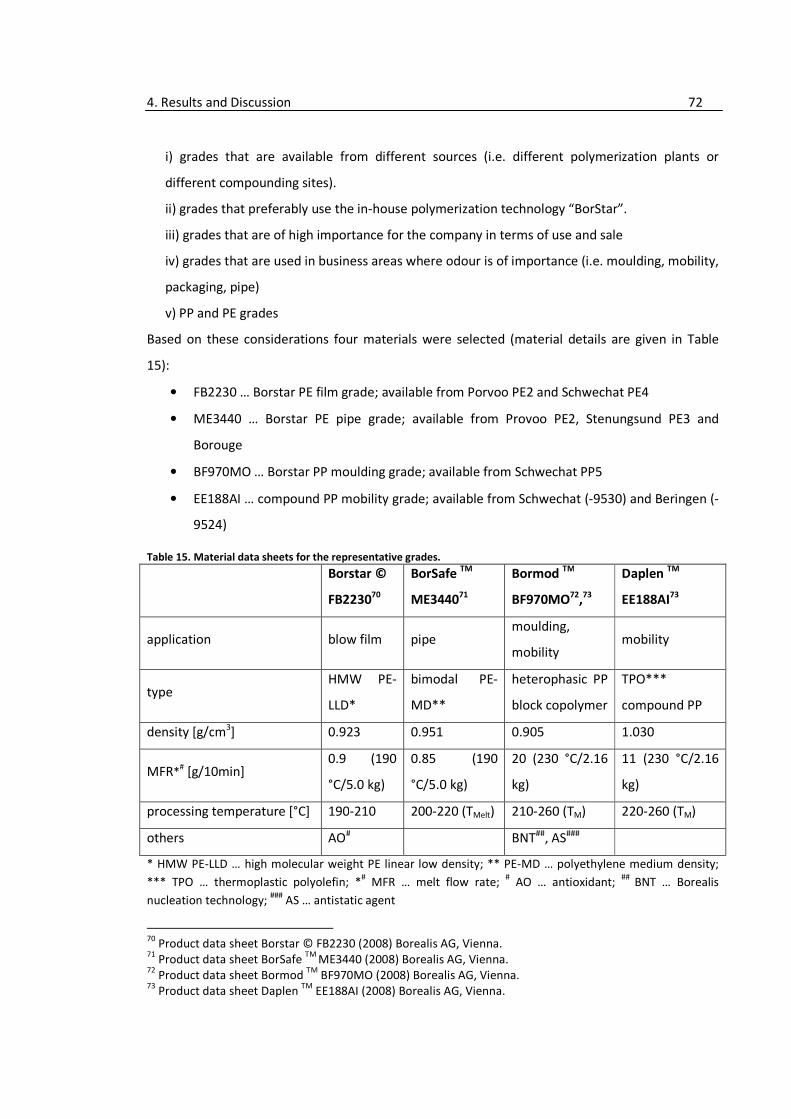
4. Results and Discussion 72
i) grades that are available from different sources (i.e. different polymerization plants or
different compounding sites).
ii) grades that preferably use the in-house polymerization technology “BorStar”.
iii) grades that are of high importance for the company in terms of use and sale
iv) grades that are used in business areas where odour is of importance (i.e. moulding, mobility,
packaging, pipe)
v) PP and PE grades
Based on these considerations four materials were selected (material details are given in Table
15):
• FB2230 … Borstar PE film grade; available from Porvoo PE2 and Schwechat PE4
• ME3440 … Borstar PE pipe grade; available from Provoo PE2, Stenungsund PE3 and
Borouge
• BF970MO … Borstar PP moulding grade; available from Schwechat PP5
• EE188AI … compound PP mobility grade; available from Schwechat (-9530) and Beringen (-
9524)
Table 15. Material data sheets for the representative grades.
Borstar ©
FB223070
BorSafe TM
ME344071
Bormod TM
BF970MO72
,73
Daplen TM
EE188AI73
application blow film pipe moulding,
mobility mobility
type HMW PE-
LLD*
bimodal PE-
MD**
heterophasic PP
block copolymer
TPO***
compound PP
density [g/cm3] 0.923 0.951 0.905 1.030
MFR*# [g/10min]
0.9 (190
°C/5.0 kg)
0.85 (190
°C/5.0 kg)
20 (230 °C/2.16
kg)
11 (230 °C/2.16
kg)
processing temperature [°C] 190-210 200-220 (TMelt) 210-260 (TM) 220-260 (TM)
others AO# BNT##, AS###
* HMW PE-LLD … high molecular weight PE linear low density; ** PE-MD … polyethylene medium density;
*** TPO … thermoplastic polyolefin; *# MFR … melt flow rate;
# AO … antioxidant;
## BNT … Borealis
nucleation technology; ###
AS … antistatic agent
70
Product data sheet Borstar © FB2230 (2008) Borealis AG, Vienna. 71
Product data sheet BorSafe TM
ME3440 (2008) Borealis AG, Vienna. 72
Product data sheet Bormod TM
BF970MO (2008) Borealis AG, Vienna. 73
Product data sheet Daplen TM
EE188AI (2008) Borealis AG, Vienna.

4. Results and Discussion 73
Apart from the ME3440 and one FB2230 grade, for all materials both pellets and plaques were
evaluated. For the EE188AI grade also the respective base polymers were screened for odour-
active compounds. The FB2230 from Porvoo PE2 arrived in the second year and ME3440 was
investigated in year three, while all other samples were evaluated in the first year of the thesis.
In the following sections the results obtained from GC-O with subsequent MVDA and the GC-O
with subsequent Detection Frequency (see section 3.6.b) evaluation using the liquid extract are
discussed. For the GC-O discussion it must be mentioned that all odour-active compounds could
be resolved well with exception of the RI area between 1095 and 1104 due to several reasons:
(1) In that area several compounds elute very close to each other; namely (E) 4-, (E + Z) 6-, 8-
nonenal and nonanal with RI of 1096, 1095.1, 1101.2, 1096.5, 1104.6.
(2) Additionally, are the odour impressions of these substances similar; all of them are
described as fatty, burnt, waxy, plastic
(3) All the nonenals show very low sensory thresholds as shown in Table 24and
Table 25 resulting in very intense and long-lasting odour impressions. The less intense nonanal
was frequently masked by the other compounds. In most cases different odour impressions
were not separated but more moved into the next one, thus making a clear separation
impossible.
4.3.a. Results of the MVDA of the Detection Frequency results.
We applied multivariate data analysis (MVDA) with the Unscrambler© program on the detection
frequency results (see section 3.6.b) to get a better picture about differences and similarities
between the samples. For that we took all the 80 % and 100 % SNIF values together with the
corresponding RI for all samples and rated the 100 % values with 2 and the 80 % values with 1, if a
sample neither had 80 or 100 % SNIF value for the corresponding RI the values was set to 0.
Information about processing type (pellet or plaques) as well as material type (PE or PP) was
added as category variables.
The result of the MVDA is shown in Figure 15 a clear distinction between PE (on the left side) and
PP (on the right side) can be made as well as a clear separation between pellets (G) and plaques
(P) for the same material.
Both E188AI pellets from Beringen and Schwechat are more separated from each other while the
plaques are relatively close to each other. The pellets and plaques originating from Schwechat are
more separated from each other than the Beringen ones. This is an indicator that the differences
in between the pellets and plaques from Schwechat are larger maybe due to a higher amount or
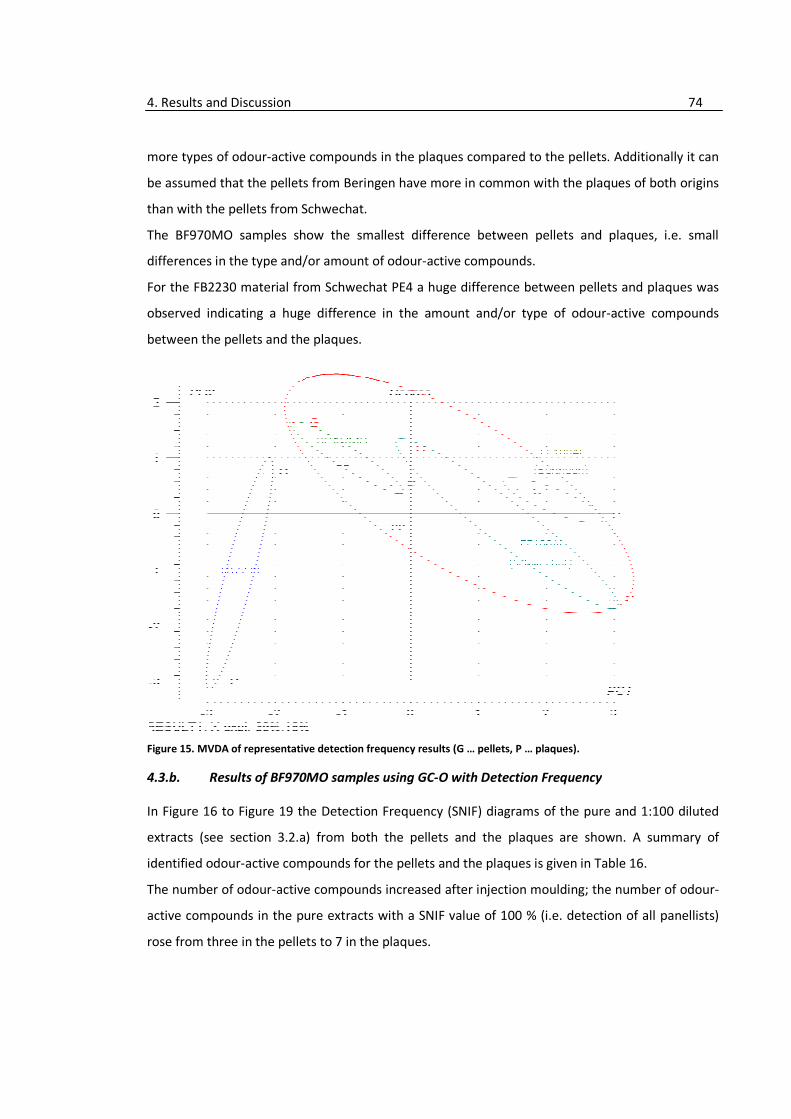
4. Results and Discussion
more types of odour-active compounds in the plaques compared to the pellets. Additionally it can
be assumed that the pellets from Beringen have more in common with
than with the pellets from Schwechat.
The BF970MO samples show the smallest difference between pellets and plaques, i.e. small
differences in the type and/or amount of odour
For the FB2230 material
observed indicating a huge difference in the amount and/or type of odour
between the pellets and the plaques
Figure 15. MVDA of representative detection
4.3.b. Results of BF970MO
In Figure 16 to Figure
extracts (see section 3.2.a
identified odour-active compounds for the pellets
The number of odour-active compounds increased after i
active compounds in the pure extracts with a SNIF value of 100
rose from three in the pellets to 7 in the plaques.
Results and Discussion
active compounds in the plaques compared to the pellets. Additionally it can
be assumed that the pellets from Beringen have more in common with
than with the pellets from Schwechat.
The BF970MO samples show the smallest difference between pellets and plaques, i.e. small
differences in the type and/or amount of odour-active compounds.
For the FB2230 material from Schwechat PE4 a huge difference between pellets and plaques was
observed indicating a huge difference in the amount and/or type of odour
between the pellets and the plaques.
. MVDA of representative detection frequency results (G … pellets, P … plaques).
BF970MO samples using GC-O with Detection Frequency
Figure 19 the Detection Frequency (SNIF) diagrams of the pure and 1:100 diluted
3.2.a) from both the pellets and the plaques are shown. A summary of
active compounds for the pellets and the plaques is given in
active compounds increased after injection moulding
active compounds in the pure extracts with a SNIF value of 100 % (i.e. detec
rose from three in the pellets to 7 in the plaques.
74
active compounds in the plaques compared to the pellets. Additionally it can
be assumed that the pellets from Beringen have more in common with the plaques of both origins
The BF970MO samples show the smallest difference between pellets and plaques, i.e. small
a huge difference between pellets and plaques was
observed indicating a huge difference in the amount and/or type of odour-active compounds
frequency results (G … pellets, P … plaques).
O with Detection Frequency
diagrams of the pure and 1:100 diluted
from both the pellets and the plaques are shown. A summary of
is given in Table 16.
oulding; the number of odour-
% (i.e. detection of all panellists)
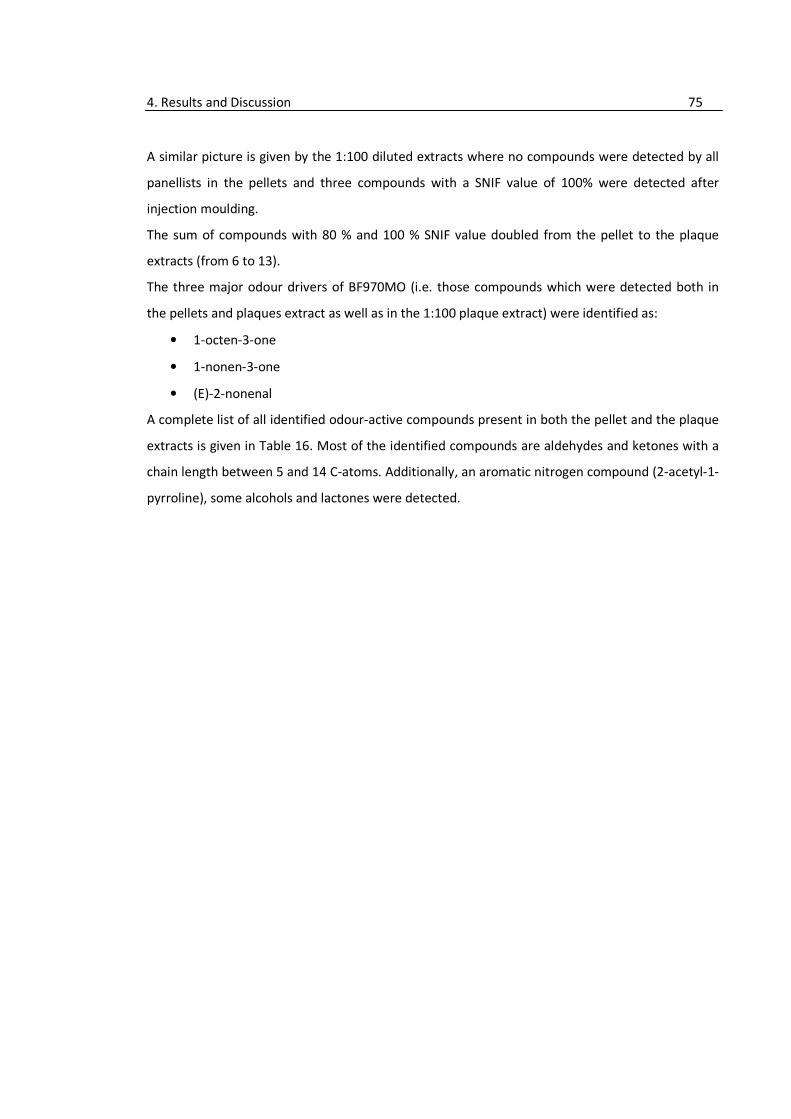
4. Results and Discussion 75
A similar picture is given by the 1:100 diluted extracts where no compounds were detected by all
panellists in the pellets and three compounds with a SNIF value of 100% were detected after
injection moulding.
The sum of compounds with 80 % and 100 % SNIF value doubled from the pellet to the plaque
extracts (from 6 to 13).
The three major odour drivers of BF970MO (i.e. those compounds which were detected both in
the pellets and plaques extract as well as in the 1:100 plaque extract) were identified as:
• 1-octen-3-one
• 1-nonen-3-one
• (E)-2-nonenal
A complete list of all identified odour-active compounds present in both the pellet and the plaque
extracts is given in Table 16. Most of the identified compounds are aldehydes and ketones with a
chain length between 5 and 14 C-atoms. Additionally, an aromatic nitrogen compound (2-acetyl-1-
pyrroline), some alcohols and lactones were detected.
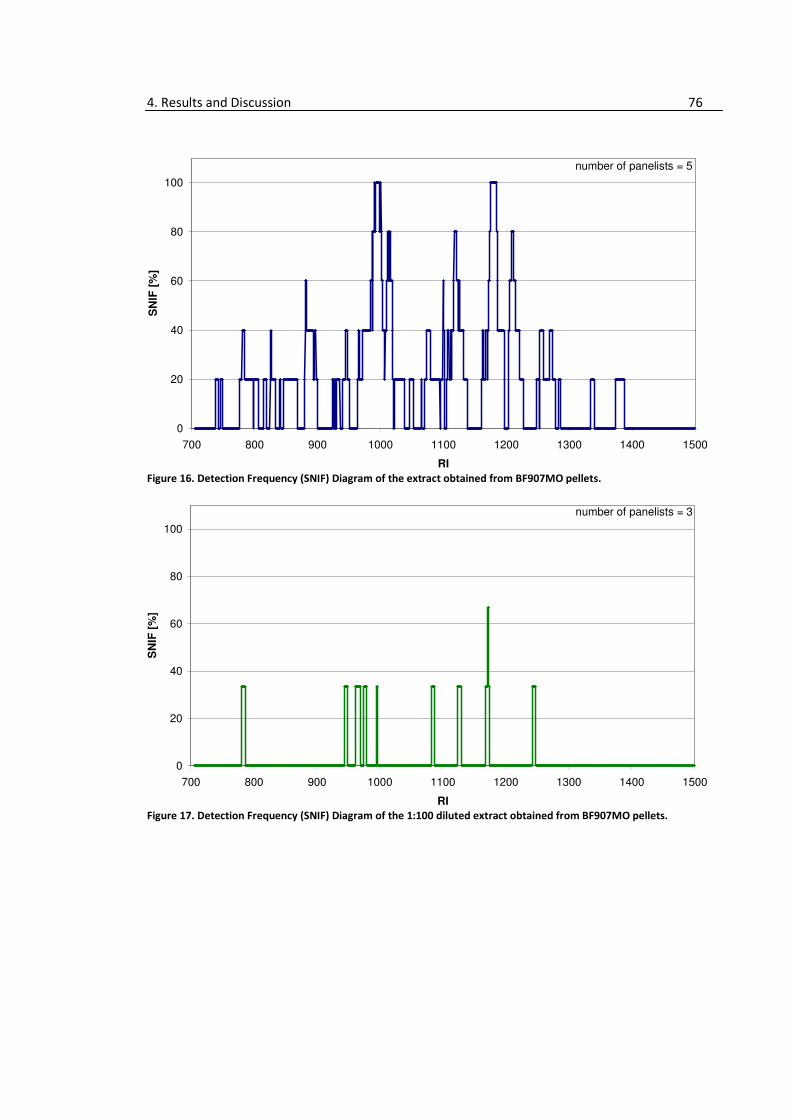
4. Results and Discussion 76
Figure 16. Detection Frequency (SNIF) Diagram of the extract obtained from BF907MO pellets.
Figure 17. Detection Frequency (SNIF) Diagram of the 1:100 diluted extract obtained from BF907MO pellets.
0
20
40
60
80
100
700 800 900 1000 1100 1200 1300 1400 1500
RI
SN
IF [
%]
number of panelists = 5
0
20
40
60
80
100
700 800 900 1000 1100 1200 1300 1400 1500
RI
SN
IF [
%]
number of panelists = 3
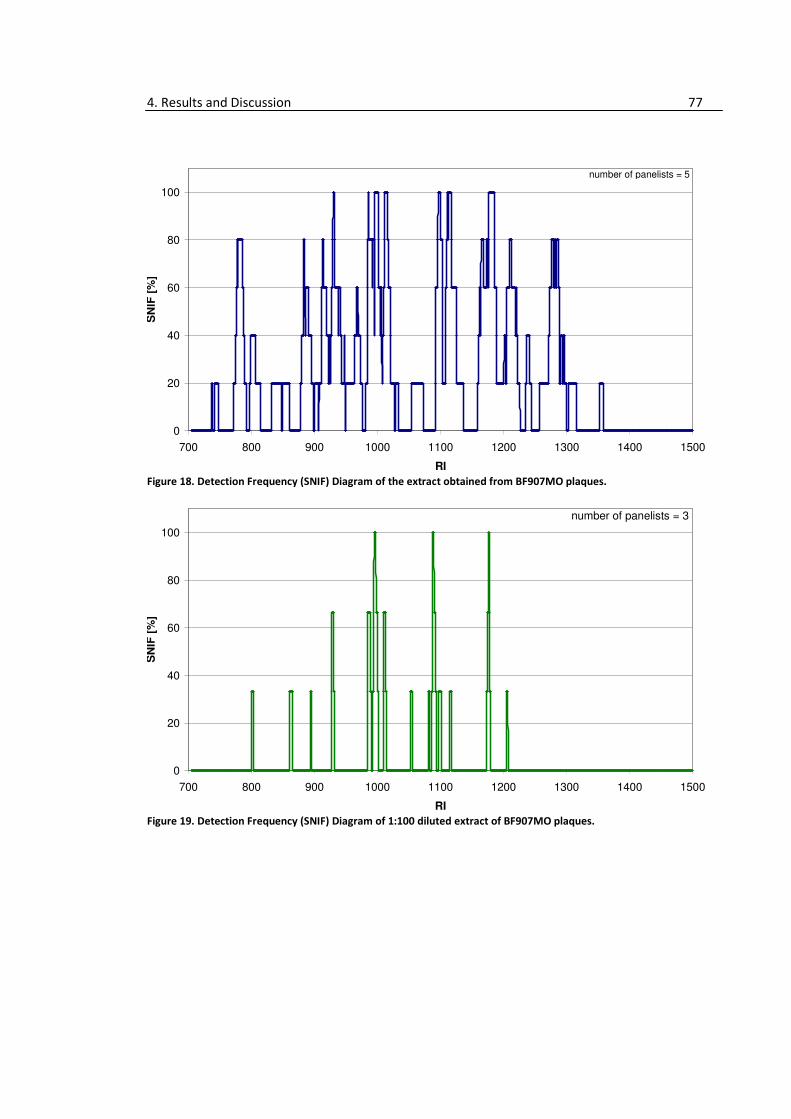
4. Results and Discussion 77
Figure 18. Detection Frequency (SNIF) Diagram of the extract obtained from BF907MO plaques.
Figure 19. Detection Frequency (SNIF) Diagram of 1:100 diluted extract of BF907MO plaques.
0
20
40
60
80
100
700 800 900 1000 1100 1200 1300 1400 1500
RI
SN
IF [
%]
number of panelists = 5
0
20
40
60
80
100
700 800 900 1000 1100 1200 1300 1400 1500
RI
SN
IF [
%]
number of panelists = 3
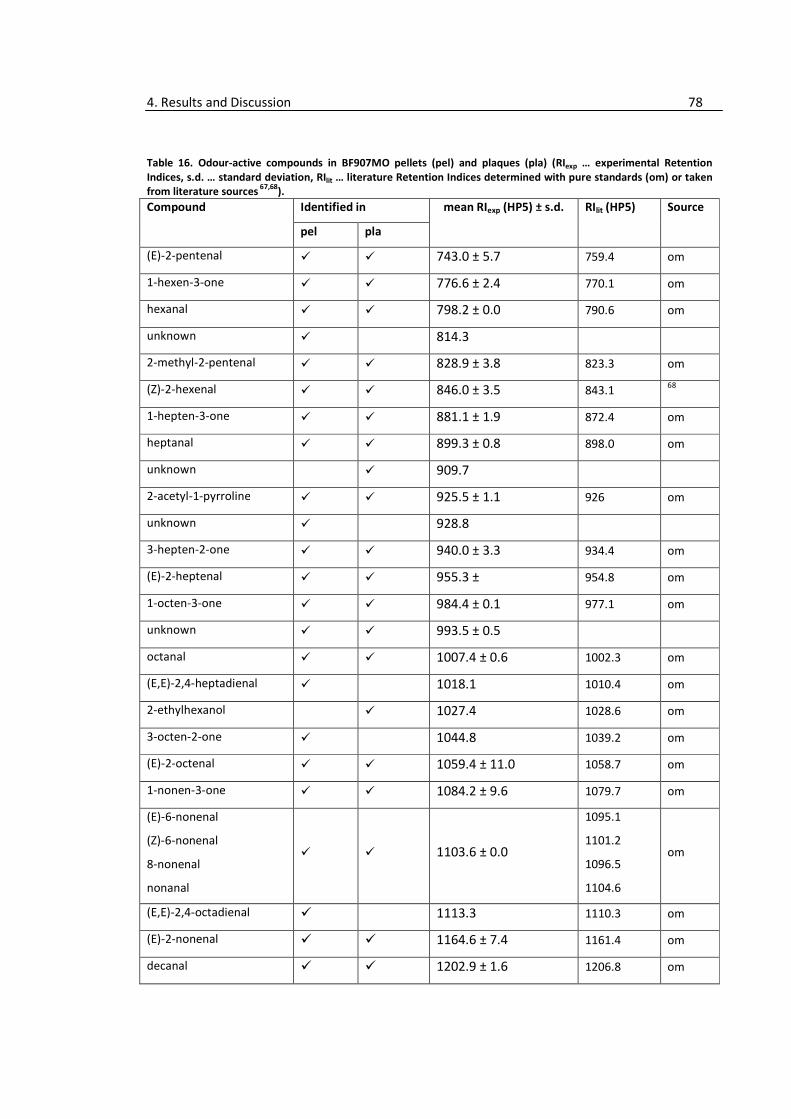
4. Results and Discussion 78
Table 16. Odour-active compounds in BF907MO pellets (pel) and plaques (pla) (RIexp … experimental Retention
Indices, s.d. … standard deviation, RIlit … literature Retention Indices determined with pure standards (om) or taken
from literature sources 67,68
).
Compound Identified in mean RIexp (HP5) ± s.d. RIlit (HP5) Source
pel pla
(E)-2-pentenal � � 743.0 ± 5.7 759.4 om
1-hexen-3-one � � 776.6 ± 2.4 770.1 om
hexanal � � 798.2 ± 0.0 790.6 om
unknown � 814.3
2-methyl-2-pentenal � � 828.9 ± 3.8 823.3 om
(Z)-2-hexenal � � 846.0 ± 3.5 843.1 68
1-hepten-3-one � � 881.1 ± 1.9 872.4 om
heptanal � � 899.3 ± 0.8 898.0 om
unknown � 909.7
2-acetyl-1-pyrroline � � 925.5 ± 1.1 926 om
unknown � 928.8
3-hepten-2-one � � 940.0 ± 3.3 934.4 om
(E)-2-heptenal � � 955.3 ± 954.8 om
1-octen-3-one � � 984.4 ± 0.1 977.1 om
unknown � � 993.5 ± 0.5
octanal � � 1007.4 ± 0.6 1002.3 om
(E,E)-2,4-heptadienal � 1018.1 1010.4 om
2-ethylhexanol � 1027.4 1028.6 om
3-octen-2-one � 1044.8 1039.2 om
(E)-2-octenal � � 1059.4 ± 11.0 1058.7 om
1-nonen-3-one � � 1084.2 ± 9.6 1079.7 om
(E)-6-nonenal
(Z)-6-nonenal
8-nonenal
nonanal
� � 1103.6 ± 0.0
1095.1
1101.2
1096.5
1104.6
om
(E,E)-2,4-octadienal � 1113.3 1110.3 om
(E)-2-nonenal � � 1164.6 ± 7.4 1161.4 om
decanal � � 1202.9 ± 1.6 1206.8 om
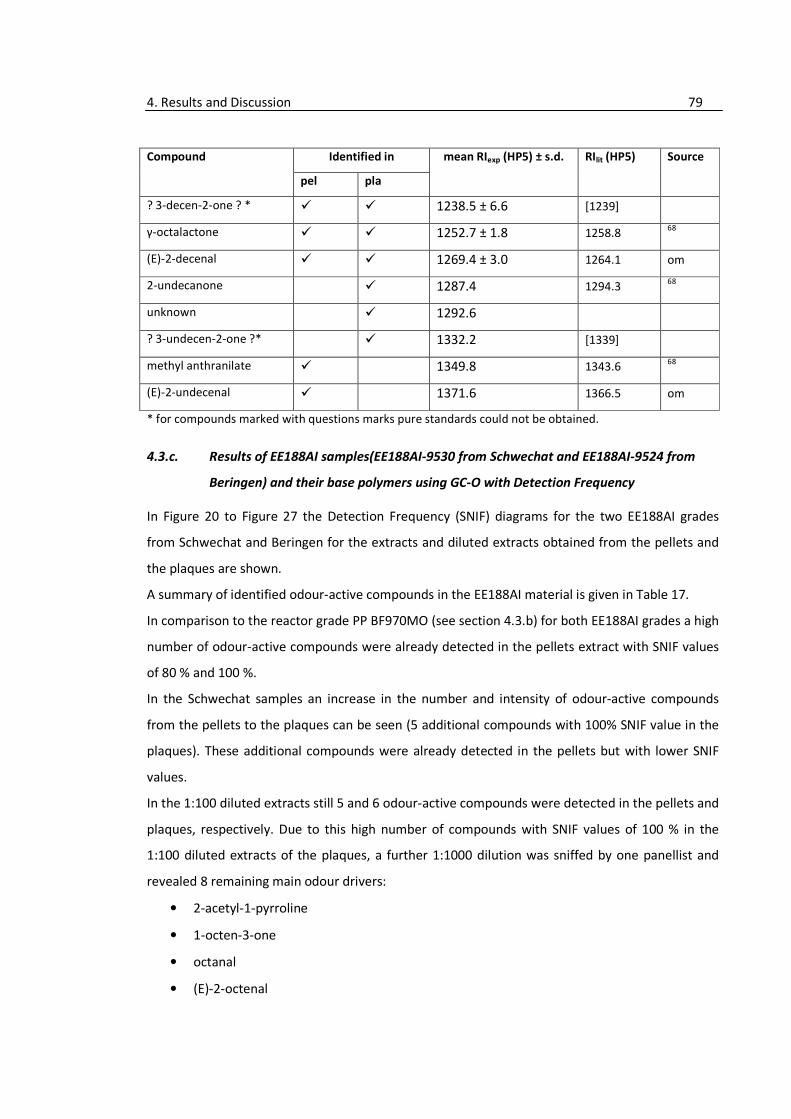
4. Results and Discussion 79
Compound Identified in mean RIexp (HP5) ± s.d. RIlit (HP5) Source
pel pla
? 3-decen-2-one ? * � � 1238.5 ± 6.6 [1239]
γ-octalactone � � 1252.7 ± 1.8 1258.8 68
(E)-2-decenal � � 1269.4 ± 3.0 1264.1 om
2-undecanone � 1287.4 1294.3 68
unknown � 1292.6
? 3-undecen-2-one ?* � 1332.2 [1339]
methyl anthranilate � 1349.8 1343.6 68
(E)-2-undecenal � 1371.6 1366.5 om
* for compounds marked with questions marks pure standards could not be obtained.
4.3.c. Results of EE188AI samples(EE188AI-9530 from Schwechat and EE188AI-9524 from
Beringen) and their base polymers using GC-O with Detection Frequency
In Figure 20 to Figure 27 the Detection Frequency (SNIF) diagrams for the two EE188AI grades
from Schwechat and Beringen for the extracts and diluted extracts obtained from the pellets and
the plaques are shown.
A summary of identified odour-active compounds in the EE188AI material is given in Table 17.
In comparison to the reactor grade PP BF970MO (see section 4.3.b) for both EE188AI grades a high
number of odour-active compounds were already detected in the pellets extract with SNIF values
of 80 % and 100 %.
In the Schwechat samples an increase in the number and intensity of odour-active compounds
from the pellets to the plaques can be seen (5 additional compounds with 100% SNIF value in the
plaques). These additional compounds were already detected in the pellets but with lower SNIF
values.
In the 1:100 diluted extracts still 5 and 6 odour-active compounds were detected in the pellets and
plaques, respectively. Due to this high number of compounds with SNIF values of 100 % in the
1:100 diluted extracts of the plaques, a further 1:1000 dilution was sniffed by one panellist and
revealed 8 remaining main odour drivers:
• 2-acetyl-1-pyrroline
• 1-octen-3-one
• octanal
• (E)-2-octenal
4. Results and Discussion 80
• 1-nonen-3-one
• 6-/ 8-nonenal
• (E)-2-nonenal
• decanal
In the Beringen samples a similar conclusion can be drawn: Again, a high number of odour-active
compounds was detected by 80 % and 100 % of the panellists already in the pellets. After
injections moulding two additional odour-active compounds with a 100 % SNIF value were
detected in the plaque extract compared to the pellet extract (7 compounds with 100 % SNIF
value).
In the 1:100 diluted extracts the difference between the pellets and the plaques was more
pronounced: instead of two compounds with 100 % SNIF detected in the pellets, 8 compounds
with high odour relevancy (i.e. SNIF value of 100 %) could be detected by all panellists in the
plaque sample.
This discrepancy between the pure and the 1:100 diluted extract is most probably due to the high
odour intensity of the extract: The compounds cannot be fully resolved by the panellist before the
next odour-active compound is already eluting; every breath increases the risk of missing out
compounds.
By diluting the extract this problem becomes less prone and odour detection is easier due to
clearly separated odour impressions.
Evaluation of the 1:1000 diluted extract obtained from the plaque extract by one panellist
revealed 6 remaining main odour drivers:
• heptanal
• octanal
• 1-nonen-3-one
• 6-/ 8-nonenal
• (E)-2-nonenal
• decanal
By comparing the two EE188AI materials some dissimilarity can be found:
(i) although most odour-active compounds are the same, differences in intensity (i.e.
concentration) were detected (e.g.: 1-octen-3-one was present in the 1:1000 diluted
Schwechat extract while not detected in the Beringen extract).
4. Results and Discussion 81
(ii) For the 1:1000 diluted extracts the Schwechat sample showed one compound more and
also their concentration seems to be higher (e.g. 2-acteyl-1-pyrroline vanished in the Beringen
sample but not in the Schwechat sample in the 1:1000 diluted extracts).
In Figure 28 a direct comparison of the SNIF diagrams of the pure extracts obtained from the
EE188AI pellets from Schwechat and Beringen is shown. The SNIF pattern look very similar,
however, some differences can be found. All these compounds are highly odour-active and were
all detected in the highest dilution of the extract obtained from the plaques, indicating that (1)
these substances survive during the injection moulding,(2) most probably are further generated
during the injection moulding of the pellets to the plaques, and (3) are known to be oxidation
products and/or generated during elevated temperatures (i.e. 2-acetyl-1-pyrroline is a typical
Maillard reaction product in food where during heating the compound forms from a reducing
sugar and an amino acid).
• The Schwechat sample shows higher SNIF values (i.e. higher amounts) in
o hexanal (RI 790)
o 2-acetyl-1-pyrroline (RI 926)
o 1-octen-3-one (RI 978)
• The Beringen sample shows higher SNIF values (i.e. higher amounts) in
o 1-hexen-3-one (RI 779)
o 1-nonen-3-one (RI 1079)
o (E)-2-decenal (RI 1255)
During compounding of the EE188AI samples from Beringen the base polymers (i.e. those which
are used in the formulation) were collected, injection moulded into plaques and analyzed as well.
The samples are BS2581, a PE-HD, BE677AI, a mobility compound PP and EF015AE, a PP.
The samples were extracted and evaluated with GC-O as described in section 3. The resulting
Detection Frequency (SNIF) diagrams are shown in Figure 29 – Figure 34.
Similar conclusion as in the EE188AI compound PP can be drawn:
1) The same substances turn up in both the pellets and plaques (e.g. compare the SNIF diagrams of
BS2581 in Figure 29 - Figure 30).
2) These odour-active substances are more intense (i.e. higher concentrated) in the plaques
indicated by broader SNIF areas in the SNIF diagrams (see Figure 29 - Figure 30).
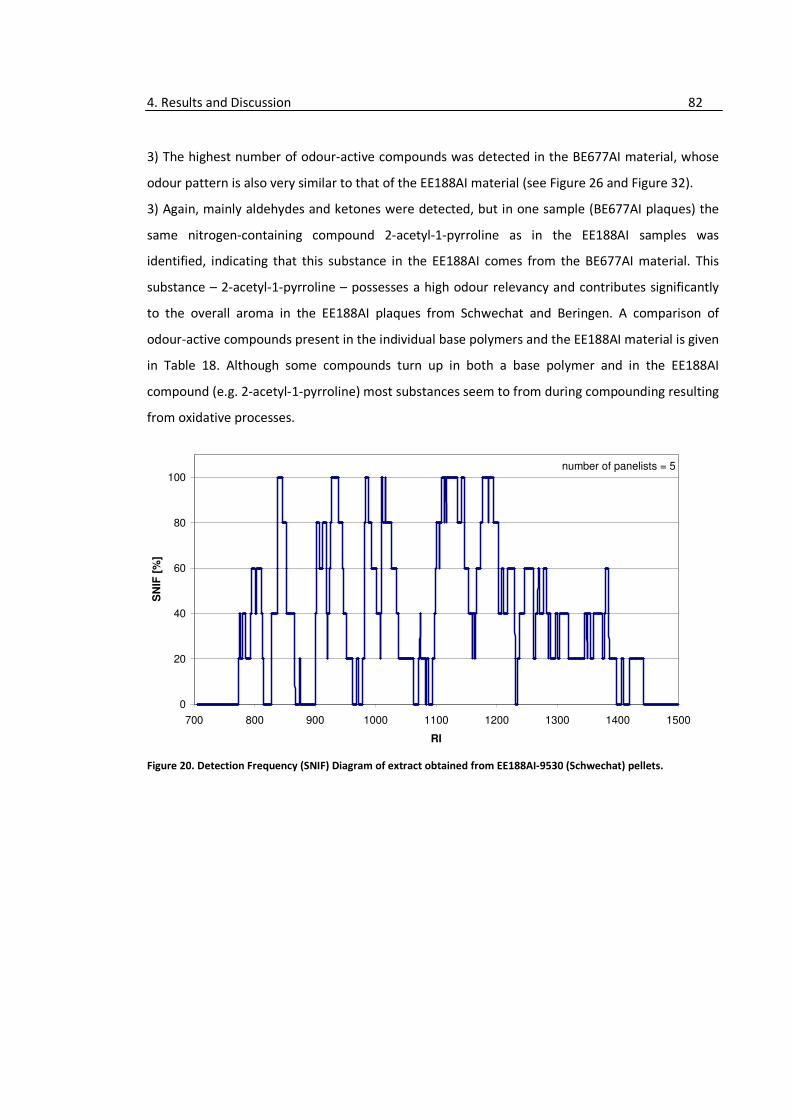
4. Results and Discussion 82
3) The highest number of odour-active compounds was detected in the BE677AI material, whose
odour pattern is also very similar to that of the EE188AI material (see Figure 26 and Figure 32).
3) Again, mainly aldehydes and ketones were detected, but in one sample (BE677AI plaques) the
same nitrogen-containing compound 2-acetyl-1-pyrroline as in the EE188AI samples was
identified, indicating that this substance in the EE188AI comes from the BE677AI material. This
substance – 2-acetyl-1-pyrroline – possesses a high odour relevancy and contributes significantly
to the overall aroma in the EE188AI plaques from Schwechat and Beringen. A comparison of
odour-active compounds present in the individual base polymers and the EE188AI material is given
in Table 18. Although some compounds turn up in both a base polymer and in the EE188AI
compound (e.g. 2-acetyl-1-pyrroline) most substances seem to from during compounding resulting
from oxidative processes.
Figure 20. Detection Frequency (SNIF) Diagram of extract obtained from EE188AI-9530 (Schwechat) pellets.
0
20
40
60
80
100
700 800 900 1000 1100 1200 1300 1400 1500
RI
SN
IF [
%]
number of panelists = 5
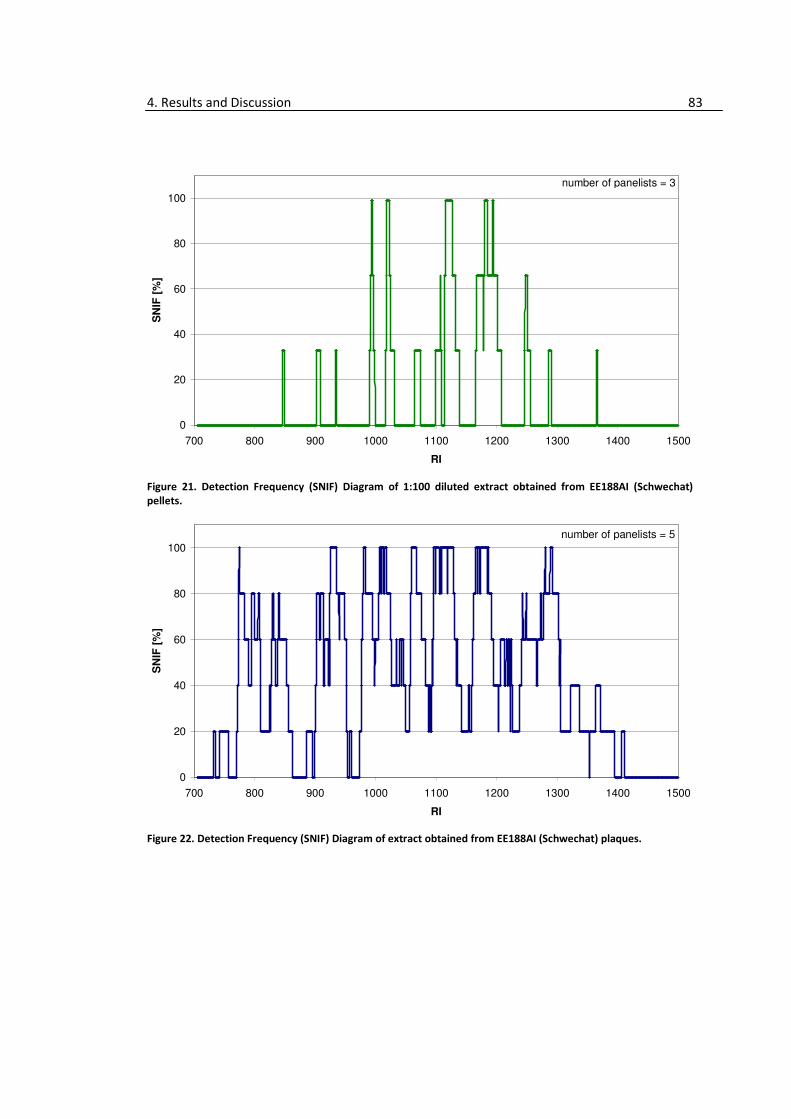
4. Results and Discussion 83
Figure 21. Detection Frequency (SNIF) Diagram of 1:100 diluted extract obtained from EE188AI (Schwechat)
pellets.
Figure 22. Detection Frequency (SNIF) Diagram of extract obtained from EE188AI (Schwechat) plaques.
0
20
40
60
80
100
700 800 900 1000 1100 1200 1300 1400 1500
RI
SN
IF [
%]
number of panelists = 3
0
20
40
60
80
100
700 800 900 1000 1100 1200 1300 1400 1500
RI
SN
IF [
%]
number of panelists = 5
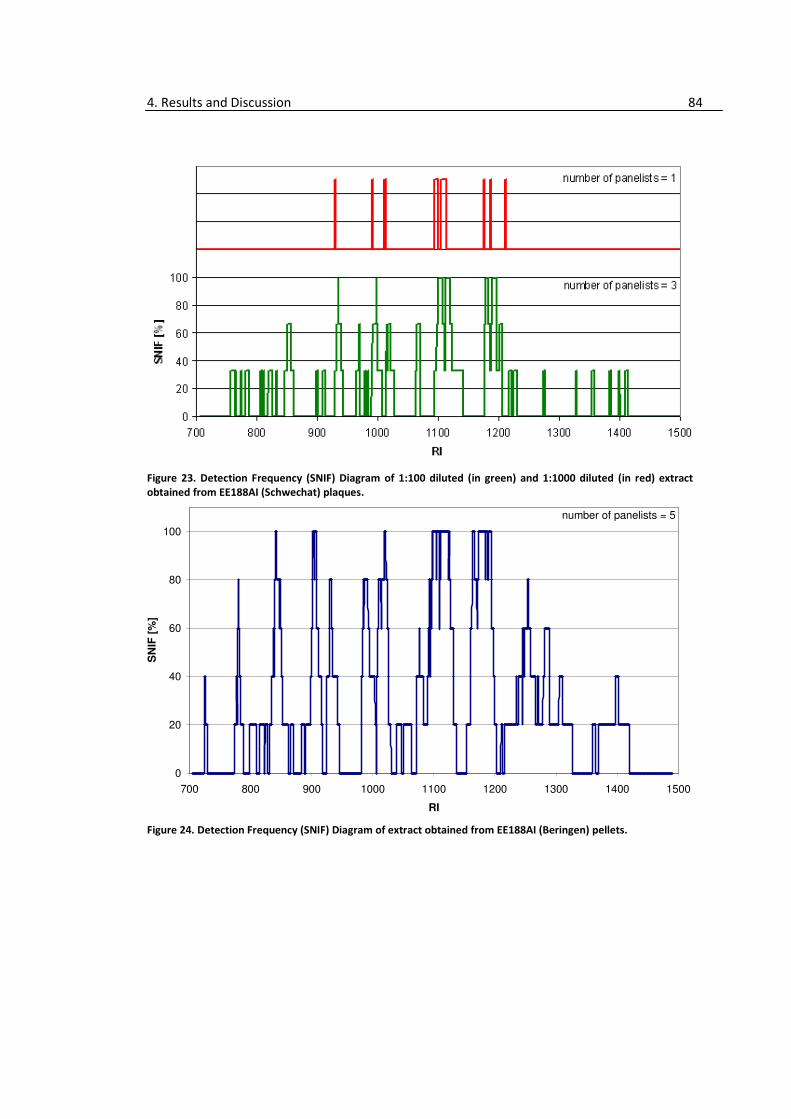
4. Results and Discussion 84
Figure 23. Detection Frequency (SNIF) Diagram of 1:100 diluted (in green) and 1:1000 diluted (in red) extract
obtained from EE188AI (Schwechat) plaques.
Figure 24. Detection Frequency (SNIF) Diagram of extract obtained from EE188AI (Beringen) pellets.
0
20
40
60
80
100
700 800 900 1000 1100 1200 1300 1400 1500
RI
SN
IF [
%]
number of panelists = 5

4. Results and Discussion 85
Figure 25. Detection Frequency (SNIF) Diagram of 1:100 diluted extract obtained from EE188AI (Beringen)
pellets.
Figure 26. Detection Frequency (SNIF) Diagram of extract obtained from EE188AI (Beringen) plaques.
0
20
40
60
80
100
700 800 900 1000 1100 1200 1300 1400 1500
RI
SN
IF [
%]
number of panelists = 3
0
20
40
60
80
100
700 800 900 1000 1100 1200 1300 1400 1500
RI
SN
IF [
%]
number of panelists = 5
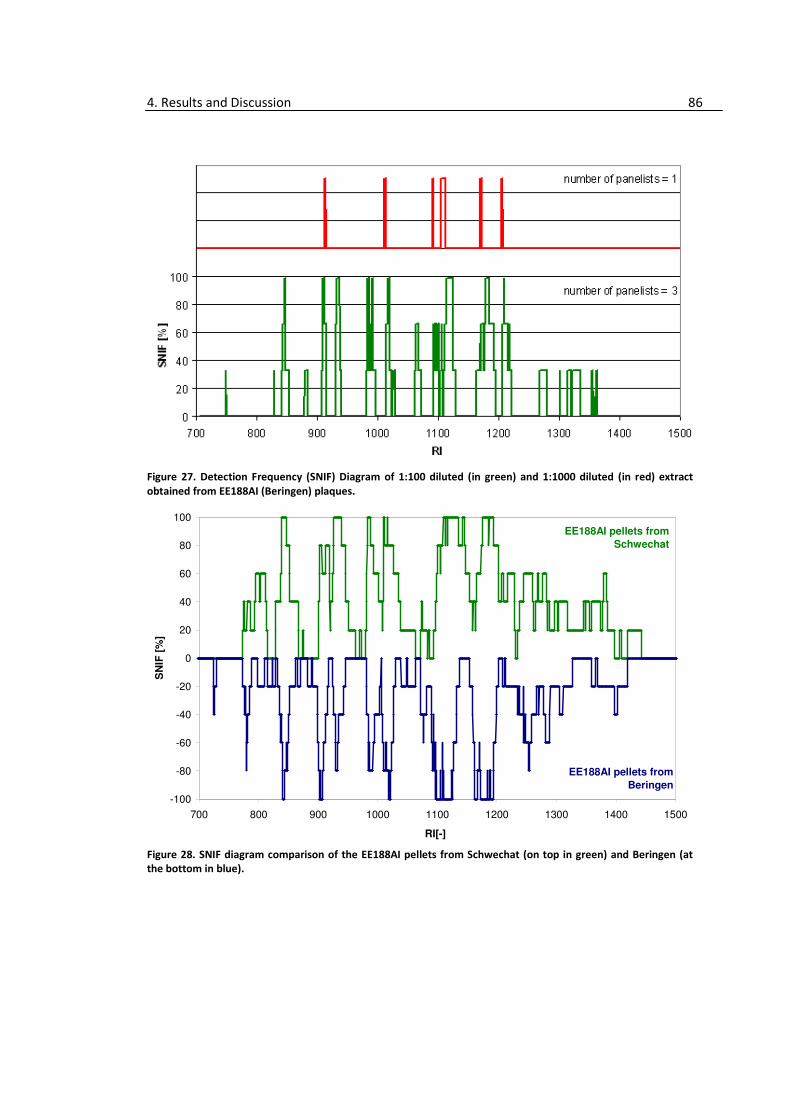
4. Results and Discussion 86
Figure 27. Detection Frequency (SNIF) Diagram of 1:100 diluted (in green) and 1:1000 diluted (in red) extract
obtained from EE188AI (Beringen) plaques.
Figure 28. SNIF diagram comparison of the EE188AI pellets from Schwechat (on top in green) and Beringen (at
the bottom in blue).
-100
-80
-60
-40
-20
0
20
40
60
80
100
700 800 900 1000 1100 1200 1300 1400 1500
RI[-]
SN
IF [
%]
EE188AI pellets from
Schwechat
EE188AI pellets from
Beringen
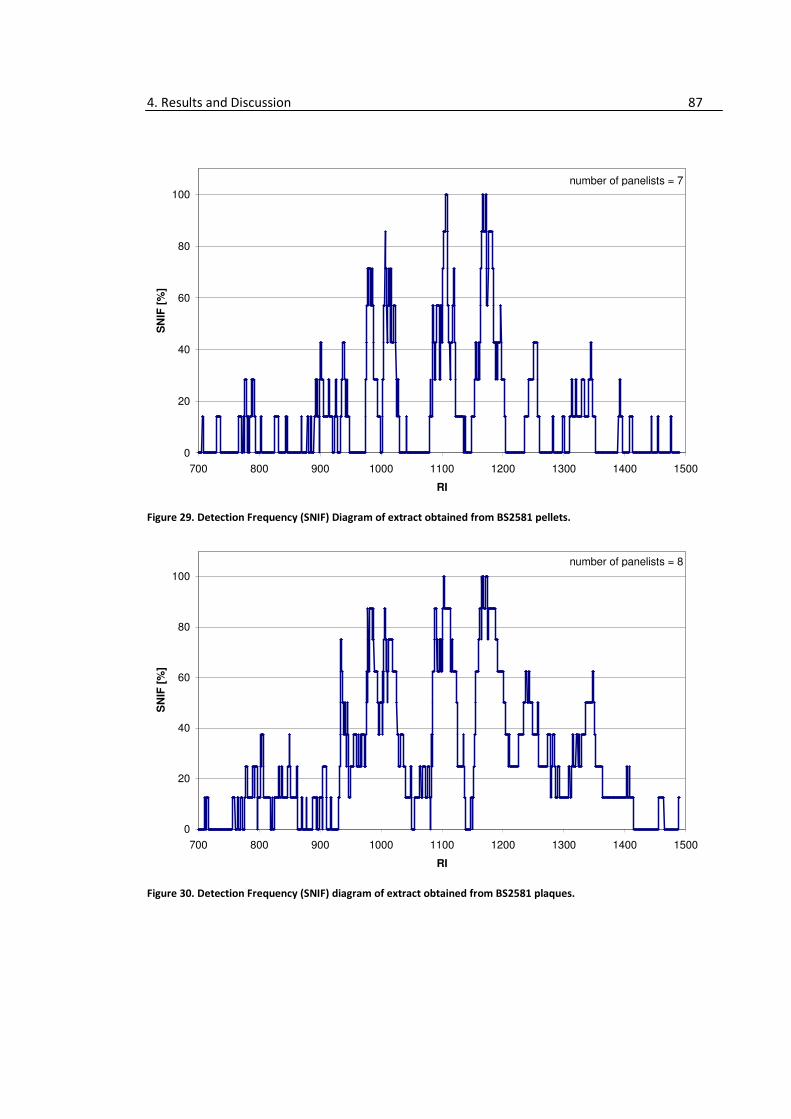
4. Results and Discussion 87
Figure 29. Detection Frequency (SNIF) Diagram of extract obtained from BS2581 pellets.
Figure 30. Detection Frequency (SNIF) diagram of extract obtained from BS2581 plaques.
0
20
40
60
80
100
700 800 900 1000 1100 1200 1300 1400 1500
RI
SN
IF [
%]
number of panelists = 7
0
20
40
60
80
100
700 800 900 1000 1100 1200 1300 1400 1500
RI
SN
IF [
%]
number of panelists = 8
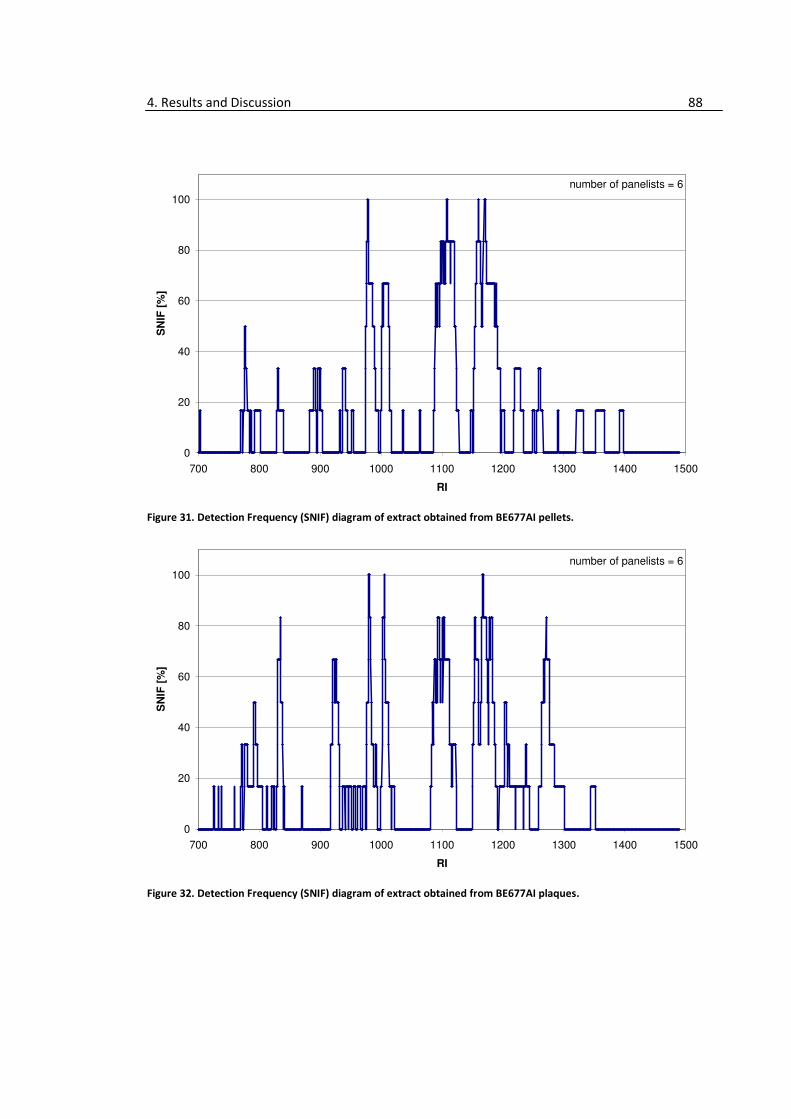
4. Results and Discussion 88
Figure 31. Detection Frequency (SNIF) diagram of extract obtained from BE677AI pellets.
Figure 32. Detection Frequency (SNIF) diagram of extract obtained from BE677AI plaques.
0
20
40
60
80
100
700 800 900 1000 1100 1200 1300 1400 1500
RI
SN
IF [
%]
number of panelists = 6
0
20
40
60
80
100
700 800 900 1000 1100 1200 1300 1400 1500
RI
SN
IF [
%]
number of panelists = 6
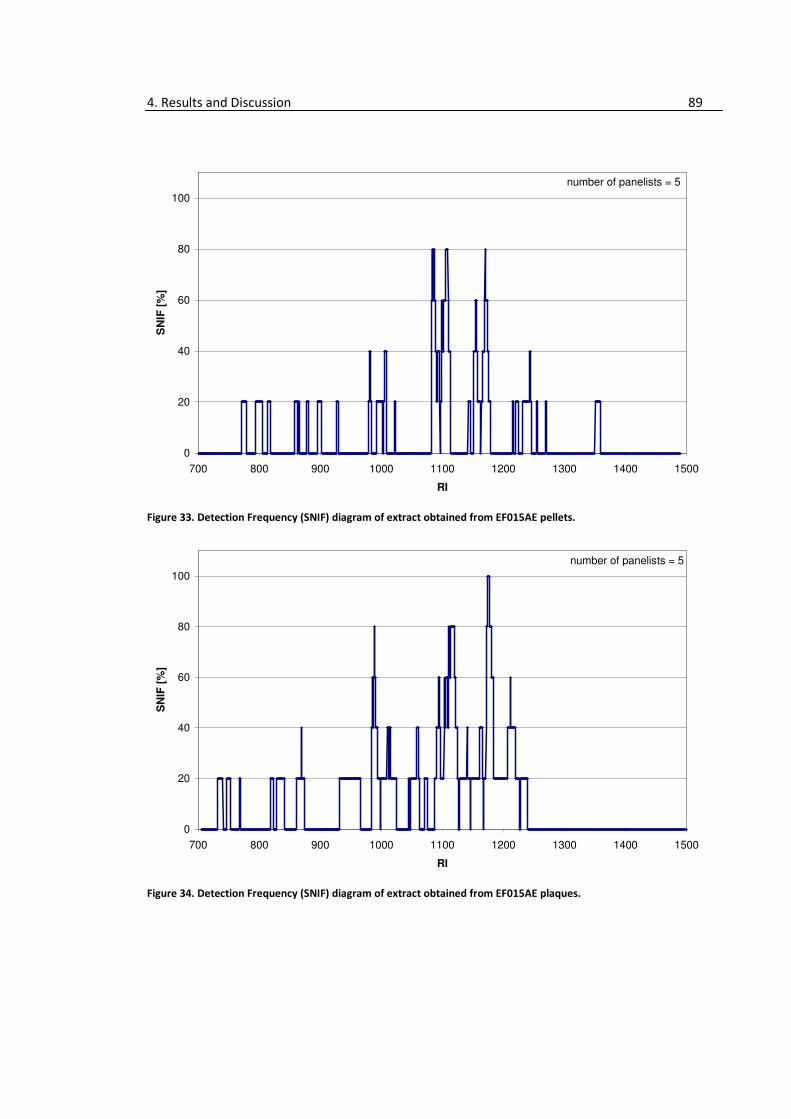
4. Results and Discussion 89
Figure 33. Detection Frequency (SNIF) diagram of extract obtained from EF015AE pellets.
Figure 34. Detection Frequency (SNIF) diagram of extract obtained from EF015AE plaques.
0
20
40
60
80
100
700 800 900 1000 1100 1200 1300 1400 1500
RI
SN
IF [
%]
number of panelists = 5
0
20
40
60
80
100
700 800 900 1000 1100 1200 1300 1400 1500
RI
SN
IF [
%]
number of panelists = 5
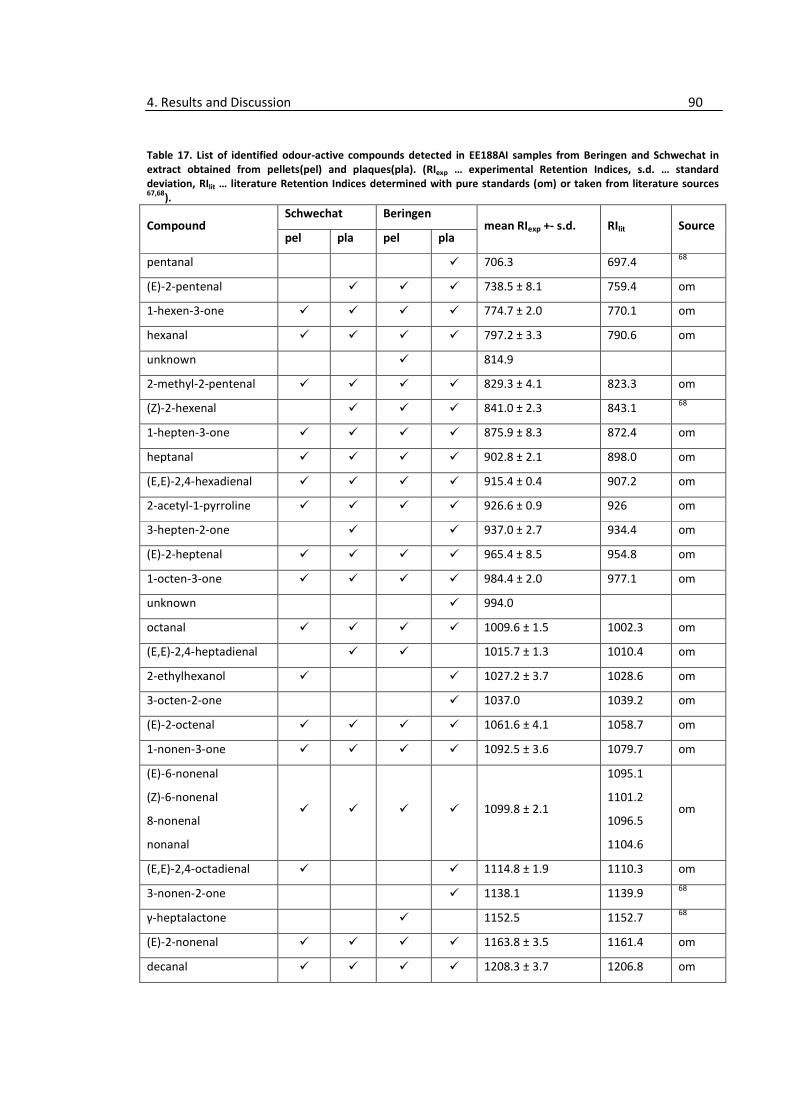
4. Results and Discussion 90
Table 17. List of identified odour-active compounds detected in EE188AI samples from Beringen and Schwechat in
extract obtained from pellets(pel) and plaques(pla). (RIexp … experimental Retention Indices, s.d. … standard
deviation, RIlit … literature Retention Indices determined with pure standards (om) or taken from literature sources 67,68
).
Compound Schwechat Beringen
mean RIexp +- s.d. RIlit Source pel pla pel pla
pentanal � 706.3 697.4 68
(E)-2-pentenal � � � 738.5 ± 8.1 759.4 om
1-hexen-3-one � � � � 774.7 ± 2.0 770.1 om
hexanal � � � � 797.2 ± 3.3 790.6 om
unknown � 814.9
2-methyl-2-pentenal � � � � 829.3 ± 4.1 823.3 om
(Z)-2-hexenal � � � 841.0 ± 2.3 843.1 68
1-hepten-3-one � � � � 875.9 ± 8.3 872.4 om
heptanal � � � � 902.8 ± 2.1 898.0 om
(E,E)-2,4-hexadienal � � � � 915.4 ± 0.4 907.2 om
2-acetyl-1-pyrroline � � � � 926.6 ± 0.9 926 om
3-hepten-2-one � � 937.0 ± 2.7 934.4 om
(E)-2-heptenal � � � � 965.4 ± 8.5 954.8 om
1-octen-3-one � � � � 984.4 ± 2.0 977.1 om
unknown � 994.0
octanal � � � � 1009.6 ± 1.5 1002.3 om
(E,E)-2,4-heptadienal � � 1015.7 ± 1.3 1010.4 om
2-ethylhexanol � � 1027.2 ± 3.7 1028.6 om
3-octen-2-one � 1037.0 1039.2 om
(E)-2-octenal � � � � 1061.6 ± 4.1 1058.7 om
1-nonen-3-one � � � � 1092.5 ± 3.6 1079.7 om
(E)-6-nonenal
(Z)-6-nonenal
8-nonenal
nonanal
� � � � 1099.8 ± 2.1
1095.1
1101.2
1096.5
1104.6
om
(E,E)-2,4-octadienal � � 1114.8 ± 1.9 1110.3 om
3-nonen-2-one � 1138.1 1139.9 68
γ-heptalactone � 1152.5 1152.7 68
(E)-2-nonenal � � � � 1163.8 ± 3.5 1161.4 om
decanal � � � � 1208.3 ± 3.7 1206.8 om
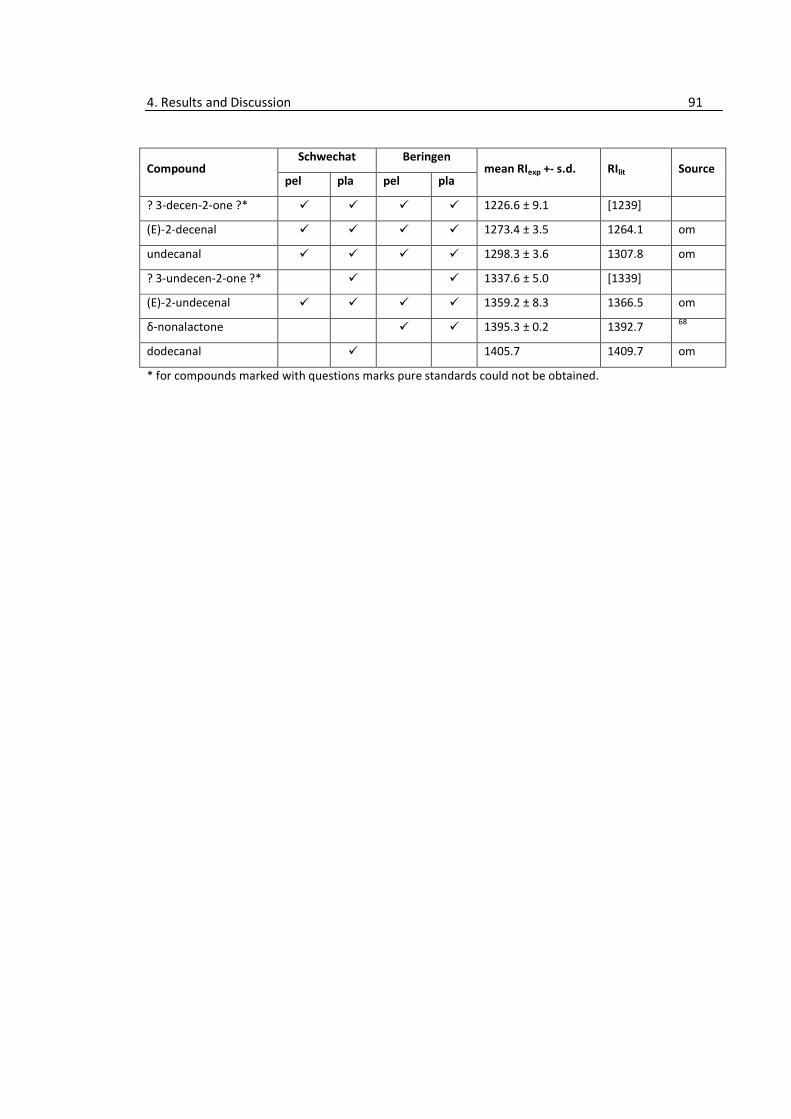
4. Results and Discussion 91
Compound Schwechat Beringen
mean RIexp +- s.d. RIlit Source pel pla pel pla
? 3-decen-2-one ?* � � � � 1226.6 ± 9.1 [1239]
(E)-2-decenal � � � � 1273.4 ± 3.5 1264.1 om
undecanal � � � � 1298.3 ± 3.6 1307.8 om
? 3-undecen-2-one ?* � � 1337.6 ± 5.0 [1339]
(E)-2-undecenal � � � � 1359.2 ± 8.3 1366.5 om
δ-nonalactone � � 1395.3 ± 0.2 1392.7 68
dodecanal � 1405.7 1409.7 om
* for compounds marked with questions marks pure standards could not be obtained.

4. Results and Discussion 92
Table 18. List of odour-active compounds present in the base polymers BS2581, BE677AI, EF015AE and in the
corresponding compound PP EE188AI from Beringen in pellets (pel) and plaques (pla) (RIexp … experimental Retention
Indices, s.d. … standard deviation, RIlit … literature Retention Indices determined with pure standards (om) or taken
from literature sources 67,68
).
Compound BS2581 BE677AI EF015AE
EE188AI
Beringen mean RIexp
+- s.d. RIlit Source
pel pla pel pla pel pla pel pla
pentanal � � � 708.1 ± 3.1 697.4 68
unknown � � � � 727.7 ± 2.5
3-penten-2-one � � � � 739.1 ± 7.1 734.0 68
(E)-3-pentenal � � 756.3 ± 1.1 759.4 om
unknown � � � 766.1 ± 2.4
1-hexen-3-one � � � � � � � � 773.1 ± 3.7 770.1 om
(Z)-3-hexenal � � � 785.1 ± 0.7 788.1 om
hexanal � � � � � � 795.0 ± 2.6 790.6 om
unknown � � � � � 812.4 ± 2.3
2-methyl-2-pentenal � � � � 823.2 ± 2.7 823.3 om
unknown � � � � 828.4 ± 1.7
(E)-2-hexenal � � � � � 841.3 ± 2.4 849.5 68
1-hepten-3-one � � � � � 865.3 ± 3.4 872.4 om
unknown � � � � � � 883.0 ± 4.1
heptanal � � � � � � 900.1 ± 3.9 898.0 om
(E,E)-2,4-hexadienal � � � � 915.1 ± 1.5 907.2 om
2-acetyl-1-pyrroline � � � � � 924.5 ± 2.5 926.0 om
3-hepten-2-one � � � � 937.4 ± 2.6 934.4 om
(E)-2-heptenal � � � � 951.2 ± 2.8 954.8 om
1-heptanol � � � � 963.4 ± 2.9 968.4 om
1-octen-3-one � � � � � � � � 977.3 ± 1.2 977.1 om
unknown � � � � � � 988.4 ± 3.0
octanal � � � � � � � � 1004.7 ± 2.8 1002.3 om
(E,E)-2,4-
heptadienal � � � 1017.0 ± 0.5 1010.4 om
2-ethylhexanol � � � � 1025.7 ± 2.3 1028.6 om
3-octen-2-one � � � � 1036.7 ± 1.5 1039.2 om
unknown � � � � 1046.2 ± 4.0
(E)-2-octenal � � � � � � 1061.6 ± 1.6 1058.7 om
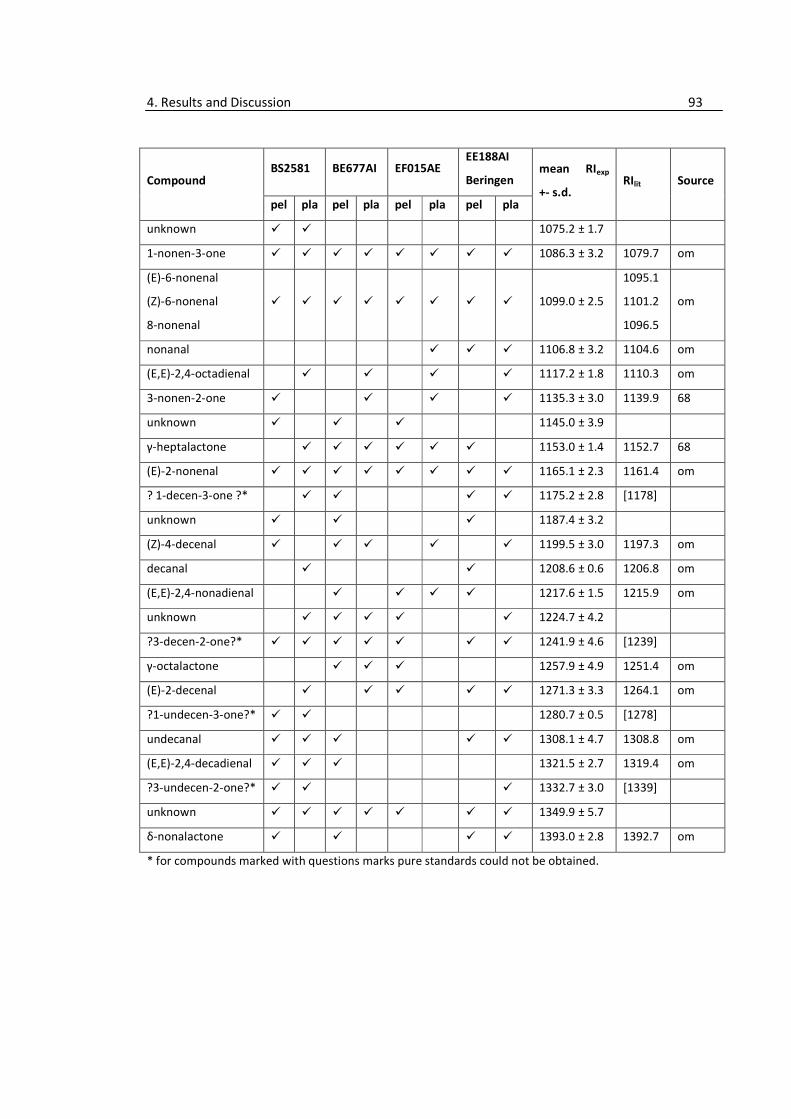
4. Results and Discussion 93
Compound BS2581 BE677AI EF015AE
EE188AI
Beringen mean RIexp
+- s.d. RIlit Source
pel pla pel pla pel pla pel pla
unknown � � 1075.2 ± 1.7
1-nonen-3-one � � � � � � � � 1086.3 ± 3.2 1079.7 om
(E)-6-nonenal
(Z)-6-nonenal
8-nonenal
� � � � � � � � 1099.0 ± 2.5
1095.1
1101.2
1096.5
om
nonanal � � � 1106.8 ± 3.2 1104.6 om
(E,E)-2,4-octadienal � � � � 1117.2 ± 1.8 1110.3 om
3-nonen-2-one � � � � 1135.3 ± 3.0 1139.9 68
unknown � � � 1145.0 ± 3.9
γ-heptalactone � � � � � � 1153.0 ± 1.4 1152.7 68
(E)-2-nonenal � � � � � � � � 1165.1 ± 2.3 1161.4 om
? 1-decen-3-one ?* � � � � 1175.2 ± 2.8 [1178]
unknown � � � 1187.4 ± 3.2
(Z)-4-decenal � � � � � 1199.5 ± 3.0 1197.3 om
decanal � � 1208.6 ± 0.6 1206.8 om
(E,E)-2,4-nonadienal � � � � 1217.6 ± 1.5 1215.9 om
unknown � � � � � 1224.7 ± 4.2
?3-decen-2-one?* � � � � � � � 1241.9 ± 4.6 [1239]
γ-octalactone � � � 1257.9 ± 4.9 1251.4 om
(E)-2-decenal � � � � � 1271.3 ± 3.3 1264.1 om
?1-undecen-3-one?* � � 1280.7 ± 0.5 [1278]
undecanal � � � � � 1308.1 ± 4.7 1308.8 om
(E,E)-2,4-decadienal � � � 1321.5 ± 2.7 1319.4 om
?3-undecen-2-one?* � � � 1332.7 ± 3.0 [1339]
unknown � � � � � � � 1349.9 ± 5.7
δ-nonalactone � � � � 1393.0 ± 2.8 1392.7 om
* for compounds marked with questions marks pure standards could not be obtained.
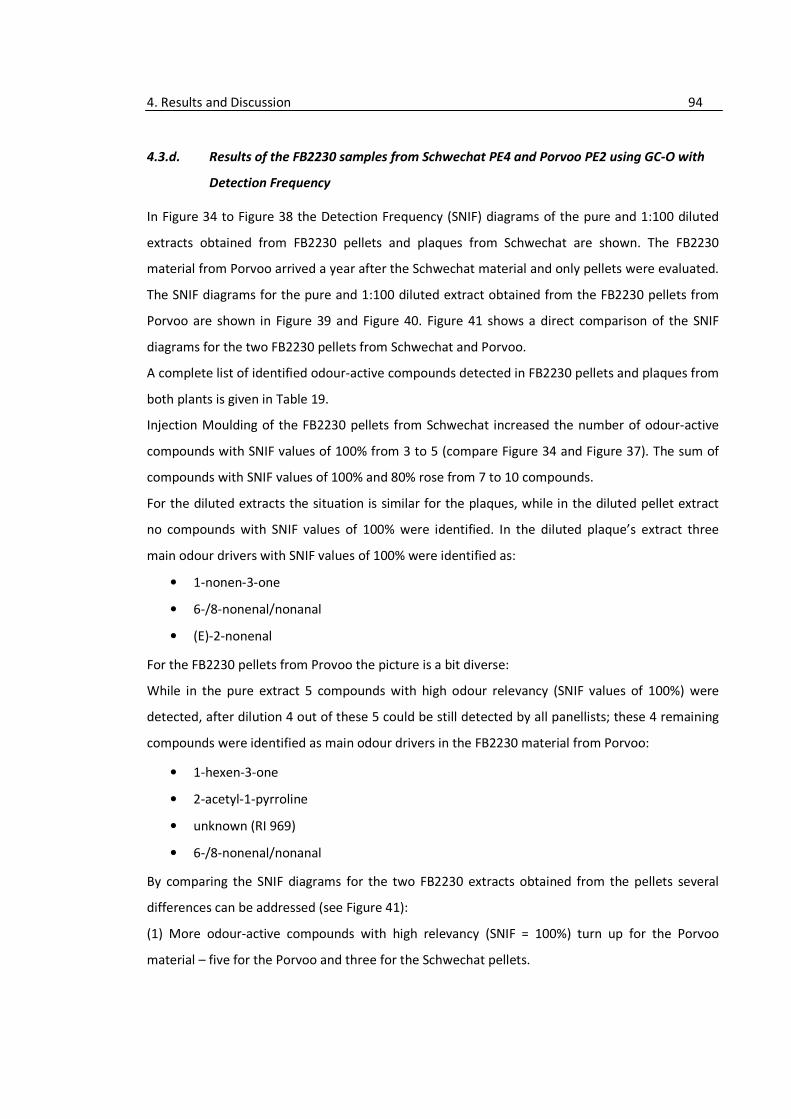
4. Results and Discussion 94
4.3.d. Results of the FB2230 samples from Schwechat PE4 and Porvoo PE2 using GC-O with
Detection Frequency
In Figure 34 to Figure 38 the Detection Frequency (SNIF) diagrams of the pure and 1:100 diluted
extracts obtained from FB2230 pellets and plaques from Schwechat are shown. The FB2230
material from Porvoo arrived a year after the Schwechat material and only pellets were evaluated.
The SNIF diagrams for the pure and 1:100 diluted extract obtained from the FB2230 pellets from
Porvoo are shown in Figure 39 and Figure 40. Figure 41 shows a direct comparison of the SNIF
diagrams for the two FB2230 pellets from Schwechat and Porvoo.
A complete list of identified odour-active compounds detected in FB2230 pellets and plaques from
both plants is given in Table 19.
Injection Moulding of the FB2230 pellets from Schwechat increased the number of odour-active
compounds with SNIF values of 100% from 3 to 5 (compare Figure 34 and Figure 37). The sum of
compounds with SNIF values of 100% and 80% rose from 7 to 10 compounds.
For the diluted extracts the situation is similar for the plaques, while in the diluted pellet extract
no compounds with SNIF values of 100% were identified. In the diluted plaque’s extract three
main odour drivers with SNIF values of 100% were identified as:
• 1-nonen-3-one
• 6-/8-nonenal/nonanal
• (E)-2-nonenal
For the FB2230 pellets from Provoo the picture is a bit diverse:
While in the pure extract 5 compounds with high odour relevancy (SNIF values of 100%) were
detected, after dilution 4 out of these 5 could be still detected by all panellists; these 4 remaining
compounds were identified as main odour drivers in the FB2230 material from Porvoo:
• 1-hexen-3-one
• 2-acetyl-1-pyrroline
• unknown (RI 969)
• 6-/8-nonenal/nonanal
By comparing the SNIF diagrams for the two FB2230 extracts obtained from the pellets several
differences can be addressed (see Figure 41):
(1) More odour-active compounds with high relevancy (SNIF = 100%) turn up for the Porvoo
material – five for the Porvoo and three for the Schwechat pellets.
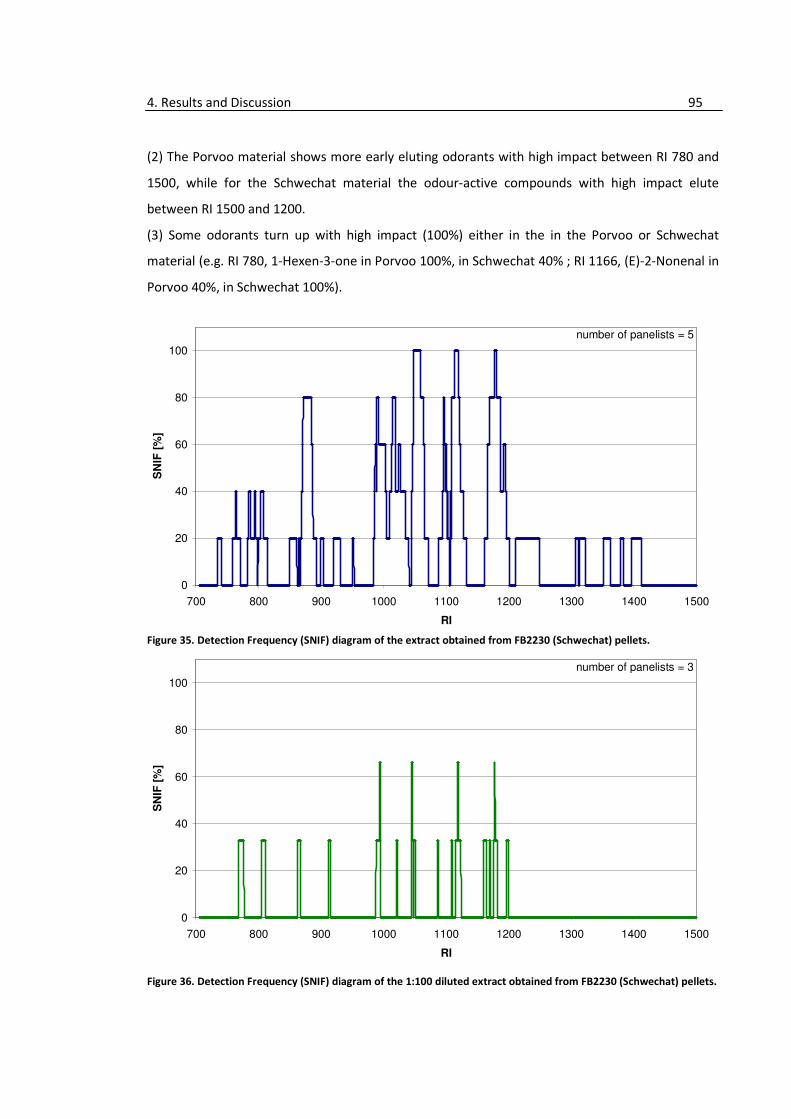
4. Results and Discussion 95
(2) The Porvoo material shows more early eluting odorants with high impact between RI 780 and
1500, while for the Schwechat material the odour-active compounds with high impact elute
between RI 1500 and 1200.
(3) Some odorants turn up with high impact (100%) either in the in the Porvoo or Schwechat
material (e.g. RI 780, 1-Hexen-3-one in Porvoo 100%, in Schwechat 40% ; RI 1166, (E)-2-Nonenal in
Porvoo 40%, in Schwechat 100%).
Figure 35. Detection Frequency (SNIF) diagram of the extract obtained from FB2230 (Schwechat) pellets.
Figure 36. Detection Frequency (SNIF) diagram of the 1:100 diluted extract obtained from FB2230 (Schwechat) pellets.
0
20
40
60
80
100
700 800 900 1000 1100 1200 1300 1400 1500
RI
SN
IF [
%]
number of panelists = 5
0
20
40
60
80
100
700 800 900 1000 1100 1200 1300 1400 1500
RI
SN
IF [
%]
number of panelists = 3
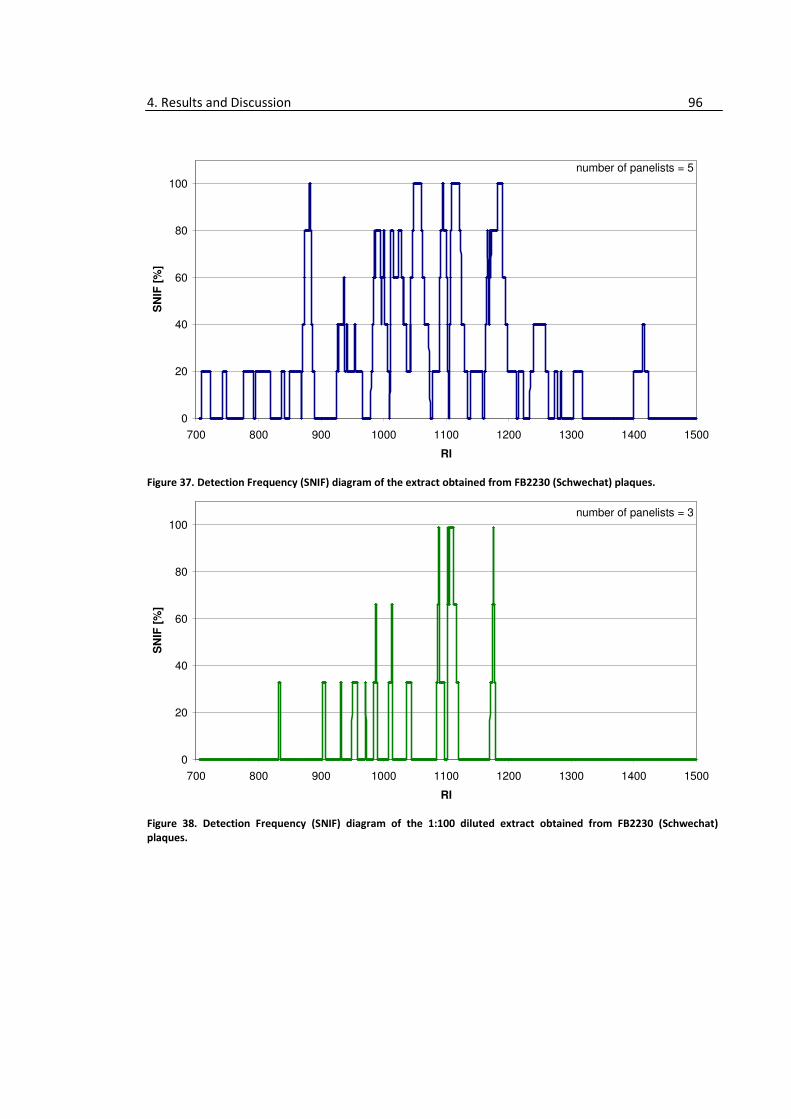
4. Results and Discussion 96
Figure 37. Detection Frequency (SNIF) diagram of the extract obtained from FB2230 (Schwechat) plaques.
Figure 38. Detection Frequency (SNIF) diagram of the 1:100 diluted extract obtained from FB2230 (Schwechat)
plaques.
0
20
40
60
80
100
700 800 900 1000 1100 1200 1300 1400 1500
RI
SN
IF [
%]
number of panelists = 5
0
20
40
60
80
100
700 800 900 1000 1100 1200 1300 1400 1500
RI
SN
IF [
%]
number of panelists = 3
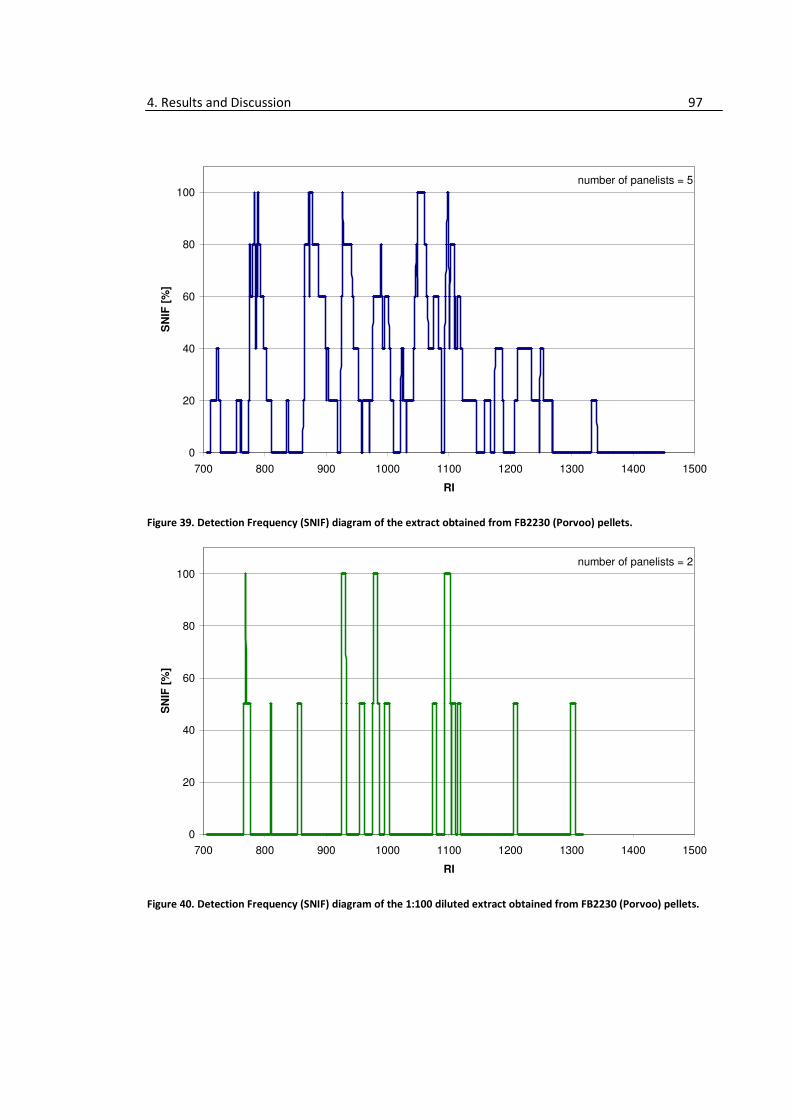
4. Results and Discussion 97
Figure 39. Detection Frequency (SNIF) diagram of the extract obtained from FB2230 (Porvoo) pellets.
Figure 40. Detection Frequency (SNIF) diagram of the 1:100 diluted extract obtained from FB2230 (Porvoo) pellets.
0
20
40
60
80
100
700 800 900 1000 1100 1200 1300 1400 1500
RI
SN
IF [
%]
number of panelists = 5
0
20
40
60
80
100
700 800 900 1000 1100 1200 1300 1400 1500
RI
SN
IF [
%]
number of panelists = 2
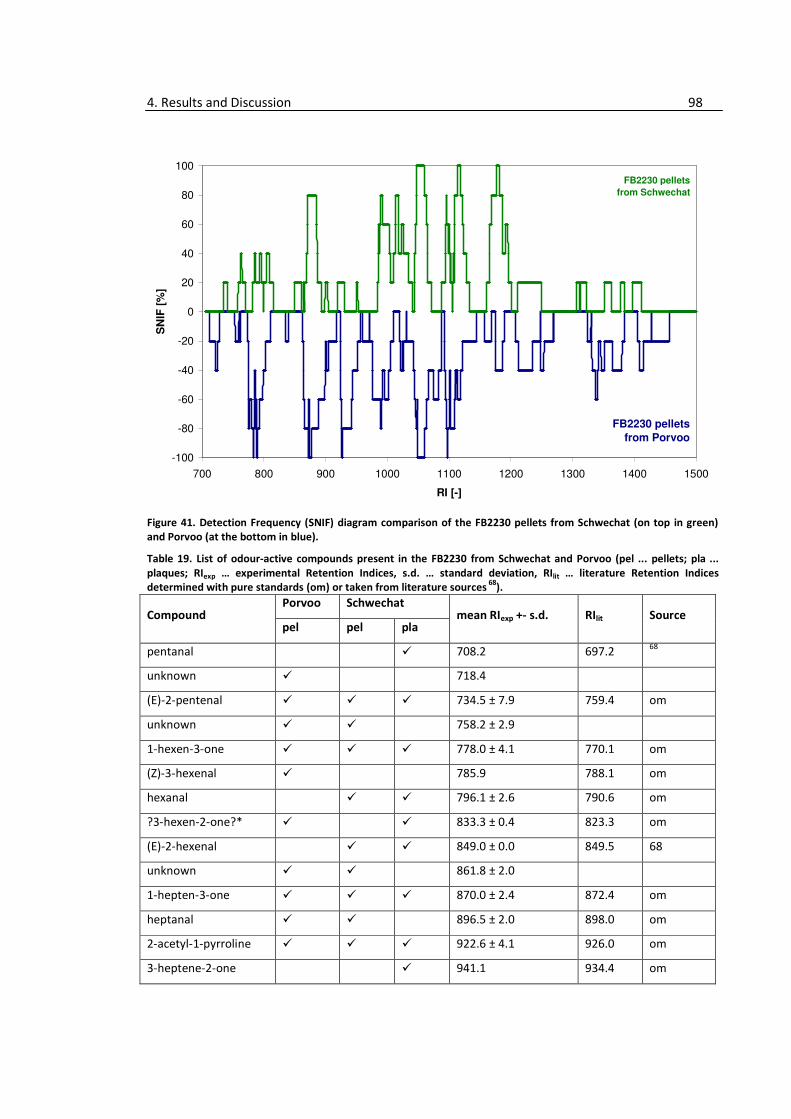
4. Results and Discussion 98
Figure 41. Detection Frequency (SNIF) diagram comparison of the FB2230 pellets from Schwechat (on top in green)
and Porvoo (at the bottom in blue).
Table 19. List of odour-active compounds present in the FB2230 from Schwechat and Porvoo (pel ... pellets; pla ...
plaques; RIexp … experimental Retention Indices, s.d. … standard deviation, RIlit … literature Retention Indices
determined with pure standards (om) or taken from literature sources 68
).
Compound Porvoo Schwechat
mean RIexp +- s.d. RIlit Source pel pel pla
pentanal � 708.2 697.2 68
unknown � 718.4
(E)-2-pentenal � � � 734.5 ± 7.9 759.4 om
unknown � � 758.2 ± 2.9
1-hexen-3-one � � � 778.0 ± 4.1 770.1 om
(Z)-3-hexenal � 785.9 788.1 om
hexanal � � 796.1 ± 2.6 790.6 om
?3-hexen-2-one?* � � 833.3 ± 0.4 823.3 om
(E)-2-hexenal � � 849.0 ± 0.0 849.5 68
unknown � � 861.8 ± 2.0
1-hepten-3-one � � � 870.0 ± 2.4 872.4 om
heptanal � � 896.5 ± 2.0 898.0 om
2-acetyl-1-pyrroline � � � 922.6 ± 4.1 926.0 om
3-heptene-2-one � 941.1 934.4 om
-100
-80
-60
-40
-20
0
20
40
60
80
100
700 800 900 1000 1100 1200 1300 1400 1500
RI [-]
SN
IF [
%]
FB2230 pellets
from Schwechat
FB2230 pellets
from Porvoo
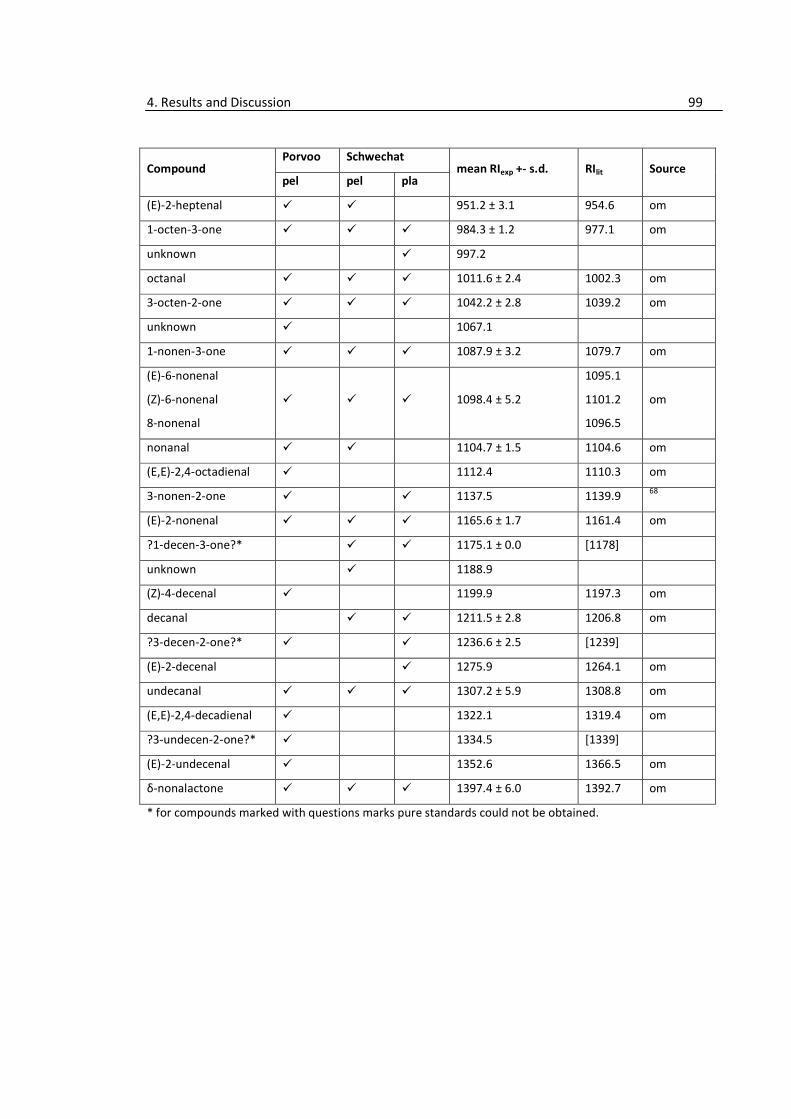
4. Results and Discussion 99
Compound Porvoo Schwechat
mean RIexp +- s.d. RIlit Source pel pel pla
(E)-2-heptenal � � 951.2 ± 3.1 954.6 om
1-octen-3-one � � � 984.3 ± 1.2 977.1 om
unknown � 997.2
octanal � � � 1011.6 ± 2.4 1002.3 om
3-octen-2-one � � � 1042.2 ± 2.8 1039.2 om
unknown � 1067.1
1-nonen-3-one � � � 1087.9 ± 3.2 1079.7 om
(E)-6-nonenal
(Z)-6-nonenal
8-nonenal
� � � 1098.4 ± 5.2
1095.1
1101.2
1096.5
om
nonanal � � 1104.7 ± 1.5 1104.6 om
(E,E)-2,4-octadienal � 1112.4 1110.3 om
3-nonen-2-one � � 1137.5 1139.9 68
(E)-2-nonenal � � � 1165.6 ± 1.7 1161.4 om
?1-decen-3-one?* � � 1175.1 ± 0.0 [1178]
unknown � 1188.9
(Z)-4-decenal � 1199.9 1197.3 om
decanal � � 1211.5 ± 2.8 1206.8 om
?3-decen-2-one?* � � 1236.6 ± 2.5 [1239]
(E)-2-decenal � 1275.9 1264.1 om
undecanal � � � 1307.2 ± 5.9 1308.8 om
(E,E)-2,4-decadienal � 1322.1 1319.4 om
?3-undecen-2-one?* � 1334.5 [1339]
(E)-2-undecenal � 1352.6 1366.5 om
δ-nonalactone � � � 1397.4 ± 6.0 1392.7 om
* for compounds marked with questions marks pure standards could not be obtained.
4. Results and Discussion 100
4.3.e. Results of ME3440 samples from Porvoo, Stenungsund and Borouge using GC-O with
Detection Frequency
The ME3440 samples were obtained from three different plants (Provoo (Po), Stenungsund (St)
and Borouge (Bo)) and thus a MVDA with the MasStat© program was possible to look for
similarities and differences in between the samples. HS-SPME-GC-MS data was used for the
differentiation. Only pellets were screened.
In Figure 42. the result of the MVDA is shown: Despite the same composition and similar GC-MS
chromatograms the program was able to differentiate between the samples. All three samples lie
on a horizontal line when x- and y-axis (respectively PC1 and PC2) are scaled the same and are
differentiated along the x-axis (= PC1) with the Stenungsund sample on the left side, followed by
the Porvoo sample in the middle and the Borouge sample on the right side. Looking into the
details for the differentiation one is able to find compounds which are responsible for differences
of the ME3440 samples:
• 2-ethyl-1-hexanol (Bo >> Po ~ St)
• toluene (Bo > Po > St)
• Cyclohexane (Bo)
• 1-ethylcyclohexene (Bo > Po > St)
• Methyl-alkenes (Po ~ St > Bo)
Using GC-O with Detection Frequency, it is able to identify odour-active compounds which
contribute to the differences in the odour pattern of the three ME3440 samples.
Due to the general lower odour of the samples, only a 1:10 dilution was evaluated by GC-O. All
SNIF diagrams for the pure and the 1:10 diluted extract are shown in Figure 44 to Figure 49. A
complete list of the odour-active compounds detected in the three ME3440 samples is given in
Table 20.
A comparison of the SNIF diagrams obtained from the pure extract of the three ME3440 samples is
shown in Figure 50. Differences can be found for these compounds:
• 1-Hexen-3-one (SNIF 100% in Po; 60% in St and Bo)
• 1-Hepten-3-one (SNIF 80% in St., 60% in Po and Bo)
• 2-Acetyl-1-pyrroline (SNIF 100% in Bo, 60% in Po, 40% in St)
• Octanal (SNIF 100% in St, 60% in Po and Bo)
• 2-Ethylhexanol (SNIF 100% in Bo, 40% in Po and St)
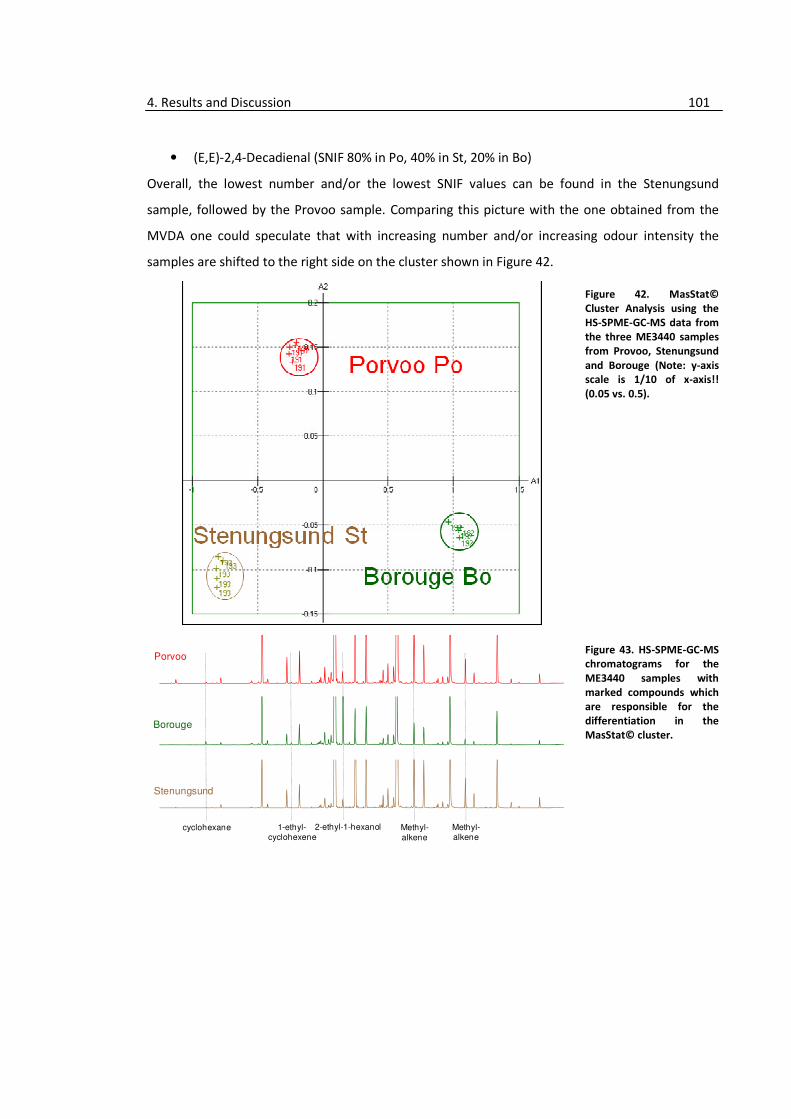
4. Results and Discussion 101
• (E,E)-2,4-Decadienal (SNIF 80% in Po, 40% in St, 20% in Bo)
Overall, the lowest number and/or the lowest SNIF values can be found in the Stenungsund
sample, followed by the Provoo sample. Comparing this picture with the one obtained from the
MVDA one could speculate that with increasing number and/or increasing odour intensity the
samples are shifted to the right side on the cluster shown in Figure 42.
Figure 42. MasStat©
Cluster Analysis using the
HS-SPME-GC-MS data from
the three ME3440 samples
from Provoo, Stenungsund
and Borouge (Note: y-axis
scale is 1/10 of x-axis!!
(0.05 vs. 0.5).
Figure 43. HS-SPME-GC-MS
chromatograms for the
ME3440 samples with
marked compounds which
are responsible for the
differentiation in the
MasStat© cluster.
Porvoo
Borouge
Stenungsund
1-ethyl-cyclohexene
2-ethyl-1-hexanolcyclohexane Methyl-alkene
Methyl-alkene
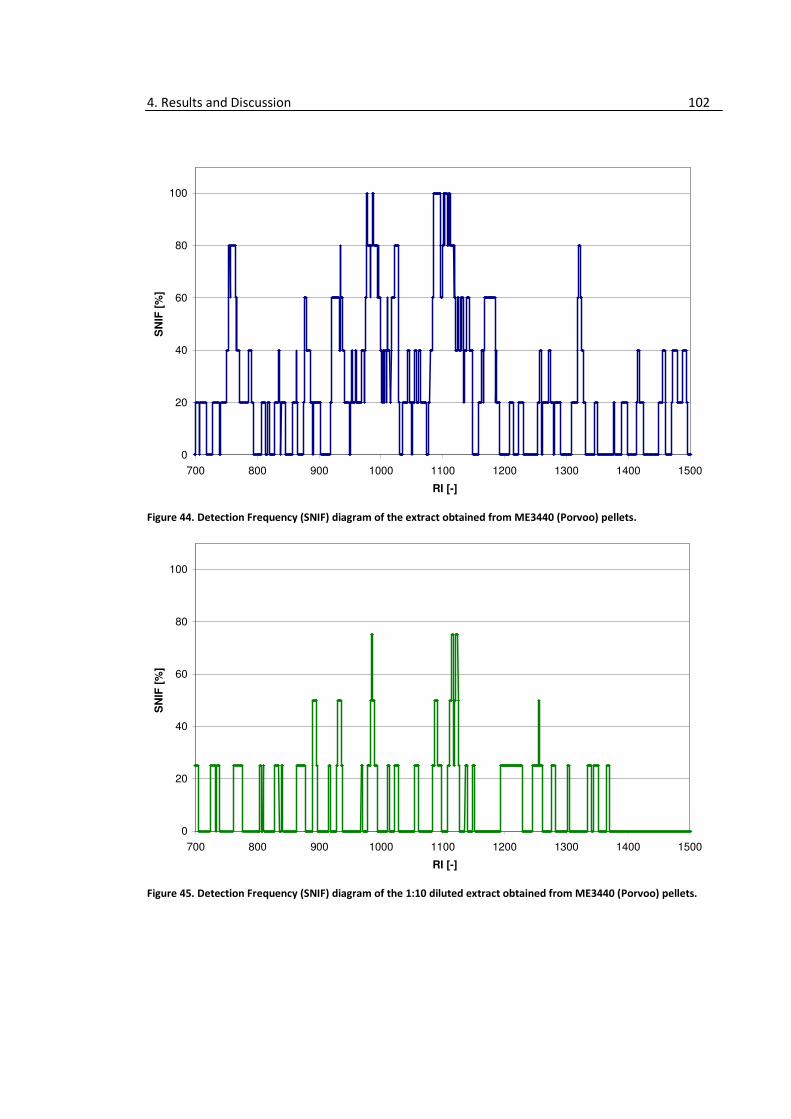
4. Results and Discussion 102
Figure 44. Detection Frequency (SNIF) diagram of the extract obtained from ME3440 (Porvoo) pellets.
Figure 45. Detection Frequency (SNIF) diagram of the 1:10 diluted extract obtained from ME3440 (Porvoo) pellets.
0
20
40
60
80
100
700 800 900 1000 1100 1200 1300 1400 1500
RI [-]
SN
IF [
%]
0
20
40
60
80
100
700 800 900 1000 1100 1200 1300 1400 1500
RI [-]
SN
IF [
%]
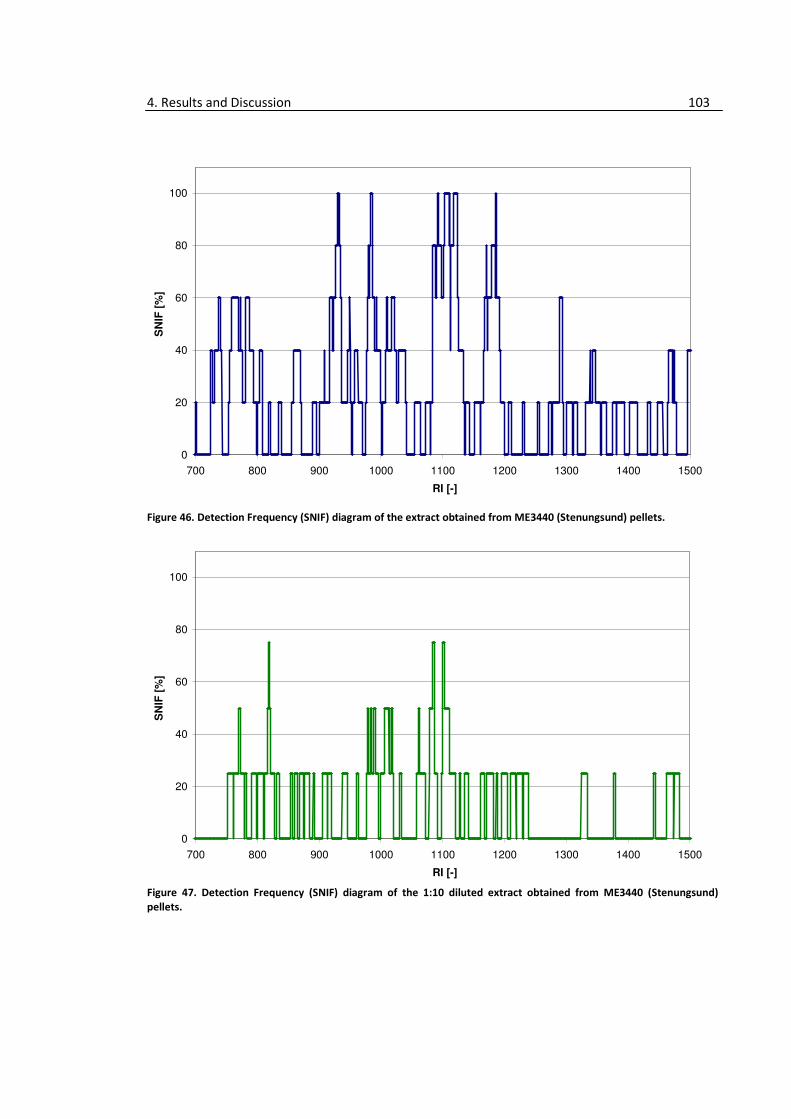
4. Results and Discussion 103
Figure 46. Detection Frequency (SNIF) diagram of the extract obtained from ME3440 (Stenungsund) pellets.
Figure 47. Detection Frequency (SNIF) diagram of the 1:10 diluted extract obtained from ME3440 (Stenungsund)
pellets.
0
20
40
60
80
100
700 800 900 1000 1100 1200 1300 1400 1500
RI [-]
SN
IF [
%]
0
20
40
60
80
100
700 800 900 1000 1100 1200 1300 1400 1500
RI [-]
SN
IF [
%]
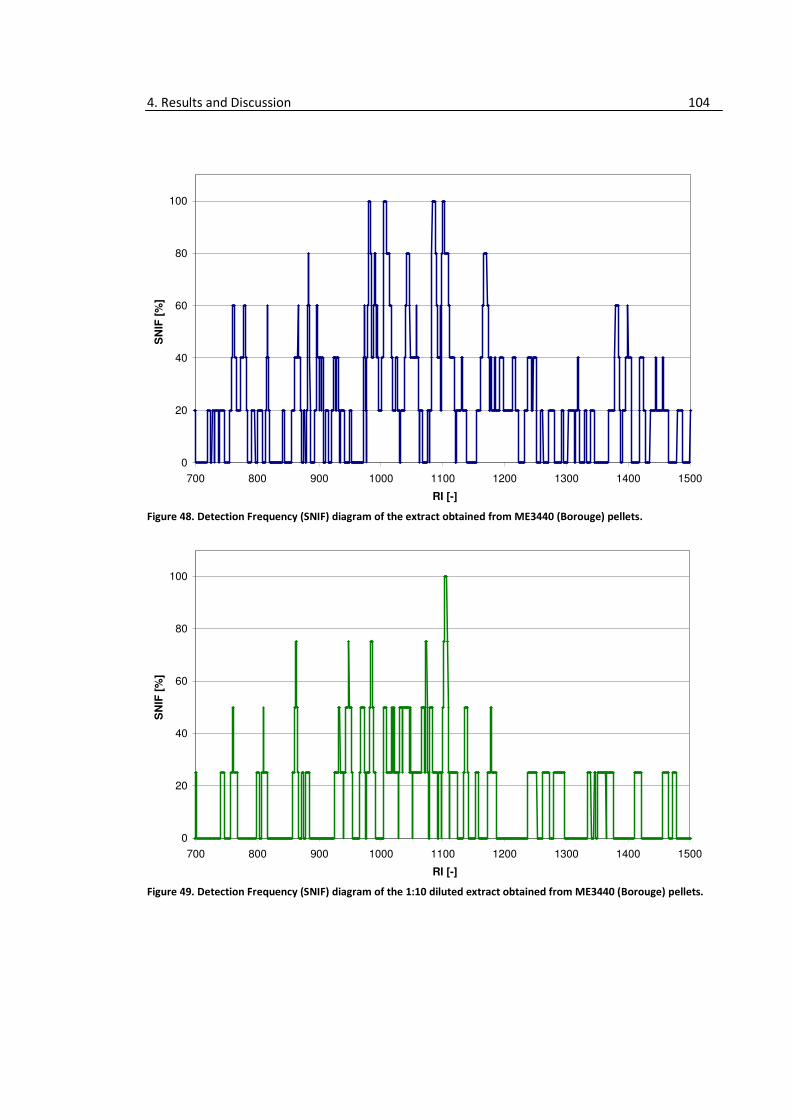
4. Results and Discussion 104
Figure 48. Detection Frequency (SNIF) diagram of the extract obtained from ME3440 (Borouge) pellets.
Figure 49. Detection Frequency (SNIF) diagram of the 1:10 diluted extract obtained from ME3440 (Borouge) pellets.
0
20
40
60
80
100
700 800 900 1000 1100 1200 1300 1400 1500
RI [-]
SN
IF [
%]
0
20
40
60
80
100
700 800 900 1000 1100 1200 1300 1400 1500
RI [-]
SN
IF [
%]
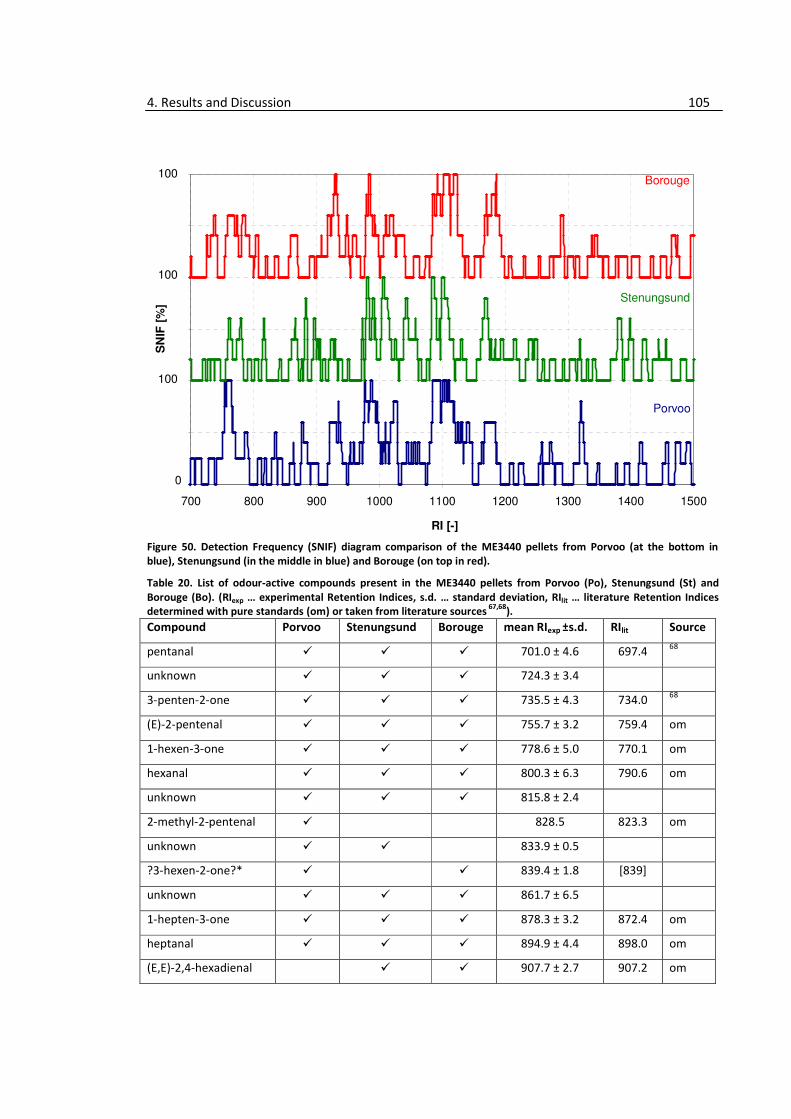
4. Results and Discussion 105
Figure 50. Detection Frequency (SNIF) diagram comparison of the ME3440 pellets from Porvoo (at the bottom in
blue), Stenungsund (in the middle in blue) and Borouge (on top in red).
Table 20. List of odour-active compounds present in the ME3440 pellets from Porvoo (Po), Stenungsund (St) and
Borouge (Bo). (RIexp … experimental Retention Indices, s.d. … standard deviation, RIlit … literature Retention Indices
determined with pure standards (om) or taken from literature sources 67,68
).
Compound Porvoo Stenungsund Borouge mean RIexp ±s.d. RIlit Source
pentanal � � � 701.0 ± 4.6 697.4 68
unknown � � � 724.3 ± 3.4
3-penten-2-one � � � 735.5 ± 4.3 734.0 68
(E)-2-pentenal � � � 755.7 ± 3.2 759.4 om
1-hexen-3-one � � � 778.6 ± 5.0 770.1 om
hexanal � � � 800.3 ± 6.3 790.6 om
unknown � � � 815.8 ± 2.4
2-methyl-2-pentenal � 828.5 823.3 om
unknown � � 833.9 ± 0.5
?3-hexen-2-one?* � � 839.4 ± 1.8 [839]
unknown � � � 861.7 ± 6.5
1-hepten-3-one � � � 878.3 ± 3.2 872.4 om
heptanal � � � 894.9 ± 4.4 898.0 om
(E,E)-2,4-hexadienal � � 907.7 ± 2.7 907.2 om
0
50
100
150
200
250
300
700 800 900 1000 1100 1200 1300 1400 1500
RI [-]
SN
IF [
%]
Porvoo
Stenungsund
Borouge
100
100
100
0
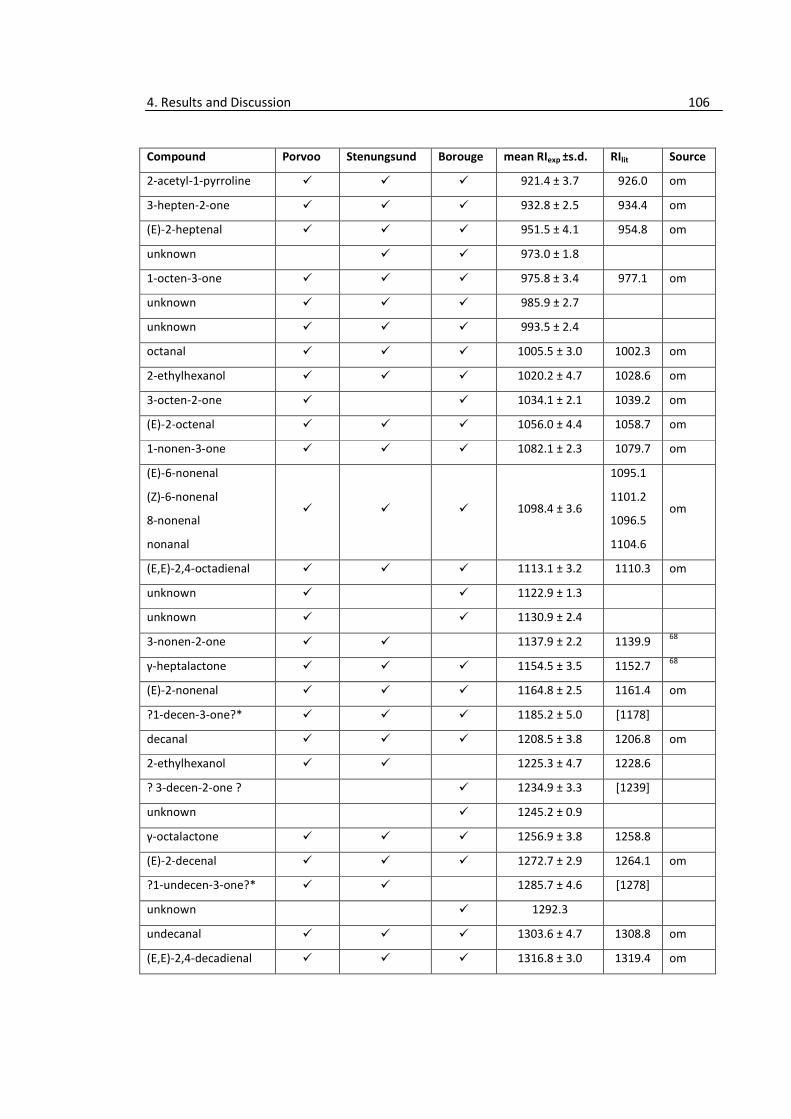
4. Results and Discussion 106
Compound Porvoo Stenungsund Borouge mean RIexp ±s.d. RIlit Source
2-acetyl-1-pyrroline � � � 921.4 ± 3.7 926.0 om
3-hepten-2-one � � � 932.8 ± 2.5 934.4 om
(E)-2-heptenal � � � 951.5 ± 4.1 954.8 om
unknown � � 973.0 ± 1.8
1-octen-3-one � � � 975.8 ± 3.4 977.1 om
unknown � � � 985.9 ± 2.7
unknown � � � 993.5 ± 2.4
octanal � � � 1005.5 ± 3.0 1002.3 om
2-ethylhexanol � � � 1020.2 ± 4.7 1028.6 om
3-octen-2-one � � 1034.1 ± 2.1 1039.2 om
(E)-2-octenal � � � 1056.0 ± 4.4 1058.7 om
1-nonen-3-one � � � 1082.1 ± 2.3 1079.7 om
(E)-6-nonenal
(Z)-6-nonenal
8-nonenal
nonanal
� � � 1098.4 ± 3.6
1095.1
1101.2
1096.5
1104.6
om
(E,E)-2,4-octadienal � � � 1113.1 ± 3.2 1110.3 om
unknown � � 1122.9 ± 1.3
unknown � � 1130.9 ± 2.4
3-nonen-2-one � � 1137.9 ± 2.2 1139.9 68
γ-heptalactone � � � 1154.5 ± 3.5 1152.7 68
(E)-2-nonenal � � � 1164.8 ± 2.5 1161.4 om
?1-decen-3-one?* � � � 1185.2 ± 5.0 [1178]
decanal � � � 1208.5 ± 3.8 1206.8 om
2-ethylhexanol � � 1225.3 ± 4.7 1228.6
? 3-decen-2-one ? � 1234.9 ± 3.3 [1239]
unknown � 1245.2 ± 0.9
γ-octalactone � � � 1256.9 ± 3.8 1258.8
(E)-2-decenal � � � 1272.7 ± 2.9 1264.1 om
?1-undecen-3-one?* � � 1285.7 ± 4.6 [1278]
unknown � 1292.3
undecanal � � � 1303.6 ± 4.7 1308.8 om
(E,E)-2,4-decadienal � � � 1316.8 ± 3.0 1319.4 om
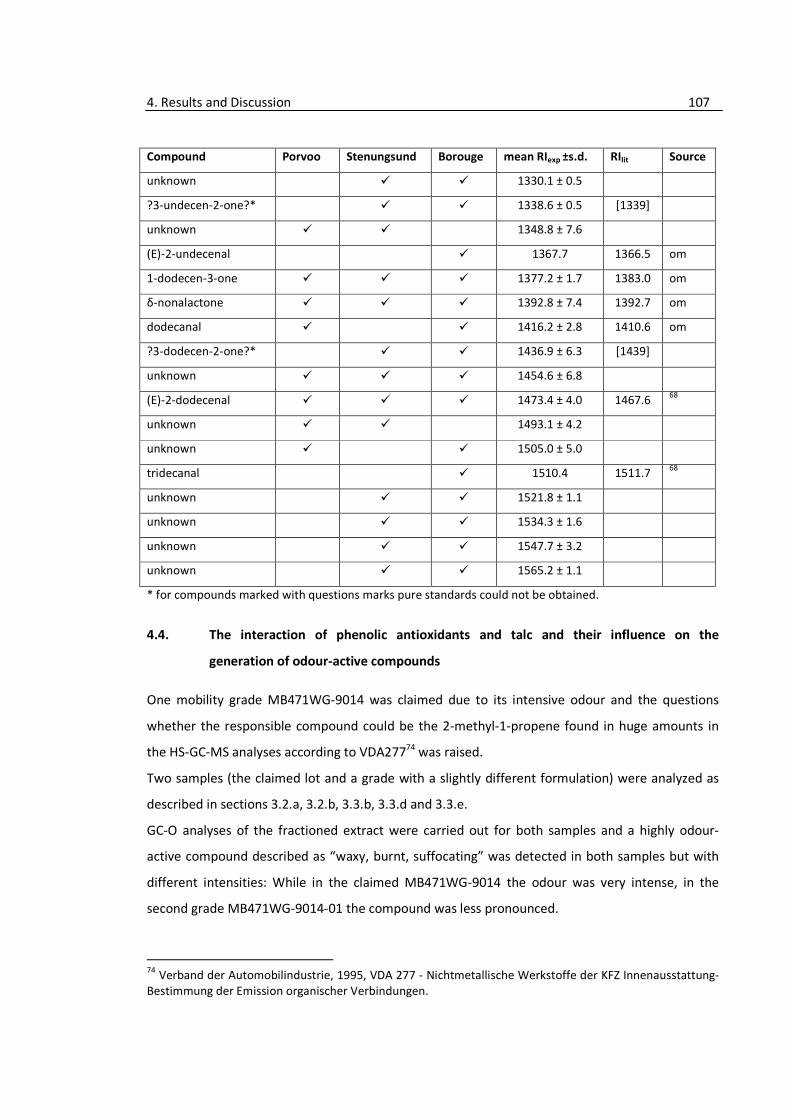
4. Results and Discussion 107
Compound Porvoo Stenungsund Borouge mean RIexp ±s.d. RIlit Source
unknown � � 1330.1 ± 0.5
?3-undecen-2-one?* � � 1338.6 ± 0.5 [1339]
unknown � � 1348.8 ± 7.6
(E)-2-undecenal � 1367.7 1366.5 om
1-dodecen-3-one � � � 1377.2 ± 1.7 1383.0 om
δ-nonalactone � � � 1392.8 ± 7.4 1392.7 om
dodecanal � � 1416.2 ± 2.8 1410.6 om
?3-dodecen-2-one?* � � 1436.9 ± 6.3 [1439]
unknown � � � 1454.6 ± 6.8
(E)-2-dodecenal � � � 1473.4 ± 4.0 1467.6 68
unknown � � 1493.1 ± 4.2
unknown � � 1505.0 ± 5.0
tridecanal � 1510.4 1511.7 68
unknown � � 1521.8 ± 1.1
unknown � � 1534.3 ± 1.6
unknown � � 1547.7 ± 3.2
unknown � � 1565.2 ± 1.1
* for compounds marked with questions marks pure standards could not be obtained.
4.4. The interaction of phenolic antioxidants and talc and their influence on the
generation of odour-active compounds
One mobility grade MB471WG-9014 was claimed due to its intensive odour and the questions
whether the responsible compound could be the 2-methyl-1-propene found in huge amounts in
the HS-GC-MS analyses according to VDA27774 was raised.
Two samples (the claimed lot and a grade with a slightly different formulation) were analyzed as
described in sections 3.2.a, 3.2.b, 3.3.b, 3.3.d and 3.3.e.
GC-O analyses of the fractioned extract were carried out for both samples and a highly odour-
active compound described as “waxy, burnt, suffocating” was detected in both samples but with
different intensities: While in the claimed MB471WG-9014 the odour was very intense, in the
second grade MB471WG-9014-01 the compound was less pronounced.
74
Verband der Automobilindustrie, 1995, VDA 277 - Nichtmetallische Werkstoffe der KFZ Innenausstattung-
Bestimmung der Emission organischer Verbindungen.
4. Results and Discussion 108
In Figure 51 GC-FID-O chromatograms of both samples are shown. Although the odour-active
compound gave a very intense signal and at the same retention time a large peak was detected,
this peak is not responsible for the odour as proven by GC-O of the pure reference; furthermore
these huge peaks in the relevant area are the three stereoisomers of tert.-butylphenols (2-, 3-, 4-)
which are coeluting with the odour-active compound of interest (see Figure 52). A rough
estimation of the concentration of the analyte was carried out giving a concentration of the
analyte of interest of less than 1 µg/kg.
A change of the analytical GC-column from the standard HP-5 to a more polar DB-WAX and
applying the same GC parameters should according to literature help to separate coeluting peaks.
In this case it did not: On the HP-5 column the unknown compound coeluted with 3-ter.-
butylphenol and on the DB-WAX column the 2-tert.-butylphenol overlaid the analyte of interest.
A check whether the unknown compound has nitrogen- or sulphur-containing functional groups
was carried out with NPD (in N-mode) and FPD, but no signal was observed in the relevant area.
Applying derivatization using O-(2,3,4,5,6-Pentafluorbenzyl)-hydroxylamine (PFBHA) to transfer an
possibly carbonyl group into the corresponding oxime thus eliminating the odour function of the
analyte did not work – during the subsequent GC-O of the derivatized extract the odour was still
detectable and did not change.
A second derivatization reagent – N,O-bis(trimethylsilyl)trifluoroacetamide) (BSTFA) – which
trimethylsilylates alcohols, amines, carboxylic acids and phenols, followed by GC-O was successful;
the odour could not be detected.
Summarizing the results, the unknown compound which odour is described as pungent, intense,
dusty, burnt, waxy and suffocating, is
(1) most likely a phenolic compound indicated by the coelution with the tert.-butylphenols and
the reaction with BSTFA,
(2) is not 2-, 3-, or 4-tert.-butylphenol due to their lack of the characteristic odour in the
relevant concentration range which was checked by GC-O of pure references and
(3) does not have functional groups containing N or S due to the lack of response to the
element-specific detectors NPD ( in N-mode) and FPD.
However, a chemical name and/or structure is yet unknown. It is assumed that the unknown
compound derive from the degradation of the phenolic antioxidants in presence of the talc as
described by Sauer (see Scheme 1).
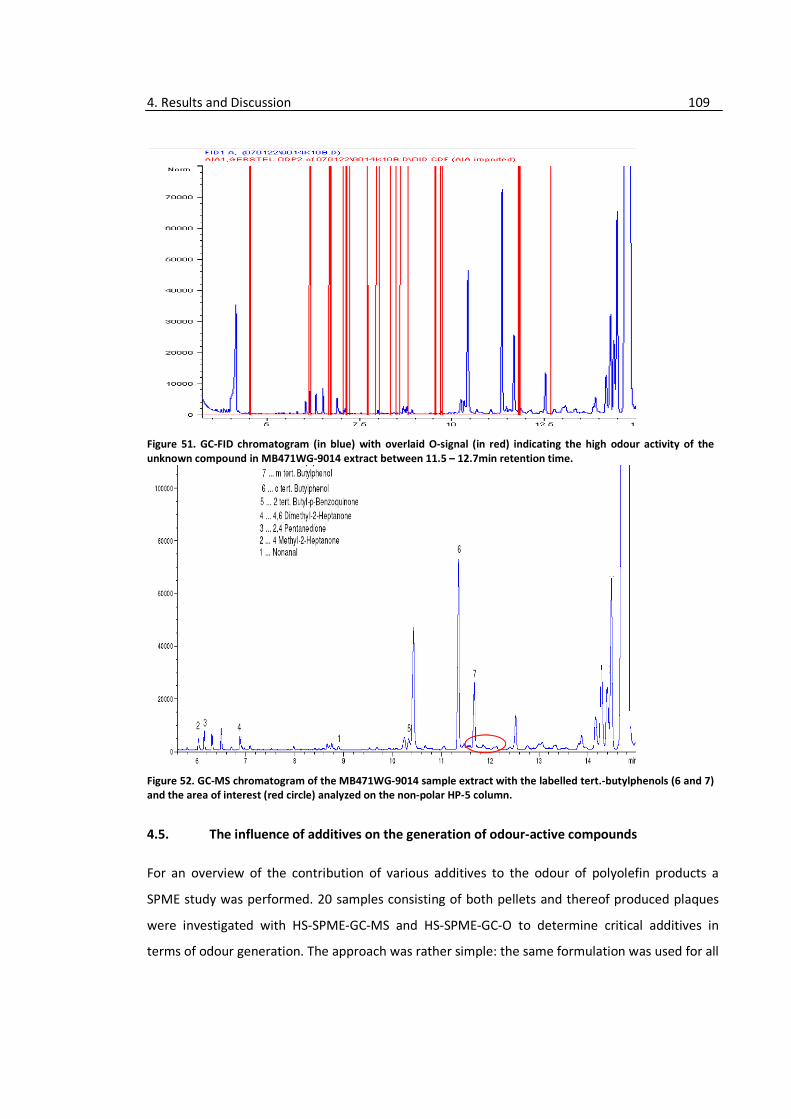
4. Results and Discussion 109
Figure 51. GC-FID chromatogram (in blue) with overlaid O-signal (in red) indicating the high odour activity of the
unknown compound in MB471WG-9014 extract between 11.5 – 12.7min retention time.
Figure 52. GC-MS chromatogram of the MB471WG-9014 sample extract with the labelled tert.-butylphenols (6 and 7)
and the area of interest (red circle) analyzed on the non-polar HP-5 column.
4.5. The influence of additives on the generation of odour-active compounds
For an overview of the contribution of various additives to the odour of polyolefin products a
SPME study was performed. 20 samples consisting of both pellets and thereof produced plaques
were investigated with HS-SPME-GC-MS and HS-SPME-GC-O to determine critical additives in
terms of odour generation. The approach was rather simple: the same formulation was used for all
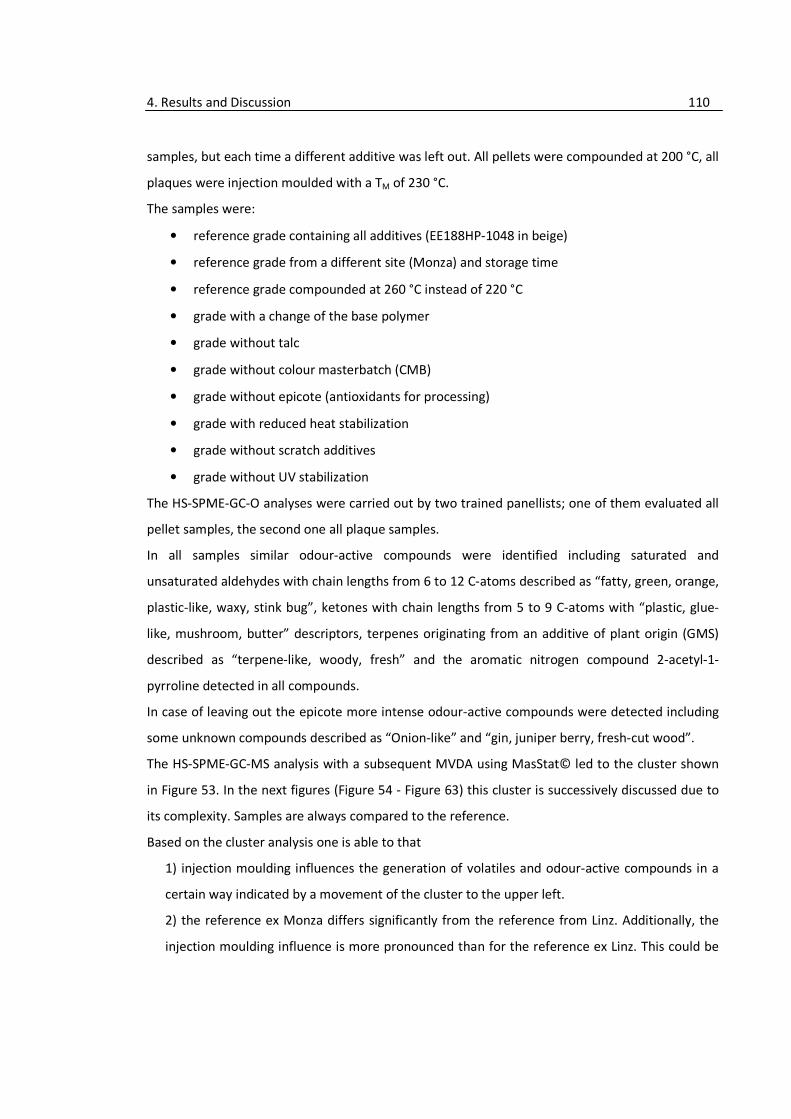
4. Results and Discussion 110
samples, but each time a different additive was left out. All pellets were compounded at 200 °C, all
plaques were injection moulded with a TM of 230 °C.
The samples were:
• reference grade containing all additives (EE188HP-1048 in beige)
• reference grade from a different site (Monza) and storage time
• reference grade compounded at 260 °C instead of 220 °C
• grade with a change of the base polymer
• grade without talc
• grade without colour masterbatch (CMB)
• grade without epicote (antioxidants for processing)
• grade with reduced heat stabilization
• grade without scratch additives
• grade without UV stabilization
The HS-SPME-GC-O analyses were carried out by two trained panellists; one of them evaluated all
pellet samples, the second one all plaque samples.
In all samples similar odour-active compounds were identified including saturated and
unsaturated aldehydes with chain lengths from 6 to 12 C-atoms described as “fatty, green, orange,
plastic-like, waxy, stink bug”, ketones with chain lengths from 5 to 9 C-atoms with “plastic, glue-
like, mushroom, butter” descriptors, terpenes originating from an additive of plant origin (GMS)
described as “terpene-like, woody, fresh” and the aromatic nitrogen compound 2-acetyl-1-
pyrroline detected in all compounds.
In case of leaving out the epicote more intense odour-active compounds were detected including
some unknown compounds described as “Onion-like” and “gin, juniper berry, fresh-cut wood”.
The HS-SPME-GC-MS analysis with a subsequent MVDA using MasStat© led to the cluster shown
in Figure 53. In the next figures (Figure 54 - Figure 63) this cluster is successively discussed due to
its complexity. Samples are always compared to the reference.
Based on the cluster analysis one is able to that
1) injection moulding influences the generation of volatiles and odour-active compounds in a
certain way indicated by a movement of the cluster to the upper left.
2) the reference ex Monza differs significantly from the reference from Linz. Additionally, the
injection moulding influence is more pronounced than for the reference ex Linz. This could be
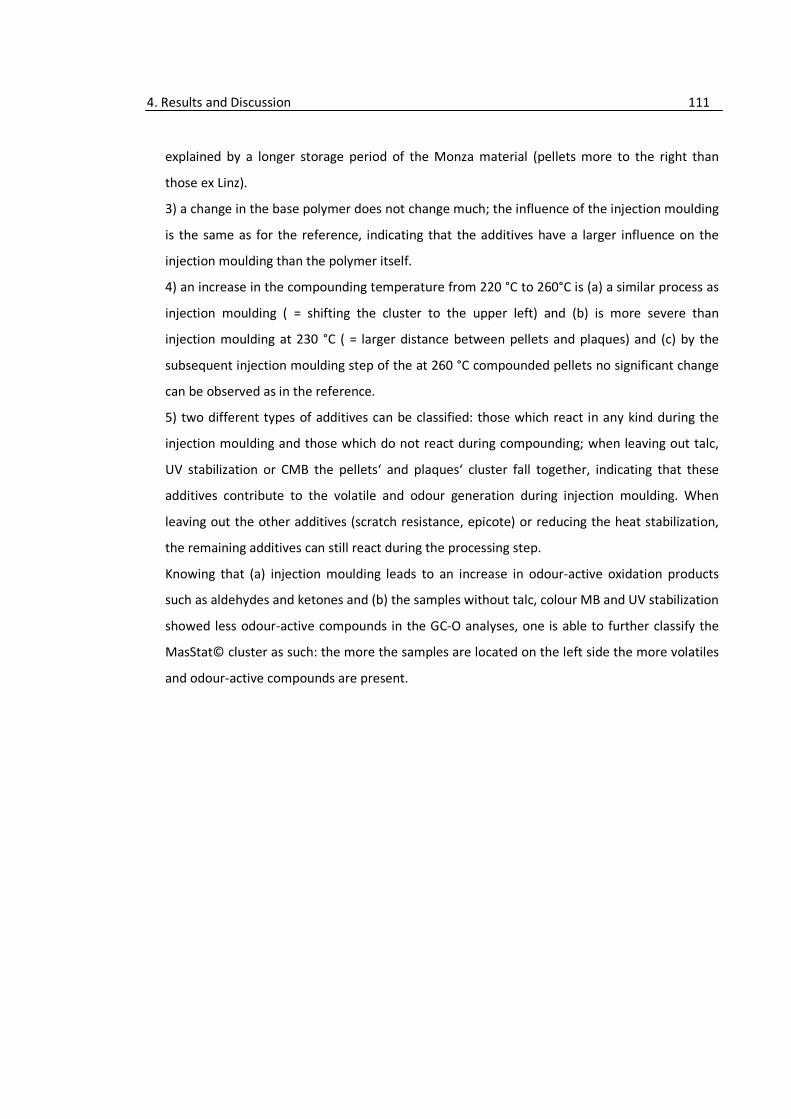
4. Results and Discussion 111
explained by a longer storage period of the Monza material (pellets more to the right than
those ex Linz).
3) a change in the base polymer does not change much; the influence of the injection moulding
is the same as for the reference, indicating that the additives have a larger influence on the
injection moulding than the polymer itself.
4) an increase in the compounding temperature from 220 °C to 260°C is (a) a similar process as
injection moulding ( = shifting the cluster to the upper left) and (b) is more severe than
injection moulding at 230 °C ( = larger distance between pellets and plaques) and (c) by the
subsequent injection moulding step of the at 260 °C compounded pellets no significant change
can be observed as in the reference.
5) two different types of additives can be classified: those which react in any kind during the
injection moulding and those which do not react during compounding; when leaving out talc,
UV stabilization or CMB the pellets‘ and plaques‘ cluster fall together, indicating that these
additives contribute to the volatile and odour generation during injection moulding. When
leaving out the other additives (scratch resistance, epicote) or reducing the heat stabilization,
the remaining additives can still react during the processing step.
Knowing that (a) injection moulding leads to an increase in odour-active oxidation products
such as aldehydes and ketones and (b) the samples without talc, colour MB and UV stabilization
showed less odour-active compounds in the GC-O analyses, one is able to further classify the
MasStat© cluster as such: the more the samples are located on the left side the more volatiles
and odour-active compounds are present.
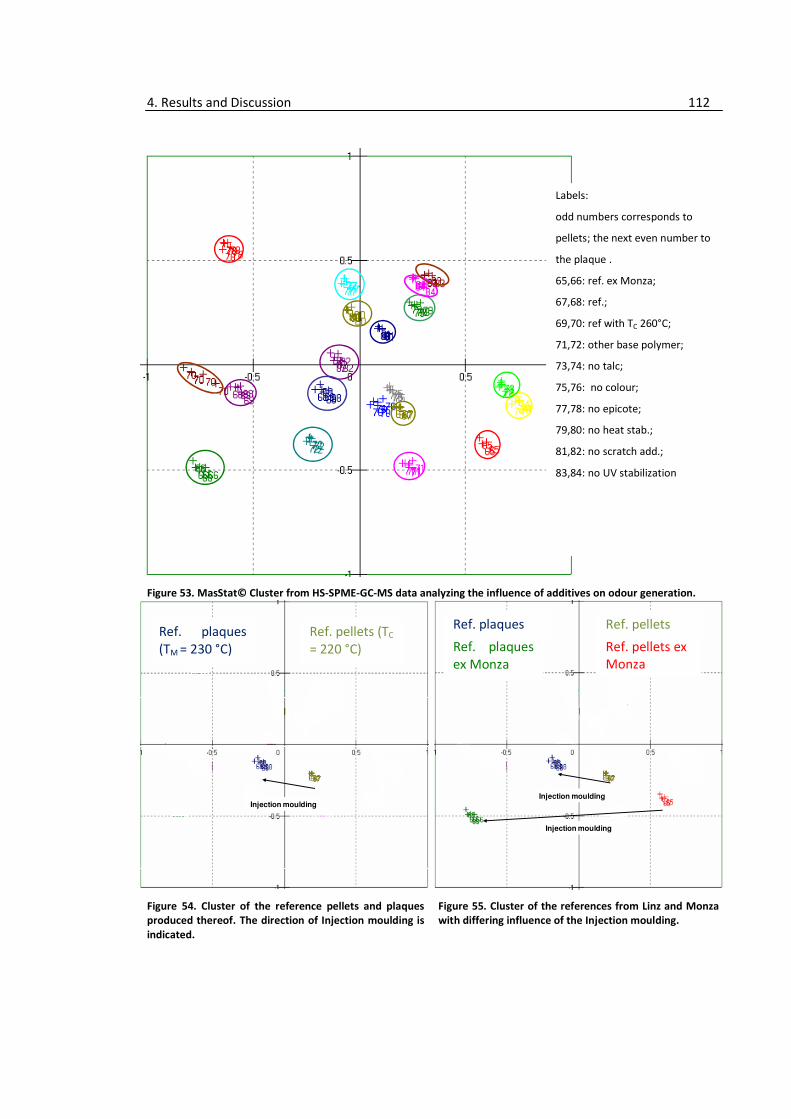
4. Results and Discussion 112
Figure 53. MasStat© Cluster from HS-SPME-GC-MS data analyzing the influence of additives on odour generation.
Figure 54. Cluster of the reference pellets and plaques
produced thereof. The direction of Injection moulding is
indicated.
Figure 55. Cluster of the references from Linz and Monza
with differing influence of the Injection moulding.
Injection mouldingInjection moulding
Injection moulding
Ref. plaques
(TM = 230 °C)
Ref. pellets (TC
= 220 °C)
Ref. plaques Ref. pellets
Ref. plaques
ex Monza
Ref. pellets ex
Monza
Labels:
odd numbers corresponds to
pellets; the next even number to
the plaque .
65,66: ref. ex Monza;
67,68: ref.;
69,70: ref with TC 260°C;
71,72: other base polymer;
73,74: no talc;
75,76: no colour;
77,78: no epicote;
79,80: no heat stab.;
81,82: no scratch add.;
83,84: no UV stabilization
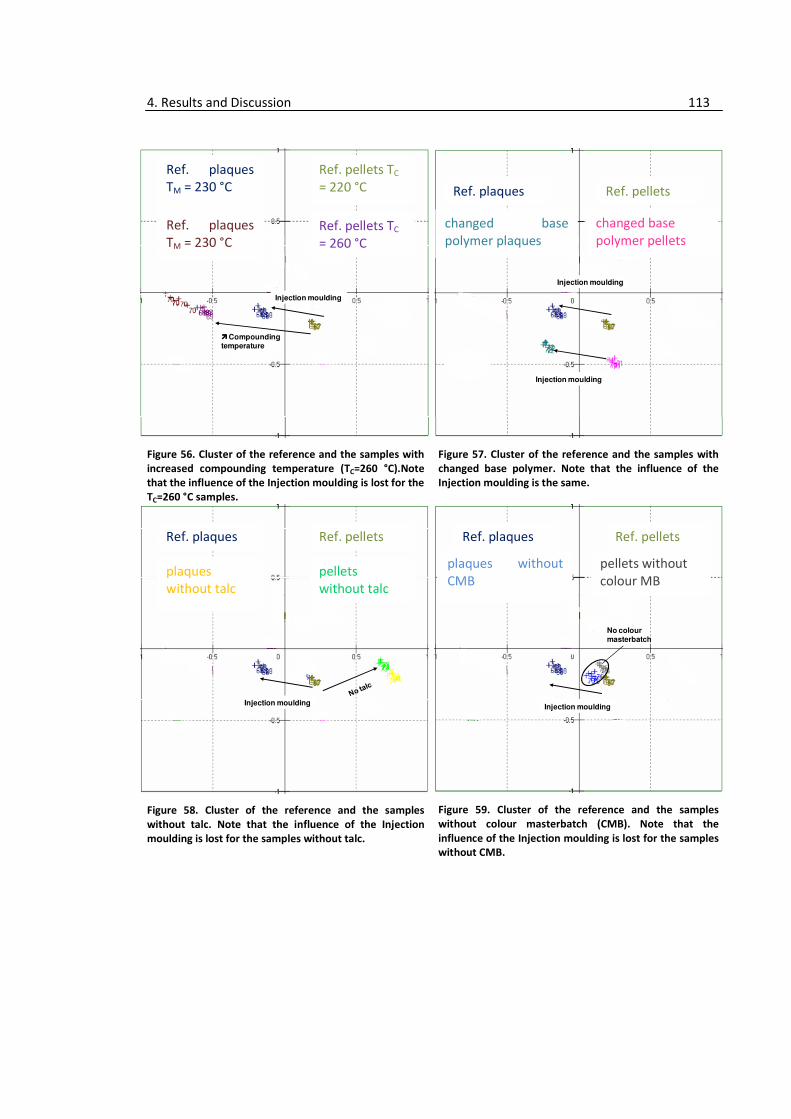
4. Results and Discussion 113
Figure 56. Cluster of the reference and the samples with
increased compounding temperature (TC=260 °C).Note
that the influence of the Injection moulding is lost for the
TC=260 °C samples.
Figure 57. Cluster of the reference and the samples with
changed base polymer. Note that the influence of the
Injection moulding is the same.
Figure 58. Cluster of the reference and the samples
without talc. Note that the influence of the Injection
moulding is lost for the samples without talc.
Figure 59. Cluster of the reference and the samples
without colour masterbatch (CMB). Note that the
influence of the Injection moulding is lost for the samples
without CMB.
���� Compounding temperature
Injection moulding
Injection moulding
Injection moulding
Injection mouldingInjection moulding
No colour masterbatch
Ref. plaques
TM = 230 °C
Ref. pellets TC
= 220 °C
Ref. plaques
TM = 230 °C Ref. pellets TC
= 260 °C
Ref. plaques Ref. pellets
changed base
polymer plaques
changed base
polymer pellets
Ref. plaques Ref. pellets Ref. plaques Ref. pellets
plaques
without talc
pellets
without talc
plaques without
CMB
pellets without
colour MB
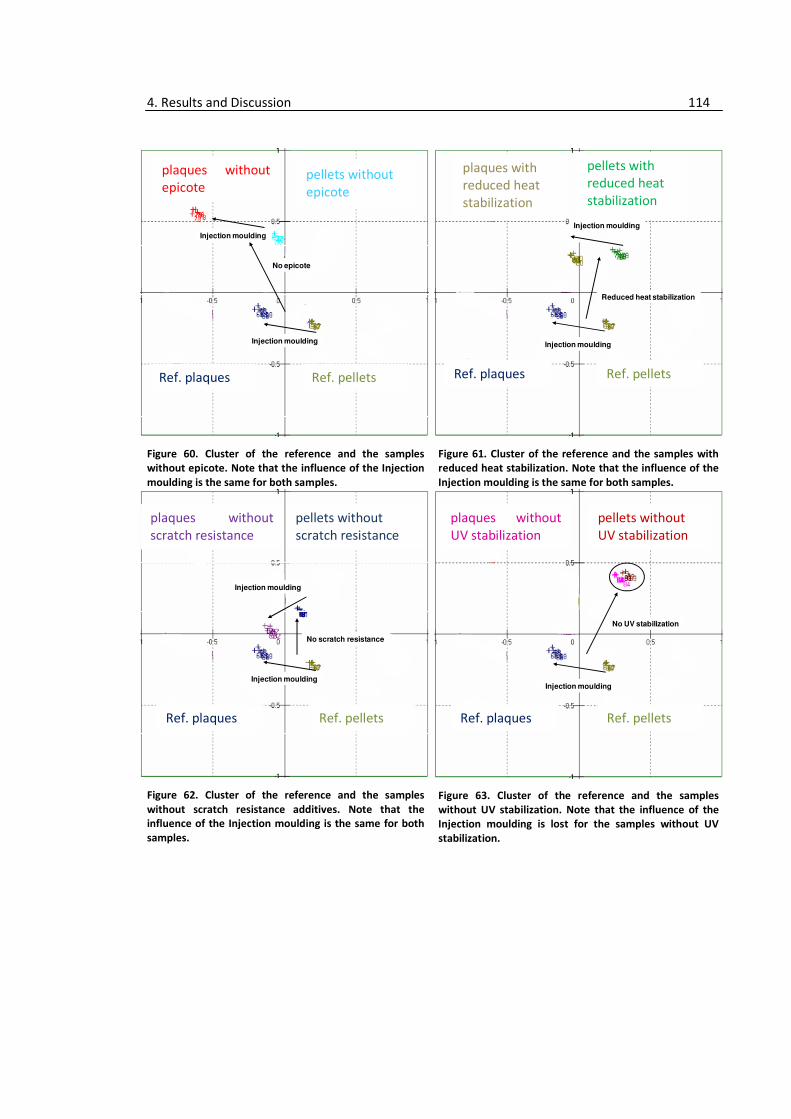
4. Results and Discussion 114
Figure 60. Cluster of the reference and the samples
without epicote. Note that the influence of the Injection
moulding is the same for both samples.
Figure 61. Cluster of the reference and the samples with
reduced heat stabilization. Note that the influence of the
Injection moulding is the same for both samples.
Figure 62. Cluster of the reference and the samples
without scratch resistance additives. Note that the
influence of the Injection moulding is the same for both
samples.
Figure 63. Cluster of the reference and the samples
without UV stabilization. Note that the influence of the
Injection moulding is lost for the samples without UV
stabilization.
Injection moulding
Injection moulding
No epicote
Injection moulding
Injection moulding
Reduced heat stabilization
Injection moulding
Injection moulding
No scratch resistance
Injection moulding
No UV stabilization
plaques without
epicote pellets without
epicote
plaques with
reduced heat
stabilization
pellets with
reduced heat
stabilization
Ref. plaques Ref. pellets Ref. plaques Ref. pellets
Ref. plaques
pellets without
scratch resistance
Ref. plaques
pellets without
UV stabilization
plaques without
scratch resistance
Ref. pellets
plaques without
UV stabilization
Ref. pellets
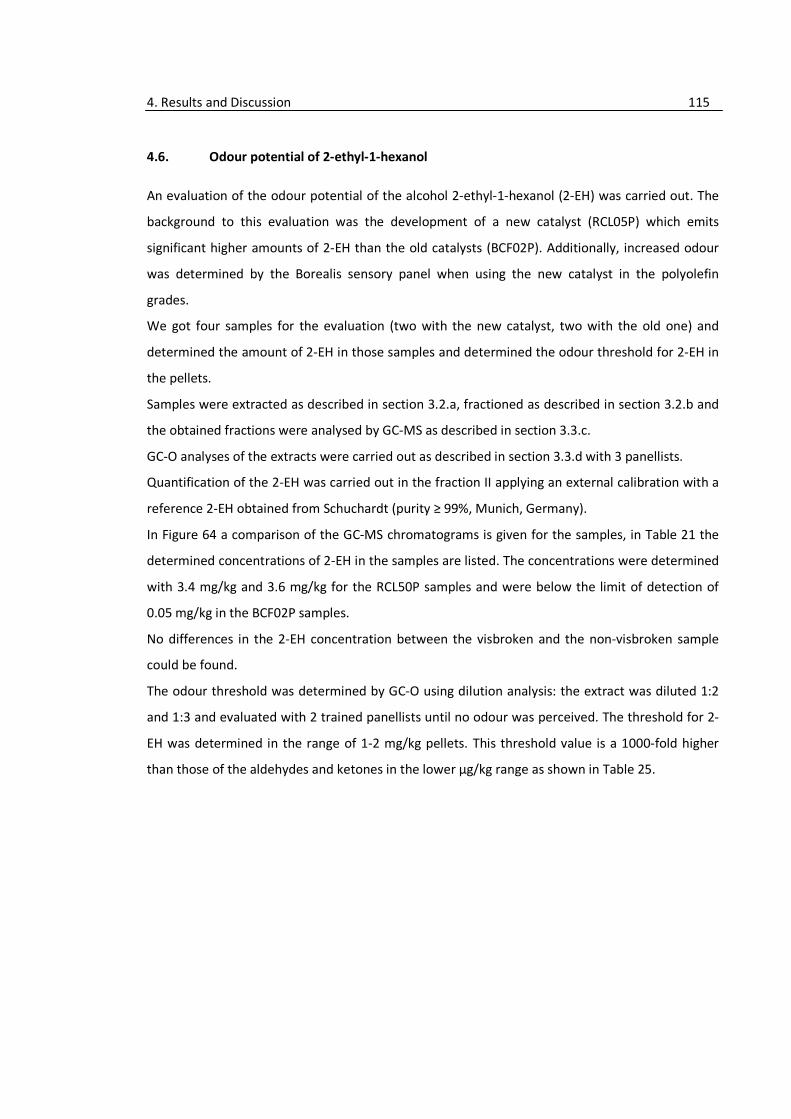
4. Results and Discussion 115
4.6. Odour potential of 2-ethyl-1-hexanol
An evaluation of the odour potential of the alcohol 2-ethyl-1-hexanol (2-EH) was carried out. The
background to this evaluation was the development of a new catalyst (RCL05P) which emits
significant higher amounts of 2-EH than the old catalysts (BCF02P). Additionally, increased odour
was determined by the Borealis sensory panel when using the new catalyst in the polyolefin
grades.
We got four samples for the evaluation (two with the new catalyst, two with the old one) and
determined the amount of 2-EH in those samples and determined the odour threshold for 2-EH in
the pellets.
Samples were extracted as described in section 3.2.a, fractioned as described in section 3.2.b and
the obtained fractions were analysed by GC-MS as described in section 3.3.c.
GC-O analyses of the extracts were carried out as described in section 3.3.d with 3 panellists.
Quantification of the 2-EH was carried out in the fraction II applying an external calibration with a
reference 2-EH obtained from Schuchardt (purity ≥ 99%, Munich, Germany).
In Figure 64 a comparison of the GC-MS chromatograms is given for the samples, in Table 21 the
determined concentrations of 2-EH in the samples are listed. The concentrations were determined
with 3.4 mg/kg and 3.6 mg/kg for the RCL50P samples and were below the limit of detection of
0.05 mg/kg in the BCF02P samples.
No differences in the 2-EH concentration between the visbroken and the non-visbroken sample
could be found.
The odour threshold was determined by GC-O using dilution analysis: the extract was diluted 1:2
and 1:3 and evaluated with 2 trained panellists until no odour was perceived. The threshold for 2-
EH was determined in the range of 1-2 mg/kg pellets. This threshold value is a 1000-fold higher
than those of the aldehydes and ketones in the lower µg/kg range as shown in Table 25.
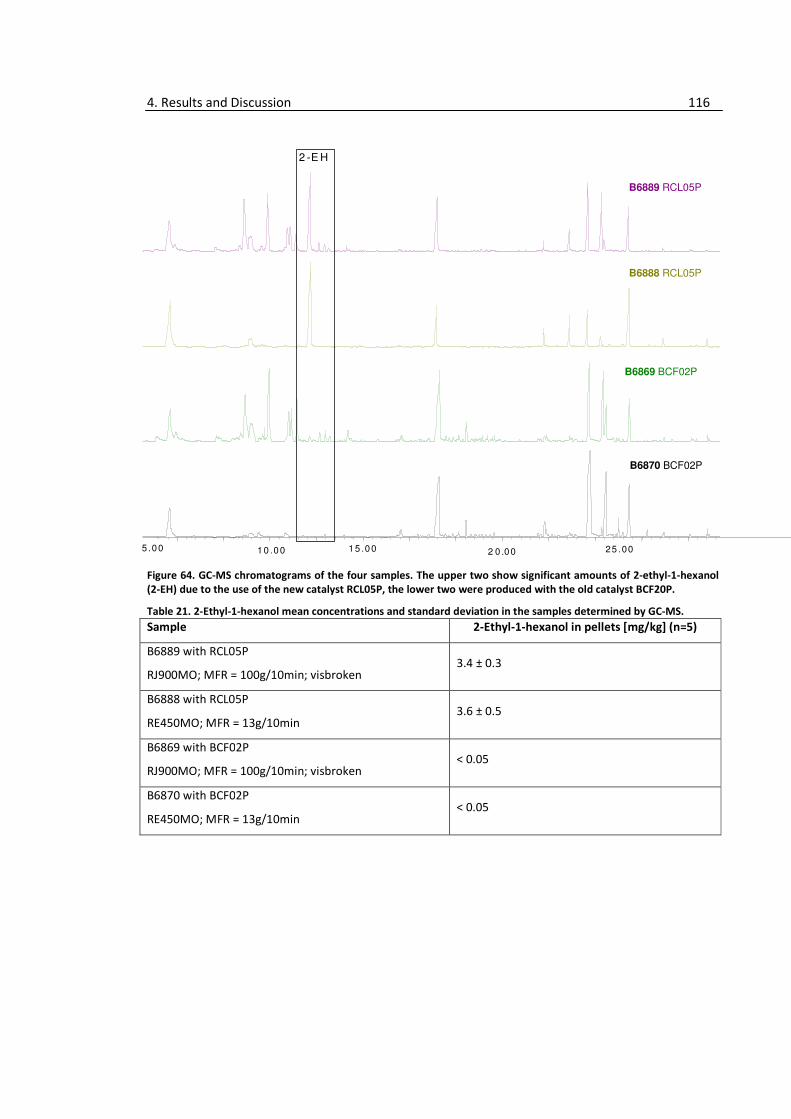
4. Results and Discussion 116
Figure 64. GC-MS chromatograms of the four samples. The upper two show significant amounts of 2-ethyl-1-hexanol
(2-EH) due to the use of the new catalyst RCL05P, the lower two were produced with the old catalyst BCF20P.
Table 21. 2-Ethyl-1-hexanol mean concentrations and standard deviation in the samples determined by GC-MS.
Sample 2-Ethyl-1-hexanol in pellets [mg/kg] (n=5)
B6889 with RCL05P
RJ900MO; MFR = 100g/10min; visbroken 3.4 ± 0.3
B6888 with RCL05P
RE450MO; MFR = 13g/10min 3.6 ± 0.5
B6869 with BCF02P
RJ900MO; MFR = 100g/10min; visbroken < 0.05
B6870 with BCF02P
RE450MO; MFR = 13g/10min < 0.05
5 .00 10 .00 15 .00 2 0 .00 25 .00
2 -E H
B6870 BCF02P
B6869 BCF02P
B6888 RCL05P
B6889 RCL05P

4. Results and Discussion 117
OCH3
CH3
CH3
C CH2O
CH3
CH3
C OCH2
CH3
CH3
C CH3O
CH3
CH3
C
4.7. The influence of vis-breaking reagents (peroxides) on the generation of odour-active
compounds
Based on the results from the additive screening (see section 4.5) in the second year of the thesis
the influence of peroxides on the generation of odour-active compounds was investigated.
Peroxides are used for a controlled decrease of the average molecular mass of the PP in
combination with a narrower molecular weight distribution (MWD) for production of the so called
visbroken (VB-PP) or controlled rheology PP (CR-PP) grades. A narrower MWD results in less
wrapage, more uniform shrinkage and better drawdown during extrusion; on the other hand less
stiffness and the loss of melt strength occur.
We evaluated the influence of two different peroxide systems on the odour by HS-SPME-GC-MS
with subsequent MVDA using MasStat© and by GC-O using extracts obtained from selected grades
(HD120MO with no peroxide as reference, HD120MO + Tx101 and HD120MO + Tx301) as shown in
Table 23.
Samples were selected to evaluate various aspects of the peroxide visbreaking and the influence
on the generation of odour-active compounds:
• two peroxide systems (2,5-dimethyl-2,5-di(tert-butylperoxy)hexane (Tx101) and 3,6,9-
triethyl-3,6,9-trimethyl-1,4,7-triperoxonane (Tx301)
• used in two polymers (HD120MO and RJ370MO) from different sites (Linz and Schwechat)
• applying different peroxide concentrations measured by MFR [g/10min] from 8 (reference
without peroxide), 12.5, ..., 100
• applying different peroxide dosing (masterbatch (MB) and liquid)
Figure 65. Chemical structure of Tx101.
Figure 66. Chemical structure of Tx301.
CH3
CH3
CH3
C
CH2
O O
O O
C CO O
CH2CH3 CH3
CH3CH2
4. Results and Discussion 118
Table 22. List of peroxide samples analyzed in the study. Samples in italic were used in the GC-O analyses.
peroxide dosing Polymer MFR [g/10min] peroxide system
MB HD120MO
8 (reference) -
12.5 Tx101
50 Tx101 Tx 301
100 Tx101
liquid RJ370MO 45 Tx101 Tx301
In Figure 67 the MasStat© cluster obtained from the HS-SPME-GC-MS data is shown:
• samples are clearly separated indicating a different volatile pattern
• separation of the samples is based on the peroxide system rather than the polymer as the
TX101 samples are located on the right side and the Tx301 samples are located on the left
side of the cluster irrespective what polymer (HD120MO or Rj370MO) is used.
• HD120MO samples containing increasing amounts of Tx101 fall together on a straight line
indicating the generation of the same volatiles in increasing amounts.
• different types of dosage lead to similar results as the RJ370MO samples (liquid dosage)
and the HD120MO samples (MB dosage) are close to each other.
A deeper look into the HS-SPME-GC-MS data shows a total different volatile composition for the
two different peroxide systems (see Figure 68). Table 23 summarizes the differences in both
polymer materials for selected compounds calculated with Tx101 as reference (=100%). For most
cases the same results can be found for both polymers except for the methyl-tert.-butyl ether
which appeared only in the RJ370MO with both peroxide systems. Due to the different molecular
structure of the Tx101 and Tx301 the different volatile pattern are easily explained; e.g. lack
Tx301-containing samples acetone and tert.-butanol while Tx101-containing samples do not show
the presence of acetates.
In terms of odour a summary of the SNIF diagrams is given in Figure 69 where the odour pattern
for the HD120MO reference is compared to the HD120MO with Tx101 (MFR 50 g/10min) and to
the HD120MO with Tx301 (MFR 50 g/10min).
By addition of peroxide the number of odour-active compounds with a high impact (SNIF=100 %) is
increased (from 8 for the reference to 12 for the Tx101 and 10 for the Tx301 material). These
odour-active compounds can be grouped in
• odour-active aldehyde and ketones which are present in the reference as well but in
smaller concentrations
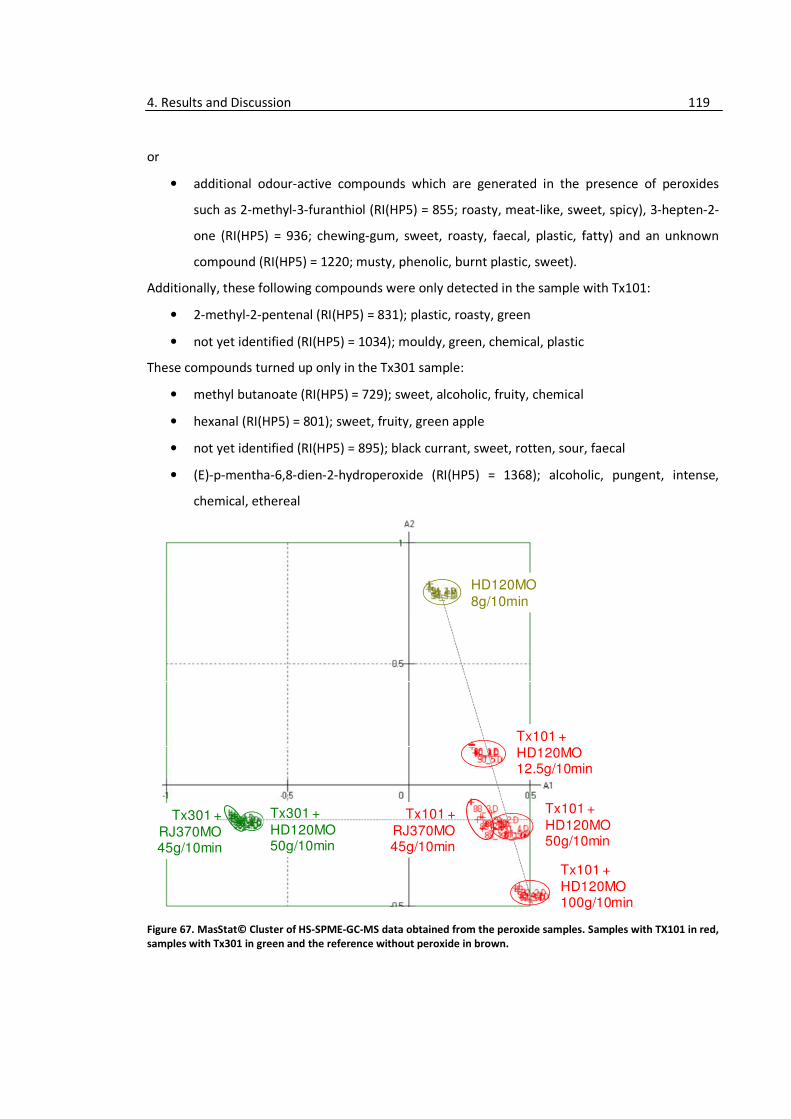
4. Results and Discussion 119
or
• additional odour-active compounds which are generated in the presence of peroxides
such as 2-methyl-3-furanthiol (RI(HP5) = 855; roasty, meat-like, sweet, spicy), 3-hepten-2-
one (RI(HP5) = 936; chewing-gum, sweet, roasty, faecal, plastic, fatty) and an unknown
compound (RI(HP5) = 1220; musty, phenolic, burnt plastic, sweet).
Additionally, these following compounds were only detected in the sample with Tx101:
• 2-methyl-2-pentenal (RI(HP5) = 831); plastic, roasty, green
• not yet identified (RI(HP5) = 1034); mouldy, green, chemical, plastic
These compounds turned up only in the Tx301 sample:
• methyl butanoate (RI(HP5) = 729); sweet, alcoholic, fruity, chemical
• hexanal (RI(HP5) = 801); sweet, fruity, green apple
• not yet identified (RI(HP5) = 895); black currant, sweet, rotten, sour, faecal
• (E)-p-mentha-6,8-dien-2-hydroperoxide (RI(HP5) = 1368); alcoholic, pungent, intense,
chemical, ethereal
Figure 67. MasStat© Cluster of HS-SPME-GC-MS data obtained from the peroxide samples. Samples with TX101 in red,
samples with Tx301 in green and the reference without peroxide in brown.
HD120MO
8g/10min
Tx301 +
RJ370MO45g/10min
Tx101 +
RJ370MO45g/10min
Tx101 +
HD120MO12.5g/10min
Tx101 +
HD120MO50g/10min
Tx101 +
HD120MO100g/10min
Tx301 +
HD120MO50g/10min

4. Results and Discussion 120
Figure 68. HS-SPME-GC-MS chromatograms of the analyzed data showing clear differences between the two peroxide
systems Tx101 and Tx301.
Table 23. Differences in selected compounds representative for the use of Tx301 and Tx101. Tx101 was used as
reference, values are expressed as difference to the use of Tx101.
Changes compared to the use of Tx101 RJ370MO + Tx301 HD120MO + Tx301
formaldehyde +35% +118%
acetaldehyde +76% -4%
methanol +55% only in Tx101
2-methyl-1-propene only in Tx101 only in Tx101
ethanol +343% +162%
acetone only in Tx101 only in Tx101
tert.-butanol only in Tx101 only in Tx101
methyl acetate only in Tx301 only in Tx301
methyl tert.-butyl ether -79% +22%
2-butanone +185% +90%
ethyl acetate only in Tx301 only in Tx301
tert.-pentanol only in Tx101 only in Tx101
pentanal +11% +71%
HD120MO reference
HD120MO + Tx101
(12.5g/10min)
HD120MO + Tx101
(50g/10min)
HD120MO + Tx101
(100g/10min)
HD120MO + Tx301
(50g/10min)
RJ370MO + Tx301
(45g/10min)
RJ370MO + Tx101
(45g/10min)
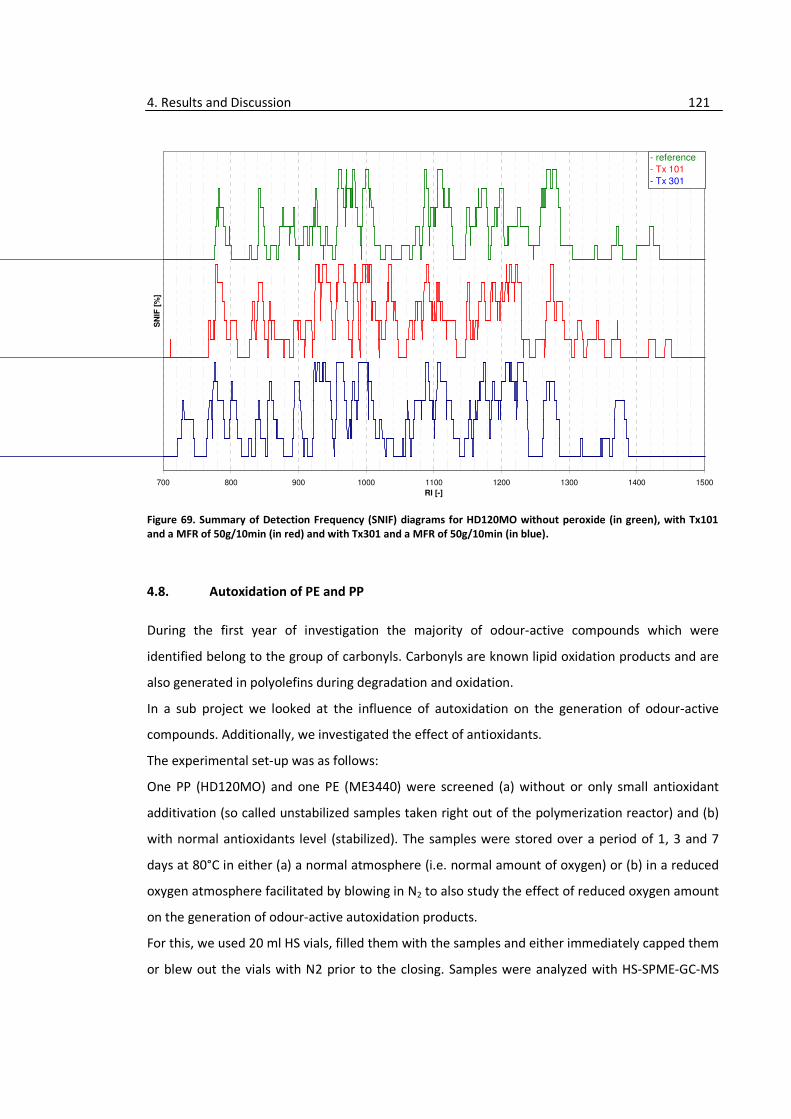
4. Results and Discussion 121
Figure 69. Summary of Detection Frequency (SNIF) diagrams for HD120MO without peroxide (in green), with Tx101
and a MFR of 50g/10min (in red) and with Tx301 and a MFR of 50g/10min (in blue).
4.8. Autoxidation of PE and PP
During the first year of investigation the majority of odour-active compounds which were
identified belong to the group of carbonyls. Carbonyls are known lipid oxidation products and are
also generated in polyolefins during degradation and oxidation.
In a sub project we looked at the influence of autoxidation on the generation of odour-active
compounds. Additionally, we investigated the effect of antioxidants.
The experimental set-up was as follows:
One PP (HD120MO) and one PE (ME3440) were screened (a) without or only small antioxidant
additivation (so called unstabilized samples taken right out of the polymerization reactor) and (b)
with normal antioxidants level (stabilized). The samples were stored over a period of 1, 3 and 7
days at 80°C in either (a) a normal atmosphere (i.e. normal amount of oxygen) or (b) in a reduced
oxygen atmosphere facilitated by blowing in N2 to also study the effect of reduced oxygen amount
on the generation of odour-active autoxidation products.
For this, we used 20 ml HS vials, filled them with the samples and either immediately capped them
or blew out the vials with N2 prior to the closing. Samples were analyzed with HS-SPME-GC-MS
700 800 900 1000 1100 1200 1300 1400 1500
RI [-]
SN
IF [
%]
- reference
- Tx 101
- Tx 301
4. Results and Discussion 122
and HS-SPME-GC-O. For a better use of the gained results samples were also analyzed using FTIR
observing typical oxidation bands and calculating the Carbonyl Index (CI).
We received the samples in dark glass bottles intensely “aerated” with N2 before filling and stored
them in a freezer until use. As the non-stabilized samples were taken directly from the
polymerization reactor in a powdery form, the stabilized samples were milled under liquid N2 to
get comparable surface as non-stabilised powder as autoxidation processes are surface-driven
reactions.
4.8.a. Results of the PP (HD120MO) samples
In Figure 70 the MasStat© cluster of all PP samples is shown. As expected, unstabilized samples
show a stronger answer to ageing as stabilized ones seen by larger differences between sampling
points. In this cluster stabilised samples fall together in one cluster proving that stabilisation of
samples works to a certain extent as also shown in Figure 71 and Figure 72, where HS-SPME-GC-
MS chromatograms for unstabilized and stabilized PP samples are compared. A similar trend in
volatile generation can be seen but in different amount e.g. by generation of acids with increasing
storage time (i.e. “triangles”) (3 and 7 days in unstabilized and stabilized samples). Reduction of
oxygen by blowing in nitrogen (called “nitrogen” samples) results in only small changes as seen in
the overall cluster where air and nitrogen samples are only little separated with a tendency of less
oxidation than in the air sample.
In terms of odour following conclusions can be drawn and seen in Figure 73:
• With increasing oxidation time the number of odour-active compounds with high
relevancy (SNIF value of 100 %) increased.
• No differences between stabilized and unstabilized samples in the odour pattern could be
found, but in unstabilized samples much higher amounts of volatiles are generated
especially acids (e.g. acetic acid) turn up after one day. This indicates similar oxidation
processes in both samples regardless of the stabilization.
• A slightly smaller number of odour-active compounds with high SNIF values (100 %) was
observed in nitrogen samples compared to air samples.
• Odour-active compounds (bold ones with high odour relevancy) include 1-hexen-3-one,
hexanal, 2,3-butandione, 2,3-pentandione, 2-methyl-2pPentenal, 1-hepten-3-one,
heptanal, 2-acetyl-1-pyrroline, 3-hepten-2-one, (E)-2-heptenal, 1-octen-3-one, octanal,
(E,E)-2,4-heptadienal, (E)-2-octenal, 3-octen-2-one, 1-nonen-3-one, 6- / 8-nonenal, (E,E)-
2,4-octadienal, (E)-2-nonenal, decanal, γ-octalactone, (E)-2-decenal and (E)-2-undecenal.

4. Results and Discussion 123
We tried to use FTIR for reference measurements to determine after what period the FTIR is
able to detect the degradation of the samples by using the Carbonyl Index (CI) as described in
3.4.a.
For the calculation of the CI we used both the area and the peak height, but in no case we
were able to find a trend indicating an increase in degradation with FTIR and subsequent CI
calculations. One possible explanation could be the heavy thermal treatment especially of the
unstabilized samples during the film pressing at 220°C. But even for the stabilized samples no
trend was observed. We then switched to NIR as alternative as described in 3.4.b and were
able to achieve good correlation by partial least square regression as described in 3.4.b. The
calibration curves are shown in Figure 77,
Using NIR measurements of the stabilized and unstabilized PP samples resulted in good
correlation and multivariate calibration was possible.
Data was pre-treated with multiplicative scatter correction to minimise non-specific scatter
phenomena. No outliner could be detected by Principal Component Analysis (PCA).
Distinct wavelengths responsible for Autoxidation could not be identified and so all wave
numbers from 4000 – 10000-1 were used for establishment of calibration model. Models
shown are cross-validated, which is a proof that the established model describes well the
happening. R-Square values are nearly 1 for both calibration and cross-validation curves.
However, a separation between samples stored in normal air and in a reduced oxygen
atmosphere was not achieved.
The same was observed for the GC-O analyses indicating that after the oxygen reduction still
enough oxygen was present for oxidative processes.
This is also important, as for preventing oxidation during processing or compounding very low
amounts of oxygen are needed to achieve an effect as described by Epacher et al.15.

4. Results and Discussion 124
Figure 70. MasStat© Cluster obtained from the HS-SPME-GC-MS data of the unstabilized (unstab.) and stabilized PP
samples stored for 0 (ref), 1 (1d), 3 (3d) and 7 (7d) days at 80 °C in normal atmosphere (air) or in reduced oxygen
atmosphere (N2).
Figure 71. HS-SPME-GC-MS chromatograms of unstabilized PP samples stored @80 °C up to 7 days in normal
atmosphere.
Stabilised samples
unstab. PP, air, 3d unstab. PP,N2, 7d
unstab. PP,air, 7d
unstab. PP, N2, 3d
unstab. PP, N2, 1d
unstab. PP, air, 1dunstab. PP, reference
unstab. Ref in air
unstab. 1d in air
unstab. 3d in air
unstab. 7d in air
2.0
4.0
6.0
8.0
10.0
12.0
14.0
16.0
18.0
20.0
22.0
24.0
0
2000
4000
6000
8000
2.0
4.0
6.0
8.0
10.0
12.0
14.0
16.0
18.0
20.0
22.0
24.0
0
2000
4000
6000
8000
2.0
4.0
6.0
8.0
10.0
12.0
14.0
16.0
18.0
20.0
22.0
24.0
0
2000
4000
6000
8000
2.0
4.0
6.0
8.0
10.0
12.0
14.0
16.0
18.0
20.0
22.0
24.0
0
2000
4000
6000
8000

4. Results and Discussion 125
Figure 72. HS-SPME-GC-MS chromatograms of stabilized PP samples stored @80 °C up to 7 days in normal
atmosphere.
Figure 73. Detection Frequency (SNIF) diagrams of
unstabilized PP samples stored @80 °C in air for (a) 0
days, (b) 1 day (top right) and (c) 3 days (bottom left).
0
33
67
100
600 700 800 900 1000 1100 1200 1300 1400 1500
RI
SN
IF [
%]
number of
panelists = 3
0
33
67
100
600 700 800 900 1000 1100 1200 1300 1400 1500
RI
SN
IF [
%]
number of panelists = 3
0
33
67
100
600 700 800 900 1000 1100 1200 1300 1400 1500
RI
SN
IF [
%]
number of panelists = 3
(a) (b)
(c)
2.00 4.00 6.00 8.00 10.00 12.00 14.00 16.00 18.00 20.00 22.00 24.00 0
20000 40000 60000 80000
2.00 4.00 6.00 8.00 10.00 12.00 14.00 16.00 18.00 20.00 22.00 24.00 0
20000 40000 60000 80000
2.00 4.00 6.00 8.00 10.00 12.00 14.00 16.00 18.00 20.00 22.00 24.00 0
20000 40000 60000 80000
2.00 4.00 6.00 8.00 10.00 12.00 14.00 16.00 18.00 20.00 22.00 24.00 0
20000 40000 60000 80000
stab. Ref in air
stab. 1d in air
stab. 3d in air
stab. 7d in air
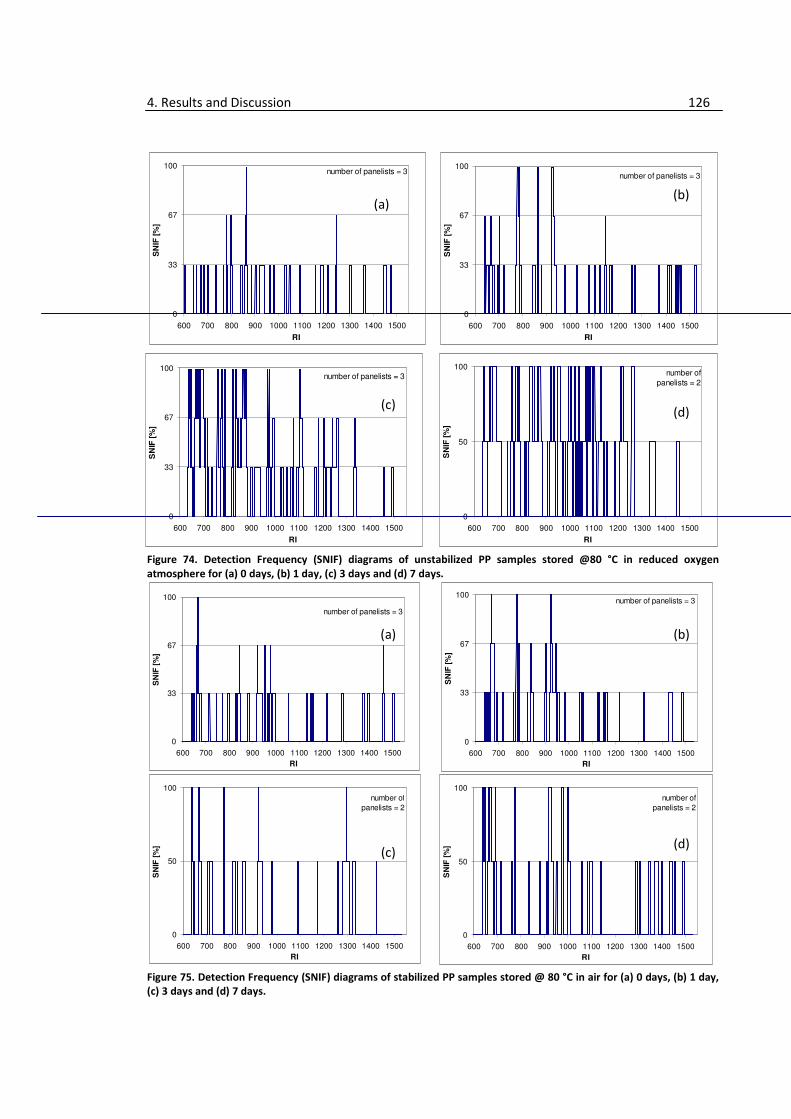
4. Results and Discussion 126
Figure 74. Detection Frequency (SNIF) diagrams of unstabilized PP samples stored @80 °C in reduced oxygen
atmosphere for (a) 0 days, (b) 1 day, (c) 3 days and (d) 7 days.
Figure 75. Detection Frequency (SNIF) diagrams of stabilized PP samples stored @ 80 °C in air for (a) 0 days, (b) 1 day,
(c) 3 days and (d) 7 days.
0
50
100
600 700 800 900 1000 1100 1200 1300 1400 1500
RI
SN
IF [
%]
number of
panelists = 2
0
50
100
600 700 800 900 1000 1100 1200 1300 1400 1500
RI
SN
IF [
%]
number of
panelists = 2
0
33
67
100
600 700 800 900 1000 1100 1200 1300 1400 1500
RI
SN
IF [
%]
number of panelists = 3
0
50
100
600 700 800 900 1000 1100 1200 1300 1400 1500
RI
SN
IF [
%]
number of
panelists = 2
0
33
67
100
600 700 800 900 1000 1100 1200 1300 1400 1500
RI
SN
IF [
%]
number of panelists = 3
0
33
67
100
600 700 800 900 1000 1100 1200 1300 1400 1500
RI
SN
IF [
%]
number of panelists = 3
0
33
67
100
600 700 800 900 1000 1100 1200 1300 1400 1500
RI
SN
IF [
%]
number of panelists = 3
(a) (b)
(c) (d)
(a)
0
33
67
100
600 700 800 900 1000 1100 1200 1300 1400 1500
RI
SN
IF [%
]
number of panelists = 3
(b)
(c) (d)
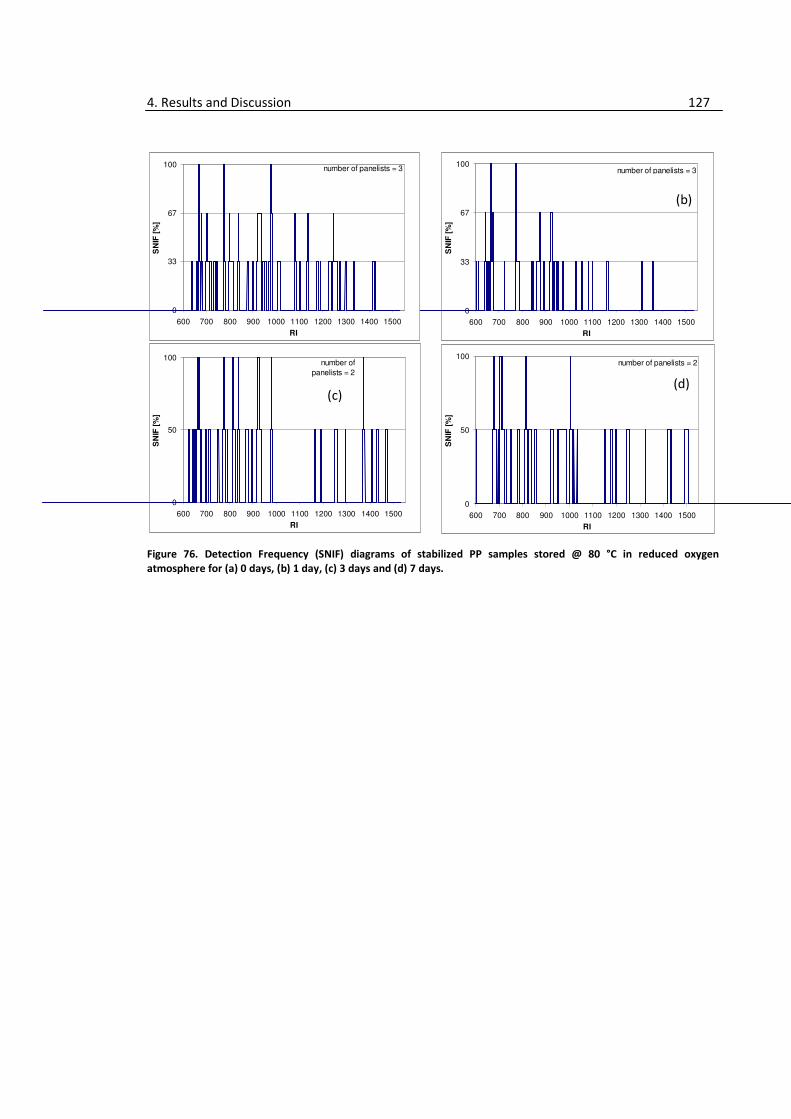
4. Results and Discussion 127
Figure 76. Detection Frequency (SNIF) diagrams of stabilized PP samples stored @ 80 °C in reduced oxygen
atmosphere for (a) 0 days, (b) 1 day, (c) 3 days and (d) 7 days.
0
50
100
600 700 800 900 1000 1100 1200 1300 1400 1500
RI
SN
IF [
%]
number of
panelists = 2
0
33
67
100
600 700 800 900 1000 1100 1200 1300 1400 1500
RI
SN
IF [
%]
number of panelists = 3
0
50
100
600 700 800 900 1000 1100 1200 1300 1400 1500
RI
SN
IF [
%]
number of panelists = 2
(a) (b)
(c) (d)
0
33
67
100
600 700 800 900 1000 1100 1200 1300 1400 1500
RI
SN
IF [
%]
number of panelists = 3

4. Results and Discussion
Figure 77. Multivariate calibration
samples in a reduced oxygen atmosphere
atmosphere and (e) unstabilized
Results and Discussion
Multivariate calibration and cross-validation curves for (a) all PP (HD120MO)
samples in a reduced oxygen atmosphere, (c) stabilized samples in air, (d) unstabilized
unstabilized samples in air.
(b)
(d)
128
PP (HD120MO) samples, (b) stabilized
unstabilized samples in a reduced oxygen
(a)
(c)
(e)
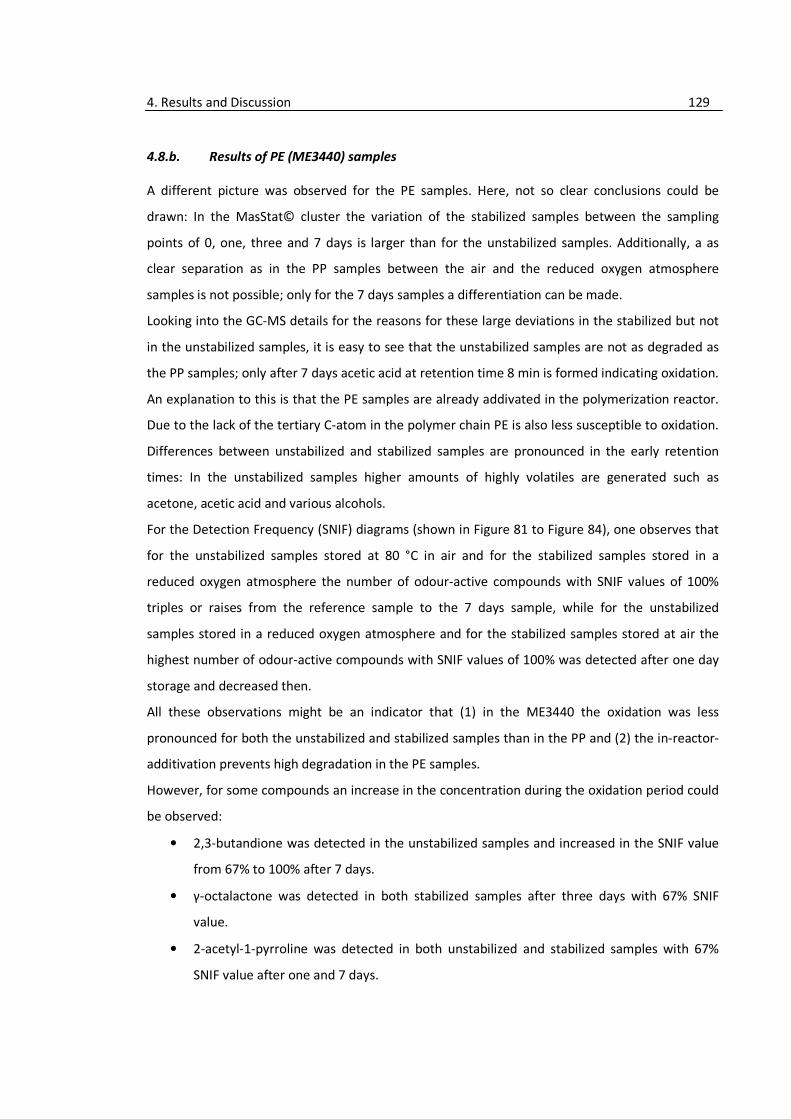
4. Results and Discussion 129
4.8.b. Results of PE (ME3440) samples
A different picture was observed for the PE samples. Here, not so clear conclusions could be
drawn: In the MasStat© cluster the variation of the stabilized samples between the sampling
points of 0, one, three and 7 days is larger than for the unstabilized samples. Additionally, a as
clear separation as in the PP samples between the air and the reduced oxygen atmosphere
samples is not possible; only for the 7 days samples a differentiation can be made.
Looking into the GC-MS details for the reasons for these large deviations in the stabilized but not
in the unstabilized samples, it is easy to see that the unstabilized samples are not as degraded as
the PP samples; only after 7 days acetic acid at retention time 8 min is formed indicating oxidation.
An explanation to this is that the PE samples are already addivated in the polymerization reactor.
Due to the lack of the tertiary C-atom in the polymer chain PE is also less susceptible to oxidation.
Differences between unstabilized and stabilized samples are pronounced in the early retention
times: In the unstabilized samples higher amounts of highly volatiles are generated such as
acetone, acetic acid and various alcohols.
For the Detection Frequency (SNIF) diagrams (shown in Figure 81 to Figure 84), one observes that
for the unstabilized samples stored at 80 °C in air and for the stabilized samples stored in a
reduced oxygen atmosphere the number of odour-active compounds with SNIF values of 100%
triples or raises from the reference sample to the 7 days sample, while for the unstabilized
samples stored in a reduced oxygen atmosphere and for the stabilized samples stored at air the
highest number of odour-active compounds with SNIF values of 100% was detected after one day
storage and decreased then.
All these observations might be an indicator that (1) in the ME3440 the oxidation was less
pronounced for both the unstabilized and stabilized samples than in the PP and (2) the in-reactor-
additivation prevents high degradation in the PE samples.
However, for some compounds an increase in the concentration during the oxidation period could
be observed:
• 2,3-butandione was detected in the unstabilized samples and increased in the SNIF value
from 67% to 100% after 7 days.
• γ-octalactone was detected in both stabilized samples after three days with 67% SNIF
value.
• 2-acetyl-1-pyrroline was detected in both unstabilized and stabilized samples with 67%
SNIF value after one and 7 days.

4. Results and Discussion 130
These compounds could be detected with high SNIF values in all samples both stabilized and un-
stabilized and already in the reference samples:
• 1-hexen-3-one
• 1-octen-3-one
• octanal
• 1-nonen-3-one
• 6/8-nonenal
NIR measurements of the stabilized and unstabilized PE samples were carried out and the results
used for a multivariate calibration. Good correlation was achieved and multivariate calibration was
possible as shown in Figure 85.
Data was pre-treated with multiplicative scatter correction to minimise non-specific scatter
phenomena. No outliner could be detected by Principal Component Analysis (PCA).
Distinct wavelengths responsible for Autoxidation could not be identified and so all wave numbers
from 4000 – 10000-1 were used for establishment of calibration model. Models shown are cross-
validated, which is a proof that the established model describes well the happening. R-Square
values are nearly 1 for both calibration and cross-validation curves, but are lower than those
obtained for the PP samples.
Again, it was not possible to distinguish between samples stored in normal air and in a reduced
oxygen atmosphere. For all plots the data points show a larger scattering than observed for the PP
samples. For the stabilized samples in a reduced oxygen atmosphere the calibration points for 3
and 7 days could not be separated; for all other plots separation between the individual sampling
days was achieved.

4. Results and Discussion 131
Figure 78. MasStat© Cluster obtained from the HS-SPME-GC-MS data of the unstabilized (unstab.) and stabilized
(stab.) PE samples stored for 0 (ref), 1 (1d), 3 (3d) and 7 (7d) days at 80 °C in normal atmosphere (air) or in reduced
oxygen atmosphere (N2).
Figure 79. HS-SPME-GC-MS chromatograms of unstabilized PE samples stored @80 °C up to 7 days in normal
atmosphere (air).
PE, stab., air, 7d
PE, stab., N2, 7d
PE, stab., air, 3d
PE, stab.,N2, 3d
PE, stab., air, 1d
PE, stab., N2, 1d
PE, stab., air, 0d
PE, stab., N2, 0d
PE, unstab. samples
2.00 4.00 6.00 8.00 10.00 12.00 14.00 16.00 18.00 20.00 22.00 24.000
50000
2.00 4.00 6.00 8.00 10.00 12.00 14.00 16.00 18.00 20.00 22.00 24.000
50000
2.00 4.00 6.00 8.00 10.00 12.00 14.00 16.00 18.00 20.00 22.00 24.000
50000
2.00 4.00 6.00 8.00 10.00 12.00 14.00 16.00 18.00 20.00 22.00 24.000
50000
Unstab. Ref. in air
Unstab. 1d in air
Unstab. 3d in air
Unstab. 7d in air
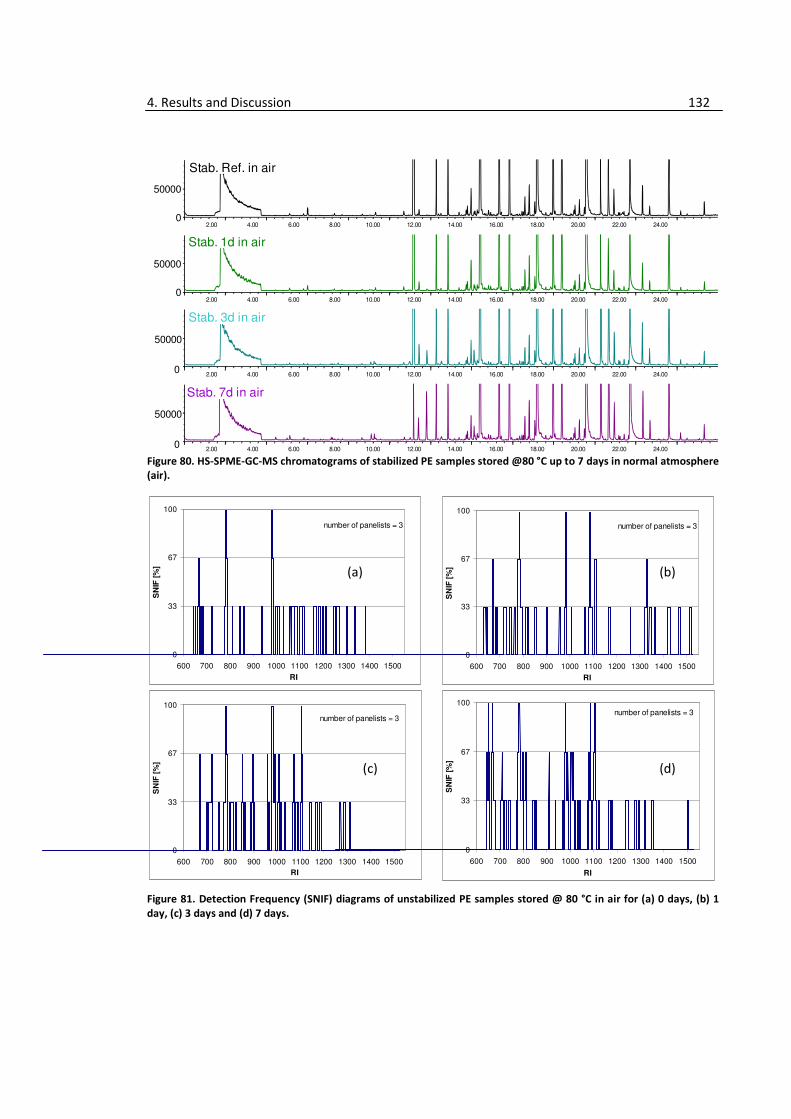
4. Results and Discussion 132
Figure 80. HS-SPME-GC-MS chromatograms of stabilized PE samples stored @80 °C up to 7 days in normal atmosphere
(air).
Figure 81. Detection Frequency (SNIF) diagrams of unstabilized PE samples stored @ 80 °C in air for (a) 0 days, (b) 1
day, (c) 3 days and (d) 7 days.
2.00 4.00 6.00 8.00 10.00 12.00 14.00 16.00 18.00 20.00 22.00 24.000
50000
2.00 4.00 6.00 8.00 10.00 12.00 14.00 16.00 18.00 20.00 22.00 24.000
50000
2.00 4.00 6.00 8.00 10.00 12.00 14.00 16.00 18.00 20.00 22.00 24.000
50000
2.00 4.00 6.00 8.00 10.00 12.00 14.00 16.00 18.00 20.00 22.00 24.000
50000
Stab. Ref. in air
Stab. 1d in air
Stab. 3d in air
Stab. 7d in air
0
33
67
100
600 700 800 900 1000 1100 1200 1300 1400 1500
RI
SN
IF [
%]
number of panelists = 3
0
33
67
100
600 700 800 900 1000 1100 1200 1300 1400 1500
RI
SN
IF [
%]
number of panelists = 3
0
33
67
100
600 700 800 900 1000 1100 1200 1300 1400 1500
RI
SN
IF [
%]
number of panelists = 3
0
33
67
100
600 700 800 900 1000 1100 1200 1300 1400 1500
RI
SN
IF [
%]
number of panelists = 3
(a) (b)
(c) (d)

4. Results and Discussion 133
Figure 82. Detection Frequency (SNIF) diagrams of unstabilized PE samples stored @ 80 °C in a reduced oxygen
atmosphere for (a) 0 days, (b) 1 day, (c) 3 days and (d) 7 days.
Figure 83. Detection Frequency (SNIF) diagrams of stabilized PE samples stored @ 80 °C in air for (a) 0 days, (b) 1 day,
(c) 3 days and (d) 7 days.
0
33
67
100
600 700 800 900 1000 1100 1200 1300 1400 1500
RI
SN
IF [
%]
number of panelists = 3
0
33
67
100
600 700 800 900 1000 1100 1200 1300 1400 1500
RI
SN
IF [
%]
number of
panelists = 3
0
33
67
100
600 700 800 900 1000 1100 1200 1300 1400 1500
RI
SN
IF [
%]
number of
panelists = 3
0
33
67
100
600 700 800 900 1000 1100 1200 1300 1400 1500
RI
SN
IF [
%]
number of
panelists = 3
0
33
67
100
600 700 800 900 1000 1100 1200 1300 1400 1500
RI
SN
IF [
%]
number of panelists = 3
0
33
67
100
600 700 800 900 1000 1100 1200 1300 1400 1500
RI
SN
IF [
%]
number of panelists = 3
0
33
67
100
600 700 800 900 1000 1100 1200 1300 1400 1500
RI
SN
IF [
%]
number of panelists = 3
0
33
67
100
600 700 800 900 1000 1100 1200 1300 1400 1500
RI
SN
IF [
%]
number of panelists = 3
(a) (b)
(c) (d)
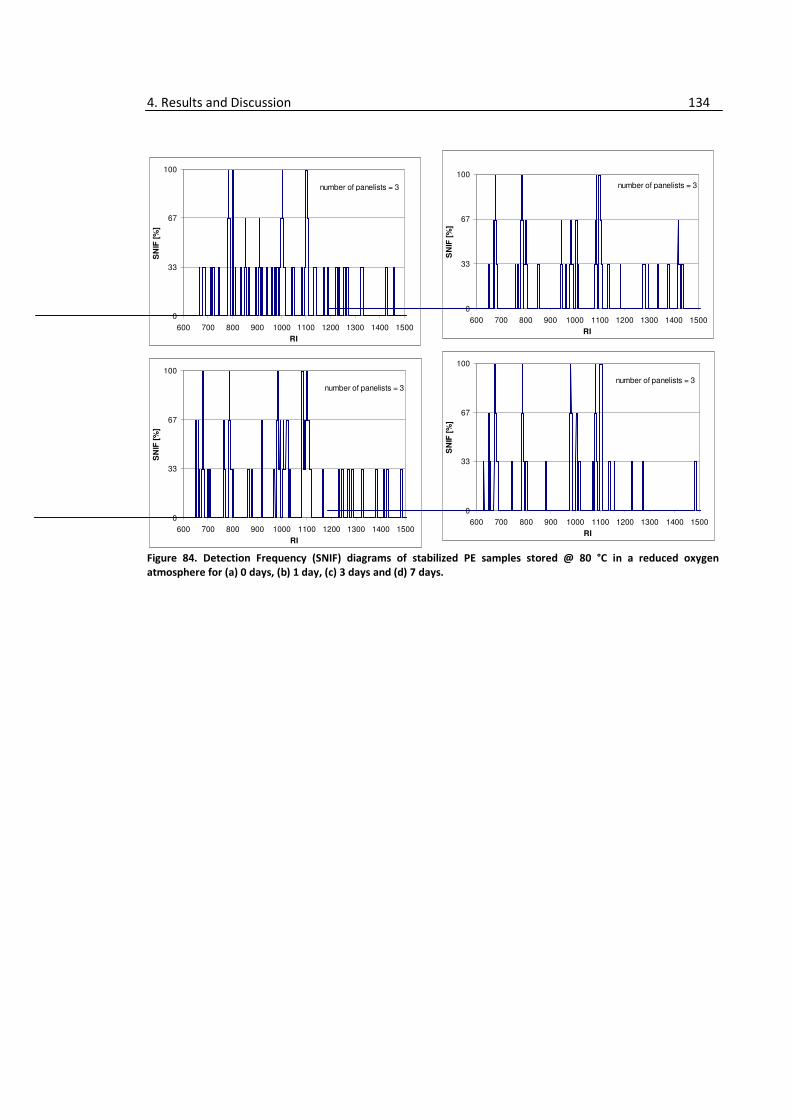
4. Results and Discussion 134
Figure 84. Detection Frequency (SNIF) diagrams of stabilized PE samples stored @ 80 °C in a reduced oxygen
atmosphere for (a) 0 days, (b) 1 day, (c) 3 days and (d) 7 days.
0
33
67
100
600 700 800 900 1000 1100 1200 1300 1400 1500
RI
SN
IF [
%]
number of panelists = 3
0
33
67
100
600 700 800 900 1000 1100 1200 1300 1400 1500
RI
SN
IF [
%]
number of panelists = 3
0
33
67
100
600 700 800 900 1000 1100 1200 1300 1400 1500
RI
SN
IF [
%]
number of panelists = 3
0
33
67
100
600 700 800 900 1000 1100 1200 1300 1400 1500
RI
SN
IF [
%]
number of panelists = 3
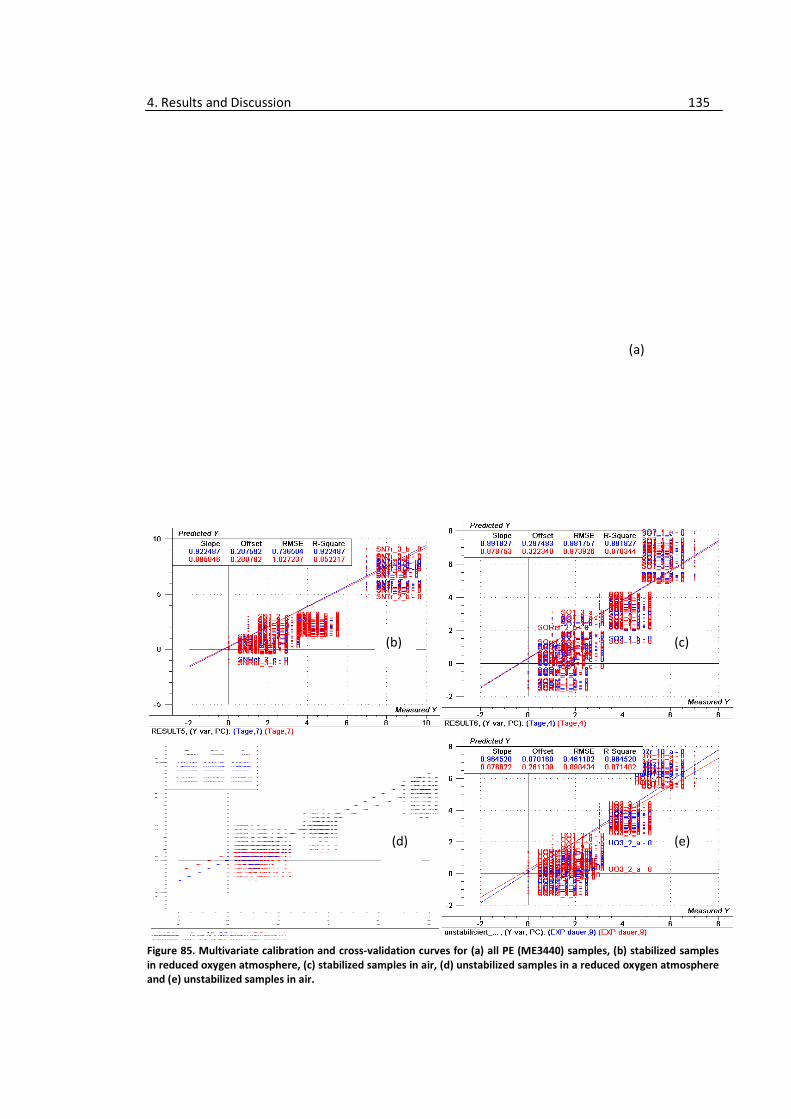
4. Results and Discussion
Figure 85. Multivariate calibration
in reduced oxygen atmosphere, (c) stabilized samples in air, (d) unstabilized samples in a reduced oxygen atmosphere
and (e) unstabilized samples in air.
Results and Discussion
. Multivariate calibration and cross-validation curves for (a) all PE (ME3440) samples, (b) stabilized samples
in reduced oxygen atmosphere, (c) stabilized samples in air, (d) unstabilized samples in a reduced oxygen atmosphere
(e) unstabilized samples in air.
(b)
(d)
135
for (a) all PE (ME3440) samples, (b) stabilized samples
in reduced oxygen atmosphere, (c) stabilized samples in air, (d) unstabilized samples in a reduced oxygen atmosphere
(a)
(e)
(c)
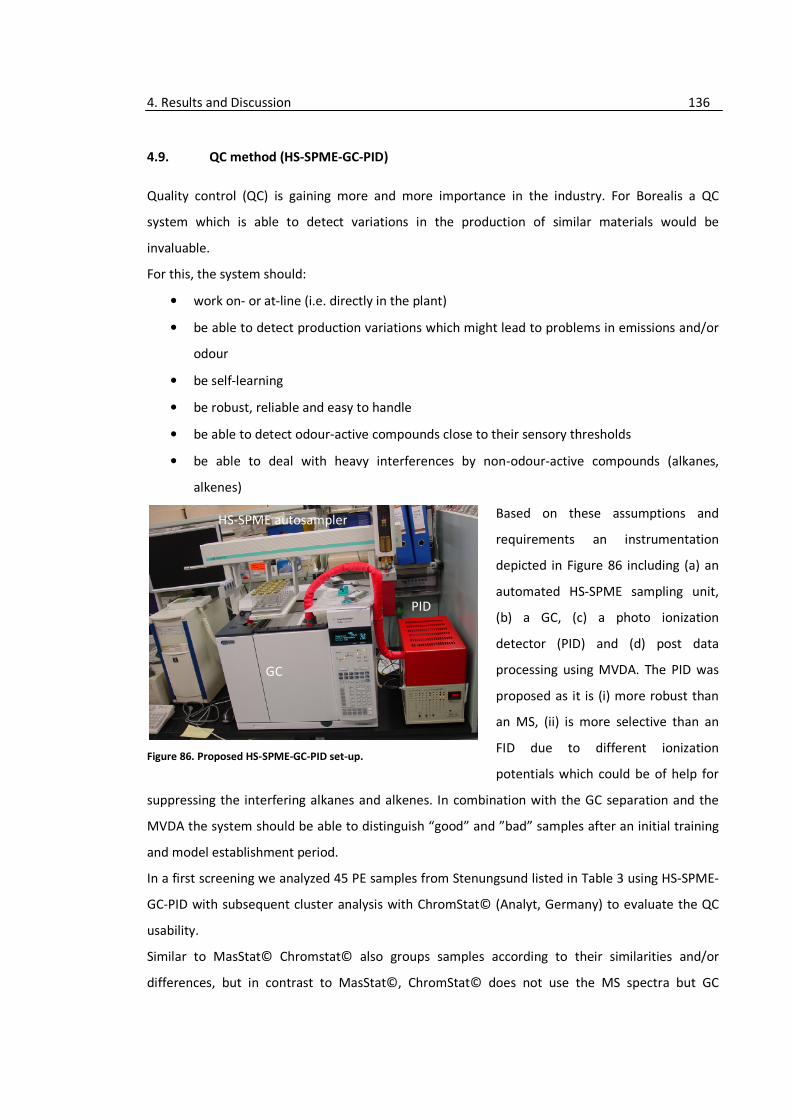
4. Results and Discussion 136
4.9. QC method (HS-SPME-GC-PID)
Quality control (QC) is gaining more and more importance in the industry. For Borealis a QC
system which is able to detect variations in the production of similar materials would be
invaluable.
For this, the system should:
• work on- or at-line (i.e. directly in the plant)
• be able to detect production variations which might lead to problems in emissions and/or
odour
• be self-learning
• be robust, reliable and easy to handle
• be able to detect odour-active compounds close to their sensory thresholds
• be able to deal with heavy interferences by non-odour-active compounds (alkanes,
alkenes)
Based on these assumptions and
requirements an instrumentation
depicted in Figure 86 including (a) an
automated HS-SPME sampling unit,
(b) a GC, (c) a photo ionization
detector (PID) and (d) post data
processing using MVDA. The PID was
proposed as it is (i) more robust than
an MS, (ii) is more selective than an
FID due to different ionization
potentials which could be of help for
suppressing the interfering alkanes and alkenes. In combination with the GC separation and the
MVDA the system should be able to distinguish “good” and ”bad” samples after an initial training
and model establishment period.
In a first screening we analyzed 45 PE samples from Stenungsund listed in Table 3 using HS-SPME-
GC-PID with subsequent cluster analysis with ChromStat© (Analyt, Germany) to evaluate the QC
usability.
Similar to MasStat© Chromstat© also groups samples according to their similarities and/or
differences, but in contrast to MasStat©, ChromStat© does not use the MS spectra but GC
Figure 86. Proposed HS-SPME-GC-PID set-up.
PID
GC
HS-SPME autosampler

4. Results and Discussion 137
integration results (i.e. peak areas or heights) from either the whole chromatogram or from
selected retention time areas.
First screening results showed that the setup is able to differentiate between different materials
(Figure 87) and different lots of the same material (Figure 88). It was proved that setup could be
used as a QC tool, but further development and optimisation of whole setup is needed as each
part of the system influences the results and has to be investigated. These influences include:
• sample amount in the HS vials
• type of SPME extraction (headspace vs. direct)
• extraction medium (air, water)
• SPME fibre
• SPME thermostatising and extraction program
• GC oven program and flow parameter
• GC column
• PID lamps (i.e. ionization potential)
• PID setup (temperature, current, flow)
• data processing prior to cluster analysis (integration parameters, retention time areas)
• cluster analysis parameters
• robustness of the method to system deviations vs. sensitivity to real changes in production
Figure 87. ChromStat© Cluster of QC
samples separated by the material
legend:
9 … ME3490,
4 … ME3440,
7 … ME3470,
9H … ME3490 H01,
9M … ME34901MO2
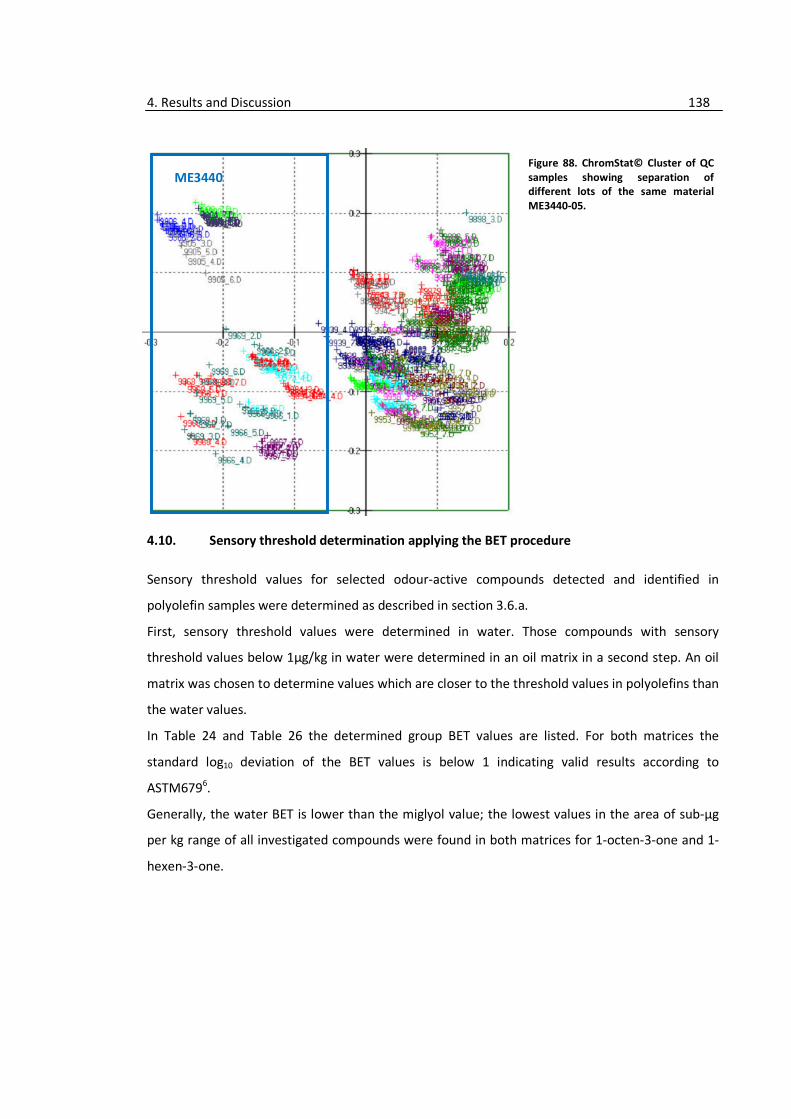
4. Results and Discussion 138
Figure 88. ChromStat© Cluster of QC
samples showing separation of
different lots of the same material
ME3440-05.
4.10. Sensory threshold determination applying the BET procedure
Sensory threshold values for selected odour-active compounds detected and identified in
polyolefin samples were determined as described in section 3.6.a.
First, sensory threshold values were determined in water. Those compounds with sensory
threshold values below 1µg/kg in water were determined in an oil matrix in a second step. An oil
matrix was chosen to determine values which are closer to the threshold values in polyolefins than
the water values.
In Table 24 and Table 26 the determined group BET values are listed. For both matrices the
standard log10 deviation of the BET values is below 1 indicating valid results according to
ASTM6796.
Generally, the water BET is lower than the miglyol value; the lowest values in the area of sub-µg
per kg range of all investigated compounds were found in both matrices for 1-octen-3-one and 1-
hexen-3-one.
ME3440

4. Results and Discussion 139
Table 24. Sensory threshold values determined as group BET in water (s.d. ... standard deviation).
Compound BET
a in water
[µg/kg] log10 of BET [-] log10 s.d. [-]
upper limit BET
[µg/kg]
lower limit BET
[µg/kg]
(E)-2-heptenal 9.1 0.96 0.51 29.4 2.8
heptanal 2.8 0.44 0.33 5.9 1.3
octanal 2.1 0.32 0.87 15.4 0.3
decanal 2.1 0.33 0.86 15.3 0.3
nonanal 1.9 0.27 0.6 7.5 0.5
(E)-2-octenal 1.5 0.16 0.76 8.4 0.3
γ-octalactone 1.4 0.16 0.80 9.2 0.2
(E)-2-decenal 1.2 0.09 0.33 2.6 0.6
2,3-butandione 0.31 -0.51 0.55 1.10 0.09
(E)-2-nonenal 0.20 -0.70 0.42 0.52 0.08
1-octen-3-one 0.03 -1.60 0.68 0.12 0.005
1-hexen-3-one 0.0005 -3.30 0.47 0.0016 0.0002
a Values are given in terms of detection group BET. n = 10-13. The value for the detection threshold is the
level at which the differing sample is selected correctly by the panel without being able to describe the
sensory properties of the odour-active compound.
Table 25. Sensory threshold values determined as group BET in miglyol (s.d. ... standard deviation).
Compound BET
a in miglyol
[µg/kg] log10 of BET [-] log10 s.d. [-]
upper limit BET
[µg/kg]
lower limit BET
[µg/kg]
(Z)-6-nonenal 2.01 3.31 0.51 6.55 0.630
(E)-2-nonenal 1.99 3.30 0.68 9.47 0.419
2,3-butandione 0.603 2.78 1.08 3.59 0.015
8-nonenal 0.371 2.57 0.70 1.85 0.075
1-octen-3-one 0.116 2.06 0.78 0.694 0.019
1-hexen-3-one 0.013 1.12 0.98 0.126 0.001
a Values are given in terms of detection group BET. n = 10-13. The value for the detection threshold is the
level at which the differing sample is selected correctly by the panel without being able to describe the
sensory properties of the odour-active compound.
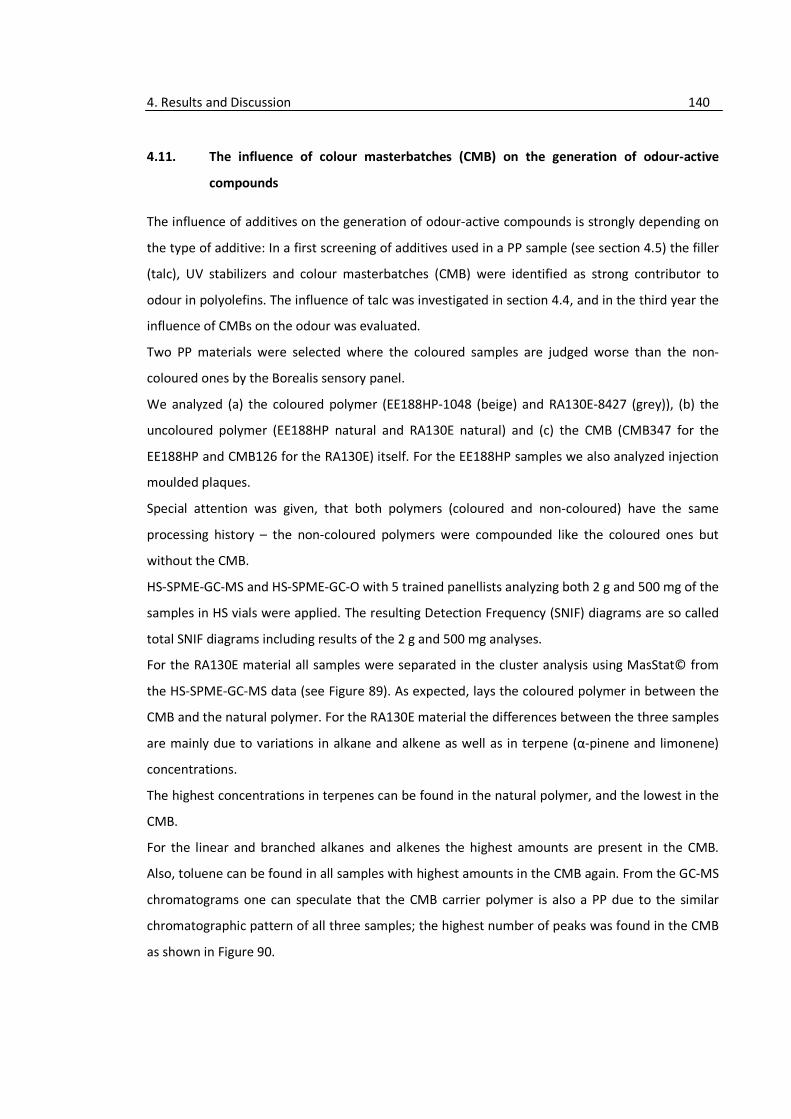
4. Results and Discussion 140
4.11. The influence of colour masterbatches (CMB) on the generation of odour-active
compounds
The influence of additives on the generation of odour-active compounds is strongly depending on
the type of additive: In a first screening of additives used in a PP sample (see section 4.5) the filler
(talc), UV stabilizers and colour masterbatches (CMB) were identified as strong contributor to
odour in polyolefins. The influence of talc was investigated in section 4.4, and in the third year the
influence of CMBs on the odour was evaluated.
Two PP materials were selected where the coloured samples are judged worse than the non-
coloured ones by the Borealis sensory panel.
We analyzed (a) the coloured polymer (EE188HP-1048 (beige) and RA130E-8427 (grey)), (b) the
uncoloured polymer (EE188HP natural and RA130E natural) and (c) the CMB (CMB347 for the
EE188HP and CMB126 for the RA130E) itself. For the EE188HP samples we also analyzed injection
moulded plaques.
Special attention was given, that both polymers (coloured and non-coloured) have the same
processing history – the non-coloured polymers were compounded like the coloured ones but
without the CMB.
HS-SPME-GC-MS and HS-SPME-GC-O with 5 trained panellists analyzing both 2 g and 500 mg of the
samples in HS vials were applied. The resulting Detection Frequency (SNIF) diagrams are so called
total SNIF diagrams including results of the 2 g and 500 mg analyses.
For the RA130E material all samples were separated in the cluster analysis using MasStat© from
the HS-SPME-GC-MS data (see Figure 89). As expected, lays the coloured polymer in between the
CMB and the natural polymer. For the RA130E material the differences between the three samples
are mainly due to variations in alkane and alkene as well as in terpene (α-pinene and limonene)
concentrations.
The highest concentrations in terpenes can be found in the natural polymer, and the lowest in the
CMB.
For the linear and branched alkanes and alkenes the highest amounts are present in the CMB.
Also, toluene can be found in all samples with highest amounts in the CMB again. From the GC-MS
chromatograms one can speculate that the CMB carrier polymer is also a PP due to the similar
chromatographic pattern of all three samples; the highest number of peaks was found in the CMB
as shown in Figure 90.
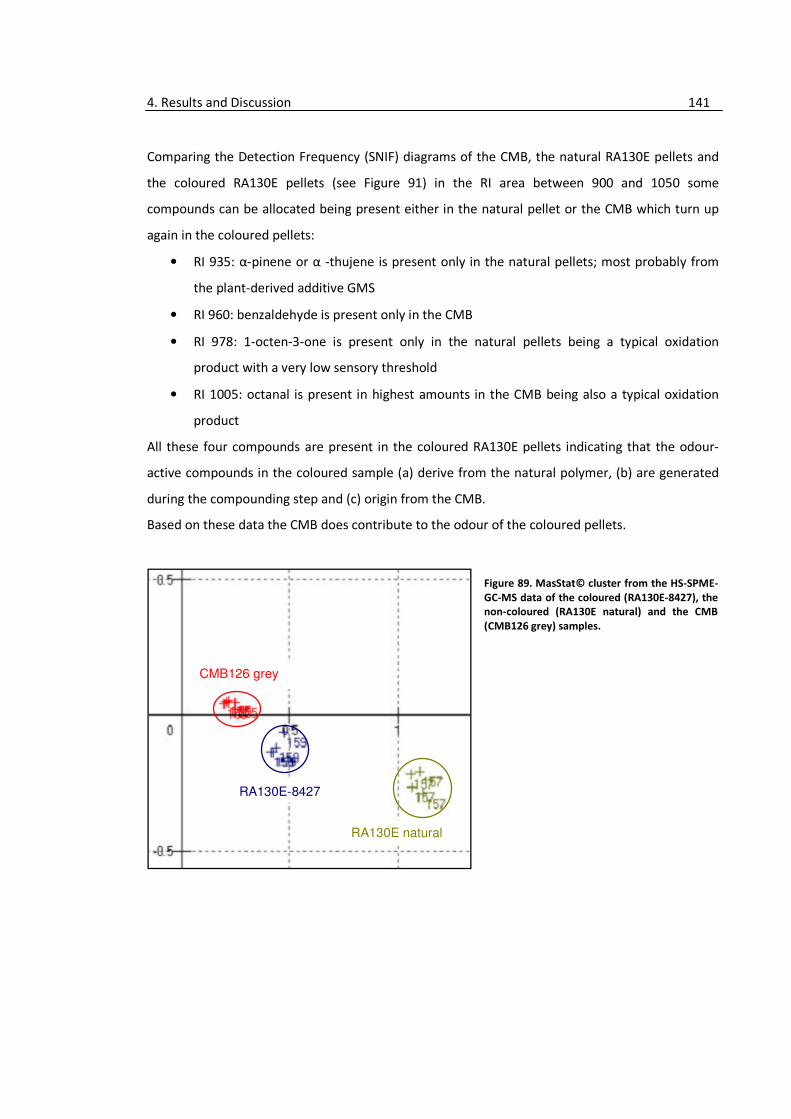
4. Results and Discussion 141
Comparing the Detection Frequency (SNIF) diagrams of the CMB, the natural RA130E pellets and
the coloured RA130E pellets (see Figure 91) in the RI area between 900 and 1050 some
compounds can be allocated being present either in the natural pellet or the CMB which turn up
again in the coloured pellets:
• RI 935: α-pinene or α -thujene is present only in the natural pellets; most probably from
the plant-derived additive GMS
• RI 960: benzaldehyde is present only in the CMB
• RI 978: 1-octen-3-one is present only in the natural pellets being a typical oxidation
product with a very low sensory threshold
• RI 1005: octanal is present in highest amounts in the CMB being also a typical oxidation
product
All these four compounds are present in the coloured RA130E pellets indicating that the odour-
active compounds in the coloured sample (a) derive from the natural polymer, (b) are generated
during the compounding step and (c) origin from the CMB.
Based on these data the CMB does contribute to the odour of the coloured pellets.
Figure 89. MasStat© cluster from the HS-SPME-
GC-MS data of the coloured (RA130E-8427), the
non-coloured (RA130E natural) and the CMB
(CMB126 grey) samples.
RA130E natural
RA130E-8427
CMB126 grey
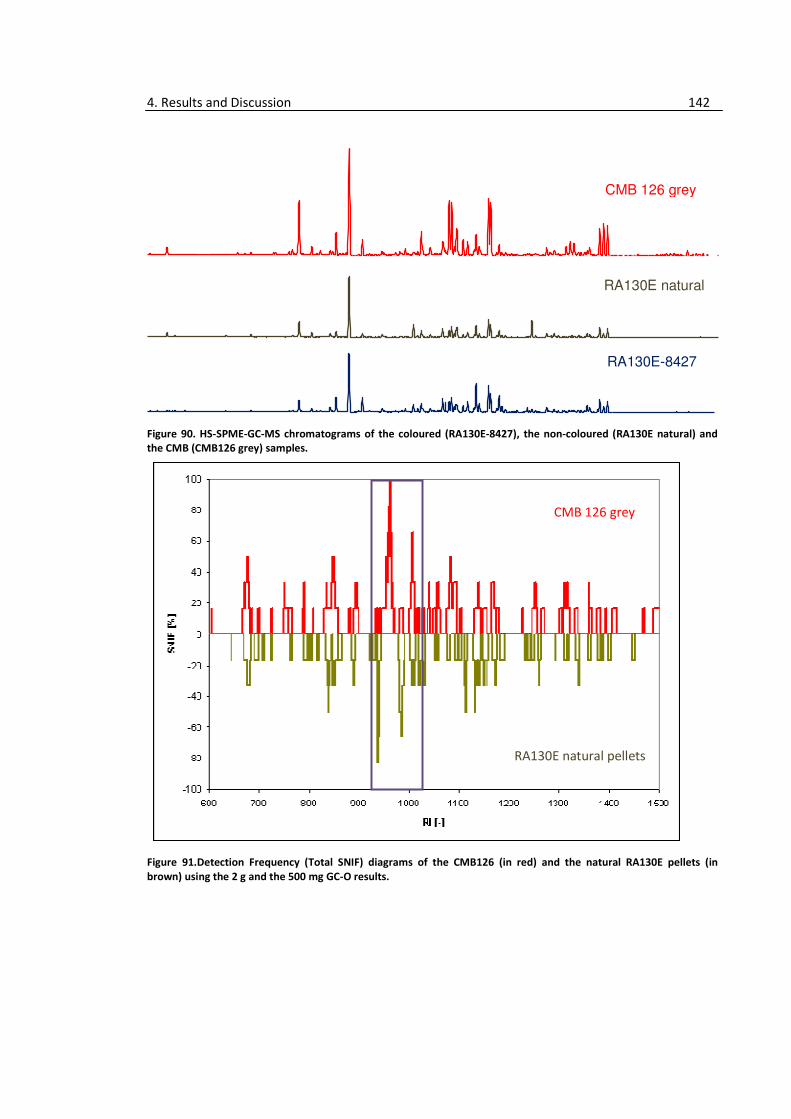
4. Results and Discussion 142
Figure 90. HS-SPME-GC-MS chromatograms of the coloured (RA130E-8427), the non-coloured (RA130E natural) and
the CMB (CMB126 grey) samples.
Figure 91.Detection Frequency (Total SNIF) diagrams of the CMB126 (in red) and the natural RA130E pellets (in
brown) using the 2 g and the 500 mg GC-O results.
CMB 126 grey
RA130E natural
RA130E-8427
CMB 126 grey
RA130E natural pellets

4. Results and Discussion 143
Figure 92.Detection Frequency (Total SNIF) diagrams of the coloured RA130E pellets (in blue) using the 2 g and the
500 mg GC-O results.
MasStat© analyses of the EE188HP samples gave a different picture (see Figure 93). As this
material was already investigated in the first year in the screening of additives (section 4.5) we
also analyzed injection moulded plaques besides the pellets and CMB. All pellets and plaques have
the same history (i.e. storage time, lot number, …).
An as clear linear effect by addition of the CMB as found in the RA130E samples was not observed
for the EE188HP samples: It seems that the addition of the CMB and the injection moulding are
running in opposite directions; injection moulding of the natural pellets moves the cluster of the
natural plaques to the top left while for the coloured samples the inverse direction is found. Also,
the differences between the coloured and non-coloured plaques are smaller than for the coloured
and non-coloured pellets.
Comparing the HS-SPME-GC-MS chromatograms (see Figure 94) it is easy to see why the cluster
looks like this: By addition of the CMB the number and the intensities of the peaks is dramatically
reduced in the pellets. However, injection moulding of the coloured pellets diminish this effect
and leads to a dramatic increase in the number and the amount of compounds ending with very
similar chromatograms of coloured and natural plaques.
RA130E-8427 coloured pellets
4. Results and Discussion 144
It seems that by addition of the CMB the emissions of the pellets are reduced, however, any
further thermal treatment such as injection moulding completely destroys this effect and results in
high emissions in the plaques.
MasStat© cluster differences are due to these compounds:
• pyrazines and methylpyrazines present only in the CMB
• aromatics (toluene, ethylbenzene, xylene) present in highest amounts in the natural
pellets
• terpenes present only in the natural pellets and plaques
Comparing the total SNIF diagrams from the CMB and the natural EE188HP pellets (Figure 95) no
significant differences could be identified which turn up also in the coloured pellets (Figure 96).
For the coloured EE188HP-1048 no odour-active compounds coming only from the CMB could be
identified. Comparing the CMB and the natural product similar odour pattern were found. No
compound was detected by all panellists in both sample concentrations.
Those compounds with the highest SNIF values (66%) are:
• (E)-2-hexenal (RI 846) in the EE188HP natural pellets
• α-pinene (RI 938) in the EE188HP natural pellets
• 6-/8-nonenal in the CMB and the EE188HP-1048 coloured pellets
• unknown compound (RI 1340; described as sweet, intense, mouldy, dusty, warm
elastomer) in the EE188HP-1048 coloured pellets
Based on the results from the two PP samples (RA130E and EE188HP) it is clear that (1) the CMB
does influence the odour of the polyolefin product and (2) that the CMB either contributes with
new odour-active compounds to the overall odour and/or increases the generation of odour-
active compounds by influencing the thermal stability of the polymer or reacting with other
species present in the polymer. For the RA130E sample it was possible to find odour-active
compounds coming directly from the CMB; additionally, in the RA130E sample a linear relationship
was found between the CMB, the natural and the coloured product.
In the EE188HP samples it was not possible to identify odour-active compounds coming only from
the CMB, moreover, it seems that the CMB seems to have some kind of a suppressing effect in
terms of emissions. Also, the odour pattern of the CMB and the natural polymer were very similar.
For the EE188HP the natural polymer influences the odour of the coloured product mostly.
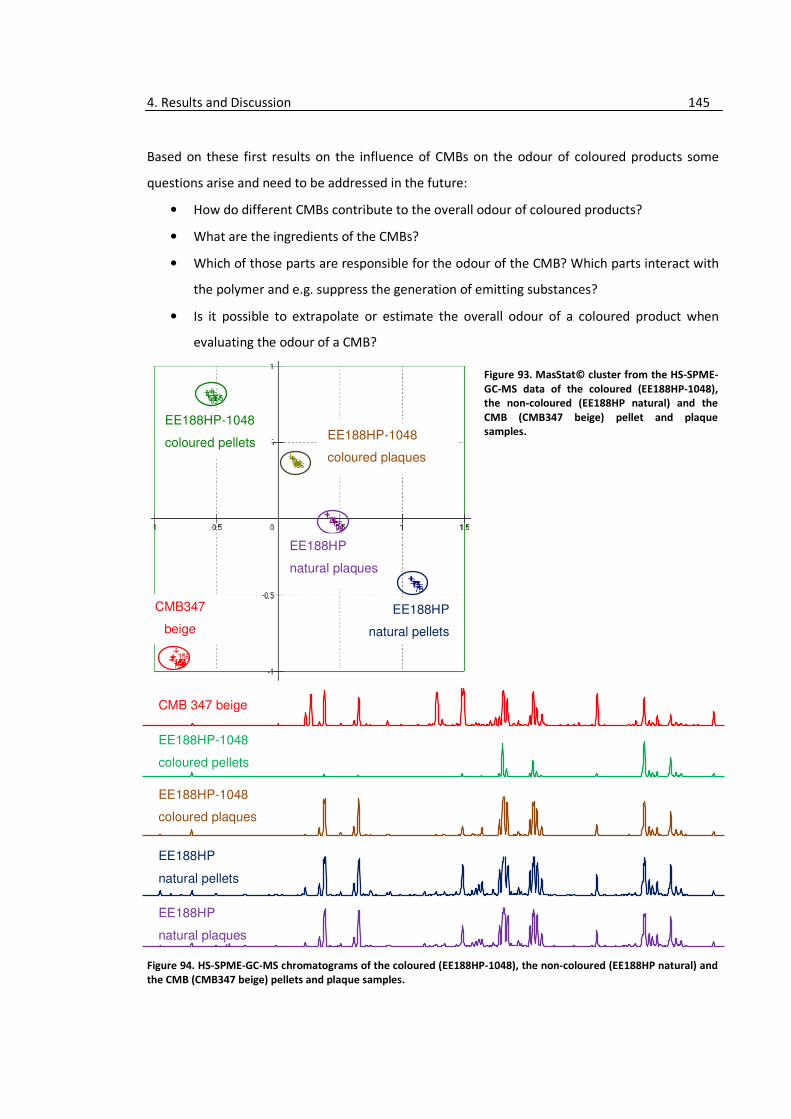
4. Results and Discussion 145
Based on these first results on the influence of CMBs on the odour of coloured products some
questions arise and need to be addressed in the future:
• How do different CMBs contribute to the overall odour of coloured products?
• What are the ingredients of the CMBs?
• Which of those parts are responsible for the odour of the CMB? Which parts interact with
the polymer and e.g. suppress the generation of emitting substances?
• Is it possible to extrapolate or estimate the overall odour of a coloured product when
evaluating the odour of a CMB?
Figure 93. MasStat© cluster from the HS-SPME-
GC-MS data of the coloured (EE188HP-1048),
the non-coloured (EE188HP natural) and the
CMB (CMB347 beige) pellet and plaque
samples.
Figure 94. HS-SPME-GC-MS chromatograms of the coloured (EE188HP-1048), the non-coloured (EE188HP natural) and
the CMB (CMB347 beige) pellets and plaque samples.
EE188HP
natural pellets
EE188HP
natural plaques
EE188HP-1048
coloured plaques
EE188HP-1048
coloured pellets
CMB 347 beige
EE188HP
natural pellets
EE188HP-1048
coloured plaques
EE188HP
natural plaques
EE188HP-1048
coloured pellets
CMB347
beige
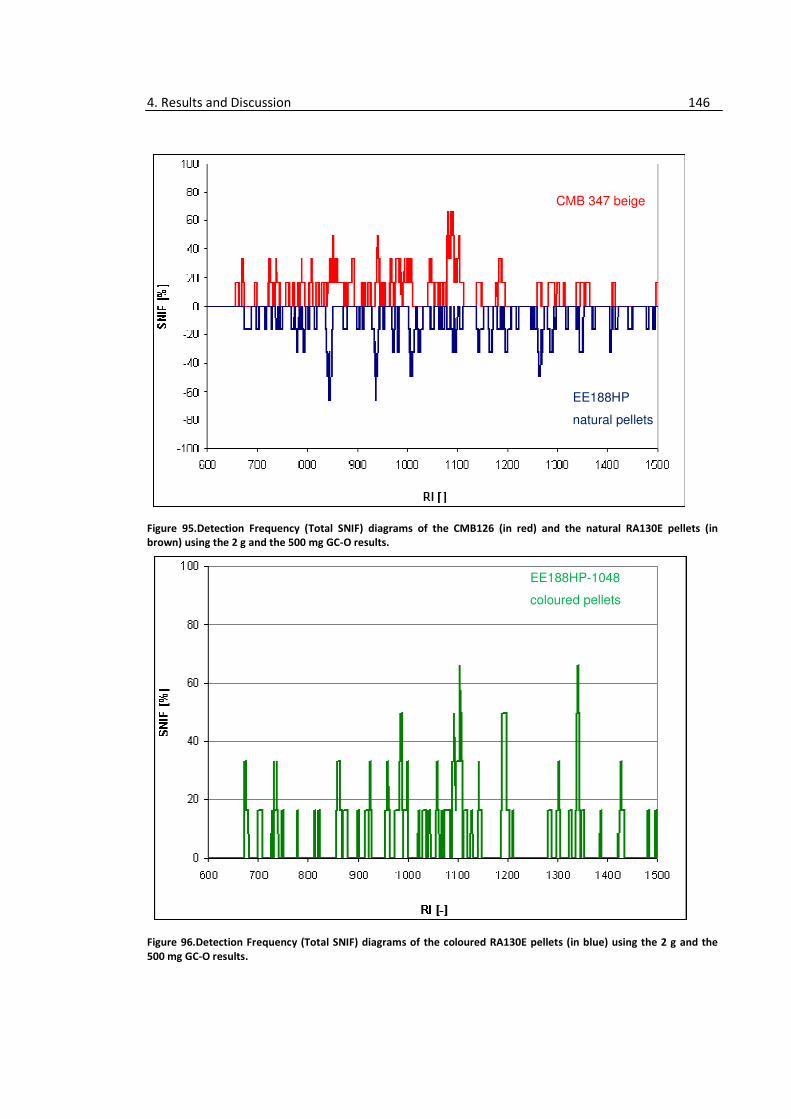
4. Results and Discussion 146
Figure 95.Detection Frequency (Total SNIF) diagrams of the CMB126 (in red) and the natural RA130E pellets (in
brown) using the 2 g and the 500 mg GC-O results.
Figure 96.Detection Frequency (Total SNIF) diagrams of the coloured RA130E pellets (in blue) using the 2 g and the
500 mg GC-O results.
CMB 347 beige
EE188HP
natural pellets
EE188HP-1048
coloured pellets
4. Results and Discussion 147
4.12. Evaluation of the odour potential of Monomers
Looking at the process chain of polyolefins monomers at the beginning of the chain may also
contribute to the overall odour of the polyolefin product.
In a master thesis by Edith Renöckl75 , monomers (ethylene, propylene), comonomers (1-butene,
1-hexene) and diluents (propane) from different sources were screened for their odour potential
applying HS-SPME-GC-MS and HS-SPME-GC-O.
In addition, after the thesis was finished some re-measurements were carried out applying the
procedures as in the master thesis.
Propylene from Kallo sampled before (63001) and after dehydration (63103) used as purification
was analyzed with HS-SPME-GC-MS and HS-SPME-GC-O. Air was sampled prior to filling in the lab
in Linz to serve as blanks.
Due to difficulties with the originally used GC-MS system we switched another one with a different
set-up as in Edith’s work. We used an Agilent 7980 GC with a 5973 MS and an CTC CombiPal
Autosampler. The used GC column was an HP-5-MS UI with 30mx0.25mm IDx0.25µm film
thickness instead of the used 1µm film thickness in Edith’s work.
However, as we ran all the samples on the same instrument and we only compare these samples
to each other, this change in the set-up did not bother. Each sample was measured fivefold, the air
only once.
For the comparison of the HS-SPME-GC-MS chromatograms (Figure 97) the sample with the
highest number of peaks out of the five runs were taken. In Figure 98 we selected compounds
which are contributing to the difference between samples 63001 and 63103. For each compound a
selective m/z was selected, the area of the respective peak was integrated for all 5 runs and
arithmetic mean and standard deviation were calculated.
Despite the huge deviation in sample amount, some aromatic compounds (toluene, phenol) are
present in higher concentrations in the sample after the purification (63103) than in the one
before (63001).
We were also able to detect some sulphur compounds by GC-MS such as dimethyl disulfide
(higher conc. in 63103) and allyl propyl disulfide (present only in 63103).
75
Renöckl E. (2010) Monomer Purity concerning Odour and Taste, Master Thesis, Graz University of
Technology.
4. Results and Discussion 148
We extracted the m/z 44, a typical m/z for the odour-active saturated aldehydes (Figure 99) to see
that only a little to no effect of the purification on the concentration of the odour-active aldehydes
was observed.
HS-SPME-GC with nitrogen sensitive detection and parallel PID detection was carried out and gave
positive results for nitrogen compounds (Figure 100). However, the large peaks seen in the
chromatogram originate from n-alkanes or siloxanes from the GC-column present in so high
concentrations that the NPD also detects them. Those peaks are marked as “alkanes”.
For the remaining peaks some differences between the two samples can be observed. Peaks at 5.5
min and 8 min are only present in the 63001 sample.
Peaks at 5.4 min, 11.25 min and 14.4 min are present in both samples but in higher concentration
in the 63103 sample.
The peak at 14.75 min is present in both samples but in higher concentration in the 63001 sample.
Based on these NPD measurements the purification does seem to have an impact on nitrogen
compounds.
HS-SPME-GC-O was carried out for analyzing the samples with one panellist. The resulting SNIF
diagrams for both samples are shown in Figure 101.
In total, not many or strong odour-active compounds could be detected. In principal, the SNIF
diagrams of both samples are similar except for the RI area around 1100 which gave a more
intense odour impression in the 63103 sample as the odour lasts longer. This time area accounts
to 6-/8-nonenal.
When comparing the SNIF diagrams to those obtained from the 1st monomer samples from Kallo
shown in Figure 102, it can be seen that there were more and also more intense odour signals
compared to the now evaluated samples 63001 and 63103.
Using the HS-SPME-GC-FID chromatogram in both “old” samples much more peaks are present
while the propylene peak was bigger in the 2nd samples. Additionally, a so called “Ölberg” was
observed only for the “old” samples. Based on this we assume that vials were equally filled and
quality of Kallo monomer improved from the 1st to the 2nd measurements.
These measurements and the work of Renöckl prove that monomers do have an odour potential;
however, it is not yet cleared if the odour-active compounds contribute to the odour of the
polyolefins. As the in the monomer identified compounds are the same as those identified in the
polyolefins, one can think of two possible ways: Either do these compounds survive the
polymerization process or are destroyed and regenerated during the polymerization.
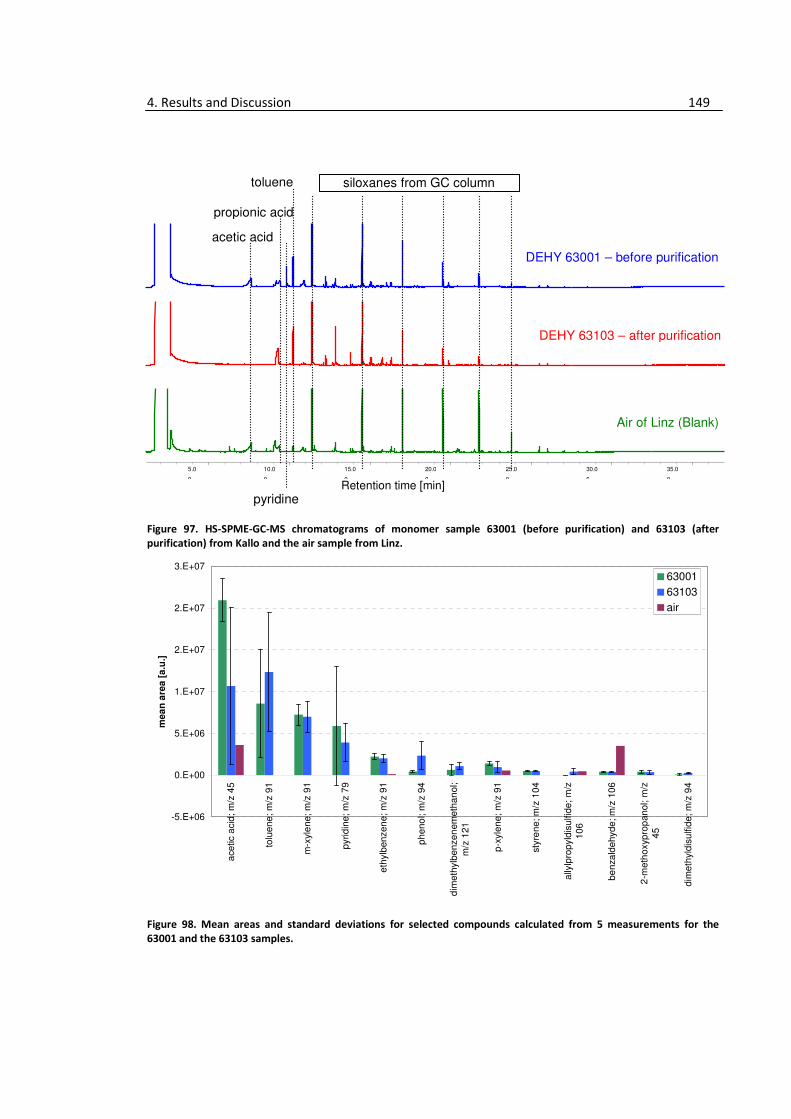
4. Results and Discussion 149
Figure 97. HS-SPME-GC-MS chromatograms of monomer sample 63001 (before purification) and 63103 (after
purification) from Kallo and the air sample from Linz.
Figure 98. Mean areas and standard deviations for selected compounds calculated from 5 measurements for the
63001 and the 63103 samples.
-5.E+06
0.E+00
5.E+06
1.E+07
2.E+07
2.E+07
3.E+07
acetic a
cid
; m
/z 4
5
tolu
ene
; m
/z 9
1
m-x
yle
ne; m
/z 9
1
pyrid
ine; m
/z 7
9
eth
ylb
enzen
e; m
/z 9
1
pheno
l; m
/z 9
4
dim
eth
ylb
enzen
em
eth
an
ol;
m/z
121
p-x
yle
ne; m
/z 9
1
sty
rene; m
/z 1
04
ally
lpro
pyld
isulfid
e;
m/z
106
be
nza
ldehyde
; m
/z 1
06
2-m
eth
oxypro
panol; m
/z
45
dim
eth
yld
isulfid
e; m
/z 9
4
mea
n a
rea [
a.u
.]
63001
63103
air
5.0
0 10.0
0 15.0
0 20.0
0 25.0
0 30.0
0 35.0
0
DEHY 63103 – after purification
Air of Linz (Blank)
DEHY 63001 – before purification
Retention time [min]
siloxanes from GC column
acetic acid
propionic acid
toluene
pyridine
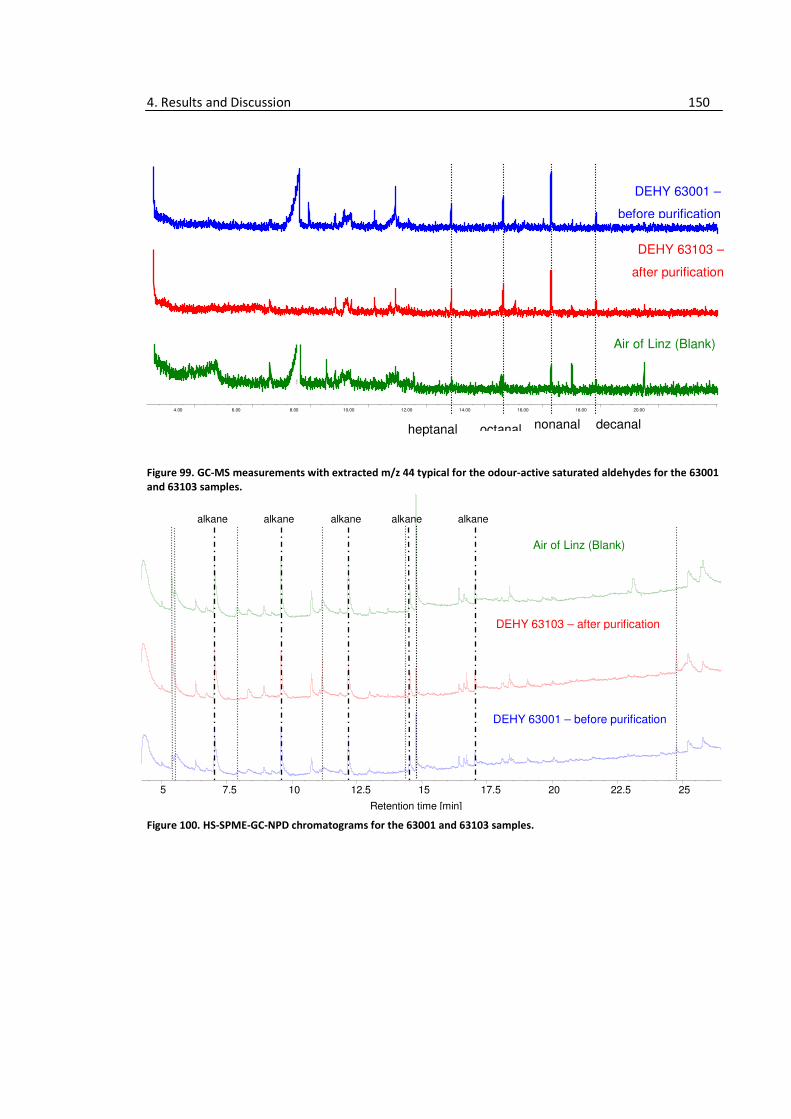
4. Results and Discussion 150
Figure 99. GC-MS measurements with extracted m/z 44 typical for the odour-active saturated aldehydes for the 63001
and 63103 samples.
Figure 100. HS-SPME-GC-NPD chromatograms for the 63001 and 63103 samples.
4.00 6.00 8.00 10.00 12.00 14.00 16.00 18.00 20.00
DEHY 63103 –
after purification
DEHY 63001 –
before purification
Air of Linz (Blank)
nonanal decanal octanal heptanal
Retention time [min]
5 7.5 10 12.5 15 17.5 20 22.5 25
DEHY 63001 – before purification
DEHY 63103 – after purification
Air of Linz (Blank)
alkane alkane alkane alkane alkane
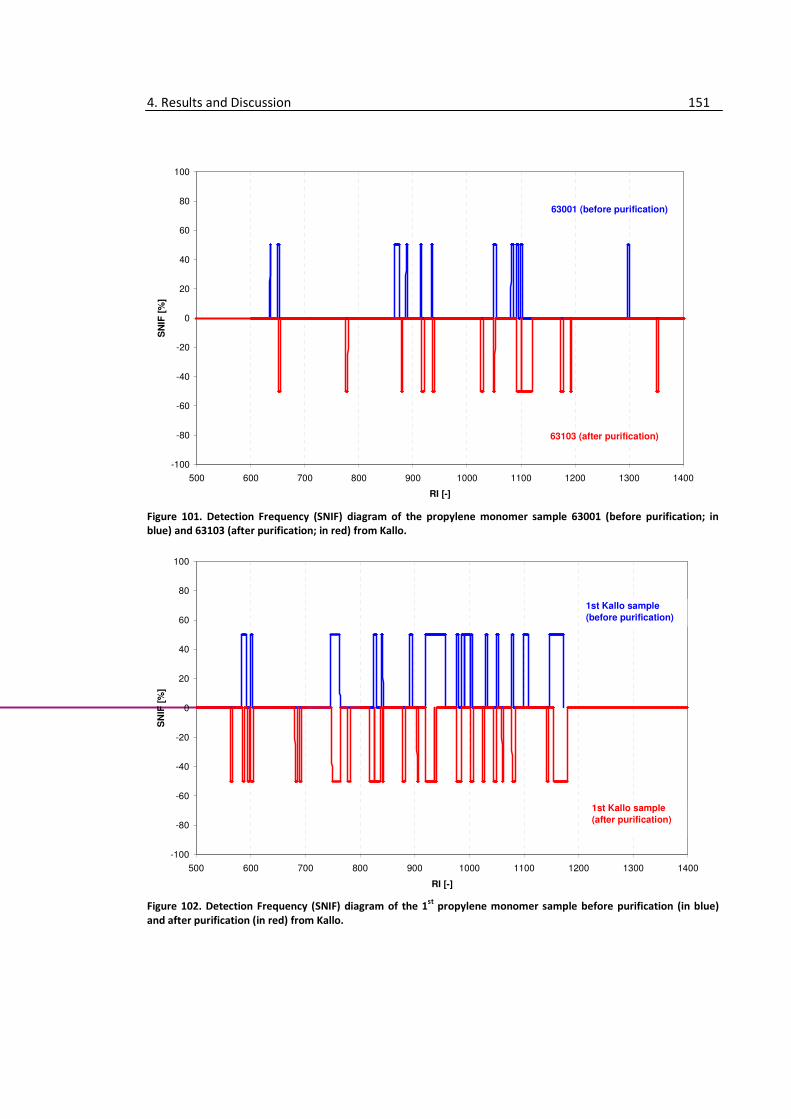
4. Results and Discussion 151
Figure 101. Detection Frequency (SNIF) diagram of the propylene monomer sample 63001 (before purification; in
blue) and 63103 (after purification; in red) from Kallo.
Figure 102. Detection Frequency (SNIF) diagram of the 1
st propylene monomer sample before purification (in blue)
and after purification (in red) from Kallo.
-100
-80
-60
-40
-20
0
20
40
60
80
100
500 600 700 800 900 1000 1100 1200 1300 1400
RI [-]
SN
IF [
%]
63001 (before purification)
63103 (after purification)
-100
-80
-60
-40
-20
0
20
40
60
80
100
500 600 700 800 900 1000 1100 1200 1300 1400
RI [-]
SN
IF [
%]
1st Kallo sample
(before purification)
1st Kallo sample
(after purification)
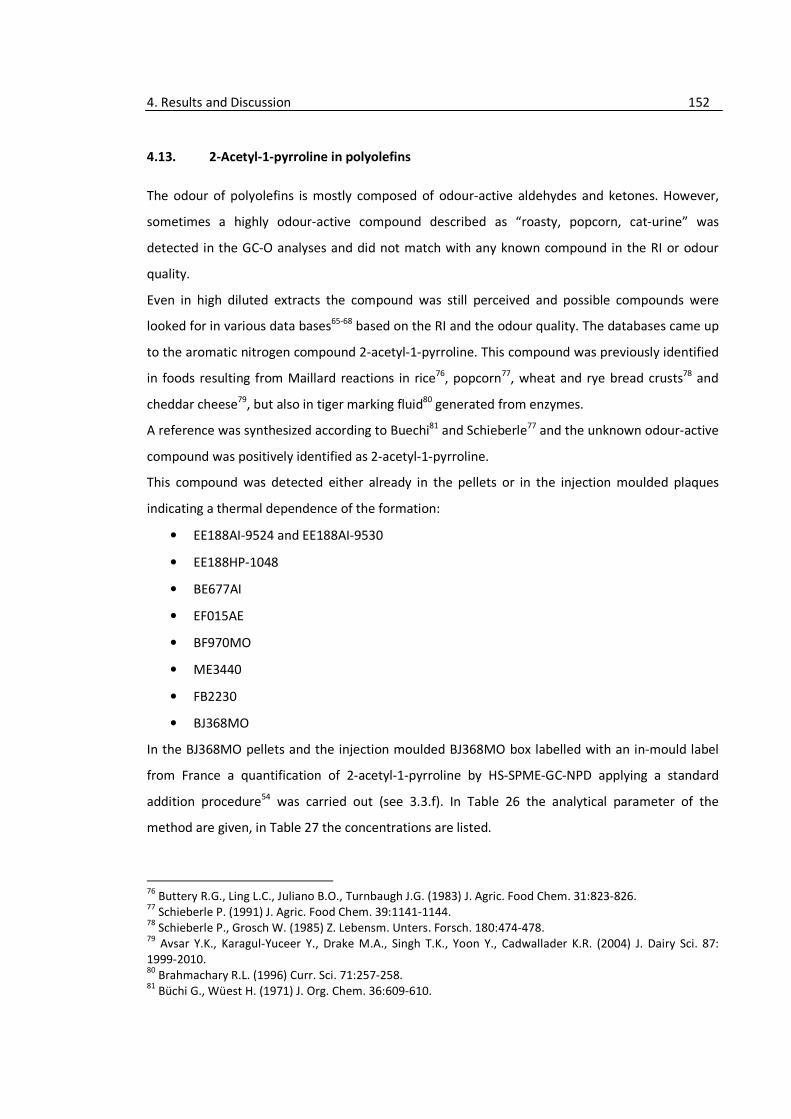
4. Results and Discussion 152
4.13. 2-Acetyl-1-pyrroline in polyolefins
The odour of polyolefins is mostly composed of odour-active aldehydes and ketones. However,
sometimes a highly odour-active compound described as “roasty, popcorn, cat-urine” was
detected in the GC-O analyses and did not match with any known compound in the RI or odour
quality.
Even in high diluted extracts the compound was still perceived and possible compounds were
looked for in various data bases65-68 based on the RI and the odour quality. The databases came up
to the aromatic nitrogen compound 2-acetyl-1-pyrroline. This compound was previously identified
in foods resulting from Maillard reactions in rice76, popcorn77, wheat and rye bread crusts78 and
cheddar cheese79, but also in tiger marking fluid80 generated from enzymes.
A reference was synthesized according to Buechi81 and Schieberle77 and the unknown odour-active
compound was positively identified as 2-acetyl-1-pyrroline.
This compound was detected either already in the pellets or in the injection moulded plaques
indicating a thermal dependence of the formation:
• EE188AI-9524 and EE188AI-9530
• EE188HP-1048
• BE677AI
• EF015AE
• BF970MO
• ME3440
• FB2230
• BJ368MO
In the BJ368MO pellets and the injection moulded BJ368MO box labelled with an in-mould label
from France a quantification of 2-acetyl-1-pyrroline by HS-SPME-GC-NPD applying a standard
addition procedure54 was carried out (see 3.3.f). In Table 26 the analytical parameter of the
method are given, in Table 27 the concentrations are listed.
76
Buttery R.G., Ling L.C., Juliano B.O., Turnbaugh J.G. (1983) J. Agric. Food Chem. 31:823-826. 77
Schieberle P. (1991) J. Agric. Food Chem. 39:1141-1144. 78
Schieberle P., Grosch W. (1985) Z. Lebensm. Unters. Forsch. 180:474-478. 79
Avsar Y.K., Karagul-Yuceer Y., Drake M.A., Singh T.K., Yoon Y., Cadwallader K.R. (2004) J. Dairy Sci. 87:
1999-2010. 80
Brahmachary R.L. (1996) Curr. Sci. 71:257-258. 81
Büchi G., Wüest H. (1971) J. Org. Chem. 36:609-610.
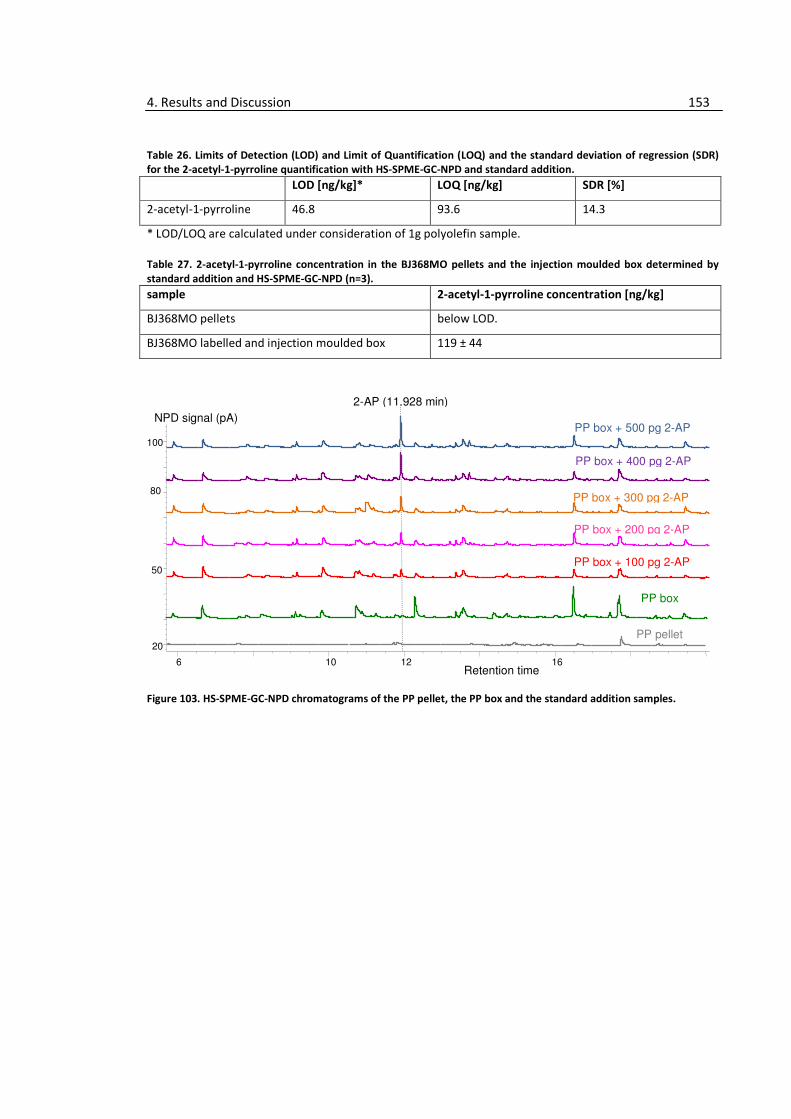
4. Results and Discussion 153
Table 26. Limits of Detection (LOD) and Limit of Quantification (LOQ) and the standard deviation of regression (SDR)
for the 2-acetyl-1-pyrroline quantification with HS-SPME-GC-NPD and standard addition.
LOD [ng/kg]* LOQ [ng/kg] SDR [%]
2-acetyl-1-pyrroline 46.8 93.6 14.3
* LOD/LOQ are calculated under consideration of 1g polyolefin sample.
Table 27. 2-acetyl-1-pyrroline concentration in the BJ368MO pellets and the injection moulded box determined by
standard addition and HS-SPME-GC-NPD (n=3).
sample 2-acetyl-1-pyrroline concentration [ng/kg]
BJ368MO pellets below LOD.
BJ368MO labelled and injection moulded box 119 ± 44
Figure 103. HS-SPME-GC-NPD chromatograms of the PP pellet, the PP box and the standard addition samples.
6 10 12 16
NPD signal (pA)
20
50
100 PP box + 500 pg 2-AP
2-AP (11.928 min)
PP box + 300 pg 2-AP
PP box + 200 pg 2-AP
PP box + 100 pg 2-AP
PP pellet
PP box + 400 pg 2-AP
80
Retention time
PP box

4. Results and Discussion 154
4.14. BJ368MO claim
The business unit moulding had a customer claim for injection moulded BJ368MO boxes with in-
mould labels concerning increased odour of the Borealis product compared to a competitor box.
The boxes having a strong popcorn-like odour and the corresponding pellets as well as the
competitor’s boxes arrived in Graz.
Additionally, test runs in Belgium with the same material but another label were done including
volatile measurement during processing of the material. Last, we got additional pellets of Borealis
internal test runs and plaques injection moulded at three temperatures (260, 280, 300°C). All
samples were analyzed with HS-SPME-GC-MS and HS-SPME-GC-NPD, first samples were also
analyzed with HS-SPME-GC-O. Additionally, processing was simulated by heating pellets for 10min
at 200°C and 280°C and GC-MS analysis afterwards.
4.14.a. Results of HS-SPME-GC-MS measurements
We ran HS-SPME-GC-MS analyses of all samples (5 repetitions) and analyzed the data with
MasStat©. The cluster with all samples is shown in Figure 104.
A massive influence on the volatiles by the in-mould label (no BO175) can be seen for the labelled
(no. BO173) and unlabelled (no BO172) boxes from Belgium. By analysis of the cluster the
following conclusions were made:
• The application of an in-mould label has an impact on the number and concentration of
volatiles. This can be seen by comparing the position of the labelled BJ368MO box (no.
BO173) with that of the in-mould label (no.BO175) and that of the unlabelled BJ368MO
box (no. BO172). The white colour MB (no. BO171a) does not have an impact on the
volatile generation.
• Injection moulding of the pellets to the corresponding boxes moves the samples down to
the left. This is outlined by comparing the BJ368MO pellets (no. BO168) with the
unlabelled boxes (no. BO173) as well as comparing the 3 test run pellets (no. BO188,
BO189, and BO190) with the produced plaques at various temperatures (no. BO179-
BO187).
• Changing the MFR and/or leaving out the 1% talc does have an influence for the processed
plaques, while no difference between the pellets can be seen (no. BO188-BO190) where
the clusters fall together in one. With increasing injection moulding temperature
differences become more prone esp. at 300°C plaques of sample 1 (no.BO181), which is
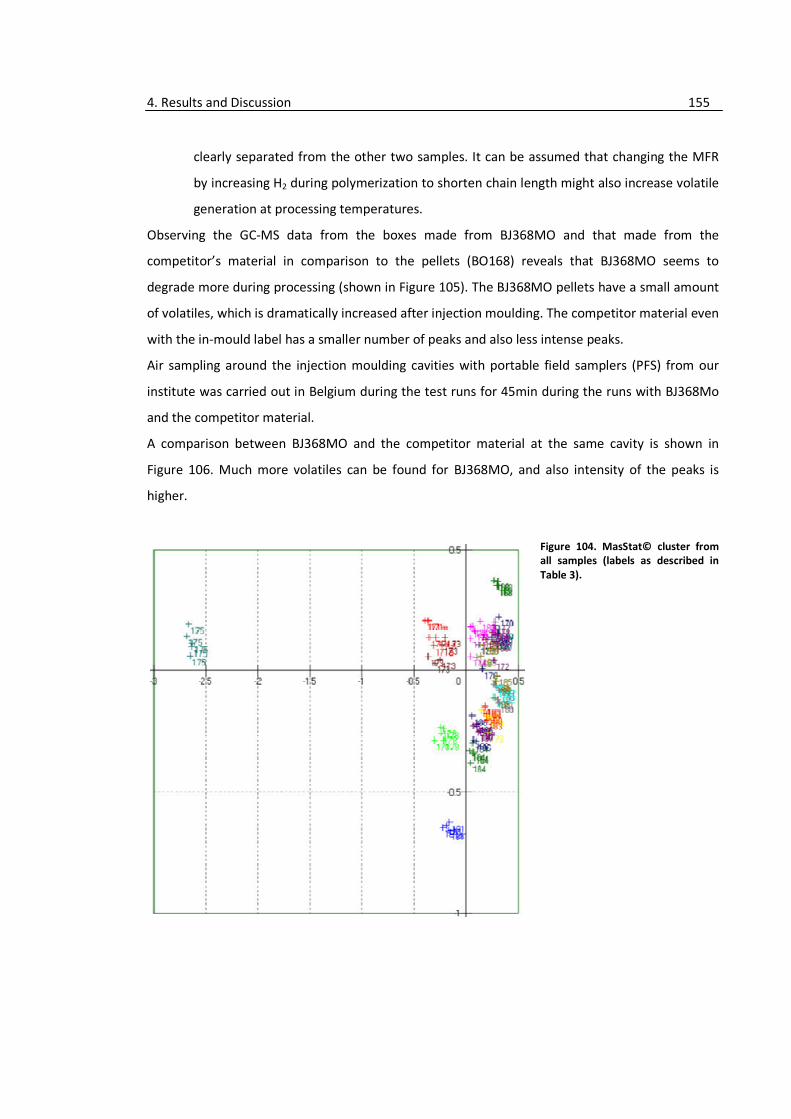
4. Results and Discussion 155
clearly separated from the other two samples. It can be assumed that changing the MFR
by increasing H2 during polymerization to shorten chain length might also increase volatile
generation at processing temperatures.
Observing the GC-MS data from the boxes made from BJ368MO and that made from the
competitor’s material in comparison to the pellets (BO168) reveals that BJ368MO seems to
degrade more during processing (shown in Figure 105). The BJ368MO pellets have a small amount
of volatiles, which is dramatically increased after injection moulding. The competitor material even
with the in-mould label has a smaller number of peaks and also less intense peaks.
Air sampling around the injection moulding cavities with portable field samplers (PFS) from our
institute was carried out in Belgium during the test runs for 45min during the runs with BJ368Mo
and the competitor material.
A comparison between BJ368MO and the competitor material at the same cavity is shown in
Figure 106. Much more volatiles can be found for BJ368MO, and also intensity of the peaks is
higher.
Figure 104. MasStat© cluster from
all samples (labels as described in
Table 3).
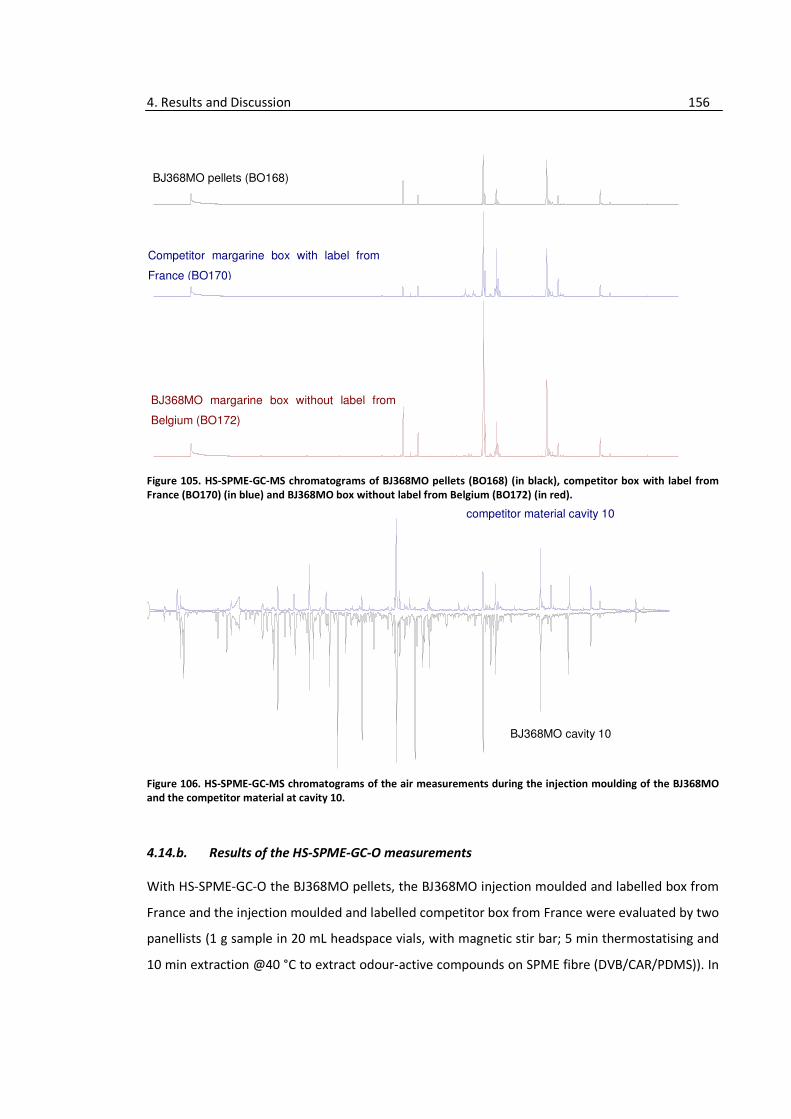
4. Results and Discussion 156
Figure 105. HS-SPME-GC-MS chromatograms of BJ368MO pellets (BO168) (in black), competitor box with label from
France (BO170) (in blue) and BJ368MO box without label from Belgium (BO172) (in red).
Figure 106. HS-SPME-GC-MS chromatograms of the air measurements during the injection moulding of the BJ368MO
and the competitor material at cavity 10.
4.14.b. Results of the HS-SPME-GC-O measurements
With HS-SPME-GC-O the BJ368MO pellets, the BJ368MO injection moulded and labelled box from
France and the injection moulded and labelled competitor box from France were evaluated by two
panellists (1 g sample in 20 mL headspace vials, with magnetic stir bar; 5 min thermostatising and
10 min extraction @40 °C to extract odour-active compounds on SPME fibre (DVB/CAR/PDMS)). In
BJ368MO pellets (BO168)
Competitor margarine box with label from
France (BO170)
BJ368MO margarine box without label from
Belgium (BO172)
BJ368MO cavity 10
competitor material cavity 10
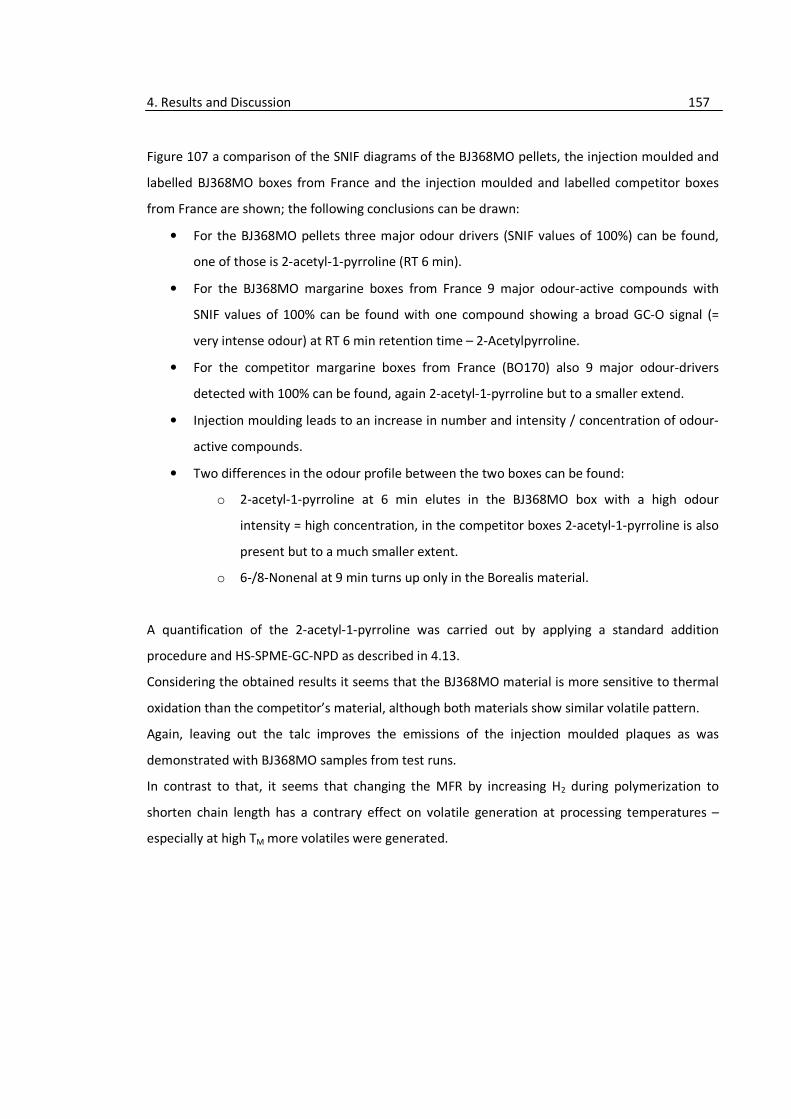
4. Results and Discussion 157
Figure 107 a comparison of the SNIF diagrams of the BJ368MO pellets, the injection moulded and
labelled BJ368MO boxes from France and the injection moulded and labelled competitor boxes
from France are shown; the following conclusions can be drawn:
• For the BJ368MO pellets three major odour drivers (SNIF values of 100%) can be found,
one of those is 2-acetyl-1-pyrroline (RT 6 min).
• For the BJ368MO margarine boxes from France 9 major odour-active compounds with
SNIF values of 100% can be found with one compound showing a broad GC-O signal (=
very intense odour) at RT 6 min retention time – 2-Acetylpyrroline.
• For the competitor margarine boxes from France (BO170) also 9 major odour-drivers
detected with 100% can be found, again 2-acetyl-1-pyrroline but to a smaller extend.
• Injection moulding leads to an increase in number and intensity / concentration of odour-
active compounds.
• Two differences in the odour profile between the two boxes can be found:
o 2-acetyl-1-pyrroline at 6 min elutes in the BJ368MO box with a high odour
intensity = high concentration, in the competitor boxes 2-acetyl-1-pyrroline is also
present but to a much smaller extent.
o 6-/8-Nonenal at 9 min turns up only in the Borealis material.
A quantification of the 2-acetyl-1-pyrroline was carried out by applying a standard addition
procedure and HS-SPME-GC-NPD as described in 4.13.
Considering the obtained results it seems that the BJ368MO material is more sensitive to thermal
oxidation than the competitor’s material, although both materials show similar volatile pattern.
Again, leaving out the talc improves the emissions of the injection moulded plaques as was
demonstrated with BJ368MO samples from test runs.
In contrast to that, it seems that changing the MFR by increasing H2 during polymerization to
shorten chain length has a contrary effect on volatile generation at processing temperatures –
especially at high TM more volatiles were generated.
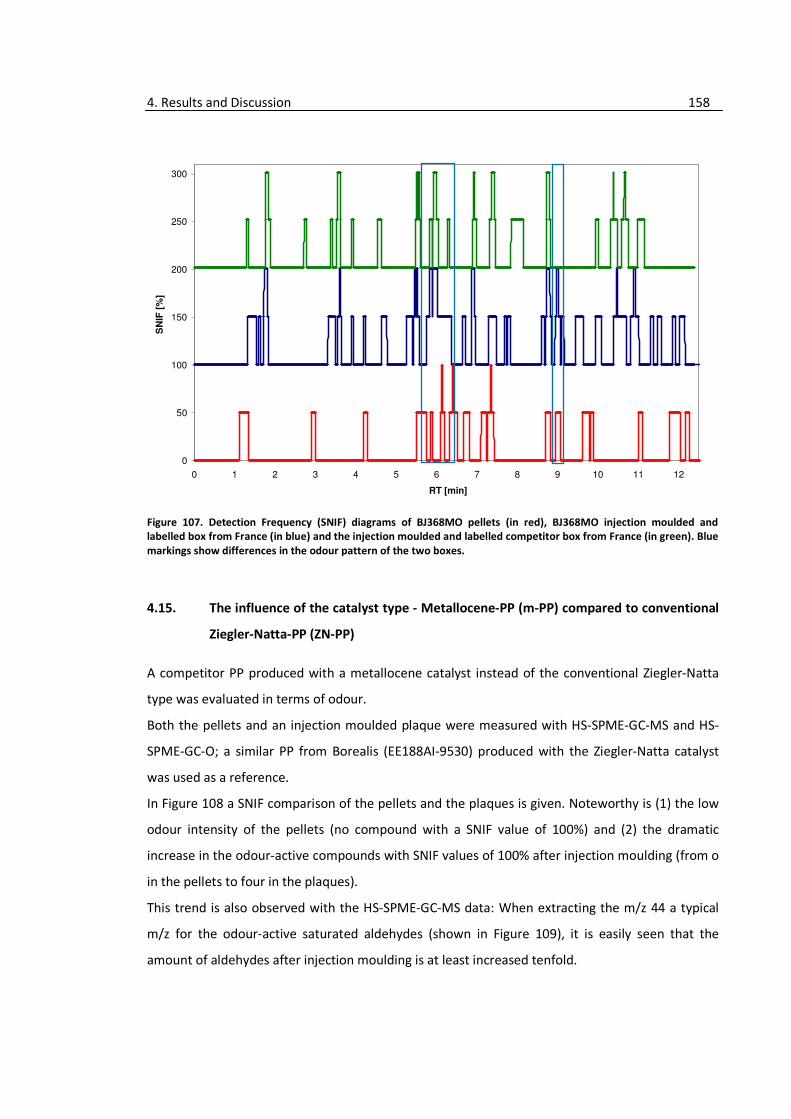
4. Results and Discussion 158
Figure 107. Detection Frequency (SNIF) diagrams of BJ368MO pellets (in red), BJ368MO injection moulded and
labelled box from France (in blue) and the injection moulded and labelled competitor box from France (in green). Blue
markings show differences in the odour pattern of the two boxes.
4.15. The influence of the catalyst type - Metallocene-PP (m-PP) compared to conventional
Ziegler-Natta-PP (ZN-PP)
A competitor PP produced with a metallocene catalyst instead of the conventional Ziegler-Natta
type was evaluated in terms of odour.
Both the pellets and an injection moulded plaque were measured with HS-SPME-GC-MS and HS-
SPME-GC-O; a similar PP from Borealis (EE188AI-9530) produced with the Ziegler-Natta catalyst
was used as a reference.
In Figure 108 a SNIF comparison of the pellets and the plaques is given. Noteworthy is (1) the low
odour intensity of the pellets (no compound with a SNIF value of 100%) and (2) the dramatic
increase in the odour-active compounds with SNIF values of 100% after injection moulding (from o
in the pellets to four in the plaques).
This trend is also observed with the HS-SPME-GC-MS data: When extracting the m/z 44 a typical
m/z for the odour-active saturated aldehydes (shown in Figure 109), it is easily seen that the
amount of aldehydes after injection moulding is at least increased tenfold.
0
50
100
150
200
250
300
0 1 2 3 4 5 6 7 8 9 10 11 12
RT [min]
SN
IF [
%]
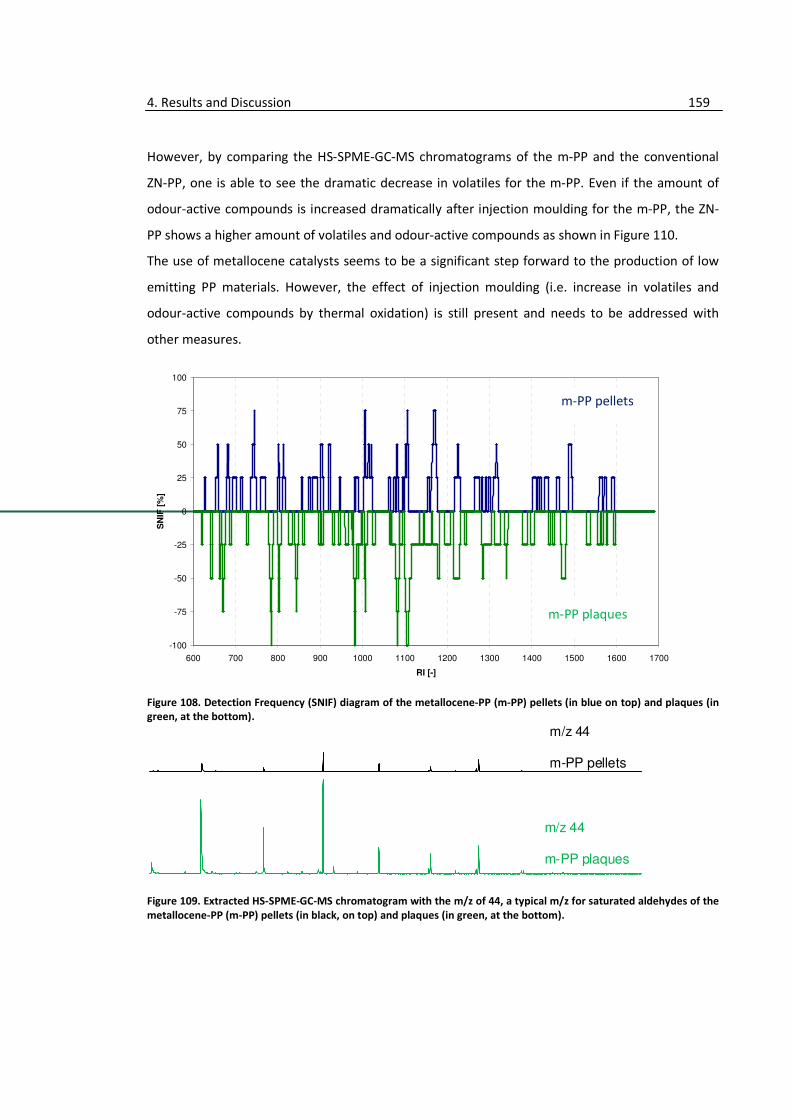
4. Results and Discussion 159
However, by comparing the HS-SPME-GC-MS chromatograms of the m-PP and the conventional
ZN-PP, one is able to see the dramatic decrease in volatiles for the m-PP. Even if the amount of
odour-active compounds is increased dramatically after injection moulding for the m-PP, the ZN-
PP shows a higher amount of volatiles and odour-active compounds as shown in Figure 110.
The use of metallocene catalysts seems to be a significant step forward to the production of low
emitting PP materials. However, the effect of injection moulding (i.e. increase in volatiles and
odour-active compounds by thermal oxidation) is still present and needs to be addressed with
other measures.
Figure 108. Detection Frequency (SNIF) diagram of the metallocene-PP (m-PP) pellets (in blue on top) and plaques (in
green, at the bottom).
Figure 109. Extracted HS-SPME-GC-MS chromatogram with the m/z of 44, a typical m/z for saturated aldehydes of the
metallocene-PP (m-PP) pellets (in black, on top) and plaques (in green, at the bottom).
-100
-75
-50
-25
0
25
50
75
100
600 700 800 900 1000 1100 1200 1300 1400 1500 1600 1700
RI [-]
SN
IF [
%]
m/z 44
m-PP plaques
m/z 44
m-PP pellets
m-PP pellets
m-PP plaques
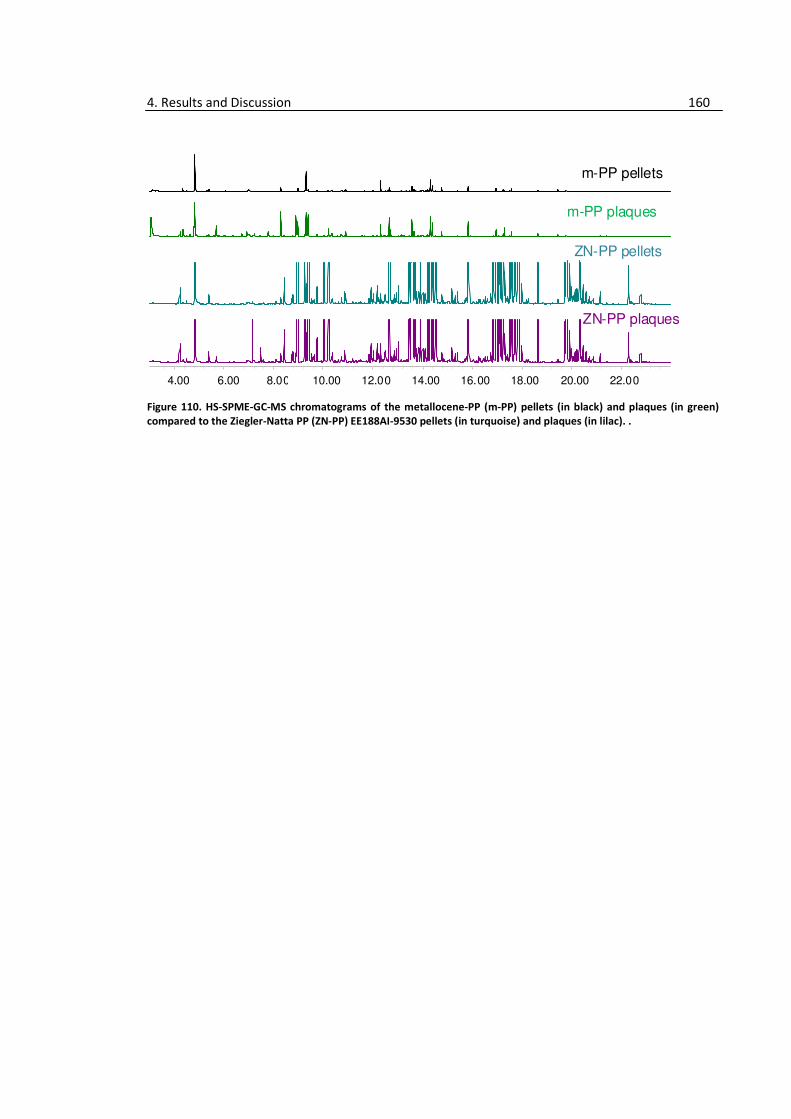
4. Results and Discussion 160
Figure 110. HS-SPME-GC-MS chromatograms of the metallocene-PP (m-PP) pellets (in black) and plaques (in green)
compared to the Ziegler-Natta PP (ZN-PP) EE188AI-9530 pellets (in turquoise) and plaques (in lilac). .
m-PP pellets
m-PP plaques
ZN-PP pellets
ZN-PP plaques
4.00 6.00 8.00 10.00 12.00 14.00 16.00 18.00 20.00 22.00
5. Conclusion and Outlook 161
5. Conclusion and Outlook
5.1. Identified odour-active compounds detected in PE and PP samples
In all investigated grades similar odour-active compounds could be detected.
Mainly aldehydes and ketones were identified as major odour contributors due to their low
sensory thresholds which were also determined by the sensory panel in the lower and sub-µg per
kg range.
Especially carbonyls with 6 to 10 C-atoms could be detected with a high frequency; among these
substances the unsaturated aliphatic aldehydes (E)-2-alkenales and the unsaturated aliphatic
ketones 1-alken-3-ones were the most important ones including
• (E)-2-nonenal
• (E)-6-nonenal
• (Z)-6-nonenal
• 8-nonenal
• (E)-2-decenal
• 1-hexen-3-one
• 1-octen-3-one
• 1-nonen-3-one
• 2,3-butandione
• 2,3-pentandione
Regardless whether the investigated sample was a PE or a PP, the mentioned compounds were
detected.
Comparing these compounds with those found in the literature (see Table 2) one is able to see
that they match in most parts.
However, due to the majority of publications deal only with PE, in this work (E)-2-octenal, (E)-2-
nonenal, 8-nonenal, 2,3-pentandione and 1-hexen-3-one were identified in PP for the first time.
The latter two compounds were also identified in PE-HD for the first time.
5.2. The influence of processing on the generation of odour-active compounds – Is an
odour evaluation on pellets valid for the judgement of processed parts?
Processing such as injection moulding is a major influencing factor for the generation of odour-
active compounds. In all investigations where pellets and injection moulded plaques were
5. Conclusion and Outlook 162
analyzed a higher number of and more intense odour-active compounds were detected in the
processed samples.
Based on these evaluations and separate investigations carried out on stabilized and unstabilized
PE and PP materials autoxidation processes seem to take place leading to the increase in odour-
active oxidation products such as aldehydes and ketones. It was observed that the investigated PP
material was more affected by the oxidation than the investigated PE. This might results from the
higher susceptibility of PP to oxidation in general.
Besides these carbonyls, other compounds such as 2-acetyl-1-pyrroline and the unknown
substance from the talc and phenolic antioxidant interaction are present in higher amounts after
injection moulding indicating as well a temperature-driven reaction.
Different degrees of autoxidation were observed depending on the polymer formulation (e.g.
compound PP with high additivation compared to a PE pipe grade).
5.3. The influence of processing locations on the generation of odour-active compounds –
Is there a typical plant smell?
Various grades available from different plants were screened for the presence of a typical „plant
smell“, i.e. identification of odour-active compounds specific for a plant / polymerization site /
compounding site.
Three grades with at least two different origins were investigated (EE188AI from Schwechat and
Beringen, FB2230 from Schwechat PE4 and Porvoo PE2, ME3440 from Porvoo PE2, Stenungsund
PE3 and Borouge).
To summarize, there are differences in between the same grade from different plants. In all three
screened grades similar odour-active compounds were detected including saturated and
unsaturated aldehydes and ketones and the aromatic nitrogen compound 2-acetyl-1-pyrroline.
Of all three materials the compound PP EE188AI showed the highest number and amounts of
odour-active compounds coming from (a) the use of different PE and PPs and additives in the
formulation and (b) the additional compounding step inducing further thermally and mechanically
induced oxidation.
Although different odour patterns of the PE and PP samples were obtained one is not able to
specify typical compounds for PE or PP, mostly due to the low number of screened grades and
therefore the lack of representativeness.
5. Conclusion and Outlook 163
Although the methyl side chain in the PP should contribute to the generation of other types of
oxidation compounds, these compounds were not exclusively identified.
Most probably this can be explained by (1) the use of both PE and PP in the investigated
polyolefins and (2) the higher sensory threshold values for these methylated compounds
compared to the thresholds of the mentioned substances.
5.4. The influence of additives on the generation of odour-active compounds – What do
talc, UV stabilization and colour contribute to the odour?
In a screening program a compound PP containing numerous additives was analyzed for odour-
active compounds originating from different additives. Here, talc, phenolic antioxidants and the
colour masterbatch showed a massive impact on the generation of odour-active compounds by (a)
an increase in odour-active oxidation products coming from the polymer and by (b) formation of
new odour-active species coming most probably from the degradation of the additives and/or
interactions between the additive and the polymer.
For the combination of talc and phenolic antioxidants the odour is dramatically increased by
formation of one major odour contributor which is not yet identified. However, it is believed that
this compound originates from the degradation of the phenolic antioxidants in the presence of
talc.
Evaluations on stabilized and unstabilized PE and PP materials showed that the used additives are
able to prevent the polymer from heavy degradation; however, the stabilizers are not able to
prevent the formation of odour-active oxidation compounds during processing.
5.5. The influence of the catalyst on the generation of odour-active compounds – What
does 2-ethyl-1-hexanol contribute to the odour?
The use of the new catalyst RCL50P leads to a massive increase in the 2-ethyl-1-hexanol
concentration compared to the use of the old catalyst (BCF02P) by at least an order of 20. For the
RCL50P samples concentrations of 2-ethyl-1-hexanol in the range of 3.5 mg/kg were determined
with GC-MS and external calibration. For the BCF02P samples the concentrations were below 0.05
mg/kg.
No significant differences in the 2-ethyl-1-hexanol concentrations between the visbroken and non-
visbroken samples neither with the new nor with the old catalyst were found.
5. Conclusion and Outlook 164
The odour threshold of 2-ethyl-1-hexanol was determined with 1-2 mg/kg with GC-O using dilution
analysis of fraction II until two panellists perceived no odour anymore.
Although the amount of 2-ethyl-1-hexanol is dramatically increased by the use of the new catalyst
RCL50P, the odour contribution is not significantly increased due to the rather high odour
threshold of 1-2 mg/kg which is in the range of the determined concentration of 3.5 mg/kg.
5.6. The influence of visbreaking on the generation of odour-active compounds – Do
peroxides always smell bad?
The investigation of two different peroxide systems in two PP materials showed that the increased
odour ratings of visbroken grades are originating (a) from an increase in odour-active degradation
products coming from the polymer initiated by the peroxides and (b) from new species generated
during the peroxide decomposition.
Although both peroxide systems showed diverse decomposition species, with no system it was
possible to achieve as low odour values as with the non-visbroken grade.
5.7. The crux with measuring “nothing” – How well do different methods measure the
things we want to know?
Analysis of odour-active compounds is not easy and despite a time-consuming and extensive
sample preparation procedure it is for example still not possible to quantify the highly odour-
active (E)-2-alkenales and 1-alken-3-ones with conventional GC systems, although they are clearly
detected by the human nose.
For realising lower detection limits more sensitive detection systems are needed.
Second, often the needed information is highly interfered, and applying multivariate data analysis
(MVDA) can help to filter all this data and get the essence out of it. It was shown that for trends
and correlations the used HS-SPME-GC-MS procedure followed by multivariate data analysis
(MVDA) can be applied to gain information about the contribution of various additives on the
emissions of PP polymer in an easy and reliable way.
MVDA seems to be a valuable tool also for quality control issues as proposed with the HS-SPME-
GC-PID system.
5. Conclusion and Outlook 165
However, the gained information is still only qualitative. Even with high separation power
provided by modern one-dimensional GC columns co-elution is happening.
For solving the problem of co-elution and interferences a higher degree of separation is needed.
There are systems on the market which can do both; using multi-dimensional GC (MDGC) or
comprehensive GC in combination with a high resolution MS system such as time-of-flight (TOF)
MS one is able to dramatically increase both the sensitivity and the selectivity. This is realised by
coupling two GC columns of orthogonal behaviour. So, in the first column (also called first
dimension) the analytes are separated e.g. according to their boiling points when using a non-
polar column, and before going into the detector the analytes are separated in the second column
(also called second dimension) e.g. according to their polarity when using a polar column.
MDGC and comprehensive GC are of enormous importance for material development and
research, however, these systems are costly and require a lot of time and care. In most cases
relative and qualitative answers are sufficient for ? as these information is easier and faster to
obtain and to understand as MDGC and comprehensive GC data.
References IV
References
[1] Plastics Europe (2009): The Compelling Facts About Plastics 2009 - An analysis of European
plastics production, demand and recovery for 2008. Available on www.plasticseurope.org
.Accessed 12/14/2009.
[2] Buck L.B., Axel R. (1991) A novel multigene family may encode odorant receptors: A
molecular basis for odor recognition, Cell 65:175–187.
[3] Vosshall L.B. (2004) Olfaction: Attracting both sperm and the nose, Curr. Biol. 14:R918-920.
[4] Spehr M., Schwane K., Heilmann S., Gisselmann G., Hummel T., Hatt H. (2004) Dual capacity
of a human olfactory receptor, Curr. Biol. 14:R832-833.
[5] Starkenmann C., Le Calve B., Niclass Y., Cayeux I., Beccucci S., Troccaz M. (2008) Olfactory
Perception of Cysteine−S-Conjugates from Fruits and Vegetables, J. Agric. Food Chem.
56:9575-9580.
[6] ASTM E679 - 04 (2004) Standard Practice for Determination of Odor and Taste Thresholds By
a Forced-Choice Ascending Concentration Series Method of Limits.
[7] Brydson J.A. (1999) Plastics Materials: 7th edition, Elsevier Butterworth-Heinemann, Oxford,
UK.
[8] Oberbach K. (2001) Saechtling Kunststoff Taschenbuch, 28th edition, Hanser, Munich,
Germany.
[9] Imuta J.-I., Kashiwa N. (2000) Recent Progress on single-site catalysts in: Handbook of
polyolefins (Vasile C., ed.) Marcel Dekker, New York, USA, 71-88.
[10] Maier C., Haber T. (1998) Polypropylene: The Definitive User's Guide and Databook (Plastics
Design Library), William Andrew, Norwich, USA.
[11] Schneider B., Doskocilova D. (2000) Structures of polyolefins, in: Handbook of polyolefins
(Vasile C., ed.) Marcel Dekker, New York, USA, 161-222.
[12] Barret J., Gijsman P., Swagten J., Lange R.F.M. (2002) A molecular study towards the
interaction of phenolic anti-oxidants, aromatic amines and HALS stabilizers in a thermo-
oxidative ageing process, Polym. Degrad. Stab. 76:441–448.
[13] Bertin D., Boutevin B., Rigal G., Fourty G. (1998) Study of talc-additive interactions by
combined TGA-FTIR system, Eur. Polym. J. 34:163-170.
[14] Sauer C. (2007) Interaction of talc and phenolic antioxidants with respect to volatiles and
odour, Internal Technical report, Borealis Polyolefine GmbH.
References V
[15] Epacher E., Tolveth J., Kröhnke C., Pukansky B. (2000) Processing stability of high density
polyethylene: effect of absorbed and dissolved oxygen, Polymer 41:8401-8409.
[16] Andersson T., Stalbom B., Wesslen B. (2004) Degradation of polyethylene during extrusion.
II. Degradation of low-density polyethylene, linear low-density polyethylene and high-density
polyethylene in film extrusion, J. Appl. Polym. Sci. 91:1525-1537.
[17] Tüdös F., Iring M. (1988) Polyolefine oxidation: Rates and products, Acta Polymerica 39:19-
26.
[18] Albertsson A.-C., Gröning M., Hakkarainen M. (2006) Emission of volatiles from polymers – a
new approach for understanding polymer degradation, J. Polym. Environ. 14:9-13.
[19] Bernstein R., Thornberg S.M., Assink R.A., Irwin A.N., Hochrein J.M., Brown J.R., Derzon D.K.,
Klamo S.B., Clough R.L. (2007) The origins of volatile oxidation products in the thermal
degradation of polypropylene, identified by selective isotopic labeling, Polym. Degrad. Stab.
92:2076-2094.
[20] Hoff A., Jacobsson S. (1981) Thermo-Oxidative Degradation of Low-Density Polyethylene
Close to Industrial Processing Conditions, J. Appl. Polym. Sci. 26:3409-3423.
[21] Frank H.P. (1976) Some oxidation characteristics of polypropylene, J. Polym. Sci. Symp.
57:311-318.
[22] Hoff A., Jacobssen S. (1982) Thermal Oxidation of Polypropylene Close to Industrial
Processing Conditions, J. Appl. Polym. Sci. 27:2539-2551.
[23] Richaud E., Farcas F., Fayolle B., Audouin L., Verdu J. (2007) Hydroperoxide build-up in the
thermal oxidation of polypropylene- A kinetic study, Polym. Degrad. Stab. 92:118-124.
[24] Piringer O., Rüter M. (2000) Sensory problems caused by food and packaging interactions in:
Plastic Packaging Materials for Food (Piringer O., Baner A.L., ed.), 407-426, Wiley-VCH, Weinheim, Germany.
[25] Villberg K., Veijanen A. (2001) Analysis of a GC/MS thermal desorption system with
simultaneous sniffing for determination of off-odor compounds and VOCs in fumes formed
during extrusion coating of low-density polyethylene, Anal. Chem. 73:971-977.
[26] Bravo A., Hotchkiss J.H., Acree T.E. (1992) Identification of odor-active compounds resulting
from thermal oxidation of PE, J. Agric. Food Chem. 40:1881-1885.
[27] Tyapkova O., Czerny M., Buettner A. (2009) Characterization of flavour compounds formed
by γ-irradiation of polypropylene, Polym. Degrad. Stab. 94:757-769.
[28] Villberg K., Veijanen A., Gustafsson I., Wickström K. (1997) Analysis of odour and taste
problems in high-density polyethylene, J. Chromatogr., A 791:213-219.
[29] Rebeyrolle-Bernard P., Etievant P. (1993) Volatile compounds extracted from PP sheets by
hot water: influence of temperature of sheets injection, J. Appl. Polym. Sci. 49:1159-1164.
References VI
[30] Skjervak I., Due A., Gjerstad K.O., Herikstad H. (2003) Volatile organic components migrating
from plastic pipes (HDPE, PEX, PVC) into drinking water, Water Res 37:1912-1920.
[31] Sanders R.A., Zyzak D.V., Morsch T.R., Zimmerman S.P., Searles P.M., Srothers M.A., Eberhart B.L., Woo A.K. (2005) Identification of 8-Nonenal as an important contributor to
"plastic" off-odor in PE packaging, J. Agric. Food Chem. 53:1713-1716.
[32] van Gemert L.J. (2003) Compilations of odour threshold values in air, water and other media;
Oliemans Punter & Partner BV, Utrecht, The Netherlands.
[33] Kovats E. (1958) Gas-chromatographische Charakterisierung organischer Verbindungen. Teil
1: Retentionsindices aliphatischer Halogenide, Alkohole, Aldehyde und Ketone, Helv. Chim.
Acta 41:1915-1920.
[34] Dool H, Kratz P.(1963) A generalization of the retention index system including linear
temperature programmed gas-liquid partition chromatography, J Chromatogr. 11:463-471.
[35] Farkas P., Le Quere J.L, Maarse H., Kovac M. (1994) The standard GC retention index library
of flavour compounds, in: Maarse H., van der Heij D.G. (ed.), Trends in Flavour Research,
Elsevier Science B.V., The Netherlands, 145-149.
[36] Molyneux R.J., Schieberle P. (2007) Compound Identification: A Journal of Agricultural and
Food Chemistry Perspective, J. Agric. Food Chem. 55:4625-4629.
[37] Chaintreau A. (2001) Simultaneous distillation-extraction: from birth to maturity, Flav. Frag.
16:136-138.
[38] Veith G.D., Kiwus L.M. (1977) An exhaustive steam-distillation and solvent-extraction unit for
pesticides and industrial chemicals, Bull. Environ. Contam. Toxicol. 17:631-636.
[39] Likens S.T., Nickerson G.B. (1964) Detection of certain hop oil constituents in brewing
products, Am. Soc. Brew. Chem. Proc., 5-13.
[40] Filek G., Bergamini M., Lindner W. (1995) Steam distillation-solvent extraction, a selective
sample enrichment technique for the gas chromatographic-electron-capture detection of
organochlorine compounds in milk powder and other milk products, J. Chromatogr., A,
712:355-364.
[41] Repnegg F. (2001) Geruchsaktive Verbindungen in Polyolefinen, Dissertation Graz University
of Technology.
[42] Supelco (2009) Normal Phase Solid Phase Extraction,
http://www.sigmaaldrich.com/analytical-chromatography/sample-
preparation/spe/normalphase-methodology.html .accessed 01/12/2010.
[43] Siegmund B. (1997) Untersuchung und Optimierung der Aromaeigenschaften eines
Convenience-Food Produkts, Dissertation Graz University of Technology.

References VII
[44] Pawliszyn J. (1997) Solid Phase Microextraction Theory and Practise, Wiley-VCH, New York,
USA.
[45] Supelco (2009) Product information, http://www.sigmaaldrich.com/analytical-chromatography/analytical-products.html?TablePage=18156565. Accessed 01/12/2010.
[46] Supelco Technical note T397136A (1997) Reduce Inlet Liner ID for Sharper Peaks by
SPME/GC, available on www.sigmaaldrich.com . Accessed 01/12/2010,
[47] Knapp D.R. (1979) Handbook of Analytical Derivatization reactions, Wiley-Interscience, New
York, USA.
[48] Wood K.V., Schmidt C.E., Cooks R.G., Batts B.D. (1984) Identification of Partially
Hydrogenated Nitrogen-Containing Polycyclic Aromatic Hydrocarbons in Coal Liquids by
Tandem Mass Spectrometry, Anal. Chem. 56:1335-1338.
[49] Schmarr H.G., Potouridis T., Ganß S., Sang W., Köpp B., Bokuz U., Fischer U. (2008) Analysis
of carbonyl compounds via HS SPME with onfibre derivatization and GC ion trap tandem
mass spectrometric determination of their O-(2,3,4,5,6-pentafluorobeznyl)oxime derivatives,
Anal. Chim. Acta 617:119–131.
[50] Hopfer, H.; Haar, N.; Koraimann C., Leitner, E. (2009) Derivatization of odour-active
carbonyls in trace amounts for determination with GC and various detectors in: Food for the
future – the contribution of chemistry to improvement of food quality (Sørensen H.,
Sørensen S., Sørensen A.D., Sørensen J.C., Andersen K.E., Bjergegaard C., Møller P.)
Proceedings of the EURO FOOD CHEM XV, Copenhagen, University of Copenhagen:
Copenhagen (2009) 100 – 103.
[51] Tamura H., Shibamoto T. (1991) Factors affecting cyclization of alkenal-N-methylhydrazones
used for trace aldehyde determination, Anal Chim Acta 248:619-623.
[52] Agilent Technologies Inc. (2008) J&W GC Column Selection Guide.
[53] Agilent Technologies Inc (2008) NEW Agilent J&W Ultra Inert Capillary GC Columns.
[54] Hopfer H., Schrampf E., Leitner E. (2010) Maillard Reactions in Polyolefins? - Identification of
the odor-active Maillard product 2-Acetyl-1-pyrroline in polypropylene (PP), J. Chromatogr.,
A., submitted.
[55] Wegscheider W., Rohrer C., Neuböck R. (1997) Validata - Excel 97 Makro zur
Methodenvalidierung, Version 3.02.48.
[56] Funk W., Damman V., Donnevert G. (1992) Qualitätssicherung in der Analytischen Chemie,
VCH, Weinheim, Germany.
[57] DIN 32645 (1994) Chemical analysis - Decision limit, detection limit and determination limit
under repeatability conditions - Terms, methods, evaluation.
References VIII
[58] DIN 53383-2:1983-06 (1983) Testing of plastics; testing of oxidation stability by means of
ageing in an oven; polyethylene of high density (PE-HD), infra red spectroscopic (IR)
determination of the carbonyl content.
[59] Kessler W. (2007) Multivariate Datenanalyse für die Pharma-, Bio- und Prozessanalytik,
Wiley-VCH, Weinheim, Germany.
[60] DIN 10961:1996-08 (1996) Training of assessors for sensory analysis.
[61] O'Mahony M. (1995) Who told you the triangle test was simple?, Food Qual. Prefer. 6:227–
238.
[62] Pollien P., Ott A., Montigon F., Baumgartner M., Munoz-Box R., Chaintreau A. (1997)
Hyphenated headspace-gas chromatography-sniffing technique: Screening of impact
odorants and quantitative aromagram comparisons J. Agric. Food Chem.45:2630-2637.
[63] Grosch W. (1994) Review: Determination of potent odourants in foods by aroma extract
dilution analysis (AEVA) and calculation of odour activity values (OAVs), Flav. Fragr. 9:147-158.
[64] Linssen J.P.H., Janssens J.L.G.M., Roozen J.P., Posthumus M.A. (1993) Combined gas
chromatography and sniffing port analysis of volatile compounds of mineral water packed in
polyethylene laminated packages, Food Chem. 46:367-371.
[65] Acree T., Arn H.(2004) Flavornet and human odor space, www.flavornet.org. Accessed
08/28/2009.
[66] Mottram R., The LRI and Odour Database, www.odour.org.uk. Accessed 08/28/2009.
[67] El-Sayed A.M. (2009) The Pherobase: Database of Insect Pheromones and Semiochemicals,
www.pherobase.com. Accessed 08/28/2009.
[68] Farkaš P., Sádecká J., Leitner E., Siegmund B., Petka J. (2001 ) SKAF flavour database.
[69] CITAC/Eurachem Guide (2002) Guide to Quality in Analytical Chemistry, available on
http://www.eurachem.org/guides/CITAC%20EURACHEM%20GUIDE.pdf. Accessed
12/19/2009.
[70] Product data sheet Borstar © FB2230 (2008) Borealis AG, Vienna.
[71] Product data sheet BorSafe TM ME3440 (2008) Borealis AG, Vienna.
[72] Product data sheet Bormod TM BF970MO (2008) Borealis AG, Vienna.
[73] Product data sheet Daplen TM EE188AI (2008) Borealis AG, Vienna.
[74] Verband der Automobilindustrie, 1995, VDA 277 - Nichtmetallische Werkstoffe der KFZ
Innenausstattung-Bestimmung der Emission organischer Verbindungen.

References IX
[75] Renöckl E. (2010) Monomer Purity concerning Odour and Taste, Master Thesis, Graz
University of Technology.
[76] Buttery R.G., Ling L.C., Juliano B.O., Turnbaugh J.G. (1983) Cooked rice aroma and 2-acetyl-1-
pyrroline, J. Agric. Food Chem. 31:823-826.
[77] Schieberle P. (1991) Primary odorants in popcorn, J. Agric. Food Chem. 39:1141-1144.
[78] Schieberle P., Grosch W. (1985) Identification of the volatile flavour compounds of wheat
bread crust — comparison with rye bread crust, Z. Lebensm. Unters. Forsch. 180:474-478.
[79] Avsar Y.K., Karagul-Yuceer Y., Drake M.A., Singh T.K., Yoon Y., Cadwallader K.R. (2004)
Characterization of nutty flavour in cheddar cheese, J. Dairy Sci. 87: 1999-2010.
[80] Brahmachary R.L. (1996) The expanding world of 2-acetyl-1-pyrroline, Curr. Sci. 71:257-258.
[81] Büchi G., Wüest H. (1971) Synthesis of 2-acetyl-1,4,5,6-tetrahydropyridine, a constituent of
bread aroma, J. Org. Chem. 36:609-610.
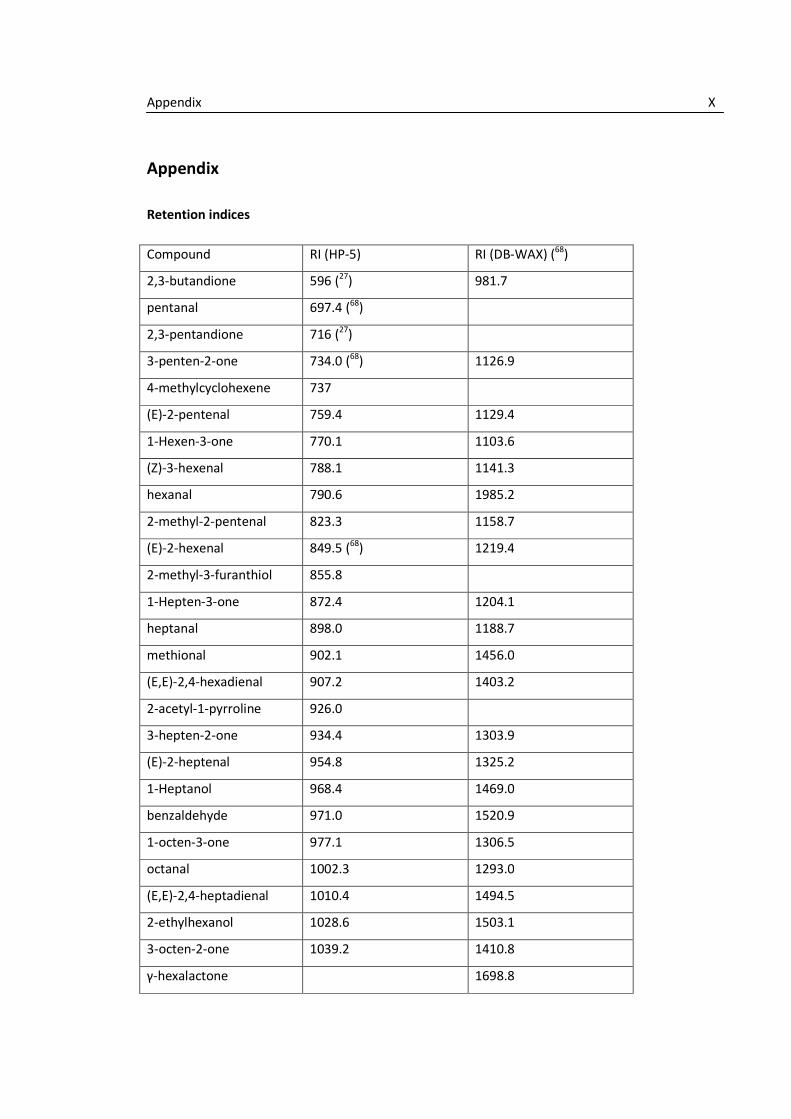
Appendix X
Appendix
Retention indices
Compound RI (HP-5) RI (DB-WAX) (68)
2,3-butandione 596 (27) 981.7
pentanal 697.4 (68)
2,3-pentandione 716 (27)
3-penten-2-one 734.0 (68) 1126.9
4-methylcyclohexene 737
(E)-2-pentenal 759.4 1129.4
1-Hexen-3-one 770.1 1103.6
(Z)-3-hexenal 788.1 1141.3
hexanal 790.6 1985.2
2-methyl-2-pentenal 823.3 1158.7
(E)-2-hexenal 849.5 (68) 1219.4
2-methyl-3-furanthiol 855.8
1-Hepten-3-one 872.4 1204.1
heptanal 898.0 1188.7
methional 902.1 1456.0
(E,E)-2,4-hexadienal 907.2 1403.2
2-acetyl-1-pyrroline 926.0
3-hepten-2-one 934.4 1303.9
(E)-2-heptenal 954.8 1325.2
1-Heptanol 968.4 1469.0
benzaldehyde 971.0 1520.9
1-octen-3-one 977.1 1306.5
octanal 1002.3 1293.0
(E,E)-2,4-heptadienal 1010.4 1494.5
2-ethylhexanol 1028.6 1503.1
3-octen-2-one 1039.2 1410.8
γ-hexalactone 1698.8

Appendix XI
(E)-2-octenal 1058.7 1431.2
1-nonen-3-one 1079.7 1409.4
furaneol 1087.4 2043.3
o-cresol 1092
(E)-6-nonenal 1095.1
(E)-4-nonenal 1096.0 1442.9
8-nonenal 1096.5
(Z)-6-nonenal 1101.2 1454.4
nonanal 1104.6 1397.7
(E,E)-2,4-octadienal 1110.3 1590.8
3-nonen-2-one 1139.9 (68) 1515.3
γ-heptalactone 1152.7 1800.0
(E)-2-nonenal 1161.4 1537.6
(Z)-4-decenal 1197.3 1544.4
decanal 1206.8 1502.9
(E,E)-2,4-nonadienal 1215.9 1702.5
γ-octalactone 1258.8 1914.7
(E)-2-decenal 1264.1 1646.1
undecanal 1308.8 1608.6
(E,E)-2,4-decadienal 1319.4 1812.0
methyl anthranilate 1346.5 2240.0
γ-nonalactone 1364.1 (68) 2028.3
(E)-2-undecenal 1366.5 1754.5
1-dodecen-3-one 1383 1724.9
δ-nonalactone 1392.7 2080.8
dodecanal 1409.7 1714.7
(E,E)-2,4-undecadienal 1423.1 1921.3
(E)-2-dodecenal 1467.6 1863.3
tridecanal 1511.7 (68) 1821.2
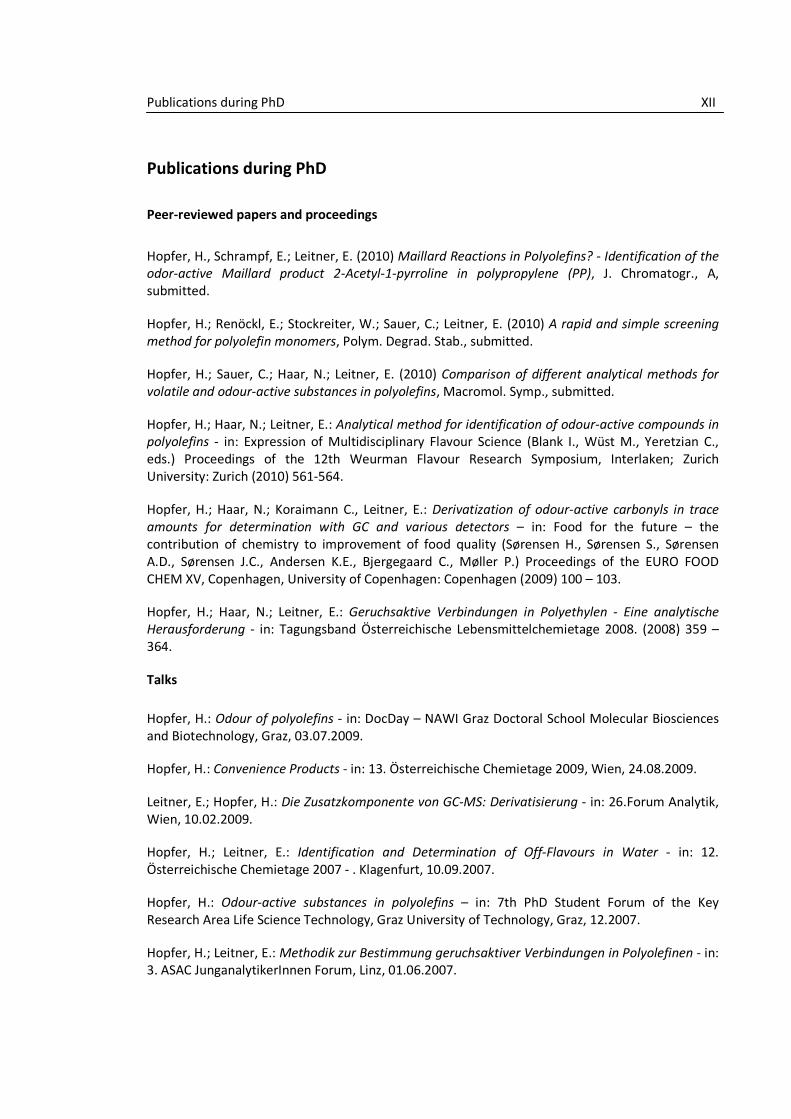
Publications during PhD XII
Publications during PhD
Peer-reviewed papers and proceedings
Hopfer, H., Schrampf, E.; Leitner, E. (2010) Maillard Reactions in Polyolefins? - Identification of the
odor-active Maillard product 2-Acetyl-1-pyrroline in polypropylene (PP), J. Chromatogr., A,
submitted.
Hopfer, H.; Renöckl, E.; Stockreiter, W.; Sauer, C.; Leitner, E. (2010) A rapid and simple screening
method for polyolefin monomers, Polym. Degrad. Stab., submitted.
Hopfer, H.; Sauer, C.; Haar, N.; Leitner, E. (2010) Comparison of different analytical methods for
volatile and odour-active substances in polyolefins, Macromol. Symp., submitted.
Hopfer, H.; Haar, N.; Leitner, E.: Analytical method for identification of odour-active compounds in
polyolefins - in: Expression of Multidisciplinary Flavour Science (Blank I., Wüst M., Yeretzian C.,
eds.) Proceedings of the 12th Weurman Flavour Research Symposium, Interlaken; Zurich
University: Zurich (2010) 561-564.
Hopfer, H.; Haar, N.; Koraimann C., Leitner, E.: Derivatization of odour-active carbonyls in trace
amounts for determination with GC and various detectors – in: Food for the future – the
contribution of chemistry to improvement of food quality (Sørensen H., Sørensen S., Sørensen
A.D., Sørensen J.C., Andersen K.E., Bjergegaard C., Møller P.) Proceedings of the EURO FOOD
CHEM XV, Copenhagen, University of Copenhagen: Copenhagen (2009) 100 – 103.
Hopfer, H.; Haar, N.; Leitner, E.: Geruchsaktive Verbindungen in Polyethylen - Eine analytische
Herausforderung - in: Tagungsband Österreichische Lebensmittelchemietage 2008. (2008) 359 –
364.
Talks
Hopfer, H.: Odour of polyolefins - in: DocDay – NAWI Graz Doctoral School Molecular Biosciences
and Biotechnology, Graz, 03.07.2009.
Hopfer, H.: Convenience Products - in: 13. Österreichische Chemietage 2009, Wien, 24.08.2009.
Leitner, E.; Hopfer, H.: Die Zusatzkomponente von GC-MS: Derivatisierung - in: 26.Forum Analytik,
Wien, 10.02.2009.
Hopfer, H.; Leitner, E.: Identification and Determination of Off-Flavours in Water - in: 12.
Österreichische Chemietage 2007 - . Klagenfurt, 10.09.2007.
Hopfer, H.: Odour-active substances in polyolefins – in: 7th PhD Student Forum of the Key
Research Area Life Science Technology, Graz University of Technology, Graz, 12.2007.
Hopfer, H.; Leitner, E.: Methodik zur Bestimmung geruchsaktiver Verbindungen in Polyolefinen - in: 3. ASAC JunganalytikerInnen Forum, Linz, 01.06.2007.
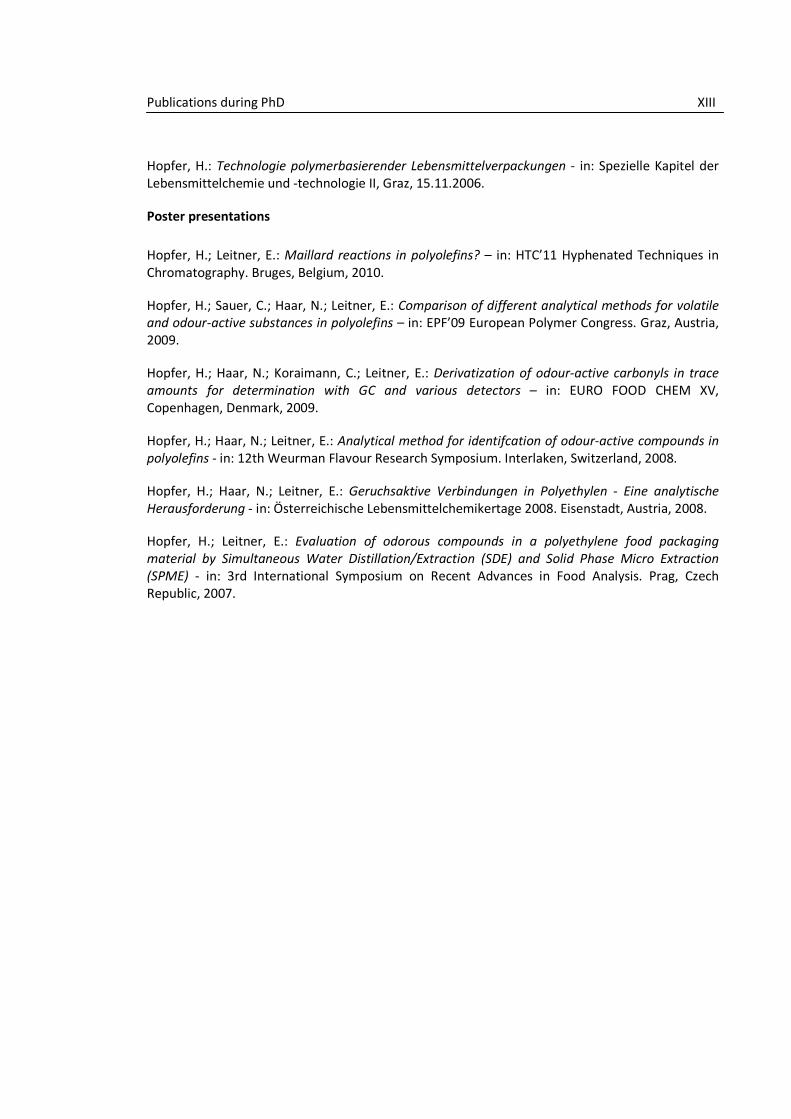
Publications during PhD XIII
Hopfer, H.: Technologie polymerbasierender Lebensmittelverpackungen - in: Spezielle Kapitel der
Lebensmittelchemie und -technologie II, Graz, 15.11.2006.
Poster presentations
Hopfer, H.; Leitner, E.: Maillard reactions in polyolefins? – in: HTC’11 Hyphenated Techniques in
Chromatography. Bruges, Belgium, 2010.
Hopfer, H.; Sauer, C.; Haar, N.; Leitner, E.: Comparison of different analytical methods for volatile
and odour-active substances in polyolefins – in: EPF’09 European Polymer Congress. Graz, Austria,
2009.
Hopfer, H.; Haar, N.; Koraimann, C.; Leitner, E.: Derivatization of odour-active carbonyls in trace
amounts for determination with GC and various detectors – in: EURO FOOD CHEM XV,
Copenhagen, Denmark, 2009.
Hopfer, H.; Haar, N.; Leitner, E.: Analytical method for identifcation of odour-active compounds in
polyolefins - in: 12th Weurman Flavour Research Symposium. Interlaken, Switzerland, 2008.
Hopfer, H.; Haar, N.; Leitner, E.: Geruchsaktive Verbindungen in Polyethylen - Eine analytische
Herausforderung - in: Österreichische Lebensmittelchemikertage 2008. Eisenstadt, Austria, 2008.
Hopfer, H.; Leitner, E.: Evaluation of odorous compounds in a polyethylene food packaging
material by Simultaneous Water Distillation/Extraction (SDE) and Solid Phase Micro Extraction
(SPME) - in: 3rd International Symposium on Recent Advances in Food Analysis. Prag, Czech
Republic, 2007.
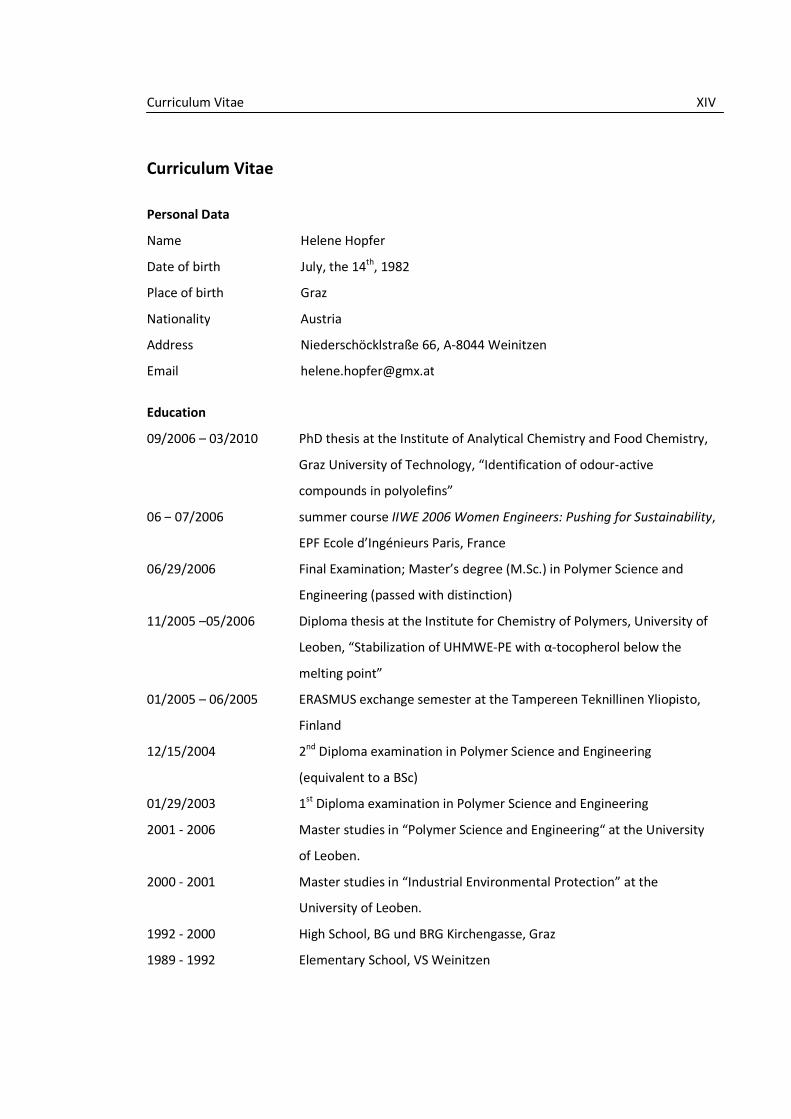
Curriculum Vitae XIV
Curriculum Vitae
Personal Data
Name Helene Hopfer
Date of birth July, the 14th, 1982
Place of birth Graz
Nationality Austria
Address Niederschöcklstraße 66, A-8044 Weinitzen
Email [email protected]
Education
09/2006 – 03/2010 PhD thesis at the Institute of Analytical Chemistry and Food Chemistry,
Graz University of Technology, “Identification of odour-active
compounds in polyolefins”
06 – 07/2006 summer course IIWE 2006 Women Engineers: Pushing for Sustainability,
EPF Ecole d’Ingénieurs Paris, France
06/29/2006 Final Examination; Master’s degree (M.Sc.) in Polymer Science and
Engineering (passed with distinction)
11/2005 –05/2006 Diploma thesis at the Institute for Chemistry of Polymers, University of
Leoben, “Stabilization of UHMWE-PE with α-tocopherol below the
melting point”
01/2005 – 06/2005 ERASMUS exchange semester at the Tampereen Teknillinen Yliopisto,
Finland
12/15/2004 2nd Diploma examination in Polymer Science and Engineering
(equivalent to a BSc)
01/29/2003 1st Diploma examination in Polymer Science and Engineering
2001 - 2006 Master studies in “Polymer Science and Engineering“ at the University
of Leoben.
2000 - 2001 Master studies in “Industrial Environmental Protection” at the
University of Leoben.
1992 - 2000 High School, BG und BRG Kirchengasse, Graz
1989 - 1992 Elementary School, VS Weinitzen
Curriculum Vitae XV
Research experience
06 – 08/2005 IAESTE internship at the Queen Mary University London, UK, New
keratoprosthesis materials based on hydroxyapatite layered polymers.
2002 - 2004 student worker at the Institute of Materials Science and Testing of
Plastics, University of Leoben
07 – 08/2004 internship at DOW Europe GmbH, Horgen, Switzerland, Noise reduction
of adult diapers
07 – 08/2003 internship at Roche Diagnostics, Near Patient Testing, Graz, Austria,
Materials Testing of plastics used in blood analyzer instruments
07 – 08/2002 internship at the Joanneum Research, Institute for Polymer Engineering,
Leoben, Fracture mechanical characterization of PVDF films
Language and Other skills
Languages English (fluent), Italian (basic), Finnish (basic)
PC skills MS Office, Agilent Chemstation, Java, Unscrambler, Matlab, Autocad
Grants
2009 GÖCH travel grant
2008 Weurman Symposium 2008 Scholarship
2008 GÖCH travel grant 2008
Graz, 2010-02-25 Helene Hopfer