Embed Size (px)
Citation preview

Inmunoterapia en Tumores Diges1vos Santander, 14 y 15 Julio 2016
Maria Alsina, MD
Hospital Universitari Vall d’Hebron
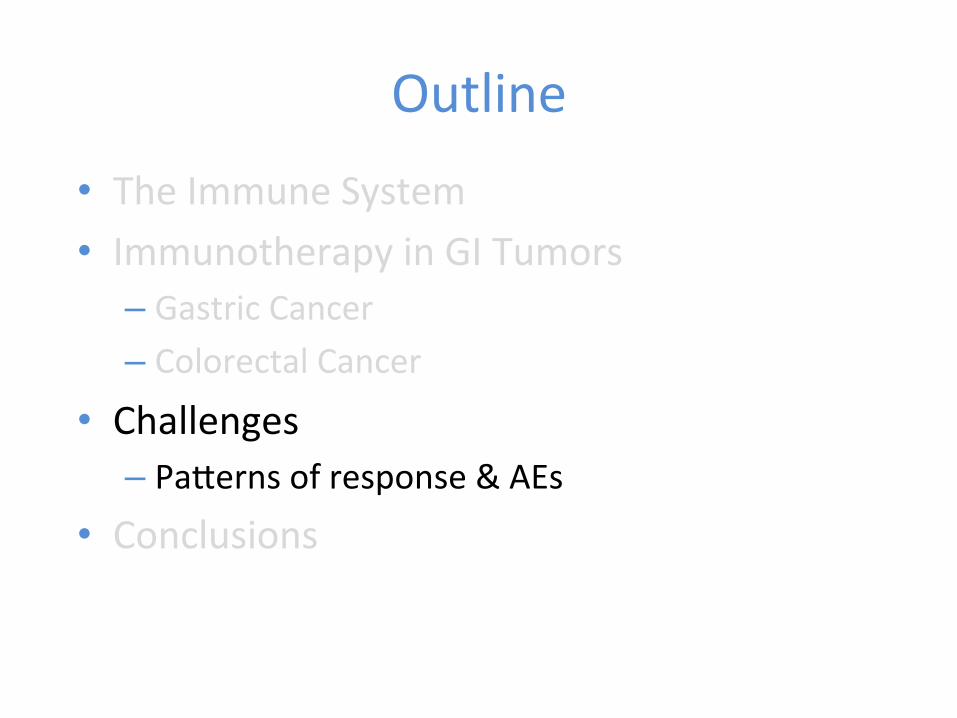
Outline • The Immune System • Immunotherapy in GI Tumors
– Gastric Cancer – Colorectal Cancer
• Challenges – PaKerns of response & AEs
• Conclusions
Outline • The Immune System • Immunotherapy in GI Tumors
– Gastric Cancer – Colorectal Cancer
• Challenges – PaKerns of response & AEs
• Conclusions
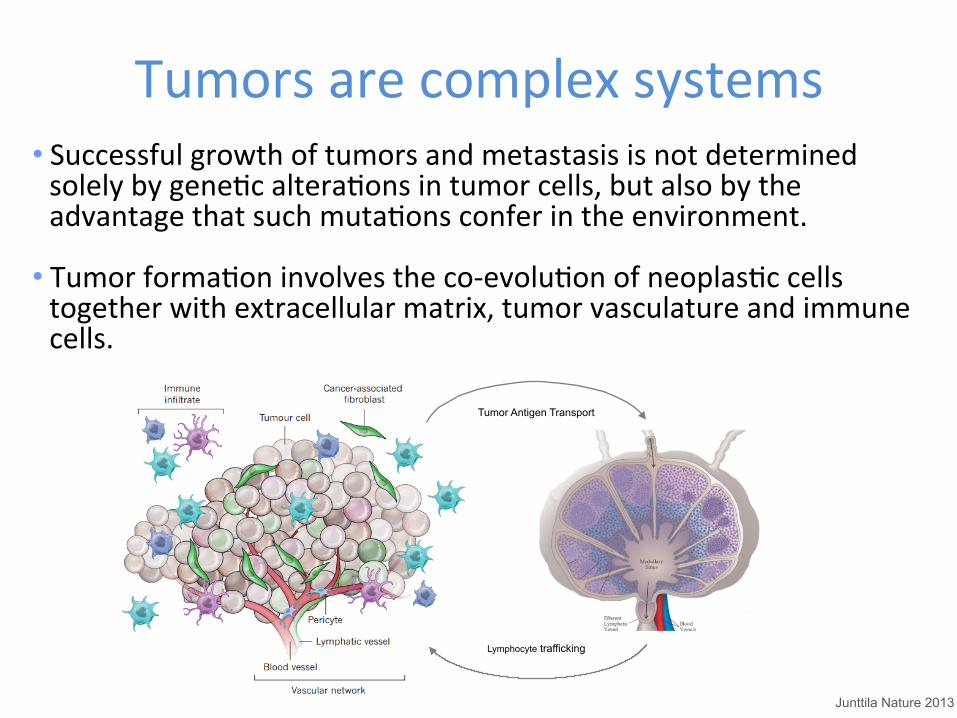
Tumors are complex systems • Successful growth of tumors and metastasis is not determined solely by geneQc alteraQons in tumor cells, but also by the advantage that such mutaQons confer in the environment.
• Tumor formaQon involves the co-‐evoluQon of neoplasQc cells together with extracellular matrix, tumor vasculature and immune cells.
Tumor Antigen Transport
Lymphocyte trafficking
Junttila Nature 2013
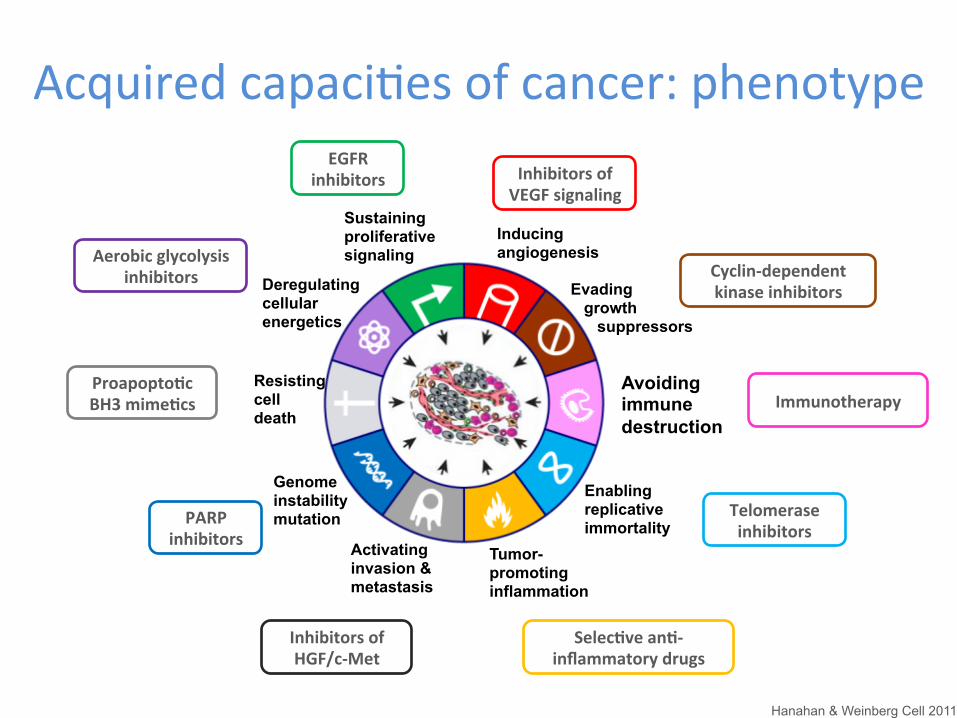
Acquired capaciQes of cancer: phenotype
Avoiding immune destruction
Evading growth suppressors
Enabling replicative immortality
Tumor- promoting inflammation
Activating invasion & metastasis
Genome instability mutation
Resisting cell death
Deregulating cellular energetics
Sustaining proliferative signaling
Inducing angiogenesis
Hanahan & Weinberg Cell 2011
EGFR inhibitors
Aerobic glycolysis inhibitors
Proapopto1c BH3 mime1cs
PARP inhibitors
Inhibitors of HGF/c-‐Met
Selec1ve an1-‐inflammatory drugs
Telomerase inhibitors
Cyclin-‐dependent kinase inhibitors
Inhibitors of VEGF signaling
Immunotherapy
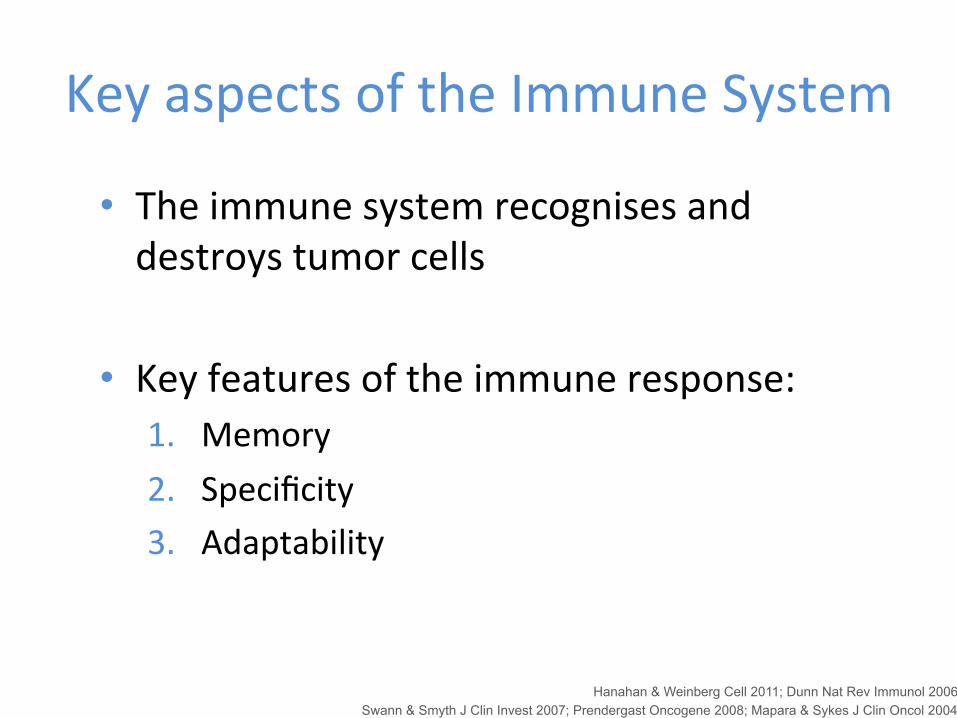
Key aspects of the Immune System
Hanahan & Weinberg Cell 2011; Dunn Nat Rev Immunol 2006 Swann & Smyth J Clin Invest 2007; Prendergast Oncogene 2008; Mapara & Sykes J Clin Oncol 2004
• The immune system recognises and destroys tumor cells
• Key features of the immune response: 1. Memory 2. Specificity 3. Adaptability
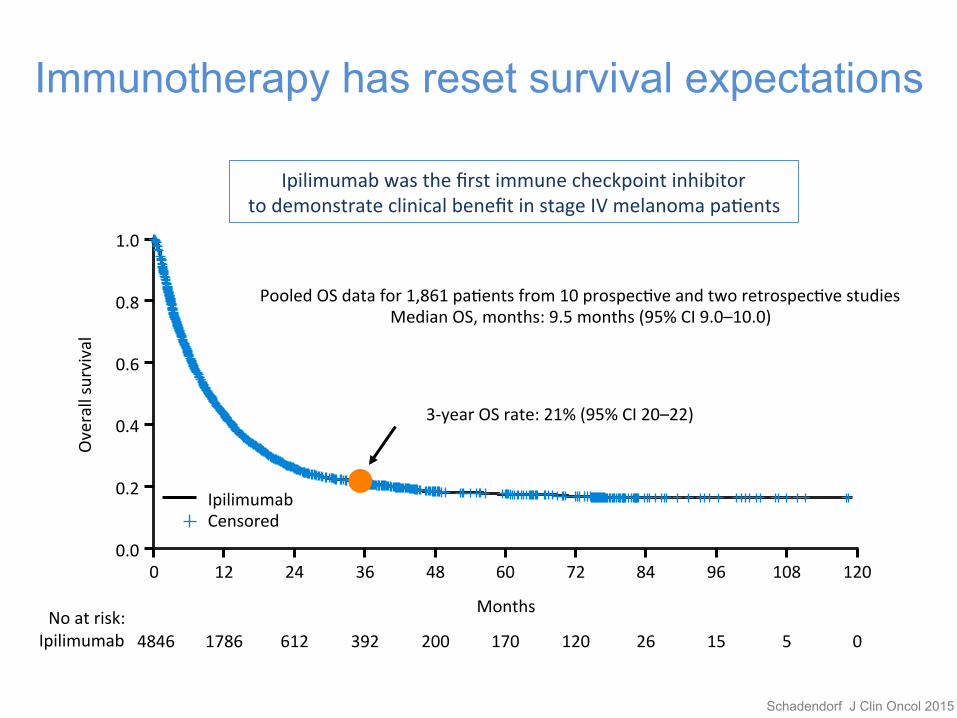
Immunotherapy has reset survival expectations
0 12 24 36 48 60 72 84 96 108 120 0.0
0.2
0.4
0.6
0.8
1.0
4846 1786 612 392 200 170 120 26 15 5 0
Months
Pooled OS data for 1,861 paQents from 10 prospecQve and two retrospecQve studies Median OS, months: 9.5 months (95% CI 9.0–10.0)
3-‐year OS rate: 21% (95% CI 20–22)
Ipilimumab Censored
Ipilimumab No at risk:
Schadendorf J Clin Oncol 2015
Overall survival
Ipilimumab was the first immune checkpoint inhibitor to demonstrate clinical benefit in stage IV melanoma paQents
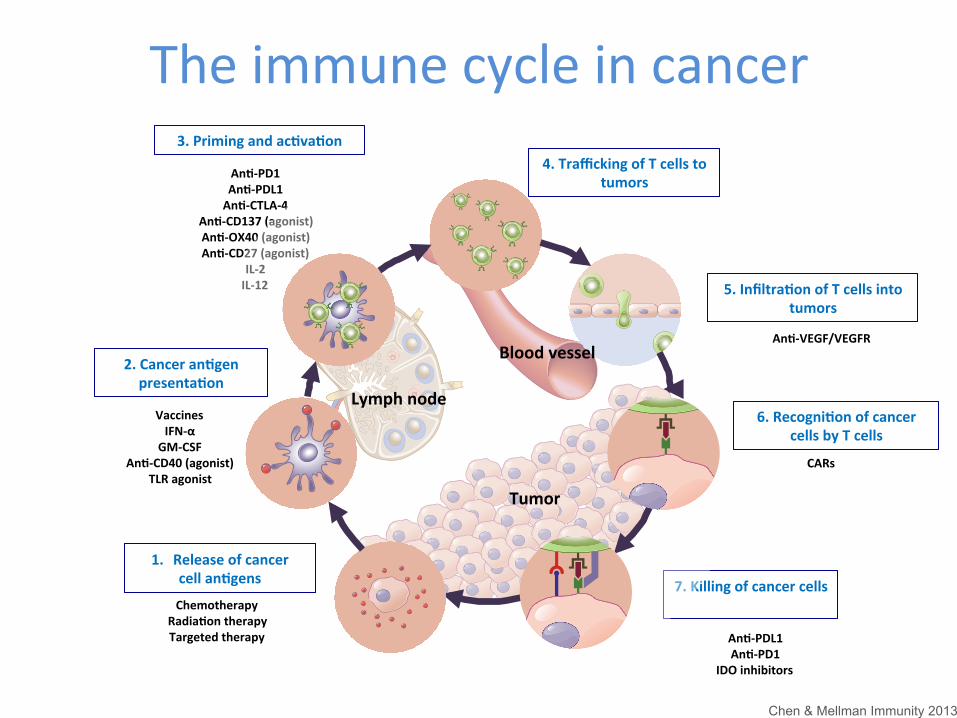
The immune cycle in cancer
7. Killing of cancer cells
An1-‐PD1 An1-‐PDL1 An1-‐CTLA-‐4
An1-‐CD137 (agonist) An1-‐OX40 (agonist) An1-‐CD27 (agonist)
IL-‐2 IL-‐12
Tumor
Lymph node
Blood vessel
1. Release of cancer cell an1gens
2. Cancer an1gen presenta1on
3. Priming and ac1va1on
5. Infiltra1on of T cells into tumors
6. Recogni1on of cancer cells by T cells
4. Trafficking of T cells to tumors
Vaccines IFN-‐α GM-‐CSF
An1-‐CD40 (agonist) TLR agonist
Chemotherapy Radia1on therapy Targeted therapy
An1-‐VEGF/VEGFR
CARs
An1-‐PDL1 An1-‐PD1
IDO inhibitors
Chen & Mellman Immunity 2013
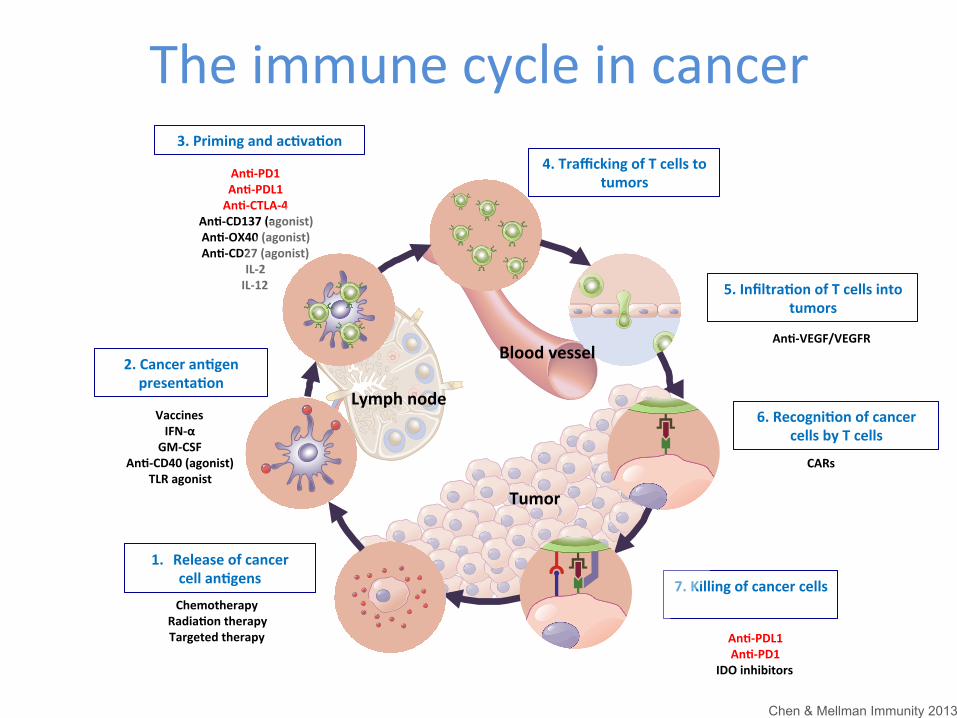
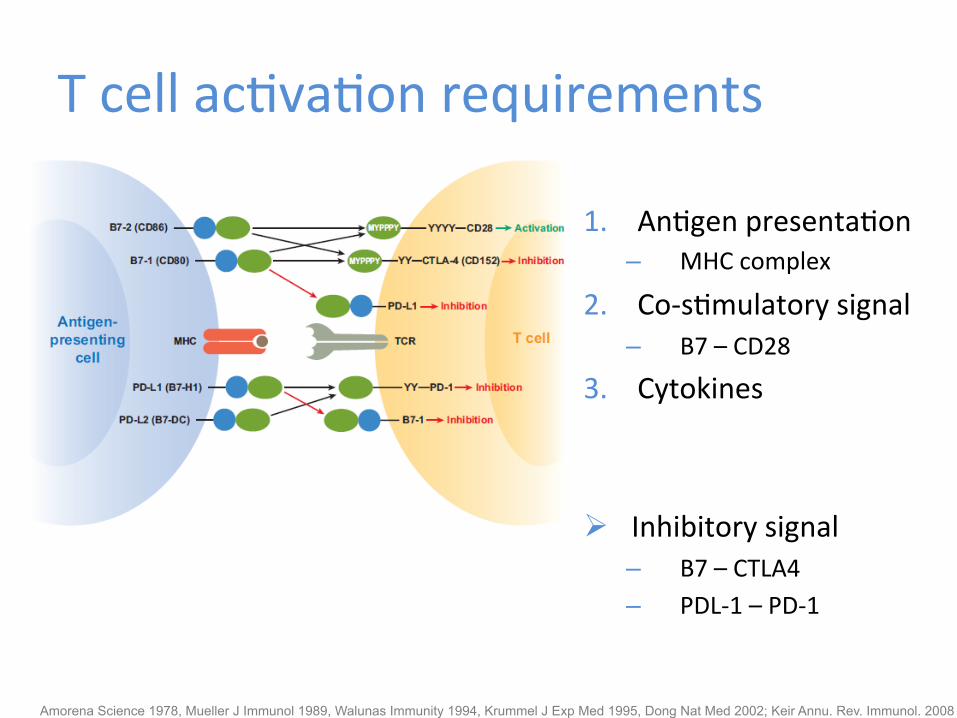
T cell acQvaQon requirements
1. AnQgen presentaQon – MHC complex
2. Co-‐sQmulatory signal – B7 – CD28
3. Cytokines
Ø Inhibitory signal – B7 – CTLA4 – PDL-‐1 – PD-‐1
Amorena Science 1978, Mueller J Immunol 1989, Walunas Immunity 1994, Krummel J Exp Med 1995, Dong Nat Med 2002; Keir Annu. Rev. Immunol. 2008
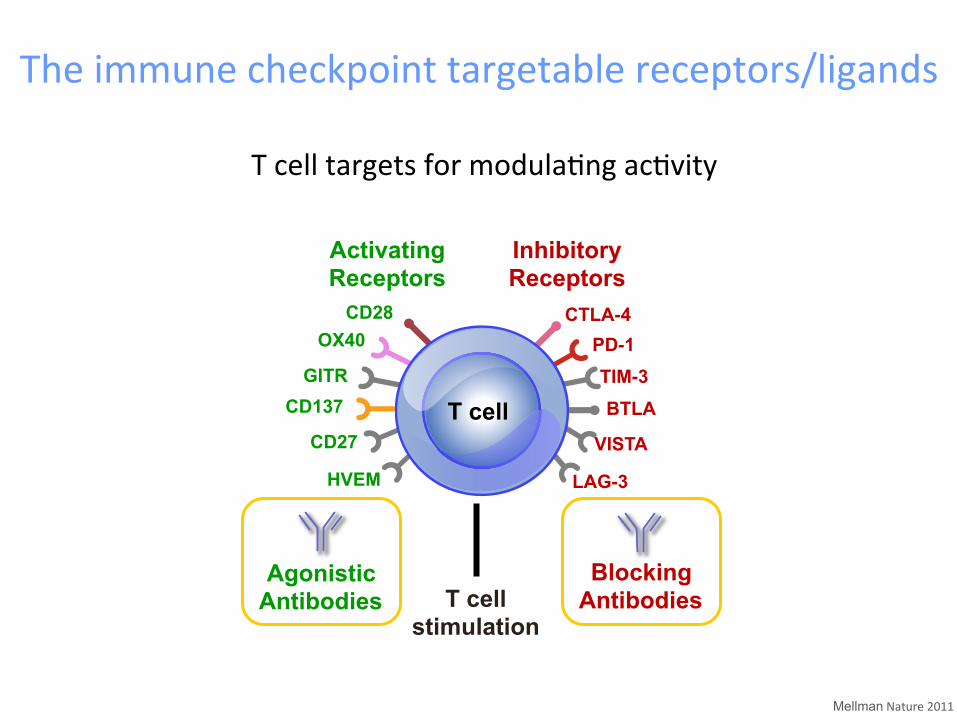
The immune checkpoint targetable receptors/ligands
Mellman Nature 2011
T cell targets for modulaQng acQvity
CD28 OX40
GITR CD137
CD27
HVEM
CTLA-4 PD-1 TIM-3 BTLA
VISTA
LAG-3
Activating Receptors
Inhibitory Receptors
T cell stimulation
T cell
Agonistic Antibodies
Blocking Antibodies
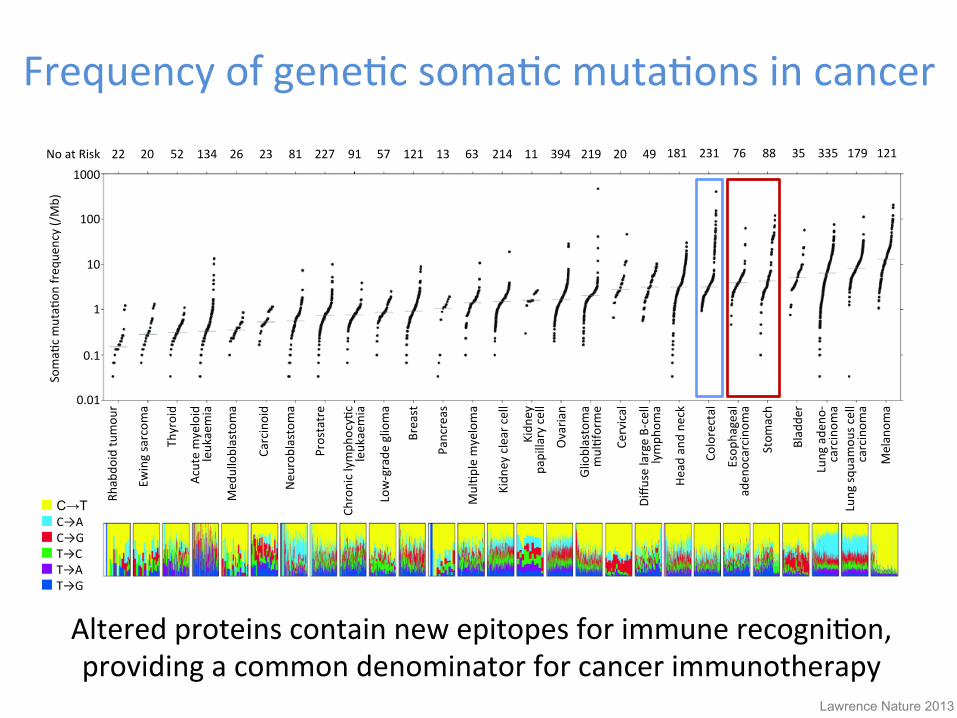
Frequency of geneQc somaQc mutaQons in cancer
Altered proteins contain new epitopes for immune recogniQon, providing a common denominator for cancer immunotherapy
Rhabdo
id tu
mou
r
Ewing sarcom
a
Thyroid
Acute myeloid
leukaemia
Med
ulloblastoma
Carcinoid
Neu
roblastoma
Prostatre
Chronic lymph
ocyQc
leukaemia
Low-‐grade
glioma
Breast
Pancreas
MulQp
le m
yeloma
Kidn
ey clear cell
Kidn
ey
papillary cell
Ovaria
n
Glioblastoma
mulQforme
Cervical
Diffu
se large B-‐cell
lymph
oma
Head and
neck
Colorectal
Esop
hageal
aden
ocarcino
ma
Stom
ach
Bladde
r
Lung ade
no-‐
carcinom
a Lung sq
uamou
s cell
carcinom
a
Melanom
a 0.01
0.1
1
10
100
1000
SomaQ
c mutaQ
on freq
uency (/Mb)
22 20 52 134 26 23 81 227 91 57 121 13 63 214 11 394 219 20 49 181 231 76 88 35 335 179 121
C→T C→A C→G T→C T→A T→G
Lawrence Nature 2013
No at Risk
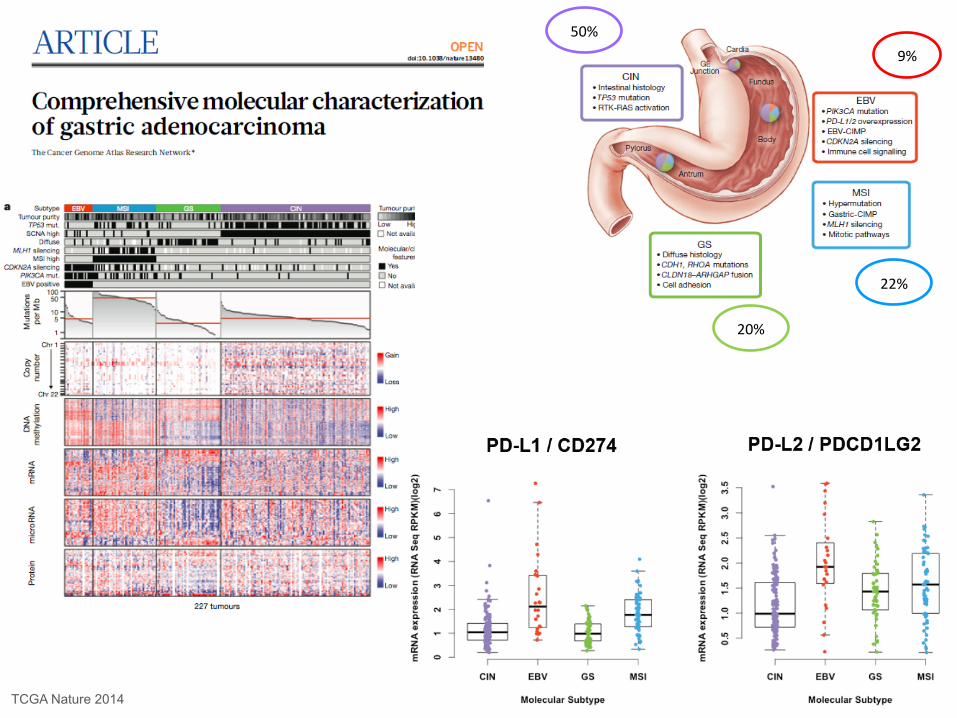
50%
20%
22%
9%
TCGA Nature 2014
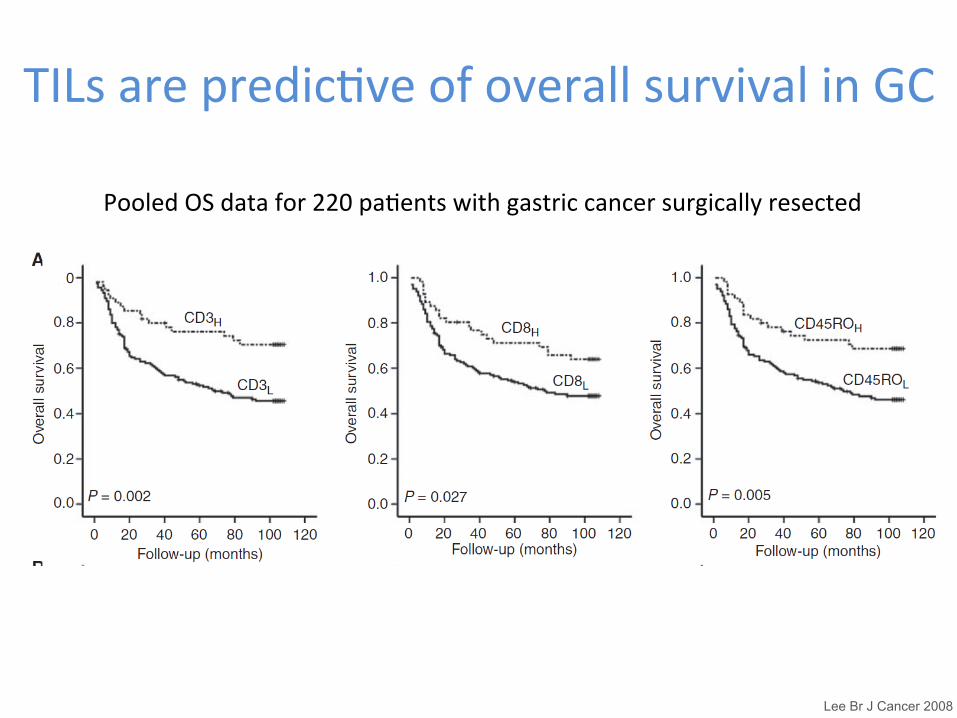
TILs are predicQve of overall survival in GC
Lee Br J Cancer 2008
Pooled OS data for 220 paQents with gastric cancer surgically resected
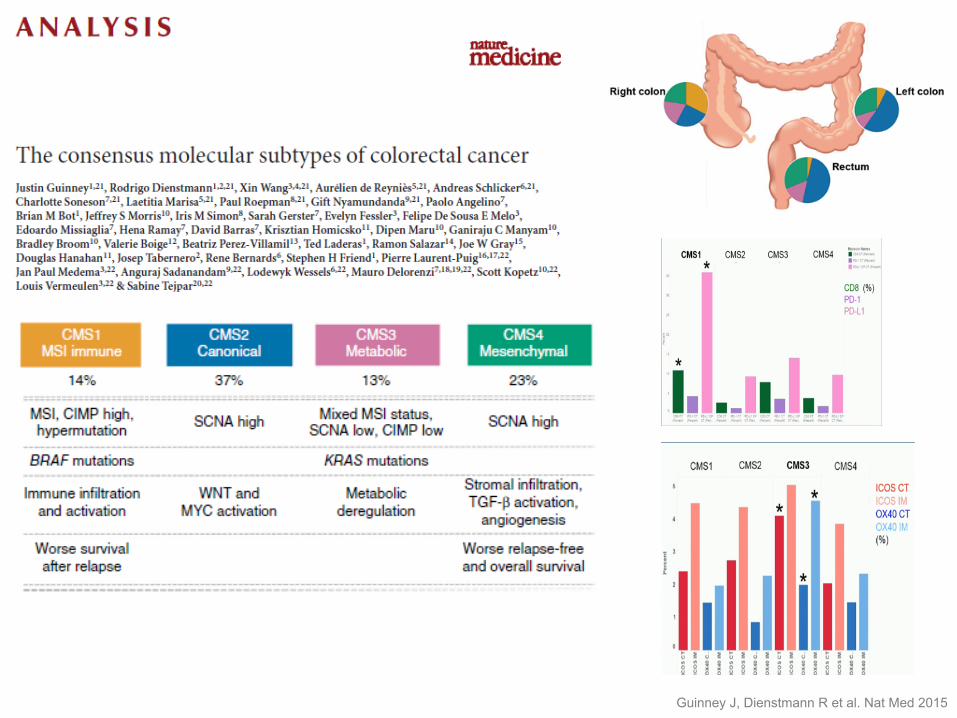
Guinney J, Dienstmann R et al. Nat Med 2015
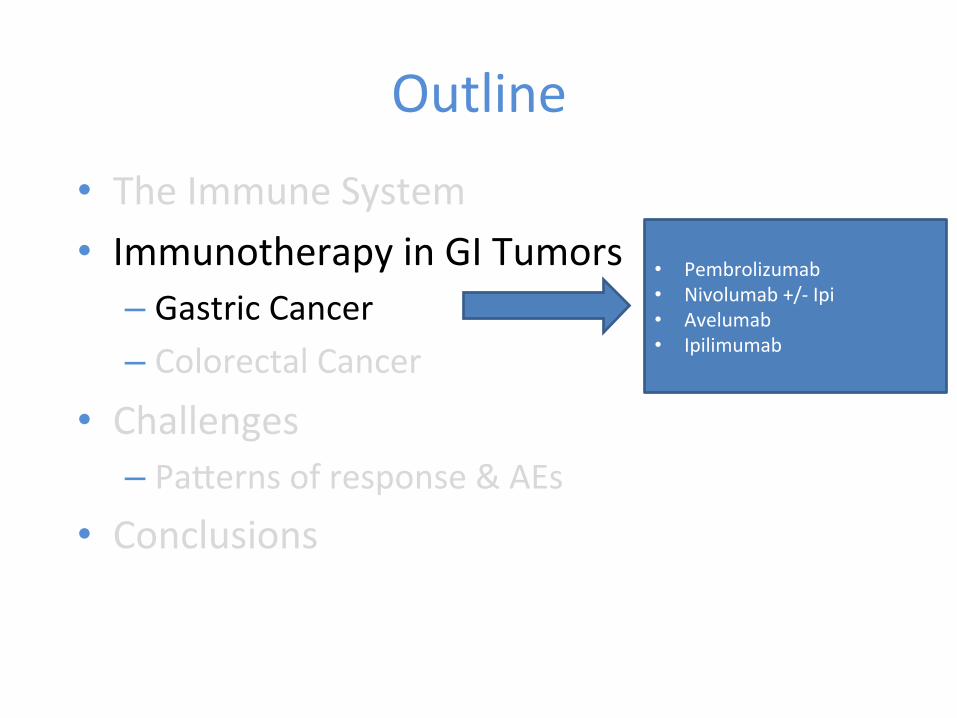
Outline • The Immune System • Immunotherapy in GI Tumors
– Gastric Cancer – Colorectal Cancer
• Challenges – PaKerns of response & AEs
• Conclusions
• Pembrolizumab • Nivolumab +/-‐ Ipi • Avelumab • Ipilimumab

Pembrolizumab
• KEYNOTE 0121 ü Ph 1b with a GC cohort (39 pts)
• KEYNOTE 0592 ü Ph II 1st Line ü Preliminary safety data
1. Muro Lancet Oncol 2016 2. Fuchs ASCO 2016
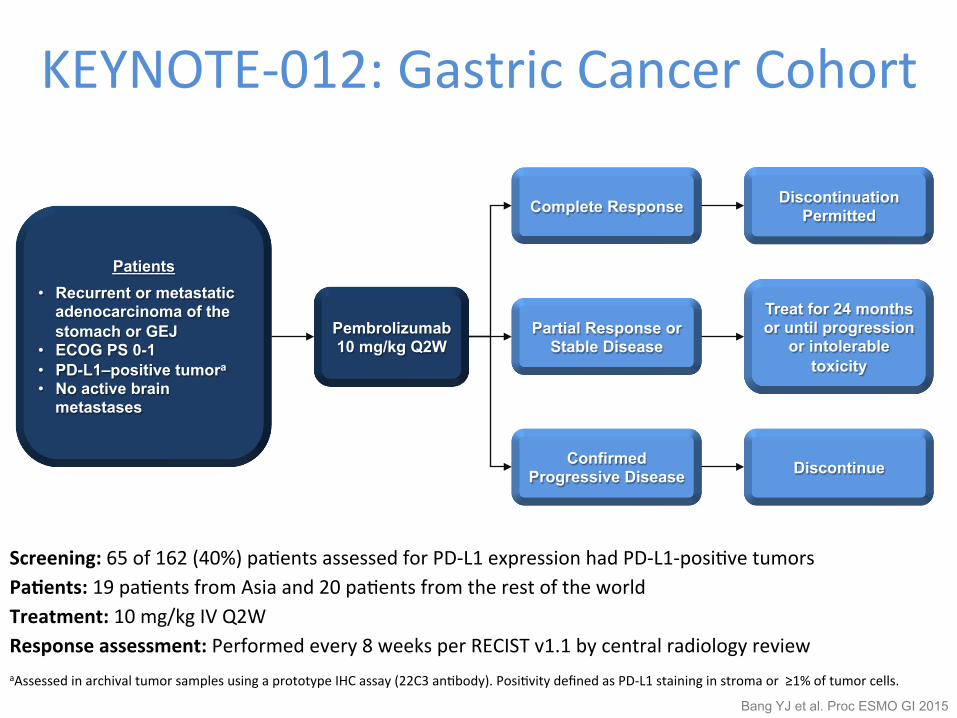
Screening: 65 of 162 (40%) paQents assessed for PD-‐L1 expression had PD-‐L1-‐posiQve tumors Pa1ents: 19 paQents from Asia and 20 paQents from the rest of the world Treatment: 10 mg/kg IV Q2W Response assessment: Performed every 8 weeks per RECIST v1.1 by central radiology review aAssessed in archival tumor samples using a prototype IHC assay (22C3 anQbody). PosiQvity defined as PD-‐L1 staining in stroma or ≥1% of tumor cells.
Patients • Recurrent or metastatic
adenocarcinoma of the stomach or GEJ
• ECOG PS 0-1 • PD-L1–positive tumora
• No active brain metastases
Pembrolizumab 10 mg/kg Q2W
Complete Response
Partial Response or Stable Disease
Confirmed Progressive Disease
Discontinuation Permitted
Treat for 24 months or until progression
or intolerable toxicity
Discontinue
KEYNOTE-‐012: Gastric Cancer Cohort
Bang YJ et al. Proc ESMO GI 2015
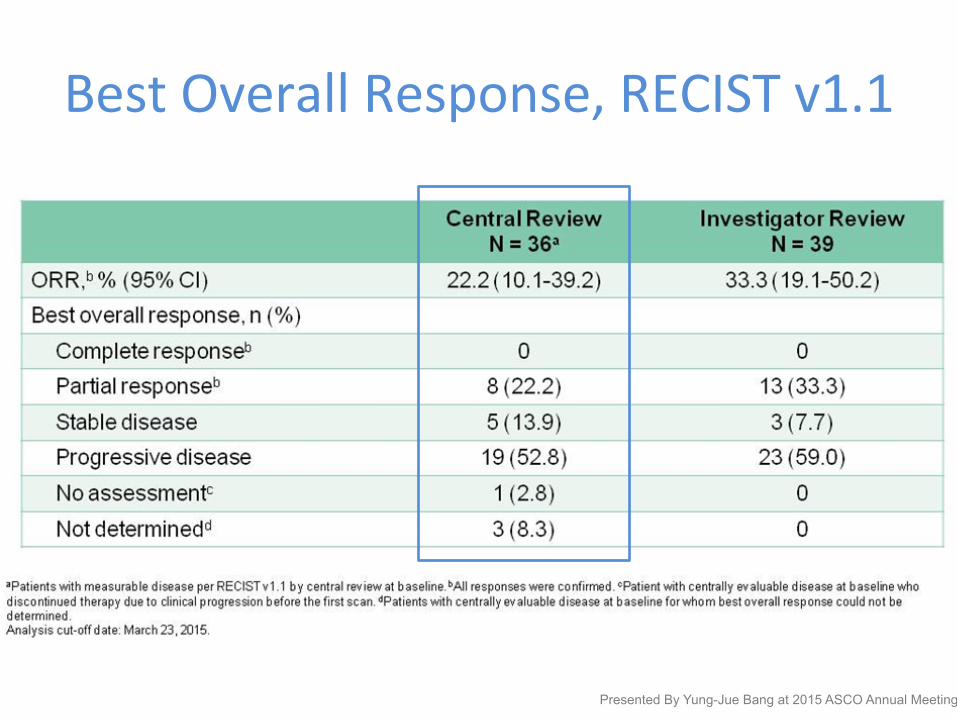
Best Overall Response, RECIST v1.1
Presented By Yung-Jue Bang at 2015 ASCO Annual Meeting
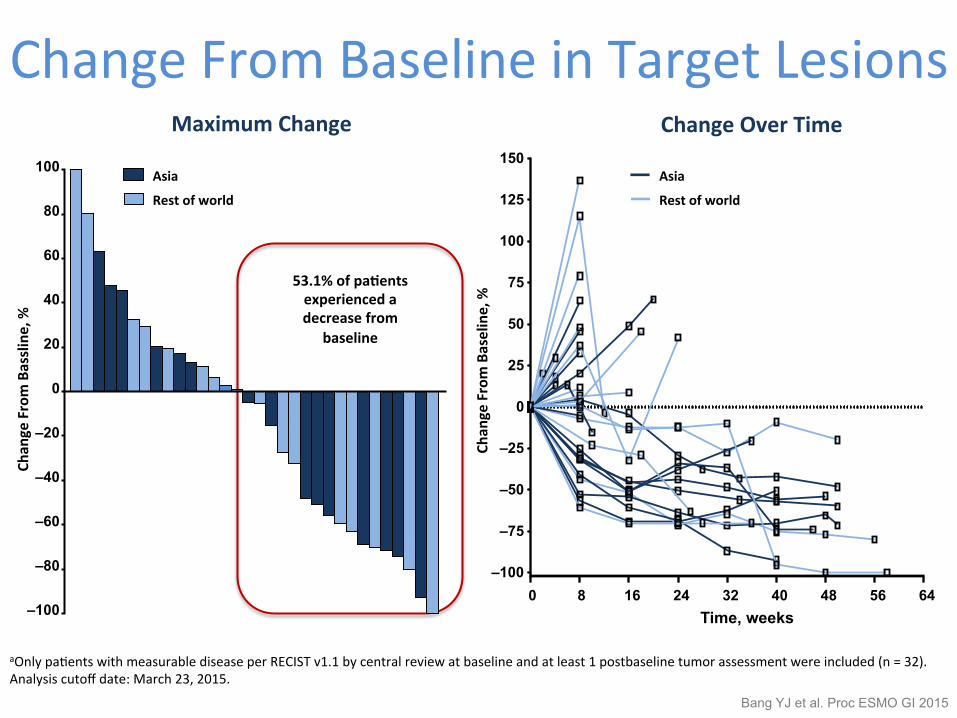
Change From Baseline in Target Lesions
aOnly paQents with measurable disease per RECIST v1.1 by central review at baseline and at least 1 postbaseline tumor assessment were included (n = 32). Analysis cutoff date: March 23, 2015.
53.1% of pa1ents experienced a decrease from
baseline
–100
–80
–60
–40
–20
0
20
40
60
80
100
Chan
ge From Bassline, %
Maximum Change
Asia
Rest of world
Chan
ge From Baseline, %
0 8 16 24 32 40 48 56 64 –100
–75
–50
–25
0
25
50
75
100
125
150
Time, weeks
Change Over Time
Asia
Rest of world
Bang YJ et al. Proc ESMO GI 2015
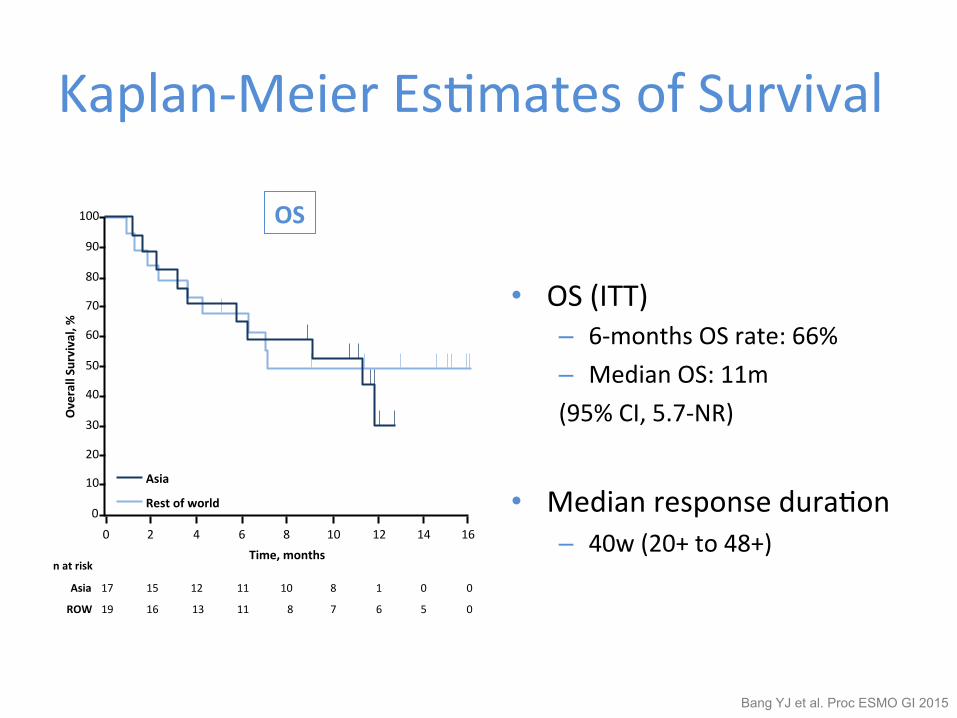
Kaplan-‐Meier EsQmates of Survival
• OS (ITT) – 6-‐months OS rate: 66% – Median OS: 11m (95% CI, 5.7-‐NR)
• Median response duraQon – 40w (20+ to 48+)
Analysis cutoff date: March 23, 2015.
OS
0
10
20
30
40
50
60
70
80
90
100
0 2 4 6 8 10 12 14 16 Time, months
Overall Survival, %
n at risk
17 15 12 11 10 8 1 0 0 Asia
19 16 13 11 8 7 6 5 0 ROW
Asia
Rest of world
Bang YJ et al. Proc ESMO GI 2015
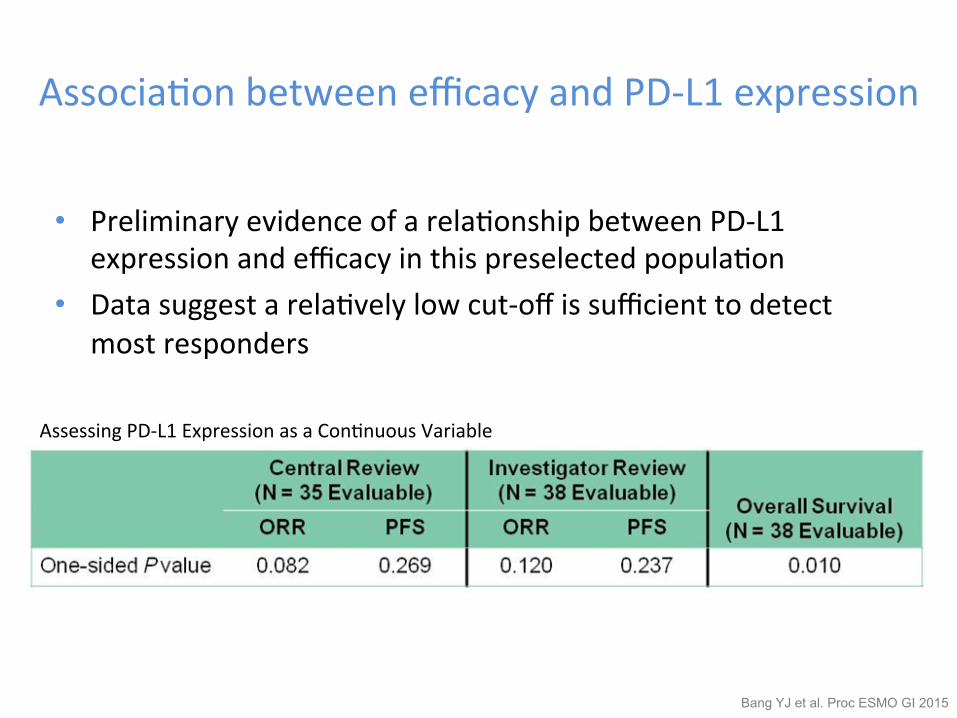
AssociaQon between efficacy and PD-‐L1 expression
• Preliminary evidence of a relaQonship between PD-‐L1 expression and efficacy in this preselected populaQon
• Data suggest a relaQvely low cut-‐off is sufficient to detect most responders
Bang YJ et al. Proc ESMO GI 2015
Assessing PD-‐L1 Expression as a ConQnuous Variable
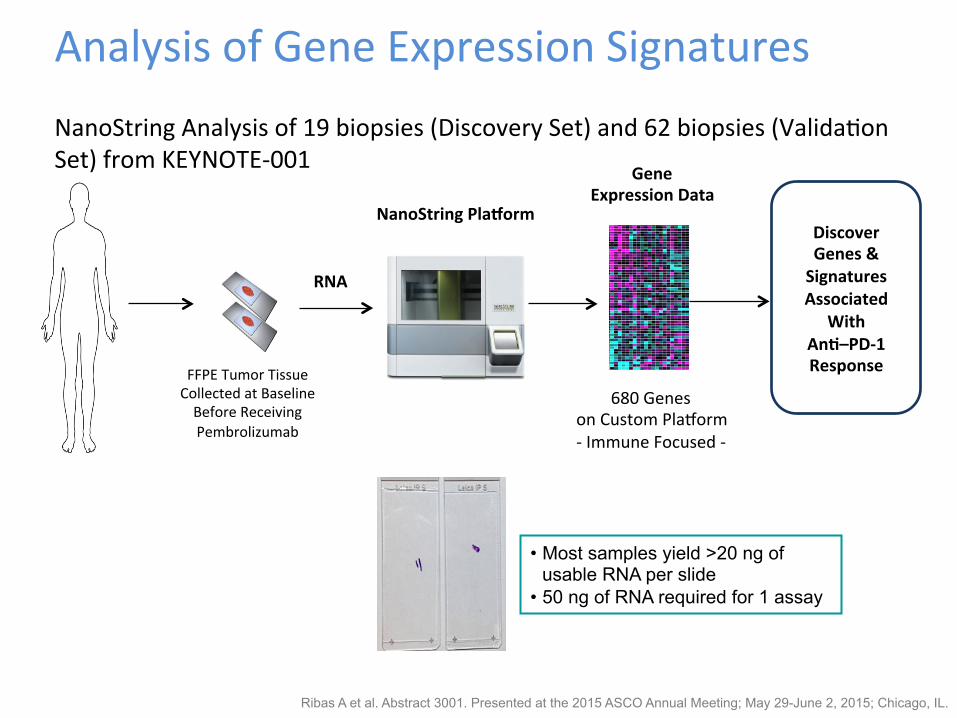
Analysis of Gene Expression Signatures NanoString Analysis of 19 biopsies (Discovery Set) and 62 biopsies (ValidaQon Set) from KEYNOTE-‐001
FFPE Tumor Tissue Collected at Baseline Before Receiving Pembrolizumab
NanoString Placorm
FFPET block or unstained slides (~27 patients)
RNA profiling (baseline assessment)•Affymetrix platforms•Already being performed with Covance
Depending on DNA yield (200 ng per slide?)• Affy SNP 6.0 CNV• Genotyping (Sequenom); should see Kras mutations etc.• To be initiated
MET IHC (baseline assessment)MET amplification status (baseline for only responders)• Already being performed with Ventana
(N=3)
(N=4)
(N=3)
Phase I
Gene Expression Data
680 Genes on Custom Plaqorm -‐ Immune Focused -‐
RNA
Discover Genes & Signatures Associated
With An1–PD-‐1 Response
• Most samples yield >20 ng of usable RNA per slide
• 50 ng of RNA required for 1 assay
Ribas A et al. Abstract 3001. Presented at the 2015 ASCO Annual Meeting; May 29-June 2, 2015; Chicago, IL.
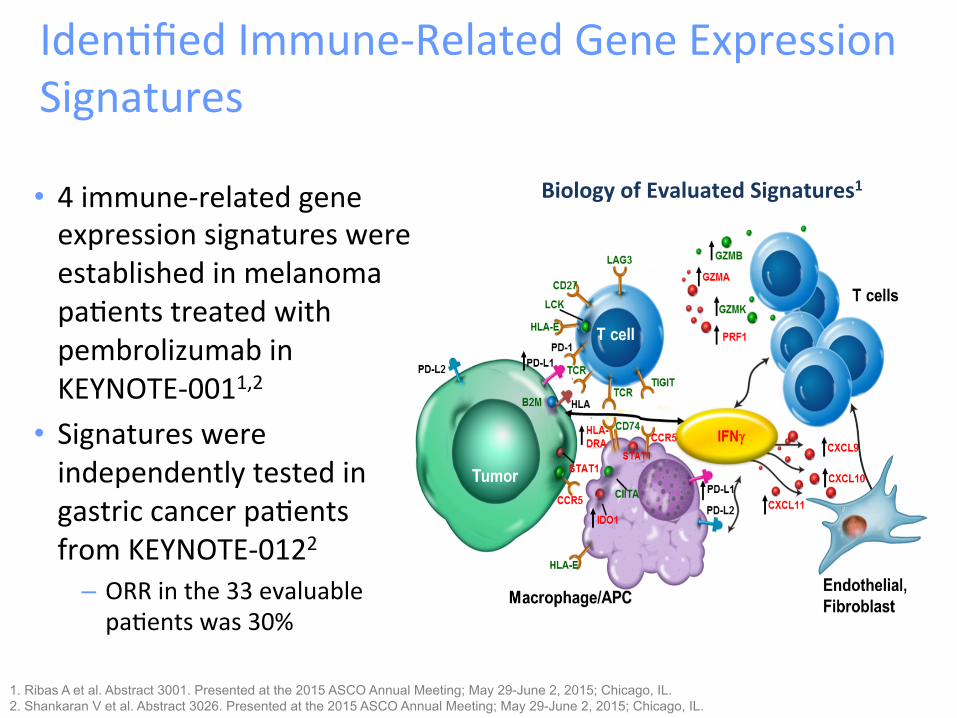
IdenQfied Immune-‐Related Gene Expression Signatures
• 4 immune-‐related gene expression signatures were established in melanoma paQents treated with pembrolizumab in KEYNOTE-‐0011,2
• Signatures were independently tested in gastric cancer paQents from KEYNOTE-‐0122
– ORR in the 33 evaluable paQents was 30%
1. Ribas A et al. Abstract 3001. Presented at the 2015 ASCO Annual Meeting; May 29-June 2, 2015; Chicago, IL. 2. Shankaran V et al. Abstract 3026. Presented at the 2015 ASCO Annual Meeting; May 29-June 2, 2015; Chicago, IL.
Biology of Evaluated Signatures1
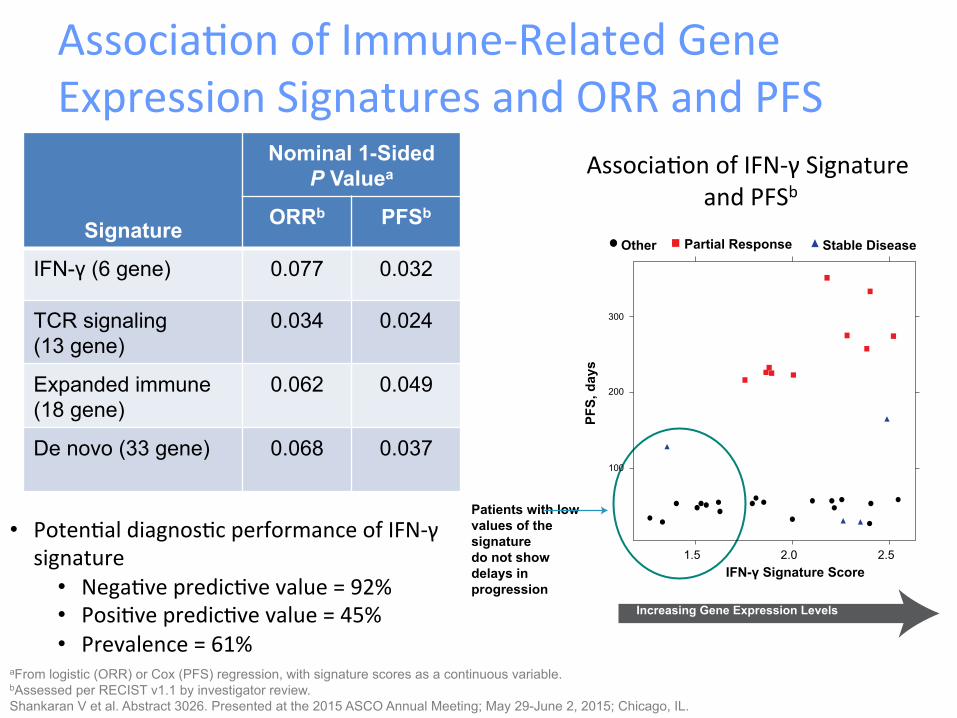
AssociaQon of Immune-‐Related Gene Expression Signatures and ORR and PFS
Signature
Nominal 1-Sided P Valuea
ORRb PFSb
IFN-γ (6 gene) 0.077 0.032
TCR signaling (13 gene)
0.034 0.024
Expanded immune (18 gene)
0.062 0.049
De novo (33 gene) 0.068 0.037
aFrom logistic (ORR) or Cox (PFS) regression, with signature scores as a continuous variable. bAssessed per RECIST v1.1 by investigator review. Shankaran V et al. Abstract 3026. Presented at the 2015 ASCO Annual Meeting; May 29-June 2, 2015; Chicago, IL.
• PotenQal diagnosQc performance of IFN-‐γ signature
• NegaQve predicQve value = 92% • PosiQve predicQve value = 45% • Prevalence = 61%
AssociaQon of IFN-‐γ Signature and PFSb
Patients with low values of the signature do not show delays in progression
PFS,
day
s Increasing Gene Expression Levels
IFN-γ Signature Score
Other Partial Response Stable Disease
1.5 2.0 2.5
100
200
300
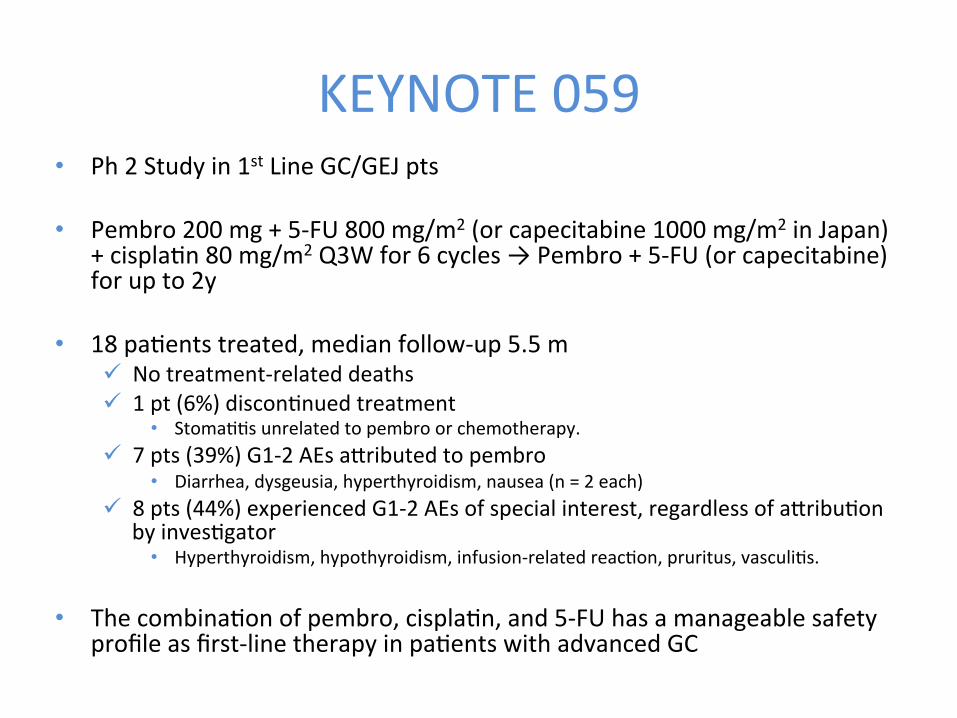
KEYNOTE 059 • Ph 2 Study in 1st Line GC/GEJ pts
• Pembro 200 mg + 5-‐FU 800 mg/m2 (or capecitabine 1000 mg/m2 in Japan) + cisplaQn 80 mg/m2 Q3W for 6 cycles → Pembro + 5-‐FU (or capecitabine) for up to 2y
• 18 paQents treated, median follow-‐up 5.5 m ü No treatment-‐related deaths ü 1 pt (6%) disconQnued treatment
• StomaQQs unrelated to pembro or chemotherapy. ü 7 pts (39%) G1-‐2 AEs aKributed to pembro
• Diarrhea, dysgeusia, hyperthyroidism, nausea (n = 2 each) ü 8 pts (44%) experienced G1-‐2 AEs of special interest, regardless of aKribuQon
by invesQgator • Hyperthyroidism, hypothyroidism, infusion-‐related reacQon, pruritus, vasculiQs.
• The combinaQon of pembro, cisplaQn, and 5-‐FU has a manageable safety profile as first-‐line therapy in paQents with advanced GC
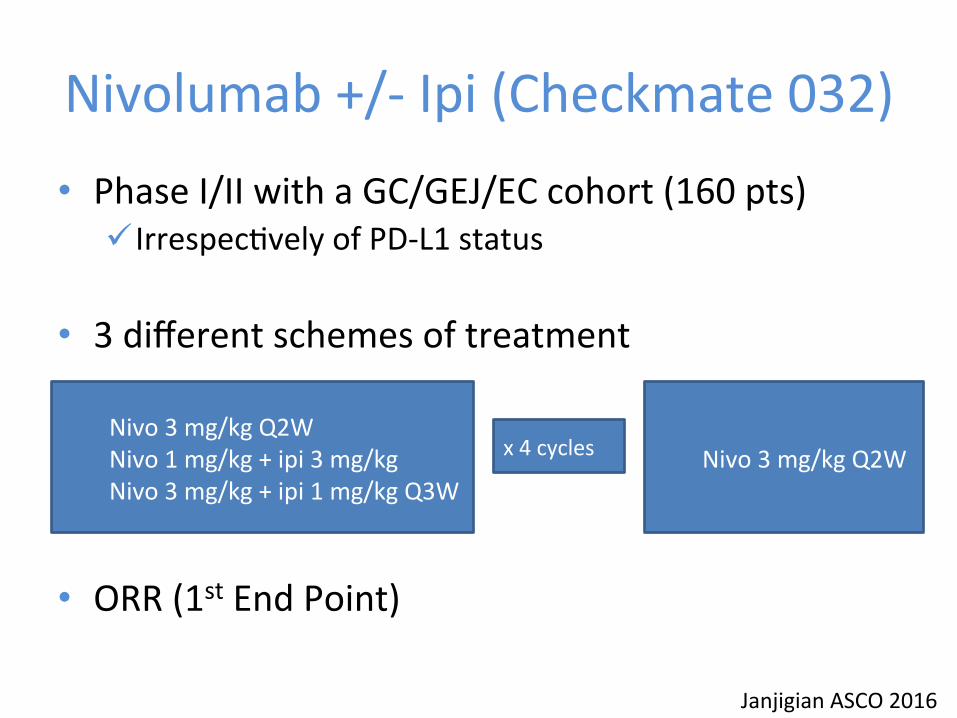
Nivolumab +/-‐ Ipi (Checkmate 032) • Phase I/II with a GC/GEJ/EC cohort (160 pts)
ü IrrespecQvely of PD-‐L1 status
• 3 different schemes of treatment
• ORR (1st End Point)
Janjigian ASCO 2016
Nivo 3 mg/kg Q2W Nivo 1 mg/kg + ipi 3 mg/kg Nivo 3 mg/kg + ipi 1 mg/kg Q3W
x 4 cycles Nivo 3 mg/kg Q2W
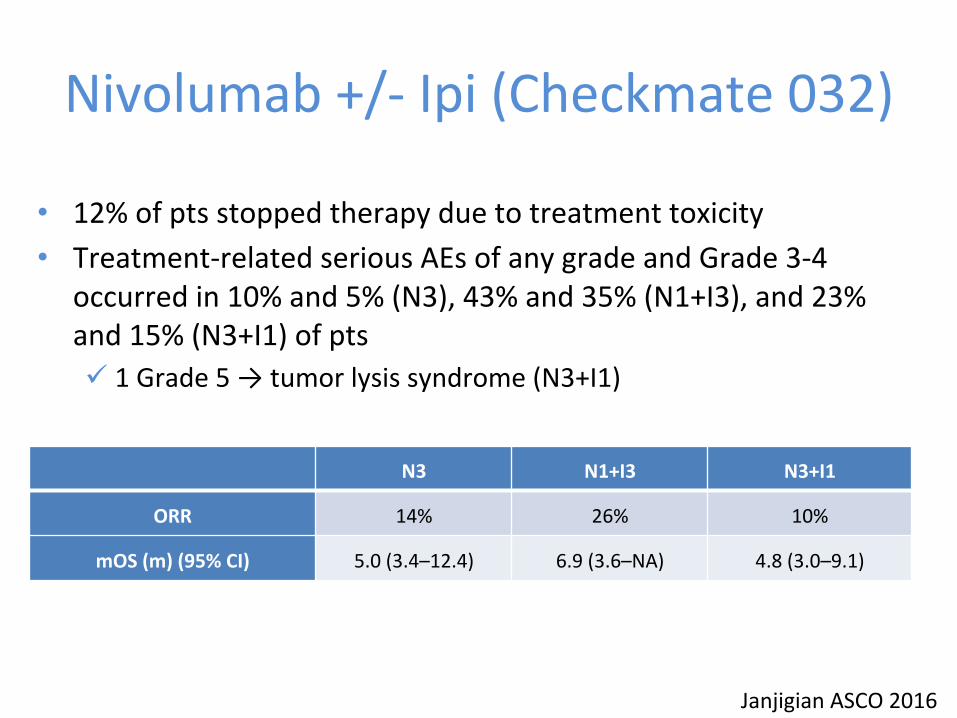
Nivolumab +/-‐ Ipi (Checkmate 032)
Janjigian ASCO 2016
N3 N1+I3 N3+I1
ORR 14% 26% 10%
mOS (m) (95% CI) 5.0 (3.4–12.4) 6.9 (3.6–NA) 4.8 (3.0–9.1)
• 12% of pts stopped therapy due to treatment toxicity • Treatment-‐related serious AEs of any grade and Grade 3-‐4
occurred in 10% and 5% (N3), 43% and 35% (N1+I3), and 23% and 15% (N3+I1) of pts ü 1 Grade 5 → tumor lysis syndrome (N3+I1)
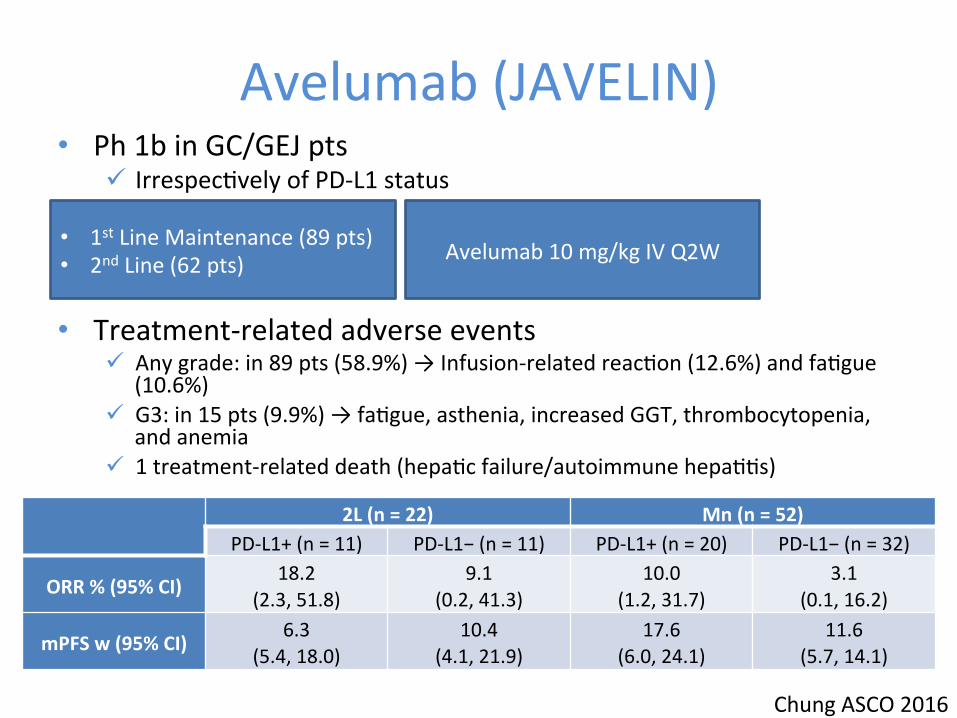
Avelumab (JAVELIN) • Ph 1b in GC/GEJ pts
ü IrrespecQvely of PD-‐L1 status
• Treatment-‐related adverse events
ü Any grade: in 89 pts (58.9%) → Infusion-‐related reacQon (12.6%) and faQgue (10.6%)
ü G3: in 15 pts (9.9%) → faQgue, asthenia, increased GGT, thrombocytopenia, and anemia
ü 1 treatment-‐related death (hepaQc failure/autoimmune hepaQQs)
Chung ASCO 2016
2L (n = 22) Mn (n = 52) PD-‐L1+ (n = 11) PD-‐L1− (n = 11) PD-‐L1+ (n = 20) PD-‐L1− (n = 32)
ORR % (95% CI) 18.2
(2.3, 51.8) 9.1
(0.2, 41.3) 10.0
(1.2, 31.7) 3.1
(0.1, 16.2)
mPFS w (95% CI) 6.3
(5.4, 18.0) 10.4
(4.1, 21.9) 17.6
(6.0, 24.1) 11.6
(5.7, 14.1)
• 1st Line Maintenance (89 pts) • 2nd Line (62 pts) Avelumab 10 mg/kg IV Q2W
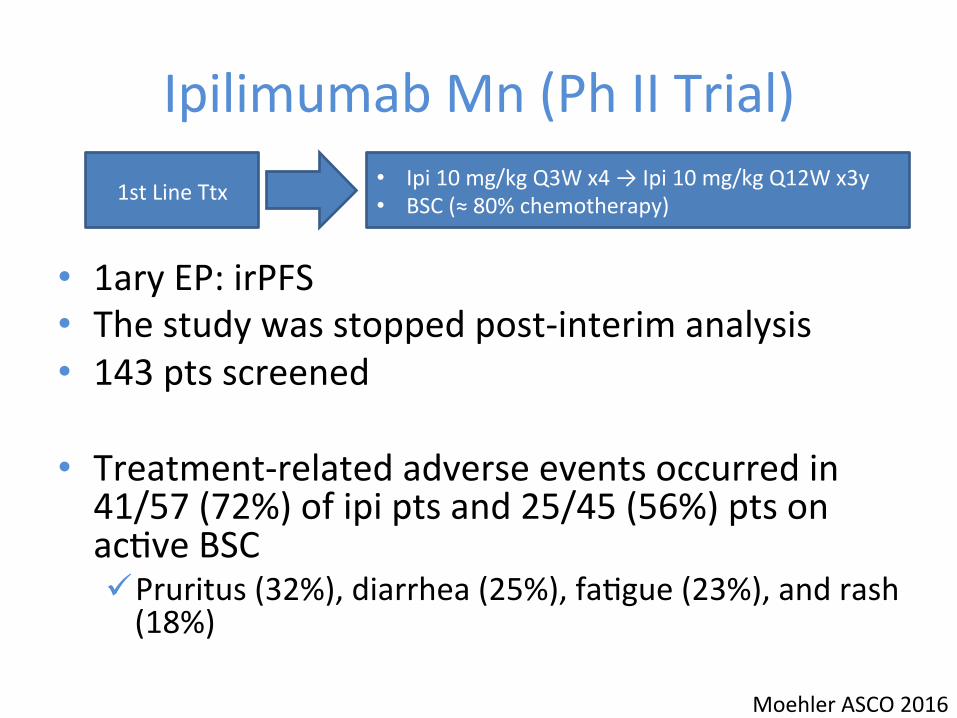
Ipilimumab Mn (Ph II Trial)
• 1ary EP: irPFS • The study was stopped post-‐interim analysis • 143 pts screened
• Treatment-‐related adverse events occurred in 41/57 (72%) of ipi pts and 25/45 (56%) pts on acQve BSC ü Pruritus (32%), diarrhea (25%), faQgue (23%), and rash (18%)
Moehler ASCO 2016
1st Line Ttx • Ipi 10 mg/kg Q3W x4 → Ipi 10 mg/kg Q12W x3y • BSC (≈ 80% chemotherapy)

Ipilimumab Mn (Ph II Trial) • irPFS similar between arms (HR=1.44, p=0.097) • median OS for both arms ≈ 1 yr
Moehler ASCO 2016
Median irPFS (95% CI) ü Ipi 2.92 (1.6 – 5.2) ü BSC 4.9 (3.5-‐6.5)
Early progressors lost
When the immune system reacts, it reacts well, potenQally even in re-‐introducQon or 2nd L

Ongoing Phase III Clinical Trials Line Study N Treatment Arms 1ary EP
1st Line KEYNOTE-‐062 NCT02494583 (TPS 4138)
750
Pembrolizumab 200mg Q3W vs Pembro + CisplaQno + 5-‐FU/CPC vs Placebo + CisplaQno + 5-‐FU/CPC
OS PFS (RECIST 1.1)
CG & CUGE PS 0-‐1 PD-‐L1+/HER2-‐ StraQficaQon: Europe/North America/Australia vs Asia vs ROW RECIST 1.1 & irRECIST
Mn
JAVELIN Gastric 100 NCT02625610 (TPS 4134)
466
FOLFOX/XELOX x12 semanas, luego: Avelumab 10mg/kg Q2W vs ConQnuar FOLFOX/XELOX
OS PFS
CG & CUGE PS 0-‐1 PD-‐L1+ Exclusion HER2+ RECIST 1.1
2nd Line KEYNOTE-‐061 NCT02370498 (TPS 4137)
720 Pembrolizumab 200mg Q3W vs Paclitaxel
PFS (RECIST 1.1) & OS en PD-‐L1+
CG & CUGE PS 0-‐1 No molecular selecQon RECIST 1.1 & irRECIST
3rd Line
JAVELIN Gastric 300 NCT02625623 (TPS4135)
330 Avelumab 10mg/kg Q2W + BSC vs Paclitaxel/Irinotencan/BSC
OS
CG & CUGE PS 0-‐1 No molecular selecQon StraQficaQon: Asia vs non Asia Exclusion of previous immunother RECIST 1.1

Ongoing Phase I/II Clinical Tria
ls ID Ph Strategy Indication Status
NCT02443324 I Pembrolizumab plus Ramucirumab Specific cohort, 2nd or 3rd Line Recruiting
NCT02335411 (KEYNOTE 059) II Pembrolizumab in monotherapy or in combination
with CT Different lines, HER2-neg Recruiting
NCT02563548 I Pembrolizumab plus PEGPH20 Specific cohort, at least 2nd Line Recruiting
NCT01848834 (KEYNOTE 012) I Pembrolizumab Specific cohort, refractory
setting Active, not recruiting
NCT02452424 I Pembrolizumab plus PLX3397 Specific cohort, refractory setting Recruiting
NCT02318901 I/II Pembrolizumab plus trastuzumab Specific cohort, HER2-positive Recruiting
NCT02268825 I/II Pembrolizumab plus FOLFOX Specific cohort Recruiting
NCT02340975 II Tremelimumab and/or durvalumab Refractory setting Recruiting
NCT01585987 II Ipilimumab vs FU/BSC Manteinance after 1st Line Completed
NCT01928394 I/II Nivolumab +/- ipilimumab Specific cohort, refractory setting Recruiting
NCT02267343 I Nivolumab Refractory setting Recruiting
NCT02488759 I/II Nivolumab EBV-positive Recruiting
NCT01772004 I Avelumab Specific cohort, 3rd Line Recruiting
NCT01943461 I Avelumab 2nd and 3rd Line, Japanesse and Asian Recruiting
NCT01633970 I Atezolizumab montherapy or in combination with bevacizumab or CT Basket Recruiting
NCT01375842 I Atezolizumab Basket Recruiting
NCT02471846 I Atezolizumab and GDC-0919 Specific cohort, refractory setting Recruiting
Outline • The Immune System • Immunotherapy in GI Tumors
– Gastric Cancer – Colorectal Cancer
• Challenges – PaKerns of response & AEs
• Conclusions
• Pembrolizumab • Nivolumab + Ipilimumab • CobimeQnib + Atezolizumab
• Immunoscore
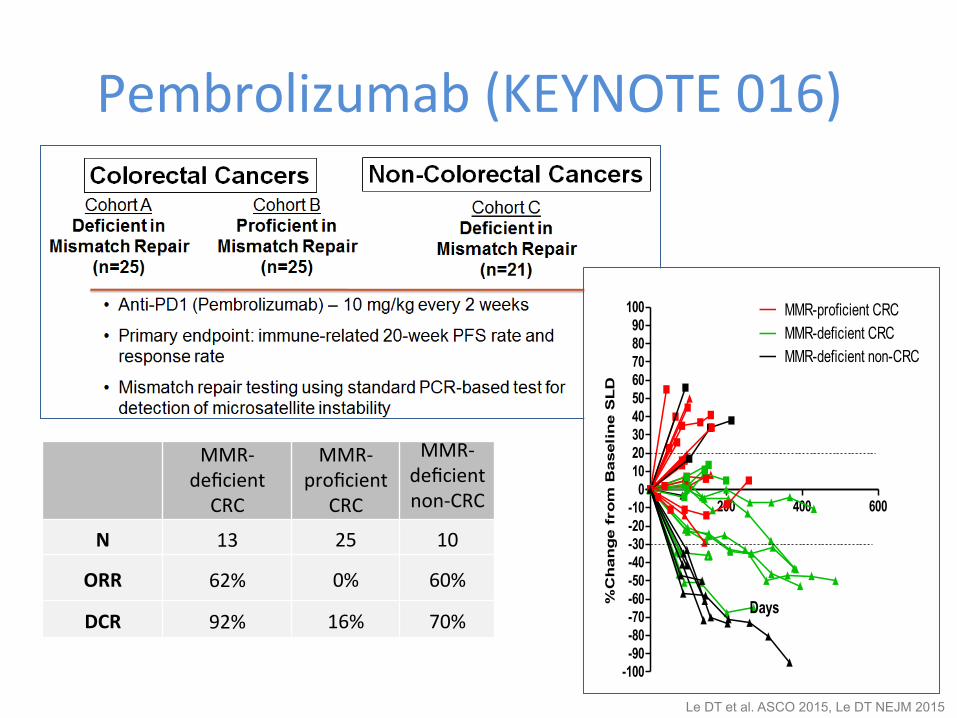
Pembrolizumab (KEYNOTE 016)
Le DT et al. ASCO 2015, Le DT NEJM 2015
MMR-‐deficient CRC
MMR-‐proficient
CRC
MMR-‐deficient non-‐CRC
N 13 25 10
ORR 62% 0% 60%
DCR 92% 16% 70%
200 400 600
-100-90-80-70-60-50-40-30-20-10
0102030405060708090
100 MMR-proficient CRCMMR-deficient CRCMMR-deficient non-CRC
Days%C
han
ge f
rom
Baseli
ne S
LD
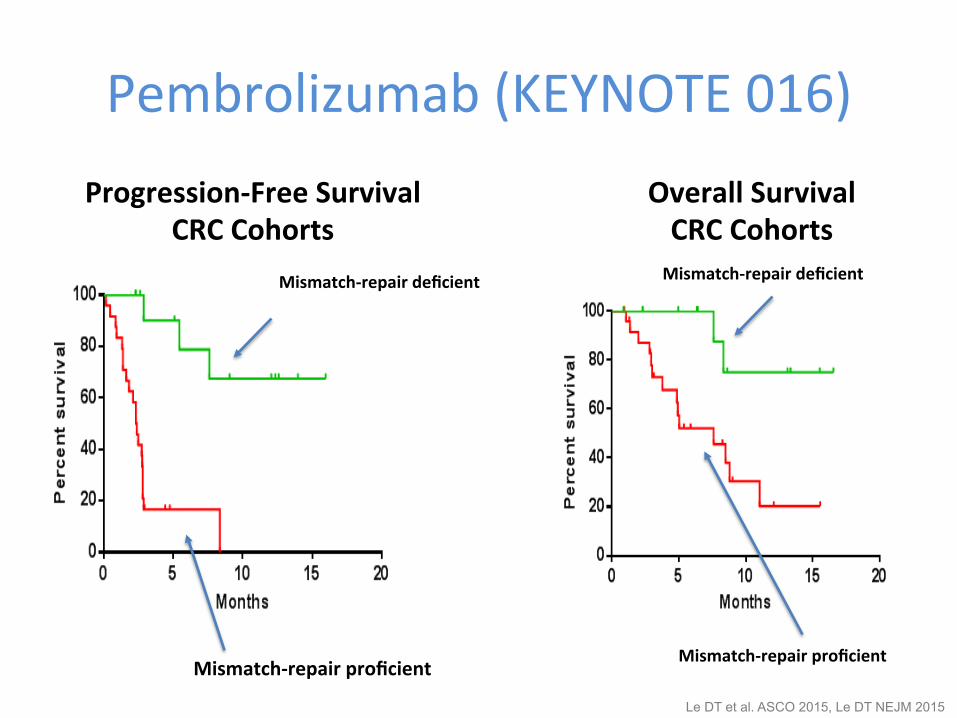
Pembrolizumab (KEYNOTE 016) Progression-‐Free Survival
CRC Cohorts
Mismatch-‐repair proficient
Mismatch-‐repair deficient
Mismatch-‐repair proficient
Mismatch-‐repair deficient
Overall Survival CRC Cohorts
Le DT et al. ASCO 2015, Le DT NEJM 2015
MMR-deficient MMR-proficient
0
500
1000
1500
Den
sity
of
intr
atu
mo
ral
CD
8+ T
cel
ls
MMR-deficient MMR-proficient
0
500
1000
1500
Den
sity
of
inva
sive
fro
nt
CD
8+ T
cel
ls
MMR-deficient MMR-proficient
0
20
40
60
80
100
PD
-L1
+ T
ILS
(%
)
MMR-deficient MMR-proficient
0
20
40
60
80
100
Inva
sive
fro
nt
PD
-L1
+ c
ells
(%
)
MMR-deficient MMR-proficient
0
20
40
60
80
100
PD
-L1
+ T
um
or
Cel
ls (
%)
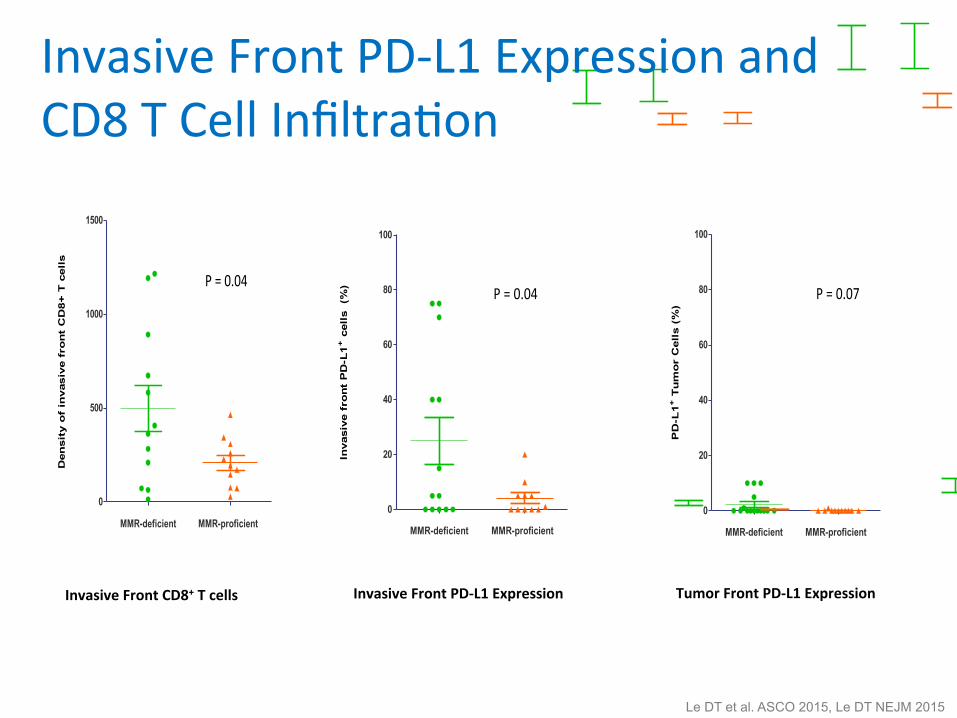
P = 0.07P = 0.04
P = 0.10 P = 0.04
P = 0.22
MMR-deficient MMR-proficient
0
500
1000
1500
Den
sity
of
intr
atu
mo
ral
CD
8+ T
cel
ls
MMR-deficient MMR-proficient
0
500
1000
1500
Den
sity
of
inva
sive
fro
nt
CD
8+ T
cel
ls
MMR-deficient MMR-proficient
0
20
40
60
80
100
PD
-L1+
TIL
S (
%)
MMR-deficient MMR-proficient
0
20
40
60
80
100
Inva
sive
fro
nt
PD
-L1
+ c
ells
(%
)
MMR-deficient MMR-proficient
0
20
40
60
80
100
PD
-L1+
Tu
mo
r C
ells
(%
)
P = 0.07P = 0.04
P = 0.10 P = 0.04
P = 0.22
MMR-deficient MMR-proficient
0
500
1000
1500
Den
sit
y o
f in
tratu
mo
ral
CD
8+ T
cell
s
MMR-deficient MMR-proficient
0
500
1000
1500
Den
sit
y o
f in
vas
ive f
ron
t C
D8+
T c
ell
s
MMR-deficient MMR-proficient
0
20
40
60
80
100
PD
-L1
+ T
ILS
(%
)
MMR-deficient MMR-proficient
0
20
40
60
80
100
Invasiv
e f
ron
t P
D-L
1+ c
ell
s
(%)
MMR-deficient MMR-proficient
0
20
40
60
80
100
PD
-L1
+ T
um
or
Cell
s (
%)
P = 0.07P = 0.04
P = 0.10 P = 0.04
P = 0.22
Invasive Front PD-‐L1 Expression and CD8 T Cell InfiltraQon
Invasive Front CD8+ T cells Invasive Front PD-‐L1 Expression Tumor Front PD-‐L1 Expression
Le DT et al. ASCO 2015, Le DT NEJM 2015
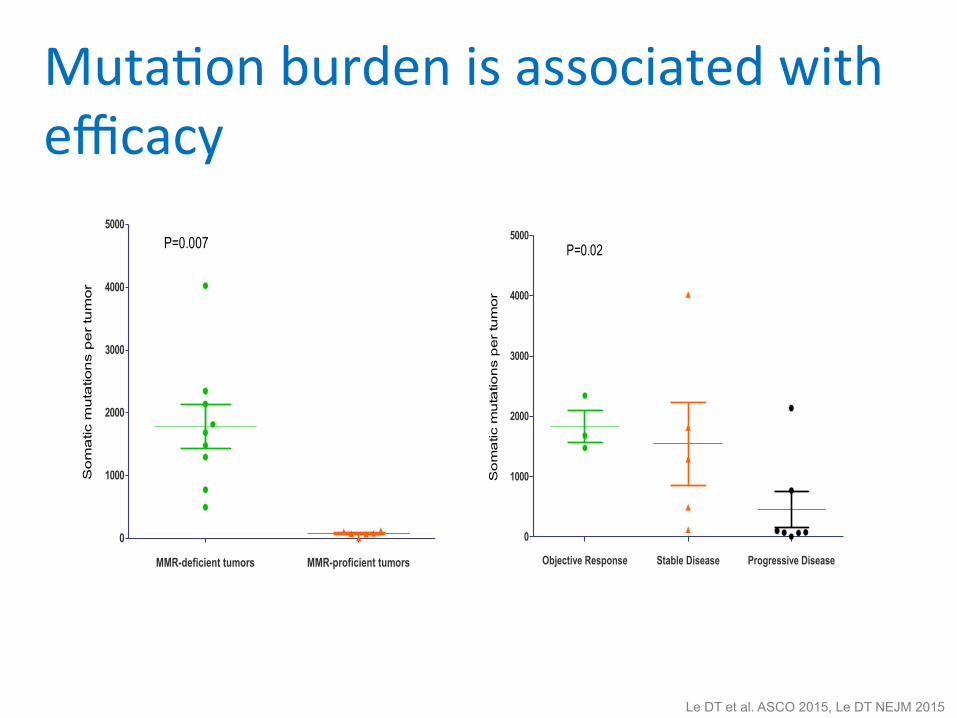
MMR-deficient tumors MMR-proficient tumors
0
1000
2000
3000
4000
5000P=0.007
Som
atic
muta
tions p
er
tum
or
Objective Response Stable Disease Progressive Disease
0
1000
2000
3000
4000
5000P=0.02
Som
atic
muta
tions p
er tu
mor
MutaQon burden is associated with efficacy
Le DT et al. ASCO 2015, Le DT NEJM 2015
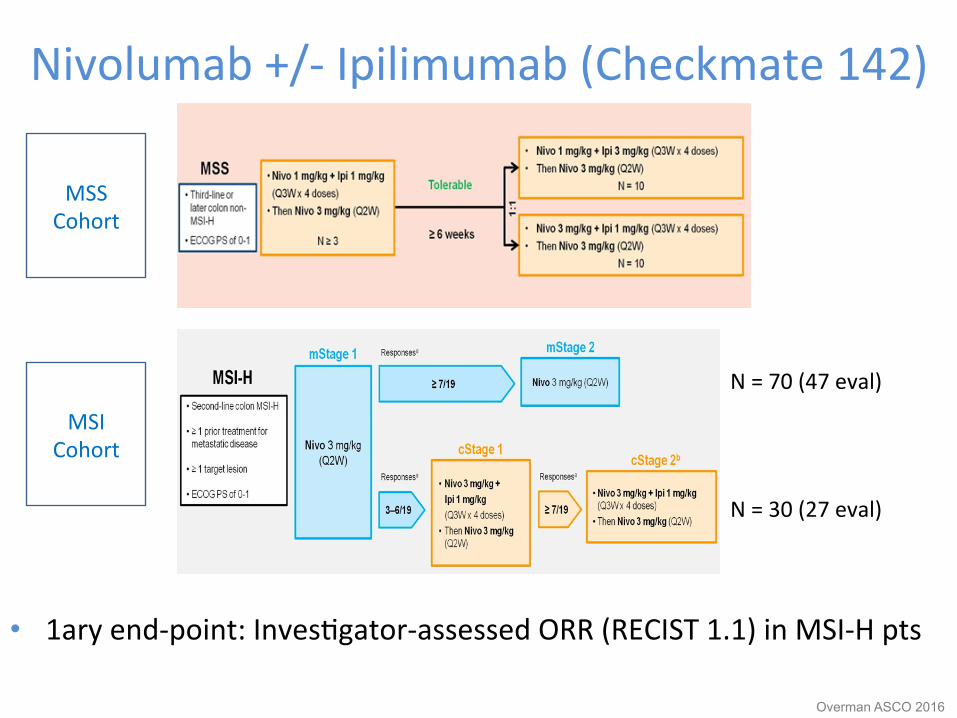
Nivolumab +/-‐ Ipilimumab (Checkmate 142)
• 1ary end-‐point: InvesQgator-‐assessed ORR (RECIST 1.1) in MSI-‐H pts
Overman ASCO 2016
MSS Cohort
MSI Cohort
N = 70 (47 eval)
N = 30 (27 eval)
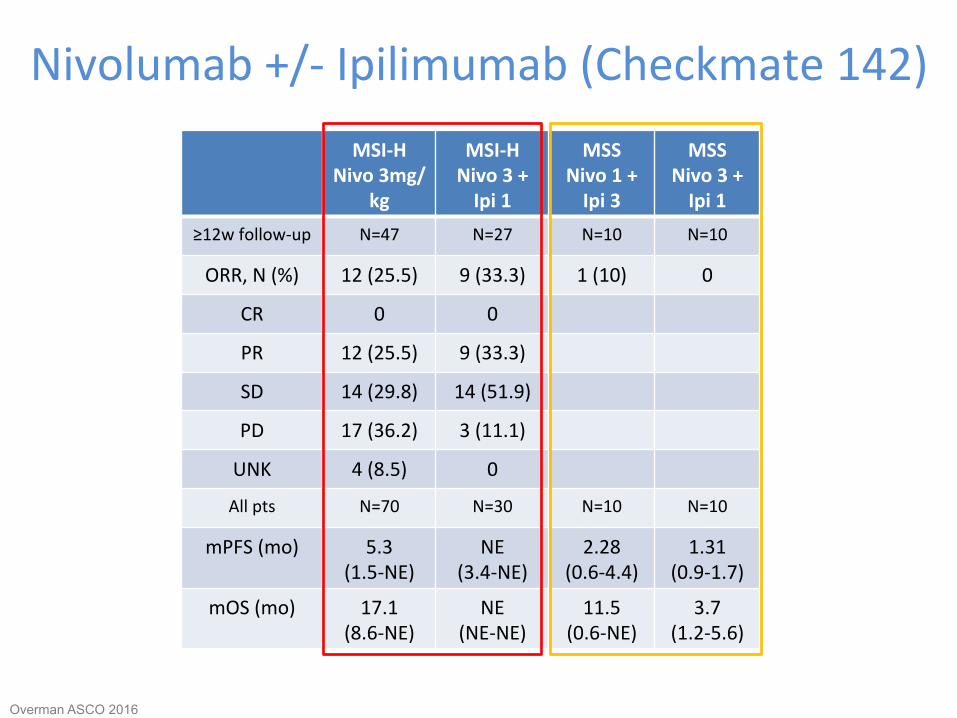
Nivolumab +/-‐ Ipilimumab (Checkmate 142) MSI-‐H
Nivo 3mg/kg
MSI-‐H Nivo 3 + Ipi 1
MSS Nivo 1 + Ipi 3
MSS Nivo 3 + Ipi 1
≥12w follow-‐up N=47 N=27 N=10 N=10
ORR, N (%) 12 (25.5) 9 (33.3) 1 (10) 0
CR 0 0
PR 12 (25.5) 9 (33.3)
SD 14 (29.8) 14 (51.9)
PD 17 (36.2) 3 (11.1)
UNK 4 (8.5) 0
All pts N=70 N=30 N=10 N=10
mPFS (mo) 5.3 (1.5-‐NE)
NE (3.4-‐NE)
2.28 (0.6-‐4.4)
1.31 (0.9-‐1.7)
mOS (mo) 17.1 (8.6-‐NE)
NE (NE-‐NE)
11.5 (0.6-‐NE)
3.7 (1.2-‐5.6)
Overman ASCO 2016

Response in paQents with MSI-‐H
Overman ASCO 2016
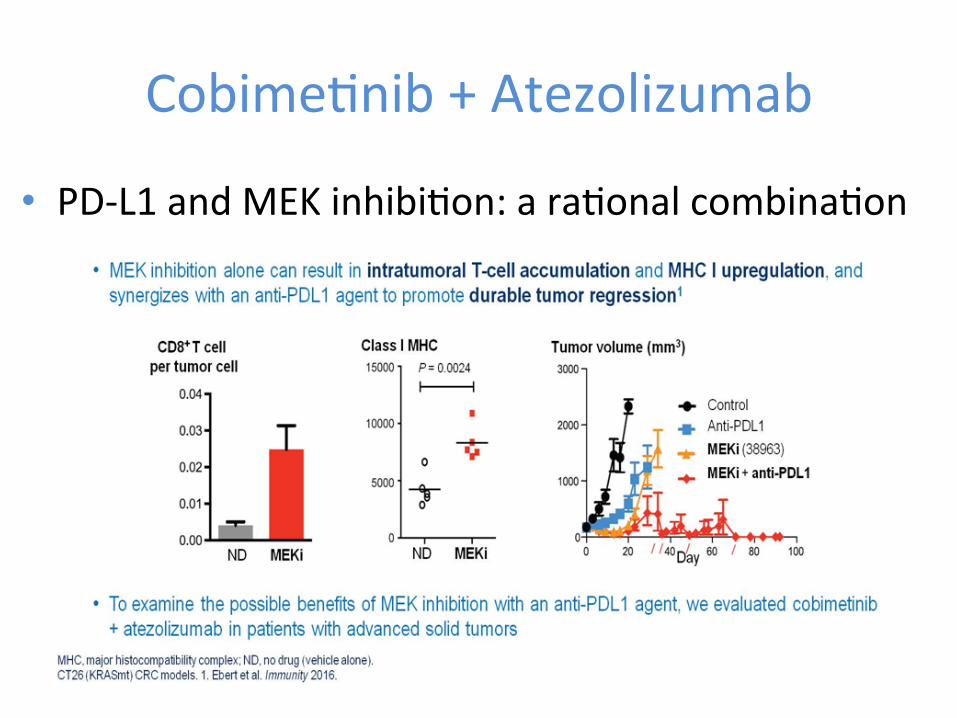
CobimeQnib + Atezolizumab
• PD-‐L1 and MEK inhibiQon: a raQonal combinaQon
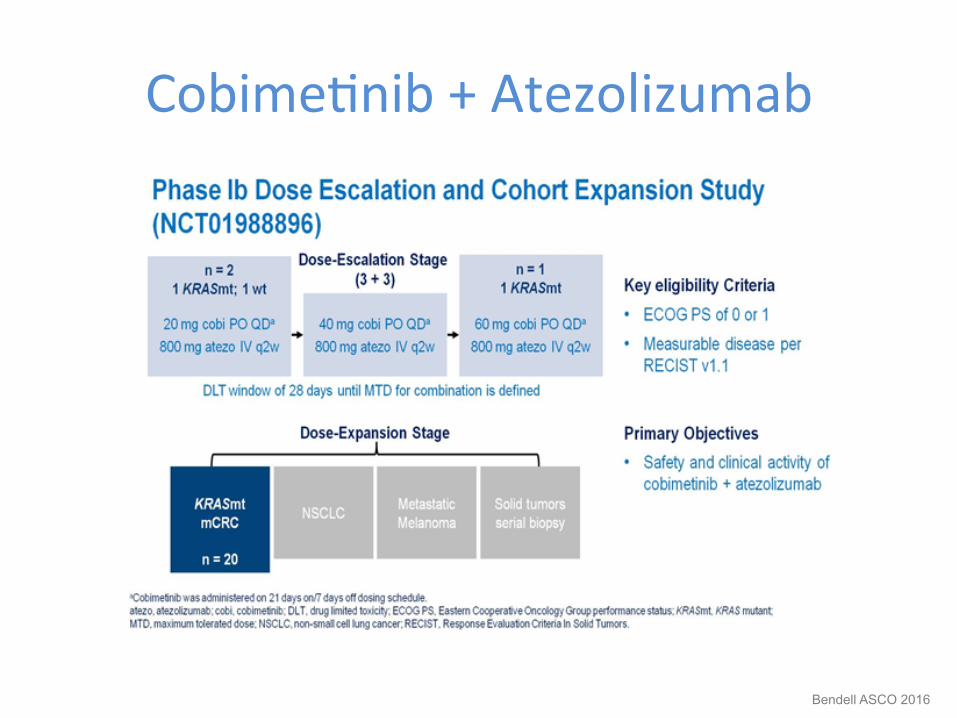
CobimeQnib + Atezolizumab
Bendell ASCO 2016
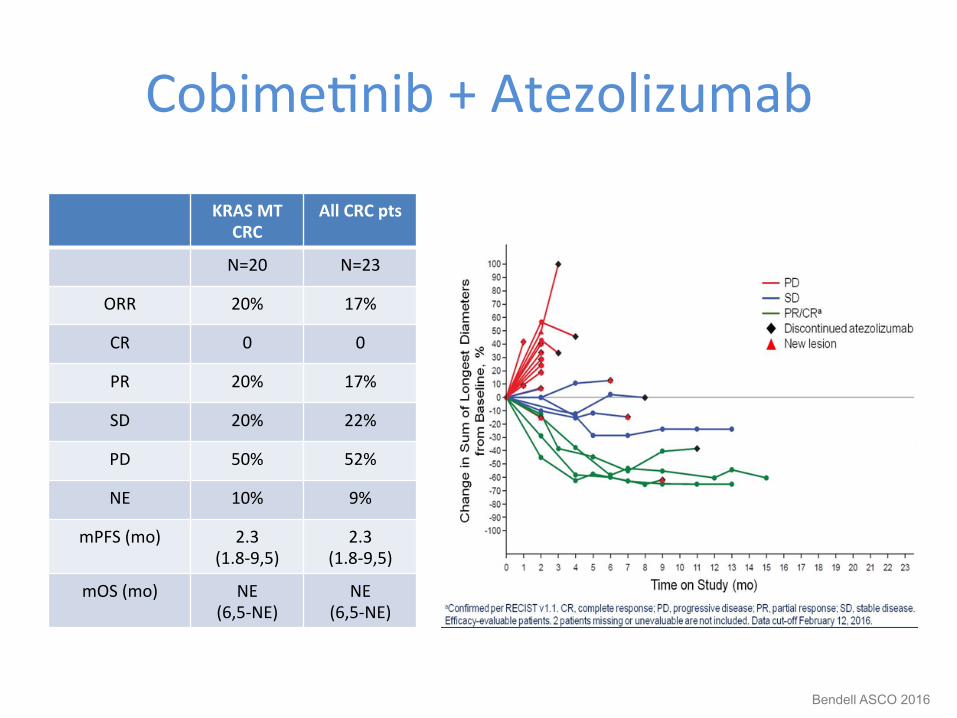
CobimeQnib + Atezolizumab
KRAS MT CRC
All CRC pts
N=20 N=23
ORR 20% 17%
CR 0 0
PR 20% 17%
SD 20% 22%
PD 50% 52%
NE 10% 9%
mPFS (mo) 2.3 (1.8-‐9,5)
2.3 (1.8-‐9,5)
mOS (mo) NE (6,5-‐NE)
NE (6,5-‐NE)
Bendell ASCO 2016
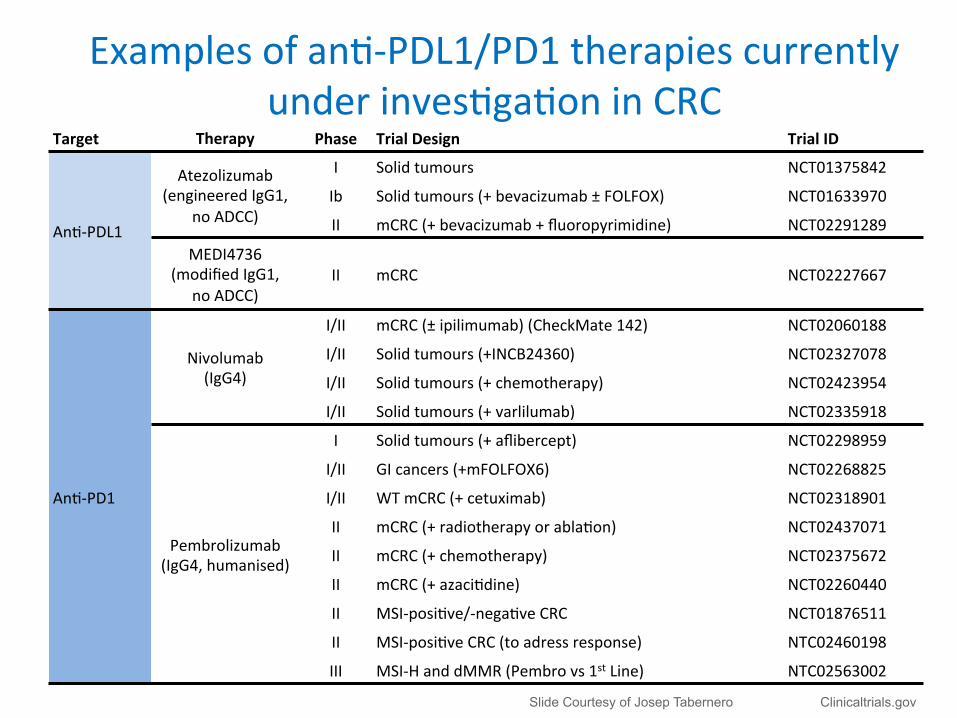
Target Therapy Phase Trial Design Trial ID
AnQ-‐PDL1
Atezolizumab (engineered IgG1,
no ADCC)
I Solid tumours NCT01375842
Ib Solid tumours (+ bevacizumab ± FOLFOX) NCT01633970
II mCRC (+ bevacizumab + fluoropyrimidine) NCT02291289
MEDI4736 (modified IgG1,
no ADCC) II mCRC NCT02227667
AnQ-‐PD1
Nivolumab (IgG4)
I/II mCRC (± ipilimumab) (CheckMate 142) NCT02060188
I/II Solid tumours (+INCB24360) NCT02327078
I/II Solid tumours (+ chemotherapy) NCT02423954
I/II Solid tumours (+ varlilumab) NCT02335918
Pembrolizumab (IgG4, humanised)
I Solid tumours (+ aflibercept) NCT02298959
I/II GI cancers (+mFOLFOX6) NCT02268825
I/II WT mCRC (+ cetuximab) NCT02318901
II mCRC (+ radiotherapy or ablaQon) NCT02437071
II mCRC (+ chemotherapy) NCT02375672
II mCRC (+ azaciQdine) NCT02260440
II MSI-‐posiQve/-‐negaQve CRC NCT01876511
II MSI-‐posiQve CRC (to adress response) NTC02460198
III MSI-‐H and dMMR (Pembro vs 1st Line) NTC02563002
Examples of anQ-‐PDL1/PD1 therapies currently under invesQgaQon in CRC
Clinicaltrials.gov
Slide Courtesy of Josep Tabernero Clinicaltrials.gov
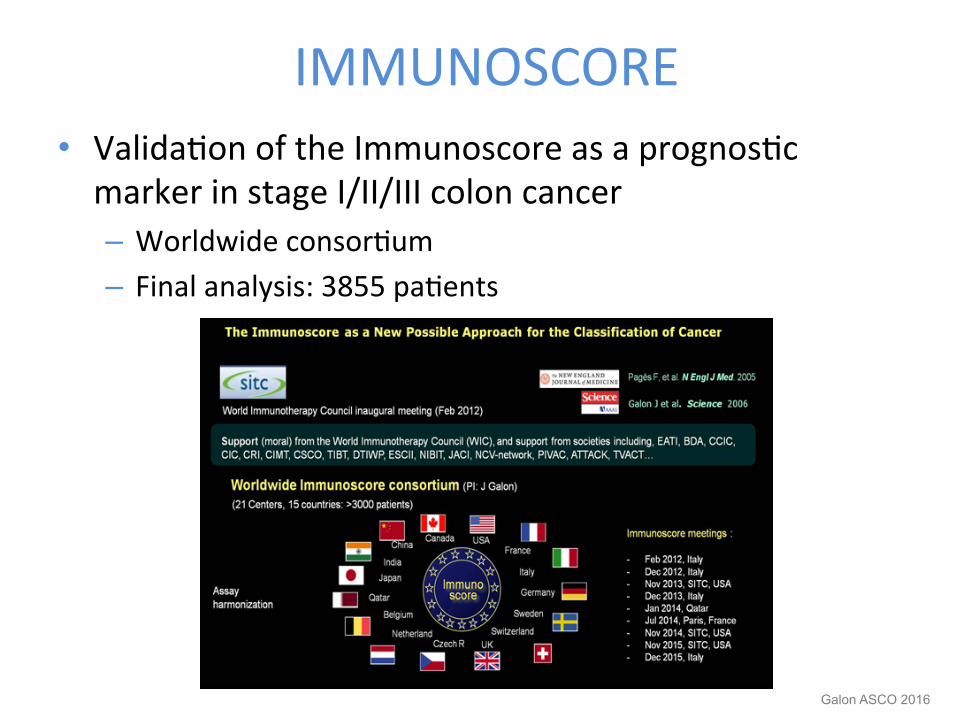
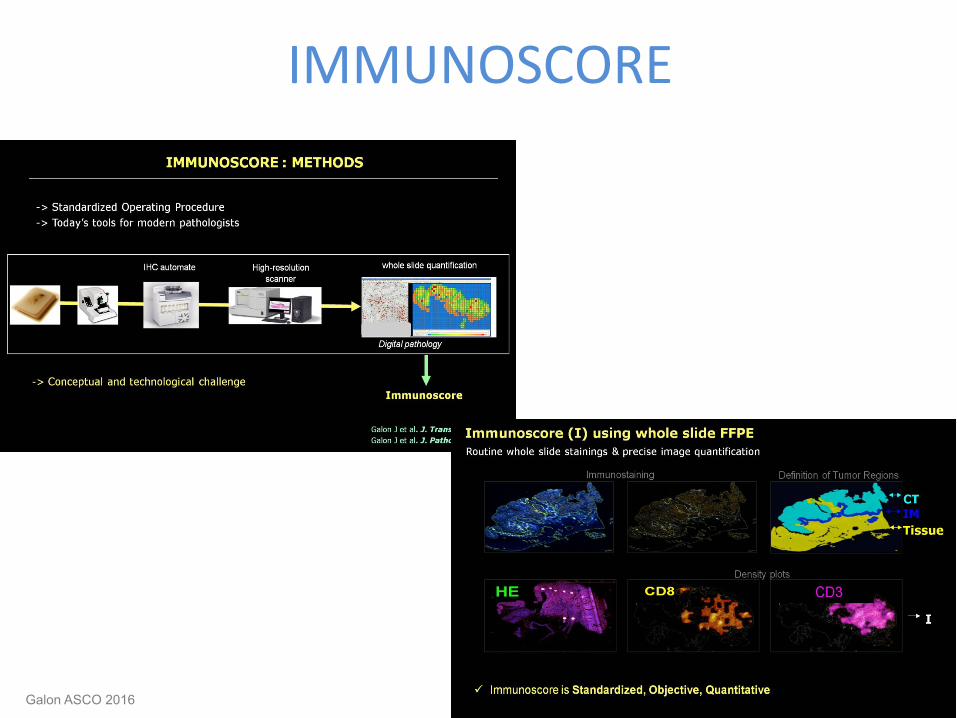
IMMUNOSCORE • ValidaQon of the Immunoscore as a prognosQc marker in stage I/II/III colon cancer – Worldwide consorQum – Final analysis: 3855 paQents
Galon ASCO 2016
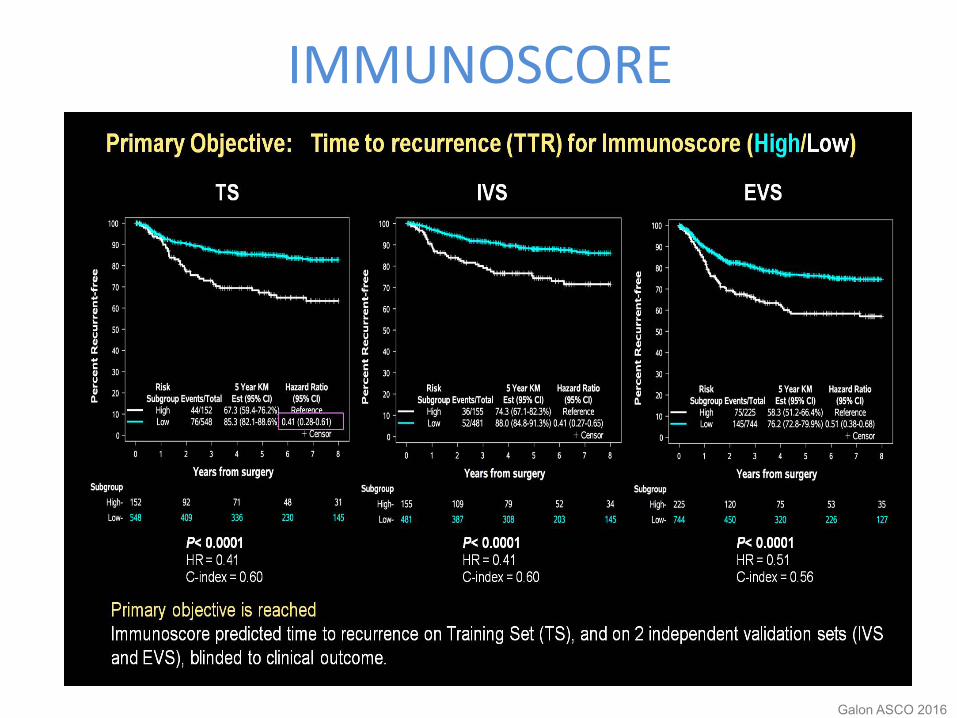
IMMUNOSCORE
Galon ASCO 2016
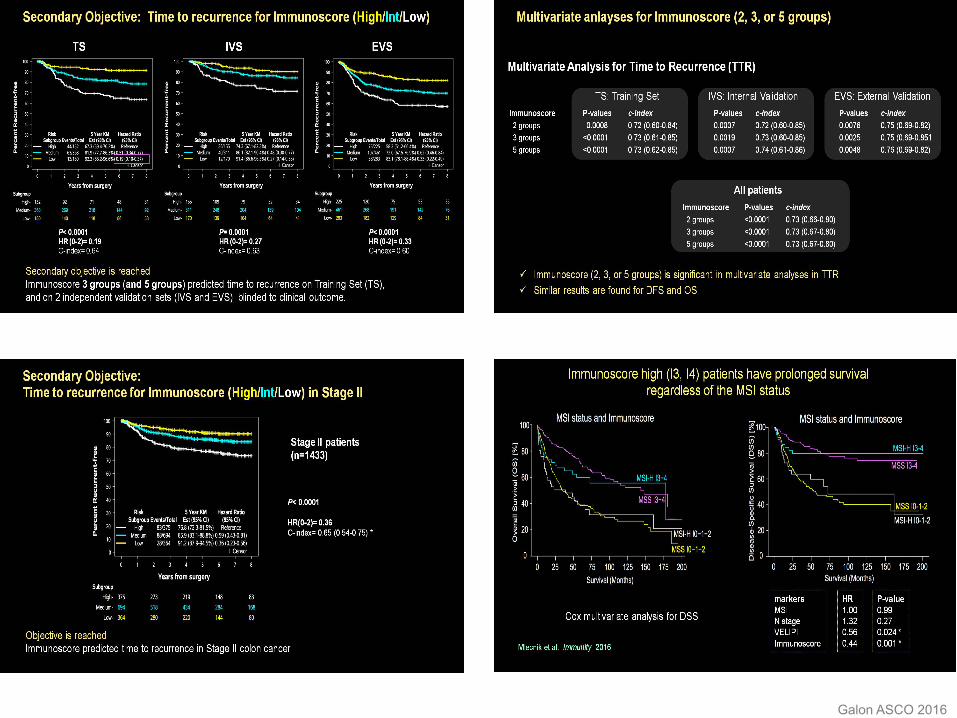
IMMUNOSCORE
Galon ASCO 2016
Galon ASCO 2016
Outline • The Immune System • Immunotherapy in GI Tumors
– Gastric Cancer – Colorectal Cancer
• Challenges – PaKerns of response & AEs
• Conclusions

IdenQfying paKerns of response
50
25
–125
–25
Change from
baseline SPD (%
)
–50
–75
–21 –63
RelaQve day from date of first dose 21 63 105 147 189 231 273 315 357
0
–100
2810 2482 2154 1826 1498 1171 843 515
–140 187
–468
SPD (mm
2)
50
25
–125
–25 Ch
ange from
baseline SPD (%
) –50
–75
–21 –63
RelaQve day from date of first dose 21 63 105 147 189 231 273 315 357
0
–100
1272 1124 975 827 678 530 382 233
–64 85
–212
SPD (mm
2)
N
N N N N N
150 125
–125
75
Change from
baseline SPD (%
)
50 25
–21 –63
RelaQve day from date of first dose 21 63 105 147 189 231 273 315 357
100
0
19373 17242 15111 12980 10849 8718 6587 4456
194 2325
–1937
50
25
–125
–25
Change from
baseline SPD (%
)
–50
–75
–21 –63
RelaQve day from first dose 21 63 105 147 189 231 273 315 357 399 441 483 525
0
–100
153 135 117 99 82 64 46 28
–8 10
–26
SPD (mm
2) SPD (m
m2)
–100 –75 –50 –25
N
Response in baseline lesions
Response ajer ini1al increase in total tumor volume
‘Stable disease’ with slow, steady decline in total tumor volume
Reduc1on in total tumor burden ajer appearance of new lesions
Wolchok Clin Cancer Res 2009

Managing immune-‐related AEs
Rash
Autoimmune hepaQQs Elevated transaminases
PneumoniQs
ColiQs -‐ duodeniQs
PancreaQQs
Type 1 diabetes mellitus
Hypothyroidism MyosiQs
Myasthenia Gravis
Melero Clin Cancer Res 2013
Outline • The Immune System • Immunotherapy in GI Tumors
– Gastric Cancer – Colorectal Cancer
• Challenges – PaKerns of response & AEs
• Conclusions
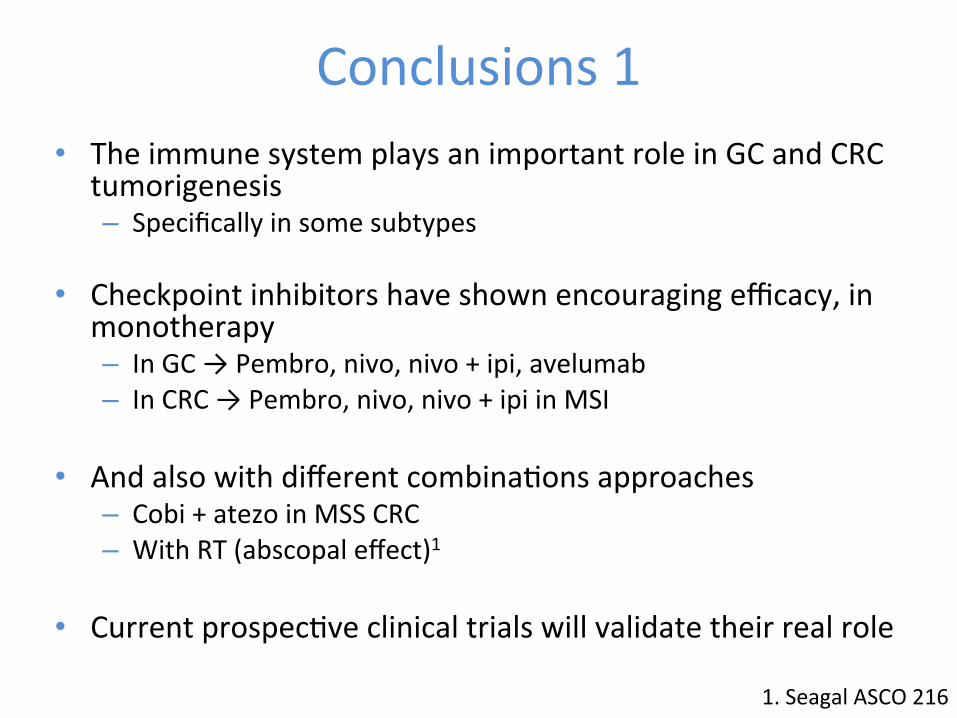
Conclusions 1 • The immune system plays an important role in GC and CRC
tumorigenesis – Specifically in some subtypes
• Checkpoint inhibitors have shown encouraging efficacy, in monotherapy – In GC → Pembro, nivo, nivo + ipi, avelumab – In CRC → Pembro, nivo, nivo + ipi in MSI
• And also with different combinaQons approaches – Cobi + atezo in MSS CRC – With RT (abscopal effect)1
• Current prospecQve clinical trials will validate their real role
1. Seagal ASCO 216
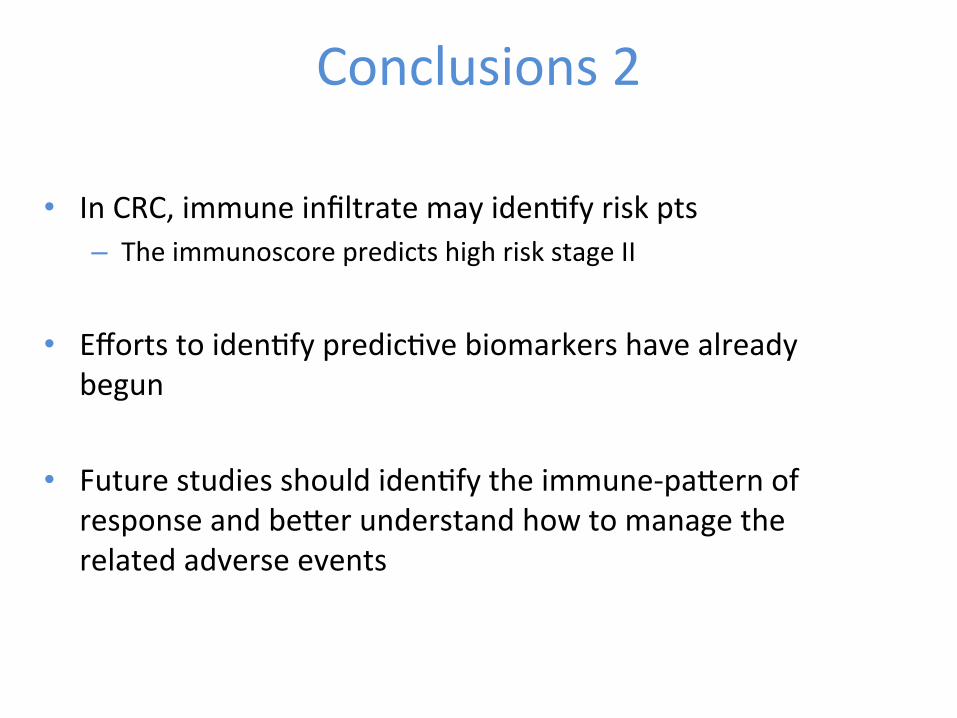
Conclusions 2
• In CRC, immune infiltrate may idenQfy risk pts – The immunoscore predicts high risk stage II
• Efforts to idenQfy predicQve biomarkers have already
begun
• Future studies should idenQfy the immune-‐paKern of response and beKer understand how to manage the related adverse events