Embed Size (px)
Citation preview

Integ
rated A
nn
ual R
epo
rt 2013
IntegratedAnnual Report 2013

2013 Integrated Annual Report
GROUP OveRview2 Group at a glance2 Mission and values3 Store footprint4 Key indicators5 Geographic spread6 Pick n Pay awards7 Value added analysis8 – 9 Five-year financial review10 – 11 Engaging with our stakeholders
RePORt tO stakehOldeRs12 – 15 Chairman’s report16 – 18 Board of directors20 – 21 Chief Executive Officer’s report22 – 25 Chief Finance Officer’s report26 – 29 Sustainability summary
cORPORate GOveRnancePick n Pay Stores Limited31– 38 Corporate governance report39 – 40 Audit committee report41 – 47 Remuneration committee report48 Social and ethics committee report49 – 50 Risk management report51 Legal report
Pick n Pay Holdings Limited RF52 – 54 Corporate governance report55 Audit committee report
annUal financial statements57 – 104 Group annual financial statements105 – 113 Company annual financial statements
cORPORate and shaRehOldeR infORmatiOn114 – 115 Analysis of shareholders116 Shareholders’ informationIBC Administration
Contents
aPPROval
The audit committee has reviewed the Integrated Annual Report for 2013 and recommended it for approval to the Board.
The Board of directors acknowledges its responsibility to ensure the integrity of the Integrated Annual Report. The directors confirm that they have collectively reviewed the content of this report and agree that it addresses the material issues faced by the Group, and provides a fair presentation of the financial position of the Group as at 3 March 2013 and its performance for the related annual financial period.
The Board authorised the Integrated Annual Report for release on 22 April 2013.
Gareth Ackerman Richard BrasherNon-executive Chairman Chief Executive Officer
To best serve the needs of a variety of stakeholders, different sections of our full Integrated Report are available in different mediums. These are cross-referenced in the different reports and detailed below:
Medium Report Content
Printed and available on request
www.picknpay-ir.co.za
Integrated Annual Report
Group overview report to stakeholders
Sustainability summary Corporate governance Annual Financial Statements
Printed and mailed to shareholders
www.picknpay-ir.co.za
Summarised Results: Pick n Pay Stores Limited
Review of operations Summarised Annual Financial Statements
Summarised remuneration policy
Shareholder information Notice of AGM and proxy form
Printed and mailed to shareholders
www.picknpay-ir.co.za
Summarised Results: Pick n Pay Holdings Limited RF
Review of operations Summarised Annual Financial Statements
Summarised remuneration policy
Shareholder information Notice of AGM and proxy form
www.picknpay-ir.co.za/sustainability-reports
Sustainable Living Report Full sustainability report GRI index
In order to promote sustainability, we will not be posting the Integrated Annual Report to all our shareholders.Notices of AGM and proxy forms can be found on our website, www.picknpay-ir.co.za, in the summarised results.A printed copy of the Integrated Annual Report is available on request from our Company Secretary, Debra Muller, at [email protected] or by fax at + 27 21 797 0314. Any additional requests for information or comments on the report can also be directed to her.
hOw tO Use OUR RePORts
Integ
rated A
nn
ual R
epo
rt 2013
IntegratedAnnual Report 2013
Notice and proxy of annual general meeting and audited summarised financial statements
for the 2013 annual financial period
Pick n Pay Stores Limited
Notice and proxy of annual general meeting and audited summarised financial statements
for the 2013 annual financial period
Pick n Pay Holdings Limited

1 Integrated Annual Report 2013
About this report
RegulatoRy intRoduction
We are pleased to present our Integrated Annual Report for 2013.
In this document our aim is to provide a review of the financial,
social and environmental performance indicators and results for
Pick n Pay Holdings Limited RF (“Pick n Pay Holdings Limited”) and
Pick n Pay Stores Limited and all their subsidiaries and associate (the
Group), as well as the opportunities and related risks faced by the
Group and how these underpin our strategic objectives. We believe
this will provide all our stakeholders with improved insight into our
business and an increased understanding of how we create value
and how we are ensuring that our value creation is sustainable in
the long term.
We remain committed to achieving the highest standards of global
best practice in reporting and, as such, continue on our journey
to implement those standards as far as possible in the Group.
We have expanded our disclosures in 2013 and will continue
to engage with all stakeholders and improve year-on-year.
Scope of the RepoRt
This report covers the financial performance, operational
highlights and strategic objectives of Pick n Pay Holdings Limited
and Pick n Pay Stores Limited and all their subsidiaries and associate
(the Group).
Pick n Pay Holdings Limited is an investment holding company
listed on JSE Limited (JSE), with a controlling shareholding in JSE
listed Pick n Pay Stores Limited. The latter is an investment holding
company whose subsidiaries and associate operate in the retail
sector on the African continent.
Sustainability elements covered in this report are specific to our
Pick n Pay branded business unit. It is our intention to expand
these disclosures in the future to all business units of the Group
in South Africa in order to provide a comprehensive view of the
social and environmental impact of the Group as a whole.
The report covers the 2013 annual financial period and has been
compiled and presented in line with the requirements and principles
of the following:
The King Report on Governance for South Africa, and the King
Code of Governance Principles (King III);
The International Integrated Reporting Committee’s prototype
of the international Integrated Reporting (IR) framework;
The Global Reporting Initiative’s G3.1 guidelines on reporting
of non-financial information (GRI G3.1);
The Companies Act 71 of 2008, as amended;
The JSE Listings Requirements; and
International Financial Reporting Standards (IFRS).
There are a number of improvements in our report, which resulted
in some changes to the structure and the presentation of
information. This has not materially affected the consistency of our
reporting, and no previously reported significant information has
been excluded from the report.
See pages 97 to 99 of the annual financial statements for improved
segmental reporting in line with our operational structure. There
have been some changes in the executive management structure
as detailed in the Chairman’s report on pages 12 to 15.
There have been no restatements of financial information in respect
of prior periods, however, in considering year-on-year comparability
we draw your attention to the following:
During the financial period under review the Group has adopted
a 52-week financial reporting calendar for all future annual
financial periods. This change will integrate financial reporting
with operational structures and will improve comparative
reporting to both internal and external stakeholders. As a result
the 2013 annual financial period ended on 3 March 2013
compared to 29 February 2012 in the comparative period. Refer
to note 29 on page 104 for the estimated impact on the annual
financial statements.
foRwaRd looking infoRmation
This Integrated Annual Report contains certain forward looking
statements as relates to the financial performance and position of
the Group. All forward looking statements are solely based on the
views and considerations of the directors. These statements involve
risk and uncertainty as they relate to events and depend on
circumstances that may occur in the future. Factors that could cause
actual results to differ materially from those in forward looking
statements include, but are not limited to, global and national
economic and market conditions, competitive conditions and
regulatory factors. These forward looking statements have not been
reviewed or reported on by the Group’s external auditors.
exteRnal aSSuRance
The Board, assisted by the audit committee, is ultimately responsible
for overseeing the integrity of the Integrated Report. This was
achieved through setting up the appropriate teams and structures
to undertake the reporting process and performing a thorough
review of the report.
The annual financial statements in the Integrated Annual Report
have been prepared under the supervision of the Chief Finance
Officer, Bakar Jakoet, CA(SA).
External assurance obtained in the current period is limited to the
external audit opinion on the Group annual financial statements.
We are currently working with a qualified, independent third party
to assist us with developing and implementing a comprehensive
combined assurance approach, to ensure the integrity of all data
contained within the report.

2 2013 Integrated Annual Report
Group overview
mission
We serve
With our hearts we create a great place to be
With our minds we create an excellent place to shop
Values
We are passionate about our customers and will fight for their rights
We care for, and respect each other
We foster personal growth and opportunity
We nurture leadership and vision, and reward innovation
We live by honesty and integrity
We support and participate in our communities
We take individual responsibility
We are all accountable
convenient and accessible shopping experience the
Group operates across multiple store formats, both
franchised and owned.
For the past 5 years the Group’s core focus has been
to strengthen its strong South African retail businesses
under the Pick n Pay and Boxer brands, while adopting
a systematic approach to expanding into adjacent areas,
including geographical growth through the
African continent.
As a major retailer in Africa, the Group strives to address
socio-economic challenges through the supply of
high-quality, affordable food for all customers, while
providing significant employment and economic
opportunities across its value chain. The growth and
success of Pick n Pay is attributable to 3 basic principles,
which form the cornerstone of the business:
Consumer sovereignty;
Doing good is good business; and
Maximising business efficiency.
Pick n Pay Holdings Limited and Pink n Pay Stores Limited
are investment holding companies listed on the JSE since
1968. Pick n Pay Holdings Limited’s sole purpose is the
holding of the controlling shareholding in Pick n Pay
Stores Limited. Pick n Pay Stores Limited, through its
subsidiaries and associates, operates in the retail sector
on the African continent.
Pick n Pay is the quintessential family store focused
on the customer. Since 1967 when consumer champion
Raymond Ackerman purchased the first few stores,
the Ackerman family’s vision has grown and expanded
to now encompass stores in South Africa, Namibia,
Botswana, Zambia, Mozambique, Mauritius, Swaziland
and Lesotho. Additionally Pick n Pay owns a 49% share
of a Zimbabwean supermarket business,
TM Supermarkets. Our offer to customers focuses on
groceries, clothing and general merchandise, but also
includes additional value-added services to cater for our
customers’ expectations and evolving needs. To ensure a
Group at a glance

3 Integrated Annual Report 2013
Group overview
Repo
Rt to
stA
keh
old
eRs
CoR
poR
Ate
Go
VeR
NA
NCe
AN
NU
Al fIN
AN
CIAl
stAtem
eNts
GR
oU
p o
VeR
VIew
CoR
poR
Ate A
Nd
sh
AR
eho
ldeR
INfo
Rm
AtIo
N
We are a multi-format, multi-channel retailer with a footprint of 992 stores, 107 opened during the 2013 annual financial period.
Store footprint
28pharmacy
COMPANY OWNED – 24 IN-STORE and 4 STAND AlONE
Pharmaceutical, health and beauty
76clothing
COMPANY OWNEDClothing and homeware
13clothing
FRANCHISEClothing and homeware
17expressFRANCHISE
Convenience store – food
135liquor
COMPANY OWNEDBeer, wine and liquor
105liquor
FRANCHISEBeer, wine and liquor
20hypermarkets
COMPANY OWNEDFood, wine, clothing, with wide range
of general merchandise and home improvement supplies
185Supermarkets
COMPANY OWNEDFood, wine, clothing, with associated
range of general merchandise
287Supermarkets
FRANCHISEFood, wine, clothing, with associated
range of general merchandise
113 Supermarkets
COMPANY OWNEDFood, wine and
general merchandise
15hardware
COMPANY OWNEDHardware and general
building supplies
12liquor
COMPANY OWNEDBeer, wine and liquor
10punch
COMPANY OWNEDConvenience store – food and
an associated range of general merchandise
INvESTMENT IN ASSOCIATE TM ZIMBABWE
47Supermarkets
Food, wine and general merchandise
2Supermarkets
Food, wine and general merchandise

4 2013 Integrated Annual Report
Group overview
Key indicators
More than half of South Africa’s customers regularly shop at Pick n Pay (source: AMPS 2012)
Customer counts increased by 4.3%
More than 6.3 million South Africans have smartshopper cards
10 smartshopper cards are swiped every second
95% of our private label suppliers were audited on food safety
peRfoRmance indicatoRS turnover
R59.3 billion
net asset value per share increase
6.9%
992 stores
net trading profit
R808.9 million
eBitda
R1 793.1 million
14 milliontransactions per week
headline earnings
R532.2 million
total dividend per share
84.00 cents
pRiVate laBel
Brand positioning for price, range and quality.

5 Integrated Annual Report 2013
Group overview
Repo
Rt to
stA
keh
old
eRs
CoR
poR
Ate
Go
VeR
NA
NCe
AN
NU
Al fIN
AN
CIAl
stAtem
eNts
CoR
poR
Ate A
Nd
sh
AR
eho
ldeR
INfo
Rm
AtIo
NG
Ro
Up
oV
eRV
Iew
Geographic spread
1
2
792
415
145
9
5
2
47
5
20 103
377
We have 937 stores in South Africa across all formats.
We have 104 stores outside South Africa.
We serve most customer groups.
We tailor our ownership model to the local environment, whether franchised, owned or part investment.
We offer online shopping across South Africa.
South Africa segment
Africa Division(For further details refer to note 26 on page 97 of the annual financial statements.)
Operating segments
Namibia
South Africa Lesotho
Swaziland
MauritiusMozambique
Zimbabwe
Zambia
Botswana
Pick n PayCompany ownedFranchise
BoxerOnlineTM
Number of stores

6 2013 Integrated Annual Report
Group overview
awaRdS and achieVementS
Pick n Pay was included in the JSE 100 Carbon Performance Leadership index for 2012.
Sunday Times readers voted Pick n Pay as the most environmentally responsible South African retailer.
moSt tRuSted RetaileRPick n Pay was voted the most trusted retailer in SA – Ask Africa Trust Barometer.
Pick n Pay awards
Coolest grocery store in the country for the 8th year running 2012 - Sunday Times Generation Next Brand Survey.
Pick n Pay was selected the No 1 Food Retailer in TGI’s CON Brand Survey.
Pick n Pay was the Grand Prix winner for Green Awareness in the Sunday Times Top Brands Awards.
Thyme on Nicol Restaurant at Pick n Pay on Nicol has won a coveted RASA Rosetta Award. This is in recognition of service excellence in the restaurant industry.
MOST REPuTABLE RETAILERPick n Pay was voted the most reputable retailer in SA, according to the 2013 RepTrak Pulse survey.

7 Integrated Annual Report 2013
Group overview
Repo
Rt to
stA
keh
old
eRs
CoR
poR
Ate
Go
VeR
NA
NCe
AN
NU
Al fIN
AN
CIAl
stAtem
eNts
CoR
poR
Ate A
Nd
sh
AR
eho
ldeR
INfo
Rm
AtIo
NG
Ro
Up
oV
eRV
Iew
value added analysis
continuing opeRationS
2013 2012
Rm % Rm %
Pick n Pay Stores Limited
Turnover 59 271.3 55 330.5
Amounts paid for merchandise and expenses (52 504.8) (48 598.3)
Interest and dividends received 42.8 39.5
Value added 6 809.3 100.0 6 771.7 100.0
Distributed as follows:
To employees as salaries, wages and other benefits 4 952.0 72.7 4 658.5 68.8
To investors as dividends and interest paid 714.8 10.5 740.5 10.9
To government as income taxation 258.3 3.8 407.7 6.0
Reinvested to finance expansion and growth 884.2 13.0 965.0 14.3
6 809.3 100.0 6 771.7 100.0
Employees 72.7%
Investors 10.5%
Government 3.8%
Reinvested to finance expansion and growth 13.0%
2013
2013
Employees 68.8%
Investors 10.9%
Government 6.0%
Reinvested to finance expansion and growth 14.3%
2012
2012
Value added Statement

8 2013 Integrated Annual Report
Group overview
R million unless otherwise stated 2013 2012 2011 2010 2009
Pick n Pay Stores Limited
peRfoRmance meaSuReSContinuing operationsTurnover growth % 7.1 8.1 5.1 11.3 17.2 Gross profit on turnover % 17.7 18.0 17.8 18.1 18.5 Trading profit growth % (33.2) (10.6) (13.5) (2.1) 10.7 Trading profit on turnover % 1.4 2.3 2.8 3.4 3.8 EBITDA growth % (13.5) (4.0) (4.9) 3.6 14.4 Net profit margin % 1.4 2.1 2.6 3.3 3.5 Headline earnings growth % (30.7) (14.8) (17.8) 1.4 15.2 Headline earnings per share cents 111.5 160.8 189.3 231.7 229.3 Headline earnings per share growth % (30.7) (15.1) (18.3) 1.1 10.9
Total GroupReturn on shareholders’ equity % 22.1 29.9 36.5 52.7 65.1Return on total assets % 4.3 5.9 7.0 9.3 10.0Net asset value per share cents 586.0 548.0 503.0 512.5 441.7
conSolidated StatementS of compRehenSiVe incomeContinuing operationsTurnover 59 271.3 55 330.5 51 185.0 48 703.2 43 754.1 Trading profit 852.4 1 275.1 1 417.7 1 638.7 1 673.9 EBITDA 1 793.1 2 073.7 2 160.9 2 271.3 2 192.3 Headline earnings 532.2 767.8 900.8 1 096.4 1 081.5
conSolidated StatementS of financial poSitionTotal Group operationsASSETSNon-current assets 5 408.0 5 091.1 4 078.3 4 849.3 4 336.4 Current assets 7 613.1 6 727.2 7 022.0 6 349.5 6 239.4
Total assets 13 021.1 11 818.3 11 100.3 11 198.8 10 575.8
eQuity and liaBilitieSOrdinary shareholders’ equity 2 416.0 2 404.1 2 158.8 2 144.6 1 695.5 Non-current liabilities 1 697.1 1 609.3 1 383.3 1 391.4 1 344.8 Current liabilities 8 908.0 7 804.9 7 558.2 7 662.8 7 535.5
Total equity and liabilities 13 021.1 11 818.3 11 100.3 11 198.8 10 575.8
Five-year financial review
20132012201120102009
43 754.1
48 703.251 185.0
55 330.559 271.3
Turnover (Rm)
20132012201120102009
441.7
512.5 521.0548.0
586.0
Net asset value (Rm)

9 Integrated Annual Report 2013
Group overview
Repo
Rt to
stA
keh
old
eRs
CoR
poR
Ate
Go
VeR
NA
NCe
AN
NU
Al fIN
AN
CIAl
stAtem
eNts
CoR
poR
Ate A
Nd
sh
AR
eho
ldeR
INfo
Rm
AtIo
NG
Ro
Up
oV
eRV
Iew
definitionS
Headline earnings Net profit for the period adjusted for the after tax effect of certain capital itemsEBITDA Earnings before interest, tax, depreciation and amortisationReturn on shareholders’ equity Headline earnings expressed as a percentage of the average ordinary shareholders’ equity for
the periodReturn on total assets Headline earnings expressed as a percentage of the average total assets for the periodHeadline earnings per share Headline earnings divided by the weighted average number of shares in issue for the periodDividend cover Headline earnings per share divided by the dividends per share which relate to those earningsNet asset value per share Total value of net assets at period end, adjusted for directors’ valuations of property and investments,
divided by the number of shares in issue at period end, held outside the GroupMarket capitalisation The price per share at period end multiplied by the number of shares in issue at period endPrice:earnings ratio The price per share at period end divided by headline earnings per share Dividends per share The interim dividend declared during the current financial period and the final dividend declared after
period end, in respect of the current financial period
R million unless otherwise stated 2013 2012 2011 2010 2009
Stock exchange (JSe limited) peRfoRmancePick n Pay Stores Limited (PIK)Number of shares in issue 480.4 480.4 480.4 480.4 506.1 Weighted average number of shares in issue 478.1 477.4 475.7 473.2 471.7 Total market capitalisation 21 829.3 20 690.7 22 309.7 19 408.1 15 690.2 Price:earnings ratio times 40.8 30.2 28.2 18.9 14.8 Dividend per share cents 84.0 130.9 142.5 174.5 170.0Dividend cover times 1.3 1.1* 1.2 1.2 1.2 Volume of shares traded 274.5 216.8 275.7 209.5 238.8Percentage of shares traded % 57.1 45.1 57.4 43.6 47.2Market price per share – average cents 4 461 4 177 4 472 3 486 3 145
Pick n Pay Holdings Limited (PWK)Number of shares in issue 527.2 527.2 527.2 527.2 527.2 Weighted average number of shares in issue 516.4 516.4 515.9 515.3 514.7 Headline earnings per share cents 55.1 70.8 82.1 106.8 104.8 Price:earnings ratio times 34.4 25.9 24.4 15.7 12.5 Dividend per share cents 40.8 63.5 69.3 84.9 83.0Dividend cover times 1.4 1.1* 1.2 1.3 1.3 Volume of shares traded 139.6 122.8 165.7 60.4 85.7Percentage of shares traded % 26.5 23.3 31.4 11.5 16.3Market price per share – average cents 1 944 1 745 1 885 1 495 1 325
* Due to an additional dividend paid to shareholders in respect of secondary tax on companies no longer payable, the dividend cover for this period decreased.
20132012201120102009
756 762
840
941992
Number of stores (continuing operations)
20132012201120102009
229.3 231.7
189.3
160.8
111.5
Headline earnings per share (cents)
10 2013 Integrated Annual Report
Group overview
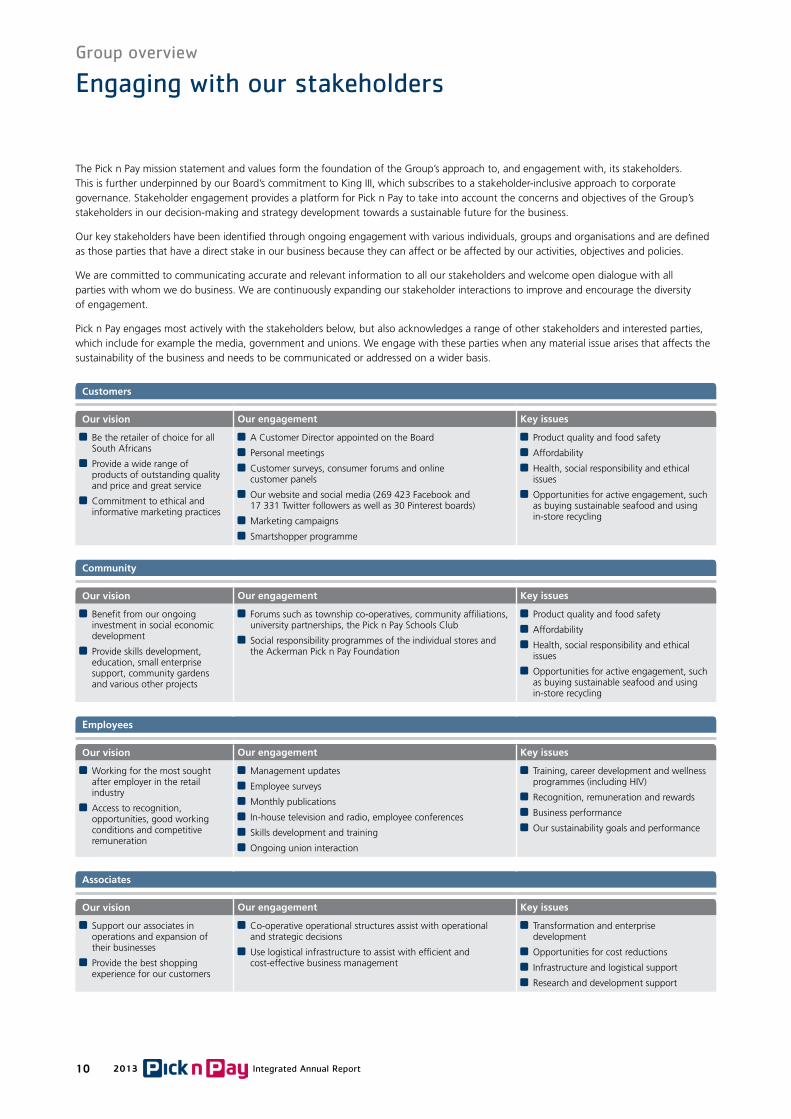
Engaging with our stakeholders
The Pick n Pay mission statement and values form the foundation of the Group’s approach to, and engagement with, its stakeholders. This is further underpinned by our Board’s commitment to King III, which subscribes to a stakeholder-inclusive approach to corporate governance. Stakeholder engagement provides a platform for Pick n Pay to take into account the concerns and objectives of the Group’s stakeholders in our decision-making and strategy development towards a sustainable future for the business.
Our key stakeholders have been identified through ongoing engagement with various individuals, groups and organisations and are defined as those parties that have a direct stake in our business because they can affect or be affected by our activities, objectives and policies.
We are committed to communicating accurate and relevant information to all our stakeholders and welcome open dialogue with all parties with whom we do business. We are continuously expanding our stakeholder interactions to improve and encourage the diversity of engagement.
Pick n Pay engages most actively with the stakeholders below, but also acknowledges a range of other stakeholders and interested parties, which include for example the media, government and unions. We engage with these parties when any material issue arises that affects the sustainability of the business and needs to be communicated or addressed on a wider basis.
Customers
Our vision Our engagement Key issues
Be the retailer of choice for all South Africans
Provide a wide range of products of outstanding quality and price and great service
Commitment to ethical and informative marketing practices
A Customer Director appointed on the Board
Personal meetings
Customer surveys, consumer forums and online customer panels
Our website and social media (269 423 Facebook and 17 331 Twitter followers as well as 30 Pinterest boards)
Marketing campaigns
Smartshopper programme
Product quality and food safety
Affordability
Health, social responsibility and ethical issues
Opportunities for active engagement, such as buying sustainable seafood and using in-store recycling
Community
Our vision Our engagement Key issues
Benefit from our ongoing investment in social economic development
Provide skills development, education, small enterprise support, community gardens and various other projects
Forums such as township co-operatives, community affiliations, university partnerships, the Pick n Pay Schools Club
Social responsibility programmes of the individual stores and the Ackerman Pick n Pay Foundation
Product quality and food safety
Affordability
Health, social responsibility and ethical issues
Opportunities for active engagement, such as buying sustainable seafood and using in-store recycling
Employees
Our vision Our engagement Key issues
Working for the most sought after employer in the retail industry
Access to recognition, opportunities, good working conditions and competitive remuneration
Management updates
Employee surveys
Monthly publications
In-house television and radio, employee conferences
Skills development and training
Ongoing union interaction
Training, career development and wellness programmes (including HIV)
Recognition, remuneration and rewards
Business performance
Our sustainability goals and performance
Associates
Our vision Our engagement Key issues
Support our associates in operations and expansion of their businesses
Provide the best shopping experience for our customers
Co-operative operational structures assist with operational and strategic decisions
Use logistical infrastructure to assist with efficient and cost-effective business management
Transformation and enterprise development
Opportunities for cost reductions
Infrastructure and logistical support
Research and development support

11 Integrated Annual Report 2013
Group overview
Repo
Rt to
stA
keh
old
eRs
CoR
poR
Ate
Go
VeR
NA
NCe
AN
NU
Al fIN
AN
CIAl
stAtem
eNts
CoR
poR
Ate A
Nd
sh
AR
eho
ldeR
INfo
Rm
AtIo
NG
Ro
Up
oV
eRV
Iew
Franchisees
Our vision Our engagement Key issues
The most innovative and mutually beneficial franchise model in the retail industry
To operate as a sustainable franchisor of choice for retail entrepreneurs across the FMCG industry
One-on-one relationships
Store visits by franchise specialists and service area consultants
Monthly meetings between the regional operational teams
Monthly CEO forum meetings with national franchise representatives
CSI programmes in the communities in which our franchisees operate
Building a sustainable business
Resource efficiency (energy, water, waste, logistics)
Security and sustainability of supply, timely delivery, pricing, product innovation, marketing support, quality of product and food safety
Opportunities for cost reductions
Transformation and enterprise development
Shareholders
Our vision Our engagement Key issues
Generate consistent profits in a long-term, sustainable manner
Operate according to good corporate governance principles
Innovative business practices
Provide an attractive return on investment
CEO and CFO regularly engage with investors, analysts and fund managers
All relevant company information is made available to all our shareholders
Analyst presentations twice a year
Annual general meetings
Investor relations section on our website (www.picknpay-ir.co.za)
ROI
Sustainability
Dividends
Risks and opportunities
New stores, channels and products
Sufficient free float of shares for trade
Constitution of the Board
Suppliers
Our vision Our engagement Key issues
Fair, efficient and mutually beneficial business relationships
Develop new products that meet evolving customer needs and environmental requirements
Give “new product innovation” the best chance of success on shelf, through visibility and availability
Committed to continuous development of small businesses and suppliers
Contribute to job creation in Africa
Conduct food safety audits at supplier factories and production facilities on an annual basis
Store visits
Joint business planning sessions
New store opening programmes
Cycle meetings
Technical support
Compliance training
Supplier conferences
Dedicated enterprise development programme
Fair pricing, research and development support, contracts and agreements, certification, infrastructure and logistical support
Opportunities for cost reductions
Transformation and enterprise development
Resource efficiency (energy, water, waste, logistics)

12 2013 Integrated Annual Report
The 2013 annual financial period reflects a mixed result for the
Pick n Pay Group. The financial performance of the Group continues
to be impacted in the short term by the costs associated with our
business transformation. The long-term benefits of these initiatives
are still to be realised and we know that a lot of hard work
lies ahead.
The year ended with the news that, according to a comprehensive
survey of the South African public by Ask Africa, Pick n Pay is the
most trusted retailer in South Africa. We work hard – and have
done so since our inception – to earn the trust of our customers
and the broader South African society. The news was welcomed by
all our people, particularly given the extensive transformation
initiatives we have been undertaking in recent years, some of which
have inconvenienced our customers at times.
ExEcutivE rEviEw
In the midst of a business transition, while also facing low economic
growth and pressure on our customers, I believe we have achieved
some notable milestones over the past year. These include:
The appointment of Richard Brasher as Chief Executive Officer
who has in a short space of time brought energy and impeccable
global retailing credentials to Pick n Pay.
Chairman’s reportReport to stakeholders
“Our focus on values continues to lie at the heart of our business”
Gareth Ackerman
We have made progress with our distribution strategy.
We successfully opened our second major distribution centre, in
Philippi in the Western Cape, and are pleased with the progress
we have made with our distribution centre in Longmeadow in
Johannesburg after the decision to take the management
in-house.
An encouraging new store pipeline across all our retail formats,
which will enhance our community coverage and anchor our
recovery in the coming year. This will ensure that customer
choice and value for money continue to be the hallmarks of the
Pick n Pay Group brands, demonstrating the extent to which a
focus on our traditional values reinforces and complements the
elements of our strategic plans to enhance performance.
The bedding down of our category buying team. This has
changed the way we negotiate with our suppliers, thereby
enhancing our buying function to the advantage of customers.
We streamlined our performance reporting process including
changing to a 52-week reporting calendar, enhancing future
comparable reporting.
95% of our private label supplies were audited for food safety.
Although we have recorded these and other achievements, they are
of a longer-term nature with the commensurate benefits only
expected to manifest themselves in future financial periods. In the
short term they contribute to an anticipated increase in the cost
base and a depressed financial result. Our trading results also reflect
the challenging conditions that characterise both the global and
domestic economies.

13 Integrated Annual Report 2013
Repo
Rt to
stA
keh
old
eRs
CoR
poR
Ate
Go
VeR
NA
NCe
AN
NU
Al fIN
AN
CIAl
stAtem
eNts
GR
oU
p o
VeR
VIew
CoR
poR
Ate A
Nd
sh
AR
eho
ldeR
INfo
Rm
AtIo
N
The recent weakening of the rand against developed market
currencies may bring some relief to the exporting sectors.
The impact on the price of imported and dollar-denominated
commodities, especially maize, oil and fuel, imported food products
and imported inputs into food and other manufactured goods
can be ultimately devastating to the poorest of our customers.
These customers are always the first to suffer the consequences
of rising food inflation. This impact on the consumer is exacerbated
by the above-inflation increases in government-administered prices
and services such as electricity, petrol, rates and indirect taxes.
We are making representations against increased duties on
imported chicken as it will inflate the retail prices which the
population cannot afford.
Pick n Pay has always sought ways to mitigate the effects of such
cost pressures on our customers. This we have achieved through
strategies such as sourcing local merchandise where possible,
competitive product-pricing, and managing our directly attributable
operational costs without compromising the quality of our service.
As this Integrated Annual Report and our Sustainable Living Report
demonstrate, our focus on sustainability continues to lie at the
heart of our business model. We do not regard this as a passing fad
or a marketing ploy to accommodate the desires of our more savvy
customers. Pick n Pay’s commitment to sustainable operating
principles goes back to the late 1980s when, if anything,
commentators wondered why we were heading in that direction.
But in keeping with our traditional core belief that sustainable
businesses have an important role to play in the building of
sustainable communities, this report records our aspirations and
achievements in our efforts to add value to the broader economy
and society of which we are a part.
Our efforts on the sustainability front have been greatly augmented
by Pick n Pay’s participation in the Consumer Goods Forum (CGF),
an international association of retailers, manufacturers and service
providers committed to a sustainable, safe and healthy consumer
goods industry. As the co-chairman of the CGF, I have been able to
gain valuable insights into those global and emerging retail trends
that are improving sustainability across the value chain. We have
been able to integrate many of the CGF’s programmes and
initiatives into Pick n Pay’s own strategic commitments. As a
signatory to the CGF protocols, such as the Global Food Safety
and Refrigeration Initiatives, we are in the process of adopting
international benchmarks that ensure excellence at all points of our
operations. These trends are also emerging in the South African
consumer profile: while many of our consumers remain under
intense cost of living pressure, many others have increasingly
demanded premium and mainstream products that are either
organic or fair trade.
Of course, no retailer in South Africa could hope to have escaped
the recent worldwide polemic about adulterated food products and
food safety. In this regard we have been able to reassure our
customers that Pick n Pay has always been fastidious about food
safety and every product line stocked in our stores is subject to
rigorous testing, independent third-party auditing and/or laboratory
analysis. I believe that the current issue is more about trust and
good faith than it is about hygiene or the adulteration of products.
Putting customers first is what builds trust: high on the list of
consumer rights is the right of access to comprehensive, visible and
reliable information about contents, ingredients and quantities, so
that customers may know what they are buying.
In addition to this process of stringent checks and controls, we
make every effort to give preference to local suppliers. This not only
makes it easier to trace the geographic origin of products, but also
to monitor the methods of manufacture. It enables us to enforce
strict standards at the food source. Through developing long-term
relationships with suppliers, we are able to monitor the entire
supply chain, from farmer to wholesaler, delivering fully traceable,
high-quality produce which we are able to trust and which is
continuously monitored by independent auditors. Currently, over
90% of our products are sourced locally.
Such support for local producers and small-scale entrepreneurs is
also an integral part of our commitment to job creation, economic
development and broad-based black economic empowerment.
It is in keeping with Pick n Pay’s procurement policies to also give
preference and support to those who were historically excluded
from South Africa’s formal economy.
We have spent much time during the past year in reminding
ourselves of those basic values and fundamental principles which
have always been at the core of our enterprise. I believe it is
imperative that we should, even in the midst of the changes that
we have embarked upon, reflect on the elementary principles of
ethical conduct, business practice and social responsibility that
informed our establishment in 1967. These are the principles that
have underscored our subsequent development as South Africa’s
most respected retail brand.
Our experience has demonstrated that there can be no substitute
for our time-tested legacy principles of consumer sovereignty,
“doing good is good business” and maximising business efficiency.
In the past few years and particularly now, the executive leadership
of the Group has again focused on these principles, the need to
continue perfecting them and to ensure that they lie at the core
of our business philosophy and model.
Report to stakeholders

14 2013 Integrated Annual Report
Chairman’s report continued
Report to stakeholders
This must necessarily mean directing our focus firmly towards
the customer:
Enhancing the shopping experience;
Opening our fair share of new trading space to get closer to
where our customers live and work; and
Generating deeper customer insights to improve our offering.
We are aiming to improve the shopping experience and give our
customers more reasons to shop with us – range, quality, service,
price and convenience.
We will continue the Group’s strategy of expansion into Africa.
The number of stores operated by Pick n Pay in the SADC region
now exceeds 100 and we are trading in Botswana, Lesotho,
Mauritius, Mozambique, Namibia, Swaziland, Zambia and
Zimbabwe. As we expand, key decisions on the choice of local
partners and whether new stores are company owned or franchised
will depend on the most efficient and effective way of investing in
individual countries.
The fact that we have progressed as far as we have in transforming
the business, without losing sight of our core foundational
principles, is testament of a loyal and committed staff who have
been asked to endure much uncertainty over the past year.
Looking back on the past five years, I remain satisfied that we took
the right decision to embark on this programme of change when
we did, and to absorb the necessary financial and institutional pain
in the short term, and remain confident that ultimately it would be
to the tangible benefit of shareholders, customers and employees.
It is part of a journey, and despite the unsatisfactory financial
performance in the 2013 financial period, I am confident that
2014 will reflect our hard work.
corporAtE GovErnAncE
Pick n Pay has always recognised that sound governance will
enhance stakeholder value. This has been ingrained in our Group’s
identity and value system. Governance processes in the Group are
consistently monitored and improved. The past year was the first
full annual period that our social and ethics committee has been
in operation.
I need to, however, draw attention to the increasing complexity and
cost of corporate governance in the South African business
environment. While recognising the need for the highest possible
standards of probity governance and accountability in both the
public and private sectors, and while acknowledging the
considerable value of the various codes of conduct and regulatory
regimes that govern our affairs, I believe we are approaching a
moment where these need to be consolidated and simplified if they
are to retain their ethical and normative value and not become
mere checklists demanding the appearance of compliance but
only a semblance of commitment. We need to work on making
sure that these values and standards are appropriately applied by
all stakeholders.
Among matters that require attention is the independence of
non-executive directors, particularly the criterion that governs
length of service. The definition of such independence is a
contentious issue in corporate governance, but institutional
memory and corporate experience are essential to the effective
operation of any company board. As Chairman of the Group,
I value the wisdom and contribution of our long-standing directors
and am satisfied that their length of tenure has in no sense
diminished their independence. However, we will continue to
monitor the independence of directors. We are currently reviewing
our Board’s composition.
There is an increasing need to align and consolidate the
expectations, demands and benchmarks of the King code, the rules
of JSE Limited and the South African Companies Act 2008. In
recent years there has been a proliferation of benchmarks, toolkits,
dashboards and checklists used by analysts, research firms and
compliance consultants. We fully support the intention of these
regulations, but there is a pressing need for the simplification and
rationalisation of the myriad demands if we are to reduce the cost
of doing business, while ensuring focus on the appropriate
implementation of the important corporate governance issues and
producing results.

15 Integrated Annual Report 2013
Repo
Rt to
stA
keh
old
eRs
CoR
poR
Ate
Go
VeR
NA
NCe
AN
NU
Al fIN
AN
CIAl
stAtem
eNts
GR
oU
p o
VeR
VIew
CoR
poR
Ate A
Nd
sh
AR
eho
ldeR
INfo
Rm
AtIo
N
prospEcts
The trading environment in the year ahead unfortunately shows
little sign of improving: food inflation and increases in the price of
petrol and municipal services will continue to burden consumers’
disposable income, while economic growth and household
spending is likely to remain sluggish. At the same time, any
deterioration in the violent nature of industrial action across
multiple sectors will impact fixed investment and job creation,
further suppressing the consumer confidence on which we depend.
There is still too wide a range of matters where government’s policy
agenda remains opaque. We need, for example, a clearer picture of
where land reform is heading, how the need for restitution in the
agricultural sector is to be aligned to food security and reconciled
with the urgent need to contain food inflation and bring down the
cost of basic foodstuffs to the poor.
Against this background, we were, as mentioned previously,
delighted to secure the appointment of Richard Brasher as our new
Chief Executive Officer. He has lost no time in immersing himself
thoroughly in the culture and operation of the Group and already
his enthusiasm and outstanding experience have brought a new
energy and drive to the Group.
With Richard’s appointment, my period as Executive Chairman
since February 2012 came to an end and I have reverted to the
Non-executive Chairmanship of Pick n Pay Stores Limited.
I would particularly like to thank our deputy CEO, Richard van
Rensburg, and the executive team for their support and hard work
over the past year.
Alex Mathole has resigned as an independent non-executive
director, with effect from 28 February 2013. Alex has taken up an
executive position at Tiger Brands Limited, a major supplier to
Pick n Pay, and her resignation from the Board prevents the creation
of a possible conflict of interests. Alex was a valuable member of
the Board with her professional experience in sustainability and
corporate social responsibility, as well as corporate governance
issues. We thank her for her contribution and wish her all of the
best in her future career.
As always, I am also pleased to have this opportunity to express
thanks to my colleagues on the Board and the executive
management team for their support. I would like to acknowledge
the loyalty and commitment of the thousands of Pick n Pay
employees who are the very heartbeat of the Group. I also
acknowledge our shareholders and thank them for their support
and patience over this period of systemic and fundamental change
that we are undertaking at Pick n Pay.
Finally, I would like to thank our customers for their ongoing
support and interactions.
Gareth Ackerman
Chairman
Cape Town
22 April 2013
Report to stakeholders

16 2013 Integrated Annual Report
Board of directorsPick n Pay Stores Limited
Report to stakeholders
Executive directors
BSocSci, CMS, Associate Fellowship at Green Templeton College, OxfordChairman Corporate governance and nominations committees’ Chairman
Appointed 1990 Years of service: 29
Gareth was an executive director at Pick n Pay for 15 years before becoming a non-executive director in 1999. While an executive, he headed up many different divisions of the Company. He was appointed to the Board in 1990 and from 2002 until 2010 served as Chairman of Pick n Pay Holdings Limited. In 2010 he was appointed Chairman of Pick n Pay Stores Limited. He assumed the role of Executive Chairman and acting CEO on the resignation of Nick Badminton from 29 February 2012 until the appointment of CEO Richard Brasher.
Gareth is a member of the Board of the Consumer Goods Forum (CGF) and is the current co-chairman of the Board and of the knowledge pillar of CGF. He is Chairman and co-founder of Pleiad Capital, and serves as a trustee of the Ackerman Pick n Pay Foundation. Gareth is a tutor at Oxford University’s Saïd Business School and an associate fellow at Green Templeton College, Oxford, as well as a member of the Oxford leadership Praxis advisory board. He serves as a member of the MENSA advisory group at the Tufts University, and is Chairman of the World President’s Organisation in Cape Town. Gareth has lectured internationally on the issues of global food security and sustainable development.
Other listed company directorships: Pick n Pay Holdings Limited
Gareth Ackerman # Δ ‡ (55)
non-executive directors
Bsc (Hons)Chief Executive Officer
Appointed 2013
Richard joins Pick n Pay after a 26-year career at Tesco in the United Kingdom, during which time Tesco was transformed into a global retailer. Prior to being appointed the Chief Executive Officer of Tesco UK/Republic of Ireland, Richard was the Group Commercial Director. He transformed Tesco’s non-food operation and developed the international supplier base. Richard was involved in the development of the house brand strategy, the modern convenience food category, the strategy of varying store formats, and the development of Tesco’s loyalty programme. Richard has recently relocated to Cape Town with his family.
richard Brasher (51)
CA(SA)Deputy Chief Executive Officer
Appointed 2009 Years of service: 4
Richard has extensive experience in retail and information technology. His experience includes being a partner at Ernst & Young, CFO of Massmart Holdings Limited, managing director of Masstores Proprietary Limited, a director of Woolworths and Wooltru and founder and CEO of Affinity Logic Holdings Proprietary Limited. He was appointed to the Board as an independent non-executive director in 2009 and became deputy CEO in October 2011.
richard van rensburg (51)
CA(SA)Chief Finance Officer
Appointed 2011 Years of service: 28
Bakar joined the Group in 1984 after qualifying as a Chartered Accountant. He commenced his career in the national finance office, heading up special projects and new business. He was appointed divisional director in 1993 and served on the retail board as Chief Finance Controller since its inception in 1995. He was appointed as CFO and a member of the Board in 2011.
Aboubakar (Bakar) Jakoet (57)
BA, Fellow: Aspen Business Institute; First MoversSocial and ethics committee Chairman
Appointed 2010 Years of service: 18
After graduating, Suzanne gained experience in the FMCG industry in Europe. Since joining Pick n Pay in 1995 as a trainee manager in fresh foods, Suzanne has worked in various positions in the business. In 2001, Suzanne was promoted to General Manager: Corporate Affairs and Social Responsibility. In 2007 she was appointed Director of Transformation. In 2010 she was appointed to the Board as an executive director and a representative of the controlling shareholder. She is active in Red Cross Hospital Trust, SMILE Foundation SA, Sunflower Fund, is Chairman of the Ackerman Pick n Pay Foundation and head of the Pick n Pay Small Business Incubator. In 2010, Suzanne graduated as a Fellow of the First Movers Fellowship Programme of the Aspen Business Institute of Management.
Other listed company directorships: Alternate director of Pick n Pay Holdings Limited
suzanne Ackerman-Berman ^ (50)
BA Marketing and Management
Appointed 2010 Years of service: 21
Jonathan graduated in marketing from the Roger Williams University in the USA, and worked in a commodity broking firm in New York. Upon returning to South Africa, he joined Pick n Pay in 1992 as a trainee manager. He has filled many executive positions in the company, gaining experience in all divisions, including produce, perishables, buying, store management, the franchise division and marketing. In 2001 he was appointed as Head of Marketing. In 2010 Jonathan was appointed to the Board as an executive director and a representative of the controlling shareholder. Jonathan is currently the Customer Director where his experience assists in ensuring that all strategic decisions are made in the best interests of the consumer.
Other listed company directorships: Alternate director of Pick n Pay Holdings Limited
Jonathan Ackerman (46)
BBusSci
Appointed 2002
David joined the Group in 1994 and was appointed to the then Group Enterprises board in 2005 as the executive responsible for expansion outside of South African borders. In 2002 he was appointed as Deputy Chairman of the Group and also as an executive director of Pick n Pay Stores Limited. During 2008 he retired from his executive position. He remains on the Board of Pick n Pay Stores Limited as a non-executive director and as a representative of the controlling shareholder.
Other listed company directorships: Alternate director of Pick n Pay Holdings Limited
Dave robins (59)

17 Integrated Annual Report 2013
Repo
Rt to
stA
keh
old
eRs
CoR
poR
Ate
Go
VeR
NA
NCe
AN
NU
Al fIN
AN
CIAl
stAtem
eNts
GR
oU
p o
VeR
VIew
CoR
poR
Ate A
Nd
sh
AR
eho
ldeR
INfo
Rm
AtIo
N
Report to stakeholders
* Member of audit committee # Member of remuneration committeeΔ Member of corporate governance committee ‡ Member of nominations committee^ Member of social and ethics committee
Member of corporate finance committee
independent non-executive directors
AttorneyLead independent non-executive directorRemuneration committee Chairman
Appointed 1976
Hugh was a partner at Sonnenberg Hoffmann Galombik before joining Pick n Pay in 1976. He was Managing Director of Pick n Pay from 1986, before joining Investec Bank in 1993. Hugh was appointed Group Chairman of Investec Bank Limited in 1996, a position from which he retired in 2011. Hugh was appointed honorary life president of the Investec Group and remains Chairman of various subsidiary companies in the Investec Group.
Other listed company directorships: Growthpoint Properties Limited, Pick n Pay Holdings Limited
Hugh Herman * # (72)
company secretary
Attorney
Appointed 2010 Years of service: 7
Debra Muller Δ ^ (51)
Attorney
Appointed 2010 Resigned 28 February 2013
Alex was admitted as an attorney in 1997 and practised commercial, corporate law and litigation for 2 years before joining Gray Security (subsequently Securicor) in 1999 where she worked in the employment law field for 5 years. In 2004 she joined Omega Risk Solutions as an executive director and subsequently moved to Siemens in 2006 as group company secretary and legal counsel. In 2007 Alex was appointed head of legal for Siemens South East Africa. In 2008 she was appointed to the board of Siemens Limited. In 2011 she became general counsel for Africa. Alex later became the Siemens executive director for sustainability and corporate affairs in Africa, as well as the chair of their social and ethics committee. Alex resigned from Siemens and subsequently the Pick n Pay Stores Board to take up an executive position with a major supplier of the Group.
Alex Mathole * (40)
BA (Hons), MA
Appointed 2010
Lorato began her working career in the FMCG sector at Unilever and at Johnson & Johnson. After moving to Nedperm in the retail banking sector, she was seconded to the Women’s Development Bank. One of the founders, and the first CEO of Nozala Investments Proprietary Limited, she has seen the company grow from its establishment in 1999 to be one of the most successful women’s investment businesses in South Africa. While at Nozala Investments, she sat on the boards of companies such as Tsebo/Fedics, Kyocera and Afripack. Lorato has also spent time in the public sector with both provincial and national government, ultimately heading up the Private Office of the President of South Africa. Lorato has recently been appointed as Chairman of the Bidvest Group.
Other listed company directorships: Bidvest Group
Lorato phalatse ‡ ^ (51)
Attorney
Appointed 2000
Ben was admitted as an attorney and conveyancer in 1970. He practiced law for his own account until 1988, and continues to consult for Van der Ross Motala Attorneys. He is a former director of the Urban Foundation and Independent Development Trust, and former CEO of the South African Rail Commuter Corporation Limited, as well as Business South Africa. He was a commissioner of the Independent Electoral Commission for South Africa’s first democratic election in 1994. Ben serves as Chairman of Strategic Real Estate Management Limited.
Other listed company directorships: Distell Group Limited, FirstRand Limited, Lewis Group Limited, MMI Holdings Limited, Naspers Limited
Ben van der ross * # ‡ (66)
CA(SA)Audit committee ChairmanCorporate finance committee Chairman
Appointed 2007
Jeff qualified as a Chartered Accountant in 1981. He founded his own auditing practice in 1984 which merged with Deloitte & Touche in 1990. He was a partner at Deloitte until June 2000 whereafter he was appointed CEO of the Financial Services Board, serving until 2005. He is a founding member and former president of the Association for the Advancement of Black Accountants and former chair of the Public Accountants and Auditors Board (now IRBA). Jeff represented SAICA on the Eastern, Central and Southern African Federation of Accountants. He is a founding member of the National Black Business Caucus and a former director of the Small Business Development Corporation. Jeff is the founder and CEO of Uranus Investment Holdings Proprietary Limited. He is a former trustee of the International Financial Reporting Standards Foundation. Jeff is presently a member of the advisory committee of SAICA.
Other listed company directorships: MTN Group Limited, Exxaro Resources Limited, Pick n Pay Holdings Limited
Jeff van rooyen * Δ (63)

18 2013 Integrated Annual Report
Board of directorsPick n Pay Holdings Limited
Report to stakeholders
non-executive directors
BCom and various honorary doctoratesChairman
Appointed 1981
Raymond founded Pick n Pay in 1967 and was its Chairman for 43 years. He was also CEO of the Group until 1999 when the roles of Chairman and CEO were split. He was Chairman until 2002 at which time Gareth Ackerman was appointed in his stead. In 2010 he was reappointed as Chairman and retired from the Pick n Pay Stores Limited Board when Gareth was appointed Chairman of Pick n Pay Stores Limited. He has won many accolades during the years as a leader, a businessman, a humanitarian and as the champion of the consumer.
raymond Ackerman (82)
Appointed 1987
See CV under Pick n Pay Stores Limited.
Gareth Ackerman (55)
Appointed 1981
Wendy is one of the founding executives of Pick n Pay. She was appointed to the Board in 1981. She retired from the Pick n Pay Stores Limited Board in 2010 where she remains integral to employee liaison, employee benefits and the management of extensive bursary funds.
wendy Ackerman
independent non-executive directors
CA(SA)Audit committee Chairman
Appointed 1981
René was an executive at Pick n Pay for 29 years, and was appointed to the Board in 1975. He was appointed joint managing director in 1993 and deputy Chairman in 1995. He retired as an executive director in 1999 but remained on the Pick n Pay Stores Limited Board as a non-executive director until 2008.
rené de wet * (70)
* Member of audit committee
Appointed 1981
See CV under Pick n Pay Stores Limited.
Hugh Herman * (72)
company secretary
Appointed 2010
Debra Muller (51)
Appointed 2011
See CV under Pick n Pay Stores Limited.
Jeff van rooyen * (63)
Alternate directors
Appointed 2010
Alternate to Raymond Ackerman
See CV under Pick n Pay Stores Limited.
suzanne Ackerman-Berman (50)
Appointed 2010
Alternate to Wendy Ackerman
See CV under Pick n Pay Stores Limited.
Jonathan Ackerman (46)
Appointed 2010
Alternate to Gareth Ackerman
See CV under Pick n Pay Stores Limited.
Dave robins (59)
chief Finance officer
Appointed 2012
See CV under Pick n Pay Stores Limited.
Bakar Jakoet (57)

19 Integrated Annual Report 2013
Repo
Rt to
stA
keh
old
eRs
CoR
poR
Ate
Go
VeR
NA
NCe
AN
NU
Al fIN
AN
CIAl
stAtem
eNts
GR
oU
p o
VeR
VIew
CoR
poR
Ate A
Nd
sh
AR
eho
ldeR
INfo
Rm
AtIo
N

20 2013 Integrated Annual Report
Chief Executive Officer’s reportReport to stakeholders
Pick n Pay is a great business. But the past few years have been
challenging, and this has been reflected in our financial results.
I have taken leadership of the business at a time of transition.
Transition can be disruptive and costly with no guarantee of
success. The key is to have a plan which combines the unaltering
basics of good retailing, relentless customer focus, consistent and
determined execution and a strong vision for the future. I am very
confident on each of these elements and that together we can
bring about a new era for Pick n Pay, characterised by growing
shared value – for our business, our staff, our shareholders, our
stakeholders and most of all our customers.
Much of the attention on Pick n Pay has in recent times focused on
strategic restructuring – for example in distribution infrastructure, in
centralised category buying and in implementing the smartshopper
loyalty scheme. Any change of this sort carries cost and a risk of
disruption, and we have seen our fair share of both. My task as
CEO is to ensure that we replace disruption with direction, and
inject the right discipline and determination to make each of these
and other changes succeed. By doing this we will strengthen our
business, improve our offer to customers and create value.
The debate on strategic restructuring and the recent financial
performance of Pick n Pay Group should never obscure the
enduring strengths of our business, which together make up its
powerful, beating heart.
We have the most loyal customers in South Africa. They trust our
business and want us to succeed. More than half of South African
consumers shop regularly with us and our customer numbers have
grown over the past year. Through the improvements we are
making to our business, through our relentless focus on value,
quality and service, and through what is now the largest loyalty
programme in the region, customer numbers and sales will continue
to grow. Every second our business is open 10 smartshopper cards
are swiped in our stores.
We have a very strong brand, built on a genuine desire to make life
better for our customers. I have spent many hours listening and
talking to customers and I have been inspired by their belief in our
commitment to making life better for them.
We have a very strong and diverse portfolio of stores – approaching
1 000 across hypermarkets, supermarkets, Express, clothing, liquor
and Boxer stores. Our trading space grew by 5.2% over the past
year, and will grow significantly again over the coming year with
more than 100 new stores. This is a key part of my vision: growing
the business by opening stores in areas which reflect the changing
Richard Brasher
“Together we can bring about a new era for Pick n Pay, characterised by growing shared value – for our business, our staff, our shareholders, our stakeholders and most of all our customers”

21 Integrated Annual Report 2013
Repo
Rt to
stA
keh
old
eRs
CoR
poR
Ate
Go
VeR
NA
NCe
AN
NU
Al fIN
AN
CIAl
stAtem
eNts
GR
oU
p o
VeR
VIew
CoR
poR
Ate A
Nd
sh
AR
eho
ldeR
INfo
Rm
AtIo
N
Report to stakeholders
habits of our customers and which bring new customers and
communities into the Pick n Pay family. Pick n Pay can and must be
part of the new South Africa’s story of growing wealth, aspiration
and access.
Commentators on the retail sector often speculate on whether a
business occupies the higher, middle or lower ground in their
appeal to customers. This is a false debate. The key to success in
retail – and the heart of any good business – is to appeal broadly, to
exclude nobody, and to move hand-in-hand with customer needs
and aspirations. I believe Pick n Pay, with its rich history of
inclusiveness and its deep well of customer loyalty, is uniquely
positioned to do this in South Africa. I am particularly excited by the
performance and the potential of our Boxer stores to reach more
customers and enhance lives among the crucial LSM 4 – 7 markets.
Every significant retail business in the world is facing the challenge
posed by a proliferation of formats and channels – in particular the
online market. Through our smartshopper programme, our online
business and other initiatives, Pick n Pay is well placed to lead in
Africa on the global challenge of developing into a multi-format,
multi-channel retailer.
We have a strong supplier base delivering quality products for our
customers, combined with a deep commitment to helping
emerging producers including those who suffered discrimination in
the past. I strongly commend the work of the Pick n Pay and the
Ackerman Pick n Pay Foundations and the successes they have
encouraged, many of which feature in our Goodness campaign as
examples of what can be achieved.
Ultimately, however, a business is best able to make its contribution
to society not just by having the right values but by being
commercially successful. If the value of a business grows, the
benefits of that growing value will accrue not just to shareholders
but to emerging suppliers through greater opportunities and to
communities through better service and employment opportunities.
I strongly endorse the Pick n Pay maxim, demonstrated over many
decades, that “doing good is good business”. My belief is that, in
turn, good business, and the growth that flows from it, creates
further opportunities to do good.
Achieving this virtuous circle is a key part of my vision for Pick n Pay.
As a lifetime retailer, however, I am not content to rest on a vision.
What excites me is the knowledge that it is only by getting a team
organised, bringing clarity, focus and motivation, and having a clear
plan – in short by getting busy – that we will turn vision into reality.
Over the coming year I am determined that we will succeed on a
number of practical priorities. The transition to central category
buying will be completed so that customers can benefit tangibly
from better products, better prices and greater innovation. The
changes to our supply chain will also benefit customers through
better availability, fresher products and less cluttered stores.
I will also focus the business on transforming the customer
experience in-store. Our staff are central to this objective. I have
been impressed by the Pick n Pay staff I have met. They will be
crucial in this next phase of our journey. Among other things I will
be encouraging our office staff to spend more time in our stores,
for it is only there that management will be able to live the maxim
that if the Company cares about the customer, the customer will
care about the Company.
I am confident that, through these and other steps, we will deliver
significant improvement and growth to our South Africa business.
Although the economy remains sluggish, its underlying potential for
growth is strong. Our population is growing and is becoming more
affluent. As our business strengthens it will be well-placed to
benefit from the opportunities generated by a return to sustained
economic growth.
We have declared our Africa performance separately for the first
time. Pick n Pay now generates R2.7 billion sales outside South
Africa in eight countries, generating close to R100 million trading
profit. This has the strong potential to develop into a second
engine of growth for our business. So this too will be an area
of strategic focus.
I am grateful to all my colleagues in Pick n Pay, from the thousands
of staff in our stores through to our Chairman, who have welcomed
and supported me since my arrival in February.
We have a great business. We have the right plan. We will get busy
as a team to deliver the plan. This way we will lead Pick n Pay into a
successful new era – to the benefit of our customers, our staff, our
shareholders and our wider stakeholders.
Richard Brasher
Chief Executive Officer
Cape Town
22 April 2013

22 2013 Integrated Annual Report
Chief Finance Officer’s reportReport to stakeholders
Historic low interest rates place pressure on the disposable
income of our customers who rely on investment income.
The pressure on customers’ disposable income, combined with
continued competition for market share by an increasing number
of market players vying for the same basket, contributed to
unsatisfactory turnover growth of 7.1%. Operating profit at
R808.9 million, 30.9% below last financial period, reflects our
weak trading performance. We have invested in the business
and we now need to ensure we deliver the benefits.
The Group adopted a 52-week financial reporting calendar for all
future annual financial periods. This change will align financial
reporting with Group operational structures and will improve
comparative reporting to both internal and external stakeholders.
As a result, the 2013 annual financial reporting period ended on
3 March 2013 compared to 29 February 2012 at the end of the
comparative period. The impact of this change has added 0.9%
growth to turnover and 6.1 cents per share to HEPS.
The Group is managed through 2 divisions, the South Africa
Division and the Africa Division. The South Africa Division operates
in various formats under the Pick n Pay and Boxer brands. The
Africa Division is responsible for the Group’s emerging expansion
into the rest of Africa and operates in Namibia, Lesotho, Swaziland,
Mozambique, Mauritius, Botswana, Zimbabwe and Zambia.
“Pick n Pay is a growing business in a growing market; however, we delivered a result that did not turn those sales into sufficient profit”
Bakar Jakoet
Pick n Pay is a growing business in a growing market. We’ve served
more customers and sold more products this period than we did last
period. However, we have delivered a disappointing result as we
failed to turn those sales into sufficient profit. We have invested
heavily to build a better future for Pick n Pay. These investments
have yet to generate sufficient value for our customers and
shareholders.
The Group experienced a challenging trading period against
a backdrop of depressed economic growth and waning
consumer confidence.
Our core customer remains under pressure:
The South African economy continues to record low economic
growth driven by low demand from developed economies and
uncertainty created by industrial action. This resulted in moderate
salary increases for many of our customers.
Household cost inflation was significantly more than overall
inflation, particularly considering increases in electricity, fuel
and rates and taxes.

23 Integrated Annual Report 2013
Repo
Rt to
stA
keh
old
eRs
CoR
poR
Ate
Go
VeR
NA
NCe
AN
NU
Al fIN
AN
CIAl
stAtem
eNts
GR
oU
p o
VeR
VIew
CoR
poR
Ate A
Nd
sh
AR
eho
ldeR
INfo
Rm
AtIo
N
Report to stakeholders
We are a scale business that is growing. The Group opened 107 stores during the financial period, ending with 992, consisting of 570 company owned and 422 franchise stores across multiple formats and in 8 geographies. In addition 49 stores, 2 of which operate under the Pick n Pay brand, are operated in Zimbabwe by our associate, TM Supermarkets. Our customer count increased by 4.3% and we serviced our customers with close on 750 million transactions. More than half of South African consumers regularly shop with us (source: AMPS 2012). Close on 60% of the Group’s turnover is through smartshopper, the largest loyalty programme in South Africa.
Number of stores 2012 Opened ClosedConver-
sion 2013
Company ownedPick n Pay 374 45 (1) 2 420
Hypermarkets 20 — — — 20 Supermarkets 174 10 (1) 2 185 Clothing 62 14 — — 76 Liquor 117 18 — — 135 Pharmacy 1 3 — — 4
Boxer 129 23 (3) 1 150 Supercities 3 7 (1) — 9 Superstores 96 7 — 1 104 Hardware 13 2 — — 15 Liquor 8 5 (1) — 12 Punch 9 2 (1) — 10
Total company owned 503 68 (4) 3 570 FranchisePick n Pay
Family 260 8 (1) (4) 263Mini Market 21 1 — 1 23 Daily 1 — — — 1 Express 9 8 — — 17 Clothing 12 1 — — 13 Liquor 85 21 (1) — 105
Total franchise 388 39 (2) (3) 422 Total Group stores 891 107 (6) — 992
PICK N PAY STORES LIMITED
FINANCIAL PERFORMANCETurnoverGroup turnover increased by 7.1% (6.3% excluding the impact of the change in financial reporting calendar).
2013 Rm
2012 Rm
%Change
%LFL
Group turnover 59 271.3 55 330.5 7.1 3.0 South Africa Division 56 694.0 53 375.5 6.2 3.0 Africa Division 2 577.3 1 955.0 31.8 22.9
The challenging trading period is reflected in our turnover growth. Inflation for the period was 5.9%. Like-for-like (LFL) turnover growth was 3.0% and 107 new company owned and franchise stores contributed 5.2% to our trading space and 3.3% to the turnover growth.
South Africa Division The South Africa Division, representing the majority of the Group’s operations, experienced positive growth in the number of stores, customers and volumes, underpinning the broad appeal of the
Group’s brands. Turnover was, however, negatively affected by
the difficult trading environment and the transport strike during
September and October 2012. The strike caused major supply chain
disruption, resulting in out-of-stock positions with a consequential
negative impact on turnover across all our brands.
Turnover was supported by 96 store openings (67 company owned,
29 franchised), including 10 Pick n Pay supermarkets and 23 Boxer
formats. The Hypermarket format remains under pressure but is
showing some improvement year-on-year. We are working hard
on ensuring that the customer offering in these stores remains
competitive.
Africa Division
The Africa Division increased external turnover by 31.8% during the
reporting period. This division is becoming a sizable business, with
store openings in Zambia, Namibia, Swaziland, Lesotho and
Mauritius contributing to strong growth, albeit off a small base.
The Group is focused on its core South African business but
will continue to look for profitable growth opportunities in the
rest of Africa.
Gross marginThe Group’s gross margin reduced to 17.7% from 18.0% in a
highly competitive market that necessitated investment in price.
A number of factors further contributed to the lower margin:
We launched a targeted promotion in the latter part of the
financial period in a determined and successful effort to clear
out under-performing inventory lines.
Distribution costs are included in the Group’s gross profit. During
the financial period, once-off costs of R64 million were incurred
to bring in-house the management of our Longmeadow
distribution centre in Gauteng.
The Group also opened a new distribution centre in Philippi in
Cape Town with the expected related initial startup costs. Our
investment in the distribution channel is focused on improving
product availability and freshness for our customers.
Shrinkage across the Group remained well controlled and within
industry benchmarks.
Trading margin
2013
% of turnover2012
% of turnover
Trading margin 1.4 2.3South Africa Division 1.3 2.3Africa Division 3.6 2.5
The trading margin decreased from 2.3% to 1.4% as a result of the
reduction in gross margin as explained earlier and our investment in
people and infrastructure. The Africa Division increased trading
margin primarily as a result of the focus on our fresh offering to
customers as well as an improved general merchandise range and
availability. An increase in volumes exported from the African
distribution centre has also contributed to increased profitability.

24 2013 Integrated Annual Report
Chief Finance Officer’s report continued
Report to stakeholders
Trading expensesTrading expenses increased by 11.5% as a result of the cost of our business improvement initiatives compared to turnover growth of 7.1%.
2013Rm
% ofturnover
2012Rm
% ofturnover
%change
Trading expenses 10 001.9 16.9 8 969.8 16.3 11.5 Employee costs 4 952.0 8.4 4 658.5 8.4 6.3 Occupancy 1 500.5 2.5 1 302.1 2.4 15.2 Operations 2 363.9 4.0 2 149.4 3.9 10.0 Merchandising and administration 1 185.5 2.0 859.8 1.6 37.9
Employee costs Employee costs were well managed, with an increase of 6.3%,
especially when taking into account the increase in our store
footprint.
All our customer-facing employees attended “Every Customer
Every Time” training, focused on improving customer service.
Occupancy Occupancy costs, up by 15.2%, increased in line with the
Group’s expansion strategy.
Increases in rates and taxes also contributed to the above-
inflationary increase.
Operations Short-term costs increased due to the overlap of regional and
centralised structures as we move to centralised buying and
administration. Increased efficiencies from the new structure will
contribute to future profitability.
Electricity usage is being controlled well, but in spite of efficiency
measures the administered price increases, at an average of
16%, are still well above inflation.
Merchandising and administration The Group is South Africa’s largest acceptor of electronic tender.
A significant increase in credit card sales participation is a
concerning indicator that customers are supplementing
household income with debt.
TaxThe Group’s effective tax rate decreased from 34.9% to 31.9%
mainly due to the replacement of secondary tax on companies (STC)
with a dividend withholding tax.
Earnings per shareHeadline earnings per share (HEPS) from continuing
operations decreased by a disappointing 30.8% from 160.8 cents
to 111.3 cents.
The change in the financial reporting calendar made a positive
contribution to HEPS. The additional trading days included in the
2013 result contributed 6.1 cents per share to HEPS and, if
excluded, the decrease on the prior period was 34.6%.
Basic earnings per share including discontinued operations
decreased by 50.6% from 233.21 cents to 115.14 cents per share
as the prior period result included a non-recurring after-tax profit
of R438 million on the disposal of Franklins, our discontinued
Australian operation.
FINANCIAL POSITIONThe financial position of the Group as at 3 March 2013 was
impacted by the change in reporting close-off date due to the
changeover to a 52-week reporting calendar. During the additional
days a net cash outflow of R1.1 billion was recorded which related
mainly to the payment of trade creditors. Although cash balances
were reduced this did not have an impact on the net working
capital of the Group.
When reviewing the Group’s financial position it is more appropriate
to consider the movement in net working capital in order to
eliminate cut-off impacts and ensure year-on-year comparability.
The net working capital decrease, during the period under review
as illustrated in the table below, is discussed in the context of the
relevant statement of financial position items.
2013Sunday
3 Mar 2013Rm
2012Wednesday29 Feb 2012
Rm
Inventory 3 996.5 3 334.9 Trade and other receivables 2 360.9 2 120.6 Cash and cash equivalents 1 255.7 1 271.7Current liabilities (8 908.0) (7 804.9)
Net working capital (1 294.9) (1 077.7)
InventoryThe 20% increase in inventory holding is a result of the following:
Provisioning of the new Western Cape distribution centre
in Philippi;
Expanding our store footprint;
Ensuring that our customer offering is accessible and convenient;
and
Increase in imported merchandise to strengthen the customer
offering in our Hypermarkets.
If these factors are taken into account, our inventory levels are
in line with those of the comparable period.

25 Integrated Annual Report 2013
Repo
Rt to
stA
keh
old
eRs
CoR
poR
Ate
Go
VeR
NA
NCe
AN
NU
Al fIN
AN
CIAl
stAtem
eNts
GR
oU
p o
VeR
VIew
CoR
poR
Ate A
Nd
sh
AR
eho
ldeR
INfo
Rm
AtIo
N
Report to stakeholders
PICK N PAY HOLDINGS LIMITED GROUP AND PICK N PAY STORES LIMITED GROUP
SHAREHOLDER DISTRIBUTIONThe Groups maintain a dividend cover at 1.33 times headline
earnings per share. The final dividend of 69.25 cents per share
for Pick n Pay Stores Limited (Stores) and 33.61 cents per share for
Pick n Pay Holdings Limited (Holdings) brings the total dividend
for the annual period to 84.0 cents per share for Pick n Pay Stores
Limited (35.8% down on the comparable period) and 40.78 cents
per share for Pick n Pay Holdings Limited (35.8% down on the
comparable period).
During the previous financial period, an additional dividend of
9.85 cents for Stores and 4.78 cents for Holdings was declared in
respect of STC no longer payable by the Group, thus passing on
the cash benefit to shareholders. If this is excluded, the decline in
the year-on-year dividend was 30.6% and 30.5% for Stores and
Holdings respectively, in line with the decrease in headline earnings
per share.
PROSPECTSWe expect the economic outlook to remain challenging for the
foreseeable future. The current weak rand will result in increased
costs of imported goods and high commodity prices will impact the
cost of manufactured goods. Interest rates and inflation will stay at
current low levels and our customers’ disposable income will remain
under pressure.
In this trading environment the Group will be focusing on the basics
of retailing, and ensuring our customers are central to all that we
do. We will concentrate on cost containment, increasing
administrative efficiencies and realising the related cost reductions.
Under the leadership of newly appointed CEO Richard Brasher, our
immediate priority is improving the shopping trip for our customers.
Pick n Pay is a great business, but as a team we know that a lot of
hard work lies ahead. It will be a challenging and exciting period for
the Group and we look forward to the future with optimism.
Bakar JakoetChief Finance Officer
22 April 2013
Trade and other receivablesThe increase of R240 million in trade and other receivables relates
to the change in reporting cut-off and 39 new franchise stores.
Franchise receivables were well controlled, but our exposure to
emerging market franchisees has resulted in an increase in our
provision for bad debts of R111.2 million.
Cash and capital managementThe Group’s liquidity position is reviewed continually. Working
capital management is critical in maintaining a sustainable and
cost-effective capital structure. The Group utilises interest-bearing
borrowings to fund specifically identified capital expenditure. All
capital expenditure is reviewed through a rigorous requisition and
approval process.
The net interest expense of R88.5 million (2012: R95.6 million) was
well controlled. The R1.2 billion proceeds from the sale of Franklins
during September 2012 strengthened our cash position.
Cash outflows during the period related to the settlement of loan
funding of R250 million and capital expenditure of R1.3 billion.
More than half of capital expenditure consisted of expanding our
store base and improving the customer experience in existing stores,
as detailed below.
2013Rm
2014Rm
Capital expenditureExpansion into new stores 539 803 Improving existing stores 135 232
Improving the customer experience 674 1 035 Investing in future infrastructure 328 442 Maintaining current infrastructure 293 280
Total capital expenditure 1 295 1 757
Capital commitments to the value of R1.8 billion are planned for
the next financial period. More than half will be focused on an
increase in our footprint and convenience offering to the customer.
This includes adding trading space via more than 100 stores. All
future capital commitments will be funded by internal funding, the
rollover of our Domestic Medium Term Note (DMTN) programme
and longer-term borrowings, where appropriate.
PICK N PAY HOLDINGS LIMITED GROUPPick n Pay Holdings Limited (Pikwik) Group’s only asset is its 53.8%
(2012: 53.8%) effective holding in Pick n Pay Stores Limited
(excluding treasury shares). The Pikwik Group earnings are directly
related to those of this investment. The table below highlights the
key financial indicators.
2013 2012 % change
Turnover (Rbn) 59.3 55.3 7.1Headline earnings per share (cents) 55.11 79.81 (30.9)EBITDA (Rm) 1 791.1 2 072.1 (13.6)

26 2013 Integrated Annual Report
Sustainability summaryReport to stakeholders
OvERvIEwEnvironmental, social and governance (ESG) issues are impacting
businesses more overtly and with greater urgency. Global debates
on the interconnectedness of water, food and energy issues are
finding local expression and food-related businesses are coming
under pressure to increase their role in addressing food security and
associated social challenges.
As a major retailer in South Africa, Pick n Pay strives to address
social challenges through the supply of high-quality, affordable food
for all South Africans, while providing significant employment and
economic opportunities across our supply chain.
A wide range of environmental, social and governance trends
are combining to create new commercial and socio-economic
challenges:
Continued volatility of global commodity prices.
Global resource availability challenges putting upward pressure
on food prices.
Rising energy prices continue to increase our operating costs.
Ongoing efforts to mitigate these increases include reducing
electricity usage, eliminating non-essential corporate travel,
and further optimising our logistics and distribution network.
Soil fertility, water demand, fertiliser prices and erratic rainfall
are just some of the issues that are of key concern to our local
produce suppliers, and all will have an increasing impact on
our ability to provide quality food at affordable prices to
our customers.
Partnerships are important in addressing social and
environmental challenges. We will continue to pursue
opportunities in this regard. A good example of this is the
Organic Farmer and Retailer programme, an initiative between
Pick n Pay and other supermarket retailers and the Department
of Trade and Industry, to facilitate the supply of organic produce
from emerging farmers.
Customer interest in green and ethical products remains strong.
While the demand for green and ethical products increases,
customers continue to expect price parity in the product
offerings. Our attention is therefore focused on meeting these
dual requirements.
Governance and disclosure requirements continue to be
developed and enhanced. Demand for greater transparency,
accountability and transformation is expected to increase across
the full value chain over the coming years.
Within this context, the Group seeks to deliver on a broad
sustainability mandate and a wide range of commitments. All of our
sustainability initiatives are directed at increasing the agility and
resilience of our business, through encouraging innovative thinking
and partnerships and the transformation of systems and processes.
We will continue to improve and grow, to ensure that we not only
become the retailer of choice for all South Africans, but that we
lead by example, as a strong and principled corporate citizen,
playing an integral role in building a strong and successful
South Africa.
This sustainability summary provides a brief, high-level overview
of our sustainability initiatives and performance. Our Sustainable
Living Report 2013 and GRI index provide a more detailed review
and are available on our website at www.picknpay-ir.co.za/
sustainability-reports.php.
Our sustainability strategy comprises 6 focus areas. These are clearly
aligned to our focus of creating value, both within our business and
in the wider society.
TOwNSHIP®BAGSTownship®bags are made in Khayelitsha by co-operatives.
They’re manufactured by Township, a Fairtrade supplier, and
generate employment for more than 60 women.

27 Integrated Annual Report 2013
Repo
Rt to
stA
keh
old
eRs
CoR
poR
Ate
Go
VeR
NA
NCe
AN
NU
Al fIN
AN
CIAl
stAtem
eNts
GR
oU
p o
VeR
VIew
CoR
poR
Ate A
Nd
sh
AR
eho
ldeR
INfo
Rm
AtIo
N
Report to stakeholders
Focus area How this creates value for our business How this creates value for society
Providing safe food and expanding sustainable product lines
Addresses increasing demand for ethical and green products, sustains viability of supply and drives innovative thinking and solutions
Promotes health and the good functioning of natural systems
Building a resilient supplier network Supports existing supply chain initiatives, consolidating our relationship with suppliers
Provides market access for producers and a support system for small-scale suppliers
Empowering our people Enables employees to act as brand ambassadors
Provides personal and career development and an opportunity to contribute positively to social change
Supporting communities in their contribution to change
Builds the brand by putting social responsibility into action
Builds social capital by encouraging action towards a sustainable society
Working for a clean and healthy environment
Manages environmental risks and achieves cost reductions in the short, medium and/or longer term
Reduces negative impact, promotes ecosystem function and restoration
Enhancing sustainable governance and accountability
Ensures compliance with existing and emerging codes of good governance
Develops trust and accountability between stakeholders
Our sustainability efforts have resulted in significant benefits for the business. We see this process as one of continual learning
and improvement.
PRIORITIES GOING FORwARD
Assurance on integrated reporting.
Improving non-financial data management and integrating sustainability compliance into our internal audit system.
Enhancing transparency on ESG commitments by making them available on our website.
Greater transparency for external stakeholders through sharing a wide range of ESG-specific commitments by making them available on our website.
More focused sustainability awareness programme for stores and customers.
Increased focus on partnerships in our broader supply chain.
BIN IT!PnP has collection points in store for CFLs, batteries, plastic bags
and printer cartridges so they can be recycled in an eco-friendly way.
PnP recycled 13 611 tonnes of waste in our last financial year, which
would otherwise have gone to landfills.

28 2013 Integrated Annual Report
Sustainability summary continued
Report to stakeholders
Focus area summaries for 2013 Achievements include Key challenges Key performance indicator 2013 2012 2011
Providing safe food and expanding sustainable product lines
Pick n Pay strives to deliver safe, quality products to our customers while ensuring the welfare of animals and the environment that supports us. To ensure food safety, we regularly audit our private label suppliers along strict health and safety guidelines. We are committed to ensuring that Pick n Pay private label products deliver on our promise of good quality and value for money. We also work closely with many suppliers to develop a common vision and to expand ethical and sustainable product lines.
We have expanded our organic food categories. We launched a project in partnership with Unilever, which will reduce packaging within our shared supply chain by 30% by 2015.
95% of our private label suppliers were audited for food safety.
Engaging stakeholders on food security is a key concern. Securing viable sources of supply remains a key priority in expanding our organic range, sustainable palm oil initiative and attaining our sustainable seafood targets.
Achieving price parity on green products is a challenge. We remain committed to expanding the Pick n Pay Green Range, focusing on decreasing the price gap with non-green products and engaging customers on sustainable choices.
Increase the range of sustainable and ethical products within Pick n Pay private label
Private Label Food Safety Audits 95% 94% 94%
Building a resilient supplier network
We continue to work closely with suppliers to ensure the sustainability of our supply base, with enterprise development being a clear focus. Our work in the agricultural sector includes projects to address the challenge of market access for emerging farmers. Successful enterprises have grown from regional to national˛suppliers.
We have quantified ESG risks in our supply chain through a formal risk assessment.
Pick n Pay Small Business Incubator provides ongoing mentorship to 72 businesses. This is an encouraging increase from 62 businesses in 2012.
Through our Enterprise Development Foundation, 52 emerging entrepreneurs have gained market access through our stores.
Communicating sustainability risks, opportunities and requirements to all our suppliers.
Balancing requirements for ESG compliance, cost reduction and the promotion of emerging farmers and entrepreneurs.
Aligning enterprise development with the needs of the business and supply chains.
Promote sustainability commitment, learning and performance across the supplier network
Small farmers and businesses in our small business incubator
72 62 54
Empowering our people
We see diversity as a driver of innovation, responsibility and a learning culture. A robust career development framework is in place, emphasising training and competence for all our employees. This meets business needs while empowering employees to grow to their full potential.
We have established a Standard Operating Procedure Manual, available to all operating units.
We introduced an “Every Customer, Every Time” training programme to improve our service to customers. To date more than 29 000 employees, support staff and external service staff members have completed the programme.
Our foundational ABET Literacy and Numeracy programmes have been extended to incorporate business specific concepts such as turnover, wastage, merchandising and sales promotion.
Ensuring continual implementation of equity appointments in all divisions.
Develop a skilled workplace enabling employees to grow to their full potential
Employee turnover (%) 16 15 15
Total investment in training including bursaries (Rm) 89.9 80.2 71.8
Employment equity
Top management (target 40%) 40 38 39
Senior management (target 65%) 61 61 58
Professionally qualified middle management (target 70%) 84 85 84
Semi-skilled junior management (target 80%) 99 95 94
Unskilled and defined decision-making (target 100%) 99.5 100 100
Supporting communities in their contribution to change
Partnerships are key to finding solutions to sustainability challenges and we actively engage with a wide range of stakeholders. We partner with communities through the Ackerman Pick n Pay Foundation and support corporate social responsibility projects that are aligned to our business. Our engagement encourages financial empowerment and independence through business development. Effective project development has enabled small enterprises to operate independently and turned seed projects into thriving community gardens.
We helped develop 100 community gardens, with 9 in KwaZulu-Natal evolving into suppliers for the Group.
We assisted in creating permanent employment for more than 60 women, employed in 7 co-operatives in townships around Cape Town who manufacture the cotton eco-bags sold in our stores.
Measuring the social impact of our community initiatives. Provide those most in need with easier access to affordable and healthy food
Number of community food gardens established to date
100 — —
Working for a clean and healthy environment
We continue to embed sustainability across our operations, driving efficiency and exploring new opportunities for our business. We continue to see significant energy and cost savings as a result of ongoing in-store efficiency initiatives and optimisation of our logistics network.We have intensified our efforts on waste management and are also starting to address environmental challenges within our wider supplier network.
We have reduced our carbon footprint by 4.94% compared to our 2012 footprint. Our store energy intensity has improved by 8.8%.
Food which has reached its sell-by date, but is still safe to consume, is donated to Foodbank South Africa. During 2012, Pick n Pay donated 1.26 million tonnes of food to Foodbank.
Our development of eco-friendly stores and ongoing commitment to climate change education was recognised when Pick n Pay received the Climate Change Leadership award in the retail category.
Continuing to reduce our consumption and impact on natural resources as the business expands.
Reduce the environmental impact of our operations
% reduction in carbon footprint (2010 baseline) 10.1 5.5* 6.0
Store energy intensity (KWh/sqm) 431 472 528
Tonnes of waste recycled 13 611 12 456 6 444
Carbon footprint (Scope 1&2) (Tonnes CO2)
577 289 607 156* 602 782**
Enhancing sustainable governance and accountability
Governance and accountability ensure compliance with existing and emerging codes of good governance, and develops trust and accountability between stakeholders. We are increasing our engagement with stakeholders on ESG issues.
Our CDP Carbon Action Programme score improved from 86 to 96 and we were placed in performance band B.
We are included in the JSE 100 Carbon Disclosure Leadership index for 2012.
A comprehensive sustainability communications strategy has streamlined our engagement with stakeholders on ESG issues.
Enhancing ESG data management through our Executive Scorecard and aligning with an increasing number of external guidance bodies.
Consolidate a robust, audited sustainability performance management system
JSE SRI listing Listed Listed Listed
Carbon Disclosure Leadership Index Score (JSE Top 100)
Included on 2012
96
Includedon 2011
86
Includedon 2010
77
* Emissions increase in FY12 due to boundary change** The figure for scope 1 and scope 2 CO2 emissions in 2011 was based on a limited scope that excluded a number of facilities and gas types. It is currently
being recalculated to allow for a more accurate year-on-year comparison of CO2 emissions

29 Integrated Annual Report 2013
Repo
Rt to
stA
keh
old
eRs
CoR
poR
Ate
Go
VeR
NA
NCe
AN
NU
Al fIN
AN
CIAl
stAtem
eNts
GR
oU
p o
VeR
VIew
CoR
poR
Ate A
Nd
sh
AR
eho
ldeR
INfo
Rm
AtIo
N
Report to stakeholders
Focus area summaries for 2013 Achievements include Key challenges Key performance indicator 2013 2012 2011
Providing safe food and expanding sustainable product lines
Pick n Pay strives to deliver safe, quality products to our customers while ensuring the welfare of animals and the environment that supports us. To ensure food safety, we regularly audit our private label suppliers along strict health and safety guidelines. We are committed to ensuring that Pick n Pay private label products deliver on our promise of good quality and value for money. We also work closely with many suppliers to develop a common vision and to expand ethical and sustainable product lines.
We have expanded our organic food categories. We launched a project in partnership with Unilever, which will reduce packaging within our shared supply chain by 30% by 2015.
95% of our private label suppliers were audited for food safety.
Engaging stakeholders on food security is a key concern. Securing viable sources of supply remains a key priority in expanding our organic range, sustainable palm oil initiative and attaining our sustainable seafood targets.
Achieving price parity on green products is a challenge. We remain committed to expanding the Pick n Pay Green Range, focusing on decreasing the price gap with non-green products and engaging customers on sustainable choices.
Increase the range of sustainable and ethical products within Pick n Pay private label
Private Label Food Safety Audits 95% 94% 94%
Building a resilient supplier network
We continue to work closely with suppliers to ensure the sustainability of our supply base, with enterprise development being a clear focus. Our work in the agricultural sector includes projects to address the challenge of market access for emerging farmers. Successful enterprises have grown from regional to national˛suppliers.
We have quantified ESG risks in our supply chain through a formal risk assessment.
Pick n Pay Small Business Incubator provides ongoing mentorship to 72 businesses. This is an encouraging increase from 62 businesses in 2012.
Through our Enterprise Development Foundation, 52 emerging entrepreneurs have gained market access through our stores.
Communicating sustainability risks, opportunities and requirements to all our suppliers.
Balancing requirements for ESG compliance, cost reduction and the promotion of emerging farmers and entrepreneurs.
Aligning enterprise development with the needs of the business and supply chains.
Promote sustainability commitment, learning and performance across the supplier network
Small farmers and businesses in our small business incubator
72 62 54
Empowering our people
We see diversity as a driver of innovation, responsibility and a learning culture. A robust career development framework is in place, emphasising training and competence for all our employees. This meets business needs while empowering employees to grow to their full potential.
We have established a Standard Operating Procedure Manual, available to all operating units.
We introduced an “Every Customer, Every Time” training programme to improve our service to customers. To date more than 29 000 employees, support staff and external service staff members have completed the programme.
Our foundational ABET Literacy and Numeracy programmes have been extended to incorporate business specific concepts such as turnover, wastage, merchandising and sales promotion.
Ensuring continual implementation of equity appointments in all divisions.
Develop a skilled workplace enabling employees to grow to their full potential
Employee turnover (%) 16 15 15
Total investment in training including bursaries (Rm) 89.9 80.2 71.8
Employment equity
Top management (target 40%) 40 38 39
Senior management (target 65%) 61 61 58
Professionally qualified middle management (target 70%) 84 85 84
Semi-skilled junior management (target 80%) 99 95 94
Unskilled and defined decision-making (target 100%) 99.5 100 100
Supporting communities in their contribution to change
Partnerships are key to finding solutions to sustainability challenges and we actively engage with a wide range of stakeholders. We partner with communities through the Ackerman Pick n Pay Foundation and support corporate social responsibility projects that are aligned to our business. Our engagement encourages financial empowerment and independence through business development. Effective project development has enabled small enterprises to operate independently and turned seed projects into thriving community gardens.
We helped develop 100 community gardens, with 9 in KwaZulu-Natal evolving into suppliers for the Group.
We assisted in creating permanent employment for more than 60 women, employed in 7 co-operatives in townships around Cape Town who manufacture the cotton eco-bags sold in our stores.
Measuring the social impact of our community initiatives. Provide those most in need with easier access to affordable and healthy food
Number of community food gardens established to date
100 — —
Working for a clean and healthy environment
We continue to embed sustainability across our operations, driving efficiency and exploring new opportunities for our business. We continue to see significant energy and cost savings as a result of ongoing in-store efficiency initiatives and optimisation of our logistics network.We have intensified our efforts on waste management and are also starting to address environmental challenges within our wider supplier network.
We have reduced our carbon footprint by 4.94% compared to our 2012 footprint. Our store energy intensity has improved by 8.8%.
Food which has reached its sell-by date, but is still safe to consume, is donated to Foodbank South Africa. During 2012, Pick n Pay donated 1.26 million tonnes of food to Foodbank.
Our development of eco-friendly stores and ongoing commitment to climate change education was recognised when Pick n Pay received the Climate Change Leadership award in the retail category.
Continuing to reduce our consumption and impact on natural resources as the business expands.
Reduce the environmental impact of our operations
% reduction in carbon footprint (2010 baseline) 10.1 5.5* 6.0
Store energy intensity (KWh/sqm) 431 472 528
Tonnes of waste recycled 13 611 12 456 6 444
Carbon footprint (Scope 1&2) (Tonnes CO2)
577 289 607 156* 602 782**
Enhancing sustainable governance and accountability
Governance and accountability ensure compliance with existing and emerging codes of good governance, and develops trust and accountability between stakeholders. We are increasing our engagement with stakeholders on ESG issues.
Our CDP Carbon Action Programme score improved from 86 to 96 and we were placed in performance band B.
We are included in the JSE 100 Carbon Disclosure Leadership index for 2012.
A comprehensive sustainability communications strategy has streamlined our engagement with stakeholders on ESG issues.
Enhancing ESG data management through our Executive Scorecard and aligning with an increasing number of external guidance bodies.
Consolidate a robust, audited sustainability performance management system
JSE SRI listing Listed Listed Listed
Carbon Disclosure Leadership Index Score (JSE Top 100)
Included on 2012
96
Includedon 2011
86
Includedon 2010
77
* Emissions increase in FY12 due to boundary change** The figure for scope 1 and scope 2 CO2 emissions in 2011 was based on a limited scope that excluded a number of facilities and gas types. It is currently
being recalculated to allow for a more accurate year-on-year comparison of CO2 emissions

30 2013 Integrated Annual Report
Pick n Pay A4 IAR_2013_FRONT_Proof 23 – 31 MAY 2013
Corporate governance
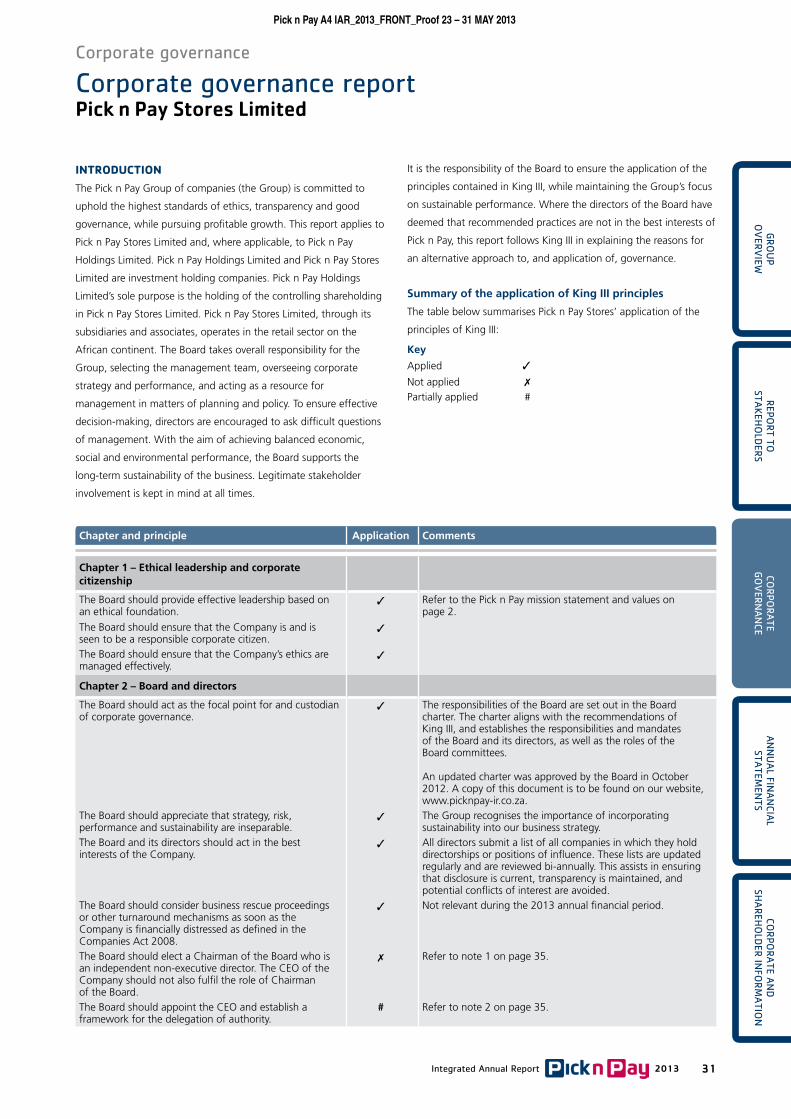
31 Integrated Annual Report 2013
Pick n Pay A4 IAR_2013_FRONT_Proof 23 – 31 MAY 2013R
epoR
t to
stAk
eho
ldeR
sCo
Rpo
RA
te G
oV
eRN
AN
CeA
NN
UA
l fINA
NCIA
l stA
temeN
tsG
Ro
Up
oV
eRV
Iew
Corporate governance
CoR
poR
Ate A
Nd
sh
AR
eho
ldeR
INfo
Rm
AtIo
N
Corporate governance reportPick n Pay Stores Limited
IntroductIonThe Pick n Pay Group of companies (the Group) is committed to
uphold the highest standards of ethics, transparency and good
governance, while pursuing profitable growth. This report applies to
Pick n Pay Stores Limited and, where applicable, to Pick n Pay
Holdings Limited. Pick n Pay Holdings Limited and Pick n Pay Stores
Limited are investment holding companies. Pick n Pay Holdings
Limited’s sole purpose is the holding of the controlling shareholding
in Pick n Pay Stores Limited. Pick n Pay Stores Limited, through its
subsidiaries and associates, operates in the retail sector on the
African continent. The Board takes overall responsibility for the
Group, selecting the management team, overseeing corporate
strategy and performance, and acting as a resource for
management in matters of planning and policy. To ensure effective
decision-making, directors are encouraged to ask difficult questions
of management. With the aim of achieving balanced economic,
social and environmental performance, the Board supports the
long-term sustainability of the business. Legitimate stakeholder
involvement is kept in mind at all times.
It is the responsibility of the Board to ensure the application of the
principles contained in King III, while maintaining the Group’s focus
on sustainable performance. Where the directors of the Board have
deemed that recommended practices are not in the best interests of
Pick n Pay, this report follows King III in explaining the reasons for
an alternative approach to, and application of, governance.
Summary of the application of King III principles
The table below summarises Pick n Pay Stores’ application of the
principles of King III:
Key
Applied ✓
Not applied ✗
Partially applied #
Chapter and principle Application Comments
Chapter 1 – Ethical leadership and corporate citizenship
The Board should provide effective leadership based on an ethical foundation.
✓ Refer to the Pick n Pay mission statement and values on page 2.
The Board should ensure that the Company is and is seen to be a responsible corporate citizen.
✓
The Board should ensure that the Company’s ethics are managed effectively.
✓
Chapter 2 – Board and directors
The Board should act as the focal point for and custodian of corporate governance.
✓ The responsibilities of the Board are set out in the Board charter. The charter aligns with the recommendations of King III, and establishes the responsibilities and mandates of the Board and its directors, as well as the roles of the Board committees.
An updated charter was approved by the Board in October 2012. A copy of this document is to be found on our website, www.picknpay-ir.co.za.
The Board should appreciate that strategy, risk, performance and sustainability are inseparable.
✓ The Group recognises the importance of incorporating sustainability into our business strategy.
The Board and its directors should act in the best interests of the Company.
✓ All directors submit a list of all companies in which they hold directorships or positions of influence. These lists are updated regularly and are reviewed bi-annually. This assists in ensuring that disclosure is current, transparency is maintained, and potential conflicts of interest are avoided.
The Board should consider business rescue proceedings or other turnaround mechanisms as soon as the Company is financially distressed as defined in the Companies Act 2008.
✓ Not relevant during the 2013 annual financial period.
The Board should elect a Chairman of the Board who is an independent non-executive director. The CEO of the Company should not also fulfil the role of Chairman of the Board.
✗ Refer to note 1 on page 35.
The Board should appoint the CEO and establish a framework for the delegation of authority.
# Refer to note 2 on page 35.

32 2013 Integrated Annual Report
Pick n Pay A4 IAR_2013_FRONT_Proof 23 – 31 MAY 2013
Corporate governance
Corporate governance report continued
Pick n Pay Stores Limited
Chapter and principle Application Comments
Chapter 2 – Board and directors continued
The Board should comprise a balance of power, with a majority of non-executive directors. The majority of non-executive directors should be independent.
# Refer to note 3 on pages 35 and 36.
Directors should be appointed through a formal process. ✓ Refer to the details on the nominations committee on page 38.
The induction and ongoing training and development of directors should be conducted through formal processes.
✓ A copy of the Board charter is given to each director upon induction, as is the Memorandum of Incorporation, which also addresses certain responsibilities of the directors. In addition, directors are provided with relevant material regarding statutory and regulatory developments.
The Board should be assisted by a competent, suitably qualified and experienced Company Secretary.
✓ The Company Secretary of the Group ensures that all directors have full and timely access to the information that helps them to perform their duties and obligations properly, enabling the Board to function effectively. The Company Secretary is not a director of any of the Group’s operations and accordingly maintains an arm’s-length relationship with the Board and its directors. The Company Secretary reports to the Chief Finance Officer and has a direct channel of communication to the Chairman and the CEO.
The Company Secretary is responsible for the functions specified in section 88 of the Companies Act. Annual consideration is given by the Board to the competence, qualification and experience of the Company Secretary. At the Board meeting held in February 2013, following consideration, the appointment was affirmed.
The evaluation of the Board, its committees and the individual directors should be performed every year.
# Refer to note 4 on page 36.
The Board should delegate certain functions to well-structured committees but without abdicating its own responsibilities.
✓ The following committees were active during 2013: Social and ethics committee Audit committee Remuneration committee Nominations committee Corporate governance committee Corporate finance committee
Each committee has a formal charter which is reviewed annually by the Board. Information on each of the committees is available on www.picknpay-ir.co.za and on page 38 of this report.
A governance framework should be agreed between the Group and its subsidiary boards.
✓ Refer to the diagram on page 37.
Companies should remunerate directors and executives fairly and responsibly.
✓ Non-executive directors have no fixed terms of appointment and no employment contracts with Pick n Pay. Their fees are not linked to the Group’s financial performance, nor do they receive share options or bonuses. Executives are remunerated in terms of the remuneration policy set out on pages 41 to 47.
Companies should disclose the remuneration of each individual director and prescribed officer.
✓ Refer to the remuneration committee report on pages 41 to 47.
Shareholders should approve the Company’s remuneration policy.
✓ Shareholders approved the policy at the AGM on 15 June 2012.
Chapter 3 – Audit committee
The Board should ensure that the Company has an effective and independent audit committee.
✓ Refer to the audit committee report on pages 39 and 40.
The audit committee members should be suitably skilled and experienced independent non-executive directors.
✓ Refer to CVs on pages 16 to 18.
The audit committee should be chaired by an independent non-executive director.
✓
The audit committee should oversee integrated reporting. ✓
The audit committee should ensure that a combined assurance model is applied to provide a co-ordinated approach to all assurance activities.
# Refer to note 5 on page 36.

33 Integrated Annual Report 2013
Pick n Pay A4 IAR_2013_FRONT_Proof 23 – 31 MAY 2013R
epoR
t to
stAk
eho
ldeR
sCo
Rpo
RA
te G
oV
eRN
AN
CeA
NN
UA
l fINA
NCIA
l stA
temeN
tsG
Ro
Up
oV
eRV
Iew
Corporate governance
CoR
poR
Ate A
Nd
sh
AR
eho
ldeR
INfo
Rm
AtIo
N
Chapter and principle Application Comments
Chapter 3 – Audit committee continued
The audit committee should satisfy itself of the expertise, resources and experience of the Company’s finance function.
✓ Refer to the audit committee report on pages 39 and 40.
The audit committee should be responsible for overseeing of internal audit.
✓
The audit committee should be an integral component of the risk management process.
✓
The audit committee is responsible for recommending the appointment of the external auditor and overseeing the external audit process.
✓
The audit committee should report to the Board and shareholders on how it has discharged its duties.
✓
Chapter 4 – The governance of risk
The Board should be responsible for the governance of risk.
✓ Refer to the risk management report on pages 49 and 50.
The Board should determine the levels of risk tolerance. ✓
The risk committee or audit committee should assist the Board in carrying out its risk responsibilities.
✓
The Board should delegate to management the responsibility to design, implement and monitor the risk management plan.
✓
The Board should ensure that risk assessments are performed on a continual basis.
✓
The Board should ensure that frameworks and methodologies are implemented to increase the probability of anticipating unpredictable risks.
✓
The Board should ensure that management considers and implements appropriate risk responses.
✓
The Board should ensure continual risk monitoring by management.
✓
The Board should receive assurance regarding the effectiveness of the risk management process.
✓
The Board should ensure that there are processes in place enabling complete, timely, relevant, accurate and accessible risk disclosure to stakeholders.
✓
Chapter 5 – The governance of information technology
The Board should be responsible for information technology (IT) governance.
✓ Refer to note 6 on page 36.
The Board, through its audit committee, risk management and executive reporting, takes responsibility for IT governance. The management of IT systems has been delegated to the Deputy CEO.
IT should be aligned with the performance and sustainability objectives of the Company.
✓ IT systems at Pick n Pay are aligned with the strategy, objectives and reporting requirements of the Company.
The Board should delegate to management the responsibility for the implementation of an IT governance framework.
✓ The management of IT governance has been delegated to the Deputy CEO who implements governance structures, systems and controls through the IT governance function.
The Board should monitor and evaluate significant IT investments and expenditure.
✓ The Board annually considers and approves all IT investment and expenditure.
IT should form an integral part of the Company’s risk management.
✓ Pick n Pay’s IT systems form part of the internal and annual external audit programme, which also considers risks to the Group. The IT systems governance function is developing a risk management framework to focus and manage IT-specific risks.

34 2013 Integrated Annual Report
Pick n Pay A4 IAR_2013_FRONT_Proof 23 – 31 MAY 2013
Corporate governance
Corporate governance report continued
Pick n Pay Stores Limited
Chapter and principle Application Comments
Chapter 5 – The governance of information technology continued
The Board should ensure that information assets are managed effectively.
✓ Pick n Pay has policies and procedures to manage the storage, control, monitoring and confidentiality of all data. Policies and procedures are continually monitored and improved where necessary.
A risk committee and audit committee should assist the Board in carrying out its IT responsibilities.
✓ IT audit items and risks are regularly reported to the Group audit committee, which reviews these risks according to the Group’s risk appetite.
Chapter 6 – Compliance with laws, rules, codes and standards
The Board should ensure that the Company complies with applicable laws and considers adherence to non-binding rules, codes and standards.
✓ Refer to the legal report on page 51.
The Board and each individual director should have a working understanding of the effect of the applicable laws, rules, codes and standards on the Company and its business.
✓
Compliance risk should form an integral part of the Company’s risk management process.
✓
The Board should delegate to management the implementation of an effective compliance framework and processes.
✓
Chapter 7 – Internal audit
The Board should ensure that there is an effective risk-based internal audit.
✓ Refer to the audit committee report on pages 49 and 50.
Internal audit should follow a risk-based approach to its plan.
✓
Internal audit should provide a written assessment of the effectiveness of the Company’s system of internal controls and risk management.
✓
The audit committee should be responsible for overseeing internal audit.
✓
Internal audit should be strategically positioned to achieve its objectives.
✓
Chapter 8 – Governing stakeholder relationships
The Board should appreciate that stakeholders’ perceptions affect a Company’s reputation.
✓ Refer to engaging with our stakeholders on pages 10 and 11.
The Board should delegate to management to proactively deal with stakeholder relationships.
✓
The Board should strive to achieve the appropriate balance between its various stakeholder groupings, in the best interests of the Company.
✓
Companies should ensure the equitable treatment of shareholders.
✓
Transparent and effective communication with stakeholders is essential for building and maintaining their trust and confidence.
✓
The Board should ensure that disputes are resolved as effectively, efficiently and expeditiously as possible.
✓
Chapter 9 – Integrated reporting and disclosure
The Board should ensure the integrity of the Company’s integrated report.
✓ The audit committee reviews the annual financial statements, and the Integrated Report makes a recommendation to the Board for approval.
Sustainability reporting and disclosure should be integrated with the Company’s financial reporting.
✓
Sustainability reporting and disclosures should be independently assured.
✗ Refer to note 5 on page 36.
35 Integrated Annual Report 2013
Repo
Rt to
stA
keh
old
eRs
CoR
poR
Ate
Go
VeR
NA
NCe
AN
NU
Al fIN
AN
CIAl
stAtem
eNts
GR
oU
p o
VeR
VIew
Corporate governance
CoR
poR
Ate A
Nd
sh
AR
eho
ldeR
INfo
Rm
AtIo
N
Notes to KiNg iii priNciples
Note 1
Chairman
King III acknowledges that there may be sound reasons for a
company to appoint a Chairman who does not meet all the criteria
for independence, but requires such a company to justify this
decision and to put further checks in place to ensure no real or
perceived conflicts of interest arise.
The Ackerman family currently owns 51% of the shares in the
holding company, Pick n Pay Holdings Limited, giving them a
holding of 27.3% in the Group. Chairman, Gareth Ackerman, is not
independent by virtue of his indirect shareholding. Perceptions of
conflicts of interest may arise regarding his decisions relating to
Pick n Pay and its shareholders. Due to the resignation of the
previous CEO of the Group in February 2012, Gareth Ackerman
adopted a temporary executive role while the search for a new
CEO was undertaken.
Hugh Herman has been appointed as lead independent director
(LID) (see note 3 in relation to independence of non-executive
directors). The main function of the LID is to provide leadership and
advice to the Board when the Chairman has a conflict of interest,
without detracting from the authority of the Chairman. The LID
provides an important point of contact for the broader investment
and stakeholder community should they have concerns with the
running of the Company or potential conflicts of interest. All
members of the Board have unfettered access to the LID when
required. With the executive role of acting CEO being temporarily
fulfilled by Gareth Ackerman in the 2013 annual financial period,
the Board relied on the guidance of the LID to ensure that it fulfilled
its mandate.
Consistent with the King III guidelines, Gareth Ackerman:
Is not a member of the audit committee;
Does not chair the remuneration committee, but is a member;
and
Is not a member of the social and ethics committee.
Note 2
Chief Executive Officer
The 2013 financial period was unusual for Pick n Pay in that Gareth
Ackerman, previously non-executive Chairman of Pick n Pay Stores
Limited, assumed the role of executive Chairman. He ran the
day-to-day administration of the Group together with Richard van
Rensburg, deputy CEO, until the CEO position was filled. The CEO
vacancy arose as a result of the resignation of Nick Badminton at
the end of the 2012 annual financial period. After a worldwide
search, Richard Brasher was appointed CEO to the Group, effective
23 January 2013. Accordingly, Gareth has reverted to his position as
non-executive Chairman.
Note 3
Board composition
The Board consists of 11 directors. Of the 6 non-executive directors,
5 are independent. The remaining 5 directors are executive. Full
curricula vitae of all directors are set out on pages 16 and 17.
The Company has appointed independent, tough-minded
non-executive directors, all of whom are successful and experienced
professionals in their respective fields, have personal integrity, do
not depend financially on the directors’ fees they receive from the
Company, and strive to preserve their reputation for independence
and governance in corporate South Africa.
The composition of the Board is continually reviewed to ensure the
correct balance is achieved. The nominations committee is looking
for a suitable candidate to replace Alex Mathole as an independent
non-executive director. Alex resigned in order to avoid a possible
conflict of interest arising as a result of her new executive position
with a major supplier to the Group. In addition, to promote
succession planning on the Board, the nominations committee is
considering additional candidates. Consideration is given to
candidates who will ensure a balance of skills and experience on the
Board. Strength of character is a key consideration, to negate any
perception that the controlling shareholder dominates any decision
making, to promote rigorous debate, to reduce the possibility of
conflicts of interest and to promote objectivity.
Board function
The Board debates issues vigorously and decisions are usually
made by consensus. All Board members, including those who are
not independent, are well aware of corporate governance
requirements, and are conscious of their obligation to act with
integrity as representatives of all stakeholders in the Group.
Controlling shareholder representation on the Board
As representatives of the controlling shareholder, Gareth Ackerman,
Suzanne Ackerman-Berman, Jonathan Ackerman and David Robins
were nominated and elected by the shareholders at the AGM to the
Board. Between them they have 59 years’ executive experience in
the Group. Suzanne and Jonathan are executive directors, while
David was an executive for 14 years and has been a non-executive
director since 2008. The Chairman, Gareth Ackerman, has been
with the Group for 20 years, the last 14 (other than an 11-month
period during the last financial period) in a non-executive capacity.
Their experience, as well as their strategic overview, assists the
Group in making long-term decisions for the benefit of all
stakeholders in the Group.

36 2013 Integrated Annual Report
Corporate governance
Corporate governance report continued
Pick n Pay Stores Limited
Note 3 continued
Executive representation on the Board
The executive function of the Group is now performed by the
executive committee, comprising Richard Brasher (CEO), Richard
van Rensburg (Deputy CEO) and Bakar Jakoet (CFO), all of whom
are executive directors on the Board.
Non-executive representation on the Board
Of the 6 non-executive directors on the Board during the 2013
annual financial period, 5 are independent. Hugh Herman has
been appointed as LID (see note 1).
Annual assessment of independence
The Board’s corporate governance charter requires that an annual
assessment of the independence of long-serving directors be
performed by considering the following:
The directors’ involvement with other companies;
External directorships;
Relationships with material suppliers and rival companies; and
Material contracts with the Group, if any.
The assessment is undertaken by the Chairman in individual
interviews. He presents his findings to each non-executive director
for them to confirm, or to provide further evidence supporting their
independence. If necessary, the Company Secretary will solicit
external legal opinion regarding the status of a non-executive
director. Following this assessment, the Chairman makes a
recommendation to the Board as to independence. The Board
interrogates the recommendations before a final decision is made.
All directors submit a list of their directorships and commercial
interests to the Company Secretary, which are regularly updated,
and distributed bi-annually to the Board. Transparency of
commercial interests ensures that directors can be seen to be free
from any business or other relationship that may interfere materially
with their ability to act in an independent manner.
Length of service
The Board has found that length of service does not automatically
preclude a director from exercising independence in decision-
making. It is our experience that our long-serving non-executive
directors have translated their loyalty into a pursuit of the best
interests of all the stakeholders of the Company. The Company
values the balance achieved between the fresh insights from new
directors and the wisdom derived from the experience of the
long-serving directors.
Conclusion as to independence
At the time of the last assessment, all Pick n Pay’s independent
non-executive directors met the criteria for independence as
established by King III, the Companies Act and the JSE Listings
Requirements. The Chairman and the Board are satisfied that,
although Hugh Herman and Ben van der Ross have long-running
relationships with the Company, their contributions remain
unbiased, objective and vigorous.
Note 4
An evaluation of the Board’s effectiveness was undertaken in March
2013. Previous evaluations were conducted in 2007, 2009 and
2011. Individual performance evaluations of directors are
undertaken annually by the Chairman of the Board. The results
allow the Board to determine whether or not it has delivered on its
mandate. It also measures and, where possible, enhances the
Board’s overall efficiency and each director’s individual contribution
to the Board. If improvements are indicated, the necessary measures
are implemented.
Note 5
The Board and audit committee are currently working with a
qualified, independent third party to assist with developing and
implementing a comprehensive combined assurance approach, to
ensure the integrity of financial and non-financial data contained
within the report.
Note 6
During the past annual financial period an IT services governance
function was established within the IT division. The IT governance
management is implementing various initiatives in order to achieve
compliance with King III where feasible.
The Group aligns its practices and processes to COBIT 5, which is
the latest edition of ISACA’s globally accepted framework, providing
an end-to-end business view of the governance of enterprise IT.

37 Integrated Annual Report 2013
Repo
Rt to
stA
keh
old
eRs
CoR
poR
Ate
Go
VeR
NA
NCe
AN
NU
Al fIN
AN
CIAl
stAtem
eNts
GR
oU
p o
VeR
VIew
Corporate governance
CoR
poR
Ate A
Nd
sh
AR
eho
ldeR
INfo
Rm
AtIo
N
goverNaNce structure
The Board governs decision-making and gives leadership through its committee structure. The committees operate within Board mandates,
ensuring that strategy is implemented through the operations of the Group. Progress is reported to the Board.
Pick n Pay Holdings Limited 6 directors and 3 alternate directors
1.
Audit committee3 directors
Pick n Pay Stores Limited 11 directors
2.
Corporate finance committee
2 directors
Audit committee3 directors
3.
Remuneration committee
3 directors
4.
Pick n Pay executive committee 7.
Social and ethics committee
2 directors
5.
Corporate governance committee
2 directors
1. Refer to the Pick n Pay Holdings Limited corporate governance report on pages 52 to 54 and Board of directors on page 18.
2. Refer to the Pick n Pay Stores Limited corporate governance report on pages 31 to 38.
3. Refer to the audit committee report on pages 39 and 40.
4. Refer to the remuneration committee report on pages 41 to 47.
5. Refer to the social and ethics committee report on page 48.
6. Refer to page 32 for composition of committees.
7. The Pick n Pay executive committee for the 2013 annual financial period consisted of Gareth Ackerman (for 11 months), Richard Brasher (CEO) (for 1 month), Richard van Rensburg (Deputy CEO) and Bakar Jakoet (CFO).
1.
6.
6.
Nominations committee
3 directors
6.

38 2013 Integrated Annual Report
Corporate governance
Corporate governance report continued
Pick n Pay Stores Limited
Directors’ attendance at Board meetings
The Board convenes a minimum of 4 times per year for formal meetings, with additional meetings scheduled when necessary. The table
below details each director’s Board meeting attendance during the past annual financial period:
Director16 April
201215 June
2012
22 and 23 October
201219 February
2013
AGM 15 June
2012
Gareth Ackerman (Chairman) P P P P PRichard Brasher (CEO)* — — — P —Richard van Rensburg (Deputy CEO) P P P P PBakar Jakoet (CFO) P P P P PSuzanne Ackerman-Berman A P P P PJonathan Ackerman P P P P PHugh Herman (LID) P P P P PBen van der Ross P P A P PJeff van Rooyen P P P P PLorato Phalatse P P P P PAlex Mathole** P P P P PDavid Robins A P P P P
P = present A = apologies * Appointed in 2013. ** Alex Mathole resigned with effect from 28 February 2013 to take up an executive position with a major supplier to the Group.
Board subcommitteesThe Board is assisted by 6 subcommittees as set out below:
Committee Roles and responsibilities
Audit committee For details on this committee, please refer to the audit committee report on pages 39 and 40.
Remuneration committee
For details on this committee, please refer to the remuneration report on pages 41 to 47.
Nominations committee
The nominations committee is chaired by Gareth Ackerman, as a representative of the controlling shareholder. The majority of the members, Lorato Phalatse and Ben van der Ross, are independent non-executive directors. Checks in place include the fact that the majority of members are independent non-executive directors, that the Board retains the authority to appoint directors recommended by the committee, and that all directors appointed by the Board are referred for election by shareholders at the earliest opportunity. The committee is responsible for identifying and evaluating suitable candidates for possible appointment to the Board. Requirements include independence, integrity, tough-mindedness and respect for the values and principles of the Group. The committee meets on an ad hoc basis. The committee identifies a list of candidates to be considered, and establishes availability, willingness and suitability. The authority to appoint directors remains with the Board. Candidates identified by the committee are interviewed by all the non-executive directors before the potential appointment is referred to the Board for a decision. Given the importance to the Group of the search for a new CEO, in this instance the nominations committee was expanded to include all non-executive directors on the Board.
Corporate governance committee
The corporate governance committee reviews and evaluates the governance practices and structures of the Group, and recommends any changes to the Board for a decision. The focus is on implementing King III’s recommendations and ensuring that the Group complies with the code of corporate practices and conduct. In addition, international standards of corporate governance are considered alongside local practices. The committee comprises Gareth Ackerman, as Chairman, and Jeff van Rooyen. The Chairman is not independent. Checks in place include the Company’s commitment to conduct its affairs in accordance with the highest standards of corporate governance, and the self-evident desire to uphold the proud record of the Ackerman family in the history of South African corporate governance and social responsibility. The committee meets with the Company Secretary and relevant members of the Board and management, as required, ensuring that corporate governance structures are appropriate and effective.
Corporate finance committee
The Company has formed the corporate finance committee to ensure that the interests of all shareholders are taken into account when investment decisions are made. Authority to accept or reject investment opportunities remains with the Board. Meeting on an ad hoc basis, this committee assists the Board in assessing investment opportunities for the Pick n Pay Group. Chaired by Jeff van Rooyen, the committee comprises independent non-executive directors.
Social and ethics committee
For details on this committee, please refer to the social and ethics committee report on page 48.

39 Integrated Annual Report 2013
Repo
Rt to
stA
keh
old
eRs
CoR
poR
Ate
Go
VeR
NA
NCe
AN
NU
Al fIN
AN
CIAl
stAtem
eNts
GR
oU
p o
VeR
VIew
Corporate governance
CoR
poR
Ate A
Nd
sh
AR
eho
ldeR
INfo
Rm
AtIo
N
Audit committee reportPick n Pay Stores Limited
The audit committee is pleased to present this report as required
by the Companies Act, 2008. The audit committee is a formal
committee of the Board and functions within an approved charter
and complies with all relevant legislation, regulation and
governance codes.
role of the committee
The audit committee has an independent role with accountability to
both the Board and to shareholders. The committee’s responsibilities
include the statutory duties prescribed by the Companies Act 2008,
activities recommended by King III and the responsibilities assigned
by the Board.
The committee’s main responsibilities are as follows:
Integrated and financial reporting
Review the annual financial statements, interim report,
preliminary results announcement, summarised annual financial
statements and the Integrated Annual Report, and ensure
compliance with International Financial Reporting Standards
and the Companies Act 2008.
Review and approve the appropriateness of accounting policies,
disclosure policies and the effectiveness of internal financial
controls.
Perform a review of the Group’s integrated reporting function
and progress and consider factors and risks that could impact
the integrity of the Integrated Annual Report.
Review the sustainability disclosure in the Integrated Annual
Report and ensure that it is consistent with financial information
reported.
Recommend the approval of the Integrated Annual Report to
the Board.
Finance function
Consider the expertise and experience of the Chief Finance
Officer.
Consider the expertise, experience and resources of the Group’s
finance function.
Internal audit
Review and approve the internal audit charter and audit plans.
Evaluate the independence, effectiveness and performance of
the internal audit function and compliance with its mandate.
Review the Group’s systems of internal control, including financial
controls, ensuring that management is adhering to and
continually improving these controls.
Review significant issues raised by the internal audit process.
Review policies and procedures for preventing and
detecting fraud.
External audit
Act as a liaison between the external auditors and the Board.
Nominate the external auditor for appointment by shareholders.
Determine annually the scope of audit and non-audit services
which the external auditors may provide to the Group.
Approve the remuneration of the external auditors and assess
their performance.
Assess annually the independence of the external auditors.
Risk management
Ensure that management’s processes and procedures are
adequate to identify, assess, manage and monitor enterprise-
wide risks.
Review tax and technology risks, in particular how they
are managed.
General
Receive and deal appropriately with any complaint relating
to the accounting practices and internal audit of the Group or
to the content or auditing of its financial statements, or to any
related matter.
Perform other functions as determined by the Board.
compositioN of the committee
This committee is chaired by and comprises only independent
non-executive directors. In accordance with the requirements of
the Companies Act 2008, members of the committee are appointed
annually by the Board for the ensuing financial period and in
compliance with King III are appointed by shareholders at
the annual general meeting.
The committee has a charter which is reviewed and approved
by the Board annually.
The composition of the committee and meeting attendance is
as follows:
Committee member Status 16 April
201215 October
2012
Jeff van Rooyen (Chairman)
Independent non-executive director
P P
Hugh Herman Independent non-executive director
P P
Alex Mathole* Independent non-executive director
P P
Ben van der Ross Independent non-executive director
P A
P = presentA = apologies* Resigned on 28 February 2013.

40 2013 Integrated Annual Report
Corporate governance
Audit committee report continued
Pick n Pay Stores Limited
The committee discharges its Board responsibilities by:
Meeting at least twice a year to review the Group’s financial
results, to receive and review reports from both the internal and
external auditors, and to meet with management to review their
progress on identifying and addressing key risk areas within
the business;
Reporting to the Board at the next meeting, which is always
held within a week of the respective committee meeting;
Meeting separately with the internal and external auditors to
confirm they are receiving the full co-operation of management;
and
The committee Chairman meets regularly with key executives to
keep abreast of emerging issues.
The committee discharges all audit committee responsibilities of all
the subsidiary companies within the Group. To help it discharge this
responsibility, financial review committees, chaired by the Chief
Finance Officer, reviews, in detail, the results of all material
operating subsidiary companies with the external auditors and
management of the respective subsidiary. These review committees
report their findings to the Group audit committee.
The external and internal auditors have unrestricted access to the
committee and all of its members throughout the period.
iNdepeNdeNce of exterNal auditors
The audit committee is satisfied as to the independence of the
Group’s external auditors, KPMG Inc., and its respective audit
partners. The committee nominates KPMG as external auditor for
the appointment by shareholders at the annual general meeting.
policY oN NoN-audit services
All non-audit services provided by the Group’s external auditors are
pre-approved by the audit committee. The total fee for non-audit
services provided should not, under normal circumstances, exceed
50% of the total auditor’s remuneration.
expertise aNd experieNce of chief fiNaNce officer aNd fiNaNce fuNctioN
The audit committee is satisfied that Bakar Jakoet has the
appropriate expertise and experience for his position of Chief
Finance Officer of the Group. In addition, the committee is also
satisfied that the composition, experience and skills of the finance
function meet the Group’s requirements.
approval of the audit committee report
The committee confirms that it has functioned in accordance with
its charter for the 2013 financial period and that its report to
shareholders has been approved by the Board.
Jeff van Rooyen
Chairman: Audit committee
22 April 2013

41 Integrated Annual Report 2013
Repo
Rt to
stA
keh
old
eRs
CoR
poR
Ate
Go
VeR
NA
NCe
AN
NU
Al fIN
AN
CIAl
stAtem
eNts
GR
oU
p o
VeR
VIew
Corporate governance
CoR
poR
Ate A
Nd
sh
AR
eho
ldeR
INfo
Rm
AtIo
N
Remuneration committee reportPick n Pay Stores Limited
This report sets out the Group’s remuneration policy, the role of the remuneration committee, the remuneration structure of the Group, the remuneration and benefits granted to key executives during the 2013 annual financial period as well as the procedures followed in ensuring that remuneration practices adhere to appropriate corporate governance principles and in ensuring alignment with the Group’s strategy. This report and the recommendations of the remuneration committee have been approved by the Board and will be submitted to shareholders for consideration at the AGM to be held on 25 June 2013.
remuNeratioN policYThe Group’s remuneration policy is aimed at attracting, retaining and motivating employees and executives, while at the same time aligning their remuneration with shareholder interests and best practice. The remuneration policy is based on the following underlying principles:
Remuneration at all levels is benchmarked to ensure that it is fair and just; An independent expert attends remuneration committee meetings to assist in benchmarking; Employees and executives are rewarded for meeting key performance targets; Remuneration levels for executive directors take into account remuneration policies and practices of comparable companies; Executive remuneration must be balanced between long-term and short-term incentives; and Non-executive directors do not receive remuneration or incentive awards related to share price or corporate performance.
remuNeratioN committeeThe remuneration committee, which meets at least twice a year, is chaired by an independent non-executive director and comprises mainly non-executive directors. The committee operates in terms of a Board-approved charter and its key responsibilities are to:
Determine the remuneration packages of executive directors and to review the remuneration packages of senior management and key employees; Propose fees for non-executive directors, subject to shareholder approval; Approve performance-related short-term incentives as well as long-term share-based incentives; and Review the Group’s remuneration philosophy and policies to ensure alignment with market practices.
Remuneration activities and decisions taken during the 2013 annual financial periodThe main items considered and approved by the remuneration committee during the 2013 annual financial period were:
Executive and non-executive director remuneration benchmarking; Annual salary increases for executives; Remuneration package for the incoming CEO; Remuneration package for the non-executive Chairman for the 2014 annual financial period; Review of the Group’s short-term incentive scheme; Review and approval of the Group’s remuneration policy and report; and Review and approval of proposed non-executive directors’ fees for the 2014 annual financial period.
The composition of the committee and meeting attendance is as follows:
Director Status12 April
201220 October
2012
Hugh Herman (Chairman)
Independent non-executive director
P P
Gareth Ackerman Chairman P PBen van der Ross Independent
non-executive director
P P
P = present
Remuneration structure Remuneration comprises the following elements:
Base payExecutive directorsExecutive directors’ base pay is benchmarked to information disclosed in the remuneration reports of comparative organisations. The annual remuneration of executive directors is directly related to individual performance ratings and is reviewed in April each year. The performance of the CEO is assessed by the Chairman and the Board, while the performance of the other executive directors is evaluated by the CEO and reviewed by the remuneration committee.
Management and employeesThe remuneration committee reviews the salaries of senior management annually. Remuneration reflects the relative skill, experience, contribution and performance of the individual. Base pay is set at levels which are competitive with the rest of the market so that the Group can attract, motivate and retain the right calibre of people to achieve the Group’s strategic business objectives. Annual increases in base pay are determined with reference to the scope of the employee’s role, the competence and performance of the employee as well as the projected consumer price index (CPI) figures. If approved, annual increases are effective in June each year.
Retirement and medicalPick n Pay contributes a total of 17.35% of salary towards retirement funding of executive directors and employees. In addition, the Company also contributes towards medical aid. For further details please refer to pages 94 and 95 of the annual financial statements where retirement benefits are disclosed.
Company car allowances Executive directors and management are granted a travel allowance or the use of a Company vehicle which includes service maintenance, fuel and insurance.
Low-interest housing loansSalaried employees are granted low-interest loans for the purpose of acquisition of residential property. Interest rates average 3.3%.
The value of executive directors’ low interest loans at period end is R0.4 million.
Short-term incentive scheme (profit-sharing scheme)Executives and management participate in the Group’s short-term incentive scheme. Bonuses awarded to executives and management are linked to the achievement of net profit growth hurdles as well as individual performance as measured through the Group’s annual

42 2013 Integrated Annual Report
Corporate governance
performance appraisal process. Bonuses are paid as a multiple of basic monthly salary, with multiples varying at the various hurdle levels. Bonuses awarded to executives are capped at 2 times annual basic salary.
The short-term incentive scheme mitigates the risk that management focus attention on managing the share price rather than the business, thus protecting the dividend flow for all shareholders.
All bonuses paid to management and executives are subject to approval by the remuneration committee. No bonuses were paid during the 2013 annual financial period as the Group did not meet its targets. Long-term incentive scheme (Employee Share Scheme)
The Group operates the 1997 Employee Share Option Scheme (the Scheme) in order to facilitate broad-based employee share ownership and to foster trust and loyalty among employees. The Scheme incentivises key management and employees by providing them with an opportunity to acquire shares in the Group, thereby aligning interests with shareholders and encouraging employee retention.
The long-term incentive scheme ensures that interests are aligned with shareholders relating to capital growth in share value.
Long-service share options – are granted to all permanent employees who have been with the Group for 5 years and further options are granted every 5 years thereafter. Long-service share options may be taken up immediately on granting.
During the financial period under review 3.1 million Pick n Pay Holdings Limited (PWK) share options were granted to employees in respect of long service, and at period end 13.9 million PWK share options are held by employees amounting to 2.6% of shares in issue.
Status share options – are granted to employees who attain manager status and further options are granted at each promotion to higher levels of management. In order to encourage employee retention, status shares vest in 3 tranches as follows:40% after 3 years30% after 5 years30% after 7 years
During the financial period under review 6 million Pick n Pay Stores Limited (PIK) options were issued to management, and at period end 52.8 million PIK share options are held by employees amounting to 11% of shares in issue.
Binary shares – are granted to key executives. These 3- to 5-year options may only be taken up when prescribed performance conditions linked to the growth of the PIK share price are met. If the conditions are not met, these options are automatically forfeited. Should further performance hurdles be achieved, discounted grant prices may apply. There are currently 3 binary share schemes in issue. The first was issued in October 2010 to senior executives, the second in October 2011 to deputy CEO Richard van Rensburg and the third to CEO Richard Brasher.
October 2010 binary issue – The salient features are as follows:
Grant date:October
2010
Grant price: R41.23
Exercise dateMay 2014
Annual compound
growth rateExercise
price
Eligibility hurdle R65.28 12% R41.23Performance hurdle 1 R78.87 18% R20.62Performance hurdle 2 R97.25 25% R1.00
If the 20-day volume weighted average share price (VWAP) up to 23 May 2014 is R65.28 or greater, the options can be exercised at the full grant price of R41.23. Should this 20-day VWAP be less than R65.28, then the options will lapse. Thereafter, if performance hurdles are met, the discounted grant prices will apply on exercise.
Binary issue to deputy CEO Richard van Rensburg – The salient features are as follows:
Grant date:October
2011
Grant price: R36.55
Exercise dateMay 2015
Annual compound
growth rateExercise
price
Eligibility hurdle R73.11 20% R36.55Performance hurdle 1 R93.07 30% R18.28Performance hurdle 2 R121.56 40% R1.00
If the 20-day volume weighted average share price (VWAP) up to 23 May 2015 is R73.11 or greater, the options can be exercised at the full grant price of R36.55. Should this 20-day VWAP be less than R73.11, then the options will lapse. Thereafter, if performance hurdles are met, the discounted grant prices will apply on exercise.
Binary issue to CEO Richard Brasher – The salient features are as follows:
Grant dateNovember
2012
Grant price: R42.24
Exercise dateNovember
2017
Annual compound
growth rateExercise
price
Eligibility hurdle R68.03 10% R42.24Performance hurdle 1 R84.96 15% R21.12Performance hurdle 2 R128.91 25% R1.00
If the 20-day volume weighted average share price (VWAP) up to 14 November 2017 is R68.03 or greater, the options can be exercised at the full grant price of R42.24. Should this 20-day VWAP be less than R68.03, then the options will lapse. Thereafter, if performance hurdles are met, the discounted grant prices will apply on exercise.
Remuneration committee report continued
Pick n Pay Stores Limited

43 Integrated Annual Report 2013
Repo
Rt to
stA
keh
old
eRs
CoR
poR
Ate
Go
VeR
NA
NCe
AN
NU
Al fIN
AN
CIAl
stAtem
eNts
GR
oU
p o
VeR
VIew
Corporate governance
CoR
poR
Ate A
Nd
sh
AR
eho
ldeR
INfo
Rm
AtIo
N
Share options granted to directors
Calendar year
granted
Option grant price
R
Balance held at
1 March 2012
Granted during
the period
Balance held at
3 March 2013
Available for
take-up
Jonathan Ackerman 2005 20.70 6 441 6 441 Now
2006 28.00 14 286 14 286 Now
2007 31.15 14 446 14 446 Now
2008 26.56 9 414 9 414 Now
26.14 25 000 25 000 Aug 2015
26.14 25 000 25 000 Aug 2016
26.14 25 000 25 000 Aug 2017
26.14 25 000 25 000 Aug 2018
2009 28.20 6 207 6 207 Now
28.20 2 660 2 660 Apr 2013
2010 42.27 624 624 Now
42.27 468 468 Apr 2013
42.27 468 468 Apr 2014
41.23 400 000* 400 000* May 2014
555 014 555 014
Suzanne Ackerman-Berman 2004 21.00 10 000 10 000 Now
2006 31.15 60 000 60 000 Now
31.15 60 000 60 000 Apr 2014
2007 31.15 2 408 2 408 Now
2008 26.56 2 259 2 259 Now
26.56 2 260 2 260 Now
26.14 25 000 25 000 Aug 2015
26.14 25 000 25 000 Aug 2016
26.14 25 000 25 000 Aug 2017
26.14 25 000 25 000 Aug 2018
2009 28.20 6 207 6 207 Now
28.20 2 660 2 660 Apr 2013
2010 42.27 569 569 Now
42.27 426 426 Apr 2013
42.27 426 426 Apr 2014
41.23 400 000* 400 000* May 2014
647 215 647 215
Richard Brasher 2012 42.24 — 333 334 333 334 Nov 2015
42.24 — 333 333 333 333 Nov 2017
42.24 — 333 333 333 333 Nov 2019
42.24 — 1 000 000* 1 000 000* Nov 2017
— 2 000 000 2 000 000
* The exercising of these binary options is subject to specific performance criteria relating to the growth of the Company’s share price over the term of the option. If the share price performance criteria are not met, the options are forfeited.

44 2013 Integrated Annual Report
Corporate governance
Remuneration committee report continued
Pick n Pay Stores Limited
Share options granted to directors continued
Calendar year
granted
Option grant price
R
Balance held at
1 March 2012
Granted during
the period
Balance held at
3 March 2013
Available for
take-up
Bakar Jakoet 2003 12.00 250 000 250 000 Now2007 31.15 5 779 5 779 Now2008 26.55 3 954 3 954 Now
26.55 3 953 3 953 Now26.14 60 000 60 000 Now26.14 45 000 45 000 Aug 201326.14 45 000 45 000 Aug 2015
2009 28.20 8 689 8 689 Now28.20 3 724 3 724 Apr 2013
2010 42.28 719 719 Now42.28 540 540 Apr 201342.28 540 540 Apr 201441.23 500 000* 500 000* May 2014
2011 41.70 200 000 200 000 Apr 201441.70 300 000 300 000 Apr 2016
1 427 898 1 427 898Richard van Rensburg 2011 36.55 400 000* 400 000* May 2015
400 000 400 000* The exercising of these binary options is subject to specific performance criteria relating to the growth of the Company’s share price over the term of the
option. If the share price performance criteria are not met, the options are forfeited.
Directors’ interest in shares – all held beneficially
2013How held**
Balance held at
1 March 2012
Additions during
the period
Average purchase price per
share R
Disposals during
the period
Average selling
price per share R
Balance held at
3 March 2013
Gareth Ackerman direct 43 43 Jonathan Ackerman direct 43 43 Suzanne Ackerman-Berman direct 2 500 2 500
indirect 4 651 4 651 Bakar Jakoet direct 500 000 500 000 David Robins direct 74 108 (74 108) 40.23 —
indirect 224 000 (224 000) 40.34 —
2012How held**
Balance held at
1 March 2011
Additions during
the period
Average purchase price per
share R
Disposals during
the period
Average selling
price per share R
Balance held at
29 February 2012
Gareth Ackerman direct 43 43 Jonathan Ackerman direct 43 43 Suzanne Ackerman-Berman direct 2 500 2 500
indirect 4 651 4 651 Nick Badminton‡ direct 630 000 149 478 43.30 779 478
indirect 350 000 350 000Bakar Jakoet direct 500 000 500 000 David Robins direct 74 108 74 108
indirect 333 604 (109 604) 46.07 224 000
** Direct interests represent a holding in the director’s personal capacity and indirect interests represent a holding by a family trust of which the director is a trustee.
‡ Resigned 29 February 2012.

45 Integrated Annual Report 2013
Repo
Rt to
stA
keh
old
eRs
CoR
poR
Ate
Go
VeR
NA
NCe
AN
NU
Al fIN
AN
CIAl
stAtem
eNts
GR
oU
p o
VeR
VIew
Corporate governance
CoR
poR
Ate A
Nd
sh
AR
eho
ldeR
INfo
Rm
AtIo
N
Remuneration and benefits awarded to directors
2013
Fees for board
meetingsR’000
Fees for committee and other
workR’000
Remune-rationR’000
Retirement and
medical contri-
butionsR’000
Fringe and other
benefitsR’000
TotalR’000
Expense relating to
share options granted
R’000
Non-executive directorsGareth Ackerman* 349.7 349.7Hugh Herman 300.0 459.0 759.0Alex Mathole** 300.0 100.0 400.0Lorato Phalatse 300.0 165.0 465.0David Robins 300.0 300.0Ben van der Ross 300.0 294.0 594.0Jeff van Rooyen 300.0 400.0 700.0
2 149.7 1 418.0 — — — 3 567.7 —Executive directorsGareth Ackerman* 1.5 3 100.3 254.4 3 356.2Jonathan Ackerman 1.5 2 170.2 333.6 47.2 2 552.5 969.0Suzanne Ackerman-Berman 1.5 2 202.3 325.2 16.0 2 545.0 1 057.4Richard Brasher*** 1.5 838.9 134.5 140.0 1 114.9 413.7Bakar Jakoet 1.5 2 551.0 409.6 227.2 3 189.3 1 900.2Richard van Rensburg 1.5 3 940.8 49.2 3 991.5 1 603.3
9.0 — 14 803.5 1 202.9 734.0 16 749.4 5 943.6Total remuneration 2 158.7 1 418.0 14 803.5 1 202.9 734.0 20 317.1 5 943.6
2012
Non-executive directorsGareth Ackerman 3 000.0 3 000.0Hugh Herman 280.0 336.5 616.5Alex Mathole 280.0 145.0 425.0Lorato Phalatse 280.0 116.3 396.3David Robins 280.0 280.0Ben van der Ross 280.0 181.5 461.5Richard van Rensburg 220.2 220.2Jeff van Rooyen 280.0 285.0 565.0
4 900.2 1 064.3 — — — 5 964.5 —Executive directorsJonathan Ackerman 1.5 1 868.2 311.7 252.8 2 434.2 985.5Suzanne Ackerman-Berman 1.5 2 006.4 298.6 29.2 2 335.7 1 190.2Nick Badminton^ 1.5 3 919.6 646.3 10 392.3 14 959.7 3 683.7Dennis Cope# 1.5 400.0 30.6 432.1 77.1Bakar Jakoet¥ 1.5 1 947.9 311.1 732.7 2 993.2 1 233.1Richard van Rensburg 1 400.0 1 400.0 1 900.0
7.5 — 11 542.1 1 567.7 11 437.6 24 554.9 9 069.6Total remuneration 4 907.7 1 064.3 1 1542.1 1 567.7 11 437.6 30 519.4 9 069.6
* Performed a dual role of Chairman and acting CEO until the appointment of Richard Brasher.** Resigned 28 February 2013.*** Appointed to the Board as CEO during 2013 and received remuneration from this date. Prior to this appointment, Richard Brasher received contractor fees
of R897 489 and the Group paid for his relocation costs of R971 447. Both these costs are not included in his remuneration. Appointed as deputy CEO, effective 1 October 2011; received remuneration as an executive director from this date.^ Resigned 29 February 2012. Fringe and other benefits include a restraint of trade payment of R10.1 million.# Retired 29 April 2011.¥ Appointed 29 April 2011 – remuneration included from this date.
No performance bonuses were paid due to the performance of the Group.

46 2013 Integrated Annual Report
Corporate governance
Remuneration committee report continued
Pick n Pay Stores Limited
Remuneration of Chief Executive Officer
Richard Brasher was appointed as CEO of the Group in 2013. He
will be paid an annual base salary of R7 million, will receive a
company car allowance and the Company will contribute towards
the medical aid scheme on his behalf. He will also take part in the
Group’s short-term and long-term incentive schemes as disclosed on
pages 41 and 42. In deciding on Richard Brasher’s base pay, the
remuneration committee took into account the following factors:
Over 26 years of experience in the retail industry;
Former CEO of Tesco UK/Republic of Ireland; and
Instrumental in transforming Tesco into the market share leader
in the United Kingdom and into a global retailer.
The remuneration committee benchmarked our new CEO’s base
salary against similar sized South African companies and his salary
is considered fair in relation to the market and his expertise.
Prescribed officers
The Board is wholly responsible for the formulation, development
and effective implementation of Group strategy. In turn, the Board
delegates operational strategy implementation and general
executive management of the business to its executive directors.
As such, in terms of section 38 of the Companies Act 2008, the
executive directors of the Board are identified as prescribed officers,
and their remuneration is detailed on page 45.
Top 3 earners
In accordance with King III, we disclose below the top 3 earners of the Group, excluding executive directors, identified by the total
remuneration awarded including the IFRS 2 value of share options granted.
2013
Remune-rationR’000
Retirementand medical
contributionsR’000
Bonus*
R’000
Fringeand other
benefitsR’000
Cashtotal
R’000
Expense relating to shareoptionsgranted
R’000
Executive 1 3 002.3 459.0 — 12.4 3 473.7 570.9Executive 2 2 691.2 391.0 — 61.3 3 143.5 985.6Executive 3 2 668.4 375.9 — 37.3 3 081.6 1 450.4Total remuneration 8 361.9 1 225.9 — 111.0 9 698.8 3 006.9
2012
Executive 1 1 899.0 347.9 1 540.0 260.9 4 047.8 1 206.4Executive 2 2 681.1 429.4 — 177.6 3 288.1 628.7Executive 3 2 604.0 67.7 382.0 70.0 3 123.7 —Total remuneration 7 184.1 845.0 1 922.0 508.5 10 459.6 1 835.1
* The bonus relates to the amount provided in the financial periods.
Non-executive directors’ fees
In respect of non-executive directors, the remuneration committee
proposes fees to be paid for the membership of Board and Board
committees. Such fees are market-related, commensurate with the
time required to undertake their duties and must be approved by
the Board and shareholders. Approved fees are set for the annual
financial period. Fees are not subject to attendance at meetings as
attendance at Board meetings is generally very good.
Remuneration is not linked to the performance of the Group or
share performance. Non-executive directors do not receive
performance-related bonuses and are not granted share options.
The fees for the 2013 annual financial period were approved by
shareholders at the AGM held on 15 June 2012. The proposed
fees for the 2014 annual financial period will be submitted to
shareholders for approval at the AGM to be held on 25 June 2013.
Remuneration of non-executive Chairman for the
2014 annual financial period
Gareth Ackerman received a fee of R3 450 000 in his role as
Chairman and acting CEO for the 2013 annual financial period
while the Group conducted its search for a new CEO. The
remuneration committee has proposed that his fee remain
unchanged for the 2014 annual financial period. His role has
reverted to that of non-executive Chairman for the 2014 annual
financial period. Gareth is active in corporate governance issues and
the overarching strategy for the companies in the Group. He is not
involved in the day-to-day executive administration of the business,
but holds himself available to contribute to the executive team if
they request his advice. In addition, Gareth is ensuring that the
CEO enjoys a smooth transition into the business.

47 Integrated Annual Report 2013
Repo
Rt to
stA
keh
old
eRs
CoR
poR
Ate
Go
VeR
NA
NCe
AN
NU
Al fIN
AN
CIAl
stAtem
eNts
GR
oU
p o
VeR
VIew
Corporate governance
CoR
poR
Ate A
Nd
sh
AR
eho
ldeR
INfo
Rm
AtIo
N
Fees for the current and proposed periods are unchanged, as follows:
Proposed 2014
R2013
R
Chairman of the Board 3 450 000 3 450 000Lead non-executive director 100 000 100 000Member of the Board 300 000 300 000Chairman of the audit committee 250 000 250 000Member of the audit committee 100 000 100 000Chairman of the remuneration committee 130 000 130 000Member of the remuneration committee 65 000 65 000Member of the nominations committee 60 000 60 000Member of the social and ethics committee 65 000 65 000Member of the corporate finance committee 100 000 100 000Trustee of employee share purchase trust 29 000 29 000
Risk management and remuneration practicesThe remuneration committee ensures that corporate governance aspects and legal requirements are met when existing remuneration policies are reviewed and new remuneration plans and policies are put in place. In doing so the committee ensures that shareholder interests are protected and reward systems and remuneration policies are aligned to the Company’s risk profile.
Hugh HermanChairman: Remuneration committee
22 April 2013

48 2013 Integrated Annual Report
Corporate governance
Social and ethics committee reportPick n Pay Stores Limited
In accordance with the provisions of the Companies Act 2008, the Group has established a social and ethics committee. The committee reports to the Board and conducts its affairs within its approved charter. It performs an oversight and monitoring role with the aim of further entrenching the culture of ethical behaviour within the Group. The Group’s principle of “doing good is good business” is the cornerstone of the work done by the committee.
role of the committeeThe committee has the following responsibilities:
To monitor the Group’s activities with regard to social and economic development, environment, health and public safety, consumer relationships, and labour and employment; To draw matters within its mandate to the attention of the Board as required; and To report to the shareholders at the Company’s annual general meeting on the matters within its mandate.
The committee meets quarterly and focuses, amongst other subjects, on the following:
Best practice examples for social and ethics committees; Ethics policies; Whistleblowing structures;
BBBEE; Employment equity; Corporate social investment; Ethical treatment of animals; Local ethical procurement; and Integrity of food products and ingredients.
As a result of our commitment to doing business in a sustainable manner, the Group has been included on the Socially Responsible Investment Index of the JSE.
compositioN of the committee The committee is chaired by executive director, Suzanne Ackerman-Berman. Her positions as Director of Transformation, Chairman of the Ackerman Pick n Pay Foundation and head of the Pick n Pay Small Business Incubator, as well as her philanthropic work, ensures that Suzanne is uniquely qualified to chair the committee. Other committee members comprise non-executive director, Lorato Phalatse, senior management and technical experts on areas of mandate. Care has been taken to ensure that management is representative of the organisation across all levels and areas of expertise.
Director representation Status11 June
201227 August
201228 November
201221 February
2013
Suzanne Ackerman-Berman Chairman and executive director P P P PLorato Phalatse Independent non-executive
directorP P P P
P = present
Pick n Pay Stores Limited
Audit committee
Operational sustainability steering committee
Executive sustainability steering
committee
3.
Sustainability team
4.
Social and ethics committee
2.
5.
Executivecommittee
Corporate governance committee
Operational implementation Oversight
1. Refer to page 37 for composition of committees.
2. The social and ethics committee provides ongoing governance and management review.
3. The executive sustainability steering committee meets on a quarterly basis to ensure alignment with the business strategy. The Board is represented on the steering committee by Suzanne Ackerman-Berman and Richard Brasher.
4. The sustainability team is tasked with co-ordinating Pick n Pay’s response to ESG challenges across all of the Company’s operations.
5. The operational sustainability steering committee consists of senior management representing each of the focus areas set out in the sustainability summary, and is responsible for implementation of the sustainability strategy.
Suzanne Ackerman-BermanChairman: Social and ethics committee22 April 2013
Sustainability governance structure
1.
1.1.
1.

49 Integrated Annual Report 2013
Repo
Rt to
stA
keh
old
eRs
CoR
poR
Ate
Go
VeR
NA
NCe
AN
NU
Al fIN
AN
CIAl
stAtem
eNts
GR
oU
p o
VeR
VIew
Corporate governance
CoR
poR
Ate A
Nd
sh
AR
eho
ldeR
INfo
Rm
AtIo
N
The Board has recognised the importance of an effective risk
management process and has adopted an enterprise-wide approach
to risk management. Risks identified are captured and rated in the
Group’s risk register.
The Board is responsible for ensuring that adequate procedures and
processes are in place to identify, assess, manage and monitor key
business risks. The Board is assisted in its responsibilities by the
audit committee, whose objective is to monitor, develop and
communicate the process for managing risk across all divisions in
the Group. The day-to-day responsibility for identifying, evaluating
and managing risk resides with management. The risk management
process, which is regularly assessed by the audit committee, involves
a formalised system to identify and assess risk, both at a strategic
and operational level. Mitigating controls, and other assurances in
identifying and assessing the risks, are continuously evaluated.
The Group’s assets are insured against loss, with cover being taken
out above predetermined self-insurance levels. In a disaster recovery
circumstance, business continuity plans will ensure the business
continues with the least amount of disruption, both from an
information technology and operational viewpoint. These plans are
reviewed and updated regularly.
A summary of major risks and mitigation strategies is presented in
the table below:
Risk management reportPick n Pay Stores Limited
Risk Risk mitigation
Strategic and market risk
Damage to brand and
reputation
The Group’s governance philosophy seeks to protect and enhance our brand and reputation. Pick n Pay
strives to maintain ethical business practices, and to achieve the highest levels of compliance
and integrity.
Increasing competition The Group continuously monitors market trends and sets its strategy accordingly, with the aim of
ensuring that Pick n Pay remains the retailer of choice.
Ability to implement and
execute strategy
All Group strategies are formally documented. Strategic progress reports are reviewed and evaluated
monthly by the executive committee and bi-annually at Board level.
Ability to manage the impact of
potential differentials in markets
identified for expansion
The Group has a measured approach to expansion into non-South African markets. The regulatory
environment and economic stability of the selected countries are carefully evaluated. Care is taken
to ensure that good relationships are developed and maintained with key government and
regulatory authorities.
Increased awareness of
green/ethical issues
Levels of customer expectations on green/ethical issues are tracked via the smartshopper survey.
The Group consistently retains a leading position in respect of “green retail” and is committed to
addressing sustainability issues. Employee awareness initiatives include energy usage and saving
initiatives such as the use of natural refrigerants over synthetic substances to reduce greenhouse-
emitting gases. World-class sustainability features, tested in our “green store”, PnP-on-Nicol, are being
implemented where appropriate throughout the Group.
Sustainable food supply The Group continues its analysis of the potential effects of climate change on food supply, and is
actively involved in sustainable food supply initiatives in at-risk product areas. A comprehensive supply
chain ESG risk analysis process was initiated in 2013. Understanding of these risks will increasingly
inform supply chain decision-making.
The Group continues to monitor the potential effect on food supply of wage disputes among
agricultural labour forces.

50 2013 Integrated Annual Report
Corporate governance
Risk Risk mitigation
Financial risk
Volatility of profit margins Market conditions and their effect on profitability are continuously reviewed by management and the
Board. Unit sales growth and cost efficiencies are the primary drivers to protect profit margins. Unit
sales growth depends on high levels of customer satisfaction.
Going-concern status The going concern of the Group is reviewed by the Board at least twice a period and includes a review
of adequate levels of capital to continue operations and implement strategy.
Liquidity and credit risk The Group maintains a strong capital base (represented by total shareholders’ equity) so as to maintain
investor, creditor and market confidence and to sustain future development of the business.
Operational risk
Product quality and third-party
liability
Product safety and quality are carefully scrutinised by our internal quality control and food safety
technicians. Where any indications exist of a product flaw, the product is immediately uplifted and
returned to the supplier. Merchandise is purchased from reputable suppliers. The safety and quality
of house brands are carefully scrutinised by food safety technicians. Appropriate levels of insurance
are in place.
Safeguarding of assets Group assets are insured against loss. Business continuity plans are in place. All stores and distribution
centres have surveillance cameras in place which are monitored to assist in the safe keeping of assets.
Security of supply Pick n Pay places much emphasis on forging good relationships with suppliers to ensure that the
partnership is mutually beneficial to both parties. Electronic data interchange (EDI) is in process to
improve delivery and communication levels between Pick n Pay and suppliers. Central distribution is in
place to assist with improving lead times and minimising out of stocks.
Reliance on information systems The information systems division evaluates and decides on appropriate technology for the Group.
Further details on information systems risks are on pages 33 and 34.
Energy security and utilities Resource use is a key focus of our optimisation drive. The Group has consistently reduced energy
usage for the past 3 years and significant savings will enable further investment in reducing fuel and
electricity consumption.
Legislative risk
Compliance with legislation Pick n Pay has an in-house compliance office to monitor and assess the impact of legislation on the
business. Use is made of external specialists and advice where necessary.
Risk management report continued
Pick n Pay Stores Limited

51 Integrated Annual Report 2013
Repo
Rt to
stA
keh
old
eRs
CoR
poR
Ate
Go
VeR
NA
NCe
AN
NU
Al fIN
AN
CIAl
stAtem
eNts
GR
oU
p o
VeR
VIew
Corporate governance
CoR
poR
Ate A
Nd
sh
AR
eho
ldeR
INfo
Rm
AtIo
N
Legal reportPick n Pay Stores Limited
compliaNceThe compliance framework rests on the Group’s comprehensive set
of policies. These are regularly updated to reflect governance best
practice and the evolving legal environment. All Group companies
and employees are obliged to comply with these policies.
The Group has created a set of compliance questionnaires that are
distributed bi-annually to the relevant departments. The compliance
questionnaires indicate levels of compliance to statutes that impact
the retail industry such as the Consumer Protection Act, the
Competition Act and the Companies Act 2008. Statutory
developments are regularly monitored to establish the compliance
regime, and we are currently reviewing what is needed to establish
compliance with the provisions of the Protection of Personal
Information Bill.
Compliance questionnaires are also used to educate employees in
the requirements of statutory and regulatory compliance in the
retail sector, and staff members are trained in sessions dealing with
important legal issues such as the provisions of the Consumer
Protection Act.
The questionnaires are regularly audited internally to ensure
accurate reporting.
No judgments, damages, penalties or fines were recorded and/or
levied against any Group company, directors, officers or employees
during the period under review for non-compliance with
any legislation.
Each year, the executive directors and senior managers are required
to declare in writing that to the best of their knowledge they, and
the companies they serve, have complied with all relevant statutes
and regulations. The most recent of these exercises was completed
during April 2013, and no incidents of contravention of the policies
or the statutes were reported.
competitioN commissioNIn August 2012, a subsidiary company received a summons from
the Competition Commission regarding an investigation into
whether or not long-term exclusive lease agreements, as entered
into between landlords and various South African national retail
chains, are anti-competitive. Pick n Pay is co-operating fully with the
Competition Commission in providing all information requested,
and remains convinced that no anti-competitive behaviour exists.
In February 2013, a subsidiary company received notification of
a complaint laid against it with the Competition Commission by
a small number of Pick n Pay franchisees relating to the sourcing
of suppliers and the centralised buying system. Pick n Pay co-
operated fully with the Competition Commission in providing all
information requested. After reviewing all documentation, the
Competition Commission declined to refer the complaint to the
Competition Tribunal.
Following the recent statutory changes to, inter alia, the
Competitions Act 2008, the Consumer Protection Act and the
Companies Act, our franchise agreement was thoroughly reviewed
by both commercial and competition lawyers, and was amended to
ensure that Pick n Pay and our franchisees remain compliant with all
statutory requirements.
litigatioN mattersThe Company and its subsidiaries are not involved, and have not
in the 2013 annual financial period been involved, in any legal or
arbitration proceedings which may have or have had a material
effect on the financial position of the Pick n Pay Group of
Companies, nor is the Company aware of any such proceedings
that are pending or threatened.

52 2013 Integrated Annual Report
Corporate governance
Corporate governance reportPick n Pay Holdings Limited
iNtroductioNThis report deals with the corporate governance of Pick n Pay
Holdings Limited, the investment holding company of Pick n Pay
Stores Limited. Pick n Pay Holdings Limited’s sole purpose is the
holding of the controlling shareholding in Pick n Pay Stores Limited
and the Company therefore has minimal operating activities. Only
principles specific to Pick n Pay Holdings Limited are included in this
report as most principles have been addressed in the Pick n Pay
Stores Limited corporate governance report (see pages 31 to 38).
directorsThe Board comprises 6 non-executive directors of which 3 are
independent. In addition, there are 3 alternate directors who are
available to step in for Raymond Ackerman, Wendy Ackerman and
Gareth Ackerman should the need arise. The alternate directors
have a standing invitation to attend all board meetings, but only
vote in the absence of the director for whom they alternate. As the
Chairman, Raymond Ackerman is not independent, Hugh Herman
has been appointed as the lead independent non-executive
director (LID). All members of the Board have unfettered access to
the LID when required.
appoiNtmeNt of directorsThe appointment of all directors and alternate directors to the
Board requires shareholder approval at the annual general meeting
(AGM). On appointment to the Board new directors are required to
retire and offer themselves for re-election by shareholders at the
first AGM following their appointment.
iNdepeNdeNce of directorsOf the 3 independent non-executive directors, Hugh Herman and
René de Wet have held their positions for longer than 9 years. Their
independence has been thoroughly scrutinised by the Chairman
and discussed by the Board given their years of service on the
Board. The Board is satisfied that, despite their length of service,
they remain independent, tough-minded individuals with personal
integrity, and they translate their experience in the Group into
meaningful interrogation of the Group’s implementation of its
strategy. All 3 independent directors meet the criteria for
independence as established by King III, the Companies Act and
the JSE Listings Requirements. The Ackerman family members are
not independent given their indirect controlling shareholding of
the Group.
Board suB-committeesPick n Pay Holdings has an audit committee consisting of
independent non-executive directors, but it does not have separate
remuneration, risk, nomination, corporate governance and social
and ethics committees as the tasks relating to these committees
are undertaken by Pick n Pay Stores Limited for the Group.
remuNeratioN reportNo separate remuneration report is presented as the only
remuneration paid by the Company is non-executive directors’
remuneration which is approved by the Board as a whole.
Fees proposed for next year for Board members not serving
on the Pick n Pay Stores Board, are unchanged
as follows:
Proposed 2014 2013
Total fee R57 000 R57 000
Share options granted to directors
Calendaryear granted
Optiongrant price
R
Balance heldat 1 March
2012
Balance heldat 3 March
2013Available
for take-up
Jonathan Ackerman (alternate director) 2010 16.00 1 000 1 000 Now1 000 1 000
Suzanne Ackerman-Berman (alternate director) 2011 15.35 400 400 Now400 400
Directors of Pick n Pay Stores LimitedBakar Jakoet 2006 11.50 400 400 Now
2009 11.33 600 600 Now2010 16.00 400 400 Now
1 400 1 400Richard van Rensburg 2011 15.18 1 000 000 1 000 000 Oct 2014
1 000 000 1 000 000

53 Integrated Annual Report 2013
Repo
Rt to
stA
keh
old
eRs
CoR
poR
Ate
Go
VeR
NA
NCe
AN
NU
Al fIN
AN
CIAl
stAtem
eNts
GR
oU
p o
VeR
VIew
Corporate governance
CoR
poR
Ate A
Nd
sh
AR
eho
ldeR
INfo
Rm
AtIo
N
Directors’ interest in shares
2013 How held*
Balance held at
1 March 2012000’s
Additions during
the period000’s
Average purchase
price per share
R
Balance held at
3 March 2013000’s
Beneficial/non-
beneficial interest
Directors’ holdingsRaymond Ackerman direct 1 269.4 1 269.4 Beneficial Gareth Ackerman direct 0.5 0.5 Beneficial
indirect 3 153.0 3 153.0 Non-beneficial Ackerman Investment Holdings Proprietary Limited** indirect 254 896.0 121.6 17.99 255 017.6 Non-beneficialMistral Trust** indirect 5 308.2 5 308.2 Non-beneficial Hugh Herman direct 80.0 80.0 Beneficial
indirect 65.0 65.0 Beneficial Alternate directorsJonathan Ackerman direct 252.0 252.0 Beneficial
indirect 1 089.6 1 089.6 Beneficial Suzanne Ackerman-Berman direct 242.1 242.1 Beneficial
indirect 811.3 811.3 Beneficial David Robins direct 886.7 886.7 Beneficial Directors of Pick n Pay Stores LimitedBakar Jakoet direct 250.0 250.0 Beneficial
2012 How held*
Balance held at
1 March 2011000’s
Additions during
the year000’s
Average purchase
price per share
R
Balance held at
29 February 2012000’s
Beneficial/non-
beneficial interest
Directors’ holdingsRaymond Ackerman direct 1 019.4 250.0 17.37 1 269.4 Beneficial Gareth Ackerman direct 0.5 0.5 Beneficial
indirect 3 072.0 81.0 17.77 3 153.0 Non-beneficial Ackerman Investment Holdings Proprietary Limited** indirect 254 896.0 254 896.0 Non-beneficialMistral Trust** indirect 5 201.5 106.7 17.25 5 308.2 Non-beneficial Hugh Herman direct 62.5 17.5 16.09 80.0 Beneficial
indirect 65.0 65.0 Beneficial
Alternate directorsJonathan Ackerman direct 252.0 252.0 Beneficial
indirect 1 089.6 1 089.6 Beneficial Suzanne Ackerman-Berman direct 242.1 242.1 Beneficial
indirect 781.2 30.1 16.38 811.3 Beneficial David Robins direct 886.7 886.7 Beneficial
Directors of Pick n Pay Stores LimitedNick Badminton*** direct 880.6 880.6 Beneficial Bakar Jakoet direct 250.0 250.0 Beneficial
* Direct interests represent a holding in the director’s personal capacity and indirect interests represent a holding by a family trust of which the director is a trustee.
** The non-beneficial interest in Ackerman Investment Holdings Proprietary Limited and Mistral Trust represents a portion of the holdings of Raymond Ackerman, Wendy Ackerman, Gareth Ackerman, Jonathan Ackerman and Suzanne Ackerman-Berman.
*** Resigned 29 February 2012.
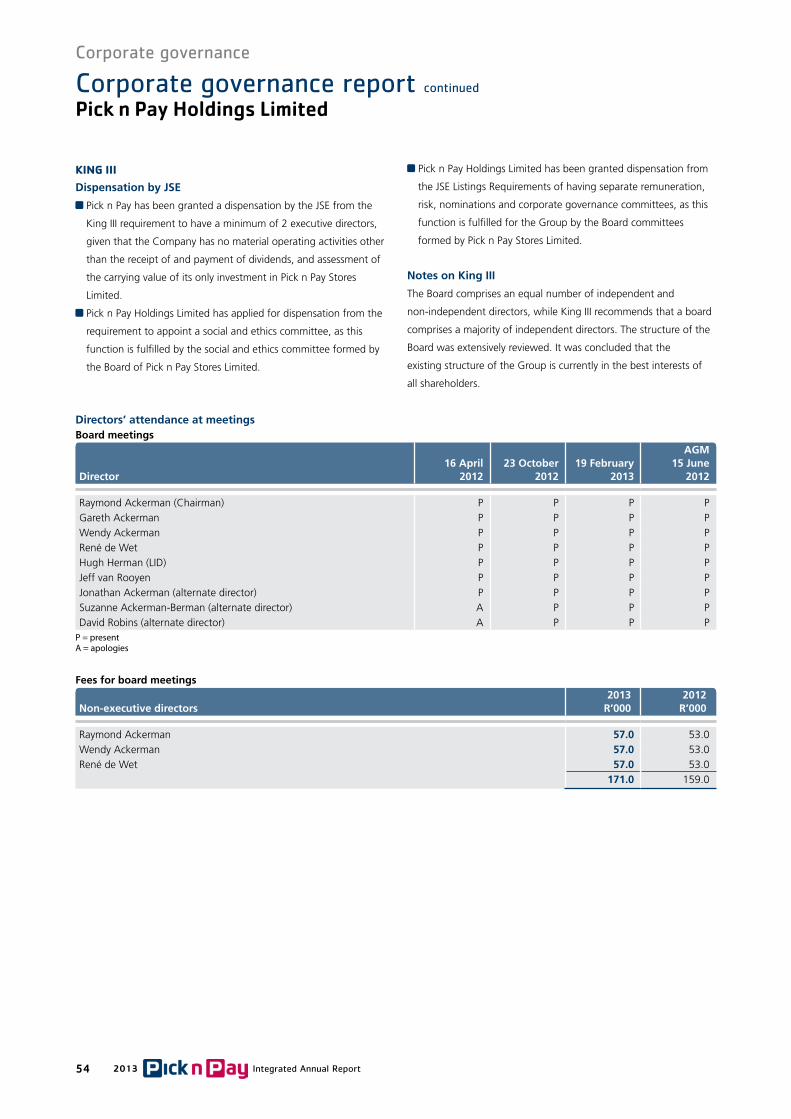
54 2013 Integrated Annual Report
Corporate governance
Corporate governance report continued
Pick n Pay Holdings Limited
KiNg iiiDispensation by JSE
Pick n Pay has been granted a dispensation by the JSE from the
King III requirement to have a minimum of 2 executive directors,
given that the Company has no material operating activities other
than the receipt of and payment of dividends, and assessment of
the carrying value of its only investment in Pick n Pay Stores
Limited.
Pick n Pay Holdings Limited has applied for dispensation from the
requirement to appoint a social and ethics committee, as this
function is fulfilled by the social and ethics committee formed by
the Board of Pick n Pay Stores Limited.
Pick n Pay Holdings Limited has been granted dispensation from
the JSE Listings Requirements of having separate remuneration,
risk, nominations and corporate governance committees, as this
function is fulfilled for the Group by the Board committees
formed by Pick n Pay Stores Limited.
Notes on King III
The Board comprises an equal number of independent and
non-independent directors, while King III recommends that a board
comprises a majority of independent directors. The structure of the
Board was extensively reviewed. It was concluded that the
existing structure of the Group is currently in the best interests of
all shareholders.
Directors’ attendance at meetingsBoard meetings
Director16 April
201223 October
201219 February
2013
AGM 15 June
2012
Raymond Ackerman (Chairman) P P P PGareth Ackerman P P P PWendy Ackerman P P P PRené de Wet P P P PHugh Herman (LID) P P P PJeff van Rooyen P P P PJonathan Ackerman (alternate director) P P P PSuzanne Ackerman-Berman (alternate director) A P P PDavid Robins (alternate director) A P P P
P = presentA = apologies
Fees for board meetings
Non-executive directors2013
R’0002012
R’000
Raymond Ackerman 57.0 53.0Wendy Ackerman 57.0 53.0René de Wet 57.0 53.0
171.0 159.0

55 Integrated Annual Report 2013
Repo
Rt to
stA
keh
old
eRs
CoR
poR
Ate
Go
VeR
NA
NCe
AN
NU
Al fIN
AN
CIAl
stAtem
eNts
GR
oU
p o
VeR
VIew
Corporate governance
CoR
poR
Ate A
Nd
sh
AR
eho
ldeR
INfo
Rm
AtIo
N
The audit committee is pleased to present this report as required
by the Companies Act, 2008. The audit committee is a formal
committee of the Board and functions within an approved charter
and complies with all relevant legislation, regulation and
governance codes.
role of the committee
The audit committee has an independent role with accountability to
both the Board and to shareholders. The committee’s responsibilities
include the statutory duties prescribed by the Companies Act 2008,
activities recommended by King III and the responsibilities assigned
by the Board.
compositioN of the committee
This committee is chaired by and comprises only independent
non-executive directors. In accordance with the requirements of
the Companies Act 2008, members of the committee are appointed
annually by the Board for the ensuing financial period and in
compliance with King III are appointed by shareholders at
the annual general meeting.
The committee has a charter which is reviewed and approved
by the Board annually.
The composition of the committee and meeting attendance is
as follows:
Committee member16 April
201215 October
2012
René de Wet (Chairman) P PHugh Herman P PJeff van Rooyen P P
P = present
The committee discharges its Board responsibilities by:
Meeting at least twice a year to review the Group’s financial
results;
Receiving and reviewing reports from the Pick n Pay Stores
audit committee;
Reviewing the carrying value of its investment in Pick n Pay
Stores Limited; and
Reporting to the Board at the next meeting.
The committee’s main responsibilities are discharged by the audit
committee elected for Pick n Pay Stores Limited. The Pick n Pay
Holdings audit committee reviews the report of the Pick n Pay
Stores Limited audit committee and assesses the carrying value of
its investment in Pick n Pay Stores Limited.
iNdepeNdeNce of exterNal auditors
The audit committee is satisfied as to the independence of the
Group’s external auditors, KPMG Inc., and its respective audit
partners. The committee nominates KPMG as external auditor for
the appointment by shareholders at the annual general meeting.
policY oN NoN-audit services
All non-audit services provided by the Group’s external auditors are
pre-approved by the audit committee. The total fee for non-audit
services provided should not, under normal circumstances, exceed
50% of the total auditor’s remuneration.
expertise aNd experieNce of chief fiNaNce officer aNd fiNaNce fuNctioN
The audit committee is satisfied that Bakar Jakoet has the
appropriate expertise and experience for his position of Chief
Finance Officer of the Group. In addition, the committee is also
satisfied that the composition, experience and skills of the finance
function meet the Group’s requirements.
approval of the audit committee report
The committee confirms that it has functioned in accordance with
its charter for the 2013 annual financial period and that its report to
shareholders has been approved by the Board.
René de Wet
Chairman: Audit committee
22 April 2013
Audit committee reportPick n Pay Holdings Limited

56 2013 Integrated Annual Report
Corporate governance

57 Integrated Annual Report 2013
Repo
Rt to
stA
keh
old
eRs
GR
oU
p o
veR
vIew
CoR
poR
Ate
Go
veR
NA
NCe
AN
NU
Al fIN
AN
CIAl
stAtem
eNts
CoR
poR
Ate A
Nd
sh
AR
eho
ldeR
INfo
Rm
AtIo
N
Pick n Pay Group of Companies annual financial statements
Contents
The annual financial statements have been prepared by the Pick n Pay Finance Division under the supervision of the Chief Finance Officer,
Bakar Jakoet, CA(SA).
Pick n Pay StoreS GrouP“Pick n Pay Stores Limited and its subsidiaries”58 Directors’ responsibility statement for Company and Group annual financial statements58 Company Secretary’s certificate59 – 60 Directors’ report61 Independent auditor’s report
Pick n Pay HoldinGS GrouP“Pick n Pay Holdings Limited and its subsidiaries”62 Directors’ responsibility statement for Company and Group annual financial statements62 Company Secretary’s certificate63 – 64 Directors’ report65 Independent auditor’s report
conSolidated annual financial StatementS“Pick n Pay Stores Group” and “Pick n Pay Holdings Group”66 Statements of comprehensive income67 Statements of financial position68 – 69 Statements of changes in equity70 Statements of cash flows71 – 79 Accounting policies80 – 104 Notes to the Group annual financial statements
comPany annual financial StatementS Pick n Pay Stores Limited and Pick n Pay Holdings Limited106 Statements of comprehensive income107 Statements of financial position108 Statements of changes in equity109 Statements of cash flows110 – 113 Notes to the Company annual financial statements

58 2013 Integrated Annual Report
Pick n Pay Stores Group
Pick n Pay StoreS limited and itS SubSidiarieSThe directors are responsible for the preparation and fair presentation of the consolidated and separate annual financial statements of Pick n Pay Stores Limited, comprising the statements of financial position at 3 March 2013, and the statements of comprehensive income, changes in equity and cash flows for the period then ended, and the notes to the financial statements which include a summary of significant accounting policies and other explanatory notes, in accordance with International Financial Reporting Standards and the requirements of the Companies Act 2008 of South Africa. In addition, the directors are responsible for preparing the directors’ report.
The directors are also responsible for such internal control as the directors determine is necessary to enable the preparation of financial statements that are free from material misstatement, whether due to fraud or error, and for maintaining adequate accounting records and an effective system of risk management, as well as the preparation of the supplementary schedules included in these financial statements.
The directors have made an assessment of the ability of the Company and its subsidiaries to continue as going concerns and have no reason to believe that the businesses will not be going concerns in the period ahead.
The auditor is responsible for reporting on whether the consolidated and separate annual financial statements are fairly presented in accordance with the applicable financial reporting framework.
aPProval of conSolidated and SeParate annual financial StatementSThe consolidated and separate annual financial statements of Pick n Pay Stores Limited, as identified in the first paragraph, were approved by the Board of directors on 22 April 2013 and signed on their behalf by:
Gareth Ackerman Richard BrasherChairman Chief Executive Officer
Directors’ responsibility statement
Pick n Pay StoreS limited and itS SubSidiarieS
I certify that Pick n Pay Stores Limited has filed all returns and notices as required by a public company in terms of section 88(2)(e) of the
Companies Act No.71 of 2008, as amended, and that such returns and notices are, to the best of my belief, true, correct and up to date.
Debra Muller
Company Secretary
22 April 2013
Company Secretary’s certificate

59 Integrated Annual Report 2013
Repo
Rt to
stA
keh
old
eRs
GR
oU
p o
veR
vIew
CoR
poR
Ate
Go
veR
NA
NCe
AN
NU
Al fIN
AN
CIAl
stAtem
eNts
CoR
poR
Ate A
Nd
sh
AR
eho
ldeR
INfo
Rm
AtIo
N
Pick n Pay Stores Group
Pick n Pay StoreS limited and itS SubSidiarieSNature of business
The Company, which is domiciled and incorporated in the Republic
of South Africa and listed on the JSE, the recognised securities
exchange in South Africa, is an investment holding company. The
Group comprises trading subsidiaries that retail food, clothing,
general merchandise, pharmaceuticals and liquor throughout
southern Africa, both on an owned and franchise basis. The Group
also acquires and develops strategic retail and distribution sites.
The nature of the business of the subsidiaries held directly and
indirectly is presented in note 5 of the Company annual financial
statements on page 111.
Review of financial results and activities
The reviews of financial results and activities of the Group are
contained in the Chief Finance Officer’s report on pages 22 to 25.
During the period under review the Group adopted a 52-week
reporting calendar for all future financial periods. Refer to note 29
for further details.
Audit committee
We draw your attention to the audit committee report on pages
39 and 40 where we set out the responsibilities of the committee
and how it has discharged these responsibilities during the period.
Dividends declared
The directors have declared a final dividend (dividend 90) of
69.25 cents per share out of income reserves. The dividend is
subject to dividend withholding tax at 15%. The last day to trade
in order to participate in the dividend (CUM dividend) will be
Friday, 7 June 2013. The shares will trade Ex dividend from the
commencement of business on Monday, 10 June 2013 and the
record date will be Friday, 14 June 2013. The dividends will be
paid on Tuesday, 18 June 2013. Refer to page 85 for a
detailed analysis.
Share capital
The issued ordinary share capital remained unchanged during the
period at 480 397 321 shares.
At period end, the Pick n Pay Employee Share Purchase Trust held
2 046 597 (2012: 2 482 193) shares in the Company and
9 115 723 (2012: 9 011 002) shares in Pick n Pay Holdings Limited
and a subsidiary company held 1 845 803 (2012: 1 845 103) shares
in Pick n Pay Holdings Limited, all of which are accounted for as
treasury shares. These shares are held to meet obligations of
options granted.
Going concern
These annual financial statements have been prepared on the
going-concern basis.
The Board has performed a formal review of the Company and
Group’s ability to continue trading as going concerns in the
foreseeable future and, based on this review, considers that the
presentation of the financial statements on this basis is appropriate.
The Group ensures that it complies with the liquidity and solvency
requirements for any dividend payment and provision of financial
assistance as per the requirements of the Companies Act 2008.
Competition Commission
In August 2012, a subsidiary company received a summons from
the Competition Commission regarding an investigation into
whether or not long-term exclusive lease agreements, as entered
into between landlords and various South African national retail
chains, are anti-competitive. Pick n Pay is co-operating fully with the
Competition Commission in providing all information requested,
and remains convinced that no anti-competitive behaviour exists.
In February 2013, a subsidiary company received notification of
a complaint laid against it with the Competition Commission by
a small number of Pick n Pay franchisees relating to the sourcing
of suppliers and the centralised buying system. Pick n Pay co-
operated fully with the Competition Commission in providing
all information requested. After reviewing all documentation,
the Competition Commission declined to refer the complaint to
the Competition Tribunal.
Following the recent statutory changes to, inter alia, the
Competitions Act, the Consumer Protection Act and the Companies
Act 2008, our franchise agreement was thoroughly reviewed by
both commercial and competition lawyers, and was amended to
ensure that Pick n Pay and our franchisees remain compliant with all
statutory requirements.
Legal proceedings
The Company and its subsidiaries are not, and have not in the 2013
annual financial period been involved in any legal or arbitration
proceedings which may have or have had a material effect on the
financial position of the Pick n Pay Group of Companies, nor is
the Company aware of any such proceedings that are pending
or threatened.
Special resolutions
On 15 June 2012 the Company’s shareholders approved the
following special resolutions as tabled in the notice to the annual
general meeting:
Directors’ fees for the 2013 annual financial period
Shareholders approved the directors’ fees.
Directors’ reportfor the period ended 3 March 2013

60 2013 Integrated Annual Report
Pick n Pay Stores Group
Provision of financial assistance to related or inter-related
companies and others
The shareholders resolved, in terms of the provisions of section 45
of the Companies Act 2008, that the Company may from time to
time provide direct or indirect financial assistance to any director,
prescribed officer, related company, inter-related company or
member of a related or inter-related company on such terms and
conditions as determined by the Board.
General approval to repurchase Company shares
Shareholders resolved that the Company or any of its subsidiaries
may acquire issued shares of the Company or its holding company,
upon such terms and conditions and in such amounts as the
directors of the Company may determine from time to time.
Acquisition of such shares is subject to the Memorandum of
Incorporation of the Company, the provisions of the Companies
Act, No. 71 of 2008, as amended and the Listings Requirements of
JSE Limited (JSE), provided further that acquisitions of shares in the
Company by the Company and its subsidiaries may not, in the
aggregate, exceed in any one financial year 5% of the Company’s
issued share capital.
Directors and secretary
Richard Brasher was appointed Chief Executive Officer in 2013 and
in terms of the Companies Act and the Company’s Memorandum
of Incorporation, offers himself for election as an executive director
of the Company.
Alex Mathole resigned with effect from 28 February 2013 to take
up an executive position with a major supplier to the Group.
In terms of the Company’s Memorandum of Incorporation the
directors listed below retire by rotation and they offer themselves
for re-election.
Executive
Suzanne Ackerman-Berman
Jonathan Ackerman
Independent non-executive
Lorato Phalatse
Information pertaining to the directors and the Company Secretary
appear on pages 16 to 18.
Holding company
The holding company is Pick n Pay Holdings Limited (listed on
the JSE).
Directors’ interest in shares
2013%
2012%
Beneficial 1.0 1.3Non-beneficial 27.5 27.6
Total 28.5 28.9
The directors’ interest in shares is their effective direct shareholding
in the Company (excluding treasury shares) and their effective
indirect shareholding through Pick n Pay Holdings Limited
(excluding treasury shares). For further details refer to the
remuneration report on pages 41 to 47.
Subsidiary companies
Details of subsidiary companies are presented in note 5 of the
Company annual financial statements on page 111.
Borrowings
The Group’s overall level of debt (including bank overdrafts
and overnight borrowings) increased from R1 464.5 million to
R2 729.6 million. This increase is largely due to the adoption of the
52-week financial reporting period. The change in reporting date
cut-off resulted in an increase in bank overdraft of R1 059.2 million.
There has been no change in net working capital due to the
adoption of the 52-week financial reporting period.
Directors’ report continued

61 Integrated Annual Report 2013
Repo
Rt to
stA
keh
old
eRs
GR
oU
p o
veR
vIew
CoR
poR
Ate
Go
veR
NA
NCe
AN
NU
Al fIN
AN
CIAl
stAtem
eNts
CoR
poR
Ate A
Nd
sh
AR
eho
ldeR
INfo
Rm
AtIo
N
Pick n Pay Stores Group
to tHe SHareHolderS of Pick n Pay StoreS limited Report on the annual financial statements
We have audited the consolidated and separate annual financial
statements of Pick n Pay Stores Limited, which comprise the
statements of financial position at 3 March 2013, and the
statements of comprehensive income, changes in equity and cash
flows for the period then ended, and the notes to the financial
statements which include a summary of significant accounting
policies and other explanatory notes, as set out on pages 66 to 113
and the remuneration report as set out on pages 41 to 47.
Directors’ responsibility for the financial statements
The Company’s directors are responsible for the preparation and fair
presentation of these financial statements in accordance with
International Financial Reporting Standards, and the requirements
of the Companies Act of South Africa, and for such internal control
as the directors determine is necessary to enable the preparation of
financial statements that are free from material misstatement,
whether due to fraud or error.
Auditor’s responsibility
Our responsibility is to express an opinion on these financial
statements based on our audit. We conducted our audit in
accordance with International Standards on Auditing. Those
standards require that we comply with ethical requirements and
plan and perform the audit to obtain reasonable assurance whether
the financial statements are free from material misstatement.
An audit involves performing procedures to obtain audit evidence
about the amounts and disclosures in the financial statements. The
procedures selected depend on the auditor’s judgement, including
the assessment of the risks of material misstatement of the financial
statements, whether due to fraud or error. In making those risk
assessments, the auditor considers internal control relevant to the
entity’s preparation and fair presentation of the financial statements
in order to design audit procedures that are appropriate in the
circumstances, but not for the purpose of expressing an opinion
on the effectiveness of the entity’s internal control. An audit also
includes evaluating the appropriateness of accounting policies
used and the reasonableness of accounting estimates made by
management, as well as evaluating the overall presentation of the
financial statements.
We believe that the audit evidence we have obtained is sufficient
and appropriate to provide a basis for our audit opinion.
Independent auditor’s reportfor the period ended 3 March 2013
Opinion
In our opinion, these financial statements present fairly, in all
material respects, the consolidated and separate financial position
of Pick n Pay Stores Limited at 3 March 2013, and its consolidated
and separate financial performance and consolidated and separate
cash flows for the period then ended in accordance with
International Financial Reporting Standards and the requirements
of the Companies Act of South Africa.
Other reports required by the Companies Act
As part of our audit of the financial statements for the period
ended 3 March 2013, we have read the directors’ report, the audit
committee’s report and the Company Secretary’s certificate for the
purpose of identifying whether there are material inconsistencies
between these reports and the audited financial statements. These
reports are the responsibility of the respective preparers. Based on
reading these reports we have not identified material
inconsistencies between these reports and the audited financial
statements. However, we have not audited these reports and
accordingly do not express an opinion on these reports.
KPMG Inc.
Registered Auditor
Per Patrick Farrand
Chartered Accountant (SA)
Registered Auditor
Director
22 April 2013
MSC House
Mediterranean Street
Cape Town
8001

62 2013 Integrated Annual Report
Pick n Pay Holdings Group
Pick n Pay HoldinGS limited and itS SubSidiarieSThe directors are responsible for the preparation and fair presentation of the consolidated and separate annual financial statements of Pick n Pay Holdings Limited, comprising the statements of financial position at 3 March 2013, and the statements of comprehensive income, changes in equity and cash flows for the period then ended, and the notes to the financial statements which include a summary of significant accounting policies and other explanatory notes, in accordance with International Financial Reporting Standards and the requirements of the Companies Act 2008 of South Africa. In addition, the directors are responsible for preparing the directors’ report.
The directors are also responsible for such internal control as the directors determine is necessary to enable the preparation of financial statements that are free from material misstatement, whether due to fraud or error, and for maintaining adequate accounting records and an effective system of risk management, as well as the preparation of the supplementary schedules included in these financial statements.
The directors have made an assessment of the ability of the Company and its subsidiaries to continue as going concerns and have no reason to believe that the businesses will not be going concerns in the period ahead.
The auditor is responsible for reporting on whether the consolidated and separate annual financial statements are fairly presented in accordance with the applicable financial reporting framework.
aPProval of conSolidated and SeParate annual financial StatementSThe consolidated and separate annual financial statements of Pick n Pay Holdings Limited, as identified in the first paragraph, were approved by the Board of directors on 22 April 2013 and signed on their behalf by:
Raymond AckermanChairman
Directors’ responsibility statement
Pick n Pay HoldinGS limited and itS SubSidiarieS
I certify that Pick n Pay Holdings Limited has filed all returns and notices as required by a public company in terms of section 88(2)(e) of the
Companies Act No.71 of 2008, as amended, and that such returns and notices are, to the best of my belief, true, correct and up to date.
Debra Muller
Company Secretary
22 April 2013
Company Secretary’s certificate

63 Integrated Annual Report 2013
Repo
Rt to
stA
keh
old
eRs
GR
oU
p o
veR
vIew
CoR
poR
Ate
Go
veR
NA
NCe
AN
NU
Al fIN
AN
CIAl
stAtem
eNts
CoR
poR
Ate A
Nd
sh
AR
eho
ldeR
INfo
Rm
AtIo
N
Pick n Pay Holdings Group
Pick n Pay HoldinGS limited and itS SubSidiarieSNature of business
The Company, which is domiciled and incorporated in the Republic of South Africa and listed on the JSE, the recognised securities exchange in South Africa, was formed with the sole purpose of holding a controlling interest in Pick n Pay Stores Limited. The Company is entitled to redistribute any dividend received from Pick n Pay Stores Limited.
Audit committee
We draw your attention to the audit committee report on page 55 where we set out the responsibilities of the committee and how it has discharged these responsibilities during the period.
Share value
The directors consider that the ratio of the dividend paid per share for the period of Pick n Pay Holdings Limited (PIKWIK) of 40.78 cents, to that of Pick n Pay Stores Limited (PICKNPAY), 84.00 cents, determines the relative value of a Pick n Pay Holdings Limited share, which, based on these figures, is 48.5% (2012: 48.5%) of a Pick n Pay Stores Limited share.
Dividends declared
The directors have declared a final dividend (dividend 63) of 33.61 cents per share out of income reserves. The dividend is subject to dividend withholding tax at 15%. The last day to trade in order to participate in the dividend (CUM dividend) will be Friday, 7 June 2013. The shares will trade Ex dividend from the commencement of business on Monday, 10 June 2013 and the record date will be Friday, 14 June 2013. The dividends will be
paid on Tuesday, 18 June 2013. Refer to page 85 for a
detailed analysis.
Investment
The Company’s sole asset is its 53.6% (2012: 53.6%) direct shareholding in its subsidiary, Pick n Pay Stores Limited, and its only source of income is the dividend received from Pick n Pay Stores Limited. After taking into account the Pick n Pay Stores Limited treasury shares held by the Group, the Company’s effective holding in Pick n Pay Stores Limited at period end is 53.8% (2012: 53.8%).
Share capital
The issued ordinary share capital remained unchanged during the period at 527 249 082 shares.
As at period end, the Pick n Pay Employee Share Purchase Trust and a subsidiary company held 9 115 723 (2012: 9 011 002) and 1 845 803 (2012: 1 845 103) shares in the Company, respectively. These shares are reflected as treasury shares in the annual financial statements.
Going concern
These annual financial statements have been prepared on the going-concern basis.
The Board has performed a formal review of the Company and Group’s ability to continue trading as going concerns in the foreseeable future and, based on this review, consider that the presentation of the financial statements on this basis is appropriate.
The Group ensures that it complies with the liquidity and solvency requirements for any dividend payment and provision of financial assistance as per the requirements of the Companies Act 2008.
Competition Commission
In August 2012, a subsidiary company received a summons from the Competition Commission regarding an investigation into whether or not long-term exclusive lease agreements, as entered into between landlords and various South African national retail chains, are anti-competitive. Pick n Pay is co-operating fully with the Competition Commission in providing all information requested, and remains convinced that no anti-competitive behaviour exists.
In February 2013, a subsidiary company received notification of a complaint laid against it with the Competition Commission by a small number of Pick n Pay franchisees relating to the sourcing of suppliers and the centralised buying system. Pick n Pay co-operated fully with the Competition Commission in providing all information requested. After reviewing all documentation, the Competition Commission declined to refer the complaint to the Competition Tribunal.
Following the recent statutory changes to, inter alia, the Competitions Act, the Consumer Protection Act and the Companies Act 2008, our franchise agreement was thoroughly reviewed by both commercial and competition lawyers, and was amended to ensure that Pick n Pay and our franchisees remain compliant with all statutory requirements.
Legal proceedings
The Company and its subsidiaries are not, and have not in the 2013 annual financial period been involved in any legal or arbitration proceedings which may have or have had a material effect on the financial position of the Pick n Pay Group of Companies, nor is the Company aware of any such proceedings that are pending or threatened.
Special resolutions
On 15 June 2012 the Company’s shareholders approved the following special resolutions as tabled in the notice to the annual general meeting:
Directors’ fees for the 2013 annual financial period
Shareholders approved the directors’ fees.
Directors’ reportfor the period ended 3 March 2013

64 2013 Integrated Annual Report
Pick n Pay Holdings Group
Provision of financial assistance to related or inter-related
companies and others
The shareholders resolved, in terms of the provisions of section 45
of the Companies Act 2008, that the Company may from time to
time provide direct or indirect financial assistance to any director,
prescribed officer, related company, inter-related company or
member of a related or inter-related company on such terms and
conditions as determined by the Board.
General approval to repurchase Company shares
Shareholders resolved that the Company or any of its subsidiaries
may acquire issued shares of the Company or its holding company,
upon such terms and conditions and in such amounts as the
directors of the Company may determine from time to time.
Acquisition of such shares is subject to the Memorandum of
Incorporation of the Company, the provisions of the Companies
Act, No. 71 of 2008, as amended and the Listings Requirements
of the JSE, provided further that acquisitions of shares in the
Company by the Company and its subsidiaries may not, in the
aggregate, exceed in any one financial year 5% of the Company’s
issued share capital.
Directors and secretary In terms of the Company’s Memorandum of Incorporation the
directors and alternate directors listed below retire by rotation and
they offer themselves for re-election.
Gareth Ackerman
Hugh Herman
Jonathan Ackerman (alternate)
Suzanne Ackerman-Berman (alternate)
David Robins (alternate)
Information pertaining to the directors and the Company Secretary
appear on pages 16 to 18.
Directors’ interest in shares
2013%
2012%
Beneficial 0.9 0.9Non-beneficial 50.4 50.4
Total 51.3 51.3
The directors’ interest in shares is their effective direct shareholding
in the Company, excluding treasury shares. For further details refer
to the remuneration report on pages 52 and 53.
Borrowings
The Group’s overall level of debt (including bank overdrafts and
overnight borrowings) increased from R1 464.5 million to
R2 729.6 million during the period. This is largely due to the
adoption of the 52-week financial reporting period. The change in
reporting date cut-off resulted in an increase in bank overdraft of
R1 059.2 million. There has been no change in net working capital
due to the adoption of the 52-week financial reporting period.
Directors’ report continued

65 Integrated Annual Report 2013
Repo
Rt to
stA
keh
old
eRs
GR
oU
p o
veR
vIew
CoR
poR
Ate
Go
veR
NA
NCe
AN
NU
Al fIN
AN
CIAl
stAtem
eNts
CoR
poR
Ate A
Nd
sh
AR
eho
ldeR
INfo
Rm
AtIo
N
Pick n Pay Holdings Group
to tHe SHareHolderS of Pick n Pay HoldinGS limited Report on the annual financial statements
We have audited the consolidated and separate annual financial
statements of Pick n Pay Holdings Limited, which comprise the
statements of financial position at 3 March 2013, and the
statements of comprehensive income, changes in equity and
cash flows for the period then ended, and the notes to the
financial statements which include a summary of significant
accounting policies and other explanatory notes, as set out on
pages 66 to 113 and the remuneration report as set out
on pages 52 and 53.
Directors’ responsibility for the financial statements
The Company’s directors are responsible for the preparation and fair
presentation of these financial statements in accordance with
International Financial Reporting Standards, and the requirements
of the Companies Act of South Africa, and for such internal control
as the directors determine is necessary to enable the preparation of
financial statements that are free from material misstatement,
whether due to fraud or error.
Auditor’s responsibility
Our responsibility is to express an opinion on these financial
statements based on our audit. We conducted our audit in
accordance with International Standards on Auditing. Those
standards require that we comply with ethical requirements and
plan and perform the audit to obtain reasonable assurance whether
the financial statements are free from material misstatement.
An audit involves performing procedures to obtain audit evidence
about the amounts and disclosures in the financial statements. The
procedures selected depend on the auditor’s judgement, including
the assessment of the risks of material misstatement of the financial
statements, whether due to fraud or error. In making those risk
assessments, the auditor considers internal control relevant to the
entity’s preparation and fair presentation of the financial statements
in order to design audit procedures that are appropriate in the
circumstances, but not for the purpose of expressing an opinion on
the effectiveness of the entity’s internal control. An audit also
includes evaluating the appropriateness of accounting policies used
and the reasonableness of accounting estimates made by
management, as well as evaluating the overall presentation of the
financial statements.
We believe that the audit evidence we have obtained is sufficient
and appropriate to provide a basis for our audit opinion.
Independent auditor’s reportfor the period ended 3 March 2013
Opinion
In our opinion, these financial statements present fairly, in all
material respects, the consolidated and separate financial position
of Pick n Pay Holdings Limited at 3 March 2013, and its
consolidated and separate financial performance and consolidated
and separate cash flows for the period then ended in accordance
with International Financial Reporting Standards and the
requirements of the Companies Act of South Africa.
Other reports required by the Companies Act
As part of our audit of the financial statements for the period
ended 3 March 2013, we have read the directors’ report, the audit
committee’s report and the Company Secretary’s certificate for the
purpose of identifying whether there are material inconsistencies
between these reports and the audited financial statements.
These reports are the responsibility of the respective preparers.
Based on reading these reports we have not identified material
inconsistencies between these reports and the audited financial
statements. However, we have not audited these reports and
accordingly do not express an opinion on these reports.
KPMG Inc.
Registered Auditor
Per Patrick Farrand
Chartered Accountant (SA)
Registered Auditor
Director
22 April 2013
MSC House
Mediterranean Street
Cape Town
8001
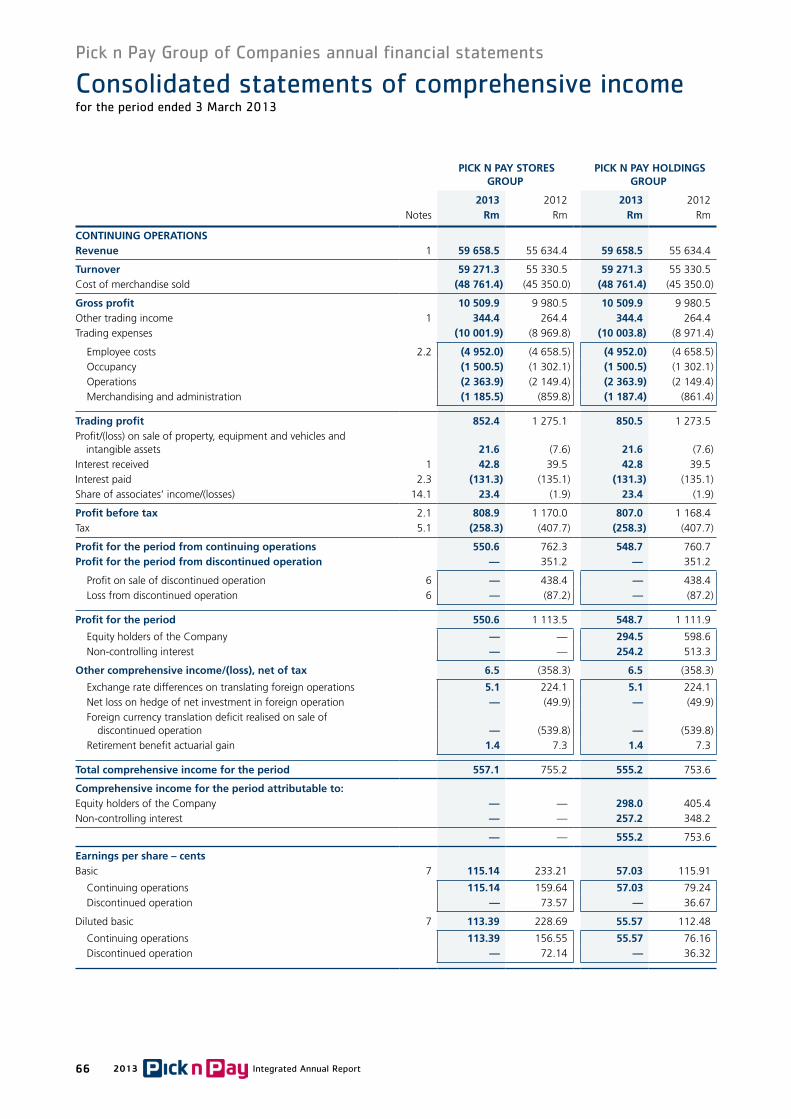
66 2013 Integrated Annual Report
Pick n Pay Group of Companies annual financial statements
Pick n Pay StoreS GrouP
Pick n Pay HoldinGS GrouP
2013 2012 2013 2012 Notes rm Rm rm Rm
continuinG oPerationS revenue 1 59 658.5 55 634.4 59 658.5 55 634.4
turnover 59 271.3 55 330.5 59 271.3 55 330.5 Cost of merchandise sold (48 761.4) (45 350.0) (48 761.4) (45 350.0)
Gross profit 10 509.9 9 980.5 10 509.9 9 980.5 Other trading income 1 344.4 264.4 344.4 264.4 Trading expenses (10 001.9) (8 969.8) (10 003.8) (8 971.4)
Employee costs 2.2 (4 952.0) (4 658.5) (4 952.0) (4 658.5) Occupancy (1 500.5) (1 302.1) (1 500.5) (1 302.1) Operations (2 363.9) (2 149.4) (2 363.9) (2 149.4) Merchandising and administration (1 185.5) (859.8) (1 187.4) (861.4)
trading profit 852.4 1 275.1 850.5 1 273.5 Profit/(loss) on sale of property, equipment and vehicles and intangible assets 21.6 (7.6) 21.6 (7.6) Interest received 1 42.8 39.5 42.8 39.5 Interest paid 2.3 (131.3) (135.1) (131.3) (135.1) Share of associates’ income/(losses) 14.1 23.4 (1.9) 23.4 (1.9)
Profit before tax 2.1 808.9 1 170.0 807.0 1 168.4 Tax 5.1 (258.3) (407.7) (258.3) (407.7)
Profit for the period from continuing operations 550.6 762.3 548.7 760.7 Profit for the period from discontinued operation — 351.2 — 351.2
Profit on sale of discontinued operation 6 — 438.4 — 438.4 Loss from discontinued operation 6 — (87.2) — (87.2)
Profit for the period 550.6 1 113.5 548.7 1 111.9
Equity holders of the Company — — 294.5 598.6 Non-controlling interest — — 254.2 513.3
other comprehensive income/(loss), net of tax 6.5 (358.3) 6.5 (358.3)
Exchange rate differences on translating foreign operations 5.1 224.1 5.1 224.1 Net loss on hedge of net investment in foreign operation — (49.9) — (49.9) Foreign currency translation deficit realised on sale of discontinued operation — (539.8) — (539.8) Retirement benefit actuarial gain 1.4 7.3 1.4 7.3
total comprehensive income for the period 557.1 755.2 555.2 753.6
comprehensive income for the period attributable to: Equity holders of the Company — — 298.0 405.4 Non-controlling interest — — 257.2 348.2
— — 555.2 753.6
earnings per share – cents Basic 7 115.14 233.21 57.03 115.91
Continuing operations 115.14 159.64 57.03 79.24 Discontinued operation — 73.57 — 36.67
Diluted basic 7 113.39 228.69 55.57 112.48
Continuing operations 113.39 156.55 55.57 76.16 Discontinued operation — 72.14 — 36.32
Consolidated statements of comprehensive incomefor the period ended 3 March 2013

67 Integrated Annual Report 2013
Repo
Rt to
stA
keh
old
eRs
GR
oU
p o
veR
vIew
CoR
poR
Ate
Go
veR
NA
NCe
AN
NU
Al fIN
AN
CIAl
stAtem
eNts
CoR
poR
Ate A
Nd
sh
AR
eho
ldeR
INfo
Rm
AtIo
N
Pick n Pay Group of Companies annual financial statements
Pick n Pay StoreS GrouP
Pick n Pay HoldinGSGrouP
as at 3 March
2013
As at 29 February
2012
as at 3 March
2013
As at 29 February
2012 Notes rm Rm rm Rm
aSSetSnon-current assets
Intangible assets 9 947.9 799.6 947.9 799.6 Property, equipment and vehicles 10 3 917.7 3 863.9 3 917.7 3 863.9 Operating lease asset 11.1 105.5 84.8 105.5 84.8 Participation in export partnerships 12 28.1 34.8 28.1 34.8 Deferred tax assets 13 174.4 116.5 174.4 116.5 Investment in associate 14.1 133.9 110.5 133.9 110.5 Loans 15 98.5 80.8 98.9 81.2 Available-for-sale investment 16 0.2 0.2 0.2 0.2 Retirement scheme assets 23.1 1.8 — 1.8 —
5 408.0 5 091.1 5 408.4 5 091.5
current assetsInventory 17 3 996.5 3 334.9 3 996.5 3 334.9 Trade and other receivables 18 2 360.9 2 120.6 2 360.9 2 120.6 Cash and cash equivalents 19 1 255.7 1 271.7 1 255.7 1 271.7
7 613.1 6 727.2 7 613.1 6 727.2
total assets 13 021.1 11 818.3 13 021.5 11 818.7
eQuity and liaBilitieScapital and reserves
Share capital 20 6.0 6.0 6.6 6.6 Share premium — — 120.8 120.8 Treasury shares 21 (139.4) (142.8) (89.3) (82.4) Retained earnings 2 562.6 2 559.2 1 222.4 1 218.2 Foreign currency translation deficit (13.2) (18.3) (7.1) (9.9)
attributable to equity holders of the company 2 416.0 2 404.1 1 253.4 1 253.3
non-controlling interest — — 1 157.4 1 147.5
total shareholders’ interest 2 416.0 2 404.1 2 410.8 2 400.8
non-current liabilitiesBorrowings 22 772.5 771.2 772.5 771.2 Retirement scheme obligations 23.1 — 9.0 — 9.0 Operating lease liability 11.2 924.6 829.1 924.6 829.1
1 697.1 1 609.3 1 697.1 1 609.3
current liabilitiesBank overdraft and overnight borrowings 19 1 525.6 — 1 525.6 —Borrowings 22 431.5 693.3 431.5 693.3 Tax 5.4 82.8 99.6 82.8 99.6 Trade and other payables 24 6 865.0 7 006.3 6 870.6 7 010.0 Derivative financial instruments 28.3.1 3.1 5.7 3.1 5.7
8 908.0 7 804.9 8 913.6 7 808.6
total equity and liabilities 13 021.1 11 818.3 13 021.5 11 818.7
Consolidated statements of financial position
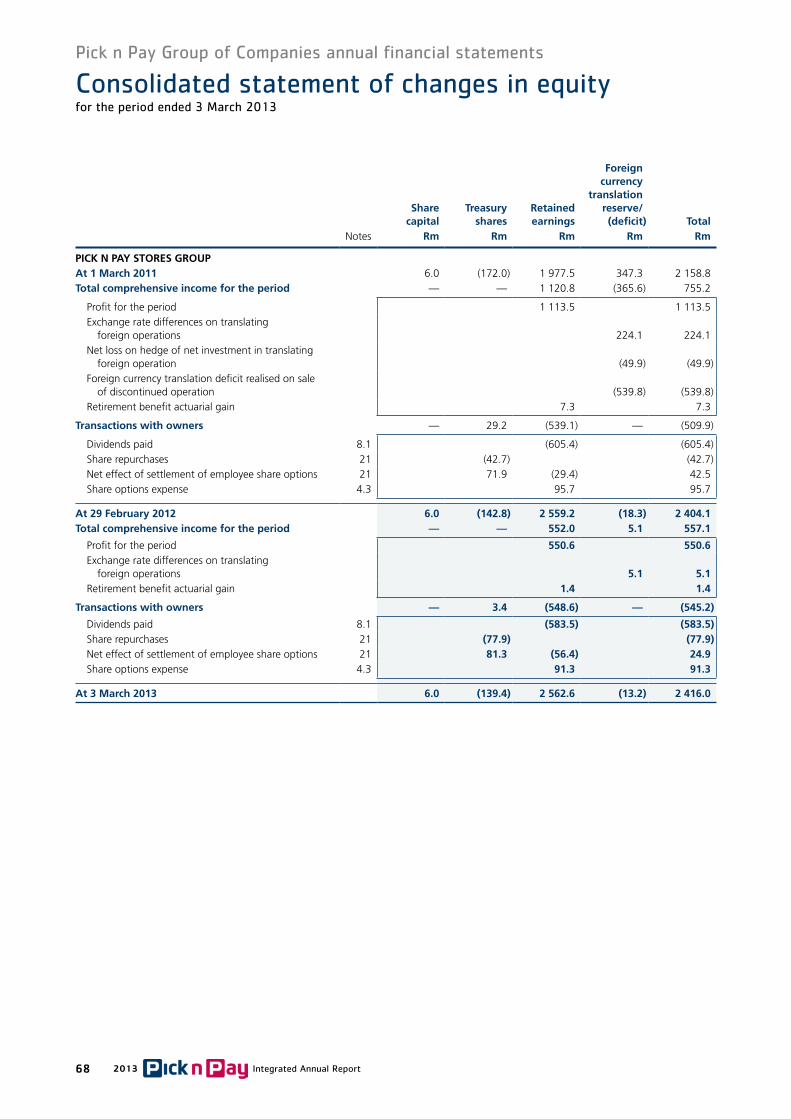
68 2013 Integrated Annual Report
Pick n Pay Group of Companies annual financial statements
Share capital
treasury shares
retained earnings
Foreign currency
translation reserve/(deficit) total
Notes rm rm rm rm rm
Pick n Pay StoreS GrouPat 1 March 2011 6.0 (172.0) 1 977.5 347.3 2 158.8 total comprehensive income for the period — — 1 120.8 (365.6) 755.2
Profit for the period 1 113.5 1 113.5 Exchange rate differences on translating foreign operations 224.1 224.1 Net loss on hedge of net investment in translating foreign operation (49.9) (49.9) Foreign currency translation deficit realised on sale of discontinued operation (539.8) (539.8) Retirement benefit actuarial gain 7.3 7.3
transactions with owners — 29.2 (539.1) — (509.9)
Dividends paid 8.1 (605.4) (605.4) Share repurchases 21 (42.7) (42.7) Net effect of settlement of employee share options 21 71.9 (29.4) 42.5 Share options expense 4.3 95.7 95.7
at 29 February 2012 6.0 (142.8) 2 559.2 (18.3) 2 404.1 total comprehensive income for the period — — 552.0 5.1 557.1
Profit for the period 550.6 550.6Exchange rate differences on translating foreign operations 5.1 5.1 Retirement benefit actuarial gain 1.4 1.4
transactions with owners — 3.4 (548.6) — (545.2)
Dividends paid 8.1 (583.5) (583.5) Share repurchases 21 (77.9) (77.9) Net effect of settlement of employee share options 21 81.3 (56.4) 24.9 Share options expense 4.3 91.3 91.3
at 3 March 2013 6.0 (139.4) 2 562.6 (13.2) 2 416.0
Consolidated statement of changes in equityfor the period ended 3 March 2013

69 Integrated Annual Report 2013
Repo
Rt to
stA
keh
old
eRs
GR
oU
p o
veR
vIew
CoR
poR
Ate
Go
veR
NA
NCe
AN
NU
Al fIN
AN
CIAl
stAtem
eNts
CoR
poR
Ate A
Nd
sh
AR
eho
ldeR
INfo
Rm
AtIo
N
Pick n Pay Group of Companies annual financial statements
Share capital
Share premium
treasury shares
retained earnings
Foreigncurrency
translation reserve/(deficit)
attri-butable
to equity holders
of the company
non-controlling
interest totalNotes rm rm rm rm rm rm rm rm
Pick n Pay HoldinGS GrouPat 1 March 2011 6.6 120.8 (77.7) 890.1 187.4 1 127.2 1 029.9 2 157.1 total comprehensive income for the period — — — 602.5 (197.1) 405.4 348.2 753.6
Profit for the period 598.6 598.6 513.3 1 111.9 Exchange rate differences on translating foreign operations 120.8 120.8 103.3 224.1 Net loss on hedge of net investment in translating foreign operation (26.9) (26.9) (23.0) (49.9) Foreign currency translation deficit realised on sale of discontinued operation (291.0) (291.0) (248.8) (539.8) Retirement benefit actuarial gain 3.9 3.9 3.4 7.3
transactions with owners — — (4.7) (274.4) (0.2) (279.3) (230.6) (509.9)
Dividends paid 8.1 (328.2) (328.2) (277.2) (605.4) Share repurchases 21 (12.0) (16.5) (28.5) (14.2) (42.7) Net effect of settlement of employee share options 21 7.3 19.0 26.3 16.2 42.5 Share options expense 4.3 51.6 51.6 44.1 95.7 Movement in treasury shares (0.3) (0.2) (0.5) 0.5 —
at 29 February 2012 6.6 120.8 (82.4) 1 218.2 (9.9) 1 253.3 1 147.5 2 400.8 total comprehensive income for the period — — — 295.3 2.7 298.0 257.2 555.2
Profit for the period 294.5 294.5 254.2 548.7Exchange rate differences on translating foreign operations 2.7 2.7 2.4 5.1 Retirement benefit actuarial gain 0.8 0.8 0.6 1.4
transactions with owners — — (6.9) (291.1) 0.1 (297.9) (247.3) (545.2)
Dividends paid 8.1 (315.0) (315.0) (268.5) (583.5) Share repurchases 21 (10.5) (31.4) (41.9) (36.0) (77.9) Net effect of settlement of employee share options 21 3.6 9.8 13.4 11.5 24.9 Share options expense 4.3 49.1 49.1 42.2 91.3 Movement in treasury shares (3.6) 0.1 (3.5) 3.5 —
at 3 March 2013 6.6 120.8 (89.3) 1 222.4 (7.1) 1 253.4 1 157.4 2 410.8
Consolidated statement of changes in equityfor the period ended 3 March 2013

70 2013 Integrated Annual Report
Pick n Pay Group of Companies annual financial statements
Pick n Pay StoreS GrouP
Pick n Pay HoldinGS GrouP
2013 2012 2013 2012 Notes rm Rm rm Rm
cash flows from operating activitiesTrading profit 852.4 1 275.1 850.5 1 273.5 Depreciation and amortisation 2.1 895.5 808.1 895.5 808.1 Share options expense 4.3 91.3 95.7 91.3 95.7 Net operating lease liability 74.8 52.7 74.8 52.7
cash generated before movements in working capital 1 914.0 2 231.6 1 912.1 2 230.0 Movements in working capital (1 012.1) 490.3 (1 010.2) 491.9
(Decrease)/increase in trade and other payables (152.4) 1 030.4 (150.5) 1 032.0 Increase in inventory (626.0) (172.2) (626.0) (172.2) Increase in trade and other receivables (233.7) (367.9) (233.7) (367.9)
cash generated by trading activities 901.9 2 721.9 901.9 2 721.9 Interest received 1 42.8 39.5 42.8 39.5 Interest paid 2.3 (131.3) (135.1) (131.3) (135.1)
cash generated by operations 813.4 2 626.3 813.4 2 626.3 Dividends paid 8 (583.5) (605.4) (583.5) (605.4) Tax paid 5.4 (311.6) (462.1) (311.6) (462.1)
net cash (utilised in)/generated by operating activities – continuing operations (81.7) 1 558.8 (81.7) 1 558.8 net cash utilised in operating activities – discontinued operation — (330.4) — (330.4)
total net cash (utilised in)/generated by operating activities (81.7) 1 228.4 (81.7) 1 228.4
cash flows from investing activitiesinvestment in property, equipment and vehicles and intangible assets (1 212.5) (1 611.0) (1 212.5) (1 611.0)
Intangible asset additions 9 (242.4) (271.7) (242.4) (271.7) Property additions 10 (166.5) (446.8) (166.5) (446.8) Equipment and vehicle additions and leasehold improvements 10 (803.6) (889.9) (803.6) (889.9) Aircraft additions 10 — (2.6) — (2.6)
Increase in investment in associate 14 — (102.5) — (102.5) Purchase of operations 9,10,17 (118.3) (106.4) (118.3) (106.4) Proceeds on disposal of property, equipment and vehicles and intangible assets 231.5 44.5 231.5 44.5 Loans (advanced)/repaid (17.7) 9.4 (17.7) 9.4
net cash utilised in investing activities – continuing operations (1 117.0) (1 766.0) (1 117.0) (1 766.0) net cash generated by investing activities – discontinued operation — 1 459.6 — 1 459.6
total net cash utilised in investing activities (1 117.0) (306.4) (1 117.0) (306.4)
cash flows from financing activitiesBorrowings (repaid)/raised (260.5) 787.5 (260.5) 787.5 Share repurchases 21 (77.9) (42.7) (77.9) (42.7) Proceeds from employees on settlement of share options 2.9 31.1 2.9 31.1
total net cash (utilised in)/generated by financing activities (335.5) 775.9 (335.5) 775.9
net (decrease)/increase in cash and cash equivalents (1 534.2) 1 697.9 (1 534.2) 1 697.9 Cash and cash equivalents at beginning of period 1 271.7 (431.8) 1 271.7 (431.8) Effect of exchange rate fluctuations on cash and cash equivalents (7.4) 5.6 (7.4) 5.6
cash and cash equivalents at end of period 19 (269.9) 1 271.7 (269.9) 1 271.7
Consolidated statements of cash flowsfor the period ended 3 March 2013

71 Integrated Annual Report 2013
Repo
Rt to
stA
keh
old
eRs
GR
oU
p o
veR
vIew
CoR
poR
Ate
Go
veR
NA
NCe
AN
NU
Al fIN
AN
CIAl
stAtem
eNts
CoR
poR
Ate A
Nd
sh
AR
eho
ldeR
INfo
Rm
AtIo
N
Pick n Pay Group of Companies annual financial statements
Pick n Pay Stores Limited and Pick n Pay Holdings Limited are domiciled in South Africa. The consolidated financial statements for the period ended 3 March 2013 comprise the Pick n Pay Stores Limited Company and its subsidiaries (referred to as “Pick n Pay Stores Group”) and Pick n Pay Holdings Limited Company and its subsidiaries (referred to as “Pick n Pay Holdings Group”) (together referred to as the “Group”) and the Group’s interest in its associates, TM Supermarkets (Pvt) Limited and Red Apple Retail Company Limited.
The financial statements were approved by the directors and authorised for issue on 22 April 2013.
These consolidated financial statements are presented in South African Rands, which is the Group and Companies’ functional currency. All financial information has been rounded to the nearest million, unless otherwise stated.
The consolidated financial statements are prepared on the historical-cost basis except for:
Derivative financial instruments at fair value through profit or loss;
Defined-benefit obligations measured at the present value of the future benefit to employees, net of the fair value of fund assets; and
Investments held at fair value.
All accounting policies have been applied consistently by all Group companies.
STATEMENT OF COMPLIANCE WITH INTERNATIONAL FINANCIAL REPORTING STANDARDS (IFRS)The Group (consolidated) and Company (separate) financial statements have been prepared in accordance with IFRS and its interpretations adopted by the International Accounting Standards Board, the South African Institute of Chartered Accountants Financial Reporting Guides as issued by the Accounting Practices Committee and Financial Reporting Pronouncements as issued by the Financial Reporting Standards Council, the JSE Listings Requirements and the requirements of the South African Companies Act of 2008.
The preparation of financial statements in conformity with IFRS requires management to make judgements, estimates and assumptions that affect the application of accounting policies and reported amounts of assets and liabilities, income and expenses. Estimates and associated assumptions are based on historical experience and various other factors that are believed to be reasonable under the circumstances, the results of which form the basis of making the judgements about carrying values of assets and liabilities. Actual results may differ from these estimates. The estimates and underlying assumptions are reviewed on an ongoing basis. Revisions to accounting estimates are recognised in the period in which the estimate is revised, if the revision affects only that period, or in the period of revision and future periods if the revision affects both current and future periods.
In particular, information about significant areas of estimation, uncertainty and critical judgements in applying accounting policies
Accounting policies
that have the significant effect on the amounts recognised in the financial statements is included in the following notes:Note 4 measurement of share-based paymentsNote 9 measurement of the recoverable amounts of cash-
generating units containing goodwillNote 9 estimates of useful lives and residual values of
intangible assetsNote 10 estimates of useful lives and residual values of
property, equipment and vehiclesNote 11 classification of operating leasesNote 13 the recognition of deferred tax assetsNote 14 the impairment reviews undertaken in respect of
our associateNote 18 the estimation of the impairment allowance for
trade and other receivablesNote 22 classification of finance leasesNote 23 measurement of defined-benefit obligationsNote 24 recognition of deferred revenue in respect of
customer loyalty programme
The accounting policies set out below have been applied consistently to all periods presented in these consolidated and separate financial statements. During the annual financial period under review the Group adopted a 52-week financial reporting calendar for all future annual financial periods. Please refer to note 29 for further information. During the annual financial period under review the Chief Operating Decision Maker of the Group was reviewed and was changed from the Pick n Pay Stores Limited Board to the Executive Committee. The operating segments and the related comparatives have been restated. Please refer to note 26 for further information.
BASIS OF CONSOLIDATIONinvestment in subsidiaries
The Group financial statements include the financial statements of the Company and the entities that it controls. Control is achieved where the Company has the power directly or indirectly to govern the financial and operating policies of a Group entity so as to obtain benefits from its activities. In assessing control, potential voting rights that are presently exercisable or convertible are taken into account.
As the Company controls the Pick n Pay Employee Share Purchase Trust (Share Trust), this entity has been consolidated into the Group financial statements.
All business combinations are accounted for by applying the acquisition method of accounting. The financial statements of subsidiaries are included in the consolidated financial statements of the Group, from the date that control commences until the date that control ceases.
On the loss of control, the Group derecognises the assets and
liabilities of the subsidiary, any non-controlling interests and the
other components of equity related to the subsidiary. Any surplus or
deficit arising on the loss of control is recognised in profit or loss. If
the Group retains any interest in the previous subsidiary, then such
interest is measured at fair value at the date that control is lost.

72 2013 Integrated Annual Report
Pick n Pay Group of Companies annual financial statements
Subsequently it is accounted for as an equity-accounted investee or
as an available-for-sale financial asset, depending on the level of
influence retained.
investments in associates
Associates are those entities in which the Group has significant
influence, but not control, over the financial and operating policies.
Associates are accounted for using the equity method and are
initially recognised at cost. The Group’s investment includes
goodwill identified on acquisition and is net of any accumulated
impairment losses.
The consolidated financial statements include the Group’s share of
the income and expenses and equity movements of the associate,
after adjustments to align the accounting policies with those of the
Group, from the date that significant influence commences until
the date that significant influence ceases.
When the Group’s share of losses exceeds its investment in an
associate, the Group’s carrying amount of that interest (including
any long-term loans considered as part of the net investment) is
reduced to nil and recognition of further losses is discontinued
except to the extent that the Group has incurred legal or
constructive obligations or made payments on behalf of
an associate.
transactions eliminated on consolidation
Intra-group balances and transactions and any unrealised gains and
losses or income and expenses arising from intra-group transactions
are eliminated in preparing the consolidated financial statements.
Unrealised gains arising from transactions with associates are
eliminated to the extent of the Group’s interest in the entity.
Unrealised losses are eliminated in the same way as
unrealised gains, but only to the extent that there is no evidence
of impairment.
INTANGIBLE ASSETSGoodwill
Goodwill is initially measured at the fair value of the consideration
transferred including the recognised amount of any non-controlling
interest in the acquiree, less the net recognised amount (generally
fair value) of the identifiable assets acquired and liabilities assumed,
all measured as of the acquisition date.
Goodwill is stated at cost less any accumulated impairment losses.
For the purposes of impairment testing, assets are grouped together
into the smallest group of assets that generate cash inflows from
continuing use that are largely independent of the cash inflows of
other assets or cash-generating units (CGUs). CGUs to which
goodwill has been allocated are aggregated so that the level at
which impairment testing is performed reflects the lowest level
at which goodwill is monitored for internal reporting purposes.
Goodwill acquired in a business combination is allocated to groups
of CGUs that are expected to benefit from the synergies of the
combination. The units or the groups of units to which goodwill is
allocated cannot be larger than the operating segments identified
by the Group.
The underlying key assumptions of the tests of impairment include,
but are not limited to, profit and cash forecasts discounted at an
appropriate rate. In respect of associates, the carrying amount of
goodwill is included in the carrying amount of the investment in
the associate. A gain on bargain purchase on an acquisition is
recognised in profit or loss.
Systems development
Systems development activities involve a plan or design for the
production of new or substantially improved products and
processes. Development expenditure is capitalised only if
development costs can be measured reliably, the product or
process is technically and commercially feasible, future economic
benefits are probable, and the Group intends to and has sufficient
resources to complete development and to use or sell the asset.
The expenditure includes the cost of materials, direct labour and
overhead costs that are directly attributable to preparing the
asset for its intended use, and capitalised borrowing costs.
Other development expenditure is recognised in profit or loss
when incurred.
Expenditure on research activities, undertaken with the prospect of
gaining new technical knowledge and understanding, is recognised
in profit or loss as incurred.
licences
Licences that are acquired by the Group are stated at cost (including
any related borrowing costs) less accumulated amortisation and
impairment losses.
Where payments are made for the acquisition of licences, the
amounts are capitalised and amortised over their anticipated useful
lives. Subsequent expenditure on intangible assets is capitalised only
when it increases the future economic benefits embodied in the
specific asset to which it relates. Expenditure incurred to maintain
trademarks or brand names are expensed in full in profit or loss.
intangible assets acquired and subsequent expenditure
Intangible assets that are acquired by the Group are stated at cost
(including any related borrowing costs) less accumulated
amortisation and impairment losses.
Subsequent expenditure on intangible assets is capitalised only
when it increases the future economic benefits embodied in the
specific asset to which it relates. No valuation is made of internally
developed and maintained trademarks or brand names. Expenditure
incurred to maintain trademarks or brand names is expensed in full
in profit or loss.
amortisation
Amortisation is based on the carrying value of an asset less its
residual value.
Amortisation is recognised in profit or loss on a straight-line basis
over the estimated useful lives of intangible assets, other than
goodwill, from the date that they are available for use.
The current and comparative estimated useful life of systems
development costs is 7 years. The current and comparative
estimated useful life of licences is 5 years.
Accounting policies continued

73 Integrated Annual Report 2013
Repo
Rt to
stA
keh
old
eRs
GR
oU
p o
veR
vIew
CoR
poR
Ate
Go
veR
NA
NCe
AN
NU
Al fIN
AN
CIAl
stAtem
eNts
CoR
poR
Ate A
Nd
sh
AR
eho
ldeR
INfo
Rm
AtIo
N
Pick n Pay Group of Companies annual financial statements
Amortisation methods, useful lives and residual values are reviewed
at each reporting date and adjusted, if appropriate.
PROPERTY, EQUIPMENT AND VEHICLESProperty (comprising land and buildings) owned by the Group is
classified as owner-occupied property and is shown at cost less
accumulated depreciation and impairment losses.
Equipment (comprising furniture, fittings and equipment), vehicles
and aircraft are stated at cost less accumulated depreciation and
impairment losses.
The cost of property, equipment, vehicles and aircraft includes
expenditure that is directly attributable to the acquisition of the
asset. The cost of self-constructed assets includes the cost of
materials and direct labour, any other costs directly attributable to
bringing the asset to a working condition for its intended use, and
the costs of dismantling and removing the items and restoring the
site on which they are located.
Borrowing costs related to the acquisition, construction or
production of qualifying assets are capitalised to the cost of
the asset.
The Group recognises in the carrying amount of property,
equipment, vehicles and aircraft the cost of replacing part of such
an item when that cost is incurred, if it is probable that the future
economic benefits embodied within the item will flow to the Group
and the cost of the item can be measured reliably. The carrying
amount of the replaced part is derecognised. All other costs are
recognised in profit or loss as an expense as incurred.
leasehold improvements
Expenditure by the Group on leased retail space is referred to as
leasehold improvements. Leasehold improvements are recognised at
cost and depreciated over the lesser of their useful lives and the
remaining lease term.
depreciation
Depreciation is recognised as an expense in profit or loss on a
straight-line basis over the estimated useful lives of each part of an
item of property, equipment, vehicles and aircraft. Leased assets are
depreciated over the shorter of the lease term and their useful lives,
unless it is reasonably certain that the Group will obtain ownership
by the end of the lease term. Land is not depreciated.
Where significant components of an item of property, equipment,
vehicles and aircraft have different useful lives, they are accounted
for as separate assets.
The estimated useful lives for the current and comparative periods
are as follows:
Buildings 40 years
Major property components 10 to 20 years
Furniture and fittings 5 to 10 years
Equipment 2 to 7 years
Vehicles 4 to 5 years
Aircraft and major components 7 to 20 years
Leasehold improvements 8 years
Estimates of useful lives, residual values and methods of depreciation
are reviewed annually. Any changes are accounted for prospectively
as a change in accounting estimate. If the expected residual value of
an asset is equal to or greater than its carrying value, depreciation on
that asset is ceased. Depreciation is resumed when the expected
residual value falls below the asset’s carrying value.
Gains or losses on disposal of an item of property, equipment,
vehicles and aircraft are determined by comparing the proceeds
from disposal with the carrying amount of the item and are
recognised directly in profit or loss.
LEASESFinance leases
Leases are classified as finance leases where substantially all the
risks and rewards associated with ownership of an asset are
transferred from the lessor to the Group as lessee.
Assets acquired in terms of finance leases are capitalised at the
lower of the fair value of the leased assets and the present value of
the minimum lease payments at the inception of the lease.
Minimum lease payments are apportioned between the finance
charge and the reduction of the outstanding liability. The finance
charge is allocated to each period during the lease term so as to
produce a constant periodic rate of interest on the remaining
balance of the liability.
Finance lease assets are carried at the initial recognised amount less
accumulated depreciation and impairment losses.
Finance lease assets are depreciated over the shorter of the useful
life of the asset or the lease term.
operating leases
Leases where the lessor retains the risks and rewards of ownership
of the underlying asset are classified as operating leases. Rentals
payable or receivable under operating leases are charged or credited
to profit or loss on a straight-line basis over the term of the relevant
lease. This results in the raising of a liability for future lease
expenses and an asset for future lease income on the statement of
financial position.
This liability and asset is reversed during the latter part of each lease term when the actual cash flow exceeds the straight-lined lease accrual included in profit or loss.
Service contracts dependent on specific underlying assets
Where the Group enters into a contract that depends on the use of a specific asset and that contract conveys the right to control the use of the specific asset, the arrangement is treated as a lease.
Recognition criteria as detailed above under finance leases and operating leases are applied to determine whether the arrangement should be treated as a finance lease or an operating lease.

74 2013 Integrated Annual Report
Pick n Pay Group of Companies annual financial statements
INVENTORYInventory comprises merchandise for resale and consumables. Inventory is measured at the lower of cost and net realisable value. Cost is calculated on the weighted-average basis and includes expenditure incurred in acquiring the inventories and bringing them to their existing location and condition, including distribution costs, and is stated net of relevant purchase incentives. The cost of merchandise sold includes shrinkage.
Obsolete, redundant and slow-moving items are identified on a regular basis and are written down to their estimated net realisable values. Net realisable value is the estimated selling price in the ordinary course of business, less the estimated costs of completion and selling expenses.
PROVISIONSA provision is recognised if, as a result of a past event, the Group has a present legal or constructive obligation that can be estimated reliably, and it is probable that an outflow of economic benefits will be required to settle the obligation. If the effect is material, provisions are determined by discounting the expected future cash flows at a pre-tax rate that reflects current market assessments of the time value of money and, where appropriate, the risks specific to the liability. The unwinding of discounts is recognised as a finance cost. Provisions are reviewed at each reporting date and adjusted to reflect the current best estimate.
A provision for onerous contracts is recognised when the expected benefits to be derived by the Group from a contract are lower than the unavoidable cost of meeting its obligations under the contract. The provision is measured at the present value of the lower of the expected cost of terminating the contract and the expected net cost of continuing with the contract. Before a provision is established, the Group recognises any impairment loss on the assets associated with that contract.
GUARANTEESA financial guarantee is a contract that requires the issuer to make specified payments to reimburse the holder for a loss it incurs because a specified debtor fails to make payment when due in accordance with the original or modified terms of a debt instrument.
Insurance contracts are classified as financial guarantees. A liability is recognised when it is probable that an outflow of resources embodying economic benefits will be required to settle the contract and a reliable estimate can be made of the amount of the obligation. The amount recognised is the best estimate of the expenditure required to settle the contract at the reporting date.
Where the effect of discounting is material, the liability is discounted. The discount rate used is a pre-tax rate that reflects current market assessments of the time value of money and, where appropriate, the risks specific to the liability.
The Group performs liability adequacy tests on financial guarantee contract liabilities to ensure that the carrying amount of the liabilities is sufficient in view of estimated future cash flows. When performing the liability adequacy test, the Group discounts all the expected contractual cash flows and compares this amount to the carrying value of the liability. Where a shortfall is identified, an additional provision is made.
FINANCIAL INSTRUMENTSnon-derivative financial instruments
Non-derivative financial instruments comprise cash and cash equivalents, investments, trade and other receivables, loans, participation in export partnerships, trade and other payables and borrowings.
A financial instrument is recognised if the Group becomes a party to the contractual provisions of the instrument.
These financial instruments are initially recognised at fair value. For instruments not recognised at fair value through profit or loss, any directly attributable transaction costs are included.
Financial assets are derecognised if the Group’s contractual rights to the cash flows from the financial assets expire or if the Group transfers the financial assets to another party without retaining control or substantially all risks and rewards of the asset. Financial liabilities are derecognised if the Group’s obligations specified in the contract expire or are discharged or cancelled.
The subsequent measurement of financial instruments is stated below:
cash and cash equivalents
Cash and cash equivalents are measured at amortised cost. Cash and cash equivalents comprise cash on hand and amounts held on deposit at financial institutions. Bank overdrafts that are repayable on demand and form an integral part of the Group’s cash management are included as a component of cash and cash equivalents for the purpose of the statement of cash flows.
investments
Listed investments are valued at market value, which is calculated by reference to stock exchange quoted selling prices at the close of business at the reporting date. Other investments are shown at fair value. Gains or losses are recognised directly in equity in the revaluation reserve.
trade and other receivables and loans
Trade and other receivables and loans are measured at amortised cost, using the effective interest method, less impairment losses.
Accounting policies continued

75 Integrated Annual Report 2013
Repo
Rt to
stA
keh
old
eRs
GR
oU
p o
veR
vIew
CoR
poR
Ate
Go
veR
NA
NCe
AN
NU
Al fIN
AN
CIAl
stAtem
eNts
CoR
poR
Ate A
Nd
sh
AR
eho
ldeR
INfo
Rm
AtIo
N
Pick n Pay Group of Companies annual financial statements
Participation in export partnerships
The participation in export partnerships is measured at amortised cost using the effective interest method. Amortised cost is the cost of the original participation less subsequent principal repayments received, plus the cumulative amortisation of the difference between the initial amount, and the maturity amount less any write down for impairment or uncollectability.
For fair value purposes, any impairment in the amounts due to the Group by virtue of its participation in export partnerships would result in a corresponding reduction in the carrying value of the related deferred tax liability. Consequently, such impairment would have no impact on profit or loss of the Group.
trade and other payables
Trade and other payables are carried at amortised cost using the effective interest method.
Borrowings
Borrowings is carried at amortised cost. The interest expense recognised in profit or loss is calculated using the effective interest method.
off-set
Financial assets and financial liabilities are off-set and the net amount reported in the statement of financial position, when the Group has a legally enforceable right to set off the recognised amounts, and intends either to settle on a net basis, or to realise the net assets and settle the liability simultaneously.
DERIVATIVE FINANCIAL INSTRUMENTSThe Group holds derivative financial instruments to hedge its foreign currency risk exposures.
Derivatives are recognised initially at fair value; attributable transaction costs are recognised in profit or loss when incurred. Subsequent to initial recognition, derivatives are measured at fair value and changes in fair value are recognised in profit or loss.
HEDGE OF A NET INVESTMENT IN FOREIGN OPERATIONSThe Group applies hedge accounting to foreign currency differences arising between the functional currency of the foreign operation and the Group’s functional currency (Rand), regardless of whether the net investment is held directly or through an intermediate parent.
Foreign currency differences arising on the translation of a financial liability designated as a hedge of a net investment in a foreign operation are recognised in other comprehensive income to the extent that the hedge is effective, and are presented within equity in the foreign currency translation reserve.
To the extent that the hedge is ineffective, such differences are recognised in profit or loss. When the hedged net investment is disposed of, the relevant amount in the translation reserve is transferred to profit or loss as part of the profit or loss on disposal.
IMPAIRMENT OF ASSETSFinancial assets
The carrying amounts of financial assets not carried at fair value through profit or loss are reviewed at each reporting date to determine whether there is any indication of impairment. If any such indication exists, the asset’s recoverable amount is estimated.
A financial asset is considered to be impaired if objective evidence indicates that 1 or more events (loss events) have had a negative effect on the estimated future cash flows of the asset. Examples of loss events include financial difficulty and default on payment by the counterparty.
An impairment loss in respect of a financial asset measured at amortised cost is calculated as the difference between its carrying amount and the present value of the estimated future cash flows discounted at the original effective interest rate. An impairment loss in respect of an available-for-sale asset is calculated by reference to its current fair value.
Individually significant financial assets are tested for impairment on an individual basis. All the remaining financial assets are assessed collectively in groups that share similar credit risk characteristics.
Impairment losses are recognised in profit or loss and reflected in an allowance account against loans and receivables. When a decline in the fair value of an available-for-sale asset has been recognised directly in equity and there is objective evidence that the asset is impaired, the cumulative loss that had been recognised directly in equity is transferred to profit or loss. The amount of the cumulative loss that is recognised in profit or loss is the difference between the acquisition cost and the current fair value, less any impairment loss previously recognised.
non-financial assets
The carrying amounts of non-financial assets are reviewed at each reporting date to determine whether there is any indication of impairment. If any such indication exists, the asset’s recoverable amount is estimated.
For intangible assets that have indefinite useful lives such as goodwill or that are not yet available for use, the recoverable amount is estimated at each reporting date.
For the purpose of impairment testing, assets are grouped together into the smallest group of assets that generates cash inflows from continuing use that are largely independent of the cash inflows of other assets or groups of assets (the CGU).
The goodwill acquired in a business combination, for the purpose of impairment testing, is allocated to CGUs that are expected to benefit from the synergies of the combination.
An impairment loss is recognised whenever the carrying amount of an asset or its CGU exceeds its recoverable amount. Impairment losses are recognised in profit or loss. Impairment losses recognised in respect of CGUs are allocated first to reduce the carrying amount of any goodwill allocated to the CGUs (or groups of units) and then to reduce the carrying value of the other assets in the unit (or groups of units) on a pro rata basis.
76 2013 Integrated Annual Report
Pick n Pay Group of Companies annual financial statements
calculation of recoverable amount
The recoverable amount of an asset or CGU is the greater of its fair value less costs to sell and its value in use.
In assessing value in use, the estimated future cash flows are discounted to their present value using a pre-tax discount rate that reflects current market assessments of the time value of money and the risks specific to that asset or CGU. For an asset that does not generate largely independent cash inflows, the recoverable amount is determined for the CGU to which the asset belongs.
reversals of impairment
An impairment loss for a financial asset is reversed if the reversal can be related objectively to an event occurring after the impairment loss was recognised. For financial assets measured at amortised cost and available-for-sale financial assets that are debt securities, the reversal is recognised in profit or loss. For available-for-sale financial assets that are equity securities, the reversal is recognised directly in equity through other comprehensive income.
Impairment losses recognised in prior periods are assessed at each reporting date for any indications that the loss has decreased or no longer exists.
An impairment loss for a non-financial asset is reversed if there has been a change in the estimates used to determine the recoverable amount. An impairment loss is reversed only to the extent that the asset’s carrying amount does not exceed the carrying amount that would have been determined, net of depreciation or amortisation, if no impairment loss had been recognised. Impairment losses in respect of goodwill are not reversed.
SHARE CAPITALOrdinary shares are classified as equity. Incremental costs directly attributable to the issue of ordinary shares and share options are recognised as a deduction from equity, net of any tax effects.
TREASURY SHARESShares in the Company held by Group entities are classified as treasury shares. These shares are treated as a deduction from the weighted average number of shares in issue and the cost price of the shares is deducted from equity in the statement of changes in equity.
When treasury shares are sold or reissued, the amount received is recognised as an increase in equity, and the resulting surplus or deficit on the transaction is transferred to or from retained earnings.
Upon settlement (take-up) of share options by employees, the difference between the proceeds received from the employees and the purchase price of the shares is accounted for directly in retained earnings.
TURNOVERTurnover comprises retail sales to customers and wholesale sales to franchisees through the Group’s supply arrangements. All turnover is stated exclusive of value added tax.
TRADING PROFITTrading profit is net income and expenditure from trading operations, excluding interest received, interest paid, the Group’s share of its associates’ income or loss and profit or loss on transactions related to fixed and intangible assets.
REVENUE RECOGNITIONturnover
Revenue from the sale of goods is measured at the fair value of consideration received or receivable, net of returns, trade discounts and volume rebates. Revenue is recognised when persuasive evidence exists that the significant risks and rewards of ownership have been transferred to the customer, recovery of the consideration is probable, the associated costs and possible return of goods can be estimated reliably, there is no continuing management involvement with the goods, and the amount of revenue can be measured reliably. If it is probable that discounts will be granted and the amount can be measured reliably, then the discount is recognised as a reduction of revenue as the sales are recognised.
loyalty programme
The Group has a customer loyalty programme in South Africa, smartshopper, whereby customers are rewarded with smartshopper points (reward credits) which are effectively used as cash back against future purchases. For every Rand spent our customers earn 1 smartshopper point. 1 000 points equate to R10 back on future purchases. Bonus points are issued on promotions.
The fair value of the consideration received, under the smartshopper programme, is allocated between the goods supplied and the award credits granted. The consideration allocated to the award credits is measured by reference to their fair value which is calculated as the amount for which the award credits could be separately sold, adjusted for an expected forfeiture rate. Such consideration is not recognised as revenue at the time of the initial sale transaction, but is deferred and recognised as revenue when the award credits are redeemed and the Group’s obligations have been fulfilled. Deferred revenue is also released to revenue in profit or loss when it is no longer considered probable that the points will be redeemed, based on management’s judgement of expected redemption rates.
interest income
Interest income is recognised as it accrues in profit or loss, using the effective interest method, by reference to the principal amounts outstanding and at the interest rate applicable.
dividend income
Dividend income from investments is recognised when the right to receive payment is established.
Franchise fee
Franchise fee income and franchise fee income is recognised when the purchase or sale which gives rise to the income takes place.
Accounting policies continued

77 Integrated Annual Report 2013
Repo
Rt to
stA
keh
old
eRs
GR
oU
p o
veR
vIew
CoR
poR
Ate
Go
veR
NA
NCe
AN
NU
Al fIN
AN
CIAl
stAtem
eNts
CoR
poR
Ate A
Nd
sh
AR
eho
ldeR
INfo
Rm
AtIo
N
Pick n Pay Group of Companies annual financial statements
operating lease income
Income from operating leases in respect of property is recognised on a straight-line basis over the term of the lease.
BORROWING COSTSBorrowing costs relating to the acquisition, construction or production of qualifying assets are capitalised to the cost of the asset.
General borrowing costs are capitalised by calculating the weighted average expenditure on the qualifying asset and applying a weighted-average borrowing rate to the expenditure. Specific borrowing costs are capitalised when the borrowing facility is utilised specifically for the qualifying asset less any investment income on the temporary investment of these funds.
All other borrowing costs incurred are recognised as an expense in profit or loss and are accrued on an effective interest basis by reference to the principal amounts outstanding and at the interest rate applicable.
INCOME TAXIncome tax on the profit or loss for the period comprises current and deferred tax. Income tax is recognised in profit or loss except to the extent that it relates to items recognised in other comprehensive income or directly in equity, in which case it is recognised in other comprehensive income or directly in equity.
current tax
Current tax comprises tax payable calculated on the basis of the expected taxable income for the period using tax rates enacted or substantively enacted at the reporting date and any adjustment of tax payable for previous periods.
deferred tax
Deferred tax is recognised for all temporary differences between the carrying amounts of assets and liabilities for financial reporting purposes and the amounts used for tax purposes.
Deferred tax is not recognised for the following temporary differences: the initial recognition of goodwill; the initial recognition of assets or liabilities in a transaction that is not a business combination, and that affects neither accounting nor taxable profit; and investments in subsidiaries, associates, and interest in joint arrangements to the extent that the holding company has the ability to control the reversal of the temporary difference and it is probable that the temporary difference will not reverse in the foreseeable future.
The amount of deferred tax provided is based on the expected manner of realisation or settlement of the carrying amount of assets and liabilities using tax rates enacted or substantively enacted at the reporting date.
Deferred tax is charged to profit or loss, except to the extent that it relates to a transaction that is recognised directly in equity or other comprehensive income, or a business combination. The effect on
deferred tax of any changes in tax rates is recognised in profit or loss, except to the extent that it relates to items previously charged or credited to other comprehensive income or directly to equity, in which case it is recognised in other comprehensive income or directly in equity.
Deferred tax assets and liabilities are offset if there is a legally enforceable right to offset current tax liabilities and assets, and they relate to income taxes levied by the same tax authority on the same taxable entity, or on different tax entities, but they intend to settle current tax liabilities and assets on a net basis or their tax assets and liabilities will be realised simultaneously.
A deferred tax asset is recognised to the extent that it is probable that future taxable profits will be available against which the associated unused tax losses and deductible temporary differences can be utilised. Deferred tax assets are reviewed at each reporting date and are reduced to the extent that it is no longer probable that the related tax benefit will be realised.
Secondary tax on companies
Secondary tax on companies (STC) on net dividends paid is recognised as a tax charge in the period it is incurred. To the extent that it is probable that STC credits will be utilised, a deferred tax asset is raised. Effective 1 April 2012, STC has been replaced by dividend withholding tax. Dividend tax withheld on dividends paid is recognised as a liability until it is paid over to SARS.
FOREIGN CURRENCY TRANSACTIONStransactions in foreign currency
Transactions denominated in foreign currencies are translated to the functional currency of the Company and to the respective functional currencies of the Group entities at the rates of exchange ruling on the dates of the transactions. Gains or losses arising from such transactions are recognised in profit or loss on settlement date or reporting date, whichever is the earlier.
Monetary assets and liabilities denominated in foreign currencies at the reporting date are translated to the functional currency at the rates of exchange ruling at that date.
The foreign currency gain or loss on monetary items is the difference between amortised cost in the functional currency at the beginning of the period, adjusted for effective interest and payments during the period, and amortised cost in foreign currency translated at the exchange rate at the end of the period.
Non-monetary assets and liabilities denominated in foreign currencies that are measured at fair value are translated to the functional currency at the exchange rate at the date that the fair value was determined. Foreign exchange differences arising on translation are recognised in profit or loss. Non-monetary items that are measured in terms of historical cost in a foreign currency are translated using the exchange rate at the date of the transaction.

78 2013 Integrated Annual Report
Pick n Pay Group of Companies annual financial statements
Foreign operations
The assets and liabilities of foreign operations, including goodwill
and fair value adjustments arising on acquisition, are translated at
foreign exchange rates ruling at the reporting date. The revenues
and expenses of foreign operations are translated at the monthly
weighted average rate of exchange for the period. Profits or losses
arising on the translation of assets and liabilities of foreign entities
are recognised in other comprehensive income and presented
within equity in a foreign currency translation reserve.
When the settlement of a monetary item receivable from or payable
to a foreign operation is neither planned nor likely in the
foreseeable future, foreign exchange gains or losses arising from
such a monetary item are considered to form part of a net
investment in a foreign operation and are recognised in other
comprehensive income, and presented in the foreign currency
translation reserve in equity.
When a foreign operation is disposed of, the related amount in the
foreign currency translation reserve is transferred to profit or loss.
EMPLOYEE BENEFITSThe cost of all short-term employee benefits is recognised as an
expense during the period in which the employee renders the
related service.
Liabilities for employee entitlements to wages, salaries and leave
represent the amount that the Group has as a present obligation,
as a result of employee services provided to the reporting date, to
the extent that such obligation can be reliably estimated.
The accruals have been calculated at undiscounted amounts based
on current wage and salary rates.
Share-based payment transactions
The share ownership programme allows Group employees to
acquire shares in Pick n Pay Holdings Limited and Pick n Pay
Stores Limited.
The fair value of options granted after 7 November 2002 is
recognised as an employee expense with a corresponding increase
in equity. This treatment is consistently applied throughout the
Group for both Pick n Pay Stores Limited and Pick n Pay Holdings
Limited shares. The fair value is measured at grant date and
spread over the period during which the employees become
unconditionally entitled to the options. The fair value of the options
granted is measured using an actuarial binomial option pricing
model, taking into account the terms and conditions upon which
the options are granted. The amount recognised as an expense is
adjusted to reflect the actual number of share options that vest
except where forfeiture is due to share prices not achieving the
threshold for vesting.
A vested share option is “taken up” when the Group delivers the share to the employee on receipt of payment of the grant (strike) price.
retirement benefits
The Group operates several retirement schemes comprising a number of defined-contribution funds (one of which has a defined-benefit element), the assets of which are held in separate trustee-administered funds.
The retirement schemes are largely non-contributory and are funded by payments from the relevant Group companies.
defined-contribution plans
A defined-contribution plan is a post-employment benefit plan under which the Group pays fixed contributions into a separate legal entity and will have no legal or constructive obligation to pay further amounts.
Obligations for contributions to defined-contribution retirement plans are recognised as an expense in profit or loss when they are due.
Where the Group is responsible for providing retirement benefits to employees with a retirement scheme outside the Group, contributions are made on behalf of the employee and the cost is accounted for in the period in which the payment is made.
Contributions to a defined-contribution plan that are made more than 12 months after the end of the period in which the employees render the services are discounted to their present value.
defined-benefit plans
A defined-benefit plan is a post-employment benefit plan which is not a defined-contribution plan.
The Group’s net obligation in respect of the defined benefit is calculated separately by estimating the amount of future benefit that qualifying employees have earned in respect of their service to date; that benefit is discounted to determine its present value, and the fair value of any plan assets is deducted. The calculation is performed by an actuary using the projected unit credit method.
When the benefits of a plan are improved, the portion of the increased benefit relating to past service by employees is recognised as an expense in profit or loss on a straight-line basis over the average period until the benefits vest.
To the extent that the benefits vest immediately, the expense is recognised immediately in profit or loss.
Actuarial gains and losses are recognised in other comprehensive income as incurred.
CAPITALISATION SHARE AWARDS AND CASH DIVIDENDSThe full value of capitalisation share awards and cash dividends are recorded as a deduction from retained earnings in the statement of changes in equity. Upon allotment of shares in terms of a capitalisation share award, the share election amounts are
transferred to the share capital account and share premium account.
Accounting policies continued

79 Integrated Annual Report 2013
Repo
Rt to
stA
keh
old
eRs
GR
oU
p o
veR
vIew
CoR
poR
Ate
Go
veR
NA
NCe
AN
NU
Al fIN
AN
CIAl
stAtem
eNts
CoR
poR
Ate A
Nd
sh
AR
eho
ldeR
INfo
Rm
AtIo
N
Pick n Pay Group of Companies annual financial statements
EARNINGS PER SHAREThe Group presents basic and diluted earnings per share (EPS)
information for its ordinary shares. Basic EPS is calculated by
dividing the profit or loss attributable to ordinary shareholders
of the Company by the weighted average number of ordinary
shares outstanding during the period, adjusted for own shares
held. Diluted EPS is determined by adjusting the weighted average
number of ordinary shares outstanding for the effects of all
dilutive potential ordinary shares, which comprise share options
granted to employees.
DISCONTINUED OPERATIONA discontinued operation is a component of the Group’s business
that represents a separate major line of business or geographical
area of operations that has been disposed of or is held for sale, or is
a subsidiary acquired exclusively with a view to resell. Classification
as a discontinued operation occurs upon disposal or when the
operation meets the criteria to be classified as held for sale, if
earlier. When an operation is classified as a discontinued
operation, the comparative statement of comprehensive income is
re-presented as if the operation had been discontinued from the
start of the comparative period.
OPERATING SEGMENTSThe Group discloses segmental financial information which is
used internally by the entity’s Chief Operating Decision Maker
(CODM) in order to assess performance and allocate resources.
Operating segments are individual components of an entity that
engages in business activities from which it may earn revenues
and incur expenses, and whose operating results are regularly
reviewed by the entity’s CODM and for which discrete financial
information is available.
Operating segments that display similar economic characteristics
are aggregated for reporting purposes.

80 2013 Integrated Annual Report
Group
2013 2012rm Rm
1. Revenue – continuing opeRationsRevenue comprises:Turnover 59 271.3 55 330.5 Interest received 42.8 39.5
Bank balances and investments 30.0 30.4 Trade and other receivables 9.7 4.9 Staff loans and other 3.1 4.2
Other trading income 344.4 264.4
Franchise fee income 284.0 234.3 Operating lease income 60.4 30.1
59 658.5 55 634.4
The Group has a customer loyalty programme, smartshopper, whereby customers are rewarded with smartshopper points (reward credits) which are effectively redeemed as cash against future purchases. At period end the Group has deferred revenue of R139.8 million (2012: R142.0 million) which represents the fair value of the smartshopper points granted and yet to be redeemed, adjusted for an expected forfeiture rate of 25% (2012: 22%) (refer note 24).
pick n pay StoreS Group
pick n pay HoldinGSGroup
2013 2012 2013 2012rm Rm rm Rm
2. pRofit befoRe tax – continuing opeRations2.1 profit before tax is stated after taking into account the
following expenses:Auditor’s remuneration 7.2 5.9 7.3 6.0
Assurance services 7.1 5.6 7.2 5.7 Other services 0.1 0.3 0.1 0.3
Amortisation (note 9) 145.8 101.0 145.8 101.0 Depreciation (note 10) 749.7 707.1 749.7 707.1 Impairment of trade and other receivables (note 18) 111.2 68.5 111.2 68.5
2.2 employee costs – continuing operationsSalaries and wages 4 243.3 4 010.5 4 243.3 4 010.5 Staff benefits and training 316.3 269.1 316.3 269.1 Contributions to defined-contribution plans (note 23.2) 278.6 261.8 278.6 261.8 Share-based payments expense (note 4.3) 91.3 95.7 91.3 95.7 Net expense recognised on defined-benefit plan (note 23.1) 17.6 19.4 17.6 19.4 Leave pay 4.9 2.0 4.9 2.0
4 952.0 4 658.5 4 952.0 4 658.5
2.3 interest paid 131.3 135.1 131.3 135.1
Finance leases 6.5 7.4 6.5 7.4 Bank overdrafts 22.7 52.1 22.7 52.1 Borrowings 102.1 75.6 102.1 75.6
Notes to the Group annual financial statementsfor the period ended 3 March 2013

81 Integrated Annual Report 2013
Repo
Rt to
stA
keh
old
eRs
GR
oU
p o
veR
vIew
CoR
poR
Ate
Go
veR
NA
NCe
AN
NU
Al fIN
AN
CIAl
stAtem
eNts
CoR
poR
Ate A
Nd
sh
AR
eho
ldeR
INfo
Rm
AtIo
N
3. DiRectoRs’ RemuneRation For full disclosure of directors’ remuneration, directors’ interest in shares and share options held by directors refer to the remuneration reports on pages 41 to 47 and 52 and 53.
Fees for board
meetings
Fees for com-
mittee and
other work
remune-ration
retire-ment
and medical
contri-butions
Fringe and
other benefits
cash total
iFrS 2: expense relating to share options granted
r’000 r’000 r’000 r’000 r’000 r’000 r’000
pick n pay StoreS Group2013Non-executive directors 2 149.7 1 418.0 — — — 3 567.7 —Executive directors 9.0 — 14 803.5 1 202.9 734.0 16 749.4 5 943.6
Total remuneration 2 158.7 1 418.0 14 803.5 1 202.9 734.0 20 317.1 5 943.6
2012Non-executive directors 4 900.2 1 064.3 — — — 5 964.5 —Executive directors 7.5 — 11 542.1 1 567.7 11 437.6 24 554.9 9 069.6
Total remuneration 4 907.7 1 064.3 11 542.1 1 567.7 11 437.6 30 519.4 9 069.6
pick n pay HoldinGS Group2013Non-executive directors 2 320.7 1 418.0 — — — 3 738.7 —Executive directors 9.0 — 14 803.5 1 202.9 734.0 16 749.4 5 943.6
Total remuneration 2 329.7 1 418.0 14 803.5 1 202.9 734.0 20 488.1 5 943.6
2012Non-executive directors 5 059.2 1 064.3 — — — 6 123.5 —Executive directors 7.5 — 11 542.1 1 567.7 11 437.6 24 554.9 9 069.6
Total remuneration 5 066.7 1 064.3 11 542.1 1 567.7 11 437.6 30 678.4 9 069.6
4. shaRe-baseD payments The Group operates an Employee Share Option Scheme (the Scheme). The Scheme is administered by the Employee Share Purchase Trust (the share trust) and its Board of trustees. All options are granted in accordance with the rules of the Scheme, which have been approved by the shareholders and the JSE.
All options are granted at the volume-weighted average market price (VWAP) for the 20 trading days preceding the option grant date. No discount is applied.
All share options granted after 11 June 2008 will, at the time of exercise by the employee, be automatically net settled by Pick n Pay Stores Limited. For all options granted prior to 11 June 2008, the employee can choose whether to net settle the options, or whether to pay the purchase price in full to take up the total allotment of shares (gross settle).
All vested share options have to be exercised, paid for (or net settled) and taken up within 10 years of the grant date. The directors are authorised to utilise up to 13.3% of the issued share capital for the Scheme.
The Scheme grants the following options to employees:Service share options in pick n pay Holdings limited – are granted to all permanent employees who have been with the Group for 5 years and further options are granted every 5 years thereafter.
Service share options may be taken up immediately on granting.
Status share options in pick n pay Stores limited – are granted to employees who attain manager status and further options are granted at each promotion to higher levels of management.
Status share options may be taken up in 3 tranches as follows:40% after 3 years30% after 5 years30% after 7 years
retention share options in pick n pay Stores limited – further share allocations are also made for the retention of key executives, with longer vesting dates of up to 10 years.
executive share options in pick n pay Stores limited – are granted to senior executives. These 5 year options may only be taken up when prescribed performance conditions linked to the growth of Pick n Pay Stores Limited’s share price are met. If the conditions are not met, these options are automatically forfeited. Should further performance hurdles be achieved, discounted grant prices may apply. Refer to the remuneration report on pages 41 to 47 for further details.

82 2013 Integrated Annual Report
pick n pay StoreS Group
pick n pay HoldinGS Group
2013number
of options000’s
2012Number
of options 000’s
2013number
of options000’s
2012Number
of options 000’s
4. shaRe-baseD payments continued4.1 outstanding share options
Movement in the total number of share options granted is as follows:at beginning of period 54 244.9 53 148.8 12 107.4 9 824.6 New options granted* 6 022.4 6 287.5 3 159.8 3 230.4 Options taken up** (5 298.9) (2 442.5) (892.9) (918.8) Options forfeited (2 118.8) (2 748.9) (419.0) (28.8)
at end of period 52 849.6 54 244.9 13 955.3 12 107.4
outstanding options may be taken up during the following financial periods:
average grant price
year
pick n pay Stores Group
pick n pay Holdings
Group2014 R34.48 R12.02 31 999.2 13 955.3 2015 R34.04 6 618.2 —2016 R34.89 5 100.9 —2017 R37.98 4 637.9 —2018 and thereafter R37.24 4 493.4 —
52 849.6 13 955.3
Percentage of issued shares 11.0% 11.3% 2.6% 2.1%Options available for granting under current authorisation (000’s) 11 043.0 9 647.9 78 313.3 80 161.2 *Average grant price of options granted during the period r44.85 R41.58 r15.36 R15.35**Average grant price of options taken up during the period r27.94 R24.48 r12.68 R10.93For details of share options held by directors refer to the remuneration reports on pages 41 to 47 and 52 and 53.
000’s 000’s 000’s 000’s
the employee Share purchase trust, which administers the 1997 employee Share option Scheme, holds the following number of ordinary shares:As a hedge against share options granted or to be granted, reflected as treasury shares 2 046.6 2 482.2 9 115.8 9 011.0
On behalf of share purchase scheme participants 133.1 144.3 389.8 426.2
2 179.7 2 626.5 9 505.6 9 437.2
4.2 Fair valueThe fair value of share options granted to employees are valued at the grant date and expensed through the statement of comprehensive income over the vesting period of the option.The fair value of each option grant in Pick n Pay Stores Limited (PIK) and Pick n Pay Holdings Limited (PWK) has been estimated on the grant date using an actuarial binomial option pricing model. The assumptions used in determining the fair value of the options granted in each financial period are as follows:
Financial period
of grantOptions granted
Number of options granted
000’s
Expected life of
options years
Share price at grant date Grant price
Expected volatilitya
Expected dividend
yieldb Risk-free
ratec
2012 PWK 2 230.4 1 R16.50 R16.50 20.66 4.49 5.602012 PIK 6 287.5 3 – 7 R37.36 – R47.23 R37.29 – R47.10 24.24 – 25.72 3.68 – 4.16 6.40 – 8.382013 pWk 3 159.8 1 r19.58 – r20.41 r18.00 – r20.04 22.82 – 23.85 3.61 – 4.04 5.69 – 6.972013 pik 6 022.4 3 – 7 r37.00 – r48.49 r32.65 – r46.37 22.24 – 24.74 3.24 – 3.62 5.76 – 7.94
a The expected volatility is determined based on the rolling historical volatility over the expected option term that prevailed at the grant date.b The expected dividend yield is the best estimate of the forward looking dividend yield over the expected life of the option. This has been estimated by
reference to the historical average dividend yield during the period preceding the grant, equal to the vesting period of the grant. c The risk-free rate is the yield on zero-coupon South African government bonds of a term consistent with the estimated option term.
Notes to the Group annual financial statementsfor the period ended 3 March 2013

83 Integrated Annual Report 2013
Repo
Rt to
stA
keh
old
eRs
GR
oU
p o
veR
vIew
CoR
poR
Ate
Go
veR
NA
NCe
AN
NU
Al fIN
AN
CIAl
stAtem
eNts
CoR
poR
Ate A
Nd
sh
AR
eho
ldeR
INfo
Rm
AtIo
N
Group
2013 2012rm Rm
4. shaRe-baseD payments continued4.3 Share-based payment expense
total expensed to date – beginning of period 407.8 312.1 Share options expense for the period 91.3 95.7
total expensed to date – end of period 499.1 407.8 Share options expense to be recognised in future financial periods, in respect of all options granted since 2003, is:Within 1 year 74.3 75.5 Within 2 to 5 years 82.6 110.0 After 5 years 3.9 3.9
total expense to be recognised 160.8 189.4
total current and future share-based payment expense 659.9 597.2
5. tax5.1 tax recognised in the statement of comprehensive income
Normal tax 316.8 359.0
– current period 280.4 360.7 – prior period under/(over) provision 36.4 (1.7)
Deferred tax (note 13) (58.5) (11.9) Secondary tax on companies — 60.6
total tax charge recognised in the statement of comprehensive income 258.3 407.7
tax charge relating to the sale of discontinued operation — 55.0
5.2 tax recognised directly in equityTax effect of share incentive transactions recorded directly in equity (22.0) (11.4) Tax effect of forward exchange contracts realised directly in equity — 2.3
total recognised directly in equity (22.0) (9.1)
5.3 Statutory tax rate reconciliation % % Statutory tax rate 28.0 28.0 Exempt income (3.9) (1.6) Secondary tax on companies — 5.2 Non-deductible share options expense 3.0 2.2 Other non-deductible expenditure 3.9 1.1 Capital gains tax 0.4 —Net prior year under/(over) provisions 0.5 (0.1) Other — 0.1
effective tax rate 31.9 34.9
rm Rm 5.4 tax paid
Owing – beginning of period 99.6 96.2 Movement through statement of comprehensive income
Current tax charge – continuing operations 316.8 359.0 Secondary tax on companies — 60.6
Tax charge relating to the sale of discontinued operation — 55.0 Movement through equity (22.0) (9.1) Owing – end of period (82.8) (99.6)
total tax paid 311.6 462.1
6. DiscontinueD opeRationinterfrank Group Holdings pty limited (Franklins)In September 2011, after a legal dispute with the Australian Competition and Consumer Commission, the Group sold its Australian business, Franklins, to Metcash Limited for R1.2 billion, net of fees. The operational loss of Franklins for the 7 months to 30 September 2011 of R87.2 million and the subsequent profit on sale of the business of R438.4 million, net of tax, was disclosed separately as a discontinued operation.

84 2013 Integrated Annual Report
pick n pay StoreS Group
pick n pay HoldinGS Group
2013cents
per share
2012Cents
per share
2013cents
per share
2012Cents
per share
7. basic, heaDLine anD DiLuteD eaRnings peR shaReBasic 115.14 233.21 57.03 115.91
Continuing operations 115.14 159.64 57.03 79.24 Discontinued operation — 73.57 — 36.67
Diluted basic 113.39 228.69 55.57 112.48
Continuing operations 113.39 156.55 55.57 76.16 Discontinued operation — 72.14 — 36.32
Headline 111.30 142.69 55.11 70.79
Continuing operations 111.30 160.78 55.11 79.81 Discontinued operation — (18.09) — (9.02)
Diluted headline 109.61 139.92 53.70 68.69
Continuing operations 109.61 157.67 53.70 77.63 Discontinued operation — (17.75) — (8.94)
7.1 Basic and headline earnings rm Rm rm Rm
reconciliation between basic and headline earnings:Basic earnings (profit for the period) 550.6 1 113.5 294.5 598.6
Continuing operations 550.6 762.3 294.5 409.2 Discontinued operation — 351.2 — 189.4
Adjustments:
Continuing operations (18.4) 5.5 (9.9) 2.9
(Profit)/loss on sale of property, equipment and vehicles and intangible assets (21.6) 7.6 (11.6) 4.0 Tax effect of profit/(loss) on sale of property, equipment and vehicles and intangible assets 3.2 (2.1) 1.7 (1.1)
Discontinued operation — (437.6) — (236.0)
Loss on sale of property, equipment and vehicles and intangible assets — 0.8 — 0.3 Profit on sale of discontinued operation — (493.4) — (265.9) Tax effect relating to sale of discontinued operation — 55.0 — 29.6
Headline earnings 532.2 681.4 284.6 365.5
Continuing operations 532.2 767.8 284.6 412.1 Discontinued operation — (86.4) — (46.6)
000’s 000’s 000’s 000’s
7.2 number of sharesMovement in the weighted average number of ordinary shares in issue comprises: at beginning of period 477 450.4 475 770.3 516 360.5 515 857.7 Effect of current period share repurchases by the share trust (899.7) (478.7) (268.8) (326.7) Effect of share sales on the take up of share options 1 117.5 943.5 216.1 359.0 Prior period net share sales/repurchases now fully weighted 464.7 1 215.3 32.4 470.5
at end of period 478 132.9 477 450.4 516 340.2 516 360.5 Dilutive effect of share options 7 385.9 9 434.2 5 192.8 4 895.6
diluted weighted average number of ordinary shares in issue 485 518.8 486 884.6 521 533.0 521 256.1
Refer to note 20 for the number of shares in issue.
Notes to the Group annual financial statements continuedfor the period ended 3 March 2013

85 Integrated Annual Report 2013
Repo
Rt to
stA
keh
old
eRs
GR
oU
p o
veR
vIew
CoR
poR
Ate
Go
veR
NA
NCe
AN
NU
Al fIN
AN
CIAl
stAtem
eNts
CoR
poR
Ate A
Nd
sh
AR
eho
ldeR
INfo
Rm
AtIo
N
pick n pay StoreS Group
2013 cents
per share
2012 Cents
per share
8. DiviDenDs 8.1 dividends paid
Number 88 – declared 16 April 2012 – paid 11 June 2012 (2012: Number 86 – declared 15 April 2011 – paid 13 June 2011) 108.35 105.50 Number 89 – declared 23 October 2012 – paid 18 December 2012 (2012: Number 87 – declared 18 October 2011 – paid 12 December 2011) 14.75 22.50
total dividends for the period 123.10 128.00
rm Rm
total value of dividends paid by the company 591.4 614.9 Dividends paid on treasury shares (7.9) (9.5)
total dividends paid outside the pick n pay Stores Group 583.5 605.4
pick n pay HoldinGS Group
2013 cents
per share
2012 Cents
per share Number 61 – declared 16 April 2012 – paid 11 June 2012 (2012: Number 59 – declared 15 April 2011 – paid 13 June 2011) 52.57 51.34 Number 62 – declared 23 October 2012 – paid 18 December 2012 (2012: Number 60 – declared 18 October 2011 – paid 12 December 2011) 7.17 10.91
total dividends for the period 59.74 62.25
rm Rm
total value of dividends paid by the company 315.0 328.2 Dividends paid by subsidiary companies to non-controlling shareholders 268.5 277.2
total dividends paid by the pick n pay Holdings Group 583.5 605.4
pick n pay StoreS Group
2013 cents
per share
2012 Cents
per share
8.2 dividends declaredInterim dividend – number 89 (2012: number 87) 14.75 22.50 Final dividend – number 90 (2012: number 88) 69.25 108.35
84.00 130.85
The directors have declared a final dividend (dividend 90) of 69.25 cents per share out of income reserves. The dividend is subject to dividend withholding tax at 15%.
The last day to trade in order to participate in the dividend (CUM dividend) will be Friday, 7 June 2013. The shares will trade Ex dividend from the commencement of business on Monday, 10 June 2013 and the record date will be Friday, 14 June 2013. The dividends will be paid on Tuesday, 18 June 2013.
pick n pay HoldinGS Group
2013 cents
per share
2012 Cents
per share
Interim dividend – number 62 (2012: number 60) 7.17 10.91 Final dividend – number 63 (2012: number 61) 33.61 52.57
40.78 63.48
The directors have declared a final dividend (dividend 63) of 33.61 cents per share out of income reserves. The dividend is subject to dividend withholding tax at 15%.
The last day to trade in order to participate in the dividend (CUM dividend) will be Friday, 7 June 2013. The shares will trade Ex dividend from the commencement of business on Monday, 10 June 2013 and the record date will be Friday, 14 June 2013. The dividends will be paid on Tuesday, 18 June 2013.

86 2013 Integrated Annual Report
Group
Goodwill rm
Systems develop-
ment rm
licences rm
total rm
9. intangibLe assets2013carrying value 233.5 642.1 72.3 947.9
Cost 254.4 1 054.6 122.6 1 431.6 Accumulated amortisation (20.9) (412.5) (50.3) (483.7)
reconciliation of carrying valuecarrying value at beginning of period 201.5 531.3 66.8 799.6 Additions — 242.4 — 242.4
Expansion of operations — 192.0 — 192.0 Maintaining operations — 50.4 — 50.4
Amortisation — (128.9) (16.9) (145.8)Disposals — (9.4) — (9.4)Purchase of operations 32.0 — 9.8 41.8 Foreign currency translation — (0.9) — (0.9) Reclassifications from property, equipment and vehicles — 7.6 12.6 20.2
carrying value at end of period 233.5 642.1 72.3 947.9
2012carrying value 201.5 531.3 66.8 799.6
Cost 222.4 812.9 100.2 1 135.5 Accumulated amortisation (20.9) (281.6) (33.4) (335.9)
reconciliation of carrying valuecarrying value at beginning of period 142.4 222.1 40.0 404.5 Additions — 271.7 — 271.7
Expansion of operations — 240.8 — 240.8 Maintaining operations — 30.9 — 30.9
Amortisation — (97.0) (4.0) (101.0)Disposals — (4.3) — (4.3)Purchase of operations 59.1 — 30.5 89.6 Reclassifications from property, equipment and vehicles — 138.8 0.3 139.1
carrying value at end of period 201.5 531.3 66.8 799.6
The cash-generating units to which goodwill has been allocated have been identified. The recoverable amount for each cash-generating unit was based on value in use. The value in use was determined by discounting the future cash flow forecast for the cash-generating unit at an appropriate pre-tax rate.
Notes to the Group annual financial statements continuedfor the period ended 3 March 2013

87 Integrated Annual Report 2013
Repo
Rt to
stA
keh
old
eRs
GR
oU
p o
veR
vIew
CoR
poR
Ate
Go
veR
NA
NCe
AN
NU
Al fIN
AN
CIAl
stAtem
eNts
CoR
poR
Ate A
Nd
sh
AR
eho
ldeR
INfo
Rm
AtIo
N
Group
land and buildings
rm
Furniture, fittings,
equipmentand
vehiclesrm
leasehold improve-
mentsrm
aircraft rm
total rm
10. pRopeRty, equipment anD vehicLes2013carrying value 1 522.9 2 052.2 321.2 21.4 3 917.7
Cost 1 720.0 4 903.3 888.0 73.8 7 585.1Accumulated depreciation (197.1) (2 851.1) (566.8) (52.4) (3 667.4)
reconciliation of carrying valuecarrying value at beginning of period 1 560.3 1 930.4 346.2 27.0 3 863.9 Additions 160.1 701.0 102.6 — 963.7
Expansion of operations 159.0 332.9 59.9 — 551.8 Maintaining operations 1.1 368.1 42.7 — 411.9
Borrowing costs capitalised† 6.4 — — — 6.4
Depreciation (35.6) (604.8) (103.7) (5.6) (749.7)Disposals (168.3) (30.3) (1.9) — (200.5)Purchase of operations — 40.8 — — 40.8 Reclassifications to intangible assets — 1.8 (22.0) — (20.2)Foreign currency translation — 13.3 — — 13.3
carrying value at end of period* 1 522.9 2 052.2 321.2 21.4 3 917.7
2012carrying value 1 560.3 1 930.4 346.2 27.0 3 863.9
Cost 1 722.9 4 566.7 892.9 73.7 7 256.2 Accumulated depreciation (162.6) (2 636.3) (546.7) (46.7) (3 392.3)
reconciliation of carrying valuecarrying value at beginning of period 1 149.0 1 933.0 289.8 30.0 3 401.8 Additions 439.5 572.7 317.2 2.6 1 332.0
Expansion of operations 428.2 246.7 51.5 — 726.4 Maintaining operations 11.3 326.0 265.7 2.6 605.6
Borrowing costs capitalised†
7.3 — — — 7.3 Depreciation (34.9) (411.8) (254.8) (5.6) (707.1)Disposals (0.6) (41.2) (6.0) — (47.8)Purchase of operations — 16.8 — — 16.8 Reclassifications to intangible assets — (139.1) — — (139.1)
carrying value at end of period* 1 560.3 1 930.4 346.2 27.0 3 863.9
Property with a carrying value of R649.3 million (2012: R670.2 million) (directors’ valuation – R1 200.7 million (2012: R1 138.0 million)) is provided as security for long-term borrowings (refer note 22).
* Included in the carrying value of property, equipment and vehicles is leased vehicles with a carrying value of R97.3 million (2012: R101.7 million) secured by lease liabilities (note 22).
† Borrowing costs are capitalised on qualifying assets. The weighted average expenditure incurred on qualifying assets was R190.2 million (2012: R223.4 million) and the weighted average borrowing rate was 5.54% (2012: 5.78%).

88 2013 Integrated Annual Report
Group
2013 2012rm Rm
11. opeRating LeasesThe Group has entered into various operating lease agreements in respect of premises. Leases on premises are contracted for periods of between 10 and 20 years (2012: 10 and 20 years) with renewal options for a further 10 to 20 years (2012: 10 and 20 years). Rentals comprise minimum monthly payments and additional payments based on turnover levels. Turnover rentals, where applicable, average 1.5% (2012: 1.5%) of turnover. Rental escalations vary but average 6.5% (2012: 6.5%) per annum.
Operating lease charges 1 240.2 1 058.9
Property – minimum lease payments 1 201.3 1 024.9 – turnover payments 38.9 34.0
Leases contained within service agreements 205.2 170.6
11.1 operating lease assetat beginning of period 84.8 37.7 Accrual for future lease income 20.7 47.1
at end of period 105.5 84.8
At the end of the period future minimum rentals receivable from non-cancellable sublease contracts amount to:Cash flow due in 2014 256.4 241.8 Cash flow due in 2015 to 2018 738.4 655.6 Cash flow due after 2018 1 002.8 789.1
total future cash flows 1 997.6 1 686.5 Less: Operating lease asset (105.5) (84.8)
total operating lease income receivable 1 892.1 1 601.7
11.2 operating lease liabilityat beginning of period 829.1 729.3 Accrual for future lease expenditure 95.5 99.8
at end of period 924.6 829.1
At the end of the period future non-cancellable minimum lease rentals are payable during the following financial years:Cash flow due in 2014 1 234.6 1 089.6 Cash flow due in 2015 to 2018 4 424.8 3 909.4 Cash flow due after 2018 6 143.3 5 058.3
total future cash flows 11 802.7 10 057.3 Less: Operating lease liability (924.6) (829.1)
total operating lease commitments 10 878.1 9 228.2
12. paRticipation in expoRt paRtneRshipsBalance at beginning of period 34.8 41.5Current portion included in trade and other receivables (6.7) (6.7)
Balance at end of period 28.1 34.8
The Group participated in various export partnerships, the business of which was the purchase and export sale of marine containers. The partnerships bought and sold containers in terms of long-term suspensive purchase and credit sale agreements respectively, with repayment terms usually over a 10 to 15-year period.
The last trade took place in the 1999 financial year. The current balance disclosed in respect of participation in export partnerships is the remaining long-term receivable.
For fair value purposes, any impairment in the amounts due to the Group by virtue of its participation in export partnerships would result in a corresponding reduction in the carrying value of the related deferred tax liability. Consequently, such impairment would have no impact on the statement of comprehensive income of the Group.
Notes to the Group annual financial statements continuedfor the period ended 3 March 2013

89 Integrated Annual Report 2013
Repo
Rt to
stA
keh
old
eRs
GR
oU
p o
veR
vIew
CoR
poR
Ate
Go
veR
NA
NCe
AN
NU
Al fIN
AN
CIAl
stAtem
eNts
CoR
poR
Ate A
Nd
sh
AR
eho
ldeR
INfo
Rm
AtIo
N
Group
2013 2012rm Rm
13. DefeRReD tax assetsThe movement in deferred tax assets are as follows:at beginning of period 116.5 85.8 recognised in the statement of comprehensive income (note 5.1) 58.5 11.9
Participation in export partnerships 6.7 6.9 Property, equipment and vehicles and intangible assets (12.4) (7.1) Net operating lease liability 19.6 13.7 Retirement benefits (2.5) (2.2) Prepayments (0.2) (0.2) Allowance for impairment losses 13.6 (4.6) Income and expense accruals 33.7 5.4
recognised in other comprehensive incomeTax effect of foreign currency translations — 39.7 Tax effect of actuarial gains (0.6) (2.9) Tax effect of forward exchange contract unrealised loss — (18.0)
at end of period 174.4 116.5
Comprising:Participation in export partnerships (35.3) (42.0) Property, equipment and vehicles and intangible assets (140.6) (128.2) Net operating lease liability 206.2 186.6 Retirement benefits and actuarial (gains)/losses (0.6) 2.5 Prepayments (4.9) (4.7) Allowance for impairment losses 47.5 33.9 Income and expense accruals 102.1 68.4
total deferred tax assets 174.4 116.5
The Group has approximately R132.6 million (2012: R188.9 million) of estimated tax losses available for set-off against future taxable income, for which no deferred tax assets have been raised.
14. investment in associate14.1 tM Supermarkets (pvt) limited
The Group has a 49% investment in TM Supermarkets (Pvt) Limited registered in Zimbabwe.at beginning of period 110.5 9.9 Share of associate’s income/(loss) 23.4 (1.9) Subscription for additional 24% interest — 102.5
at end of period 133.9 110.5
Summary financial information of TM Supermarkets (Pvt) Limited – presented in US Dollars (the associate’s functional currency) uS$m US$m
Statement of comprehensive incomeTurnover 306.7 291.6Profit/(loss) for the period 5.9 (0.9) Statement of financial positionTotal assets 54.0 53.3 Total liabilities 32.7 35.5 Equity 21.3 17.8

90 2013 Integrated Annual Report
14. investment in associate continued
14.2 related party transactionsThe nature of the transactions between the associate and the Group consists mainly of the sale of inventory.
2013rm
2012Rm
The following related party transactions occurred during the period:Sale of inventoryTM Supermarkets (Pvt) Limited 35.7 2.1The following trade receivable balance is outstanding at end of period:TM Supermarkets (Pvt) Limited 15.2 —
pick n pay StoreS Group
pick n pay HoldinGS Group
2013 2012 2013 2012rm Rm rm Rm
15. LoansThe following loans have been advanced by subsidiary companies:employees
executive directorsAt beginning of period 0.4 0.5 0.4 0.5 Repaid — (0.1) — (0.1) At end of period 0.4 0.4 0.4 0.4 Other employees 93.6 76.8 93.6 76.8
total employee loans 94.0 77.2 94.0 77.2 other loans 4.5 3.6 4.9 4.0
total loans at end of period 98.5 80.8 98.9 81.2
Loans to directors and employees are secured, bear interest at varying rates subject to an average rate of 3.3% per annum and have varying repayment terms. Loans to employees from the Employee Share Purchase Trust are payable within 10 years from the date of advance.
Group2013 2012
rm Rm
16. avaiLabLe-foR-saLe investmentunlisted shares at fair valueBusiness Partners Limited200 000 (2012: 200 000) shares at R1 each 0.2 0.2
This available-for-sale investment is stated at original purchase cost. The shares are unlisted and no active market exists where they can be traded easily. Based on management’s evaluation and judgement, management believes that original cost approximates fair value and that the investment is therefore not impaired.
Notes to the Group annual financial statements continuedfor the period ended 3 March 2013

91 Integrated Annual Report 2013
Repo
Rt to
stA
keh
old
eRs
GR
oU
p o
veR
vIew
CoR
poR
Ate
Go
veR
NA
NCe
AN
NU
Al fIN
AN
CIAl
stAtem
eNts
CoR
poR
Ate A
Nd
sh
AR
eho
ldeR
INfo
Rm
AtIo
N
Group2013 2012
rm Rm
17. inventoRyMerchandise for resale 3 962.6 3 311.0 Consumables 33.9 23.9
3 996.5 3 334.9
During the period an amount of R35.7 million (2012: nil) was acquired as a result of the purchase of operations
18. tRaDe anD otheR ReceivabLesTrade and other receivables 2 606.9 2 282.0 Allowance for impairment losses (246.0) (161.4)
total trade and other receivables, net of allowance for impairment losses 2 360.9 2 120.6
The ageing of trade and other receivables at end of period was:trade and other receivables not impairedWithin payment terms 1 888.6 1 728.2Exceeding payment terms by less than 14 days 112.0 78.6 Exceeding payment terms by more than 14 days 48.9 45.2
2 049.5 1 852.0 trade and other receivables with impairmentsWithin payment terms 241.3 217.4 Exceeding payment terms by less than 14 days 27.5 21.1 Exceeding payment terms by more than 14 days 288.6 191.5
557.4 430.0 The movement in the allowance for impairment of trade and other receivables during the period was as follows:Balance at beginning of period 161.4 183.2
Irrecoverable debts written off (26.6) (76.1) Additional impairment losses recognised 111.2 68.5 Prior allowances for impairment reversed — (14.2)
at end of period 246.0 161.4
The fair value of trade and other receivables is estimated as the present value of future cash inflows discounted at a market-related interest rate.
The Group makes allowance for specific trade debtors which have clearly indicated financial difficulty and the likelihood of repayment has become impaired. More than 80% (2012: 80%) of the balance relates to customers that have an excellent credit history with the Group.
Impairment losses are recorded in the allowance account until the Group is satisfied that no recovery of the amount owing is possible, at which point the amount is considered irrecoverable and is written off against the financial asset directly.
19. cash anD cash equivaLents 1 255.7 1 271.7
Cash at bank and cash on hand 1 255.7 271.7 Cash investments — 1 000.0
(1 525.6) —
Bank overdraft (25.6) —Overnight bank borrowings (1 500.0) —
at end of period (269.9) 1 271.7 cash at bank and cash on handCash at bank and cash on hand includes cash floats at stores as well as the Group’s current account balance. The Group’s primary banker, which has a long-term credit rating of AAA (zaf), facilitates the collection of cash at stores, provides general banking facilities and facilitates the payment of suppliers via an electronic banking platform. Interest rates earned on current account balances are linked to the South African prime rate of 8.5% p.a. (2012: 9.0% p.a.)
cash investmentsThe Group invests surplus cash throughout the year in money market funds with low levels of risk and high levels of liquidity. The funds are exposed primarily to the top 4 South African banks and have minimum rating requirements of AA (zaf). Nominal returns on the funds varied between 5.3% p.a. and 5.6% p.a. (2012: 5.7% p.a.)
Bank overdraftThe bank overdraft is secured by an unlimited suretyship given by Pick n Pay Stores Limited and certain subsidiary companies. The average interest rate on the overdraft was 7.0% p.a. (2012: 7.5% p.a.)
overnight bank borrowingsThe Group utilised overnight bank borrowings during the period. Interest rates varied between 5.3% p.a. and 6.0% p.a. (2012: 5.8% p.a.)
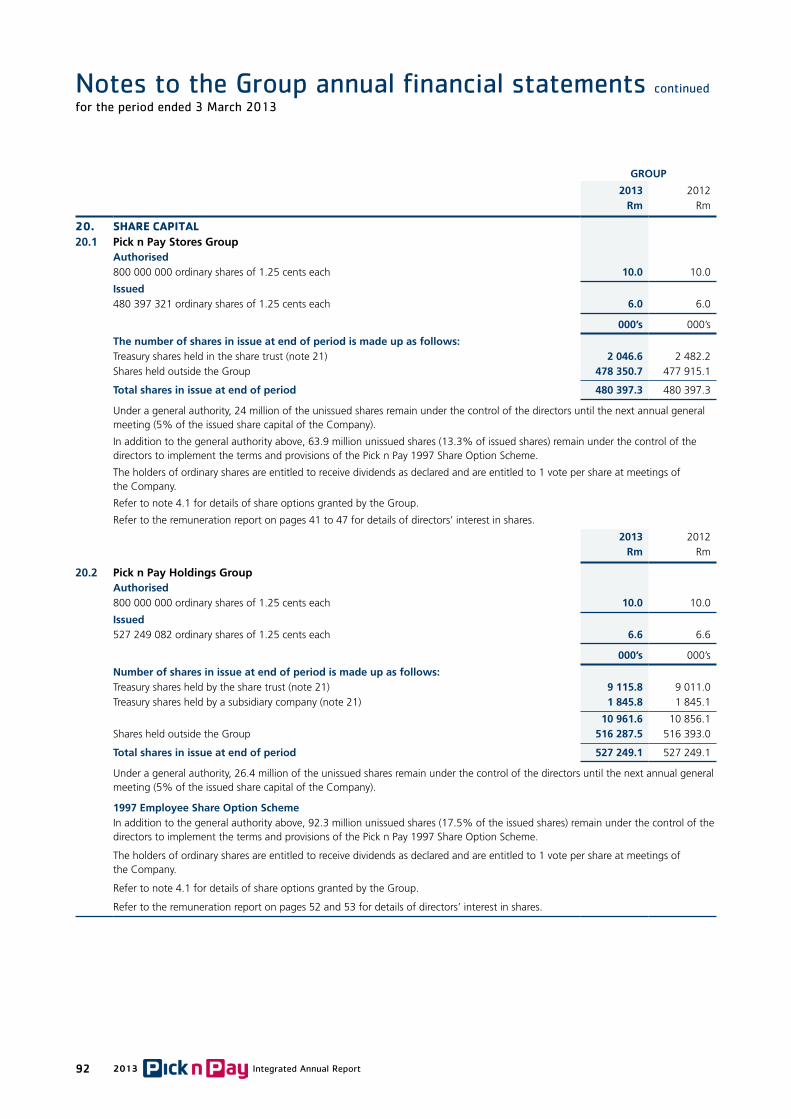
92 2013 Integrated Annual Report
Group
2013 2012rm Rm
20. SHARE CAPITAL20.1 pick n pay Stores Group
Authorised800 000 000 ordinary shares of 1.25 cents each 10.0 10.0
Issued480 397 321 ordinary shares of 1.25 cents each 6.0 6.0
000’s 000’s
The number of shares in issue at end of period is made up as follows:Treasury shares held in the share trust (note 21) 2 046.6 2 482.2 Shares held outside the Group 478 350.7 477 915.1
Total shares in issue at end of period 480 397.3 480 397.3
Under a general authority, 24 million of the unissued shares remain under the control of the directors until the next annual general meeting (5% of the issued share capital of the Company).
In addition to the general authority above, 63.9 million unissued shares (13.3% of issued shares) remain under the control of the directors to implement the terms and provisions of the Pick n Pay 1997 Share Option Scheme.
The holders of ordinary shares are entitled to receive dividends as declared and are entitled to 1 vote per share at meetings of the Company.
Refer to note 4.1 for details of share options granted by the Group.
Refer to the remuneration report on pages 41 to 47 for details of directors’ interest in shares.
2013 2012rm Rm
20.2 pick n pay Holdings GroupAuthorised800 000 000 ordinary shares of 1.25 cents each 10.0 10.0
Issued527 249 082 ordinary shares of 1.25 cents each 6.6 6.6
000’s 000’s
Number of shares in issue at end of period is made up as follows:Treasury shares held by the share trust (note 21) 9 115.8 9 011.0 Treasury shares held by a subsidiary company (note 21) 1 845.8 1 845.1
10 961.6 10 856.1 Shares held outside the Group 516 287.5 516 393.0
Total shares in issue at end of period 527 249.1 527 249.1
Under a general authority, 26.4 million of the unissued shares remain under the control of the directors until the next annual general meeting (5% of the issued share capital of the Company).
1997 Employee Share option SchemeIn addition to the general authority above, 92.3 million unissued shares (17.5% of the issued shares) remain under the control of the directors to implement the terms and provisions of the Pick n Pay 1997 Share Option Scheme.
The holders of ordinary shares are entitled to receive dividends as declared and are entitled to 1 vote per share at meetings of the Company.
Refer to note 4.1 for details of share options granted by the Group.
Refer to the remuneration report on pages 52 and 53 for details of directors’ interest in shares.
Notes to the Group annual financial statements continuedfor the period ended 3 March 2013

93 Integrated Annual Report 2013
Repo
Rt to
stA
keh
old
eRs
GR
oU
p o
veR
vIew
CoR
poR
Ate
Go
veR
NA
NCe
AN
NU
Al fIN
AN
CIAl
stAtem
eNts
CoR
poR
Ate A
Nd
sh
AR
eho
ldeR
INfo
Rm
AtIo
N
pIck N pAy STorES Group
pIck N pAy HoldINGSGroup
2013 2012 2013 2012rm Rm rm Rm
21. TREASURY SHARESAt beginning of period 142.8 172.0 82.4 77.7
Share repurchases 77.9 42.7 10.5 12.0 Take-up of share options by employees (81.3) (71.9) (3.6) (7.3)
At end of period 139.4 142.8 89.3 82.4
comprises:Pick n Pay Stores Limited shares 50.1 60.4 — —Pick n Pay Holdings Limited shares 89.3 82.4 89.3 82.4
The movement in the number of treasury shares held is as follows: 000’s 000’s 000’s 000’s
At beginning of period 2 482.2 3 411.6 10 856.1 10 920.8 Shares purchased during the period 1 799.4 957.5 537.6 653.2 Shares sold during the period pursuant to the take-up of share options by employees (2 235.0) (1 886.9) (432.1) (717.9)
At end of period 2 046.6 2 482.2 10 961.6 10 856.1
comprises:Shares held by share trust 2 046.6 2 482.2 9 115.8 9 011.0 Shares held by a subsidiary (Blue Ribbon Share Trust) — — 1 845.8 1 845.1
Average purchase price of shares purchased during the period r43.29 R42.25 r19.53 R18.37Average purchase price of shares held at period end r24.48 R24.33 r8.15 R7.59
Group
2013 2012rm Rm
22. BORROWINGS22.1 Secured and unsecured borrowings
Secured 804.0 814.5 Secured loan in respect of property with a carrying value of R70.0 million (2012: R72.3 million) (note 10) bearing interest at a fixed rate of 11.4% and payable monthly in arrears over a 15-year period, ending on 28 October 2018. 58.0 64.8
Secured loan raised to fund property development. The loan is secured by property with a carrying value of R579.3 million (2012: R597.9 million) (note 10). The directors’ valuation of the property at 3 March 2013 is R1 012.7 million. Interest is payable every 6 months in arrears at a fixed rate of 8.8% p.a. The capital is repayable on 29 June 2015. 250.0 250.0
Secured loan raised to fund property development. The loan is secured by property with a carrying value of R579.3 million (2012: R597.9 million) (note 10).The directors’ valuation of the property at 3 March 2013 is R1 012.7 million. Interest is payable every 6 months in arrears at a fixed rate of 8.9% p.a. The capital is repayable on 18 August 2016. 400.0 400.0
Finance leases in respect of vehicles with a carrying value of R97.3 million (2012: R101.7 million) (note 10) held under finance lease agreements bearing interest at prime bank rate less 2% and payable monthly in arrears over a 4-year period (refer note 22.2). At the end of the lease period the Group has the option to refinance or settle the lease and take ownership of the asset. Lease agreements do not contain any escalation or penalty clauses. 96.0 99.7
unsecured 400.0 650.0
unsecured 3-month corporate paper, issued under our Domestic Medium Term Note Programme, to fund capital projects. The notes are repayable on 23 May 2013 and carry an average interest rate linked to Jibar of 5.5% p.a. (2012: 5.8% p.a.) 400.0 400.0
unsecured loan raised to fund property development. The loan bore interest at a fixed rate of 9.6%. Interest was payable every 6 months in arrears. The capital was repaid on 3 September 2012. — 250.0
Total debt at end of period 1 204.0 1 464.5 Less: current portion (repayable within 1 year) (431.5) (693.3)
Non-current portion (repayable after 1 year) 772.5 771.2

94 2013 Integrated Annual Report
Group
2013 2012rm Rm
22. BORROWINGS continued
22.2 Finance lease commitmentsAt end of period finance lease rentals are payable as follows:Within 1 yearCapital repayments 23.8 36.5 Interest 3.6 5.5
cash flows 27.4 42.0
Within 2 to 5 yearsCapital repayments 72.2 63.2 Interest 5.1 4.4
cash flows 77.3 67.6
Total cash flows 104.7 109.6
Capital repayments 96.0 99.7 Interest 8.7 9.9
23. RETIREMENT BENEFITSThe Group provides post-retirement benefits to its employees in accordance with local benchmarks in the countries in which it operates. These benefits are provided through defined contribution plans.
One of the Group’s defined-contribution funds is the Pick n Pay Retirement Scheme. Certain members of this fund were guaranteed that should their defined-contribution benefit be less than their previous defined-benefit guarantee (under the previous Pick n Pay Retirement Fund) they would retain the former. Due to this guarantee, and the fact that the pensioners are also paid by this scheme, the scheme’s liabilities may be broken down between those which are defined contribution in nature and those which are defined benefit and for which the employer has an obligation to make additional contributions to ensure this element of the scheme is fully funded.
Group
pensioners’ defined- benefit
guarantee rm
retirement defined- benefit
guaranteerm
post- retirement
medical guarantee
rm
Total obligation
2013rm
Total obligation
2012Rm
23.1 The pick n pay retirement Schemedefined-benefit obligationsThe amount recognised in the statement of financial position is as follows:Present value of funded obligations 447.6 545.9 54.4 1 047.9 993.4 Fair value of assets (447.6) (547.7) (54.4) (1 049.7) (984.4)
Funded position — (1.8) — (1.8) 9.0
Amounts recognised in the statement of comprehensive income are as follows:Current service cost — 21.7 0.5 22.2 26.5 Interest on the obligation 32.8 49.2 6.8 88.8 88.2 Expected return on the plan assets (34.6) (52.6) (6.2) (93.4) (95.3)
Total included in employee costs (1.8) 18.3 1.1 17.6 19.4
cumulative unrecognised gains:Net cumulative unrecognised gain – beginning of period — — — — —Actuarial (loss)/gain – obligation (82.4) (8.1) 9.3 (81.2) 56.7 Actuarial gain/(loss) – assets 80.6 (9.9) 5.3 76.0 (46.5) Actuarial gain/(loss) to be recognised (before tax) 1.8 18.0 (14.6) 5.2 (10.2)
Net cumulative unrecognised gain – end of period — — — — —
Notes to the Group annual financial statements continuedfor the period ended 3 March 2013

95 Integrated Annual Report 2013
Repo
Rt to
stA
keh
old
eRs
GR
oU
p o
veR
vIew
CoR
poR
Ate
Go
veR
NA
NCe
AN
NU
Al fIN
AN
CIAl
stAtem
eNts
CoR
poR
Ate A
Nd
sh
AR
eho
ldeR
INfo
Rm
AtIo
N
Group
pensioners’ defined- benefit
guarantee rm
retirement defined- benefit
guaranteerm
post- retirement
medical guarantee
rm
Total obligation
2013rm
Total obligation
2012Rm
23. RETIREMENT BENEFITS continued23.1 The pick n pay retirement Scheme
Movement in the liability recognised on the statement of financial position is as follows:Net liability – beginning of period — 1.2 7.8 9.0 27.1 Total included in employee costs in statement of comprehensive income (1.8) 18.3 1.1 17.6 19.4 Amount recognised in other comprehensive income 1.8 18.0 (14.6) 5.2 (10.2) Contributions — (39.3) 5.7 (33.6) (27.3)
Net (asset)/liability – end of period — (1.8) — (1.8) 9.0
Movement in the fund’s obligations and plan assets recognised on the statement of financial position is as follows:liability – beginning of period 360.5 547.1 85.8 993.4 996.4 Service cost — 21.7 0.5 22.2 26.5 Interest cost 32.8 49.2 6.8 88.8 88.2 Actuarial loss/(gain) 82.4 8.1 (9.3) 81.2 (56.7) Benefits paid (28.1) (80.2) (29.4) (137.7) (61.0)
liability – end of period 447.6 545.9 54.4 1 047.9 993.4
plan assets – beginning of period 360.5 545.9 78.0 984.4 969.3 Expected return 34.6 52.6 6.2 93.4 95.3 Actuarial gain/(loss) 80.6 (9.9) 5.3 76.0 (46.5) Contributions by employer — 39.3 (5.7) 33.6 27.3 Benefits paid (28.1) (80.2) (29.4) (137.7) (61.0)
plan assets – end of period 447.6 547.7 54.4 1 049.7 984.4
% % % % %
Actuarial return on plan assets 28.5 7.8 17.2 16.7 5.0 Asset mixEquity 34.3 67.1 67.1 53.1 50.1 Fixed interest 63.7 29.0 29.0 43.8 46.9 Property 2.0 3.9 3.9 3.1 3.0
100.0 100.0 100.0 100.0 100.0

96 2013 Integrated Annual Report
Group
November 2012
% perannum
November 2011
% perannum
23. RETIREMENT BENEFITS continued
23.1 The pick n pay retirement Scheme continued
The principal actuarial assumptions at the last valuation date are:Discount rate 9.25 9.50 Future salary increases 7.56 6.71 Future pension increases 6.00 6.00 Annual increase in health care costs 7.50 7.50 Expected rate of return^ 9.75 10.00 ^ The expected rate of return on plan assets was determined by assuming that the fixed interest assets would earn a return equal to the discount rate
of 9.5%, with a further 2.25% risk premium applied to the equities and property, giving a weighted average return of 9.75% based on the current asset allocation.
At 3 March 2013, if the discount rate had been 1% higher or 1% lower (with all other variables held constant), the impact on the financial statements would have been as follows:
-1%
8.25%
rm
As reported 9.25%
rm
+1%
10.25%
rm
Statement of comprehensive incomeExpense included in employee costs 17.7 17.6 17.5
Statement of financial positionAsset at end of period (1.7) (1.8) (1.9)
Group
2013 2012rm Rm
23.2 defined current contribution benefitscurrent contributions 278.6 295.6
Continuing operations 278.6 261.8 Discontinued operation — 33.8
Group
2013 2012 2011 2010 2009rm Rm Rm Rm Rm
23.3 Historical informationPresent value of defined-benefit obligation 1 047.9 993.4 996.4 973.3 975.5 Fair value of plan assets (1 049.7) (984.4) (969.3) (984.6) (1 004.0)
(Surplus)/deficit in the plan (1.8) 9.0 27.1 (11.3) (28.5)
pIck N pAy STorES Group
pIck N pAy HoldINGS Group
2013 2012 2013 2012rm Rm rm Rm
24. TRADE AND OTHER PAYABLESTrade and other payables 6 543.1 6 691.5 6 548.7 6 695.2 Leave pay obligations 182.1 172.8 182.1 172.8 Deferred revenue – customer loyalty programme (note 1) 139.8 142.0 139.8 142.0
6 865.0 7 006.3 6 870.6 7 010.0
Notes to the Group annual financial statements continuedfor the period ended 3 March 2013

97 Integrated Annual Report 2013
Repo
Rt to
stA
keh
old
eRs
GR
oU
p o
veR
vIew
CoR
poR
Ate
Go
veR
NA
NCe
AN
NU
Al fIN
AN
CIAl
stAtem
eNts
CoR
poR
Ate A
Nd
sh
AR
eho
ldeR
INfo
Rm
AtIo
N
Group
2013 2012rm Rm
25. COMMITMENTS25.1 capital commitments
All capital expenditure will be funded from internal cash flow and through unlimited borrowing powers.
Authorised capital expenditurecontracted for 332.5 378.2
Property — 260.2 Equipment and vehicles 262.7 103.4 Intangible assets 69.8 14.6
Not contracted for 1 424.5 1 271.2
Property 159.7 —Equipment and vehicles 1 069.7 1 214.4 Intangible assets 195.1 56.8
Total commitments 1 757.0 1 649.4
25.2 operating lease commitmentsRefer to note 11
25.3 Finance lease commitmentsRefer to note 22
26. OPERATING SEGMENTSOperating segments are identified based on financial information regularly reviewed by the Chief Operating Decision Maker (CODM) of the Group for performance assessments and resource allocations. The Group annually performs a detailed review of the executives, or group of executives, that could be considered the appropriate and relevant CODM of the Group. During the period the CODM of the Group was reviewed and was changed from the Pick n Pay Stores Limited Board to the Executive Committee, as detailed on page 37. The operating segments and the related comparatives have been restated.
The Group has 3 operating segments, as described below, with no individual customer accounting for more than 10% of turnover.
South Africa division – operates in various formats under the Pick n Pay and Boxer brands in South Africa. For a detailed list of brands refer to the structure on page 3.
Africa division – responsible for the Group’s emerging expansion into the rest of Africa. The division operates in Namibia, Lesotho, Swaziland, Mozambique, Mauritius, Botswana, Zimbabwe and Zambia.
discontinued operation (Australia) – Franklins, our retail operation retailing food and general merchandise in New South Wales, Australia, was sold on 30 September 2011 and is disclosed as a discontinued operation in the comparatives.
Performance is measured based on the segment profit before tax, as management believes that such information is most relevant in evaluating the results of the segments against each other and other entities that operate within the retail industry.

98 2013 Integrated Annual Report
pIck N pAy STorES Group
South Africa
rm Africa
rm
Total continuing operations
rm
discon-tinued
operation Australia
rm
Total operations
rm
26. OPERATING SEGMENTS continued2013Total revenue 57 776.6 2 672.9 60 449.5 — 60 449.5
External revenue 57 776.6 1 881.9 59 658.5 — 59 658.5 Direct deliveries* — 695.4 695.4 695.4 Inter-segment revenue — 95.6 95.6 — 95.6
External turnover 56 694.0 2 577.3 59 271.3 — 59 271.3 profit before tax 716.2 92.7 808.9 — 808.9 other informationStatement of comprehensive incomeInterest income 40.0 2.8 42.8 — 42.8 Interest expense 131.3 — 131.3 — 131.3 Depreciation and amortisation 881.4 14.1 895.5 — 895.5 Share of associates’ income — 23.4 23.4 — 23.4 Statement of financial positionTotal assets 12 504.3 516.8 13 021.1 — 13 021.1
Total liabilities 10 150.7 454.4 10 605.1 — 10 605.1
2012Total revenue 54 284.1 2 009.9 56 294.0 3 389.3 59 683.3
External revenue 54 284.1 1 350.3 55 634.4 3 389.3 59 023.7 Direct deliveries* — 604.7 604.7 — 604.7 Inter-segment revenue — 54.9 54.9 — 54.9
External turnover 53 375.5 1 955.0 55 330.5 3 389.2 58 719.7 profit/(loss) before tax 1 120.3 49.7 1 170.0 (87.2) 1 082.8 other informationStatement of comprehensive incomeInterest income 33.0 6.5 39.5 0.2 39.7 Interest expense 135.1 — 135.1 6.0 141.1 Depreciation and amortisation 800.1 8.0 808.1 — 808.1 Share of associate’s loss — (1.9) (1.9) — (1.9) Profit on sale of Franklins (after tax) — — — 438.4 438.4 Statement of financial positionTotal assets 11 377.8 440.5 11 818.3 — 11 818.3
Total liabilities 9 004.9 409.3 9 414.2 — 9 414.2
* Direct deliveries are issues to franchisees directly by Group suppliers facilitated through the Group’s supply chain.
Notes to the Group annual financial statements continuedfor the period ended 3 March 2013

99 Integrated Annual Report 2013
Repo
Rt to
stA
keh
old
eRs
GR
oU
p o
veR
vIew
CoR
poR
Ate
Go
veR
NA
NCe
AN
NU
Al fIN
AN
CIAl
stAtem
eNts
CoR
poR
Ate A
Nd
sh
AR
eho
ldeR
INfo
Rm
AtIo
N
pIck N pAy HoldINGS Group
South Africa
rm Africa
rm
Total continuing operations
rm
discon-tinued
operation Australia
rm
Total operations
rm
26. OPERATING SEGMENTS continued2013Total revenue 57 776.6 2 672.9 60 449.5 — 60 449.5
External revenue 57 776.6 1 881.9 59 658.5 — 59 658.5 Direct deliveries* — 695.4 695.4 — 695.4 Inter-segment revenue — 95.6 95.6 — 95.6
External turnover 56 694.0 2 577.3 59 271.3 — 59 271.3 profit before tax 714.3 92.7 807.0 — 807.0 other informationStatement of comprehensive incomeInterest income 40.0 2.8 42.8 — 42.8 Interest expense 131.3 — 131.3 — 131.3 Depreciation and amortisation 881.4 14.1 895.5 — 895.5 Share of associates’ income — 23.4 23.4 — 23.4 Statement of financial positionTotal assets 12 504.7 516.8 13 021.5 — 13 021.5 Total liabilities 10 156.3 454.4 10 610.7 — 10 610.7
2012Total revenue 54 284.1 2 009.9 56 294.0 3 389.3 59 683.3
External revenue 54 284.1 1 350.3 55 634.4 3 389.3 59 023.7 Direct deliveries* — 604.7 604.7 — 604.7 Inter-segment revenue — 54.9 54.9 — 54.9
External turnover 53 375.5 1 955.0 55 330.5 3 389.2 58 719.7 profit/(loss) before tax 1 118.7 49.7 1 168.4 (87.2) 1 081.2 other informationStatement of comprehensive incomeInterest income 33.0 6.5 39.5 0.2 39.7 Interest expense 135.1 — 135.1 6.0 141.1 Depreciation and amortisation 800.1 8.0 808.1 — 808.1 Share of associate’s loss — (1.9) (1.9) — (1.9) Profit on sale of Franklins (after tax) — — — 438.4 438.4 Statement of financial positionTotal assets 11 378.2 440.5 11 818.7 — 11 818.7 Total liabilities 9 008.6 409.3 9 417.9 — 9 417.9
* Direct deliveries are issues to franchisees directly by Group suppliers facilitated through the Group’s supply chain.
27. RELATED PARTY TRANSACTIONS27.1 Transactions between Group subsidiaries
During the period, in the ordinary course of business, certain companies within the Group entered into transactions with each other. These intra-group transactions have been eliminated on consolidation. For details of loans within the Group refer to note 9 of the Company annual financial statements.
27.2 loans to executive directorsLoans to directors amount to R0.4 million at end of period (2012: R0.4 million), are secured and bear interest at varying interest rates. For further information refer to note 15.

100 2013 Integrated Annual Report
27. RELATED PARTY TRANSACTIONS continued27.3 key management personnel
Key management personnel are directors and those executives having authority and responsibility for planning, directing and controlling the activities of the Group. No key management personnel had a material interest in any contract of any significance with any Group company during the period under review.
pIck N pAy STorES Group
pIck N pAy HoldINGS Group
2013 2012 2013 2012rm Rm rm Rm
key management personnel remuneration comprises:Directors’ fees 3.7 6.0 3.7 6.0Remuneration for management services 26.6 27.3 26.6 27.3 Retirement and medical aid contributions 3.6 3.9 3.6 3.9 Performance bonus 2.2 2.0 2.2 2.0Fringe and other benefits 1.6 13.0 1.6 13.0
37.7 52.2 37.7 52.2 Expense relating to share options granted 14.1 18.6 14.1 18.6
51.8 70.8 51.8 70.8
28. FINANCIAL INSTRUMENTSoVErVIEWThe Group is exposed to credit, liquidity, interest rate and currency risk due to the effects of changes in debt, exchange rates and interest rates experienced in the normal course of business. The Group’s objective is to effectively manage each of the risks associated with its financial instruments in order to minimise the potential adverse effect on the financial performance and position of the Group.
The Board is ultimately responsible for ensuring that adequate procedures and processes are in place to identify, assess, manage and monitor financial risks. A treasury committee, appointed by the Board, comprising executive directors and senior executives, sets and monitors the adherence to appropriate risk limits and controls. Risk management is carried out by a central treasury department in line with the overall treasury policy as reviewed and approved by the Board on a regular basis.
28.1 credit riskCredit risk is the risk of financial loss to the Group if a counterparty to a financial instrument fails to meet its contractual obligations. Financial assets, which potentially subject the Group to concentrations of credit risk, consist principally of cash and cash equivalents, trade and other receivables, loans and participation in export partnerships.
The Group’s cash is placed with major South African and international financial institutions of high credit standing with a long-term rating of AAA (zaf) (refer note 19).
Trade and other receivables mainly relate to amounts owing by franchisees and are presented net of impairment losses (refer note 18). Rigorous credit granting procedures are applied to assess the credit quality of the debtors, taking into account its financial position and credit rating. The Group obtains various forms of security from its franchise debtors, including bank guarantees, notarial bonds over inventory and moveable assets and suretyships from shareholders. The total credit risk with respect to receivables from franchise debtors is further limited as a result of the dispersion amongst the individual franchisees and across different geographic areas. Consequently, the Group does not consider there to be any significant concentration or exposure to credit risk.
Loans mainly comprise employee loans granted in line with the Group’s remuneration policy. Loans are granted after reviewing the affordability for each employee and, where appropriate, suitable forms of security are obtained. Refer note 15.
A JSE listed company has warranted all material cash flow aspects of the Group’s participation in export partnerships. The Group’s directors have considered the credit risk relating to these aspects warranted and have satisfied themselves as to the creditworthiness of the warrantor company. Refer note 12.
Notes to the Group annual financial statements continuedfor the period ended 3 March 2013

101 Integrated Annual Report 2013
Repo
Rt to
stA
keh
old
eRs
GR
oU
p o
veR
vIew
CoR
poR
Ate
Go
veR
NA
NCe
AN
NU
Al fIN
AN
CIAl
stAtem
eNts
CoR
poR
Ate A
Nd
sh
AR
eho
ldeR
INfo
Rm
AtIo
N
28. FINANCIAL INSTRUMENTS continued28.2 liquidity risk
Liquidity risk is the risk that the Group will not be able to meet its financial obligations as they fall due. The Group manages this risk by maintaining adequate reserves and borrowing facilities and by continuously monitoring forecasted and actual cash flows, ensuring that the maturity profiles of financial assets and liabilities do not expose the Group to liquidity risk. In terms of the Company’s Memorandum of Incorporation the Group’s borrowing powers are unlimited, however, the treasury committee maintains strict control over the acceptance and draw-down of any loan facility.
On average, trade and other receivables and inventory are realised within 30 days and trade and other payables are settled within 60 days. To the extent that the Group requires short-term funds, it utilises the banking facilities available. Long-term borrowings are utilised to fund capital expenditure. Liquidity risk has been mitigated by substantial unutilised borrowing facilities as illustrated below.
Group
2013 2012rm Rm
Total borrowing facilities granted by financial institutions 5 723.7 5 739.7 Total actual borrowings and utilisation of facilities (2 862.7) (1 840.2)
unutilised borrowing facilities 2 861.0 3 899.5
The following are the undiscounted contractual maturities of financial liabilities, including estimated interest payments:
carryingamount
rm
contractualcash flows
rm
Within1 year
rm
2 to 5years
rm
over5 years
rm
pIck N pAy STorES Group2013
Secured loans – note 22.1 804.0 986.9 100.0 877.6 9.3 Unsecured loans – note 22.1 400.0 405.3 405.3Trade and other payables – note 24 6 543.1 6 543.1 6 543.1 Bank overdrafts – note 19 25.6 25.6 25.6 Overnight bank borrowings – note 19 1 500.0 1 500.0 1 500.0 Forward exchange contracts – note 28.3.1 3.1 3.1 3.1
Total financial obligations 9 275.8 9 464.0 8 577.1 877.6 9.3
2012Secured loans – note 22.1 814.5 1 077.7 114.6 939.9 23.2 Unsecured loans – note 22.1 650.0 667.8 667.8Trade and other payables – note 24 6 691.5 6 691.5 6 691.5 Forward exchange contracts – note 28.3.1 5.7 5.7 5.7
Total financial obligations 8 161.7 8 442.7 7 479.6 939.9 23.2
pIck N pAy HoldINGS Group2013
Secured loans – note 22.1 804.0 986.9 100.0 877.6 9.3 Unsecured loans – note 22.1 400.0 405.3 405.3Trade and other payables – note 24 6 548.7 6 548.7 6 548.7Bank overdrafts – note 19 25.6 25.6 25.6 Overnight bank borrowings – note 19 1 500.0 1 500.0 1 500.0 Forward exchange contracts – note 28.3.1 3.1 3.1 3.1
Total financial obligations 9 281.4 9 469.6 8 582.7 877.6 9.3
2012Secured loans – note 22.1 814.5 1 077.7 114.6 939.9 23.2 Unsecured loans – note 22.1 650.0 667.8 667.8Trade and other payables – note 24 6 695.2 6 695.2 6 695.2 Forward exchange contracts – note 28.3.1 5.7 5.7 5.7
Total financial obligations 8 165.4 8 446.4 7 483.3 939.9 23.2

102 2013 Integrated Annual Report
28. FINANCIAL INSTRUMENTS continued
28.3 Market risk managementChanges in market prices relating to foreign exchange rates and interest rates will affect the Group’s financial result or position. The objective of market risk management is to manage and control exposure to market risk, while optimising the return on the risk.
28.3.1 currency risk managementTransactional currency riskThe Group operates internationally and is exposed to currency risk through the importation of merchandise. Investments in foreign operations and master franchise agreements with international counterparties do not contribute to transactional currency risk as the related transactions and balances are denominated in South African Rands.
The following exchange rates applied during the period:Average rate closing rate
2013 2012 2013 2012
US Dollar/ZAR 8.28 7.25 9.02 7.53Euro/ZAR 10.97 9.86 11.83 10.11GBP/ZAR 12.84 11.61 13.73 11.94
Although the Group is exposed to currency risk through the importation of merchandise it does not have significant foreign creditors as inventory imports are mostly prepaid. The currency risk relating to future cash flows of import orders is managed by entering into forward exchange contracts (FECs). FECs are taken out when an order is placed with a foreign supplier. The Group does not use FEC’s for speculative purposes and does not apply cash flow hedge accounting.
Forward exchange contracts
contract foreign
currency m
rand equivalent
rm
Average rate
r
Fair value adjust-
ment rm
2013US Dollars 11.6 103.8 8.95 3.3Euro 1.1 12.7 11.55 (0.1)
GBP 0.4 5.1 12.75 (0.1)
121.6 3.1
2012US Dollars 9.7 78.0 8.00 4.1Euro 3.4 36.4 10.67 1.6
114.4 5.7
Sensitivity of the Group’s exposure to material foreign currencies is estimated by assessing the impact of a reasonable expected movement of the currencies on the profit and equity of the Group. A sensitivity analysis is not presented as the expected movement in currencies is not material.
In relation to the participation in export partnerships, a fixed rate of exchange was set for the purposes of converting the foreign currency receipts in respect of the partnership’s sales into Rands. Any exchange differences are for the account of the managing partner of the partnerships and will have no impact on the earnings of the Group.
currency translation riskThe Group has investments in foreign subsidiaries and the translation of the underlying assets and liabilities from the functional currency to the Group’s reporting currency exposes the Group to currency translation risks. The Group also has foreign cash balances that are exposed to currency translation risks. These risks are not considered material and therefore no sensitivity analysis is presented and the risks are not hedged.
Notes to the Group annual financial statements continuedfor the period ended 3 March 2013

103 Integrated Annual Report 2013
Repo
Rt to
stA
keh
old
eRs
GR
oU
p o
veR
vIew
CoR
poR
Ate
Go
veR
NA
NCe
AN
NU
Al fIN
AN
CIAl
stAtem
eNts
CoR
poR
Ate A
Nd
sh
AR
eho
ldeR
INfo
Rm
AtIo
N
28. FINANCIAL INSTRUMENTS continued
28.3 Market risk management continued28.3.2 Interest rate risk management
The Group’s interest rate risk arises from borrowings, cash and cash equivalents and loans. Fixed rate borrowings expose the Group to fair value interest rate risk. Variable rate borrowings, loans and cash and cash equivalents result in cash flow interest rate risk. The exposure to interest rate risk is managed though the Group’s cash management system taking into account expected movements in interest rates when funding or investing decisions are made.
The effective rates on financial instruments at end of period are:
2013Weighted
average interest
rate%
2012Weighted
average interest
rate%
Financial assetsCash at bank and cash on hand (note 19) 4.8 4.8 Cash investments (note 19) 5.7 5.6 Loans (note 15) 4.7 4.7
Financial liabilitiesVariable-rate interest-bearing debtBank overdraft (note 19) 7.0 7.5 Overnight bank borrowings (note 19) 5.4 5.8 Finance leases (note 22.2) 6.5 7.0 3-month corporate paper (note 22.1) 5.5 5.8 Fixed-rate interest-bearing debtSecured loans (note 22.1) 8.8 – 11.4 8.8 – 11.4
Interest rate sensitivity analysisSensitivity of the Group’s exposure to interest rate risk is estimated by assessing the impact of a reasonable expected movement in the relevant interest rates on the profit and equity of the Group based on the period end closing balances. We expect interest rates to remain unchanged for the following financial period, therefore there will be no impact on profit before tax. During the previous period an expected movement of 1% would have resulted in an increase or decrease of R8.5 million in profit before tax.
28.4 Fair value of financial instrumentsFinancial instruments measured at fair value are classified using a 3-level hierarchy to rank inputs used in measuring fair value. The levels are explained below:
Level 1 – quoted prices (unadjusted) in an active market for identical assets or liabilities;Level 2 – inputs other than quoted prices included within level 1 that are observable for the asset or liability either directly
(i.e. as prices) or indirectly (i.e. derived from prices); andLevel 3 – inputs for the asset or liability that are not based on observable market data (unobservable inputs).
Available-for-sale investments are measured at fair value. The investment in Business Partners Limited is classified at level 2.
Foreign exchange contracts are measured at fair value and classified at level 2.
Financial liabilities Fair value is determined by calculating the present value of future cash outflows discounted at a market interest rate at the reporting date. With regard to retirement benefit obligations, fair value is determined by a qualified actuary using actuarial assumptions.
other financial assets (including cash and cash equivalents and loans)Fair value is estimated as the present value of future cash inflows discounted at a market interest rate at the reporting date.

104 2013 Integrated Annual Report
28. FINANCIAL INSTRUMENTS continued
28.5 capital managementThe Group’s strategy is to maintain a strong capital base (represented by total shareholders’ equity) so as to maintain investor, creditor and market confidence and to sustain future development of the business. The Board of directors is ultimately responsible for capital management and has the following responsibilities in this regard:– To provide an adequate return to shareholders;– To ensure that the Group has adequate capital to continue as a going concern;– To ensure that the Group complies with the solvency and liquidity requirements for any share repurchase or dividend payment or
provision of financial assistance per the Companies Act; and– To maintain a balance between debt and equity so as to leverage return on equity whilst maintaining a strong capital base.
All debt covenants which exist on long-term and short-term borrowings are monitored on an ongoing basis. The Group purchases its own shares on the market from time to time which are intended to be used to cover share options granted under the Employee Share Scheme.
There were no changes in the Group’s approach to capital management during the period.
29. CHANGE IN FINANCIAL PERIOD CUT-OFF DATEDuring the financial period under review the Group adopted a 52-week financial reporting calendar for all future financial periods. This change will align financial reporting with Group operational structures and will improve comparative reporting to both internal and external stakeholders.
As a result, the 2013 annual financial period ended on 3 March 2013 compared to 29 February 2012 in the comparative period. The additional trading days included in the 2013 result had the following estimated impact on the consolidated financial statements:
rm
Statement of comprehensive incomeTurnover 479.6Net profit after tax 28.0
Statement of financial position
Trade and other payables 1 158.7 Trade and other receivables (99.5)Cash and cash equivalents (1 059.2)
Net working capital —
30. ACCOUNTING STANDARDS AND INTERPRETATIONS TO BE ADOPTED IN FUTURE YEARSInternational Financial reporting Standards (IFrS)A number of new standards, amendments to standards and interpretations that are applicable to the Group with an effective date after the date of these financial statements, have not been applied in preparing these consolidated financial statements. These are listed below:
IAS 19: Employee BenefitsAmendments to the standard include measuring expected returns on plan assets based on rates used to discount the defined benefit, past service cost to be expensed when the plan amendment occurs whether or not they have vested and short- and long-term benefits will be distinguished based on expected timing of settlements, rather than employee entitlement.
IFrS 9: Financial InstrumentsPrincipal change is the reduction from 4 classifications of financial assets (fair value through profit or loss, loans and receivables, held-to-maturity and those measured at amortised cost) to 2 (assets measured at fair value through profit or loss and those measured at amortised cost). The new standard reduces complexity.
IFrS 10: consolidated Financial Statements Introduces a single concept of control as determining factor in whether an entity should be included within the consolidated financial statements of the parent company and provides guidance on how to determine if control exists.
IFrS 13: Fair Value Measurements Provides new guidance on fair value measurement and additional disclosure requirements.
The other remaining standards, amendments and interpretations issued but not yet effective have been assessed for applicability to the Group and management has concluded that they are not expected to have a significant impact on future financial statements, but will result in enhanced disclosure.
Notes to the Group annual financial statements continuedfor the period ended 3 March 2013

Company annual financial statements
105 Integrated Annual Report 2013
Repo
Rt to
stA
keh
old
eRs
GR
oU
p o
veR
vIew
CoR
poR
Ate
Go
veR
NA
NCe
AN
NU
Al fIN
AN
CIAl
stAtem
eNts
CoR
poR
Ate A
Nd
sh
AR
eho
ldeR
INfo
Rm
AtIo
N
Contents
Company annual finanCial statements Pick n Pay Stores Limited and Pick n Pay Holdings Limited106 Statements of comprehensive income107 Statements of financial position108 Statements of changes in equity109 Statements of cash flows110 – 113 Notes to the Company annual financial statements
shareholders’ information114 Analysis of shareholders – Pick n Pay Stores Limited115 Analysis of shareholders – Pick n Pay Holdings Limited116 Shareholders’ informationIBC Administration
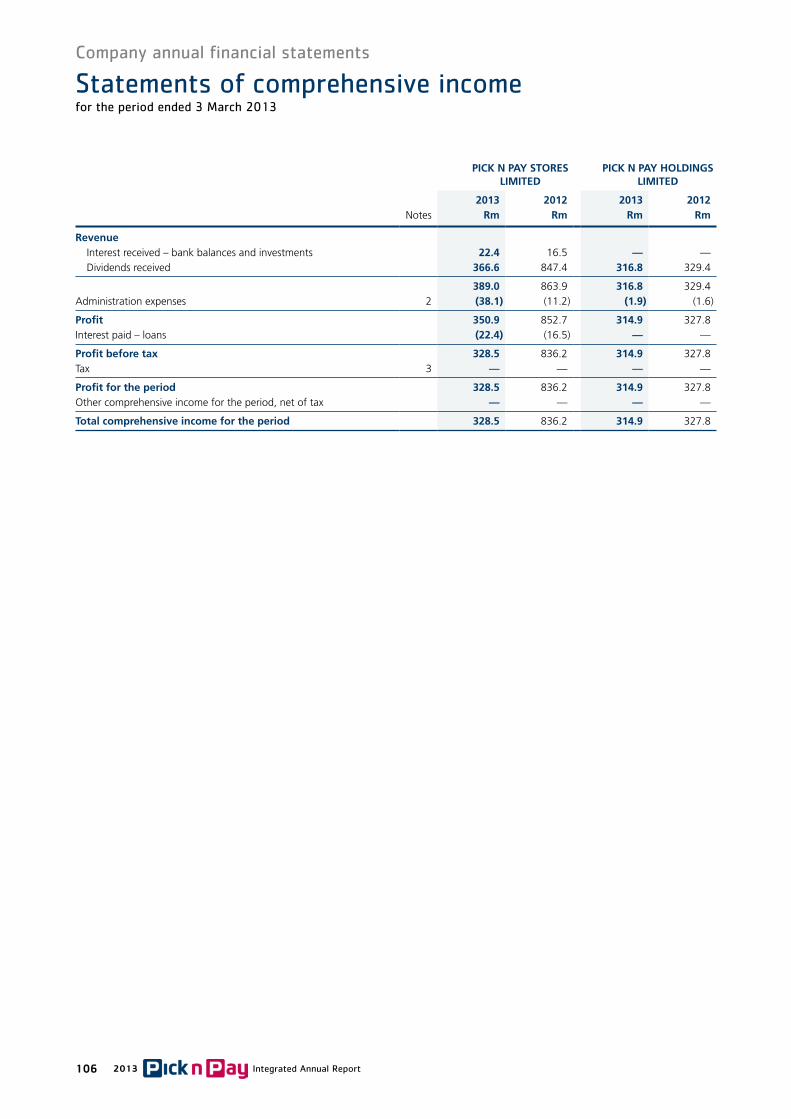
Company annual financial statements
106 2013 Integrated Annual Report
Pick n Pay StoreS LiMiteD
Pick n Pay HoLDinGS LiMiteD
2013 2012 2013 2012 Notes rm rm rm rm
revenueInterest received – bank balances and investments 22.4 16.5 — —Dividends received 366.6 847.4 316.8 329.4
389.0 863.9 316.8 329.4 Administration expenses 2 (38.1) (11.2) (1.9) (1.6)
Profit 350.9 852.7 314.9 327.8 Interest paid – loans (22.4) (16.5) — —
Profit before tax 328.5 836.2 314.9 327.8 Tax 3 — — — —
Profit for the period 328.5 836.2 314.9 327.8 Other comprehensive income for the period, net of tax — — — —
total comprehensive income for the period 328.5 836.2 314.9 327.8
Statements of comprehensive incomefor the period ended 3 March 2013

Company annual financial statements
107 Integrated Annual Report 2013
Repo
Rt to
stA
keh
old
eRs
GR
oU
p o
veR
vIew
CoR
poR
Ate
Go
veR
NA
NCe
AN
NU
Al fIN
AN
CIAl
stAtem
eNts
CoR
poR
Ate A
Nd
sh
AR
eho
ldeR
INfo
Rm
AtIo
N
Pick n Pay StoreS LiMiteD
Pick n Pay HoLDinGS LiMiteD
Notes
as at 3 March
2013rm
As at 29 February
2012Rm
as at 3 March
2013rm
As at 29 February
2012Rm
aSSetSnon-current assets
Investments in subsidiaries and trusts 5 101.9 363.7 129.4 129.4 Available-for-sale investment 6 0.2 0.2 — —
102.1 363.9 129.4 129.4
current assetsInvestments in subsidiaries and trusts 5 400.0 400.0 — —
Trade and other receivables — — 1.3 0.6
400.0 400.0 1.3 0.6
total assets 502.1 763.9 130.7 130.0
eQUity anD LiaBiLitieScapital and reserves
Share capital 7 6.0 6.0 6.6 6.6 Share premium — — 120.8 120.8 Retained earnings/(accumulated losses) 90.5 353.4 (0.6) (0.5)
total shareholders’ equity 96.5 359.4 126.8 126.9
current liabilitiesBorrowings 8 400.0 400.0 — —Trade and other payables 5.6 4.5 3.9 3.1
405.6 404.5 3.9 3.1
total equity and liabilities 502.1 763.9 130.7 130.0
Statements of financial position

Company annual financial statements
108 2013 Integrated Annual Report
Sharecapital
retained earnings total
Note rm rm rm
Pick n Pay StoreS LiMiteDat 1 March 2011 6.0 132.1 138.1 Total comprehensive income for the period — 836.2 836.2 Dividends paid 4.1 — (614.9) (614.9)
at 29 February 2012 6.0 353.4 359.4 Total comprehensive income for the period — 328.5 328.5 Dividends paid 4.1 — (591.4) (591.4)
at 3 March 2013 6.0 90.5 96.5
Sharecapital
Share premium
accu-mulated
losses totalNote rm rm rm rm
Pick n Pay HoLDinGS LiMiteDat 1 March 2011 6.6 120.8 (0.1) 127.3 Total comprehensive income for the period — — 327.8 327.8 Dividends paid 4.1 — — (328.2) (328.2)
at 29 February 2012 6.6 120.8 (0.5) 126.9 Total comprehensive income for the period — — 314.9 314.9 Dividends paid 4.1 — — (315.0) (315.0)
at 3 March 2013 6.6 120.8 (0.6) 126.8
Statements of changes in equityfor the period ended 3 March 2013

109 Integrated Annual Report 2013
Repo
Rt to
stA
keh
old
eRs
GR
oU
p o
veR
vIew
CoR
poR
Ate
Go
veR
NA
NCe
AN
NU
Al fIN
AN
CIAl
stAtem
eNts
CoR
poR
Ate A
Nd
sh
AR
eho
ldeR
INfo
Rm
AtIo
N
Pick n Pay StoreS LiMiteD
Pick n Pay HoLDinGS LiMiteD
2013 2012 2013 2012Note rm Rm rm Rm
cash flows from operating activitiesProfit 350.9 852.7 314.9 327.8
cash generated before movements in working capital 350.9 852.7 314.9 327.8 Movements in working capital 1.1 5.7 0.1 0.4
Increase in trade and other payables 1.1 2.5 0.8 0.9 Decrease/(increase) in trade and other receivables — 3.2 (0.7) (0.5)
cash generated by trading activities 352.0 858.4 315.0 328.2 Interest paid (22.4) (16.5) — —
cash generated by operations 329.6 841.9 315.0 328.2 Dividends paid 4.1 (591.4) (614.9) (315.0) (328.2)
total net cash (utilised in)/generated by operating activities (261.8) 227.0 — —
cash flows from investing activitiesLoans repaid/(advanced) 261.8 (627.0) — —
total net cash generated by/(utilised in) investing activities 261.8 (627.0) — —
cash flows from financing activitiesDebt raised — 400.0 — —
total net cash generated by financing activities — 400.0 — —
net increase in cash and cash equivalents — — — —Cash and cash equivalents at beginning of period — — — —
cash and cash equivalents at end of period — — — —
Statements of cash flowsfor the period ended 3 March 2013

110 2013 Integrated Annual Report
Notes to the Company annual financial statementsfor the period ended 3 March 2013
1. aCCounting poliCiesExcept as presented below, the accounting policies and notes to the annual financial statements are identical to those disclosed in the consolidated annual financial statements on pages 71 to 79.
investments in subsidiariesThe Company carries its investments in subsidiaries at cost less impairment losses.
2. administration expensesAdministration expenses are stated after taking into account the following expenses:
2.1 Directors’ remuneration Directors’ remuneration paid by Pick n Pay Stores Limited and Pick n Pay Holdings Limited is detailed below. Refer to pages 41 to 47 and 52 and 53 of the remuneration report for details of the directors’ remuneration and directors’ interest in shares.
Pick n Pay StoreS LiMiteD*
Pick n Pay HoLDinGS LiMiteD**
Fees forboard
meetingsr’000
Fees for committee and other
work r’000
cashtotal
r’000
Fees for board
meetings r’000
cashtotal
r’000
2013Non-executive directors 2 149.7 1 418.0 3 567.7 171.0 171.0
2012
Non-executive directors 4 900.2 1 064.3 5 964.5 159.0 159.0
* Executive directors’ salaries are paid by a subsidiary company.
** Directors of Pick n Pay Stores Limited who are also directors of Pick n Pay Holdings Limited do not receive directors’ remuneration for services rendered as a director of this Company.
Pick n Pay StoreS LiMiteD
Pick n Pay HoLDinGS LiMiteD
2013 2012 2013 2012rm Rm rm Rm
2.2 audit fees 0.1 0.1 0.1 0.1
3. tax % % % % Statutory tax rate reconciliation 28.0 28.0 28.0 28.0 Exempt income – dividends received (31.2) (28.4) (28.2) (28.1) Other non-deductible expenditure 3.2 0.4 0.2 0.1
effective tax rate — — — —
2013 cents
per share
2012 Cents
per share
4. diVidends 4.1 Dividends paid
Pick n Pay StoreS LiMiteDNumber 88 – declared 17 April 2012 – paid 11 June 2012 (2012: Number 86 – declared 15 April 2011 – paid 13 June 2011) 108.35 105.50 Number 89 – declared 23 October 2012 – paid 18 December 2012 (2012: Number 87 – declared 18 October 2011 – paid 12 December 2011) 14.75 22.50
total dividends per share for the period 123.10 128.00
rm Rm
total value of dividends paid by the company 591.4 614.9
cents per share
Cents per share
Pick n Pay HoLDinGS LiMiteDNumber 61 – declared 17 April 2012 – paid 11 June 2012 (2012: Number 59 – declared 15 April 2011 – paid 13 June 2011) 52.57 51.34 Number 62 – declared 23 October 2012 – paid 18 December 2012 (2012: Number 60 – declared 18 October 2011 – paid 12 December 2011) 7.17 10.91
total dividends per share for the period 59.74 62.25
rm Rm
total value of dividends paid by the company 315.0 328.2

111 Integrated Annual Report 2013
Repo
Rt to
stA
keh
old
eRs
GR
oU
p o
veR
vIew
CoR
poR
Ate
Go
veR
NA
NCe
AN
NU
Al fIN
AN
CIAl
stAtem
eNts
CoR
poR
Ate A
Nd
sh
AR
eho
ldeR
INfo
Rm
AtIo
N
2013 cents
per share
2012 Cents
per share
4. diVidends continued4.2 Dividends declared
Pick n Pay StoreS LiMiteDInterim dividend – number 89 (2012: number 87) 14.75 22.50Final dividend – number 90 (2012: number 88) 69.25 108.35
84.00 130.85
The directors have declared a final dividend (dividend 90) of 69.25 cents per share out of income reserves. The dividend is subject to dividend withholding tax at 15%. The last day to trade in order to participate in the dividend (CUM dividend) will be Friday, 7 June 2013. The shares will trade EX dividend from the commencement of business on Monday, 10 June 2013 and the record date will be Friday, 14 June 2013. The dividends will be paid on Tuesday, 18 June 2013.
Pick n Pay HoLDinGS LiMiteDInterim dividend – number 62 (2012: number 60) 7.17 10.91Final dividend – number 63 (2012: number 61) 33.61 52.57
40.78 63.48
The directors have declared a final dividend (dividend 63) of 33.61 cents per share out of income reserves. The dividend is subject to dividend withholding tax at 15%. The last day to trade in order to participate in the dividend (CUM dividend) will be Friday, 7 June 2013. The shares will trade EX dividend from the commencement of business on Monday, 10 June 2013 and the record date will be Friday, 14 June 2013. The dividends will be paid on Tuesday, 18 June 2013.
rm Rm
5. inVestments in subsidiaries and trust5.1 investments in subsidiaries and trust
Pick n Pay StoreS LiMiteDShares at costtrading subsidiaries 37.5 37.5
Guardrisk Insurance Company Limited “A122 ordinary shares”Pick n Pay Garages Proprietary LimitedPick n Pay Retailers Proprietary LimitedPick n Pay Investment Holdings Limited
Property owning subsidiaries 0.5 0.5 Pick n Pay (Newton Park) Proprietary LimitedPick n Pay Wholesalers Proprietary LimitedPick n Pay Wholesalers (Transvaal) Proprietary Limited
trustThe Pick n Pay Employee Share Purchase Trust
Dormant subsidiaries 0.3 0.3
total investments in subsidiaries and trust 38.3 38.3
5.2 amount owing by subsidiary companiesat beginning of period 725.4 98.4 Amounts (received)/advanced during the period (261.8) 627.0
at end of period 463.6 725.4 Refer to note 9.1.3 for a detailed analysis.The amount owing is unsecured, interest-free and no fixed rate for repayment has been determined. total investments in subsidiaries and trust 501.9 763.7
5.3 investment in subsidiaryPick n Pay HoLDinGS LiMiteDPick n Pay Stores Limited257 345 334 (2012: 257 345 334) ordinary sharesComprising:Initial investment 24.7 24.7 Capitalisation share awards received 103.3 103.3
total investment in subsidiary 128.0 128.0
5.4 amount owing by subsidiary company 1.4 1.4Refer to note 9.2.2 for a detailed analysis.The amount owing is unsecured, interest-free and no fixed rate for repayment has been determined. total investment in subsidiary 129.4 129.4

112 2013 Integrated Annual Report
Notes to the Company annual financial statements continuedfor the period ended 3 March 2013
Pick n Pay StoreS LiMiteD
2013 2012rm Rm
6. aVailable-for-sale inVestmentUnlisted shares at fair valueBusiness Partners Limited200 000 (2012: 200 000) shares at R1 each 0.2 0.2
This available-for-sale investment is stated at original purchase price. The shares are unlisted and no active market exists where they can be traded easily. Based on management’s evaluation and judgement, management believes that original cost approximates fair value and that the investment is therefore not impaired.
7. share CapitalPick n Pay StoreS
LiMiteD7.1 Pick n Pay Stores Limited
authorised800 000 000 ordinary shares of 1.25 cents each 10.0 10.0 issued480 397 321 ordinary shares of 1.25 cents each 6.0 6.0
Under a general authority, 24 million of the unissued shares remain under the control of the directors until the next annual general meeting (5% of the issued share capital of the Company).
The holders of ordinary shares are entitled to receive dividends as declared and are entitled to 1 vote per share at meetings of the Company.
7.2 Pick n Pay Holdings LimitedPick n Pay
HoLDinGS LiMiteDauthorised800 000 000 ordinary shares of 1.25 cents each 10.0 10.0 issued527 249 082 ordinary shares of 1.25 cents each 6.6 6.6
Under a general authority 26.4 million of the unissued shares remain under the control of the directors until the next annual general meeting (5% of the issued share capital of the Company).
The holders of ordinary shares are entitled to receive dividends as declared and are entitled to 1 vote per share at meetings of the Company.
Pick n Pay StoreS LiMiteD
2013 2012rm Rm
8. borrowingsUnsecured 3-month corporate paper, issued under our Domestic Medium Term Note Programme, to fund capital projects. The notes are repayable on 23 May 2013 and carry an average interest rate linked to Jibar of 5.5% p.a. (2012: 5,8% p.a.) 400.0 400.0
9. related party transaCtions9.1 Pick n Pay Stores Limited9.1.1 Dividends received from subsidiary companies and paid to its holding company
Dividends receivedPick n Pay Retailers Proprietary Limited 358.7 605.4 Pick n Pay Employee Share Purchase Trust 7.9 9.4 Carrefour Proprietary Limited — 102.9 Pick n Pay (Steelpark) Proprietary Limited — 1.9 Pick n Pay (Steeldale) Proprietary Limited — 63.4 Bedworth Sentrum Proprietary Limited — 57.7 Pick n Pay (Mitchells Plain) Limited — 6.7
total dividends received from related parties 366.6 847.4
Dividends paid to holding companyPick n Pay Holdings Limited 316.8 329.4
9.1.2 interest received from a subsidiary companyPick n Pay Retailers Proprietary Limited 22.4 16.5

113 Integrated Annual Report 2013
Repo
Rt to
stA
keh
old
eRs
GR
oU
p o
veR
vIew
CoR
poR
Ate
Go
veR
NA
NCe
AN
NU
Al fIN
AN
CIAl
stAtem
eNts
CoR
poR
Ate A
Nd
sh
AR
eho
ldeR
INfo
Rm
AtIo
N
Pick n Pay StoreS LiMiteD
2013 2012rm Rm
9. related party transaCtions continued9.1 Pick n Pay Stores Limited continued9.1.3 Loans to a subsidiary company
Pick n Pay Retailers Proprietary Limited 224.5 484.9 Pick n Pay Employee Share Purchase Trust 7.9 9.4 Carrefour Proprietary Limited 102.9 102.9 Pick n Pay (Steelpark) Proprietary Limited 1.8 1.8 Pick n Pay (Steeldale) Proprietary Limited 63.5 63.4 Bedworth Sentrum Proprietary Limited 57.7 57.7 Pick n Pay (Mitchells Plain) Limited 6.7 6.7
465.0 726.89.1.4 Loans from holding company
Pick n Pay Holdings Limited (1.4) (1.4)
total loans to related parties 463.6 725.4
Pick n Pay HoLDinGS LiMiteD
9.2 Pick n Pay Holdings Limited9.2.1 Dividends received from subsidiary company
Pick n Pay Stores Limited 316.8 329.4 9.2.2 Loan to subsidiary company
Pick n Pay Stores Limited 1.4 1.4 9.2.2 trade and other receivables due from companies within the Group
Pick n Pay Retailers Proprietary Limited 1.3 0.6 9.3 Shares held by directors
The percentage of shares held by directors of Pick n Pay Stores Limited and Pick n Pay Holdings Limited at the reporting date are disclosed in the directors’ reports on pages 59 and 60 and 63 and 64. For further information refer to the remuneration reports on pages 41 to 47 and 52 and 53.
10. finanCial instrumentsoverviewPick n Pay Stores Limited and Pick n Pay Holdings Limited have limited exposure to risk in respect of financial instruments, as their only financial assets are their loans to subsidiary companies. There is minimal credit risk relating to these items as it is payable by the main operating company within the Group. Market risk is negated as the financial assets and liabilities have no exposure to changes in exchange rates and have very limited exposure to changes in interest rates.
10.1 Liquidity riskLiquidity risk is the risk that the companies will not be able to meet their financial obligations as they fall due. Pick n Pay Stores Limited and Pick n Pay Holdings Limited have unlimited access to the funds of the Group companies. Therefore, Pick n Pay Stores Limited and Pick n Pay Holdings Limited’s liquidity risk is linked to the liquidity of the Group companies. Refer to note 28.2 of the related Group financial statements on page 101.The following are the contractual maturities of financial liabilities, including estimated interest payments:
Pick n Pay StoreS Pick n Pay HoLDinGS
carrying amount
rm
contractualcash flows
rm
within1 year
rm
carryingamount
rm
contractualcash flows
rm
within1 year
rm
2013non-derivative financial liabilities
3-month corporate paper 400.0 405.7 405.7 — — —Trade and other payables 5.6 5.6 5.6 3.9 3.9 3.9
total financial obligations 405.6 411.3 411.3 3.9 3.9 3.9
2012non-derivative financial liabilities
3-month corporate paper 400.0 405.7 405.7 — — —Trade and other payables 4.5 4.5 4.5 3.1 3.1 3.1
total financial obligations 404.5 410.2 410.2 3.1 3.1 3.1 10.2 capital management
The Companies consider the management of capital with reference to the Group policy which can be found on page 104 of the Group annual financial statements.

114 2013 Integrated Annual Report
Analysis of shareholders
SHAREHOLDER SPREADNumber of
shareholders %
Number of shares
millions %
1 – 1 000 shares 5 514 57.0 2.2 0.5 1 001 – 10 000 shares 3 365 34.7 10.4 2.2 10 001 – 100 000 shares 630 6.5 19.2 4.0 100 001 – 1 000 000 shares 144 1.5 42.9 8.9 1 000 001 shares and over 26 0.3 405.7 84.4
Total 9 679 100.0 480.4 100.0
PUBLIC/NON-PUBLIC SHAREHOLDERS
Non-public shareholders 58 0.6 316.4 65.9
Directors and associates 55 0.6 3.1 0.7Pick n Pay Holdings Limited 1 — 257.4 53.6 Pick n Pay Employee Share Purchase Trust 1 — 2.1 0.4 Government Employees Pension Fund 1 — 53.8 11.2
Public shareholders 9 621 99.4 164.0 34.1
Total 9 679 100.0 480.4 100.0
BENEFICIAL SHAREHOLDERS HOLDING 1% OR MORE
Pick n Pay Holdings Limited 257.4 53.6 Government Employees Pension Fund 53.8 11.2Genesis Emerging Markets Investment Company 7.5 1.6Liberty Life Assurance of Africa Limited 7.3 1.5Vanguard Emerging Markets Stock Index Fund 4.9 1.0
GEOGRAPHICAL SPREAD OF SHAREHOLDERS
Pick n Pay Stores Limited
Great Britain 4.6%
Luxembourg 1.7%
Other countries 1.8%
South Africa 81.2%
United States of America 10.7%
2013
Great Britain 1.0%
Luxembourg 1.3%
Other countries 1.3%
South Africa 84.7%
United States of America 11.7%
2012
2013 2012

115 Integrated Annual Report 2013
Repo
Rt to
stA
keh
old
eRs
GR
oU
p o
veR
vIew
CoR
poR
Ate
Go
veR
NA
NCe
AN
NU
Al fIN
AN
CIAl
stAtem
eNts
CoR
poR
Ate A
Nd
sh
AR
eho
ldeR
INfo
Rm
AtIo
N
Analysis of shareholders
Pick n Pay Holdings Limited
SHAREHOLDER SPREADNumber of
shareholders %
Number of shares
millions %
1 – 1 000 shares 2 615 29.5 1.4 0.3 1 001 – 10 000 shares 4 580 51.8 17.8 3.4 10 001 – 100 000 shares 1 343 15.2 38.7 7.3 100 001 – 1 000 000 shares 264 3.0 79.9 15.1 1 000 001 shares and over 48 0.5 389.4 73.9
Total 8 850 100.0 527.2 100.0
PUBLIC/NON-PUBLIC SHAREHOLDERS
Non-public shareholders 59 0.7 279.9 53.0 Directors and associates 57 0.7 15.8 3.0
Ackerman Investment Holdings Proprietary Limited 1 — 255.0 48.3 Pick n Pay Employee Share Purchase Trust 1 — 9.1 1.7
Public shareholders 8 791 99.3 247.3 47.0
Total 8 850 100.0 527.2 100.0
BENEFICIAL SHAREHOLDERS HOLDING 1% OR MORE
Ackerman Investment Holdings Proprietary Limited 255.0 48.3 Investec Opportunity Fund 13.6 2.6Government Employees Pension Fund 13.2 2.5Sanlam Life Insurance Limited 9.3 1.8Pick n Pay Employee Share Purchase Trust 9.1 1.7Allan Gray Equity Fund 8.0 1.5Eskom Pension and Provident Fund 7.0 1.3
GEOGRAPHICAL SPREAD OF SHAREHOLDERS
South Africa 95.0%
United States of America 2.0%
Great Britain 1.4%
Other countries 1.6%
2013
South Africa 96.9%
United States of America 1.7%
Great Britain 1.0%
Other countries 0.4%
20122013 2012

116 2013 Integrated Annual Report
ANNUAL GENERAL MEETINGS (AGMs) - 25 JUNE 2013 The 45th annual general meeting of shareholders of Pick n Pay Stores Limited (Stores AGM) will be held at Pick n Pay Office Park, 101 Rosmead Avenue, Kenilworth, Cape Town, 7708 on Tuesday, 25 June 2013 at 08:30.
The 32nd annual general meeting of shareholders of Pick n Pay Holdings Limited will be held at Pick n Pay Office Park, 101 Rosmead Avenue, Kenilworth, Cape Town, 7708 on Tuesday, 25 June 2013 at 09:00, or as soon as the Stores AGM is completed. There will be a video conferencing link to our offices situated at 2 Allum Road, Kensington, Gauteng to allow for electronic participation in the meeting.
Registration for both AGMs will commence at 08:00.
The minutes of the previous period’s AGMs held on 15 June 2012 are available on our Pick n Pay investor relations website at www.picknpay-ir.co.za.
SHAREHOLDER DIARY
DIVIDENDS
PICk N PAy STORES LIMITED PICk N PAy HOLDINGS LIMITEDReg No 1968/008034/06
Share code: PIkReg No 1981/009610/06
Share code: PWkISIN code: ZAE000005443 ISIN code: ZAE000005724
NumberAmount
(cents) NumberAmount
(cents)Last day of trade
Date of payment
Interim 87 22.50 60 10.91 2 December 2011 12 December 2011
Final 88 108.35 61 52.57 1 June 2012 11 June 2012
Interim 89 14.75 62 7.17 7 December 2012 18 December 2012
Final 90 69.25 63 33.61 7 June 2013 18 June 2013
Interim 91 64 6 December 2013* 17 December 2013*
Final 92 65 6 June 2014* 17 June 2014*
*estimated
RESULT ANNOUNCEMENTSInterim to 31 August 2012: 23 October 2012
Final to 3 March 2013: 23 April 2013
Interim to 1 September 2013: about 22 October 2013
Final to 2 March 2014: about 22 April 2014
PUBLICATION OF INTEGRATED ANNUAL REPORTS2013: May 2013
2014: May 2014
Shareholders’ informationPick n Pay Group of Companies

Integrated Annual Report 2013
BASTION GRAPHICS
Pick n Pay Group of Companies
Administration
cOmPanY secRetaRY Debra Mulleremail address: [email protected]
ReGisteRed OfficePick n Pay Office Park, 101 Rosmead Avenue, Kenilworth, Cape Town, 7708 Tel +27(0)21 658 1000. Fax +27(0)21 797 0314
POstal addRessPO Box 23087, Claremont, 7735
weBsitePick n Pay: www.picknpay.co.za
Investor relations: www.picknpay-ir.co.za
PROmOtiOn Of access tO infORmatiOn actInformation officer – Penny Gerber email address: [email protected]
enGaGe with Us On:
cUstOmeR caRelineTel +27(0)800 11 22 88email address: [email protected]
Online shOPPinGTel +27(0)860 30 30 30www.picknpay.co.za
ReGistRaR Computershare Investor Services Proprietary Limited 70 Marshall Street, Johannesburg, 2001 PO Box 61051, Marshalltown, 2107 Tel +27(0)11 370 5000. Fax +27(0)11 688 5248
aUditORs KPMG Inc.
attORneYs Edward Nathan Sonnenberg
PRinciPal tRansactiOnal BankeRs Absa Limited First National Bank
Jse sPOnsOR Investec Bank Limited100 Grayston Drive, Sandton, 2196

101 Rosmead AvenueKenilworth7708Cape Town
Integ
rated A
nn
ual R
epo
rt 2013
Please recycle


![TEPCO Integrated Report 2019newsml:tdnet.info:...TEPCO Power Grid #Underground grid system [Yokohama City, Kanagawa pref.] TEPCO INTEGRATED REPORT 2019 TEPCO Integrated Report 2019](https://img.pdfslide.tips/doc/110x75/60d84b38078f2b337c229abc/tepco-integrated-report-2019-newsmltdnetinfo-tepco-power-grid-underground.jpg)