Embed Size (px)
Citation preview

International Ag issues – Trends in the Local Food Market
Presentation For The
NSAC Far West Chapter Annual Meeting May 23, 2013
William Matthews University of California
Agricultural Issues Center

UC Agricultural Issues Center • AIC Mission: provide broadly-based and
objective information on agricultural issues and their significance for California’s ag economy
• Priorities: International trade, globalization, ag policy, ag. productivity and technology, ag. labor, ag. land issues, commodity markets and agribusiness
• UC based center for 30 years
• http://aic.ucdavis.edu/

Today’s Discussion
• Trends in the local food movement
• Role of California agriculture in global food supply


Number of Articles that Discuss “Local Food Movement” in Text, 2001-2012
0
100
200
300
400
500
600
70020
01
2003
2004
2005
2006
2007
2008
2009
2010
2011
2012
Num
ber
of A
rtic
les
Source: NewsBank


0
100
200
300
400
500
600
700
800
900
Calif
orni
aN
ew Y
ork
Mas
sach
uset
tsM
ichi
gan
Wis
cons
inIll
inoi
sO
hio
Penn
sylv
ania
Iow
aVi
rgin
iaN
orth
Car
olin
aFl
orid
aM
inne
sota
Colo
rado
Ore
gon
Texa
sIn
dian
aKe
ntuc
kyM
isso
uri
Conn
ectic
utM
aryl
and
Alab
ama
Was
hing
ton
New
Jers
eySo
uth
Caro
lina
Geo
rgia
Kans
asN
ew H
amps
hire
Verm
ont
Tenn
esse
eHa
wai
iM
aine
Neb
rask
aAr
izon
aW
est V
irgin
iaAr
kans
asM
issi
ssip
piO
klah
oma
New
Mex
ico
Idah
oM
onta
naN
orth
Dak
ota
Loui
sian
aRh
ode
Isla
ndW
yom
ing
Nev
ada
Sout
h D
akot
aU
tah
Dist
rict o
f…De
law
are
Alas
ka
Number of Farmers Markets Listed by State, 2012
Source: USDA AMS

Number of Farmers Markets
Arizona 82 California 827 Hawaii 88 Nevada 38 Utah 37 Total Member States 1,072 Total USA 7,860
Number of Farmers’ Markets Listed by State for 2012
Source: USDA AMS

Direct-to-Consumer Food Marketing* by Region,1997-2007
Source: USDA AMS * Direct marketing is defined as agricultural products sold directly to individuals for human consumption in the U.S. Census of Agriculture, 2007.

Top 10 States, Direct-to-Consumer Food Marketing as Share of Total Agricultural Sales, 2007
Source: USDA AMS

Agricultural Economy of Top 10 Direct-to-Consumer Marketing States, 2012
• Total Cash Receipts = $9.79 billion • Total US Cash Receipts = $390.8 billion
• Share of US Agriculture Production Value = 2.5%

Direct-to-Consumer Food Marketing Sales For 2007
Source: USDA AMS

Direct-to-Consumer Market Value as Share of California Agriculture
2007 Value of Direct-To-Consumer Sales in California $163 million
2007 Value of California Agriculture Cash Receipts $37 billion
Share .004
2012 Value of Direct-To-Consumer Sales in California* $292 million
2012 Value of California Agriculture Cash Receipts $44 billion
Share .006
* Assumes growth rate for direct-to-market sales is equal to growth rate in farmers’ markets in US.

California Agriculture
• In 2012 – California Agriculture Production = $44.1 billion.
– California agriculture =11% of total US value in
agriculture production.
– Next closest state is Iowa at about $32 billion or 8.2% of US Ag. production value.
Source: USDA-Economic Research Service

$0$5
$10$15$20$25$30$35$40$45$50
1960
1963
1966
1969
1972
1975
1978
1981
1984
1987
1990
1993
1996
1999
2002
2005
2008
2011
Tota
l Val
ue in
$bi
llion
Annual Value of California
Agricultural Production 1960-2012
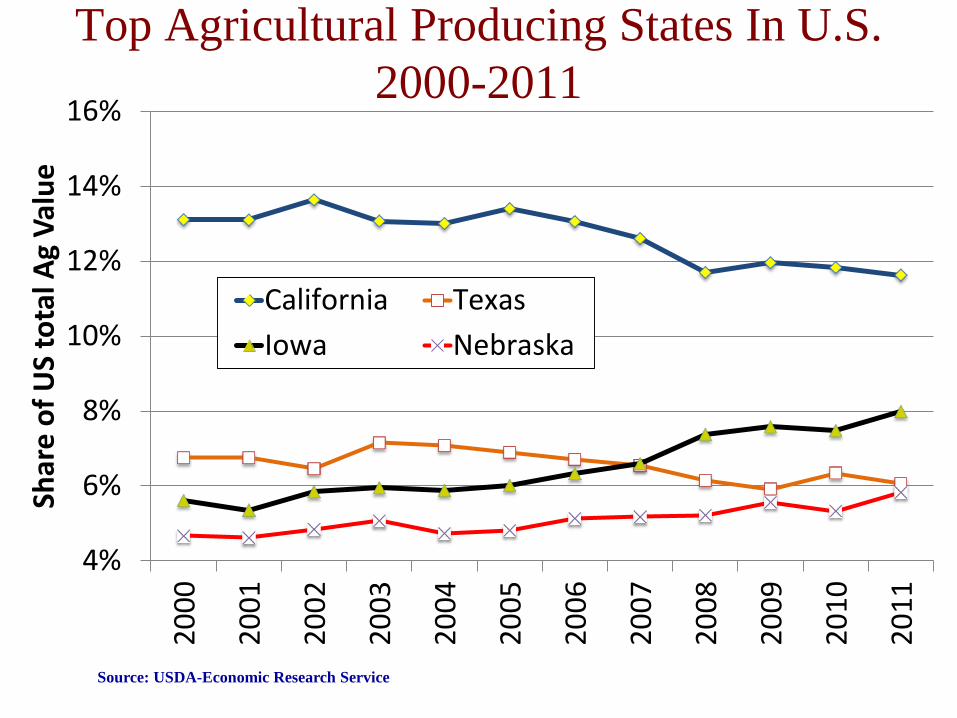
Top Agricultural Producing States In U.S. 2000-2011
Source: USDA-Economic Research Service
4%
6%
8%
10%
12%
14%
16%
2000
2001
2002
2003
2004
2005
2006
2007
2008
2009
2010
2011
Shar
e of
US
tota
l Ag
Valu
e
California TexasIowa Nebraska


California’s Agricultural Advantage
Mild Climate Fertile Soils Adequate Precipitation (Rain/Snow)
Source: State of California

Source: California Department of Food and Agriculture
Commodities Produced in California

Crops for which California is the Sole Producer in the US
• Almonds • Pistachios • Walnuts • Figs • Kiwi • Nectarines • Olives
• Clingstone Peaches • Plums • Prunes • Raisins • Dates • Artichokes
Source: USDA-Economic Research Service

Other Crops for Which CA is a Major Producer (70-98%)
• Apricots • Grapes • Lemons • Strawberries • Cotton (Pima)
• Lettuce • Proc. Tomatoes • Spinach • Garlic • Celery • Cauliflower • Broccoli • Avocadoes

Source: USDA-ERS
Fruit and nuts 32%
Vegetable 15% Dairy
16%
Meat and Poultry
10%
Greenhouse Nursery
8%
Field Crops 17%
Other Crops 2%
Share of 2011 California Agricultural Value by Commodity Group

Commodities 2011 Farm Value
(in $billions)
Dairy Products $7.6
Almonds $3.8
Grapes $3.8
Beef $2.5
Strawberries $1.9
Top 5 Commodities by Value for 2011

Annual Value of Top 5 Commodities
0.0
1.0
2.0
3.0
4.0
5.0
6.0
7.0
8.0
9.0
1990
1992
1994
1996
1998
2000
2002
2004
2006
2008
2010
Valu
e of
Pro
duct
ion
in $
billi
on Dairy
AlmondsGrapesBeefStrawberries


$0
$2
$4
$6
$8
$10
$12
$14
$16
1995
1996
1997
1998
1999
2000
2001
2002
2003
2004
2005
2006
2007
2008
2009
2010
2011
Expo
rt V
alue
s in
$bill
ion
Top-10 Commodities
Principal Commodities
All Agricultural Exports
California Export Values, 1995-2011
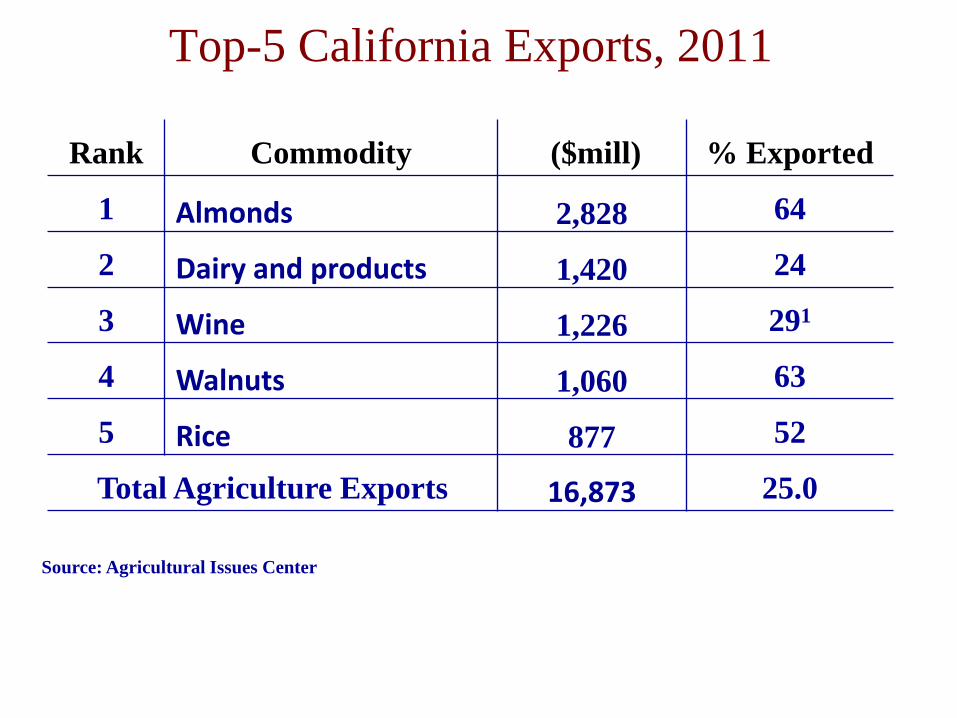
Rank Commodity ($mill) % Exported
1 Almonds 2,828 64
2 Dairy and products 1,420 24
3 Wine 1,226 291
4 Walnuts 1,060 63
5 Rice 877 52
Total Agriculture Exports 16,873 25.0
Top-5 California Exports, 2011
Source: Agricultural Issues Center
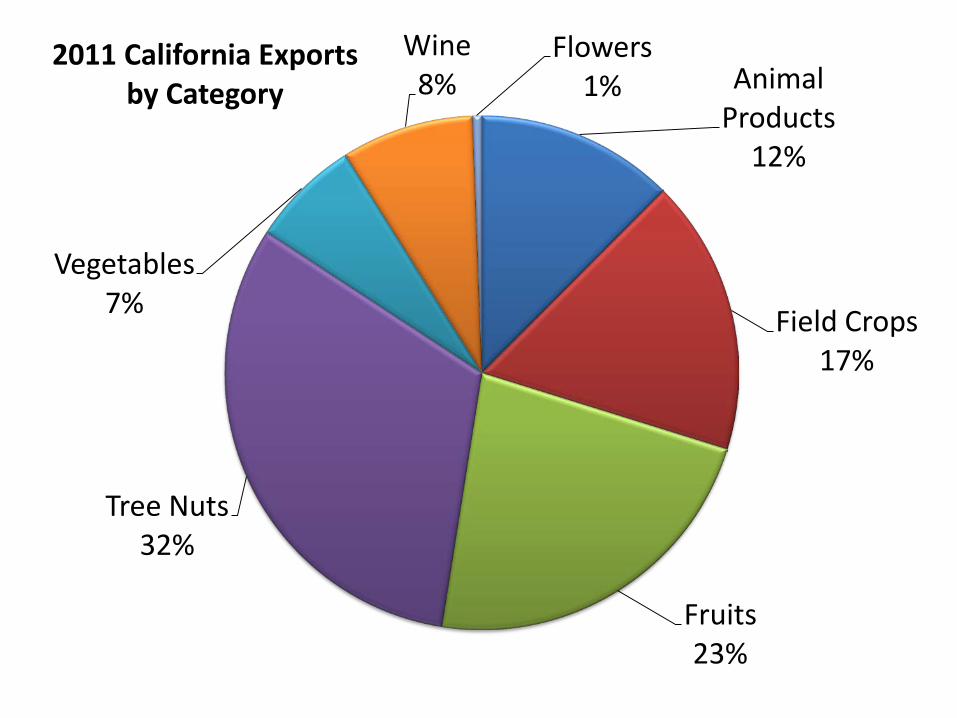
Animal Products
12%
Field Crops 17%
Fruits 23%
Tree Nuts 32%
Vegetables 7%
Wine 8%
Flowers 1%
2011 California Exports by Category

Canada 18%
European Union-27*
14%
China / Hong Kong 10%
Japan 8%
Mexico 5%
South Korea 5%
India 2%
United Arab Emirates
2%
Turkey 2%
Taiwan 2%
Rest of World 32%
Top Ten Export Destinations for 2011 California Exports

California Agriculture Exports to Asia/Pacific Region
• In 2011 California exports went to 39 different Asia/Pacific countries.
• Total value of exports to region in 2011 was $5.74 billion, or 34% of total exports.
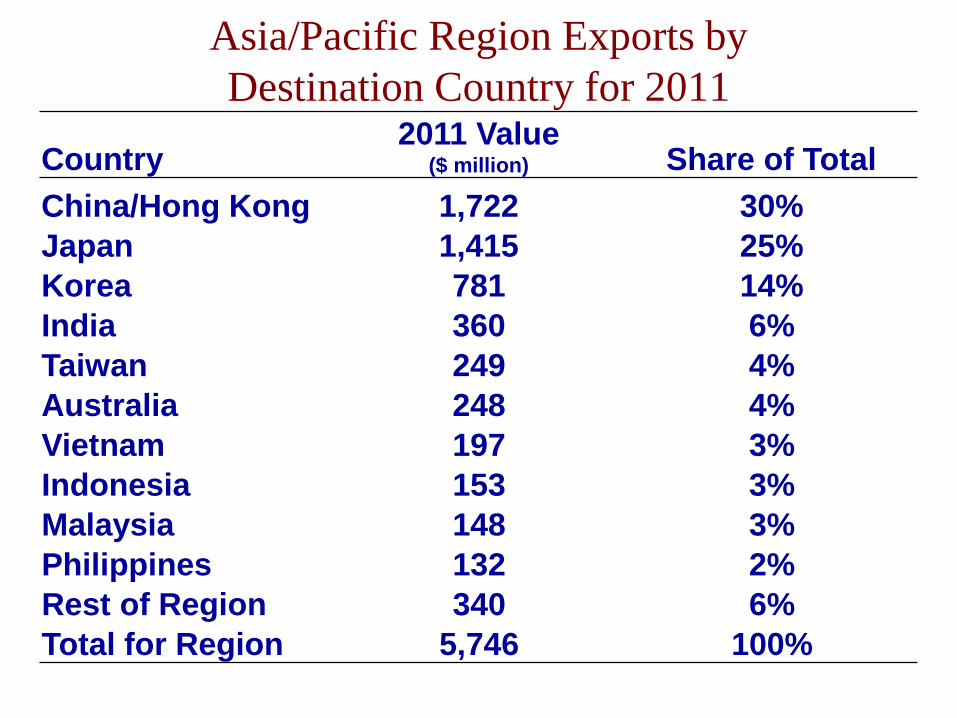
Asia/Pacific Region Exports by Destination Country for 2011
Country 2011 Value
($ million) Share of Total China/Hong Kong 1,722 30% Japan 1,415 25% Korea 781 14% India 360 6% Taiwan 249 4% Australia 248 4% Vietnam 197 3% Indonesia 153 3% Malaysia 148 3% Philippines 132 2% Rest of Region 340 6% Total for Region 5,746 100%

Asia/Pacific Region Exports by Commodity for 2011
Commodity 2011 Value
($ million) Share of Total Almonds 1,067 19% Dairy 603 11% Oranges 482 8% Rice 473 8% Walnuts 400 7% Table Grapes 366 6% Wine 363 6% Beef 349 6% Pistachios 339 6% Cotton 305 5% Other Exports 1,000 17% Total Exports 5,746 100%

2011 California Exports to Asia/Pacific Region by
Category
Animal Products
17%
Field Crops and Flowers
18%
Fruits 25%
Tree Nuts 31%
Vegetables 3%
Wine 6%

US-Asia/Pacific Free Trade Agreements
• US-Australia: Entered into force on January 1, 2005. – U.S. goods exports were $18.9 billion in 2009, up 33
percent from 2004 (US Trade Representative).
• US-Korea: Entered into force on March 15, 2012.
• Trans Pacific Partnership

Australia as Export Destination for California Agriculture
• Australia is consistently a top-15 destination country for California agriculture products.
• In 2011 Australia purchased $248 million in
agricultural exports from California.

$0
$50
$100
$150
$200
Tree Nuts Table Grapes Citrus Grand Total
Valu
e in
$m
illio
ns
2001-2004 Avg2005-2011 Avg
Average Value of California Exports to Australia

Korea as Export Destination for California Agriculture
• Korea was the #6 destination country for California agriculture products in 2011.
• Korea purchased $751 million in agriculture products from California in 2011.

Base tariffs in Korea for selected products

Access improvement by general market access category

Comparison of US Exports to Korea of Commodities that went to 0% Tariff at Start of FTA
Commodities 2011 2012 Percent Change
2011 - 2012 $1,000
Beef- Hides 286,933 312,621 9.00% Almonds 84,314 130,009 54.20% Cherries 1,842 76,382 4047.30% Tomatoes, Processed 12,761 16,215 27.10% Wine 10,511 15,550 47.90% Raisins 10,006 12,199 21.90%
Total 406,367 562,976 38.54%

Trans Pacific Partnership
• Current Trans-Pacific Partnership Agreement (TPSEP) is a free trade agreement among Brunei, Chile, New Zealand, and Singapore (begun in 2005).
• Since 2010, negotiations to significantly expand the TPP to include Australia, Canada, Malaysia, Mexico, Peru, the United States, Vietnam and Japan have taken place. – Focus on Japan

Japan as Export Destination for California Agriculture
• Total California Ag Exports to Japan in 2011 Valued $1.45 billion.
• Japan was the third highest destination
country for California agricultural exports in 2011.

2011 California Agricultural Exports to Japan
Commodity 2011 Value
($ million) Share of Total Rice 292 21% Almonds 135 10% Beef 111 8% Hay 106 7% Wine 100 7% Oranges 93 7% Dairy 86 6% Walnuts 78 6% Raisins 49 3% Lemons 47 3% Other Exports 318 22% Total Exports 1,415 100%

Conclusions • The eat local movement is a growing trend
but remains a small part of overall agricultural production and value.
• California’s strengths are producing and processing large numbers of different commodities efficiently and competing in the global market. This is will continue.

Thank You