Embed Size (px)
Citation preview
NPTEL Phase II : IIT Kharagpur : Prof. R. N. Ghosh, Dept of Metallurgical and Materials Engineering | |
1
Module 24
Iron – carbon system II
Lecture 24
Iron – carbon system II
NPTEL Phase II : IIT Kharagpur : Prof. R. N. Ghosh, Dept of Metallurgical and Materials Engineering | |
2
Keywords: Iron – graphite phase diagram, morphology of graphite in cast iron, grey cast iron,
malleable cast iron, nodular cast iron, mechanical properties of iron‐carbon alloys, effect of
super cooling on decomposition of austenite, time temperature transformation (TTT) diagram,
bainite, martensite
Introduction In the last lecture we looked at Fe‐Fe3C meta‐stable phase diagram. It was mentioned that iron
carbide is not a stable phase although it can exist in this form at room temperature for
indefinite periods. However on prolonged exposure to high temperature (around 600°C) it can
decompose into ferrite and graphite. We would therefore look at iron graphite phase diagram
and learn about alloys where carbon is present as graphite. We would also look at the effect of
carbon content on the mechanical properties of binary iron carbon alloys. We are also familiar
with the limitation of phase diagram. It can only predict evolution structure in metals and alloys
under equilibrium rate of cooling which is often too slow. In iron carbon system there is a
transformation where all the three phases involved are solid. This is the eutectoid reaction.
During this carbon atom in austenite gets partitioned between ferrite and cementite. This is
possible only through solid state diffusion of carbon which is slow. It would be interesting to
see what could be the effect of super cooling (or cooling rate) on such a transformation.
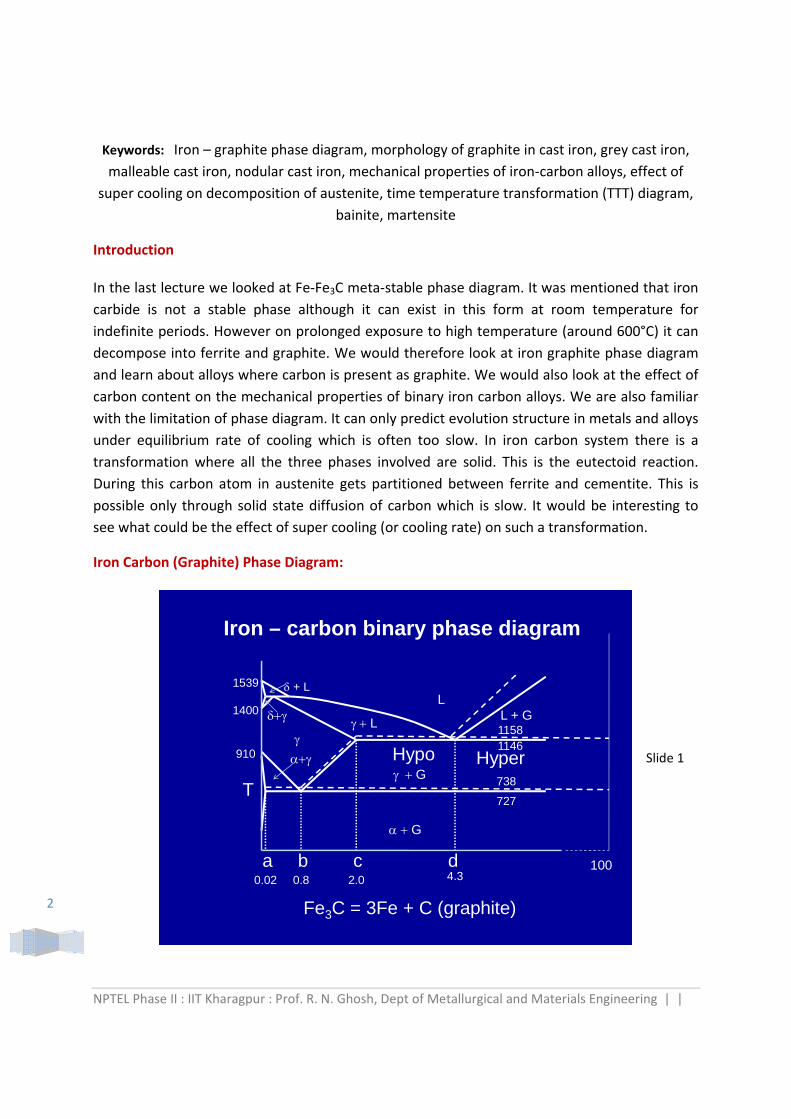
Iron Carbon (Graphite) Phase Diagram:
Iron – carbon binary phase diagram
Fe3C = 3Fe + C (graphite)
a b c d
T
Hypo Hyper
L
G
L + GL
G
0.02 0.8 2.0 4.3
910
1539
1400
727
738
11461158
+ L
100
Slide 1
NPTEL Phase II : IIT Kharagpur : Prof. R. N. Ghosh, Dept of Metallurgical and Materials Engineering | |
3
The Fe‐Fe3C phase diagram has been reproduced in slide with firm line. The iron graphite phase
diagram is very much the same. Solubility of carbon in the two forms of ferrite is still the same.
There is a minor change in the upper limit of the solubility of carbon in austenite and in liquid.
The broken (dashed) lines are the boundaries between various phase fields in the case of Fe‐C
phase diagram. Note that the compositions of the critical points marked as a, b, c, & d are
nearly the same as those in Fe‐Fe3C phase diagram. The eutectoid and the eutectic
temperatures are a little higher. The diagram extends till 100% C. Fe3C is not a stable phase. It
decomposes into Fe and C. There are several grades of cast iron having graphite as one of the
constituents. However graphite is rarely present in steel. The density of graphite is 2.2gm/cc
whereas that of iron is 7.87gm/cc. This is why iron carbon alloys where carbon is present as
graphite expands on solidification. They are easy to cast as there is no problem associated with
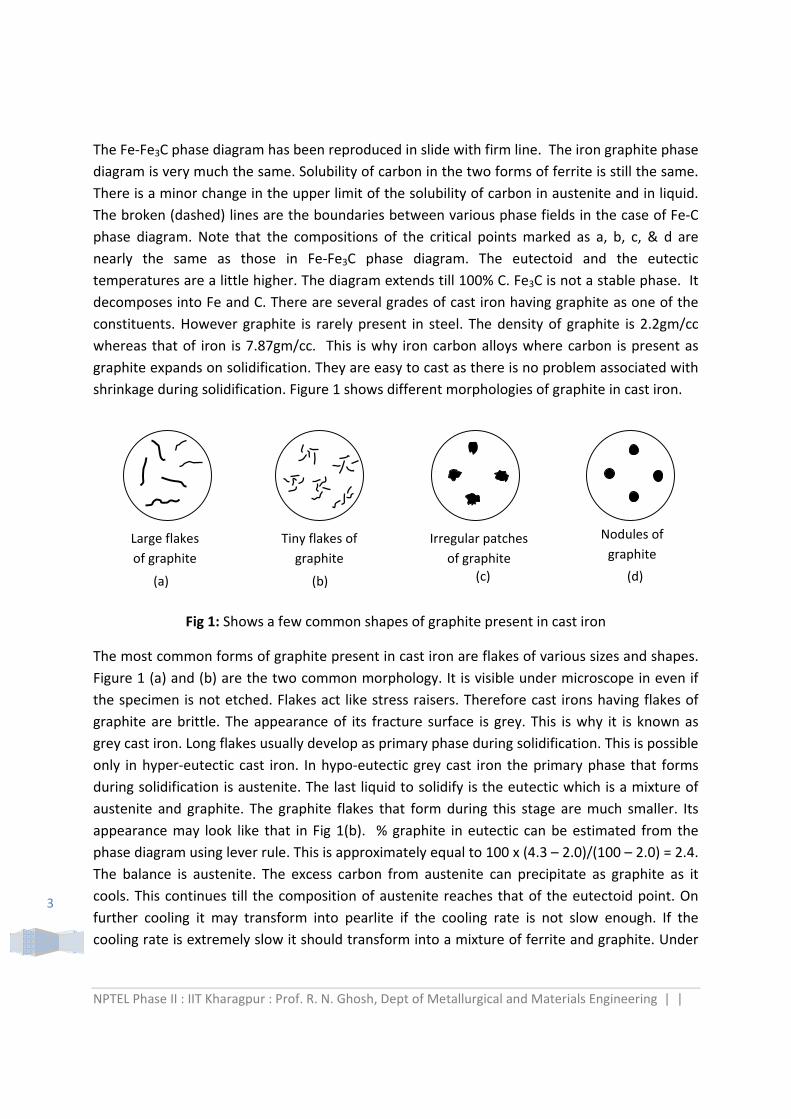
shrinkage during solidification. Figure 1 shows different morphologies of graphite in cast iron.
Fig 1: Shows a few common shapes of graphite present in cast iron
The most common forms of graphite present in cast iron are flakes of various sizes and shapes.
Figure 1 (a) and (b) are the two common morphology. It is visible under microscope in even if
the specimen is not etched. Flakes act like stress raisers. Therefore cast irons having flakes of
graphite are brittle. The appearance of its fracture surface is grey. This is why it is known as
grey cast iron. Long flakes usually develop as primary phase during solidification. This is possible
only in hyper‐eutectic cast iron. In hypo‐eutectic grey cast iron the primary phase that forms
during solidification is austenite. The last liquid to solidify is the eutectic which is a mixture of
austenite and graphite. The graphite flakes that form during this stage are much smaller. Its
appearance may look like that in Fig 1(b). % graphite in eutectic can be estimated from the
phase diagram using lever rule. This is approximately equal to 100 x (4.3 – 2.0)/(100 – 2.0) = 2.4.
The balance is austenite. The excess carbon from austenite can precipitate as graphite as it
cools. This continues till the composition of austenite reaches that of the eutectoid point. On
further cooling it may transform into pearlite if the cooling rate is not slow enough. If the
cooling rate is extremely slow it should transform into a mixture of ferrite and graphite. Under
Large flakes
of graphite
Tiny flakes of
graphite
Nodules of
graphite Irregular patches
of graphite
(a) (b) (c) (d)
NPTEL Phase II : IIT Kharagpur : Prof. R. N. Ghosh, Dept of Metallurgical and Materials Engineering | |
4
such a condition grey cast iron would consist of ferrite grains and graphite flakes. The matrix of
such cast iron can vary from 100% ferrite to 100% pearlite.
The morphology of graphite shown in fig 1 (c) develops when white cast iron is held at around
950°C for long hours. This shape is usually known as temper carbon. White cast iron is
extremely brittle. However such treatment results in substantial improvement in its ductility.
Cast iron having such a structure is known as malleable cast iron. Flakes of graphite behave as
long cracks. This makes grey cast iron brittle. Temper carbons appear as collections of irregular
shaped patches of graphite in a microstructure. Unlike flakes such a form of carbon does not
act as notches or stress raisers. Therefore cast iron where graphite exits in this form is ductile.
The morphology shown in fig 1(d) can be obtained by special treatment during solidification. If
molten iron having high superheat is inoculated with magnesium, graphite nucleates in nodular
shapes. This too has good ductility. It is known as SG (Spheroidal Graphite) or nodular iron. Like
grey cast iron both nodular and malleable cast iron can have a matrix of 100 % ferrite or 100%
pearlite or a mixture of the two. Commercial cast iron has significant amount of silicon. Truly
cast iron is not a binary alloy. It is often considered as a ternary alloy of Fe‐C‐Si.
Mechanical properties of iron – carbon alloys: Phase diagram helps us interpret the structure of an alloy belonging to a system. The properties
of an alloy depend on its microstructure. Most of these follow the rule of mixture. Let us look at
the effect of carbon content on the properties of iron carbon alloys. Slide 2 presents a sketch of
iron carbon phase diagram. Recall that it tells us about the structure of alloys under equilibrium
rate of cooling. Pure iron at room temperature consists of grains of ferrite. It has the lowest
hardness but the highest ductility. If it has less than 0.002 % carbon, the structure is expected
to be primarily ferrite with a few precipitates of cementite. As a consequence its hardness and
tensile strength is likely to increase with carbon content. When % C exceeds the solubility limit
pearlite appears as one of the constituents. Since it is an intimate mixture of ferrite and
cemetite it has significantly higher strength and hardness. The amount of pearlite keeps
increasing from 0% at 0.002% C to 100% at 0.8%C. The strength and hardness of the alloy
increase linearly with the amount of pearlite. If %C is in the range 0.8 to 2.0 the alloy consists of
pearlite and pro‐eutectoid cementite. Its strength and hardness keep increasing with the
amount of cementite since it has higher hardness. However ductility decreases with increasing
amount of cementite. The trend continues even beyond 2.0% carbon.
NPTEL Phase II : IIT Kharagpur : Prof. R. N. Ghosh, Dept of Metallurgical and Materials Engineering | |
5
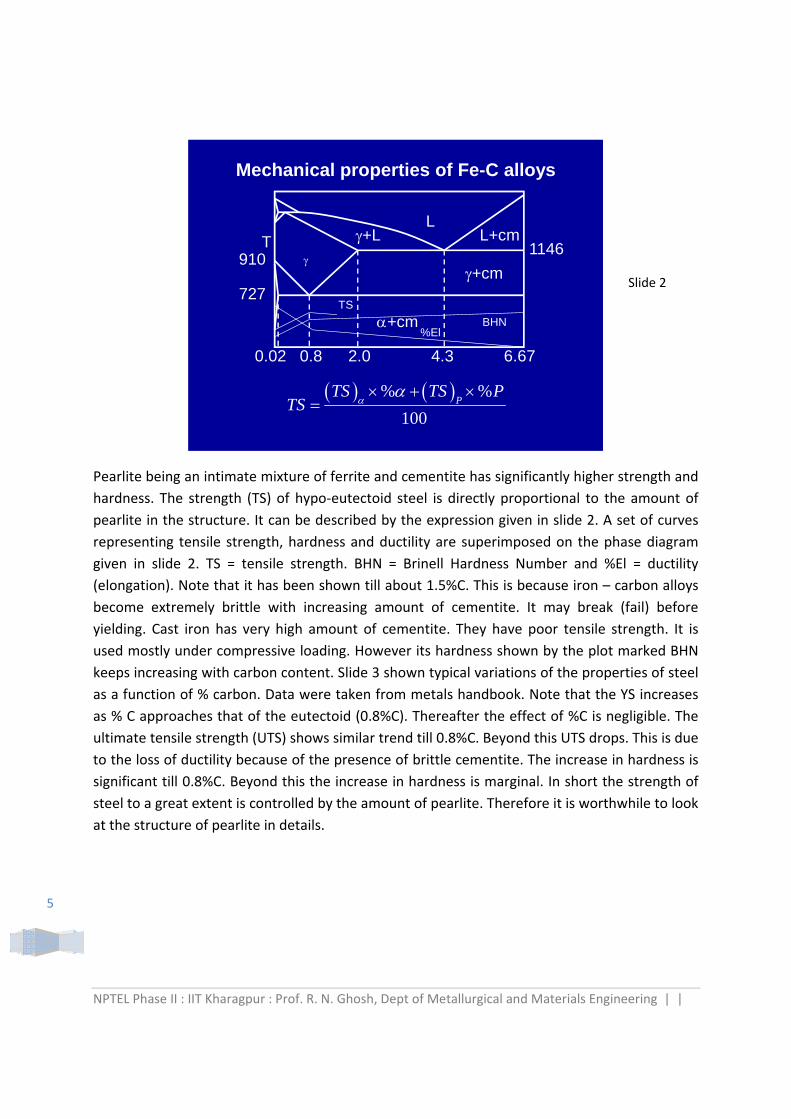
Mechanical properties of Fe-C alloys
0.02 0.8 2.0 4.3
T
6.67
9101146
727
LL+cm+L
+cm
+cm
% %
100P
TS TS PTS
TS
BHN%El
Pearlite being an intimate mixture of ferrite and cementite has significantly higher strength and
hardness. The strength (TS) of hypo‐eutectoid steel is directly proportional to the amount of
pearlite in the structure. It can be described by the expression given in slide 2. A set of curves
representing tensile strength, hardness and ductility are superimposed on the phase diagram
given in slide 2. TS = tensile strength. BHN = Brinell Hardness Number and %El = ductility
(elongation). Note that it has been shown till about 1.5%C. This is because iron – carbon alloys
become extremely brittle with increasing amount of cementite. It may break (fail) before
yielding. Cast iron has very high amount of cementite. They have poor tensile strength. It is
used mostly under compressive loading. However its hardness shown by the plot marked BHN
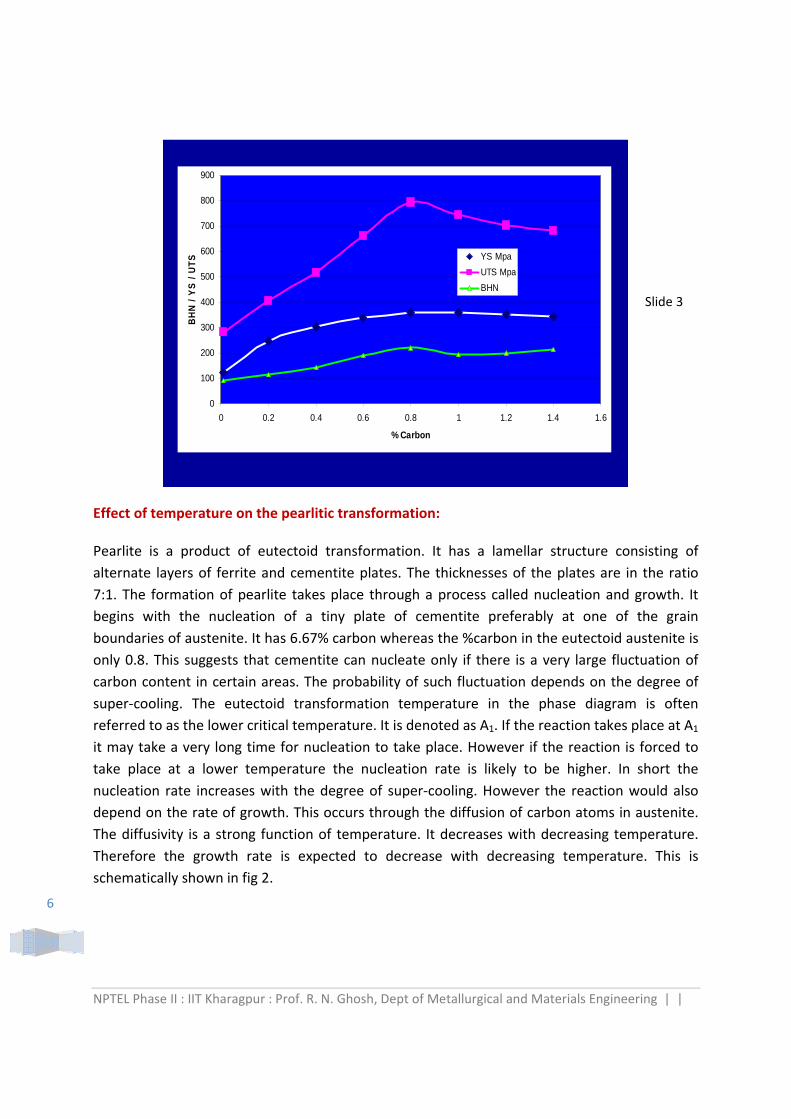
keeps increasing with carbon content. Slide 3 shown typical variations of the properties of steel
as a function of % carbon. Data were taken from metals handbook. Note that the YS increases
as % C approaches that of the eutectoid (0.8%C). Thereafter the effect of %C is negligible. The
ultimate tensile strength (UTS) shows similar trend till 0.8%C. Beyond this UTS drops. This is due
to the loss of ductility because of the presence of brittle cementite. The increase in hardness is
significant till 0.8%C. Beyond this the increase in hardness is marginal. In short the strength of
steel to a great extent is controlled by the amount of pearlite. Therefore it is worthwhile to look
at the structure of pearlite in details.
Slide 2
NPTEL Phase II : IIT Kharagpur : Prof. R. N. Ghosh, Dept of Metallurgical and Materials Engineering | |
6
0
100
200
300
400
500
600
700
800
900
0 0.2 0.4 0.6 0.8 1 1.2 1.4 1.6
% Carbon
BH
N /
YS
/ U
TS YS Mpa
UTS Mpa
BHN
Effect of temperature on the pearlitic transformation: Pearlite is a product of eutectoid transformation. It has a lamellar structure consisting of
alternate layers of ferrite and cementite plates. The thicknesses of the plates are in the ratio
7:1. The formation of pearlite takes place through a process called nucleation and growth. It
begins with the nucleation of a tiny plate of cementite preferably at one of the grain
boundaries of austenite. It has 6.67% carbon whereas the %carbon in the eutectoid austenite is
only 0.8. This suggests that cementite can nucleate only if there is a very large fluctuation of
carbon content in certain areas. The probability of such fluctuation depends on the degree of
super‐cooling. The eutectoid transformation temperature in the phase diagram is often
referred to as the lower critical temperature. It is denoted as A1. If the reaction takes place at A1
it may take a very long time for nucleation to take place. However if the reaction is forced to
take place at a lower temperature the nucleation rate is likely to be higher. In short the
nucleation rate increases with the degree of super‐cooling. However the reaction would also
depend on the rate of growth. This occurs through the diffusion of carbon atoms in austenite.
The diffusivity is a strong function of temperature. It decreases with decreasing temperature.
Therefore the growth rate is expected to decrease with decreasing temperature. This is
schematically shown in fig 2.
Slide 3
NPTEL Phase II : IIT Kharagpur : Prof. R. N. Ghosh, Dept of Metallurgical and Materials Engineering | |
7
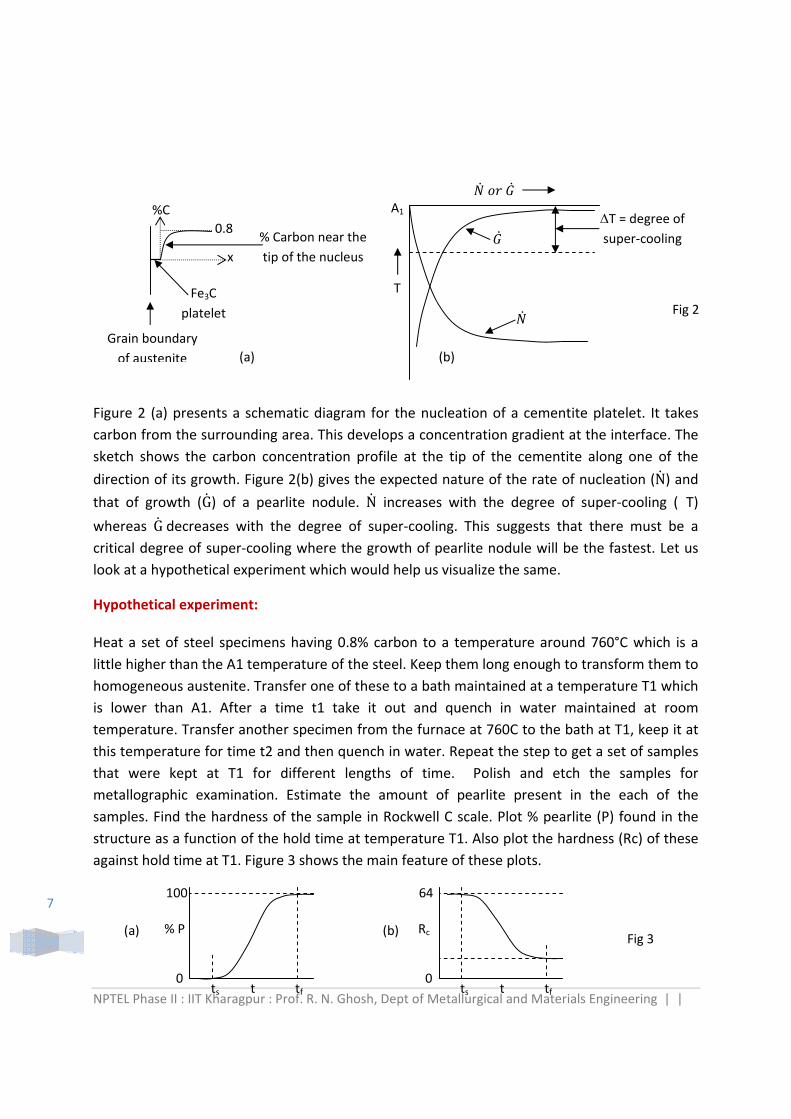
Figure 2 (a) presents a schematic diagram for the nucleation of a cementite platelet. It takes
carbon from the surrounding area. This develops a concentration gradient at the interface. The
sketch shows the carbon concentration profile at the tip of the cementite along one of the
direction of its growth. Figure 2(b) gives the expected nature of the rate of nucleation (N) and
that of growth (G) of a pearlite nodule. N increases with the degree of super‐cooling (�T)
whereas Gdecreases with the degree of super‐cooling. This suggests that there must be a
critical degree of super‐cooling where the growth of pearlite nodule will be the fastest. Let us
look at a hypothetical experiment which would help us visualize the same.
Hypothetical experiment: Heat a set of steel specimens having 0.8% carbon to a temperature around 760°C which is a
little higher than the A1 temperature of the steel. Keep them long enough to transform them to
homogeneous austenite. Transfer one of these to a bath maintained at a temperature T1 which
is lower than A1. After a time t1 take it out and quench in water maintained at room
temperature. Transfer another specimen from the furnace at 760C to the bath at T1, keep it at
this temperature for time t2 and then quench in water. Repeat the step to get a set of samples
that were kept at T1 for different lengths of time. Polish and etch the samples for
metallographic examination. Estimate the amount of pearlite present in the each of the
samples. Find the hardness of the sample in Rockwell C scale. Plot % pearlite (P) found in the
structure as a function of the hold time at temperature T1. Also plot the hardness (Rc) of these
against hold time at T1. Figure 3 shows the main feature of these plots.
Grain boundary
of austenite
Fe3C
platelet
%C
0.8
x
% Carbon near the
tip of the nucleus
A1
T
T = degree of super‐cooling
(a) (b)
Fig 2
% P
t 0
100
ts tf
Rc
t 0
64
ts tf
Fig 3 (a) (b)
NPTEL Phase II : IIT Kharagpur : Prof. R. N. Ghosh, Dept of Metallurgical and Materials Engineering | |
8
Note the S‐shaped feature of the curve representing the extent of transformation in fig 3(a). It
shows that pearlite forms only in specimens that were held at T1 for a period greater than ts,
which is a measure of the time at which the formation of pearlite begins. The amount of
pearlite that forms at this temperature increases with hold time till it becomes 100% pearlite at
tf. It denotes the time at which the transformation ends. It is very easy to identify pearlite in the
microstructure. It has a distinct lamellar feature. If the cementite plates are very closely spaced
the lamellar feature may not get resolved. Nevertheless the area would appear to be much
darker than the rest. What does the brighter region represent we would know very shortly.
Figure 3(b) represents the variation in hardness as a function of hold time at temperature T1.
Look at the shape of the curve. It appears to be a mirror reflection of the S‐shape in fig 3 (a).
The hardness of the samples which were kept at T1 for a period less than ts is very high. As the
hold time increases the hardness keeps dropping till it reaches a limiting value. This happens at
tf, the time at which the transformation is complete.
The times at which the transformation starts or ends can thus be estimated either by looking at
the microstructure or from the hardness. The two are expected to be very close. Note the initial
and the limiting value of the hardness. Repeat the same experiment at several temperatures
below the lower critical temperature A1. The data may be compiled in a tabular form as shown
in table 1. Plot these as shown in Fig 4. This gives two C‐shaped curves for ts and tf.
Table 1: A record of ts & tf as a function of transformation temperature
Transformation Temperature ts tf
T1 ts1 tf1
T2 ts2 tf2
‐ ‐ ‐
Ti tsi tfi
‐ ‐ ‐
‐ ‐ ‐
Tn tsn tfn
Ms
Mf
T
0
A1 T1
t
T2
Tc
Tn
Rc
+ P
+ B
+ M
Pearlite
(P)
Bainite
(B)
Martensite
(M) t1s t1f tcs tcf tnf tns
Fig 4
ts tf
NPTEL Phase II : IIT Kharagpur : Prof. R. N. Ghosh, Dept of Metallurgical and Materials Engineering | |
9
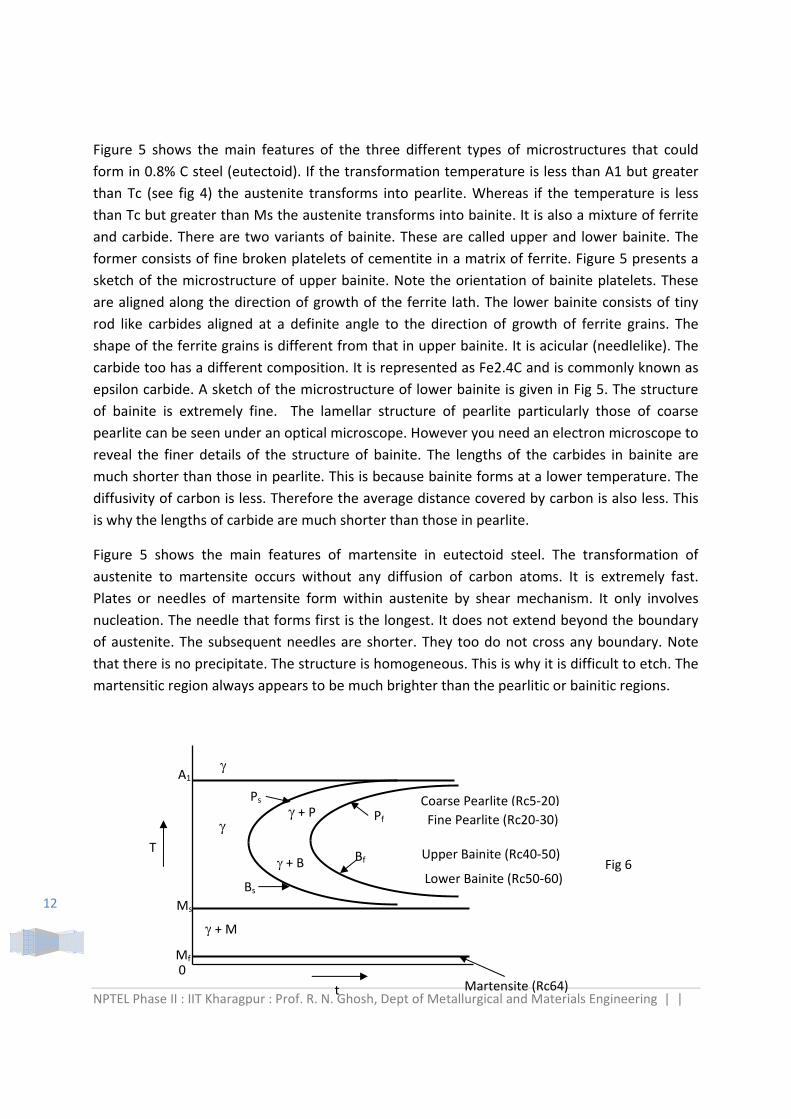
Time Temperature Transformation (TTT) Diagram: The plot shown in Fig 4 represents the time at which the transformation of austenite to a
mixture of ferrite and carbide starts (ts) and the time at which it is finished (tf) as a function of
temperature. It is commonly known as the time temperature transformation diagram. Often it
is referred to as the TTT diagram. This has been obtained by an experiment where the
transformation takes place at a constant temperature. Therefore it is also known as the
isothermal transformation diagram of the steel.
The transformation of austenite into an aggregate of ferrite and carbide takes place by
nucleation and growth. The formation of a new constituent in austenite is associated with the
creation of a new interface. At the eutectoid temperature both austenite and the ferrite
carbide aggregate are equally stable. The free energy of transformation is zero. Therefore
nucleation that needs creation of new interface cannot take place. Super‐cooling (�T) is
essential for this to happen. The rate of nucleation increases with �T (Fig 2). The growth of a
stable nucleus needs continuous supply of solutes through the austenite grains surrounding it.
This is controlled by the diffusion of carbon atoms in austenite. It decreases with decreasing
temperature (Fig 2). As a consequence as the transformation temperature drops the rate of
transformation becomes fasters. Both ts and tf keep decreasing. During this stage the
transformation is dominated by nucleation. However as the temperature drops further, the
diffusion of carbon becomes very slow. This is when the transformation begins to be dominated
by the growth. The ts and tf hereafter start increasing. There is a critical temperature at which
the magnitudes of ts and tf are the lowest. This is often called the knee (or the nose) of the
curve. The rate of eutectoid transformation is the highest at this temperature. The ferrite
carbide aggregate that forms above the knee of the TTT diagram is called pearlite. It has a
lamellar structure consisting of alternate layers of ferrite and cementite. The product of the
eutectoid transformation occurring at temperatures below the knee of the TTT diagram but
above the line marked Ms is known as Bainite. This too is a fine aggregate of ferrite and
carbide. The hardness or the strength of the product is a function of the size and the
distribution of hard cementite within ferrite matrix. Lower the temperature the finer is the
structure and finer structure means higher hardness. This is why fig 4 shows that the hardness
of the final structure (usually reported in Rockwell C scale: Rc) increases with decreasing
transformation temperature.
When the sample is quenched below a temperature marked Ms in fig 4, a totally different kind
of transformation takes place. This does not involve diffusion at all. Therefore the
transformation takes place at a very high speed approaching that of the sound. It occurs
through shear displacement. It is known as Martensitic transformation. The product is known
as Martensite. It is a phase. Carbon does not precipitate out of austenite. It is retained within
NPTEL Phase II : IIT Kharagpur : Prof. R. N. Ghosh, Dept of Metallurgical and Materials Engineering | |
10
the lattice by force. This results in a distorted body centered unit cell. Ferrite has BCC structure
where carbon occupies the octahedral interstitial sites.
Since the solubility of carbon in ferrite is very low (0.002% at room temperature) only a very
small fraction of these sites are occupied. The octahedral sites are not symmetrical. Whenever
these sites are occupied by carbon the iron atoms are pushed apart along one of the 3 axes.
This results in a tetragonal (asymmetric) distortion. The effect is not felt when only an
infinitesimally small fractions of these sites are filled up by carbon atoms. However if 0.8%
carbon is retained within the lattice (it is not allowed to precipitate out as carbide) a significant
number of these sites are occupied by carbon atoms. The lattice gets highly strained. In fact due
to the asymmetric distortion the crystal structure becomes body centered tetragonal. The c/a
ratio is a little higher than 1. In BCC the c/a ratio equal to 1. The c/a ratio of martensite is a
function of its carbon content. In eutectoid steel this may be around 1.08. Therefore for all
practical purpose, the martensite may be assumed to be a supersaturated solid solution of
carbon in ferrite having BCC structure. The presence of excess carbon is the main reason for the
tetragonal lattice distortion. This also makes the structure very hard. The hardness of
martensite is a function of its carbon content. For eutectoid steel it is around Rc 64.
Since the transformation of austentite to martensite does not involve any diffusion, the
transformation occurs only as long as the temperature keeps dropping. Such a transformation is
known as an athermal transformation. It starts at a characteristic temperature called Ms and it
continues till a characteristic temperature called Mf when it is over. Ms is the temperature at
which maternsitic transformation starts and Mf is the temperature at which it finishes.
Refer to fig 3 (b). Note that the hardness of the samples that were held at the transformation
temperature for less than ts have hardness equal to Rc 64. Thereafter it decreases because a
part of the austenite transforms into ferrite carbide aggregate having lower hardness. The
hardness approaches a limiting value which is the characteristic of the final structure. This can
be as low as Rc 20 if the structure is coarse pearlite. It can also be very high (~Rc 55) for bainite
that forms at temperatures close to the Ms. Thus depending on the transformation
temperature eutectoid steel can have hardness as low as Rc 20 to as high as Rc 64.
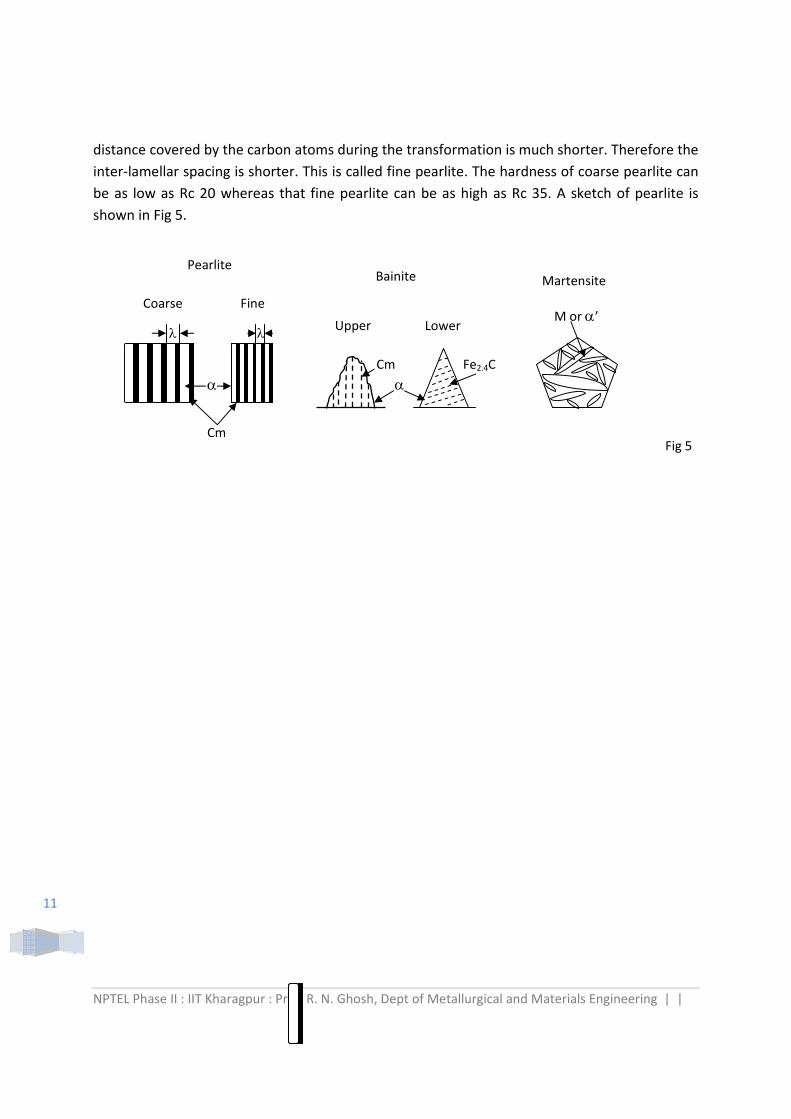
Structures of Pearlite, Bainite & Martensite: Pearlite is a mixture of ferrite and cementite. The two are arranged as alternate layers. The
plates of cementite are thin whereas those of the ferrite are thick. The widths of the two are in
the ratio of 1:7. The structure is often referred to as lamellar. The evolution its structure is
controlled by the diffusion of carbon atoms in austenite. At a higher temperature the diffusion
distance ( √Dt ) is longer. Therefore the plates of cementite and ferrite are wider. The inter‐
lamellar spacing is longer. Such a structure is called coarse pearlite. At lower temperature the
NPTEL Phase II : IIT Kharagpur : Prof. R. N. Ghosh, Dept of Metallurgical and Materials Engineering | |
11
distance covered by the carbon atoms during the transformation is much shorter. Therefore the
inter‐lamellar spacing is shorter. This is called fine pearlite. The hardness of coarse pearlite can
be as low as Rc 20 whereas that fine pearlite can be as high as Rc 35. A sketch of pearlite is
shown in Fig 5.
Cm
Pearlite
Coarse Fine
Bainite
Upper Lower
Cm Fe2.4C
Martensite
M or ’
Fig 5
NPTEL Phase II : IIT Kharagpur : Prof. R. N. Ghosh, Dept of Metallurgical and Materials Engineering | |
12
Figure 5 shows the main features of the three different types of microstructures that could
form in 0.8% C steel (eutectoid). If the transformation temperature is less than A1 but greater
than Tc (see fig 4) the austenite transforms into pearlite. Whereas if the temperature is less
than Tc but greater than Ms the austenite transforms into bainite. It is also a mixture of ferrite
and carbide. There are two variants of bainite. These are called upper and lower bainite. The
former consists of fine broken platelets of cementite in a matrix of ferrite. Figure 5 presents a
sketch of the microstructure of upper bainite. Note the orientation of bainite platelets. These
are aligned along the direction of growth of the ferrite lath. The lower bainite consists of tiny
rod like carbides aligned at a definite angle to the direction of growth of ferrite grains. The
shape of the ferrite grains is different from that in upper bainite. It is acicular (needlelike). The
carbide too has a different composition. It is represented as Fe2.4C and is commonly known as
epsilon carbide. A sketch of the microstructure of lower bainite is given in Fig 5. The structure
of bainite is extremely fine. The lamellar structure of pearlite particularly those of coarse
pearlite can be seen under an optical microscope. However you need an electron microscope to
reveal the finer details of the structure of bainite. The lengths of the carbides in bainite are
much shorter than those in pearlite. This is because bainite forms at a lower temperature. The
diffusivity of carbon is less. Therefore the average distance covered by carbon is also less. This
is why the lengths of carbide are much shorter than those in pearlite.
Figure 5 shows the main features of martensite in eutectoid steel. The transformation of
austenite to martensite occurs without any diffusion of carbon atoms. It is extremely fast.
Plates or needles of martensite form within austenite by shear mechanism. It only involves
nucleation. The needle that forms first is the longest. It does not extend beyond the boundary
of austenite. The subsequent needles are shorter. They too do not cross any boundary. Note
that there is no precipitate. The structure is homogeneous. This is why it is difficult to etch. The
martensitic region always appears to be much brighter than the pearlitic or bainitic regions.
Fig 6
Ps
Pf
Ms
Mf
T
0
A1
t
Bs
+ P
+ B
+ M
Coarse Pearlite (Rc5‐20)
Upper Bainite (Rc40‐50)
Martensite (Rc64)
Bf
Fine Pearlite (Rc20‐30)
Lower Bainite (Rc50‐60)
NPTEL Phase II : IIT Kharagpur : Prof. R. N. Ghosh, Dept of Metallurgical and Materials Engineering | |
13
Figure 6 gives a schematic time temperature transformation diagram of eutectoid steel. The
structure and properties of the final product is a function of the temperature at which the
transformation takes place. Coarse pearlite has the lowest hardness. The details of its structure
can be easily seen under optical microscope. The lower the transformation temperature finer is
the pearlite. Just below the knee of the diagram the transformation product is upper bainite. It
is also known as feathery bainite. The structure is finer than that of fine pearlite. It is harder as
well. The bainite that forms at temperatures nearer the Ms is called lower bainite. It is also
known as acicular bainite. Its hardness is higher than that of upper bainite. On direct quenching
to room temperature you get 100% martensite. This has the highest hardness.
Experimental techniques for determining TTT diagram of steel: The method described above can be used to generate the TTT diagram of steel. However this is
a very tedious method of determining the same. It takes a long time as well. There are several
alternative methods of determining the TTT diagram. One of the most popular techniques uses
the dimensional change that takes place during the decomposition of austenite into low
temperature stable structures. This is known as dilatometer. Austenite is a close packed
structure. Its density is higher than that of its transformation product. If the length of a small
test piece is continuously monitored after it is quenched from its austenitic state to a
temperature below A1 and held there you would notice that the length initially remains
constant but it begins to increase soon after. The trend continues till it reaches a limiting value.
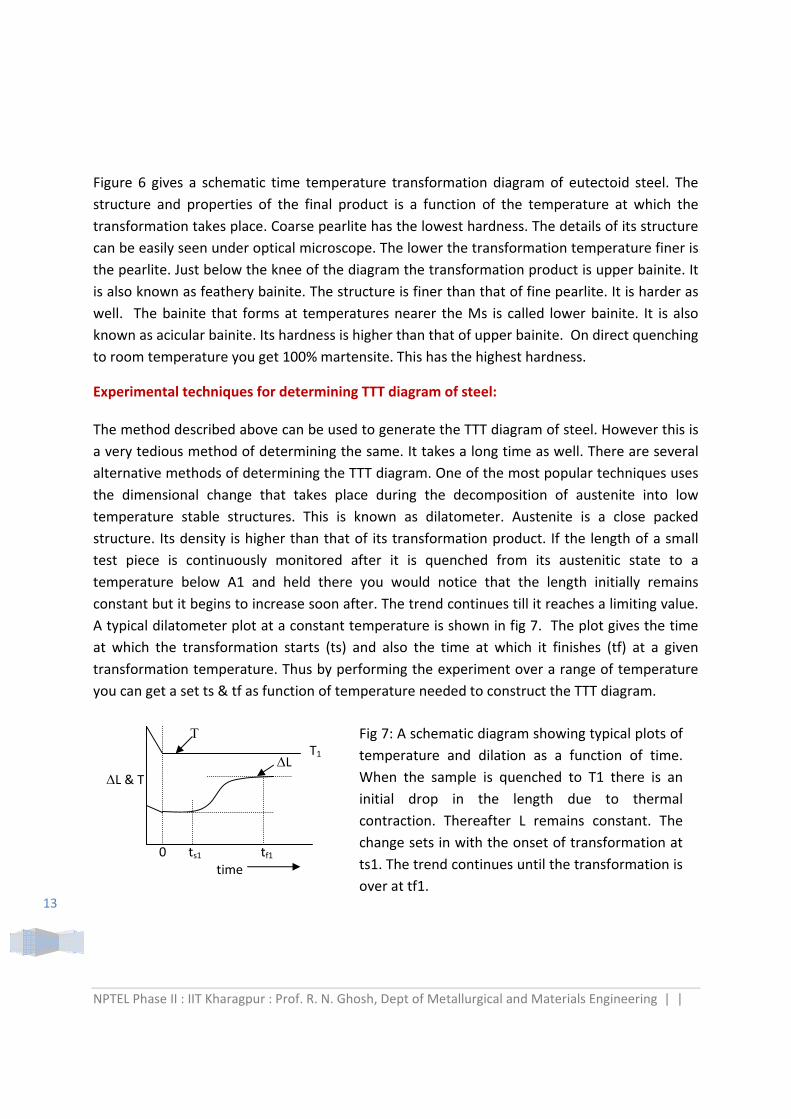
A typical dilatometer plot at a constant temperature is shown in fig 7. The plot gives the time
at which the transformation starts (ts) and also the time at which it finishes (tf) at a given
transformation temperature. Thus by performing the experiment over a range of temperature
you can get a set ts & tf as function of temperature needed to construct the TTT diagram.
L L & T
0
T1
ts1 tf1
Fig 7: A schematic diagram showing typical plots of
temperature and dilation as a function of time.
When the sample is quenched to T1 there is an
initial drop in the length due to thermal
contraction. Thereafter L remains constant. The
change sets in with the onset of transformation at
ts1. The trend continues until the transformation is
over at tf1. time
NPTEL Phase II : IIT Kharagpur : Prof. R. N. Ghosh, Dept of Metallurgical and Materials Engineering | |
14
In principle the TTT diagram can be generated by continuous measurement of any physical characteristic of steel (e.g. dilation, electrical resistance or magnetic property, thermal analysis). A wide range of commercial equipment is available which can readily be used for this purpose. Summary: In this lecture we looked at Fe‐C equilibrium diagram. Fe3C is only a meta‐stable phase. Under
prolong thermal exposure at high temperature it decomposes into Fe & C. Traces of graphite
have been detected in several high temperature components of power plants and oil refineries.
The tendency of graphitization increases with increasing carbon content. Graphite is a major
constituent in several grades of cast iron. We did look at the different types of morphology of
graphite in cast iron. We also learnt about the correlation between structure and properties of
steel and cast iron. The steel is strong yet ductile whereas cast iron is brittle. Steel is strong
under tension as well as under compression. Whereas cast iron has good compressive strength
but it has poor tensile strength. In the end we looked at the effect of transformation
temperature on the nature of transformation and the structure that evolves in eutectoid steel.
Depending on the temperature of transformation the steel can have pearlite bainite or
martensite. We learnt about the main features of three different structures and their
properties. We also learnt how to construct time temperature transformation diagram for this
steel. The evolution of microstructure so far was illustrated with the help of a set of schematic
sketches. Here are a few microstructures taken from the work of one my colleague and his
students. These would help you have an idea about the main morphological features of
martensite and bainite in steel. Finer details get revealed only when these are examined under
SEM and TEM.
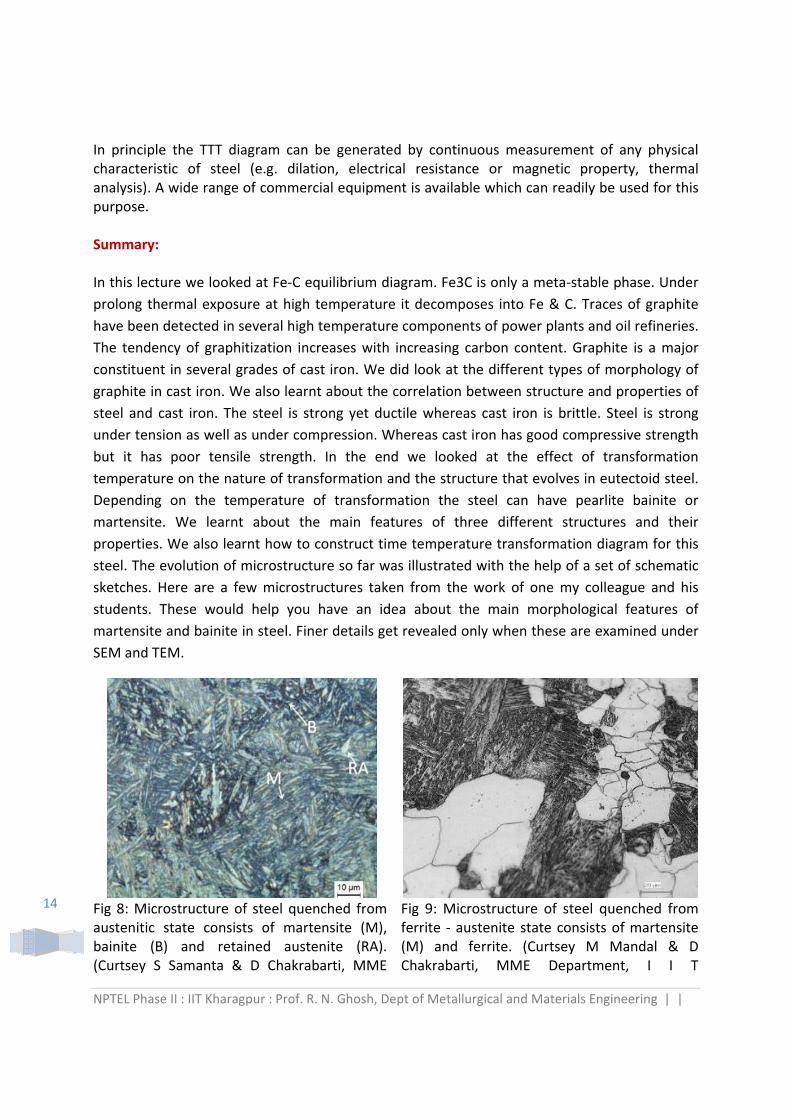
Fig 8: Microstructure of steel quenched from austenitic state consists of martensite (M), bainite (B) and retained austenite (RA). (Curtsey S Samanta & D Chakrabarti, MME
Fig 9: Microstructure of steel quenched from ferrite ‐ austenite state consists of martensite (M) and ferrite. (Curtsey M Mandal & D Chakrabarti, MME Department, I I T
NPTEL Phase II : IIT Kharagpur : Prof. R. N. Ghosh, Dept of Metallurgical and Materials Engineering | |
15
Department, I I T Kharagpur) Kharagpur)
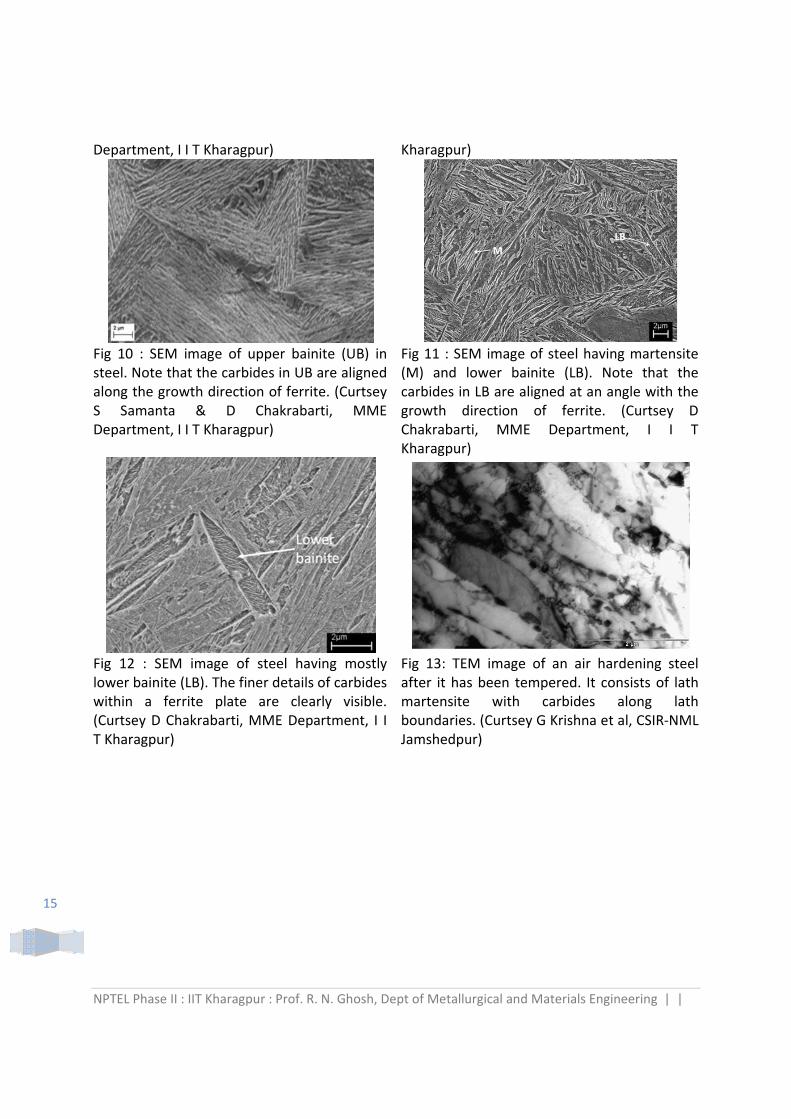
Fig 10 : SEM image of upper bainite (UB) in steel. Note that the carbides in UB are aligned along the growth direction of ferrite. (Curtsey S Samanta & D Chakrabarti, MME Department, I I T Kharagpur)
Fig 11 : SEM image of steel having martensite (M) and lower bainite (LB). Note that the carbides in LB are aligned at an angle with the growth direction of ferrite. (Curtsey D Chakrabarti, MME Department, I I T Kharagpur)
Fig 12 : SEM image of steel having mostly lower bainite (LB). The finer details of carbides within a ferrite plate are clearly visible. (Curtsey D Chakrabarti, MME Department, I I T Kharagpur)
Fig 13: TEM image of an air hardening steel after it has been tempered. It consists of lath martensite with carbides along lath boundaries. (Curtsey G Krishna et al, CSIR‐NML Jamshedpur)
NPTEL Phase II : IIT Kharagpur : Prof. R. N. Ghosh, Dept of Metallurgical and Materials Engineering | |
16
Exercise:
1. If an eutectoid steel is kept at 700⁰C what change do you expect? 2. What is the limitation of phase diagram? 3. If a piece of steel having 0.8 % carbon has martensitic stucture can it be converted to
fully pearlite structure by holding it at 700⁰ C? 4. Suggest a method of getting a mixture of Pearlite, Bainite & Martensite in an eutectoid
steel. 5. Which microstructure in eutectoid steel has maximum hardenss? Give reason.
Answer:
1. Lamellar structure is unstable as it has large surface area. Initially the cementite plates would break down in to globular structure. Size of the globule will grow with time. Cementite is also metastable on prolonged thermal exposure it breaks down in to ferrite and graphite.
2. Phase diagram does not show the effect of cooling rate. It gives the expected phases in an alloy at a given temperature under equilibrium condition.
3. No. To get pearlitic structure it must be heated back to austenite state then cooled slowly.
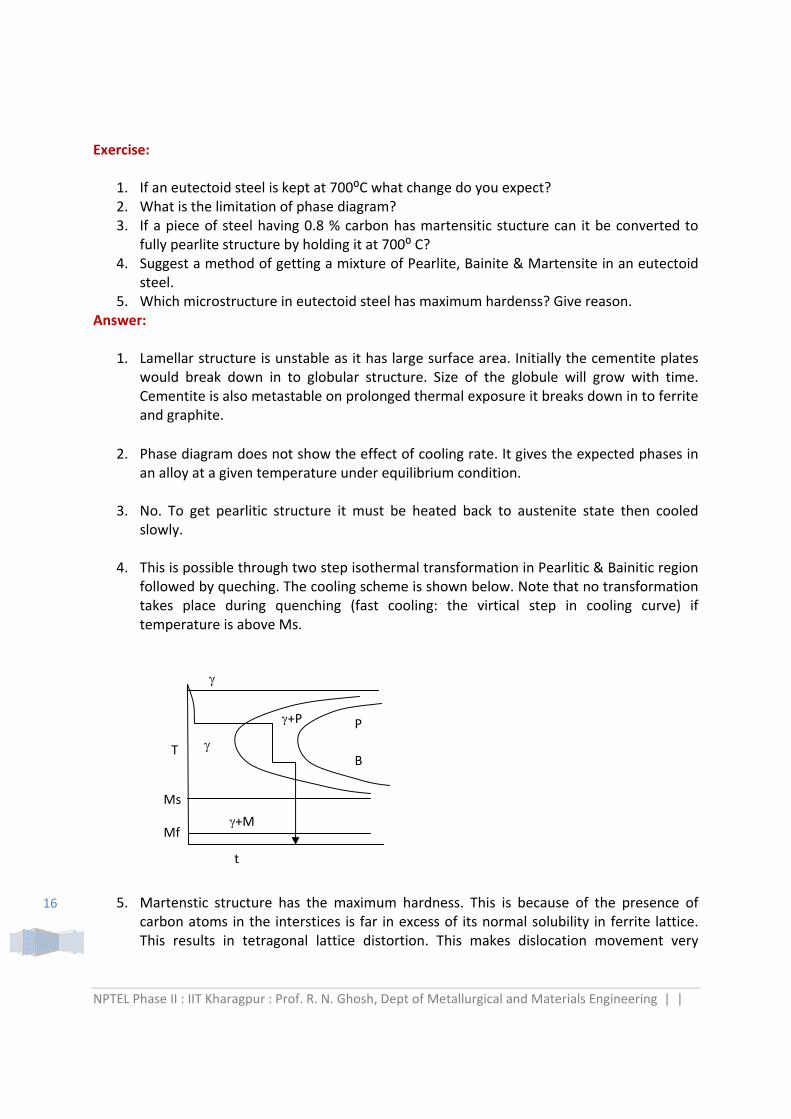
4. This is possible through two step isothermal transformation in Pearlitic & Bainitic region followed by queching. The cooling scheme is shown below. Note that no transformation takes place during quenching (fast cooling: the virtical step in cooling curve) if temperature is above Ms.
5. Martenstic structure has the maximum hardness. This is because of the presence of carbon atoms in the interstices is far in excess of its normal solubility in ferrite lattice. This results in tetragonal lattice distortion. This makes dislocation movement very
T
t
P
B
+P
+M
Ms
Mf

NPTEL Phase II : IIT Kharagpur : Prof. R. N. Ghosh, Dept of Metallurgical and Materials Engineering | |
17
difficult. This in conjuction with extremely fine microstructure account for the high hardness of Martensite.