Embed Size (px)
Citation preview
Is the Railroads’ “Renaissance” simply a thing of the past?
SWARS!Alamo City
abh consultingFebruary, 2016
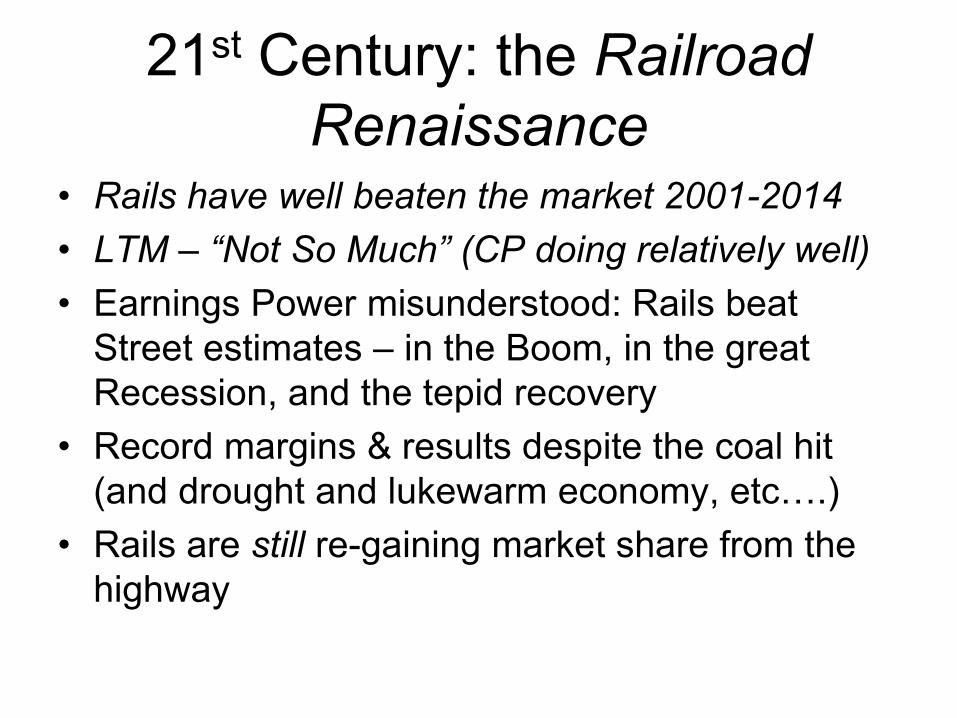
21st Century: the Railroad Renaissance
• Rails have well beaten the market 2001-2014• LTM – “Not So Much” (CP doing relatively well)• Earnings Power misunderstood: Rails beat
Street estimates – in the Boom, in the great Recession, and the tepid recovery
• Record margins & results despite the coal hit (and drought and lukewarm economy, etc….)
• Rails are still re-gaining market share from the highway
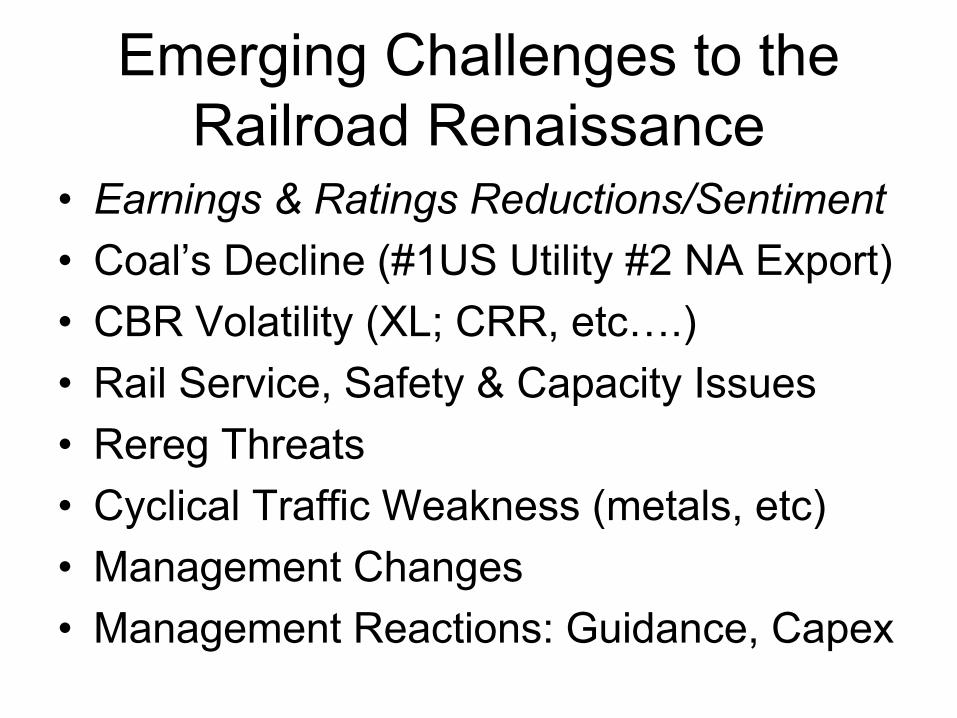
Emerging Challenges to the Railroad Renaissance
• Earnings & Ratings Reductions/Sentiment• Coal’s Decline (#1US Utility #2 NA Export)• CBR Volatility (XL; CRR, etc….)• Rail Service, Safety & Capacity Issues• Rereg Threats• Cyclical Traffic Weakness (metals, etc)• Management Changes• Management Reactions: Guidance, Capex
Railroads Help Keep Coal-Based Electricity
SLIDE 4 ASSOCIATION OF AMERICAN RAILROADS
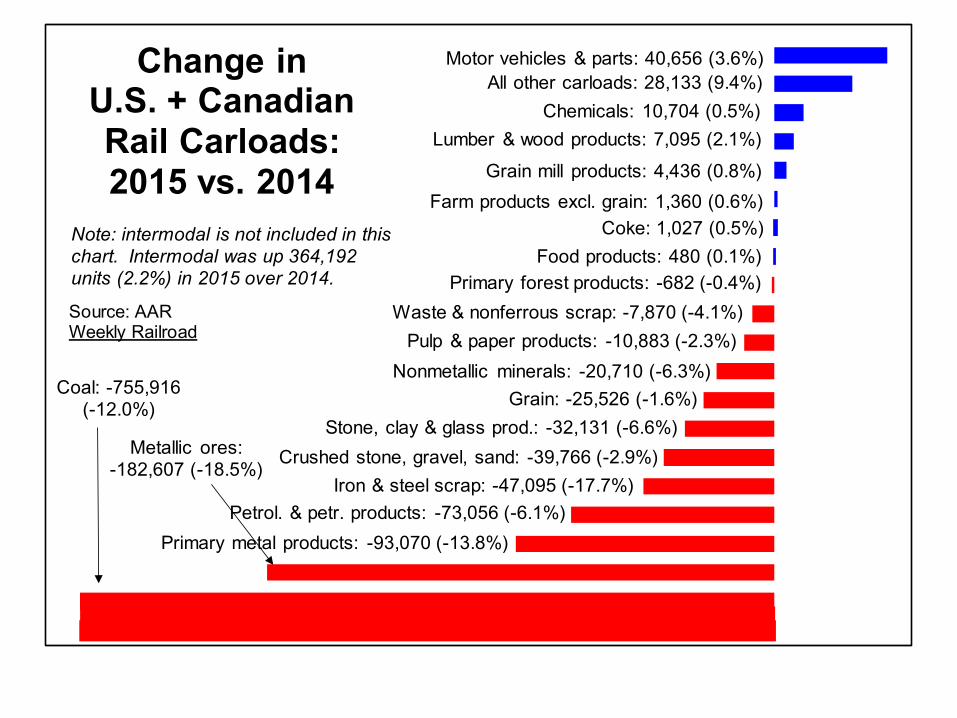
Coal: -755,916 (-12.0%)
Metallic ores: -182,607 (-18.5%)
Primary metal products: -93,070 (-13.8%)
Iron & steel scrap: -47,095 (-17.7%)Crushed stone, gravel, sand: -39,766 (-2.9%)
Stone, clay & glass prod.: -32,131 (-6.6%)Grain: -25,526 (-1.6%)
Nonmetallic minerals: -20,710 (-6.3%)Pulp & paper products: -10,883 (-2.3%)
Waste & nonferrous scrap: -7,870 (-4.1%)Primary forest products: -682 (-0.4%)
Food products: 480 (0.1%)Coke: 1,027 (0.5%)
Farm products excl. grain: 1,360 (0.6%)Grain mill products: 4,436 (0.8%)
Lumber & wood products: 7,095 (2.1%)Chemicals: 10,704 (0.5%)
All other carloads: 28,133 (9.4%)Motor vehicles & parts: 40,656 (3.6%)
Source: AAR Weekly Railroad
Change in U.S. + Canadian Rail Carloads: 2015 vs. 2014
Note: intermodal is not included in this chart. Intermodal was up 364,192 units (2.2%) in 2015 over 2014.
Petrol. & petr. products: -73,056 (-6.1%)
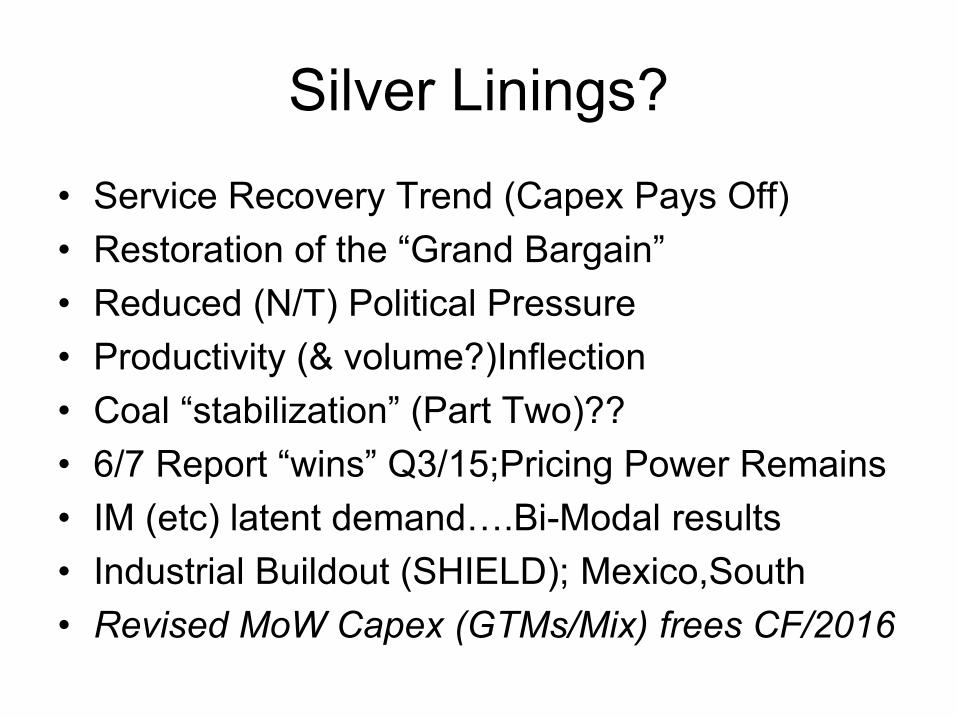
Silver Linings?• Service Recovery Trend (Capex Pays Off)• Restoration of the “Grand Bargain” • Reduced (N/T) Political Pressure• Productivity (& volume?)Inflection• Coal “stabilization” (Part Two)??• 6/7 Report “wins” Q3/15;Pricing Power Remains• IM (etc) latent demand….Bi-Modal results• Industrial Buildout (SHIELD); Mexico,South• Revised MoW Capex (GTMs/Mix) frees CF/2016

Powered by
MARS Winter 2016 Audience Polling - Tony Hatch• Tuesday, January 12, 2016
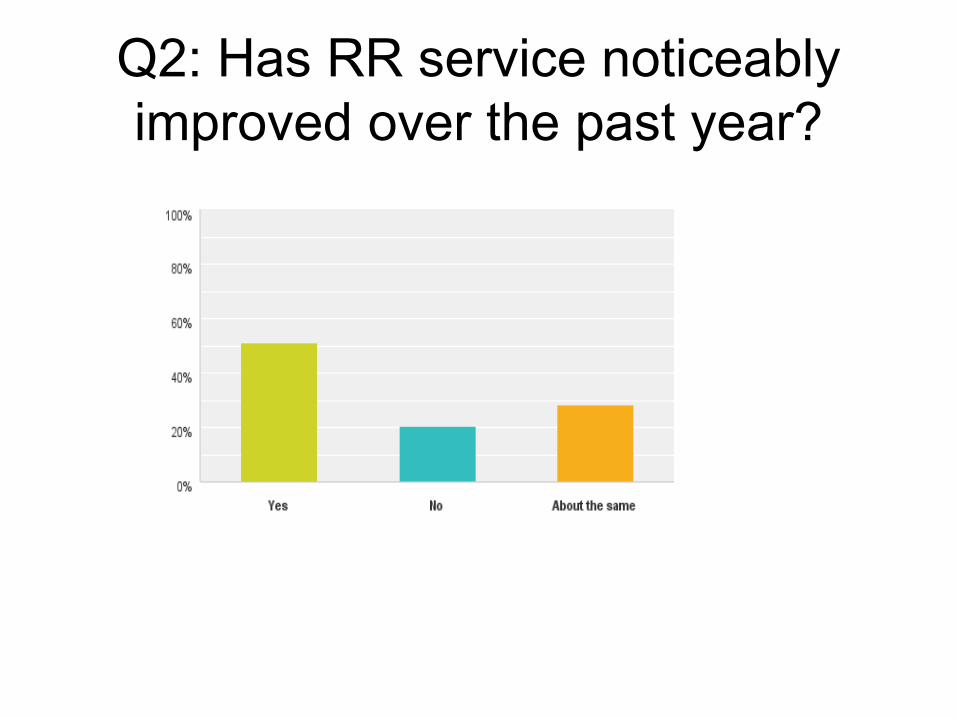
Q2: Has RR service noticeably improved over the past year?
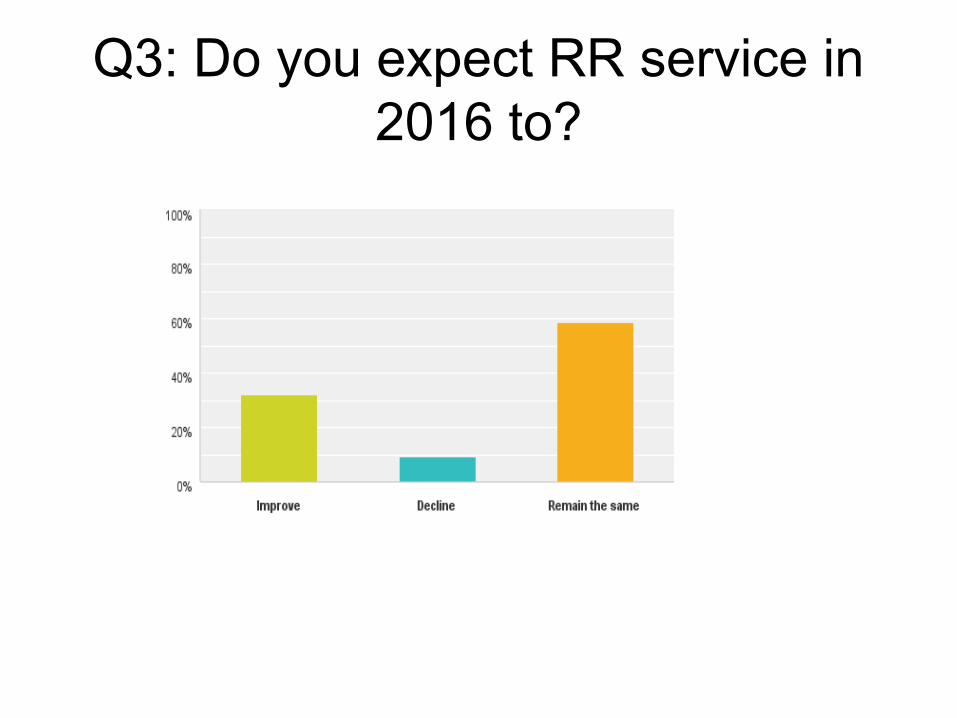
Q3: Do you expect RR service in 2016 to?
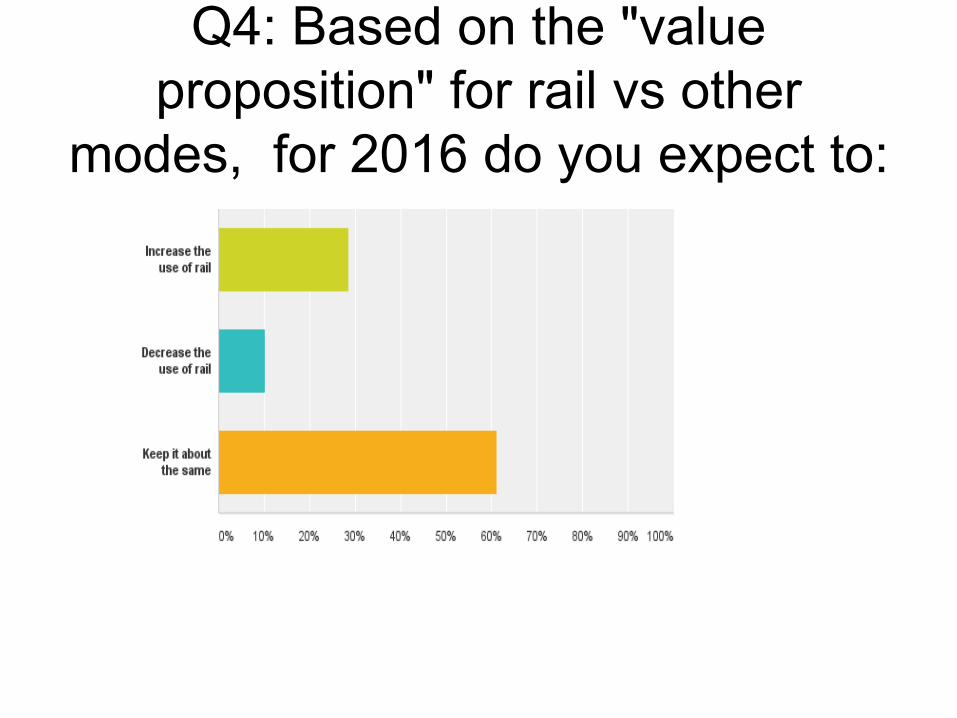
Q4: Based on the "value proposition" for rail vs other
modes, for 2016 do you expect to:
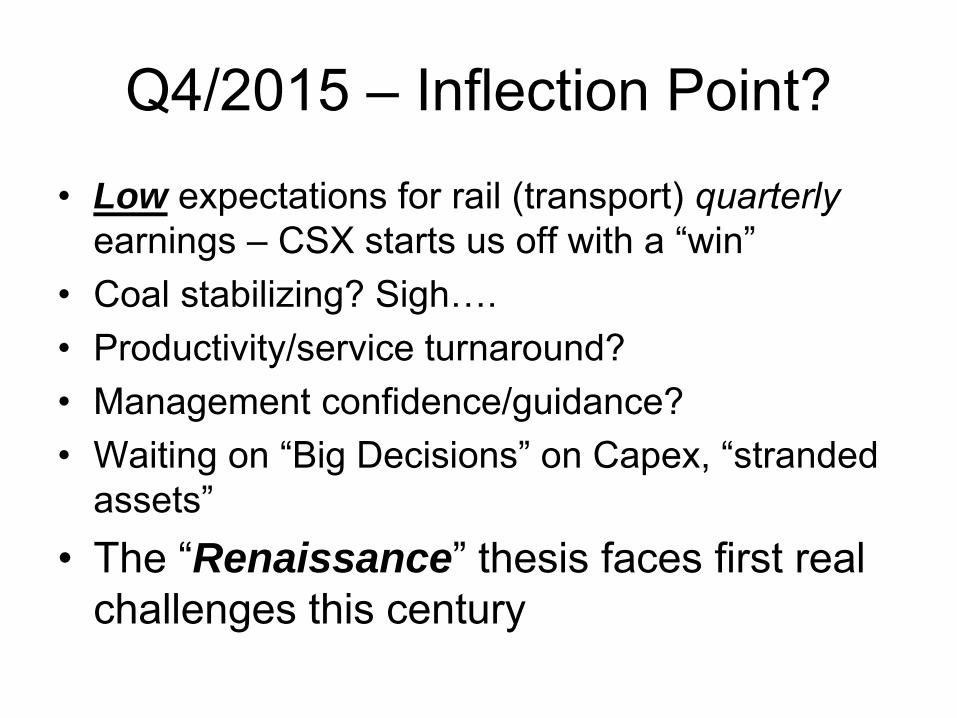
Q4/2015 – Inflection Point?• Low expectations for rail (transport) quarterly
earnings – CSX starts us off with a “win”• Coal stabilizing? Sigh….• Productivity/service turnaround?• Management confidence/guidance?• Waiting on “Big Decisions” on Capex, “stranded
assets”• The “Renaissance” thesis faces first real
challenges this century
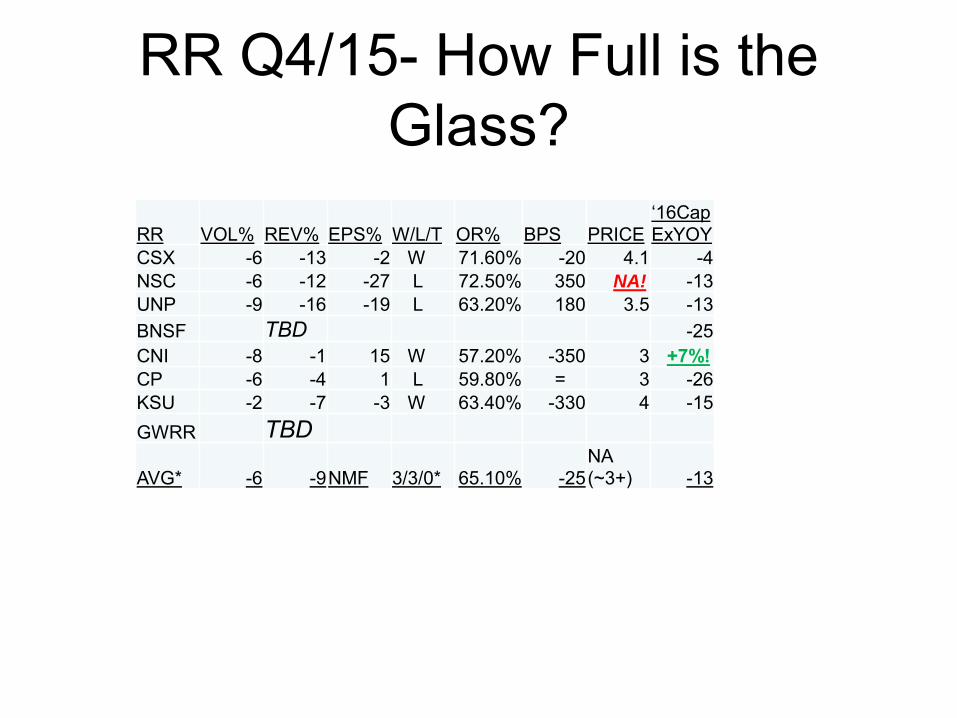
RR Q4/15- How Full is the Glass?
RR VOL% REV% EPS% W/L/T OR% BPS PRICE ‘16CapExYOY
CSX -6 -13 -2 W 71.60% -20 4.1 -4NSC -6 -12 -27 L 72.50% 350 NA! -13UNP -9 -16 -19 L 63.20% 180 3.5 -13BNSF TBD -25CNI -8 -1 15 W 57.20% -350 3 +7%!CP -6 -4 1 L 59.80% = 3 -26KSU -2 -7 -3 W 63.40% -330 4 -15GWRR TBD
AVG* -6 -9NMF 3/3/0* 65.10% -25NA (~3+) -13
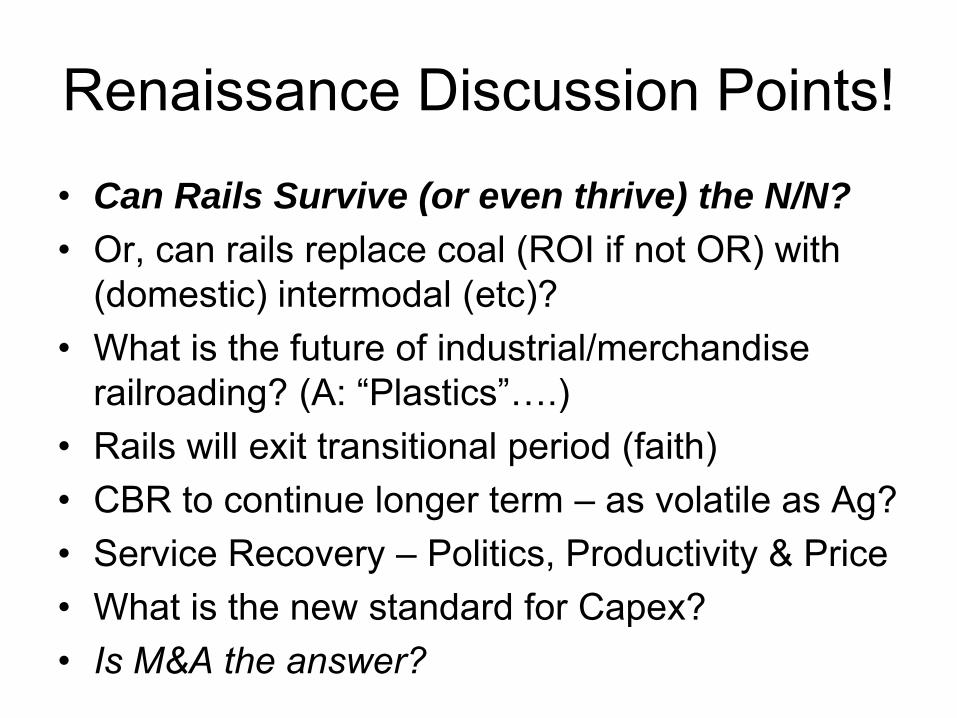
Renaissance Discussion Points!• Can Rails Survive (or even thrive) the N/N?
• Or, can rails replace coal (ROI if not OR) with (domestic) intermodal (etc)?
• What is the future of industrial/merchandise railroading? (A: “Plastics”….)
• Rails will exit transitional period (faith)• CBR to continue longer term – as volatile as Ag?• Service Recovery – Politics, Productivity & Price• What is the new standard for Capex?• Is M&A the answer?
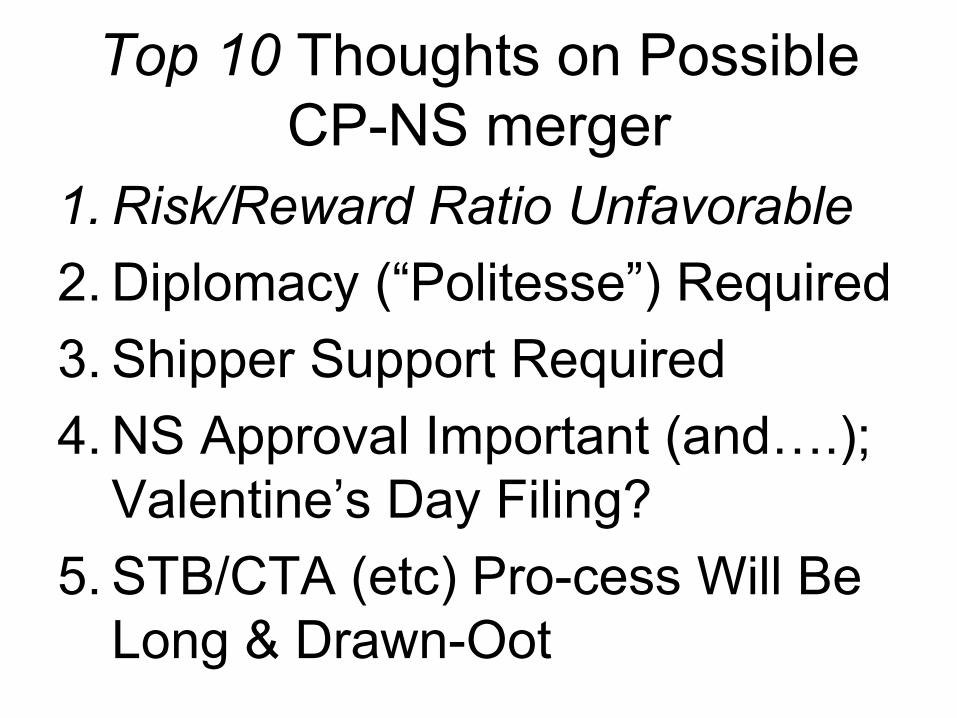
Top 10 Thoughts on Possible CP-NS merger
1. Risk/Reward Ratio Unfavorable2. Diplomacy (“Politesse”) Required3. Shipper Support Required4. NS Approval Important (and….);
Valentine’s Day Filing?5. STB/CTA (etc) Pro-cess Will Be
Long & Drawn-Oot
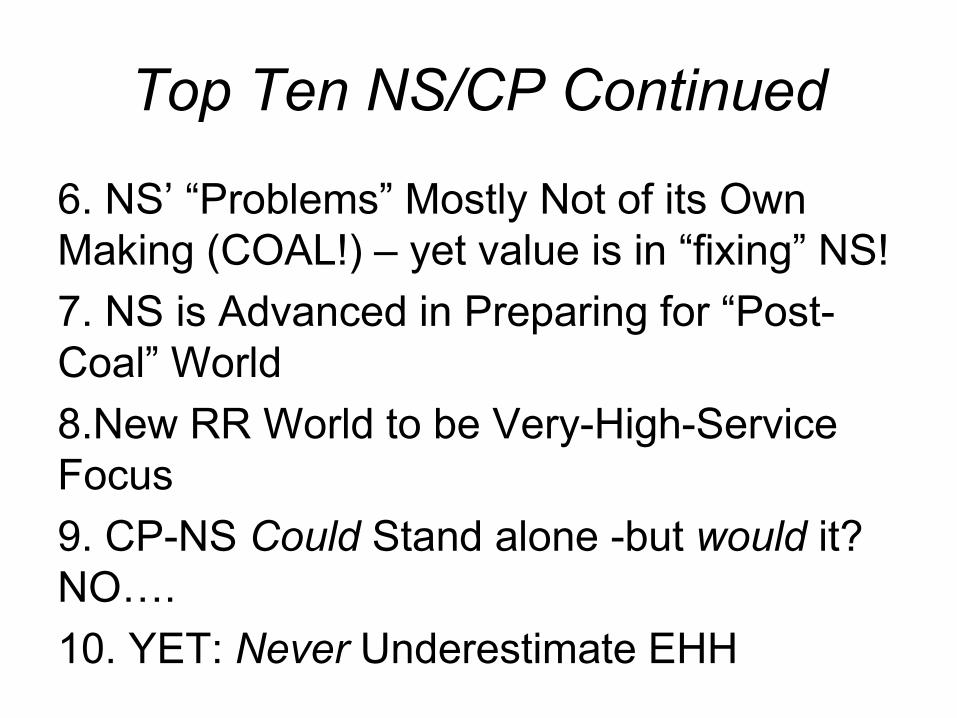
Top Ten NS/CP Continued
6. NS’ “Problems” Mostly Not of its Own Making (COAL!) – yet value is in “fixing” NS!7. NS is Advanced in Preparing for “Post-Coal” World8.New RR World to be Very-High-Service Focus9. CP-NS Could Stand alone -but would it? NO….10. YET: Never Underestimate EHH
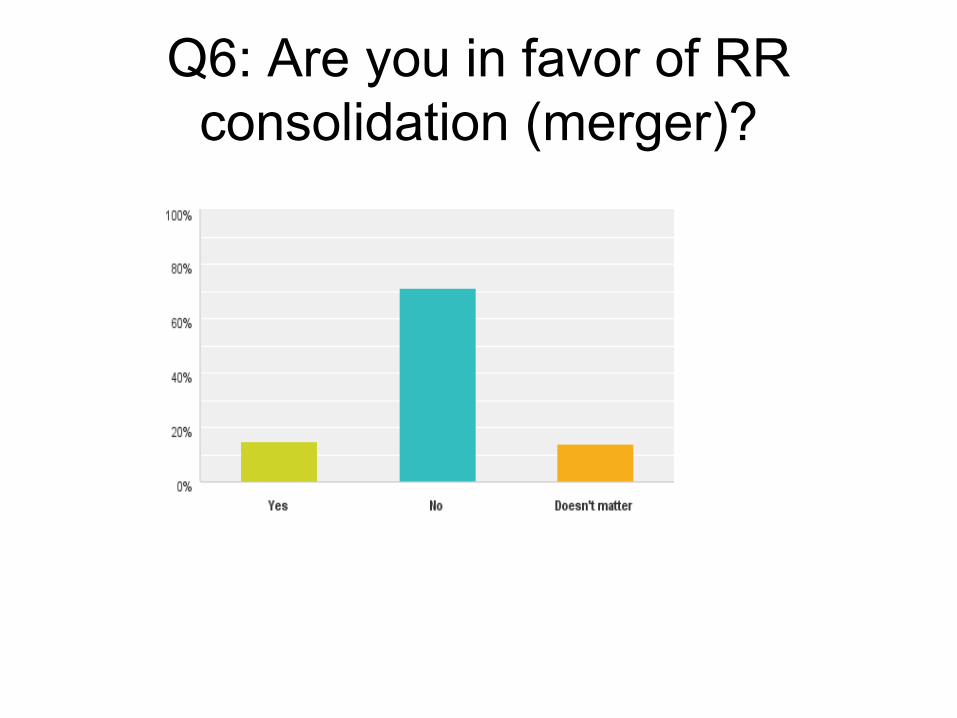
Q6: Are you in favor of RR consolidation (merger)?
(17)
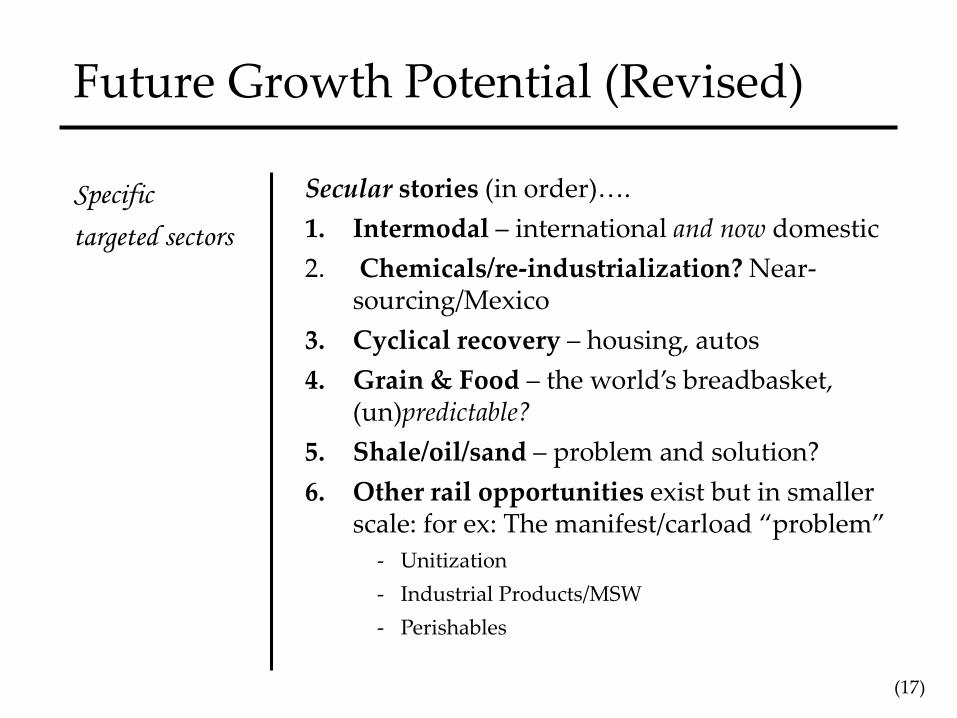
Future Growth Potential (Revised)
Specific
targeted sectors
Secular stories (in order)….
1. Intermodal – international and now domestic
2. Chemicals/re-industrialization? Near-sourcing/Mexico
3. Cyclical recovery – housing, autos
4. Grain & Food – the world’s breadbasket, (un)predictable?
5. Shale/oil/sand – problem and solution?
6. Other rail opportunities exist but in smaller scale: for ex: The manifest/carload “problem”
- Unitization
- Industrial Products/MSW
- Perishables
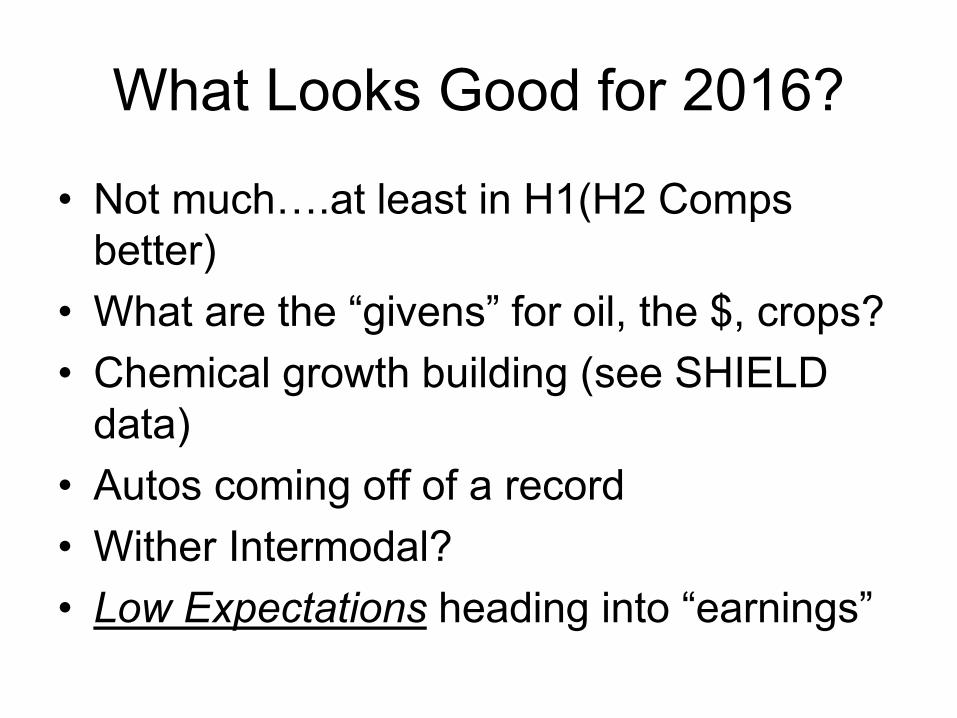
What Looks Good for 2016?
• Not much….at least in H1(H2 Comps better)
• What are the “givens” for oil, the $, crops?• Chemical growth building (see SHIELD
data)• Autos coming off of a record• Wither Intermodal?• Low Expectations heading into “earnings”
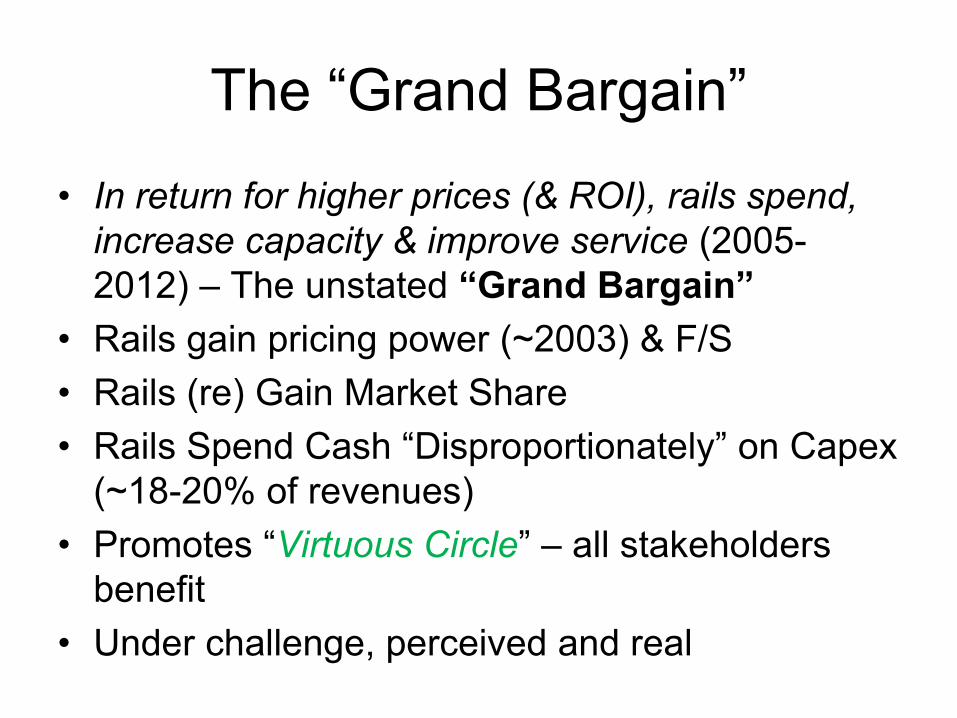
The “Grand Bargain”• In return for higher prices (& ROI), rails spend,
increase capacity & improve service (2005-2012) – The unstated “Grand Bargain”
• Rails gain pricing power (~2003) & F/S• Rails (re) Gain Market Share• Rails Spend Cash “Disproportionately” on Capex
(~18-20% of revenues)• Promotes “Virtuous Circle” – all stakeholders
benefit• Under challenge, perceived and real
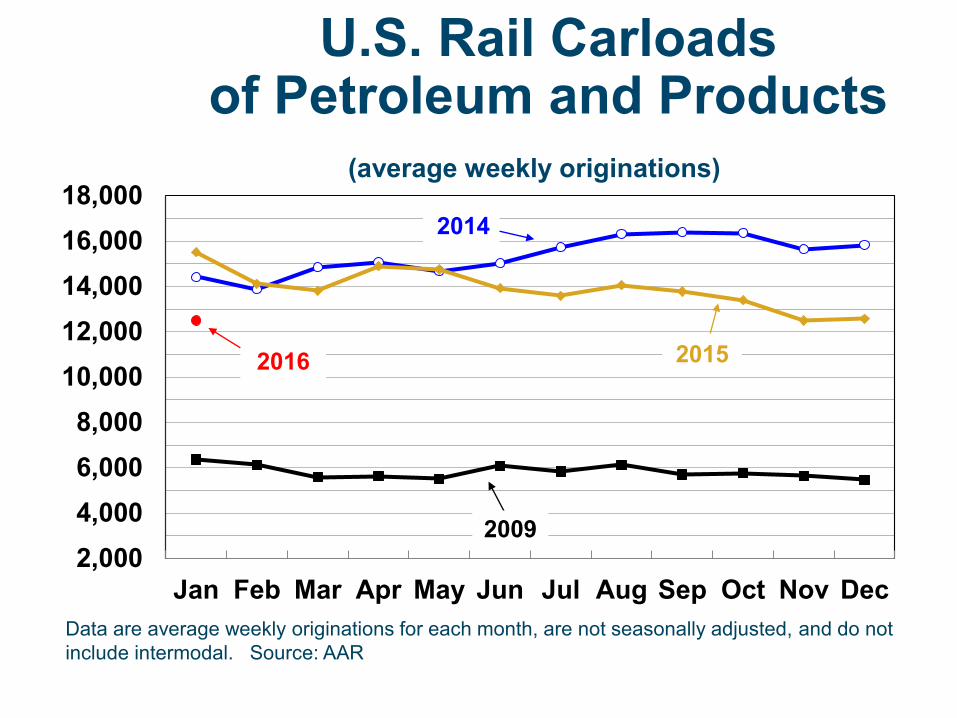
2,0004,0006,0008,000
10,00012,00014,00016,00018,000
Jan Feb Mar Apr May Jun Jul Aug Sep Oct Nov Dec
2009
20152016
2014
ASSOCIATION OF AMERICAN RAILROADSSLIDE 21
(average weekly originations)
U.S. Rail Carloadsof Petroleum and Products
Data are average weekly originations for each month, are not seasonally adjusted, and do not include intermodal. Source: AAR
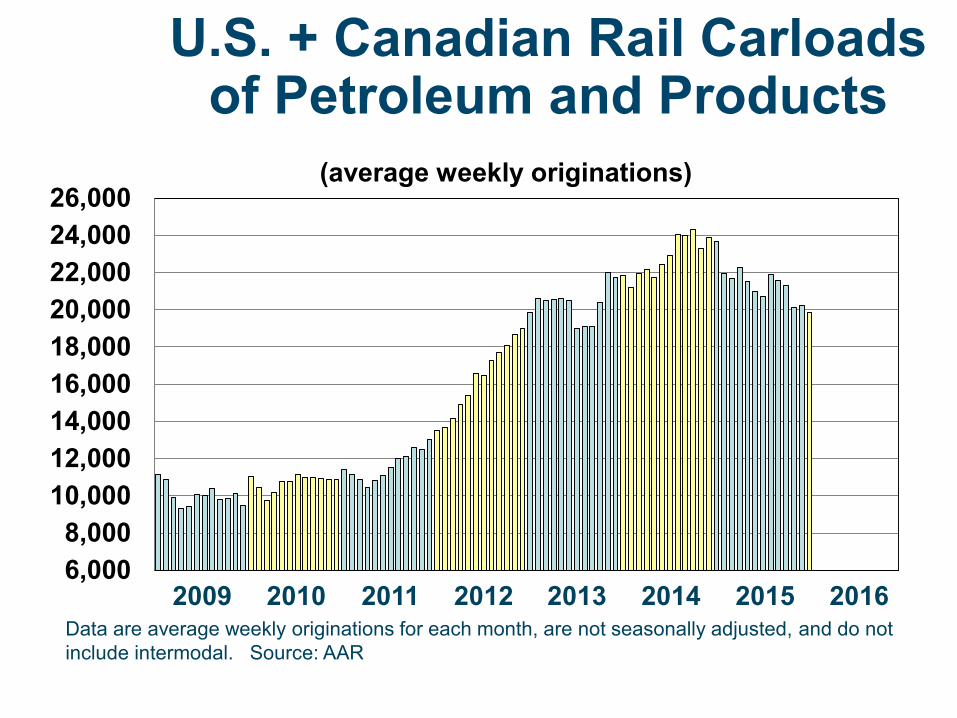
6,0008,000
10,00012,00014,00016,00018,00020,00022,00024,00026,000
(average weekly originations)
ASSOCIATION OF AMERICAN RAILROADSSLIDE 22
U.S. + Canadian Rail Carloadsof Petroleum and Products
2009 2010 2011 2012 2013 2014 2015 2016Data are average weekly originations for each month, are not seasonally adjusted, and do not include intermodal. Source: AAR
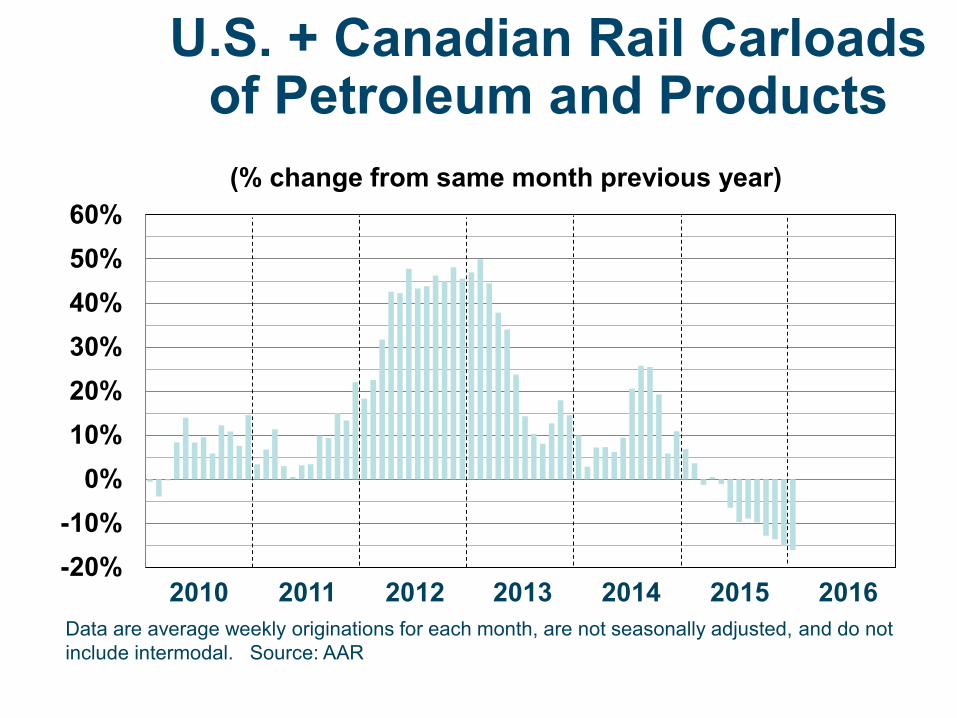
-20%-10%
0%10%20%30%40%50%60%
(% change from same month previous year)
ASSOCIATION OF AMERICAN RAILROADSSLIDE 23
2010 2011 2012 2013 2014 2015 2016
U.S. + Canadian Rail Carloadsof Petroleum and Products
Data are average weekly originations for each month, are not seasonally adjusted, and do not include intermodal. Source: AAR
24Experience / Expertise / Excellence www.plgconsulting.com
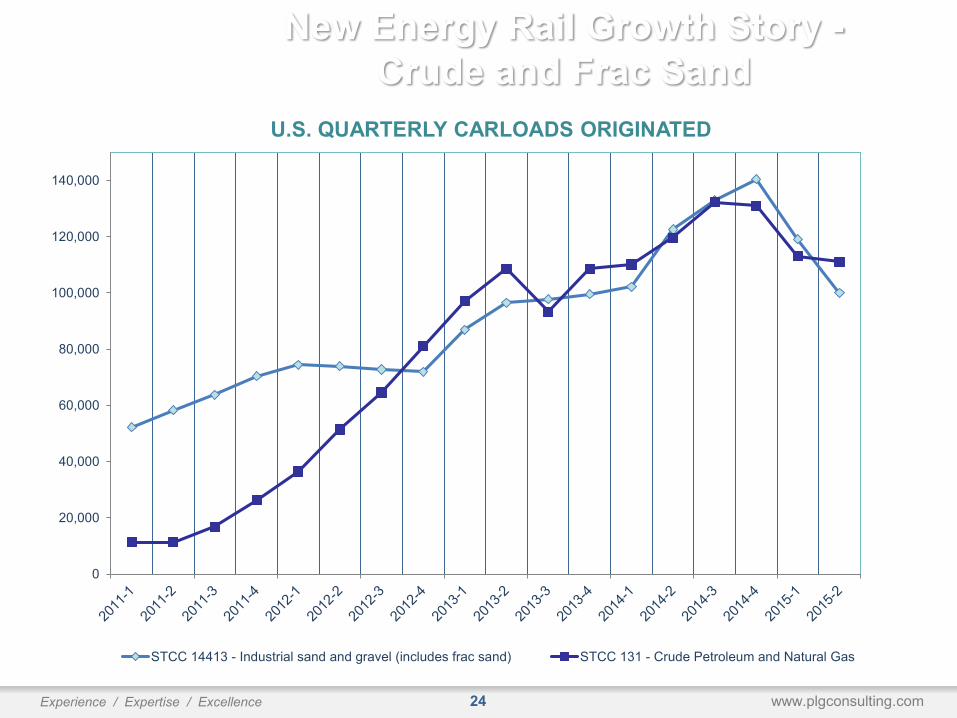
New Energy Rail Growth Story -Crude and Frac Sand
0
20,000
40,000
60,000
80,000
100,000
120,000
140,000
U.S. QUARTERLY CARLOADS ORIGINATED
STCC 14413 - Industrial sand and gravel (includes frac sand) STCC 131 - Crude Petroleum and Natural Gas

26Experience / Expertise / Excellence www.plgconsulting.com
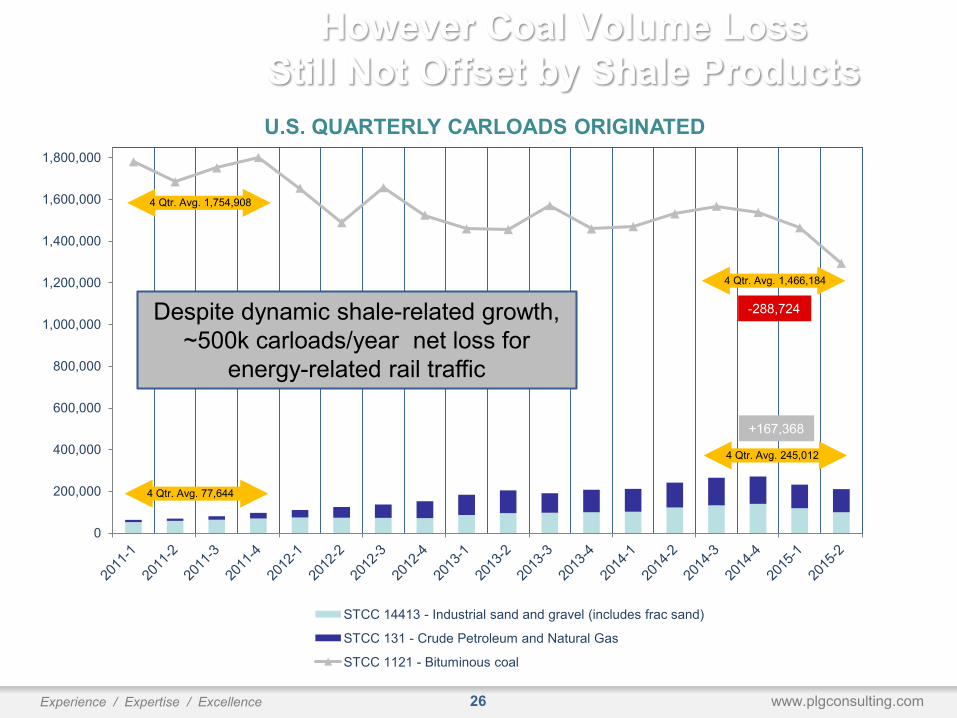
However Coal Volume LossStill Not Offset by Shale Products
0
200,000
400,000
600,000
800,000
1,000,000
1,200,000
1,400,000
1,600,000
1,800,000
U.S. QUARTERLY CARLOADS ORIGINATED
STCC 14413 - Industrial sand and gravel (includes frac sand)
STCC 131 - Crude Petroleum and Natural Gas
STCC 1121 - Bituminous coal
4 Qtr. Avg. 1,754,908
-288,724
+167,368
4 Qtr. Avg. 77,644
4 Qtr. Avg. 1,466,184
4 Qtr. Avg. 245,012
Despite dynamic shale-related growth, ~500k carloads/year net loss for
energy-related rail traffic
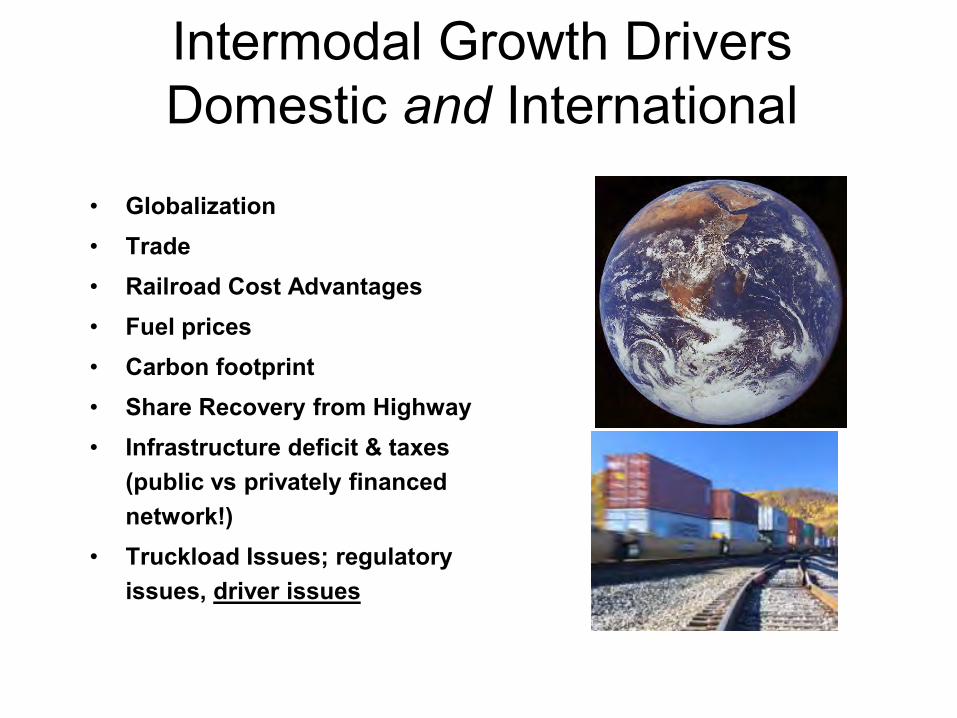
Intermodal Growth DriversDomestic and International
• Globalization• Trade• Railroad Cost Advantages• Fuel prices• Carbon footprint• Share Recovery from Highway• Infrastructure deficit & taxes
(public vs privately financed network!)
• Truckload Issues; regulatory issues, driver issues
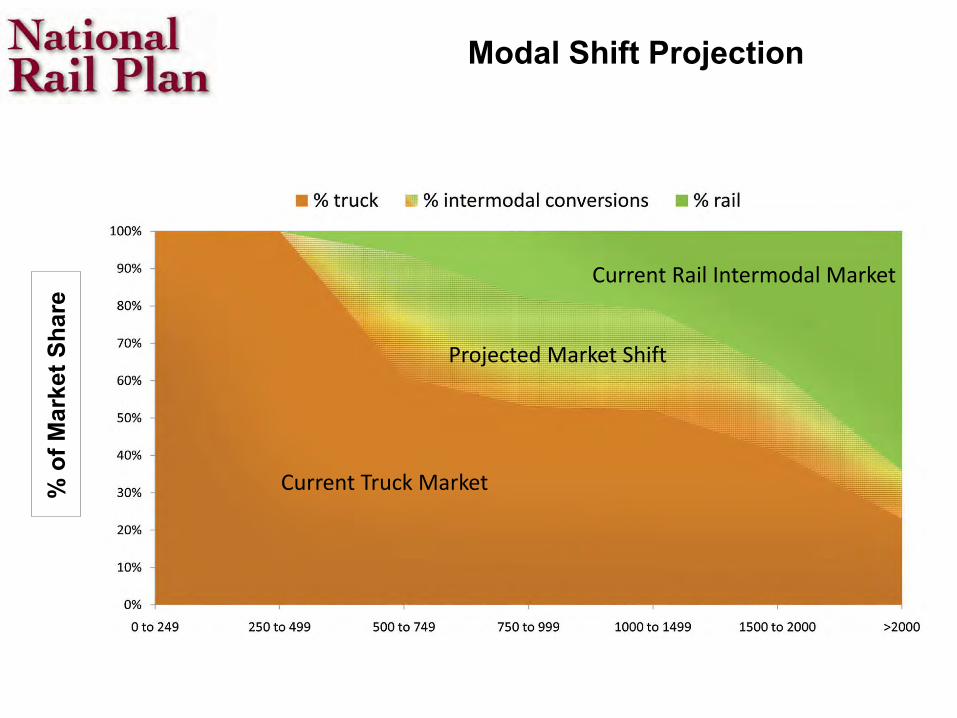
Modal Shift Projection %
of M
arke
t Sha
re
Current Truck Market
Current Rail Intermodal Market
Projected Market Shift
Intermodal 2016+
• Return to Growth?• Rail Service Improvements• Pricing?• Factors: Oil Prices, Consumer Spend,
Truck Capacity• Infrastructure Advantage• Panama Canal impacts?• Driver Shortages Re-emerge?• “Cult of the OR”
Re-industrialization?
• Near-Sourcing: Mexico, C/A• Natural Gas effect round two:
– CHEMICAL INDUSTRY (see PLG)– Fertilizers
• Steel/Aluminum/Autos/White Goods etc.• Northeast, etc. back “in play”?• Subject of future research
31Experience / Expertise / Excellence www.plgconsulting.com
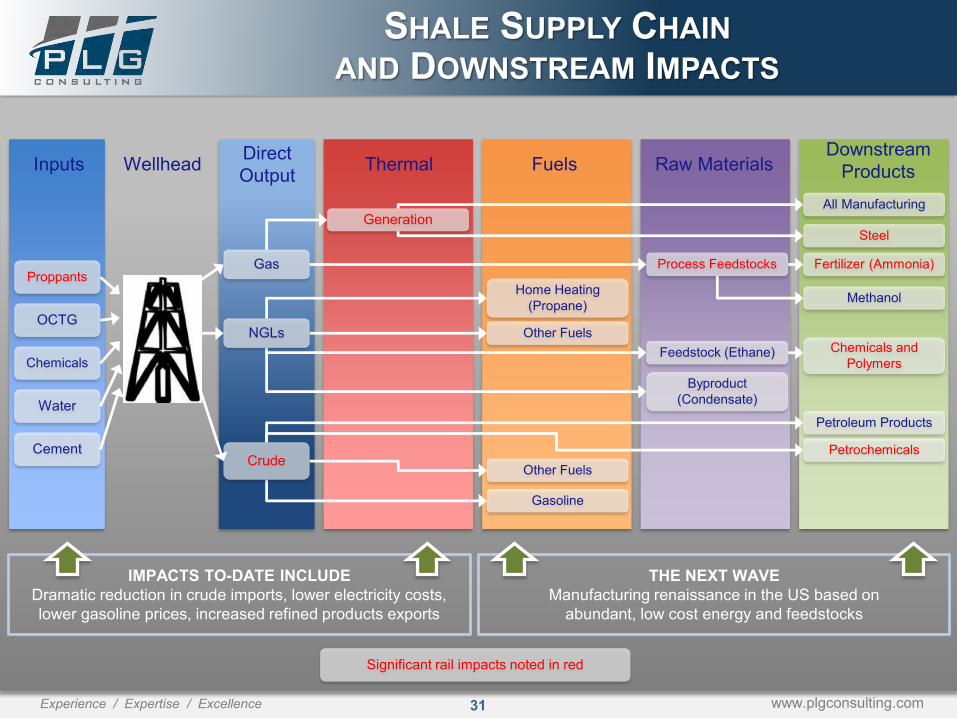
SHALE SUPPLY CHAINAND DOWNSTREAM IMPACTS
Feedstock (Ethane)
Byproduct (Condensate)
Home Heating (Propane)
Other Fuels
Other Fuels
Gasoline
Gas
NGLs
Crude
Proppants
OCTG
Chemicals
Water
Cement
Generation
Process Feedstocks
All Manufacturing
Steel
Fertilizer (Ammonia)
Methanol
Chemicals and Polymers
Petroleum Products
Petrochemicals
Inputs Wellhead Direct Output Thermal Fuels Raw Materials
THE NEXT WAVEManufacturing renaissance in the US based on
abundant, low cost energy and feedstocks
IMPACTS TO-DATE INCLUDEDramatic reduction in crude imports, lower electricity costs, lower gasoline prices, increased refined products exports
Downstream Products
Significant rail impacts noted in red
32Experience / Expertise / Excellence www.plgconsulting.com
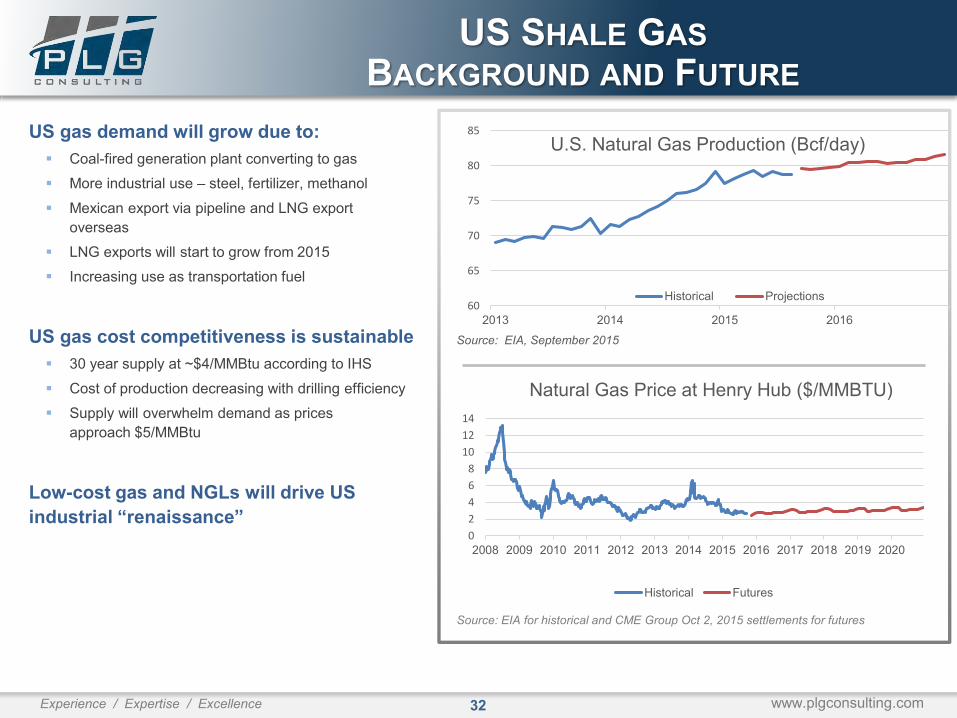
US gas demand will grow due to: Coal-fired generation plant converting to gas More industrial use – steel, fertilizer, methanol Mexican export via pipeline and LNG export
overseas LNG exports will start to grow from 2015 Increasing use as transportation fuel
US gas cost competitiveness is sustainable 30 year supply at ~$4/MMBtu according to IHS Cost of production decreasing with drilling efficiency Supply will overwhelm demand as prices
approach $5/MMBtu
Low-cost gas and NGLs will drive US industrial “renaissance”
Source: EIA, September 2015
Source: EIA for historical and CME Group Oct 2, 2015 settlements for futures
60
65
70
75
80
85
2013 2014 2015 2016
U.S. Natural Gas Production (Bcf/day)
Historical Projections
0
2
4
6
8
10
12
14
2008 2009 2010 2011 2012 2013 2014 2015 2016 2017 2018 2019 2020
Natural Gas Price at Henry Hub ($/MMBTU)
Historical Futures
US SHALE GASBACKGROUND AND FUTURE
33Experience / Expertise / Excellence www.plgconsulting.com
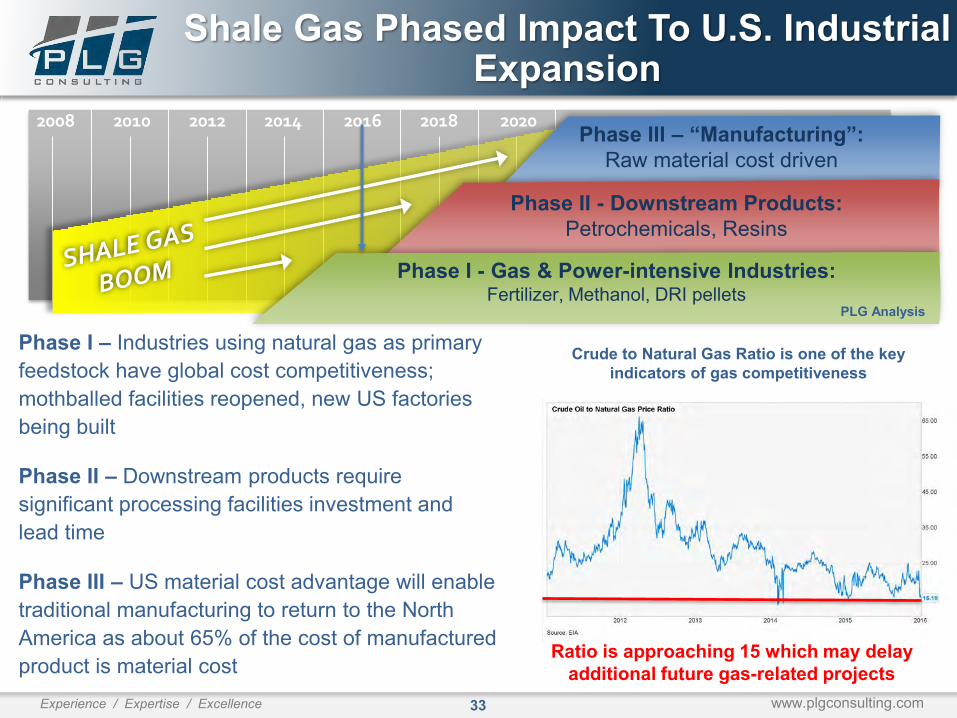
2008 2010 2012 2014 2016 2018 2020 Phase III – “Manufacturing”: Raw material cost driven
Phase I – Industries using natural gas as primary feedstock have global cost competitiveness; mothballed facilities reopened, new US factories being built
Phase II – Downstream products require significant processing facilities investment and lead time
Phase III – US material cost advantage will enable traditional manufacturing to return to the North America as about 65% of the cost of manufactured product is material cost
Phase II - Downstream Products: Petrochemicals, Resins
Phase I - Gas & Power-intensive Industries: Fertilizer, Methanol, DRI pellets
Shale Gas Phased Impact To U.S. Industrial Expansion
PLG Analysis
Ratio is approaching 15 which may delay additional future gas-related projects
Crude to Natural Gas Ratio is one of the key indicators of gas competitiveness
34Experience / Expertise / Excellence www.plgconsulting.com
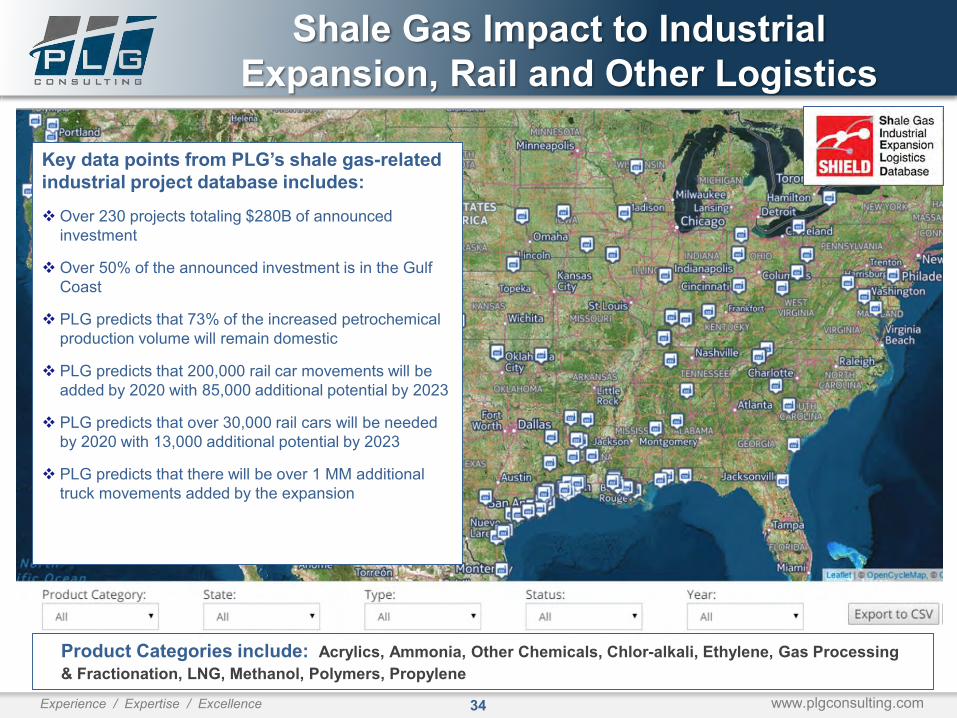
Shale Gas Impact to Industrial Expansion, Rail and Other Logistics
Key data points from PLG’s shale gas-related industrial project database includes: Over 230 projects totaling $280B of announced
investment
Over 50% of the announced investment is in the Gulf Coast
PLG predicts that 73% of the increased petrochemical production volume will remain domestic
PLG predicts that 200,000 rail car movements will be added by 2020 with 85,000 additional potential by 2023
PLG predicts that over 30,000 rail cars will be needed by 2020 with 13,000 additional potential by 2023
PLG predicts that there will be over 1 MM additional truck movements added by the expansion
Product Categories include: Acrylics, Ammonia, Other Chemicals, Chlor-alkali, Ethylene, Gas Processing& Fractionation, LNG, Methanol, Polymers, Propylene
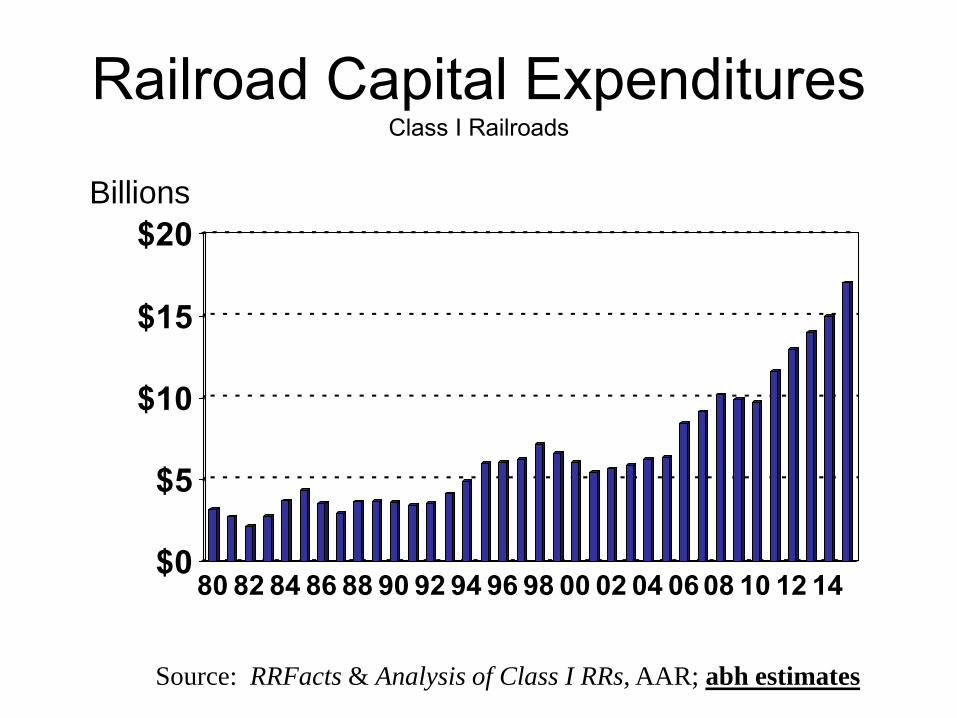
Railroad Capital ExpendituresClass I Railroads
$0
$5
$10
$15
$20
80 82 84 86 88 90 92 94 96 98 00 02 04 06 08 10 12 14
Billions
Source: RRFacts & Analysis of Class I RRs, AAR; abh estimates
ASSOCIATION OF AMERICAN RAILROADS
SLIDE 36
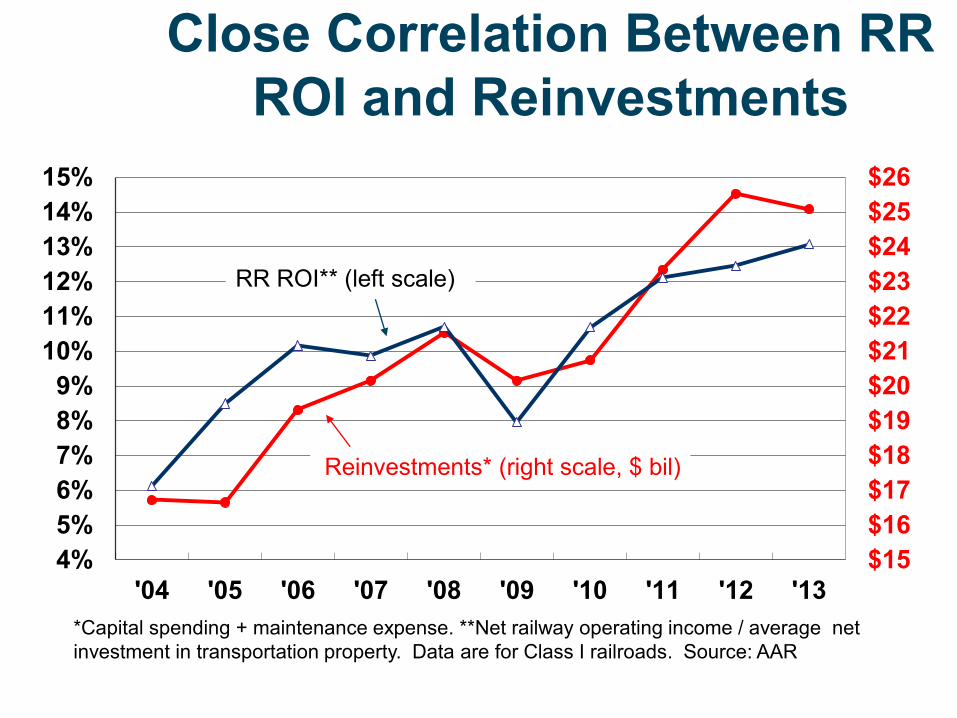
Close Correlation Between RR ROI and Reinvestments
4%5%6%7%8%9%
10%11%12%13%14%15%
'04 '05 '06 '07 '08 '09 '10 '11 '12 '13$15$16$17$18$19$20$21$22$23$24$25$26
Reinvestments* (right scale, $ bil)
*Capital spending + maintenance expense. **Net railway operating income / average net investment in transportation property. Data are for Class I railroads. Source: AAR
RR ROI** (left scale)
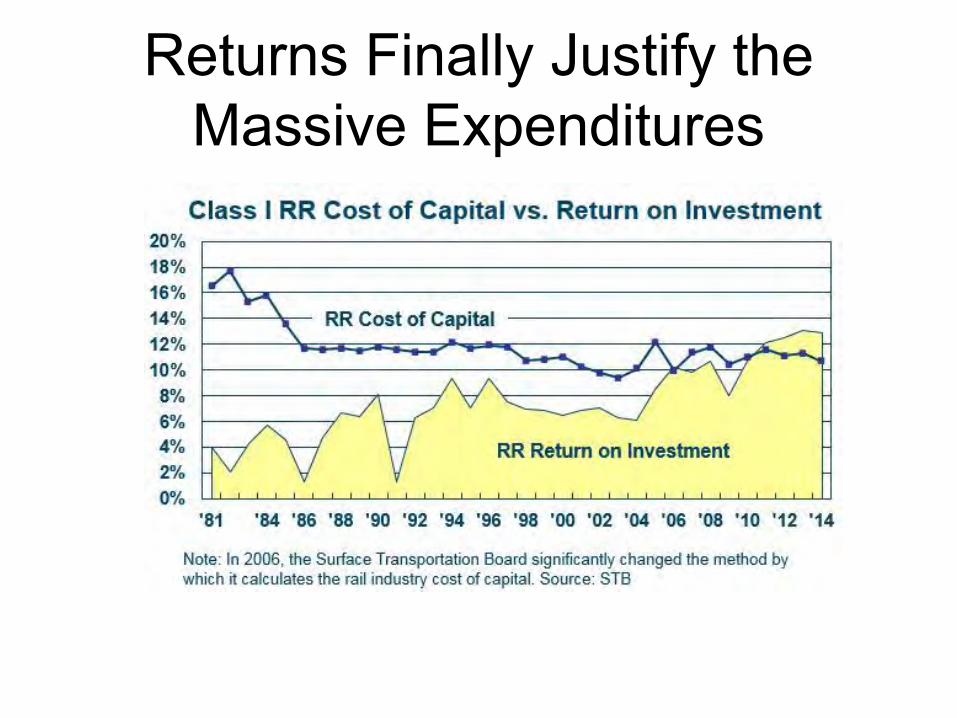
Returns Finally Justify the Massive Expenditures
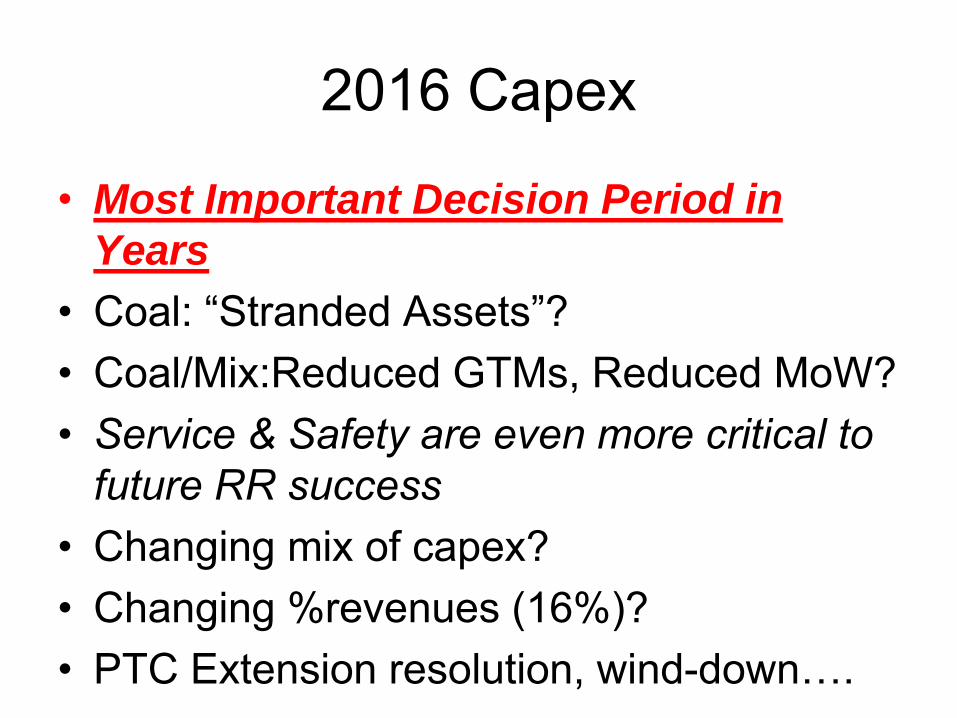
2016 Capex
• Most Important Decision Period in
Years
• Coal: “Stranded Assets”?• Coal/Mix:Reduced GTMs, Reduced MoW?• Service & Safety are even more critical to
future RR success• Changing mix of capex?• Changing %revenues (16%)?• PTC Extension resolution, wind-down….
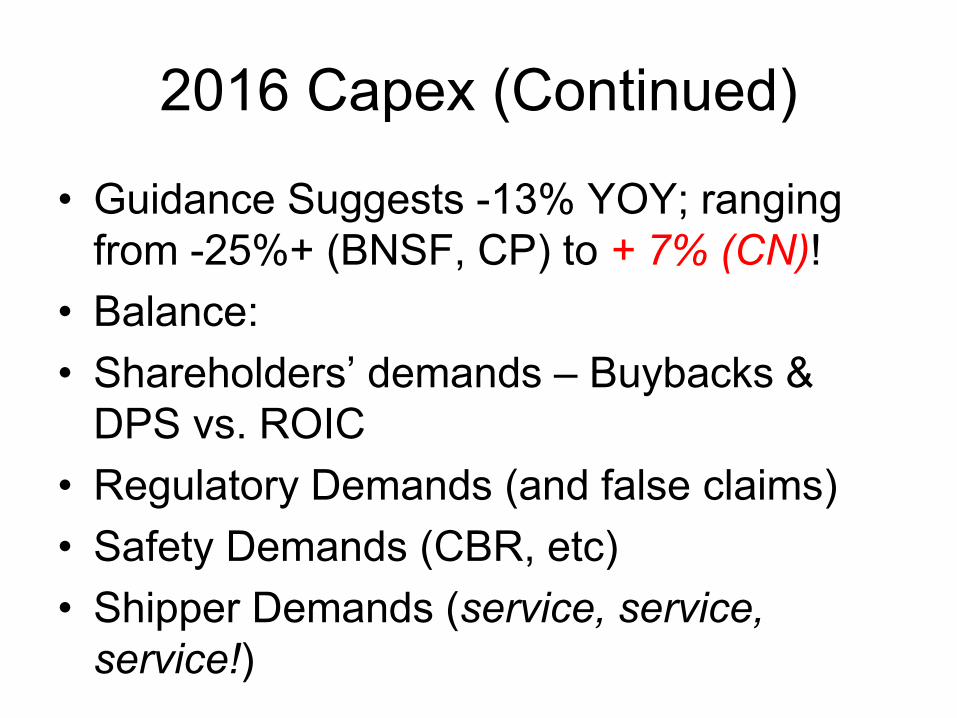
2016 Capex (Continued)
• Guidance Suggests -13% YOY; ranging from -25%+ (BNSF, CP) to + 7% (CN)!
• Balance:• Shareholders’ demands – Buybacks &
DPS vs. ROIC• Regulatory Demands (and false claims)• Safety Demands (CBR, etc)• Shipper Demands (service, service,
service!)
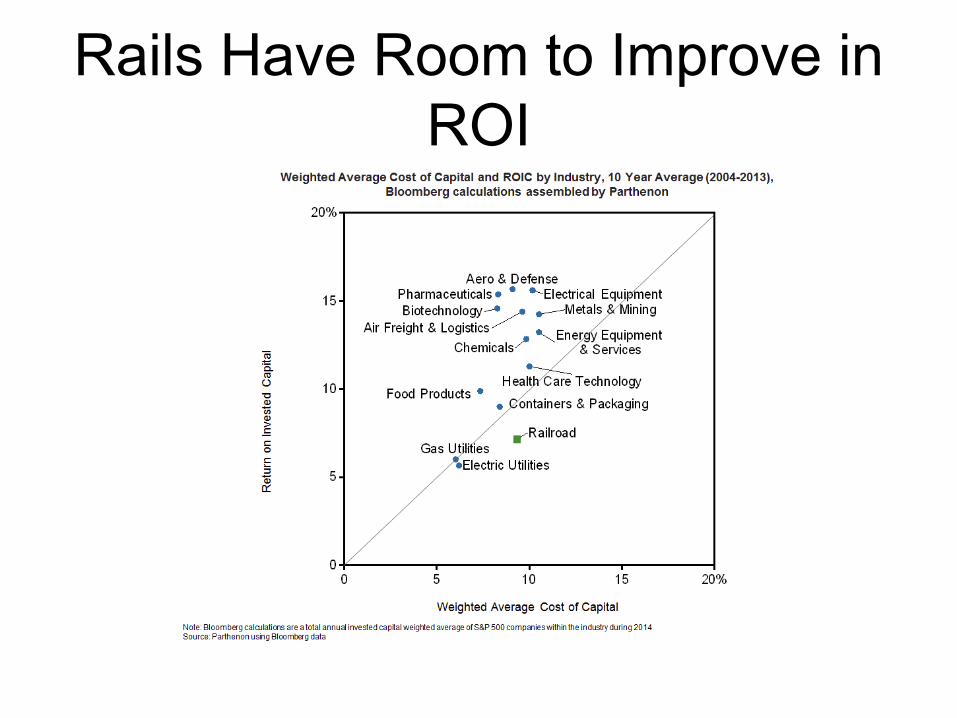
Rails Have Room to Improve in ROI
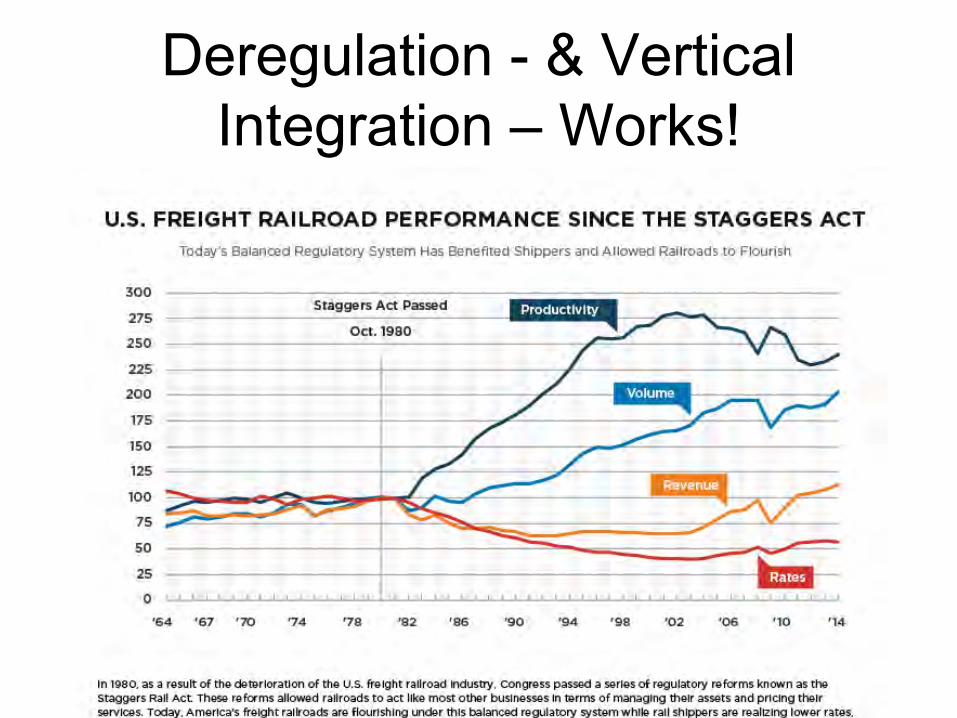
Deregulation - & Vertical Integration – Works!
42Experience / Expertise / Excellence www.plgconsulting.com
ExperienceAbout PLG
Partial Client ListPLG Team Real-world, industry veterans Delivering value to over 200 clients since 2001 Over 30 logistics, supply chain and engineering experts
with operational leadership experience
Core Expertise Bulk commodities Rail transportation and logistics Energy and chemical markets Private equity and corporate development
Services Include: Diagnostic assessments and optimization Supply chain design and operational improvement Logistics infrastructure design Site selection Investment strategy, target identification, due diligence,
post-transactional support Independent logistics technology assessment and
implementation Hazmat training, auditing and risk assessment
43Experience / Expertise / Excellence www.plgconsulting.com
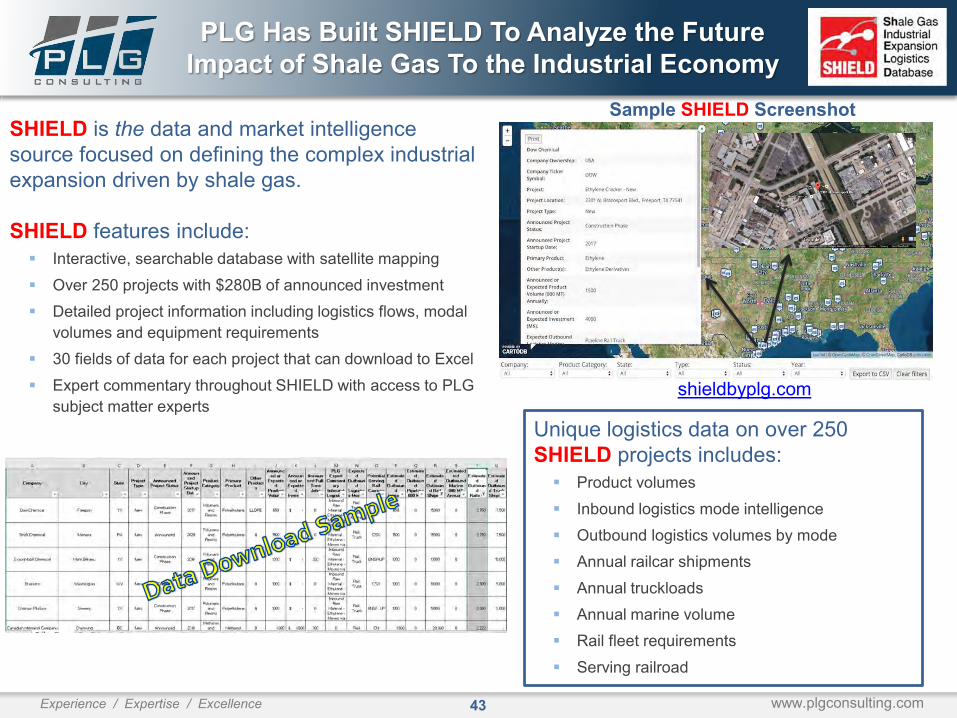
PLG Has Built SHIELD To Analyze the Future Impact of Shale Gas To the Industrial Economy
SHIELD is the data and market intelligence source focused on defining the complex industrial expansion driven by shale gas.
SHIELD features include: Interactive, searchable database with satellite mapping Over 250 projects with $280B of announced investment Detailed project information including logistics flows, modal
volumes and equipment requirements 30 fields of data for each project that can download to Excel Expert commentary throughout SHIELD with access to PLG
subject matter experts
Sample SHIELD Screenshot
Unique logistics data on over 250 SHIELD projects includes: Product volumes Inbound logistics mode intelligence Outbound logistics volumes by mode Annual railcar shipments Annual truckloads Annual marine volume Rail fleet requirements Serving railroad
shieldbyplg.com

www.abhatchconsulting.comABH Consulting/www.abhatchconsulting.com
Anthony B. Hatch155 W. 68th StreetNew York, NY 10023(212) [email protected]
www.railtrends.com
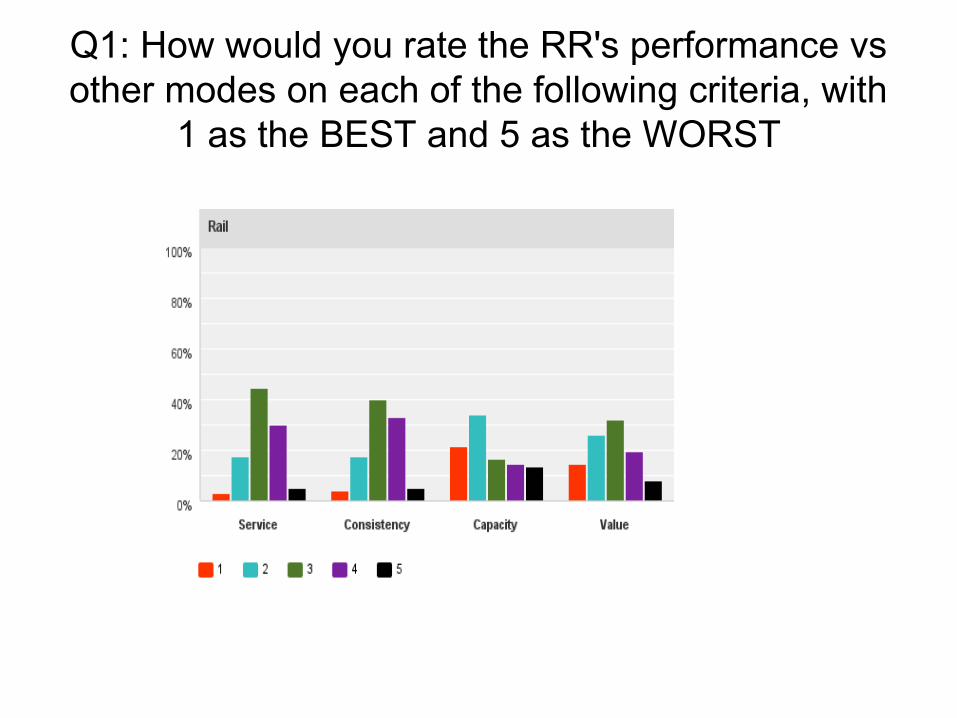
Q1: How would you rate the RR's performance vs other modes on each of the following criteria, with
1 as the BEST and 5 as the WORST
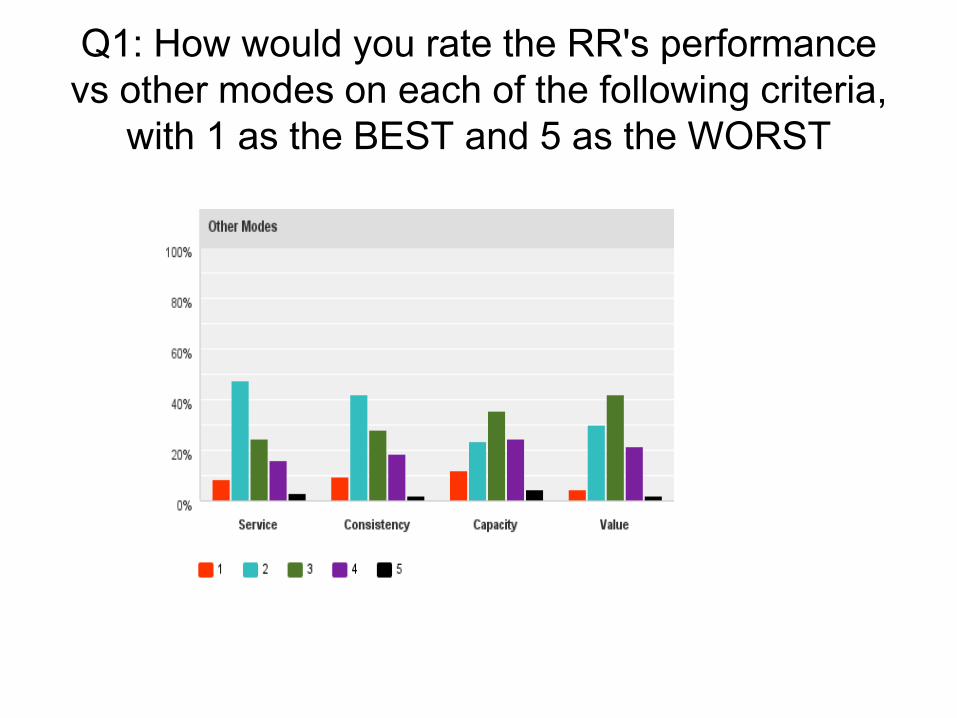
Q1: How would you rate the RR's performance vs other modes on each of the following criteria,
with 1 as the BEST and 5 as the WORST
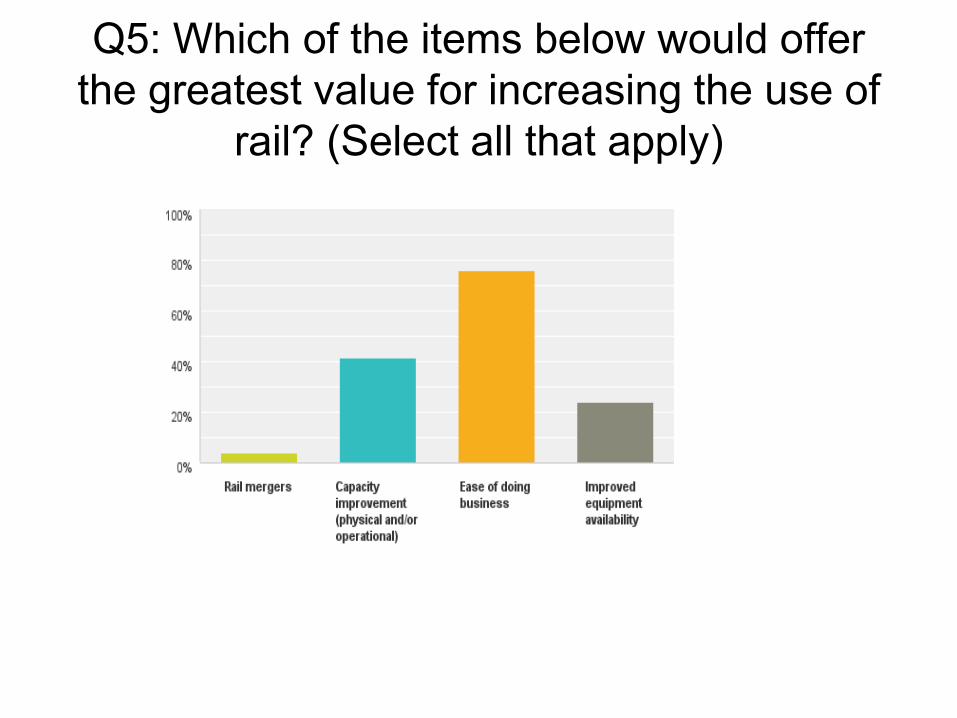
Q5: Which of the items below would offer the greatest value for increasing the use of
rail? (Select all that apply)

Deregulation - & Vertical Integration – Works!
![GET SIMPLY NET Ges.m.b€¦ · GET SIMPLY NET Ges.m.b.H Kurzinfo Seite [1] Was ist Get Simply? GET SIMPLY ist ein europaweiter Online-Marktplatz und führt über die Plattform](https://img.pdfslide.tips/doc/110x75/5ac95dd37f8b9a5d718d6fd1/get-simply-net-gesmb-get-simply-net-gesmbh-kurzinfo-seite-1-was-ist-get.jpg)