Embed Size (px)
Citation preview

ANNUAL REPORT December 31, 2020
Janus Henderson VIT Balanced Portfolio
Janus Aspen Series
HIGHLIGHTS
• Portfolio management perspective • Investment strategy behind your portfolio • Portfolio performance, characteristics
and holdings
Table of Contents
Janus Henderson VIT Balanced Portfolio Management Commentary and Schedule of Investments ............................1 Notes to Schedule of Investments and Other Information........................ 24 Statement of Assets and Liabilities ............................................................................. 26 Statement of Operations ...................................................................................................... 27 Statements of Changes in Net Assets...................................................................... 28 Financial Highlights .................................................................................................................. 29 Notes to Financial Statements ........................................................................................ 30 Report of Independent Registered Public Accounting Firm.................... 40 Additional Information............................................................................................................. 41 Useful Information About Your Portfolio Report ............................................... 47 Designation Requirements.................................................................................................. 50 Trustees and Officers.............................................................................................................. 51
Janus Henderson VIT Balanced Portfolio (unaudited)
Janus Aspen Series 1
PORTFOLIO SNAPSHOT The Portfolio’s dynamic asset allocation strategy has the flexibility to defensively position ahead of market volatility while seeking strong risk-adjusted returns. Unlike many competitor products, where asset allocations are constrained by static targets, the Portfolio’s asset allocations may vary between 35% to 65% equities depending on market conditions.
Jeremiah Buckley co-portfolio manager
Marc Pinto co-portfolio manager
Greg Wilensky
co-portfolio manager Michael Keough
co-portfolio manager
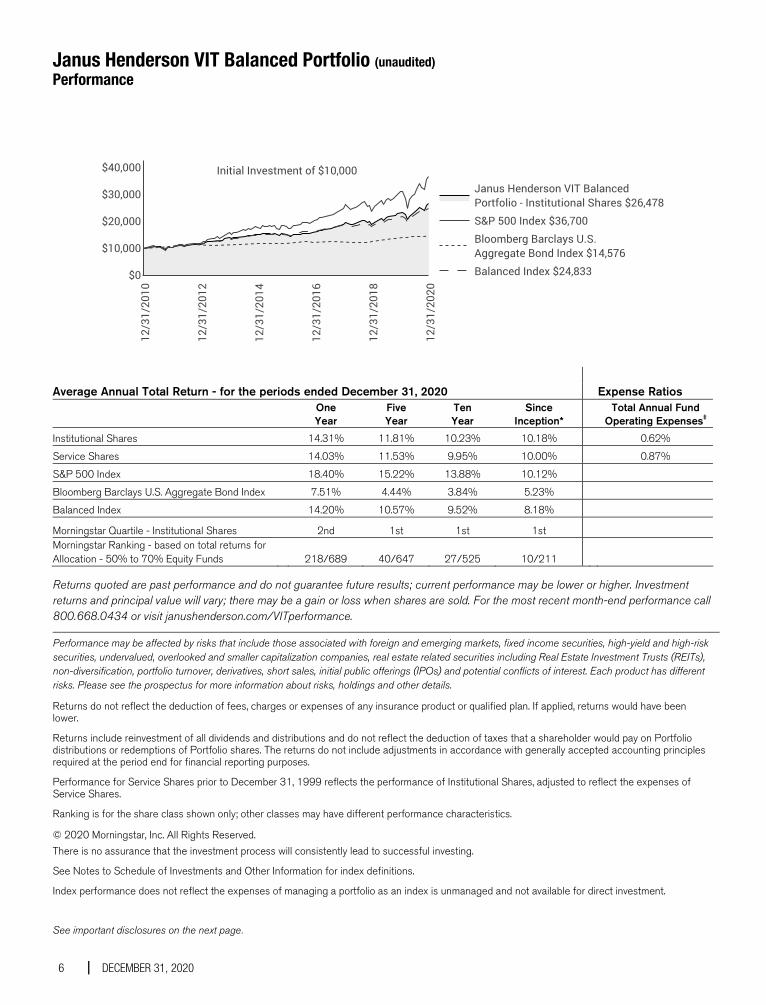
PERFORMANCE OVERVIEW Janus Henderson VIT Balanced Portfolio’s Institutional Shares and Service Shares returned 14.31% and 14.03%, respectively, for the 12-month period ended December 31, 2020, compared with 14.20% for the Balanced Index, an internally calculated benchmark that combines the total returns from the S&P 500® Index (55%) and the Bloomberg Barclays U.S. Aggregate Bond Index (45%). The S&P 500 Index returned 18.40% and the Bloomberg Barclays U.S. Aggregate Bond Index returned 7.51%.
INVESTMENT ENVIRONMENT Market participants faced a benign backdrop at the start of the period, with a relatively strong U.S. economy, low interest rate environment and progress in U.S.-China trade relations. However, in March, the exogenous shock of the COVID-19 coronavirus ushered in a period of severe economic uncertainty. Swift and aggressive central bank and government stimulus measures were put in place to combat economic shutdowns. The stimulus, coupled with faster-than-expected progress in COVID-19 vaccine developments, contributed to an improving economic outlook and helped equity markets recover at a brisk pace. U.S. stocks finished the year with strong gains, but within the S&P 500 Index, performance across sectors varied significantly. Information technology, consumer discretionary and communication services stocks led the index higher. Energy stocks ended the year with sharp losses as they struggled to recover after the price of crude oil futures went negative intra-period. Real estate and financials also generated negative returns.
The bond market ultimately fared well despite a dramatic intra-period sell-off in credit sectors during the COVID-19 correction. Both investment-grade and high-yield bonds finished the period with positive returns, with investment-grade corporates outperforming high yield. Securitized credit generated strong risk-adjusted returns. Rates fell across the yield curve as the Federal Reserve (Fed) cut
policy rates to zero and executed large-scale purchases of U.S. Treasuries. The yield on the 10-year Treasury note ended December at 0.92%, down from 1.92% one year ago.
PERFORMANCE DISCUSSION The Portfolio’s ability to dynamically adjust its allocation with changing market conditions proved beneficial over the period; we reduced equity and credit exposures as risks increased early in the year and then pivoted to a more optimistic stance as stimulus measures were announced and the economic outlook began to improve. The equity allocation dipped as low as 48% in March but ended the period at approximately 63%.
The equity sleeve performed in line with the S&P 500 Index. Sector positioning contributed to relative results. This included a material underweight to energy – the worst-performing benchmark sector – and an overweight to the strong-performing information technology sector.
The pandemic has accelerated the digital transformation of the global economy, and companies at the forefront of that shift saw outsized benefits during the year. Our position in semiconductor company Lam Research was the largest individual contributor to relative performance. Microsoft and Adobe were also strong performers as many companies pivoted to work-from-home environments and demand for their respective products remained robust.
Holdings in the consumer discretionary, industrials and materials sectors weighed on results. Early in the period, we closed positions in our largest equity detractors for the year: Boeing, LyondellBasell and Norwegian Cruise Line, all of which regained some ground as the period progressed.
Aircraft manufacturing company Boeing was the largest equity detractor. The company’s 737 MAX aircraft remained grounded and we became concerned with the level of debt the company had accumulated. Our belief
Janus Henderson VIT Balanced Portfolio (unaudited)
2 DECEMBER 31, 2020
that the global travel and leisure industries will experience long-term reverberations stemming from the COVID-19 crisis also influenced our decision and prompted us to close our position in Norwegian. In terms of chemical producer LyondellBasell, we grew concerned with the company’s ties to oil prices via ethylene – a primary product line – and exited the position.
The fixed income sleeve outperformed the Bloomberg Barclays U.S. Aggregate Bond Index. As the spread of COVID-19 gathered momentum, but before the bulk of the markets’ collapse, we had sought to preserve capital and increase liquidity by lowering our credit allocations and increasing interest rate duration. Coming out of the COVID-19 correction, we began adding back to our credit exposure by purchasing bonds of higher-quality companies that we thought would be better positioned in the event of an extended downturn. As the Fed’s level of commitment to supporting credit markets solidified and the health care industry began aggressive efforts to combat the virus, we became increasingly comfortable adding additional risk, but remained focused on issuers that we felt could navigate sustained economic uncertainty.
Later in the period, continued support from the Fed and the potential for additional fiscal stimulus, coupled with the likelihood that vaccine developments would advance the pace of reopening the U.S. economy in 2021, led us to rotate some of our investment-grade bond exposure to the higher-rated segments of the high-yield corporate market, which had underperformed investment grade earlier in the period. We also established an allocation to Treasury Inflation-Protected Securities (TIPS); while not concerned with an outsized jump in inflation, we do believe the risk of inflation is now skewed to the upside. Many of these positioning shifts were funded by moving further underweight in agency mortgage-backed securities (MBS), which in our view had lower return opportunities relative to other credit markets.
At period end, the fixed income sleeve remained materially overweight corporate and securitized credit including approximately 15% in high-yield corporate bonds, while maintaining an underweight to both Treasuries and MBS. Both our asset allocation decisions and security selection were positive contributors to relative outperformance during the year. No asset class materially detracted from relative performance, although the sleeve’s positioning in certain cyclical sectors such as independent energy weighed on results.
OUTLOOK We are pleased to see that the effectiveness of the COVID-19 vaccine has generally exceeded expectations, and we are optimistic that 2021 will bode well for risk assets, particularly equities, as evidenced by our overweight to the asset class. The economic recovery is in its early stages, and we expect economic growth, corporate earnings growth and employment data to continue to improve in 2021. Consumer and corporate balance sheets generally remain healthy, and although widespread vaccine distribution will take time to achieve, we expect pent-up demand to drive strong spending from consumers, and likely companies, during the latter half of 2021.
The Fed’s commitment to an ultra-accommodative policy paints a positive backdrop for equities. Further, with the U.S. elections mostly behind us, company management teams are gaining clarity in terms of the political and regulatory landscape and are beginning to resume share repurchase programs, which should offer another level of price support to stocks. We are also optimistic that constructive geopolitical trade negotiations could provide companies with the confidence to increase capital spending. In the equity sleeve, we remain focused on high-quality growth companies with strong balance sheets and attractive opportunities for future capital deployment. The sleeve remains positioned with considerable exposure to secular trends that continue to gain momentum, including cloud services, Software as a Service and health care innovation.
In the fixed income sleeve, we maintain a positive outlook for credit markets. With government bond yields near historic lows across the developed world, we expect areas that still offer yield to remain in demand. But it is important to acknowledge the relatively less attractive valuations across U.S. Treasuries at year-end and that much of the recovery is already priced into the highest-quality corporate bonds. In our view, it is the more credit sensitive parts of the market, including the lowest tier of investment grade as well as high yield, that still provide opportunities for active managers to identify attractive risk-adjusted securities. We expect front-end Treasury yields to remain anchored in 2021 as a result of the Fed’s commitment to ensuring a sustained economic recovery through accommodative monetary policy. But we remain mindful that the risk is more skewed to higher interest rates across the intermediate and long end of the yield curve, driven by the economic recovery and higher inflation expectations.

Janus Henderson VIT Balanced Portfolio (unaudited)
Janus Aspen Series 3
As always, we will dynamically adjust each sleeve of the Portfolio, as well as the Portfolio’s overall asset allocation, based on market conditions and the investment opportunities our equity and fixed income teams identify through their bottom-up, fundamental research.
Thank you for your investment in Janus Henderson VIT Balanced Portfolio.
Janus Henderson VIT Balanced Portfolio (unaudited) Portfolio At A Glance December 31, 2020
4 DECEMBER 31, 2020
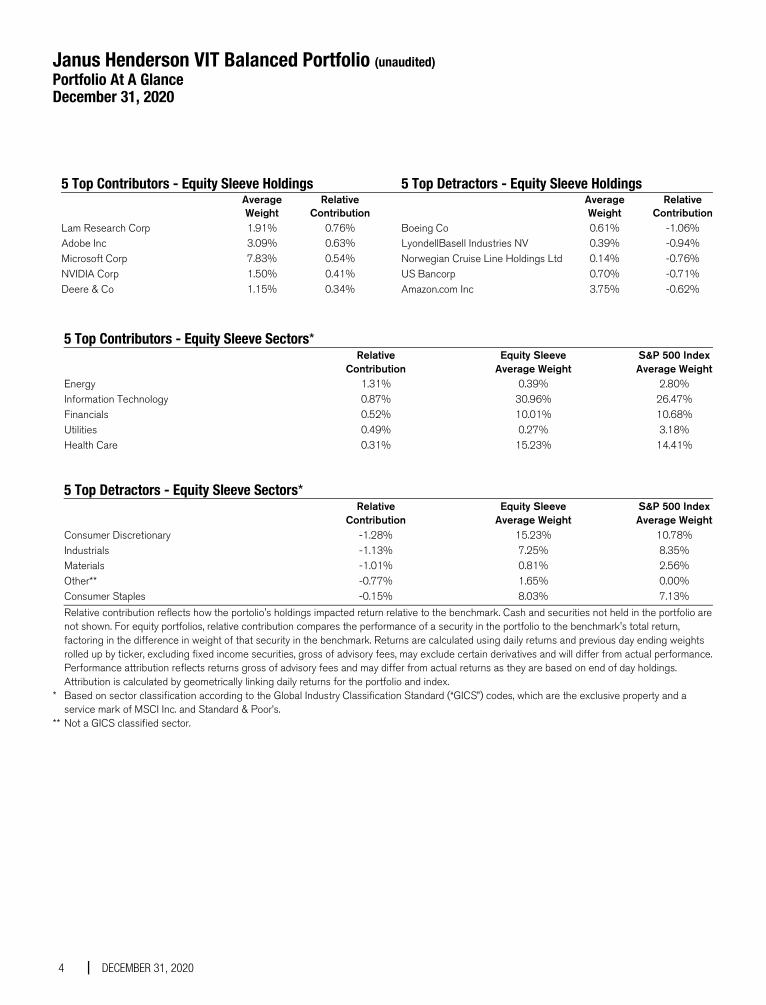
5 Top Contributors - Equity Sleeve Holdings 5 Top Detractors - Equity Sleeve Holdings
Average Weight
Relative Contribution
Average Weight
Relative Contribution
Lam Research Corp 1.91% 0.76% Boeing Co 0.61% -1.06% Adobe Inc 3.09% 0.63% LyondellBasell Industries NV 0.39% -0.94% Microsoft Corp 7.83% 0.54% Norwegian Cruise Line Holdings Ltd 0.14% -0.76% NVIDIA Corp 1.50% 0.41% US Bancorp 0.70% -0.71% Deere & Co 1.15% 0.34% Amazon.com Inc 3.75% -0.62%
5 Top Contributors - Equity Sleeve Sectors* Relative Equity Sleeve S&P 500 Index Contribution Average Weight Average Weight Energy 1.31% 0.39% 2.80% Information Technology 0.87% 30.96% 26.47% Financials 0.52% 10.01% 10.68% Utilities 0.49% 0.27% 3.18% Health Care 0.31% 15.23% 14.41%
5 Top Detractors - Equity Sleeve Sectors* Relative Equity Sleeve S&P 500 Index Contribution Average Weight Average Weight Consumer Discretionary -1.28% 15.23% 10.78% Industrials -1.13% 7.25% 8.35% Materials -1.01% 0.81% 2.56% Other** -0.77% 1.65% 0.00% Consumer Staples -0.15% 8.03% 7.13%
Relative contribution reflects how the portolio's holdings impacted return relative to the benchmark. Cash and securities not held in the portfolio are not shown. For equity portfolios, relative contribution compares the performance of a security in the portfolio to the benchmark's total return, factoring in the difference in weight of that security in the benchmark. Returns are calculated using daily returns and previous day ending weights rolled up by ticker, excluding fixed income securities, gross of advisory fees, may exclude certain derivatives and will differ from actual performance. Performance attribution reflects returns gross of advisory fees and may differ from actual returns as they are based on end of day holdings. Attribution is calculated by geometrically linking daily returns for the portfolio and index.
* Based on sector classification according to the Global Industry Classification Standard (“GICS”) codes, which are the exclusive property and a service mark of MSCI Inc. and Standard & Poor’s.
** Not a GICS classified sector.
Janus Henderson VIT Balanced Portfolio (unaudited) Portfolio At A Glance December 31, 2020
Janus Aspen Series 5
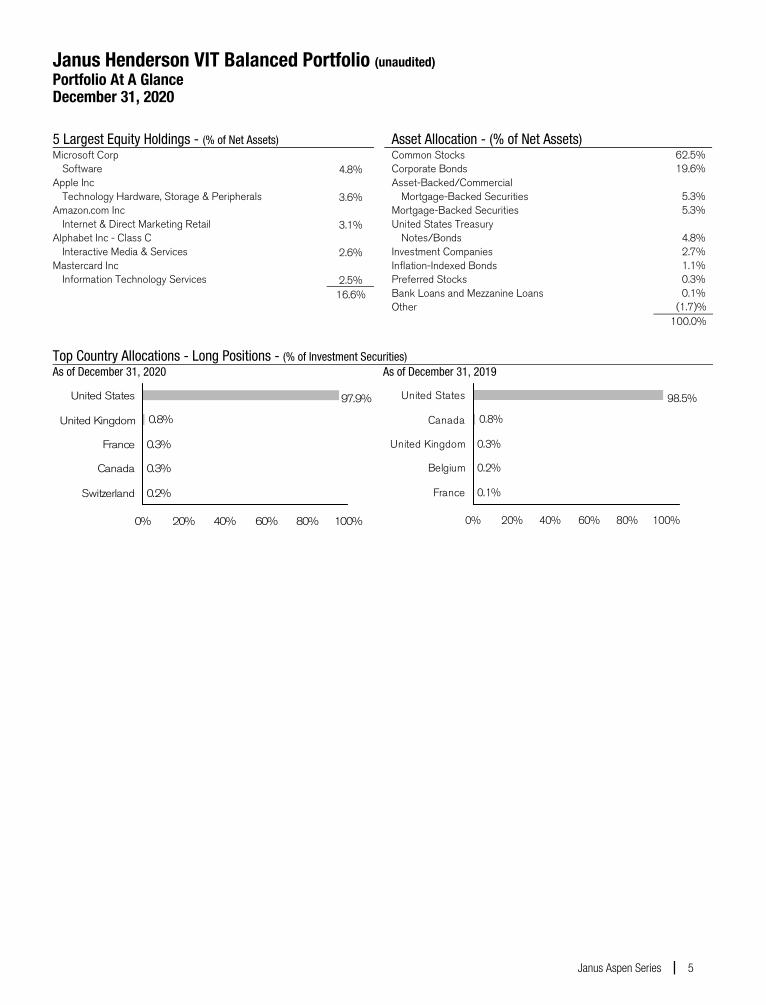
5 Largest Equity Holdings - (% of Net Assets) Microsoft Corp
Software 4.8% Apple Inc
Technology Hardware, Storage & Peripherals 3.6% Amazon.com Inc
Internet & Direct Marketing Retail 3.1% Alphabet Inc - Class C
Interactive Media & Services 2.6% Mastercard Inc
Information Technology Services 2.5% 16.6%
Asset Allocation - (% of Net Assets) Common Stocks 62.5% Corporate Bonds 19.6% Asset-Backed/Commercial
Mortgage-Backed Securities
5.3% Mortgage-Backed Securities 5.3% United States Treasury
Notes/Bonds
4.8% Investment Companies 2.7% Inflation-Indexed Bonds 1.1% Preferred Stocks 0.3% Bank Loans and Mezzanine Loans 0.1% Other (1.7)% 100.0%
Top Country Allocations - Long Positions - (% of Investment Securities) As of December 31, 2020
0.8%
0.3%
0.3%
0.2%
97.9%
0% 20% 40% 60% 80% 100%
United States
United Kingdom
France
Canada
Switzerland
As of December 31, 2019
0.8%
0.3%
0.2%
0.1%
98.5%
0% 20% 40% 60% 80% 100%
United States
Canada
United Kingdom
Belgium
France
Janus Henderson VIT Balanced Portfolio (unaudited) Performance
6 DECEMBER 31, 2020
Average Annual Total Return - for the periods ended December 31, 2020 Expense Ratios
One Year
Five Year
Ten Year
Since Inception*
Total Annual Fund Operating Expenses‡
Institutional Shares 14.31% 11.81% 10.23% 10.18% 0.62%
Service Shares 14.03% 11.53% 9.95% 10.00% 0.87%
S&P 500 Index 18.40% 15.22% 13.88% 10.12%
Bloomberg Barclays U.S. Aggregate Bond Index 7.51% 4.44% 3.84% 5.23%
Balanced Index 14.20% 10.57% 9.52% 8.18%
Morningstar Quartile - Institutional Shares 2nd 1st 1st 1st Morningstar Ranking - based on total returns for Allocation - 50% to 70% Equity Funds 218/689 40/647 27/525 10/211
Returns quoted are past performance and do not guarantee future results; current performance may be lower or higher. Investment returns and principal value will vary; there may be a gain or loss when shares are sold. For the most recent month-end performance call 800.668.0434 or visit janushenderson.com/VITperformance.
Performance may be affected by risks that include those associated with foreign and emerging markets, fixed income securities, high-yield and high-risk securities, undervalued, overlooked and smaller capitalization companies, real estate related securities including Real Estate Investment Trusts (REITs), non-diversification, portfolio turnover, derivatives, short sales, initial public offerings (IPOs) and potential conflicts of interest. Each product has different risks. Please see the prospectus for more information about risks, holdings and other details. Returns do not reflect the deduction of fees, charges or expenses of any insurance product or qualified plan. If applied, returns would have been lower.
Returns include reinvestment of all dividends and distributions and do not reflect the deduction of taxes that a shareholder would pay on Portfolio distributions or redemptions of Portfolio shares. The returns do not include adjustments in accordance with generally accepted accounting principles required at the period end for financial reporting purposes.
Performance for Service Shares prior to December 31, 1999 reflects the performance of Institutional Shares, adjusted to reflect the expenses of Service Shares.
Ranking is for the share class shown only; other classes may have different performance characteristics.
© 2020 Morningstar, Inc. All Rights Reserved. There is no assurance that the investment process will consistently lead to successful investing.
See Notes to Schedule of Investments and Other Information for index definitions.
Index performance does not reflect the expenses of managing a portfolio as an index is unmanaged and not available for direct investment.
See important disclosures on the next page.

Janus Henderson VIT Balanced Portfolio (unaudited) Performance
Janus Aspen Series 7
See “Useful Information About Your Portfolio Report.”
Effective February 1, 2020, Jeremiah Buckley, Michael Keough, Marc Pinto and Greg Wilensky are Co-Portfolio Managers of the Portfolio.
Portfolio Manager Marc Pinto has announced his retirement effective April 2, 2021.
*The Portfolio’s inception date – September 13, 1993
‡ As stated in the prospectus. See Financial Highlights for actual expense ratios during the reporting period.
Janus Henderson VIT Balanced Portfolio (unaudited) Expense Examples
8 DECEMBER 31, 2020
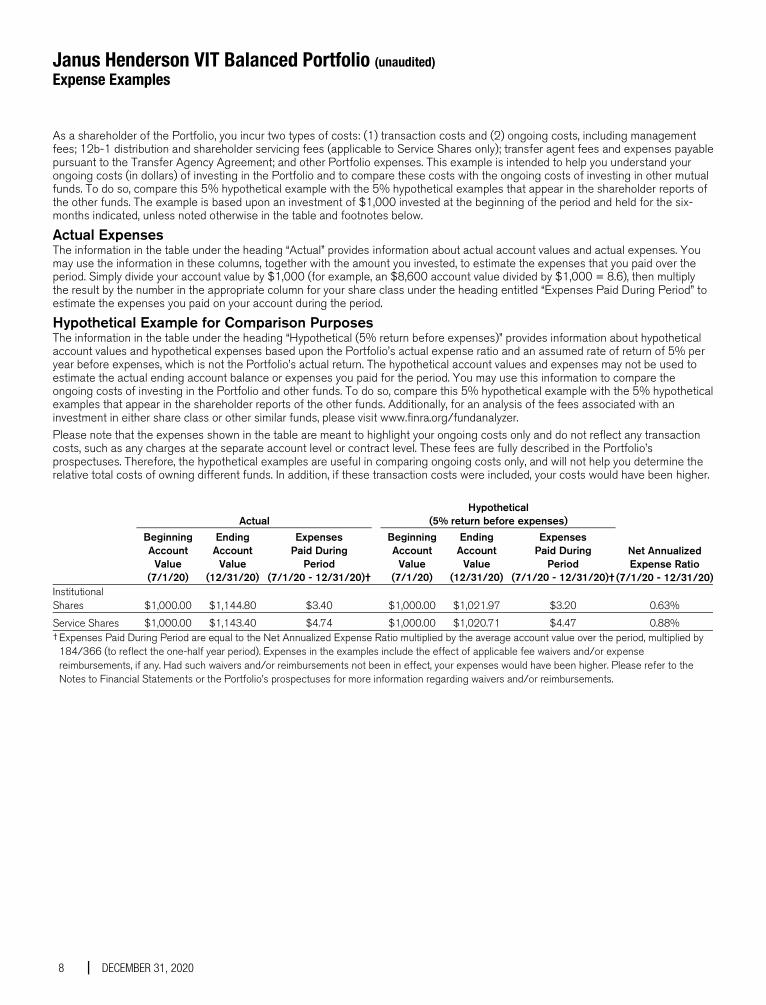
As a shareholder of the Portfolio, you incur two types of costs: (1) transaction costs and (2) ongoing costs, including management fees; 12b-1 distribution and shareholder servicing fees (applicable to Service Shares only); transfer agent fees and expenses payable pursuant to the Transfer Agency Agreement; and other Portfolio expenses. This example is intended to help you understand your ongoing costs (in dollars) of investing in the Portfolio and to compare these costs with the ongoing costs of investing in other mutual funds. To do so, compare this 5% hypothetical example with the 5% hypothetical examples that appear in the shareholder reports of the other funds. The example is based upon an investment of $1,000 invested at the beginning of the period and held for the six-months indicated, unless noted otherwise in the table and footnotes below.
Actual Expenses The information in the table under the heading “Actual” provides information about actual account values and actual expenses. You may use the information in these columns, together with the amount you invested, to estimate the expenses that you paid over the period. Simply divide your account value by $1,000 (for example, an $8,600 account value divided by $1,000 = 8.6), then multiply the result by the number in the appropriate column for your share class under the heading entitled “Expenses Paid During Period” to estimate the expenses you paid on your account during the period.
Hypothetical Example for Comparison Purposes The information in the table under the heading “Hypothetical (5% return before expenses)” provides information about hypothetical account values and hypothetical expenses based upon the Portfolio’s actual expense ratio and an assumed rate of return of 5% per year before expenses, which is not the Portfolio’s actual return. The hypothetical account values and expenses may not be used to estimate the actual ending account balance or expenses you paid for the period. You may use this information to compare the ongoing costs of investing in the Portfolio and other funds. To do so, compare this 5% hypothetical example with the 5% hypothetical examples that appear in the shareholder reports of the other funds. Additionally, for an analysis of the fees associated with an investment in either share class or other similar funds, please visit www.finra.org/fundanalyzer. Please note that the expenses shown in the table are meant to highlight your ongoing costs only and do not reflect any transaction costs, such as any charges at the separate account level or contract level. These fees are fully described in the Portfolio’s prospectuses. Therefore, the hypothetical examples are useful in comparing ongoing costs only, and will not help you determine the relative total costs of owning different funds. In addition, if these transaction costs were included, your costs would have been higher.
Actual Hypothetical
(5% return before expenses)
Beginning Account
Value (7/1/20)
Ending Account
Value (12/31/20)
Expenses Paid During
Period (7/1/20 - 12/31/20)†
BeginningAccount
Value (7/1/20)
Ending Account
Value (12/31/20)
Expenses Paid During
Period (7/1/20 - 12/31/20)†
Net Annualized Expense Ratio
(7/1/20 - 12/31/20)Institutional Shares $1,000.00 $1,144.80 $3.40 $1,000.00 $1,021.97 $3.20 0.63%
Service Shares $1,000.00 $1,143.40 $4.74 $1,000.00 $1,020.71 $4.47 0.88% † Expenses Paid During Period are equal to the Net Annualized Expense Ratio multiplied by the average account value over the period, multiplied by
184/366 (to reflect the one-half year period). Expenses in the examples include the effect of applicable fee waivers and/or expense reimbursements, if any. Had such waivers and/or reimbursements not been in effect, your expenses would have been higher. Please refer to the Notes to Financial Statements or the Portfolio’s prospectuses for more information regarding waivers and/or reimbursements.
Janus Henderson VIT Balanced Portfolio Schedule of Investments December 31, 2020
See Notes to Schedule of Investments and Other Information and Notes to Financial Statements.
Janus Aspen Series 9
Shares orPrincipal Amounts
Value
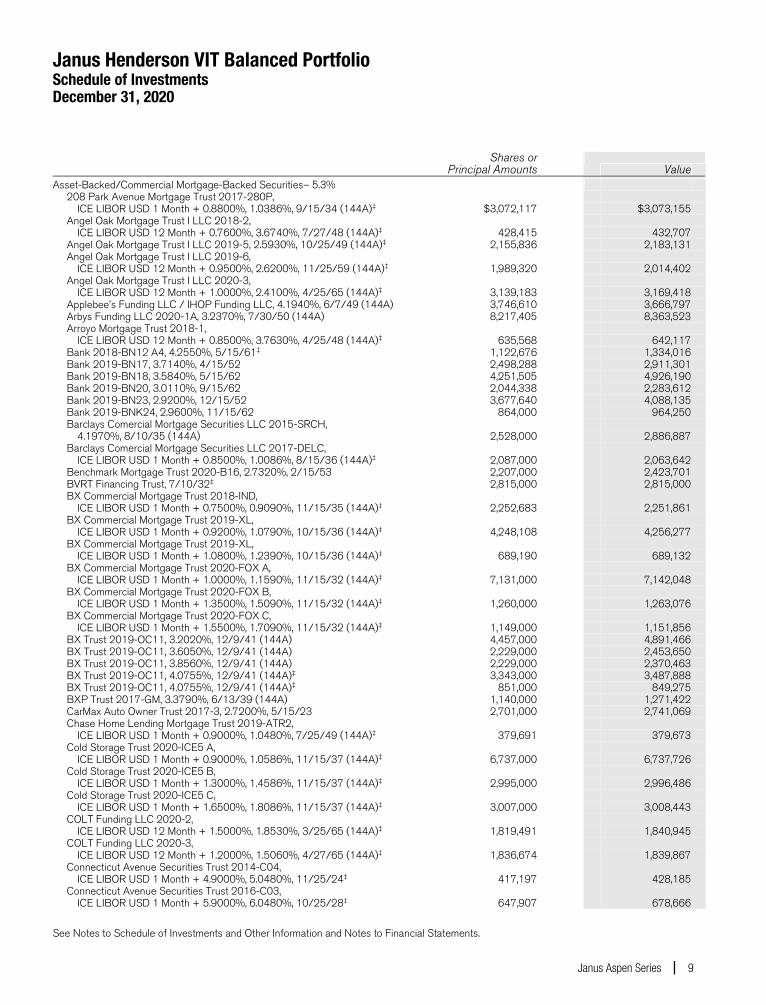
Asset-Backed/Commercial Mortgage-Backed Securities– 5.3% 208 Park Avenue Mortgage Trust 2017-280P, ICE LIBOR USD 1 Month + 0.8800%, 1.0386%, 9/15/34 (144A)‡ $3,072,117 $3,073,155 Angel Oak Mortgage Trust I LLC 2018-2, ICE LIBOR USD 12 Month + 0.7600%, 3.6740%, 7/27/48 (144A)‡ 428,415 432,707 Angel Oak Mortgage Trust I LLC 2019-5, 2.5930%, 10/25/49 (144A)‡ 2,155,836 2,183,131 Angel Oak Mortgage Trust I LLC 2019-6, ICE LIBOR USD 12 Month + 0.9500%, 2.6200%, 11/25/59 (144A)‡ 1,989,320 2,014,402 Angel Oak Mortgage Trust I LLC 2020-3, ICE LIBOR USD 12 Month + 1.0000%, 2.4100%, 4/25/65 (144A)‡ 3,139,183 3,169,418 Applebee's Funding LLC / IHOP Funding LLC, 4.1940%, 6/7/49 (144A) 3,746,610 3,666,797 Arbys Funding LLC 2020-1A, 3.2370%, 7/30/50 (144A) 8,217,405 8,363,523 Arroyo Mortgage Trust 2018-1, ICE LIBOR USD 12 Month + 0.8500%, 3.7630%, 4/25/48 (144A)‡ 635,568 642,117 Bank 2018-BN12 A4, 4.2550%, 5/15/61‡ 1,122,676 1,334,016 Bank 2019-BN17, 3.7140%, 4/15/52 2,498,288 2,911,301 Bank 2019-BN18, 3.5840%, 5/15/62 4,251,505 4,926,190 Bank 2019-BN20, 3.0110%, 9/15/62 2,044,338 2,283,612 Bank 2019-BN23, 2.9200%, 12/15/52 3,677,640 4,088,135 Bank 2019-BNK24, 2.9600%, 11/15/62 864,000 964,250 Barclays Comercial Mortgage Securities LLC 2015-SRCH, 4.1970%, 8/10/35 (144A) 2,528,000 2,886,887 Barclays Comercial Mortgage Securities LLC 2017-DELC, ICE LIBOR USD 1 Month + 0.8500%, 1.0086%, 8/15/36 (144A)‡ 2,087,000 2,063,642 Benchmark Mortgage Trust 2020-B16, 2.7320%, 2/15/53 2,207,000 2,423,701 BVRT Financing Trust, 7/10/32‡ 2,815,000 2,815,000 BX Commercial Mortgage Trust 2018-IND, ICE LIBOR USD 1 Month + 0.7500%, 0.9090%, 11/15/35 (144A)‡ 2,252,683 2,251,861 BX Commercial Mortgage Trust 2019-XL, ICE LIBOR USD 1 Month + 0.9200%, 1.0790%, 10/15/36 (144A)‡ 4,248,108 4,256,277 BX Commercial Mortgage Trust 2019-XL, ICE LIBOR USD 1 Month + 1.0800%, 1.2390%, 10/15/36 (144A)‡ 689,190 689,132 BX Commercial Mortgage Trust 2020-FOX A, ICE LIBOR USD 1 Month + 1.0000%, 1.1590%, 11/15/32 (144A)‡ 7,131,000 7,142,048 BX Commercial Mortgage Trust 2020-FOX B, ICE LIBOR USD 1 Month + 1.3500%, 1.5090%, 11/15/32 (144A)‡ 1,260,000 1,263,076 BX Commercial Mortgage Trust 2020-FOX C, ICE LIBOR USD 1 Month + 1.5500%, 1.7090%, 11/15/32 (144A)‡ 1,149,000 1,151,856 BX Trust 2019-OC11, 3.2020%, 12/9/41 (144A) 4,457,000 4,891,466 BX Trust 2019-OC11, 3.6050%, 12/9/41 (144A) 2,229,000 2,453,650 BX Trust 2019-OC11, 3.8560%, 12/9/41 (144A) 2,229,000 2,370,463 BX Trust 2019-OC11, 4.0755%, 12/9/41 (144A)‡ 3,343,000 3,487,888 BX Trust 2019-OC11, 4.0755%, 12/9/41 (144A)‡ 851,000 849,275 BXP Trust 2017-GM, 3.3790%, 6/13/39 (144A) 1,140,000 1,271,422 CarMax Auto Owner Trust 2017-3, 2.7200%, 5/15/23 2,701,000 2,741,069 Chase Home Lending Mortgage Trust 2019-ATR2, ICE LIBOR USD 1 Month + 0.9000%, 1.0480%, 7/25/49 (144A)‡ 379,691 379,673 Cold Storage Trust 2020-ICE5 A, ICE LIBOR USD 1 Month + 0.9000%, 1.0586%, 11/15/37 (144A)‡ 6,737,000 6,737,726 Cold Storage Trust 2020-ICE5 B, ICE LIBOR USD 1 Month + 1.3000%, 1.4586%, 11/15/37 (144A)‡ 2,995,000 2,996,486 Cold Storage Trust 2020-ICE5 C, ICE LIBOR USD 1 Month + 1.6500%, 1.8086%, 11/15/37 (144A)‡ 3,007,000 3,008,443 COLT Funding LLC 2020-2, ICE LIBOR USD 12 Month + 1.5000%, 1.8530%, 3/25/65 (144A)‡ 1,819,491 1,840,945 COLT Funding LLC 2020-3, ICE LIBOR USD 12 Month + 1.2000%, 1.5060%, 4/27/65 (144A)‡ 1,836,674 1,839,867 Connecticut Avenue Securities Trust 2014-C04, ICE LIBOR USD 1 Month + 4.9000%, 5.0480%, 11/25/24‡ 417,197 428,185 Connecticut Avenue Securities Trust 2016-C03, ICE LIBOR USD 1 Month + 5.9000%, 6.0480%, 10/25/28‡ 647,907 678,666
Janus Henderson VIT Balanced Portfolio Schedule of Investments December 31, 2020
See Notes to Schedule of Investments and Other Information and Notes to Financial Statements.
10 DECEMBER 31, 2020
Shares orPrincipal Amounts
Value
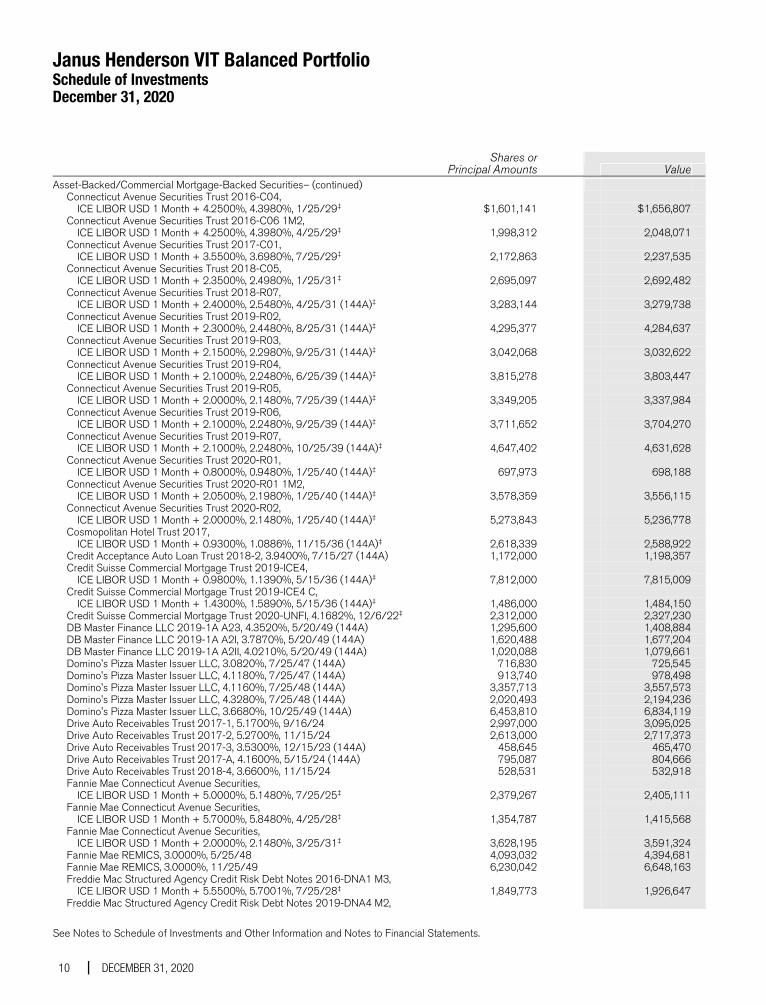
Asset-Backed/Commercial Mortgage-Backed Securities– (continued) Connecticut Avenue Securities Trust 2016-C04, ICE LIBOR USD 1 Month + 4.2500%, 4.3980%, 1/25/29‡ $1,601,141 $1,656,807 Connecticut Avenue Securities Trust 2016-C06 1M2, ICE LIBOR USD 1 Month + 4.2500%, 4.3980%, 4/25/29‡ 1,998,312 2,048,071 Connecticut Avenue Securities Trust 2017-C01, ICE LIBOR USD 1 Month + 3.5500%, 3.6980%, 7/25/29‡ 2,172,863 2,237,535 Connecticut Avenue Securities Trust 2018-C05, ICE LIBOR USD 1 Month + 2.3500%, 2.4980%, 1/25/31‡ 2,695,097 2,692,482 Connecticut Avenue Securities Trust 2018-R07, ICE LIBOR USD 1 Month + 2.4000%, 2.5480%, 4/25/31 (144A)‡ 3,283,144 3,279,738 Connecticut Avenue Securities Trust 2019-R02, ICE LIBOR USD 1 Month + 2.3000%, 2.4480%, 8/25/31 (144A)‡ 4,295,377 4,284,637 Connecticut Avenue Securities Trust 2019-R03, ICE LIBOR USD 1 Month + 2.1500%, 2.2980%, 9/25/31 (144A)‡ 3,042,068 3,032,622 Connecticut Avenue Securities Trust 2019-R04, ICE LIBOR USD 1 Month + 2.1000%, 2.2480%, 6/25/39 (144A)‡ 3,815,278 3,803,447 Connecticut Avenue Securities Trust 2019-R05, ICE LIBOR USD 1 Month + 2.0000%, 2.1480%, 7/25/39 (144A)‡ 3,349,205 3,337,984 Connecticut Avenue Securities Trust 2019-R06, ICE LIBOR USD 1 Month + 2.1000%, 2.2480%, 9/25/39 (144A)‡ 3,711,652 3,704,270 Connecticut Avenue Securities Trust 2019-R07, ICE LIBOR USD 1 Month + 2.1000%, 2.2480%, 10/25/39 (144A)‡ 4,647,402 4,631,628 Connecticut Avenue Securities Trust 2020-R01, ICE LIBOR USD 1 Month + 0.8000%, 0.9480%, 1/25/40 (144A)‡ 697,973 698,188 Connecticut Avenue Securities Trust 2020-R01 1M2, ICE LIBOR USD 1 Month + 2.0500%, 2.1980%, 1/25/40 (144A)‡ 3,578,359 3,556,115 Connecticut Avenue Securities Trust 2020-R02, ICE LIBOR USD 1 Month + 2.0000%, 2.1480%, 1/25/40 (144A)‡ 5,273,843 5,236,778 Cosmopolitan Hotel Trust 2017, ICE LIBOR USD 1 Month + 0.9300%, 1.0886%, 11/15/36 (144A)‡ 2,618,339 2,588,922 Credit Acceptance Auto Loan Trust 2018-2, 3.9400%, 7/15/27 (144A) 1,172,000 1,198,357 Credit Suisse Commercial Mortgage Trust 2019-ICE4, ICE LIBOR USD 1 Month + 0.9800%, 1.1390%, 5/15/36 (144A)‡ 7,812,000 7,815,009 Credit Suisse Commercial Mortgage Trust 2019-ICE4 C, ICE LIBOR USD 1 Month + 1.4300%, 1.5890%, 5/15/36 (144A)‡ 1,486,000 1,484,150 Credit Suisse Commercial Mortgage Trust 2020-UNFI, 4.1682%, 12/6/22‡ 2,312,000 2,327,230 DB Master Finance LLC 2019-1A A23, 4.3520%, 5/20/49 (144A) 1,295,600 1,408,884 DB Master Finance LLC 2019-1A A2I, 3.7870%, 5/20/49 (144A) 1,620,488 1,677,204 DB Master Finance LLC 2019-1A A2II, 4.0210%, 5/20/49 (144A) 1,020,088 1,079,661 Domino's Pizza Master Issuer LLC, 3.0820%, 7/25/47 (144A) 716,830 725,545 Domino's Pizza Master Issuer LLC, 4.1180%, 7/25/47 (144A) 913,740 978,498 Domino's Pizza Master Issuer LLC, 4.1160%, 7/25/48 (144A) 3,357,713 3,557,573 Domino's Pizza Master Issuer LLC, 4.3280%, 7/25/48 (144A) 2,020,493 2,194,236 Domino's Pizza Master Issuer LLC, 3.6680%, 10/25/49 (144A) 6,453,810 6,834,119 Drive Auto Receivables Trust 2017-1, 5.1700%, 9/16/24 2,997,000 3,095,025 Drive Auto Receivables Trust 2017-2, 5.2700%, 11/15/24 2,613,000 2,717,373 Drive Auto Receivables Trust 2017-3, 3.5300%, 12/15/23 (144A) 458,645 465,470 Drive Auto Receivables Trust 2017-A, 4.1600%, 5/15/24 (144A) 795,087 804,666 Drive Auto Receivables Trust 2018-4, 3.6600%, 11/15/24 528,531 532,918 Fannie Mae Connecticut Avenue Securities, ICE LIBOR USD 1 Month + 5.0000%, 5.1480%, 7/25/25‡ 2,379,267 2,405,111 Fannie Mae Connecticut Avenue Securities, ICE LIBOR USD 1 Month + 5.7000%, 5.8480%, 4/25/28‡ 1,354,787 1,415,568 Fannie Mae Connecticut Avenue Securities, ICE LIBOR USD 1 Month + 2.0000%, 2.1480%, 3/25/31‡ 3,628,195 3,591,324 Fannie Mae REMICS, 3.0000%, 5/25/48 4,093,032 4,394,681 Fannie Mae REMICS, 3.0000%, 11/25/49 6,230,042 6,648,163 Freddie Mac Structured Agency Credit Risk Debt Notes 2016-DNA1 M3, ICE LIBOR USD 1 Month + 5.5500%, 5.7001%, 7/25/28‡ 1,849,773 1,926,647 Freddie Mac Structured Agency Credit Risk Debt Notes 2019-DNA4 M2,
Janus Henderson VIT Balanced Portfolio Schedule of Investments December 31, 2020
See Notes to Schedule of Investments and Other Information and Notes to Financial Statements.
Janus Aspen Series 11
Shares orPrincipal Amounts
Value
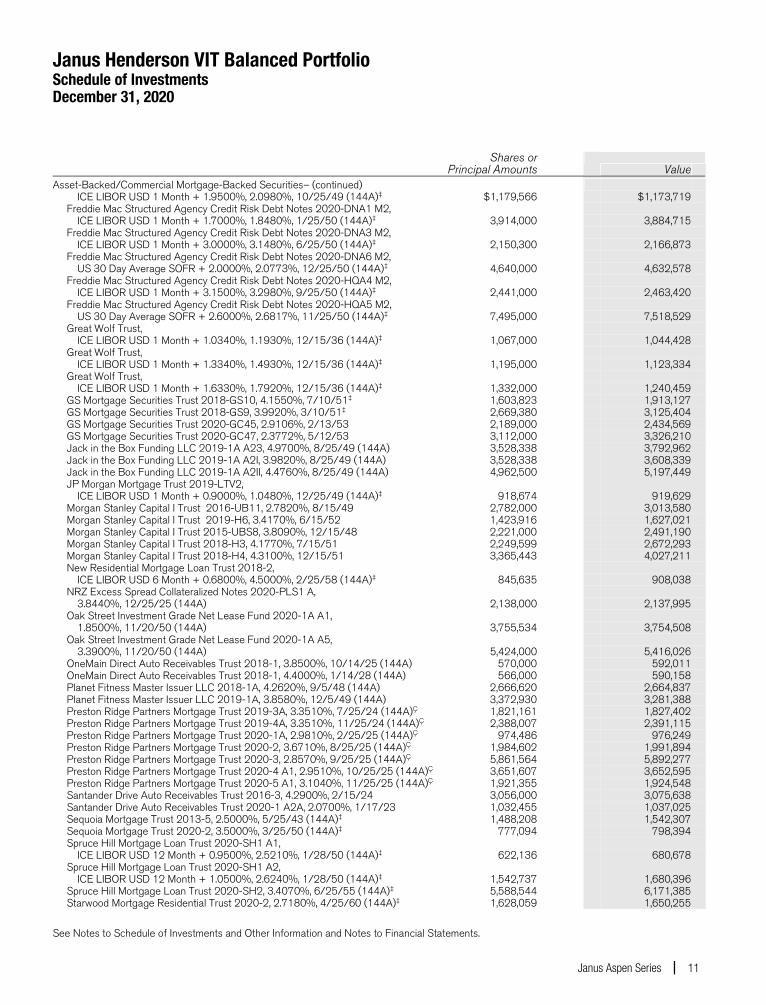
Asset-Backed/Commercial Mortgage-Backed Securities– (continued) ICE LIBOR USD 1 Month + 1.9500%, 2.0980%, 10/25/49 (144A)‡ $1,179,566 $1,173,719 Freddie Mac Structured Agency Credit Risk Debt Notes 2020-DNA1 M2, ICE LIBOR USD 1 Month + 1.7000%, 1.8480%, 1/25/50 (144A)‡ 3,914,000 3,884,715 Freddie Mac Structured Agency Credit Risk Debt Notes 2020-DNA3 M2, ICE LIBOR USD 1 Month + 3.0000%, 3.1480%, 6/25/50 (144A)‡ 2,150,300 2,166,873 Freddie Mac Structured Agency Credit Risk Debt Notes 2020-DNA6 M2, US 30 Day Average SOFR + 2.0000%, 2.0773%, 12/25/50 (144A)‡ 4,640,000 4,632,578 Freddie Mac Structured Agency Credit Risk Debt Notes 2020-HQA4 M2, ICE LIBOR USD 1 Month + 3.1500%, 3.2980%, 9/25/50 (144A)‡ 2,441,000 2,463,420 Freddie Mac Structured Agency Credit Risk Debt Notes 2020-HQA5 M2, US 30 Day Average SOFR + 2.6000%, 2.6817%, 11/25/50 (144A)‡ 7,495,000 7,518,529 Great Wolf Trust, ICE LIBOR USD 1 Month + 1.0340%, 1.1930%, 12/15/36 (144A)‡ 1,067,000 1,044,428 Great Wolf Trust, ICE LIBOR USD 1 Month + 1.3340%, 1.4930%, 12/15/36 (144A)‡ 1,195,000 1,123,334 Great Wolf Trust, ICE LIBOR USD 1 Month + 1.6330%, 1.7920%, 12/15/36 (144A)‡ 1,332,000 1,240,459 GS Mortgage Securities Trust 2018-GS10, 4.1550%, 7/10/51‡ 1,603,823 1,913,127 GS Mortgage Securities Trust 2018-GS9, 3.9920%, 3/10/51‡ 2,669,380 3,125,404 GS Mortgage Securities Trust 2020-GC45, 2.9106%, 2/13/53 2,189,000 2,434,569 GS Mortgage Securities Trust 2020-GC47, 2.3772%, 5/12/53 3,112,000 3,326,210 Jack in the Box Funding LLC 2019-1A A23, 4.9700%, 8/25/49 (144A) 3,528,338 3,792,962 Jack in the Box Funding LLC 2019-1A A2I, 3.9820%, 8/25/49 (144A) 3,528,338 3,608,339 Jack in the Box Funding LLC 2019-1A A2II, 4.4760%, 8/25/49 (144A) 4,962,500 5,197,449 JP Morgan Mortgage Trust 2019-LTV2, ICE LIBOR USD 1 Month + 0.9000%, 1.0480%, 12/25/49 (144A)‡ 918,674 919,629 Morgan Stanley Capital I Trust 2016-UB11, 2.7820%, 8/15/49 2,782,000 3,013,580 Morgan Stanley Capital I Trust 2019-H6, 3.4170%, 6/15/52 1,423,916 1,627,021 Morgan Stanley Capital I Trust 2015-UBS8, 3.8090%, 12/15/48 2,221,000 2,491,190 Morgan Stanley Capital I Trust 2018-H3, 4.1770%, 7/15/51 2,249,599 2,672,293 Morgan Stanley Capital I Trust 2018-H4, 4.3100%, 12/15/51 3,365,443 4,027,211 New Residential Mortgage Loan Trust 2018-2, ICE LIBOR USD 6 Month + 0.6800%, 4.5000%, 2/25/58 (144A)‡ 845,635 908,038 NRZ Excess Spread Collateralized Notes 2020-PLS1 A, 3.8440%, 12/25/25 (144A) 2,138,000 2,137,995 Oak Street Investment Grade Net Lease Fund 2020-1A A1, 1.8500%, 11/20/50 (144A) 3,755,534 3,754,508 Oak Street Investment Grade Net Lease Fund 2020-1A A5, 3.3900%, 11/20/50 (144A) 5,424,000 5,416,026 OneMain Direct Auto Receivables Trust 2018-1, 3.8500%, 10/14/25 (144A) 570,000 592,011 OneMain Direct Auto Receivables Trust 2018-1, 4.4000%, 1/14/28 (144A) 566,000 590,158 Planet Fitness Master Issuer LLC 2018-1A, 4.2620%, 9/5/48 (144A) 2,666,620 2,664,837 Planet Fitness Master Issuer LLC 2019-1A, 3.8580%, 12/5/49 (144A) 3,372,930 3,281,388 Preston Ridge Partners Mortgage Trust 2019-3A, 3.3510%, 7/25/24 (144A)Ç 1,821,161 1,827,402 Preston Ridge Partners Mortgage Trust 2019-4A, 3.3510%, 11/25/24 (144A)Ç 2,388,007 2,391,115 Preston Ridge Partners Mortgage Trust 2020-1A, 2.9810%, 2/25/25 (144A)Ç 974,486 976,249 Preston Ridge Partners Mortgage Trust 2020-2, 3.6710%, 8/25/25 (144A)Ç 1,984,602 1,991,894 Preston Ridge Partners Mortgage Trust 2020-3, 2.8570%, 9/25/25 (144A)Ç 5,861,564 5,892,277 Preston Ridge Partners Mortgage Trust 2020-4 A1, 2.9510%, 10/25/25 (144A)Ç 3,651,607 3,652,595 Preston Ridge Partners Mortgage Trust 2020-5 A1, 3.1040%, 11/25/25 (144A)Ç 1,921,355 1,924,548 Santander Drive Auto Receivables Trust 2016-3, 4.2900%, 2/15/24 3,056,000 3,075,638 Santander Drive Auto Receivables Trust 2020-1 A2A, 2.0700%, 1/17/23 1,032,455 1,037,025 Sequoia Mortgage Trust 2013-5, 2.5000%, 5/25/43 (144A)‡ 1,488,208 1,542,307 Sequoia Mortgage Trust 2020-2, 3.5000%, 3/25/50 (144A)‡ 777,094 798,394 Spruce Hill Mortgage Loan Trust 2020-SH1 A1, ICE LIBOR USD 12 Month + 0.9500%, 2.5210%, 1/28/50 (144A)‡ 622,136 680,678 Spruce Hill Mortgage Loan Trust 2020-SH1 A2, ICE LIBOR USD 12 Month + 1.0500%, 2.6240%, 1/28/50 (144A)‡ 1,542,737 1,680,396 Spruce Hill Mortgage Loan Trust 2020-SH2, 3.4070%, 6/25/55 (144A)‡ 5,588,544 6,171,385 Starwood Mortgage Residential Trust 2020-2, 2.7180%, 4/25/60 (144A)‡ 1,628,059 1,650,255
Janus Henderson VIT Balanced Portfolio Schedule of Investments December 31, 2020
See Notes to Schedule of Investments and Other Information and Notes to Financial Statements.
12 DECEMBER 31, 2020
Shares orPrincipal Amounts
Value
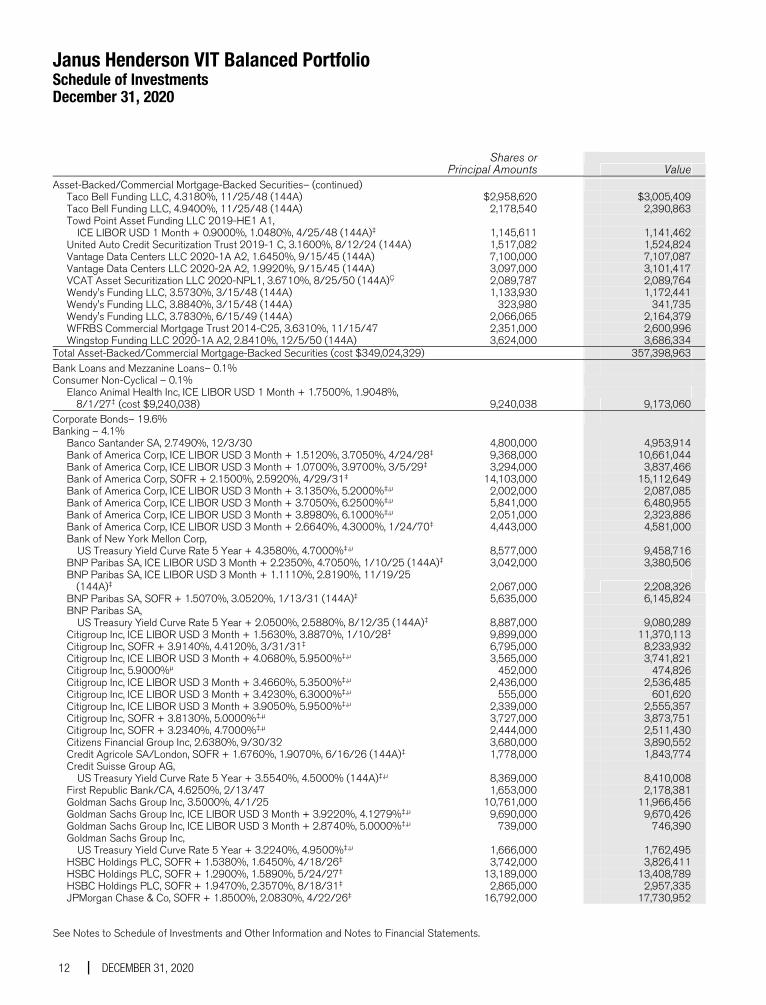
Asset-Backed/Commercial Mortgage-Backed Securities– (continued) Taco Bell Funding LLC, 4.3180%, 11/25/48 (144A) $2,958,620 $3,005,409 Taco Bell Funding LLC, 4.9400%, 11/25/48 (144A) 2,178,540 2,390,863 Towd Point Asset Funding LLC 2019-HE1 A1, ICE LIBOR USD 1 Month + 0.9000%, 1.0480%, 4/25/48 (144A)‡ 1,145,611 1,141,462 United Auto Credit Securitization Trust 2019-1 C, 3.1600%, 8/12/24 (144A) 1,517,082 1,524,824 Vantage Data Centers LLC 2020-1A A2, 1.6450%, 9/15/45 (144A) 7,100,000 7,107,087 Vantage Data Centers LLC 2020-2A A2, 1.9920%, 9/15/45 (144A) 3,097,000 3,101,417 VCAT Asset Securitization LLC 2020-NPL1, 3.6710%, 8/25/50 (144A)Ç 2,089,787 2,089,764 Wendy's Funding LLC, 3.5730%, 3/15/48 (144A) 1,133,930 1,172,441 Wendy's Funding LLC, 3.8840%, 3/15/48 (144A) 323,980 341,735 Wendy's Funding LLC, 3.7830%, 6/15/49 (144A) 2,066,065 2,164,379 WFRBS Commercial Mortgage Trust 2014-C25, 3.6310%, 11/15/47 2,351,000 2,600,996 Wingstop Funding LLC 2020-1A A2, 2.8410%, 12/5/50 (144A) 3,624,000 3,686,334Total Asset-Backed/Commercial Mortgage-Backed Securities (cost $349,024,329) 357,398,963Bank Loans and Mezzanine Loans– 0.1% Consumer Non-Cyclical – 0.1% Elanco Animal Health Inc, ICE LIBOR USD 1 Month + 1.7500%, 1.9048%,
8/1/27‡((cost $9,240,038)
9,240,038
9,173,060Corporate Bonds– 19.6% Banking – 4.1% Banco Santander SA, 2.7490%, 12/3/30 4,800,000 4,953,914 Bank of America Corp, ICE LIBOR USD 3 Month + 1.5120%, 3.7050%, 4/24/28‡ 9,368,000 10,661,044 Bank of America Corp, ICE LIBOR USD 3 Month + 1.0700%, 3.9700%, 3/5/29‡ 3,294,000 3,837,466 Bank of America Corp, SOFR + 2.1500%, 2.5920%, 4/29/31‡ 14,103,000 15,112,649 Bank of America Corp, ICE LIBOR USD 3 Month + 3.1350%, 5.2000%‡,μ 2,002,000 2,087,085 Bank of America Corp, ICE LIBOR USD 3 Month + 3.7050%, 6.2500%‡,μ 5,841,000 6,480,955 Bank of America Corp, ICE LIBOR USD 3 Month + 3.8980%, 6.1000%‡,μ 2,051,000 2,323,886 Bank of America Corp, ICE LIBOR USD 3 Month + 2.6640%, 4.3000%, 1/24/70‡ 4,443,000 4,581,000 Bank of New York Mellon Corp, US Treasury Yield Curve Rate 5 Year + 4.3580%, 4.7000%‡,μ 8,577,000 9,458,716 BNP Paribas SA, ICE LIBOR USD 3 Month + 2.2350%, 4.7050%, 1/10/25 (144A)‡ 3,042,000 3,380,506 BNP Paribas SA, ICE LIBOR USD 3 Month + 1.1110%, 2.8190%, 11/19/25
(144A)‡
2,067,000
2,208,326 BNP Paribas SA, SOFR + 1.5070%, 3.0520%, 1/13/31 (144A)‡ 5,635,000 6,145,824 BNP Paribas SA, US Treasury Yield Curve Rate 5 Year + 2.0500%, 2.5880%, 8/12/35 (144A)‡ 8,887,000 9,080,289 Citigroup Inc, ICE LIBOR USD 3 Month + 1.5630%, 3.8870%, 1/10/28‡ 9,899,000 11,370,113 Citigroup Inc, SOFR + 3.9140%, 4.4120%, 3/31/31‡ 6,795,000 8,233,932 Citigroup Inc, ICE LIBOR USD 3 Month + 4.0680%, 5.9500%‡,μ 3,565,000 3,741,821 Citigroup Inc, 5.9000%μ 452,000 474,826 Citigroup Inc, ICE LIBOR USD 3 Month + 3.4660%, 5.3500%‡,μ 2,436,000 2,536,485 Citigroup Inc, ICE LIBOR USD 3 Month + 3.4230%, 6.3000%‡,μ 555,000 601,620 Citigroup Inc, ICE LIBOR USD 3 Month + 3.9050%, 5.9500%‡,μ 2,339,000 2,555,357 Citigroup Inc, SOFR + 3.8130%, 5.0000%‡,μ 3,727,000 3,873,751 Citigroup Inc, SOFR + 3.2340%, 4.7000%‡,μ 2,444,000 2,511,430 Citizens Financial Group Inc, 2.6380%, 9/30/32 3,680,000 3,890,552 Credit Agricole SA/London, SOFR + 1.6760%, 1.9070%, 6/16/26 (144A)‡ 1,778,000 1,843,774 Credit Suisse Group AG, US Treasury Yield Curve Rate 5 Year + 3.5540%, 4.5000% (144A)‡,μ 8,369,000 8,410,008 First Republic Bank/CA, 4.6250%, 2/13/47 1,653,000 2,178,381 Goldman Sachs Group Inc, 3.5000%, 4/1/25 10,761,000 11,966,456 Goldman Sachs Group Inc, ICE LIBOR USD 3 Month + 3.9220%, 4.1279%‡,μ 9,690,000 9,670,426 Goldman Sachs Group Inc, ICE LIBOR USD 3 Month + 2.8740%, 5.0000%‡,μ 739,000 746,390 Goldman Sachs Group Inc, US Treasury Yield Curve Rate 5 Year + 3.2240%, 4.9500%‡,μ 1,666,000 1,762,495 HSBC Holdings PLC, SOFR + 1.5380%, 1.6450%, 4/18/26‡ 3,742,000 3,826,411 HSBC Holdings PLC, SOFR + 1.2900%, 1.5890%, 5/24/27‡ 13,189,000 13,408,789 HSBC Holdings PLC, SOFR + 1.9470%, 2.3570%, 8/18/31‡ 2,865,000 2,957,335 JPMorgan Chase & Co, SOFR + 1.8500%, 2.0830%, 4/22/26‡ 16,792,000 17,730,952
Janus Henderson VIT Balanced Portfolio Schedule of Investments December 31, 2020
See Notes to Schedule of Investments and Other Information and Notes to Financial Statements.
Janus Aspen Series 13
Shares orPrincipal Amounts
Value
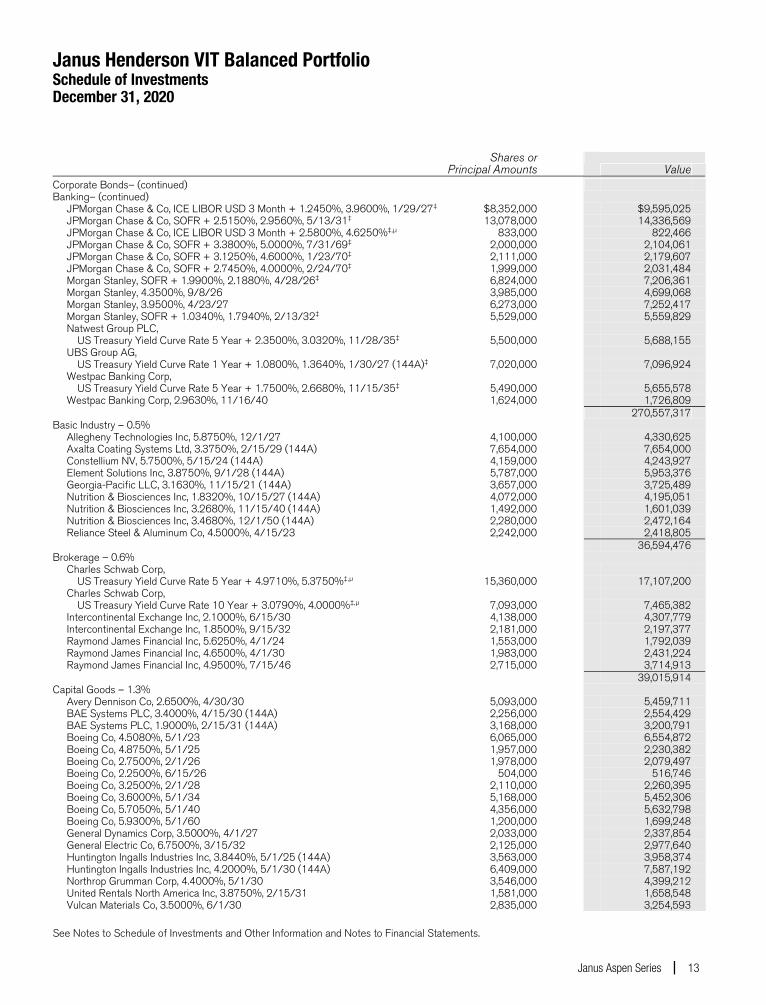
Corporate Bonds– (continued) Banking– (continued) JPMorgan Chase & Co, ICE LIBOR USD 3 Month + 1.2450%, 3.9600%, 1/29/27‡ $8,352,000 $9,595,025 JPMorgan Chase & Co, SOFR + 2.5150%, 2.9560%, 5/13/31‡ 13,078,000 14,336,569 JPMorgan Chase & Co, ICE LIBOR USD 3 Month + 2.5800%, 4.6250%‡,μ 833,000 822,466 JPMorgan Chase & Co, SOFR + 3.3800%, 5.0000%, 7/31/69‡ 2,000,000 2,104,061 JPMorgan Chase & Co, SOFR + 3.1250%, 4.6000%, 1/23/70‡ 2,111,000 2,179,607 JPMorgan Chase & Co, SOFR + 2.7450%, 4.0000%, 2/24/70‡ 1,999,000 2,031,484 Morgan Stanley, SOFR + 1.9900%, 2.1880%, 4/28/26‡ 6,824,000 7,206,361 Morgan Stanley, 4.3500%, 9/8/26 3,985,000 4,699,068 Morgan Stanley, 3.9500%, 4/23/27 6,273,000 7,252,417 Morgan Stanley, SOFR + 1.0340%, 1.7940%, 2/13/32‡ 5,529,000 5,559,829 Natwest Group PLC, US Treasury Yield Curve Rate 5 Year + 2.3500%, 3.0320%, 11/28/35‡ 5,500,000 5,688,155 UBS Group AG, US Treasury Yield Curve Rate 1 Year + 1.0800%, 1.3640%, 1/30/27 (144A)‡ 7,020,000 7,096,924 Westpac Banking Corp, US Treasury Yield Curve Rate 5 Year + 1.7500%, 2.6680%, 11/15/35‡ 5,490,000 5,655,578 Westpac Banking Corp, 2.9630%, 11/16/40 1,624,000 1,726,809 270,557,317Basic Industry – 0.5% Allegheny Technologies Inc, 5.8750%, 12/1/27 4,100,000 4,330,625 Axalta Coating Systems Ltd, 3.3750%, 2/15/29 (144A) 7,654,000 7,654,000 Constellium NV, 5.7500%, 5/15/24 (144A) 4,159,000 4,243,927 Element Solutions Inc, 3.8750%, 9/1/28 (144A) 5,787,000 5,953,376 Georgia-Pacific LLC, 3.1630%, 11/15/21 (144A) 3,657,000 3,725,489 Nutrition & Biosciences Inc, 1.8320%, 10/15/27 (144A) 4,072,000 4,195,051 Nutrition & Biosciences Inc, 3.2680%, 11/15/40 (144A) 1,492,000 1,601,039 Nutrition & Biosciences Inc, 3.4680%, 12/1/50 (144A) 2,280,000 2,472,164 Reliance Steel & Aluminum Co, 4.5000%, 4/15/23 2,242,000 2,418,805 36,594,476Brokerage – 0.6% Charles Schwab Corp, US Treasury Yield Curve Rate 5 Year + 4.9710%, 5.3750%‡,μ 15,360,000 17,107,200 Charles Schwab Corp, US Treasury Yield Curve Rate 10 Year + 3.0790%, 4.0000%‡,μ 7,093,000 7,465,382 Intercontinental Exchange Inc, 2.1000%, 6/15/30 4,138,000 4,307,779 Intercontinental Exchange Inc, 1.8500%, 9/15/32 2,181,000 2,197,377 Raymond James Financial Inc, 5.6250%, 4/1/24 1,553,000 1,792,039 Raymond James Financial Inc, 4.6500%, 4/1/30 1,983,000 2,431,224 Raymond James Financial Inc, 4.9500%, 7/15/46 2,715,000 3,714,913 39,015,914Capital Goods – 1.3% Avery Dennison Co, 2.6500%, 4/30/30 5,093,000 5,459,711 BAE Systems PLC, 3.4000%, 4/15/30 (144A) 2,256,000 2,554,429 BAE Systems PLC, 1.9000%, 2/15/31 (144A) 3,168,000 3,200,791 Boeing Co, 4.5080%, 5/1/23 6,065,000 6,554,872 Boeing Co, 4.8750%, 5/1/25 1,957,000 2,230,382 Boeing Co, 2.7500%, 2/1/26 1,978,000 2,079,497 Boeing Co, 2.2500%, 6/15/26 504,000 516,746 Boeing Co, 3.2500%, 2/1/28 2,110,000 2,260,395 Boeing Co, 3.6000%, 5/1/34 5,168,000 5,452,306 Boeing Co, 5.7050%, 5/1/40 4,356,000 5,632,798 Boeing Co, 5.9300%, 5/1/60 1,200,000 1,699,248 General Dynamics Corp, 3.5000%, 4/1/27 2,033,000 2,337,854 General Electric Co, 6.7500%, 3/15/32 2,125,000 2,977,640 Huntington Ingalls Industries Inc, 3.8440%, 5/1/25 (144A) 3,563,000 3,958,374 Huntington Ingalls Industries Inc, 4.2000%, 5/1/30 (144A) 6,409,000 7,587,192 Northrop Grumman Corp, 4.4000%, 5/1/30 3,546,000 4,399,212 United Rentals North America Inc, 3.8750%, 2/15/31 1,581,000 1,658,548 Vulcan Materials Co, 3.5000%, 6/1/30 2,835,000 3,254,593
Janus Henderson VIT Balanced Portfolio Schedule of Investments December 31, 2020
See Notes to Schedule of Investments and Other Information and Notes to Financial Statements.
14 DECEMBER 31, 2020
Shares orPrincipal Amounts
Value
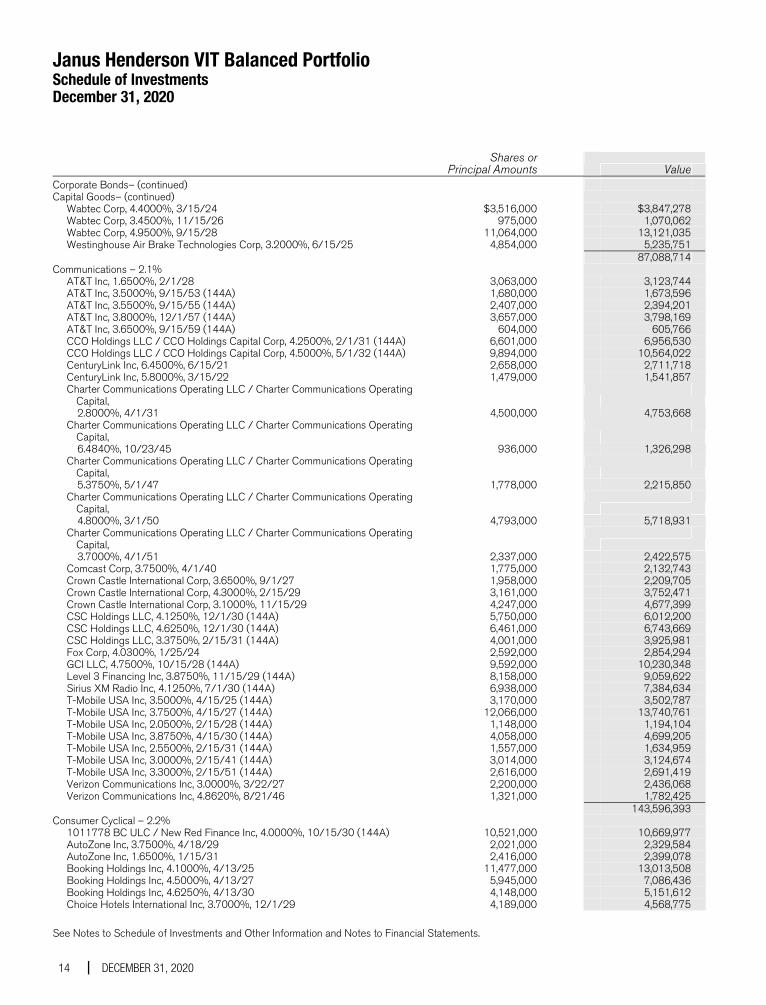
Corporate Bonds– (continued) Capital Goods– (continued) Wabtec Corp, 4.4000%, 3/15/24 $3,516,000 $3,847,278 Wabtec Corp, 3.4500%, 11/15/26 975,000 1,070,062 Wabtec Corp, 4.9500%, 9/15/28 11,064,000 13,121,035 Westinghouse Air Brake Technologies Corp, 3.2000%, 6/15/25 4,854,000 5,235,751 87,088,714Communications – 2.1% AT&T Inc, 1.6500%, 2/1/28 3,063,000 3,123,744 AT&T Inc, 3.5000%, 9/15/53 (144A) 1,680,000 1,673,596 AT&T Inc, 3.5500%, 9/15/55 (144A) 2,407,000 2,394,201 AT&T Inc, 3.8000%, 12/1/57 (144A) 3,657,000 3,798,169 AT&T Inc, 3.6500%, 9/15/59 (144A) 604,000 605,766 CCO Holdings LLC / CCO Holdings Capital Corp, 4.2500%, 2/1/31 (144A) 6,601,000 6,956,530 CCO Holdings LLC / CCO Holdings Capital Corp, 4.5000%, 5/1/32 (144A) 9,894,000 10,564,022 CenturyLink Inc, 6.4500%, 6/15/21 2,658,000 2,711,718 CenturyLink Inc, 5.8000%, 3/15/22 1,479,000 1,541,857 Charter Communications Operating LLC / Charter Communications Operating
Capital,
2.8000%, 4/1/31 4,500,000 4,753,668 Charter Communications Operating LLC / Charter Communications Operating
Capital,
6.4840%, 10/23/45 936,000 1,326,298 Charter Communications Operating LLC / Charter Communications Operating
Capital,
5.3750%, 5/1/47 1,778,000 2,215,850 Charter Communications Operating LLC / Charter Communications Operating
Capital,
4.8000%, 3/1/50 4,793,000 5,718,931 Charter Communications Operating LLC / Charter Communications Operating
Capital,
3.7000%, 4/1/51 2,337,000 2,422,575 Comcast Corp, 3.7500%, 4/1/40 1,775,000 2,132,743 Crown Castle International Corp, 3.6500%, 9/1/27 1,958,000 2,209,705 Crown Castle International Corp, 4.3000%, 2/15/29 3,161,000 3,752,471 Crown Castle International Corp, 3.1000%, 11/15/29 4,247,000 4,677,399 CSC Holdings LLC, 4.1250%, 12/1/30 (144A) 5,750,000 6,012,200 CSC Holdings LLC, 4.6250%, 12/1/30 (144A) 6,461,000 6,743,669 CSC Holdings LLC, 3.3750%, 2/15/31 (144A) 4,001,000 3,925,981 Fox Corp, 4.0300%, 1/25/24 2,592,000 2,854,294 GCI LLC, 4.7500%, 10/15/28 (144A) 9,592,000 10,230,348 Level 3 Financing Inc, 3.8750%, 11/15/29 (144A) 8,158,000 9,059,622 Sirius XM Radio Inc, 4.1250%, 7/1/30 (144A) 6,938,000 7,384,634 T-Mobile USA Inc, 3.5000%, 4/15/25 (144A) 3,170,000 3,502,787 T-Mobile USA Inc, 3.7500%, 4/15/27 (144A) 12,066,000 13,740,761 T-Mobile USA Inc, 2.0500%, 2/15/28 (144A) 1,148,000 1,194,104 T-Mobile USA Inc, 3.8750%, 4/15/30 (144A) 4,058,000 4,699,205 T-Mobile USA Inc, 2.5500%, 2/15/31 (144A) 1,557,000 1,634,959 T-Mobile USA Inc, 3.0000%, 2/15/41 (144A) 3,014,000 3,124,674 T-Mobile USA Inc, 3.3000%, 2/15/51 (144A) 2,616,000 2,691,419 Verizon Communications Inc, 3.0000%, 3/22/27 2,200,000 2,436,068 Verizon Communications Inc, 4.8620%, 8/21/46 1,321,000 1,782,425 143,596,393Consumer Cyclical – 2.2% 1011778 BC ULC / New Red Finance Inc, 4.0000%, 10/15/30 (144A) 10,521,000 10,669,977 AutoZone Inc, 3.7500%, 4/18/29 2,021,000 2,329,584 AutoZone Inc, 1.6500%, 1/15/31 2,416,000 2,399,078 Booking Holdings Inc, 4.1000%, 4/13/25 11,477,000 13,013,508 Booking Holdings Inc, 4.5000%, 4/13/27 5,945,000 7,086,436 Booking Holdings Inc, 4.6250%, 4/13/30 4,148,000 5,151,612 Choice Hotels International Inc, 3.7000%, 12/1/29 4,189,000 4,568,775
Janus Henderson VIT Balanced Portfolio Schedule of Investments December 31, 2020
See Notes to Schedule of Investments and Other Information and Notes to Financial Statements.
Janus Aspen Series 15
Shares orPrincipal Amounts
Value
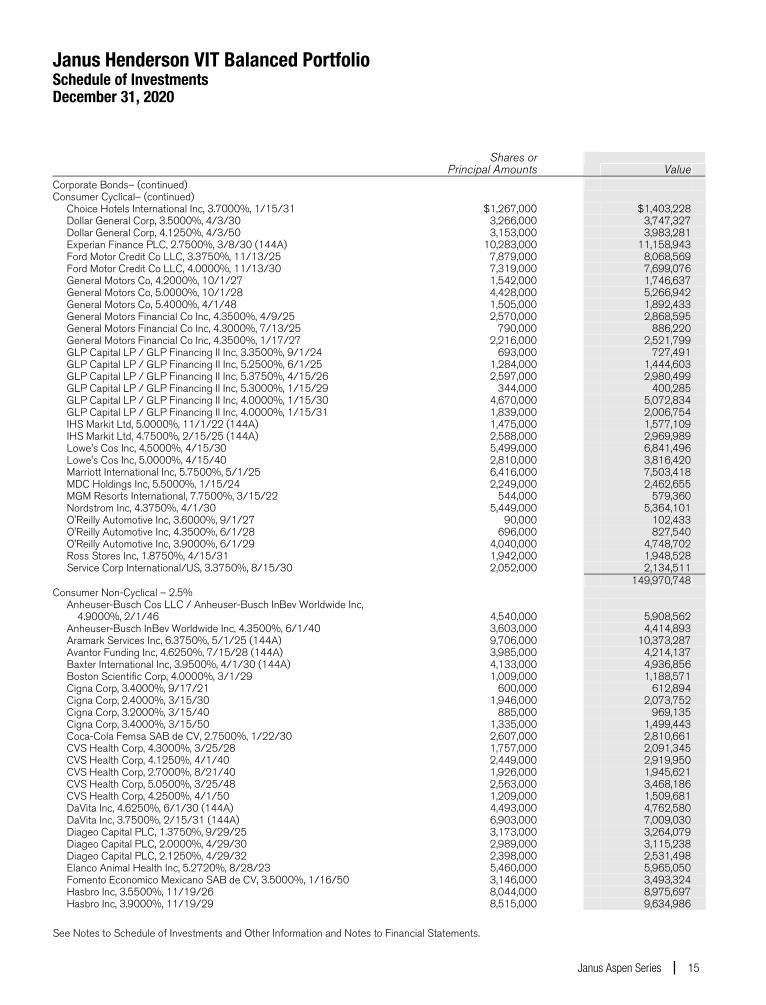
Corporate Bonds– (continued) Consumer Cyclical– (continued) Choice Hotels International Inc, 3.7000%, 1/15/31 $1,267,000 $1,403,228 Dollar General Corp, 3.5000%, 4/3/30 3,266,000 3,747,327 Dollar General Corp, 4.1250%, 4/3/50 3,153,000 3,983,281 Experian Finance PLC, 2.7500%, 3/8/30 (144A) 10,283,000 11,158,943 Ford Motor Credit Co LLC, 3.3750%, 11/13/25 7,879,000 8,068,569 Ford Motor Credit Co LLC, 4.0000%, 11/13/30 7,319,000 7,699,076 General Motors Co, 4.2000%, 10/1/27 1,542,000 1,746,637 General Motors Co, 5.0000%, 10/1/28 4,428,000 5,266,942 General Motors Co, 5.4000%, 4/1/48 1,505,000 1,892,433 General Motors Financial Co Inc, 4.3500%, 4/9/25 2,570,000 2,868,595 General Motors Financial Co Inc, 4.3000%, 7/13/25 790,000 886,220 General Motors Financial Co Inc, 4.3500%, 1/17/27 2,216,000 2,521,799 GLP Capital LP / GLP Financing II Inc, 3.3500%, 9/1/24 693,000 727,491 GLP Capital LP / GLP Financing II Inc, 5.2500%, 6/1/25 1,284,000 1,444,603 GLP Capital LP / GLP Financing II Inc, 5.3750%, 4/15/26 2,597,000 2,980,499 GLP Capital LP / GLP Financing II Inc, 5.3000%, 1/15/29 344,000 400,285 GLP Capital LP / GLP Financing II Inc, 4.0000%, 1/15/30 4,670,000 5,072,834 GLP Capital LP / GLP Financing II Inc, 4.0000%, 1/15/31 1,839,000 2,006,754 IHS Markit Ltd, 5.0000%, 11/1/22 (144A) 1,475,000 1,577,109 IHS Markit Ltd, 4.7500%, 2/15/25 (144A) 2,588,000 2,969,989 Lowe's Cos Inc, 4.5000%, 4/15/30 5,499,000 6,841,496 Lowe's Cos Inc, 5.0000%, 4/15/40 2,810,000 3,816,420 Marriott International Inc, 5.7500%, 5/1/25 6,416,000 7,503,418 MDC Holdings Inc, 5.5000%, 1/15/24 2,249,000 2,462,655 MGM Resorts International, 7.7500%, 3/15/22 544,000 579,360 Nordstrom Inc, 4.3750%, 4/1/30 5,449,000 5,364,101 O'Reilly Automotive Inc, 3.6000%, 9/1/27 90,000 102,433 O'Reilly Automotive Inc, 4.3500%, 6/1/28 696,000 827,540 O'Reilly Automotive Inc, 3.9000%, 6/1/29 4,040,000 4,748,702 Ross Stores Inc, 1.8750%, 4/15/31 1,942,000 1,948,528 Service Corp International/US, 3.3750%, 8/15/30 2,052,000 2,134,511 149,970,748Consumer Non-Cyclical – 2.5% Anheuser-Busch Cos LLC / Anheuser-Busch InBev Worldwide Inc, 4.9000%, 2/1/46 4,540,000 5,908,562 Anheuser-Busch InBev Worldwide Inc, 4.3500%, 6/1/40 3,603,000 4,414,893 Aramark Services Inc, 6.3750%, 5/1/25 (144A) 9,706,000 10,373,287 Avantor Funding Inc, 4.6250%, 7/15/28 (144A) 3,985,000 4,214,137 Baxter International Inc, 3.9500%, 4/1/30 (144A) 4,133,000 4,936,856 Boston Scientific Corp, 4.0000%, 3/1/29 1,009,000 1,188,571 Cigna Corp, 3.4000%, 9/17/21 600,000 612,894 Cigna Corp, 2.4000%, 3/15/30 1,946,000 2,073,752 Cigna Corp, 3.2000%, 3/15/40 885,000 969,135 Cigna Corp, 3.4000%, 3/15/50 1,335,000 1,499,443 Coca-Cola Femsa SAB de CV, 2.7500%, 1/22/30 2,607,000 2,810,661 CVS Health Corp, 4.3000%, 3/25/28 1,757,000 2,091,345 CVS Health Corp, 4.1250%, 4/1/40 2,449,000 2,919,950 CVS Health Corp, 2.7000%, 8/21/40 1,926,000 1,945,621 CVS Health Corp, 5.0500%, 3/25/48 2,563,000 3,468,186 CVS Health Corp, 4.2500%, 4/1/50 1,209,000 1,509,681 DaVita Inc, 4.6250%, 6/1/30 (144A) 4,493,000 4,762,580 DaVita Inc, 3.7500%, 2/15/31 (144A) 6,903,000 7,009,030 Diageo Capital PLC, 1.3750%, 9/29/25 3,173,000 3,264,079 Diageo Capital PLC, 2.0000%, 4/29/30 2,989,000 3,115,238 Diageo Capital PLC, 2.1250%, 4/29/32 2,398,000 2,531,498 Elanco Animal Health Inc, 5.2720%, 8/28/23 5,460,000 5,965,050 Fomento Economico Mexicano SAB de CV, 3.5000%, 1/16/50 3,146,000 3,493,324 Hasbro Inc, 3.5500%, 11/19/26 8,044,000 8,975,697 Hasbro Inc, 3.9000%, 11/19/29 8,515,000 9,634,986
Janus Henderson VIT Balanced Portfolio Schedule of Investments December 31, 2020
See Notes to Schedule of Investments and Other Information and Notes to Financial Statements.
16 DECEMBER 31, 2020
Shares orPrincipal Amounts
Value
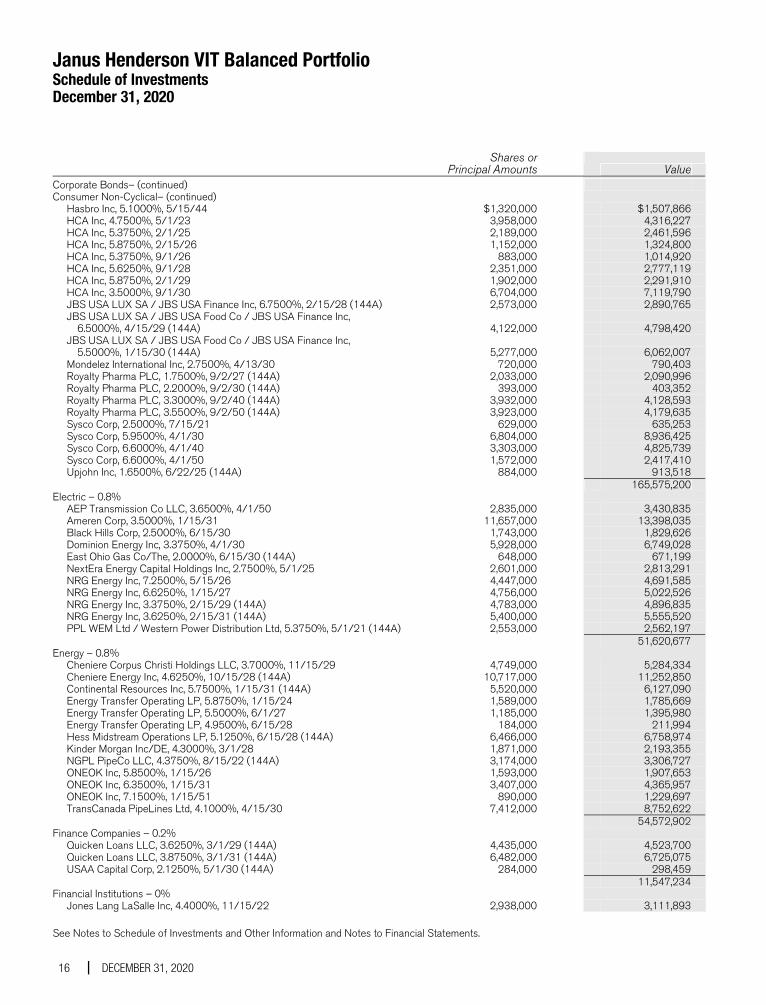
Corporate Bonds– (continued) Consumer Non-Cyclical– (continued) Hasbro Inc, 5.1000%, 5/15/44 $1,320,000 $1,507,866 HCA Inc, 4.7500%, 5/1/23 3,958,000 4,316,227 HCA Inc, 5.3750%, 2/1/25 2,189,000 2,461,596 HCA Inc, 5.8750%, 2/15/26 1,152,000 1,324,800 HCA Inc, 5.3750%, 9/1/26 883,000 1,014,920 HCA Inc, 5.6250%, 9/1/28 2,351,000 2,777,119 HCA Inc, 5.8750%, 2/1/29 1,902,000 2,291,910 HCA Inc, 3.5000%, 9/1/30 6,704,000 7,119,790 JBS USA LUX SA / JBS USA Finance Inc, 6.7500%, 2/15/28 (144A) 2,573,000 2,890,765 JBS USA LUX SA / JBS USA Food Co / JBS USA Finance Inc, 6.5000%, 4/15/29 (144A) 4,122,000 4,798,420 JBS USA LUX SA / JBS USA Food Co / JBS USA Finance Inc, 5.5000%, 1/15/30 (144A) 5,277,000 6,062,007 Mondelez International Inc, 2.7500%, 4/13/30 720,000 790,403 Royalty Pharma PLC, 1.7500%, 9/2/27 (144A) 2,033,000 2,090,996 Royalty Pharma PLC, 2.2000%, 9/2/30 (144A) 393,000 403,352 Royalty Pharma PLC, 3.3000%, 9/2/40 (144A) 3,932,000 4,128,593 Royalty Pharma PLC, 3.5500%, 9/2/50 (144A) 3,923,000 4,179,635 Sysco Corp, 2.5000%, 7/15/21 629,000 635,253 Sysco Corp, 5.9500%, 4/1/30 6,804,000 8,936,425 Sysco Corp, 6.6000%, 4/1/40 3,303,000 4,825,739 Sysco Corp, 6.6000%, 4/1/50 1,572,000 2,417,410 Upjohn Inc, 1.6500%, 6/22/25 (144A) 884,000 913,518 165,575,200Electric – 0.8% AEP Transmission Co LLC, 3.6500%, 4/1/50 2,835,000 3,430,835 Ameren Corp, 3.5000%, 1/15/31 11,657,000 13,398,035 Black Hills Corp, 2.5000%, 6/15/30 1,743,000 1,829,626 Dominion Energy Inc, 3.3750%, 4/1/30 5,928,000 6,749,028 East Ohio Gas Co/The, 2.0000%, 6/15/30 (144A) 648,000 671,199 NextEra Energy Capital Holdings Inc, 2.7500%, 5/1/25 2,601,000 2,813,291 NRG Energy Inc, 7.2500%, 5/15/26 4,447,000 4,691,585 NRG Energy Inc, 6.6250%, 1/15/27 4,756,000 5,022,526 NRG Energy Inc, 3.3750%, 2/15/29 (144A) 4,783,000 4,896,835 NRG Energy Inc, 3.6250%, 2/15/31 (144A) 5,400,000 5,555,520 PPL WEM Ltd / Western Power Distribution Ltd, 5.3750%, 5/1/21 (144A) 2,553,000 2,562,197 51,620,677Energy – 0.8% Cheniere Corpus Christi Holdings LLC, 3.7000%, 11/15/29 4,749,000 5,284,334 Cheniere Energy Inc, 4.6250%, 10/15/28 (144A) 10,717,000 11,252,850 Continental Resources Inc, 5.7500%, 1/15/31 (144A) 5,520,000 6,127,090 Energy Transfer Operating LP, 5.8750%, 1/15/24 1,589,000 1,785,669 Energy Transfer Operating LP, 5.5000%, 6/1/27 1,185,000 1,395,980 Energy Transfer Operating LP, 4.9500%, 6/15/28 184,000 211,994 Hess Midstream Operations LP, 5.1250%, 6/15/28 (144A) 6,466,000 6,758,974 Kinder Morgan Inc/DE, 4.3000%, 3/1/28 1,871,000 2,193,355 NGPL PipeCo LLC, 4.3750%, 8/15/22 (144A) 3,174,000 3,306,727 ONEOK Inc, 5.8500%, 1/15/26 1,593,000 1,907,653 ONEOK Inc, 6.3500%, 1/15/31 3,407,000 4,365,957 ONEOK Inc, 7.1500%, 1/15/51 890,000 1,229,697 TransCanada PipeLines Ltd, 4.1000%, 4/15/30 7,412,000 8,752,622 54,572,902Finance Companies – 0.2% Quicken Loans LLC, 3.6250%, 3/1/29 (144A) 4,435,000 4,523,700 Quicken Loans LLC, 3.8750%, 3/1/31 (144A) 6,482,000 6,725,075 USAA Capital Corp, 2.1250%, 5/1/30 (144A) 284,000 298,459 11,547,234Financial Institutions – 0% Jones Lang LaSalle Inc, 4.4000%, 11/15/22 2,938,000 3,111,893
Janus Henderson VIT Balanced Portfolio Schedule of Investments December 31, 2020
See Notes to Schedule of Investments and Other Information and Notes to Financial Statements.
Janus Aspen Series 17
Shares orPrincipal Amounts
Value
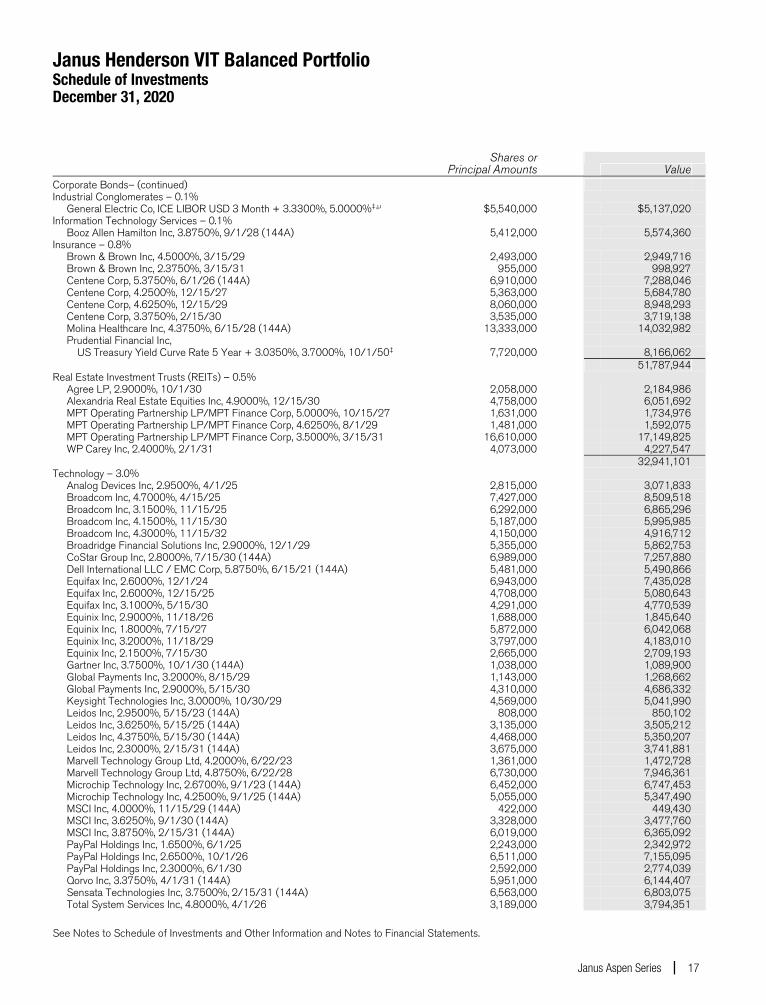
Corporate Bonds– (continued) Industrial Conglomerates – 0.1% General Electric Co, ICE LIBOR USD 3 Month + 3.3300%, 5.0000%‡,μ $5,540,000 $5,137,020Information Technology Services – 0.1% Booz Allen Hamilton Inc, 3.8750%, 9/1/28 (144A) 5,412,000 5,574,360Insurance – 0.8% Brown & Brown Inc, 4.5000%, 3/15/29 2,493,000 2,949,716 Brown & Brown Inc, 2.3750%, 3/15/31 955,000 998,927 Centene Corp, 5.3750%, 6/1/26 (144A) 6,910,000 7,288,046 Centene Corp, 4.2500%, 12/15/27 5,363,000 5,684,780 Centene Corp, 4.6250%, 12/15/29 8,060,000 8,948,293 Centene Corp, 3.3750%, 2/15/30 3,535,000 3,719,138 Molina Healthcare Inc, 4.3750%, 6/15/28 (144A) 13,333,000 14,032,982 Prudential Financial Inc, US Treasury Yield Curve Rate 5 Year + 3.0350%, 3.7000%, 10/1/50‡ 7,720,000 8,166,062 51,787,944Real Estate Investment Trusts (REITs) – 0.5% Agree LP, 2.9000%, 10/1/30 2,058,000 2,184,986 Alexandria Real Estate Equities Inc, 4.9000%, 12/15/30 4,758,000 6,051,692 MPT Operating Partnership LP/MPT Finance Corp, 5.0000%, 10/15/27 1,631,000 1,734,976 MPT Operating Partnership LP/MPT Finance Corp, 4.6250%, 8/1/29 1,481,000 1,592,075 MPT Operating Partnership LP/MPT Finance Corp, 3.5000%, 3/15/31 16,610,000 17,149,825 WP Carey Inc, 2.4000%, 2/1/31 4,073,000 4,227,547 32,941,101Technology – 3.0% Analog Devices Inc, 2.9500%, 4/1/25 2,815,000 3,071,833 Broadcom Inc, 4.7000%, 4/15/25 7,427,000 8,509,518 Broadcom Inc, 3.1500%, 11/15/25 6,292,000 6,865,296 Broadcom Inc, 4.1500%, 11/15/30 5,187,000 5,995,985 Broadcom Inc, 4.3000%, 11/15/32 4,150,000 4,916,712 Broadridge Financial Solutions Inc, 2.9000%, 12/1/29 5,355,000 5,862,753 CoStar Group Inc, 2.8000%, 7/15/30 (144A) 6,989,000 7,257,880 Dell International LLC / EMC Corp, 5.8750%, 6/15/21 (144A) 5,481,000 5,490,866 Equifax Inc, 2.6000%, 12/1/24 6,943,000 7,435,028 Equifax Inc, 2.6000%, 12/15/25 4,708,000 5,080,643 Equifax Inc, 3.1000%, 5/15/30 4,291,000 4,770,539 Equinix Inc, 2.9000%, 11/18/26 1,688,000 1,845,640 Equinix Inc, 1.8000%, 7/15/27 5,872,000 6,042,068 Equinix Inc, 3.2000%, 11/18/29 3,797,000 4,183,010 Equinix Inc, 2.1500%, 7/15/30 2,665,000 2,709,193 Gartner Inc, 3.7500%, 10/1/30 (144A) 1,038,000 1,089,900 Global Payments Inc, 3.2000%, 8/15/29 1,143,000 1,268,662 Global Payments Inc, 2.9000%, 5/15/30 4,310,000 4,686,332 Keysight Technologies Inc, 3.0000%, 10/30/29 4,569,000 5,041,990 Leidos Inc, 2.9500%, 5/15/23 (144A) 808,000 850,102 Leidos Inc, 3.6250%, 5/15/25 (144A) 3,135,000 3,505,212 Leidos Inc, 4.3750%, 5/15/30 (144A) 4,468,000 5,350,207 Leidos Inc, 2.3000%, 2/15/31 (144A) 3,675,000 3,741,881 Marvell Technology Group Ltd, 4.2000%, 6/22/23 1,361,000 1,472,728 Marvell Technology Group Ltd, 4.8750%, 6/22/28 6,730,000 7,946,361 Microchip Technology Inc, 2.6700%, 9/1/23 (144A) 6,452,000 6,747,453 Microchip Technology Inc, 4.2500%, 9/1/25 (144A) 5,055,000 5,347,490 MSCI Inc, 4.0000%, 11/15/29 (144A) 422,000 449,430 MSCI Inc, 3.6250%, 9/1/30 (144A) 3,328,000 3,477,760 MSCI Inc, 3.8750%, 2/15/31 (144A) 6,019,000 6,365,092 PayPal Holdings Inc, 1.6500%, 6/1/25 2,243,000 2,342,972 PayPal Holdings Inc, 2.6500%, 10/1/26 6,511,000 7,155,095 PayPal Holdings Inc, 2.3000%, 6/1/30 2,592,000 2,774,039 Qorvo Inc, 3.3750%, 4/1/31 (144A) 5,951,000 6,144,407 Sensata Technologies Inc, 3.7500%, 2/15/31 (144A) 6,563,000 6,803,075 Total System Services Inc, 4.8000%, 4/1/26 3,189,000 3,794,351
Janus Henderson VIT Balanced Portfolio Schedule of Investments December 31, 2020
See Notes to Schedule of Investments and Other Information and Notes to Financial Statements.
18 DECEMBER 31, 2020
Shares orPrincipal Amounts
Value
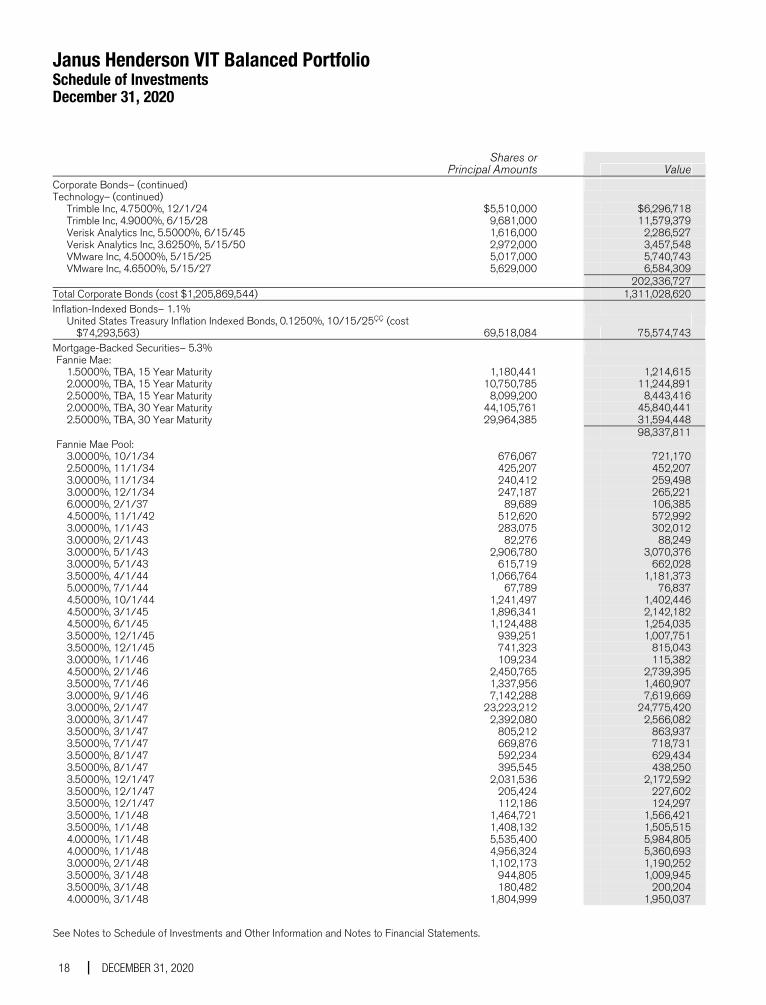
Corporate Bonds– (continued) Technology– (continued) Trimble Inc, 4.7500%, 12/1/24 $5,510,000 $6,296,718 Trimble Inc, 4.9000%, 6/15/28 9,681,000 11,579,379 Verisk Analytics Inc, 5.5000%, 6/15/45 1,616,000 2,286,527 Verisk Analytics Inc, 3.6250%, 5/15/50 2,972,000 3,457,548 VMware Inc, 4.5000%, 5/15/25 5,017,000 5,740,743 VMware Inc, 4.6500%, 5/15/27 5,629,000 6,584,309 202,336,727Total Corporate Bonds (cost $1,205,869,544) 1,311,028,620Inflation-Indexed Bonds– 1.1% United States Treasury Inflation Indexed Bonds, 0.1250%, 10/15/25ÇÇ((cost
$74,293,563)
69,518,084
75,574,743Mortgage-Backed Securities– 5.3% Fannie Mae: 1.5000%, TBA, 15 Year Maturity 1,180,441 1,214,615 2.0000%, TBA, 15 Year Maturity 10,750,785 11,244,891 2.5000%, TBA, 15 Year Maturity 8,099,200 8,443,416 2.0000%, TBA, 30 Year Maturity 44,105,761 45,840,441 2.5000%, TBA, 30 Year Maturity 29,964,385 31,594,448 98,337,811 Fannie Mae Pool: 3.0000%, 10/1/34 676,067 721,170 2.5000%, 11/1/34 425,207 452,207 3.0000%, 11/1/34 240,412 259,498 3.0000%, 12/1/34 247,187 265,221 6.0000%, 2/1/37 89,689 106,385 4.5000%, 11/1/42 512,620 572,992 3.0000%, 1/1/43 283,075 302,012 3.0000%, 2/1/43 82,276 88,249 3.0000%, 5/1/43 2,906,780 3,070,376 3.0000%, 5/1/43 615,719 662,028 3.5000%, 4/1/44 1,066,764 1,181,373 5.0000%, 7/1/44 67,789 76,837 4.5000%, 10/1/44 1,241,497 1,402,446 4.5000%, 3/1/45 1,896,341 2,142,182 4.5000%, 6/1/45 1,124,488 1,254,035 3.5000%, 12/1/45 939,251 1,007,751 3.5000%, 12/1/45 741,323 815,043 3.0000%, 1/1/46 109,234 115,382 4.5000%, 2/1/46 2,450,765 2,739,395 3.5000%, 7/1/46 1,337,956 1,460,907 3.0000%, 9/1/46 7,142,288 7,619,669 3.0000%, 2/1/47 23,223,212 24,775,420 3.0000%, 3/1/47 2,392,080 2,566,082 3.5000%, 3/1/47 805,212 863,937 3.5000%, 7/1/47 669,876 718,731 3.5000%, 8/1/47 592,234 629,434 3.5000%, 8/1/47 395,545 438,250 3.5000%, 12/1/47 2,031,536 2,172,592 3.5000%, 12/1/47 205,424 227,602 3.5000%, 12/1/47 112,186 124,297 3.5000%, 1/1/48 1,464,721 1,566,421 3.5000%, 1/1/48 1,408,132 1,505,515 4.0000%, 1/1/48 5,535,400 5,984,805 4.0000%, 1/1/48 4,956,324 5,360,693 3.0000%, 2/1/48 1,102,173 1,190,252 3.5000%, 3/1/48 944,805 1,009,945 3.5000%, 3/1/48 180,482 200,204 4.0000%, 3/1/48 1,804,999 1,950,037
Janus Henderson VIT Balanced Portfolio Schedule of Investments December 31, 2020
See Notes to Schedule of Investments and Other Information and Notes to Financial Statements.
Janus Aspen Series 19
Shares orPrincipal Amounts
Value
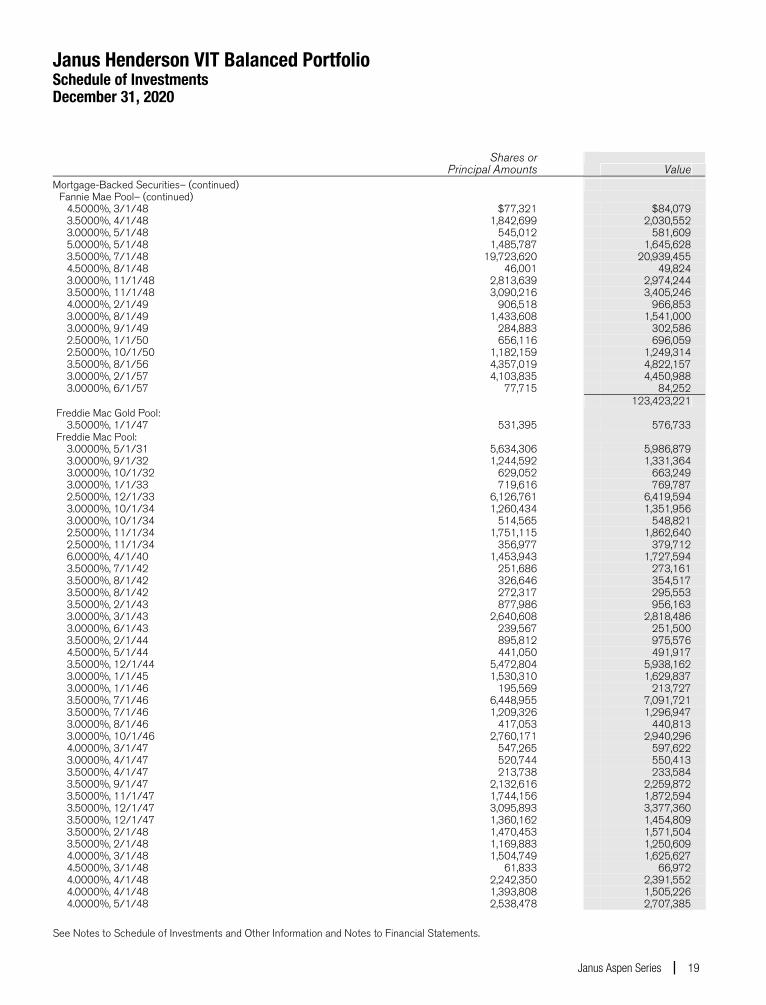
Mortgage-Backed Securities– (continued) Fannie Mae Pool– (continued) 4.5000%, 3/1/48 $77,321 $84,079 3.5000%, 4/1/48 1,842,699 2,030,552 3.0000%, 5/1/48 545,012 581,609 5.0000%, 5/1/48 1,485,787 1,645,628 3.5000%, 7/1/48 19,723,620 20,939,455 4.5000%, 8/1/48 46,001 49,824 3.0000%, 11/1/48 2,813,639 2,974,244 3.5000%, 11/1/48 3,090,216 3,405,246 4.0000%, 2/1/49 906,518 966,853 3.0000%, 8/1/49 1,433,608 1,541,000 3.0000%, 9/1/49 284,883 302,586 2.5000%, 1/1/50 656,116 696,059 2.5000%, 10/1/50 1,182,159 1,249,314 3.5000%, 8/1/56 4,357,019 4,822,157 3.0000%, 2/1/57 4,103,835 4,450,988 3.0000%, 6/1/57 77,715 84,252 123,423,221 Freddie Mac Gold Pool: 3.5000%, 1/1/47 531,395 576,733 Freddie Mac Pool: 3.0000%, 5/1/31 5,634,306 5,986,879 3.0000%, 9/1/32 1,244,592 1,331,364 3.0000%, 10/1/32 629,052 663,249 3.0000%, 1/1/33 719,616 769,787 2.5000%, 12/1/33 6,126,761 6,419,594 3.0000%, 10/1/34 1,260,434 1,351,956 3.0000%, 10/1/34 514,565 548,821 2.5000%, 11/1/34 1,751,115 1,862,640 2.5000%, 11/1/34 356,977 379,712 6.0000%, 4/1/40 1,453,943 1,727,594 3.5000%, 7/1/42 251,686 273,161 3.5000%, 8/1/42 326,646 354,517 3.5000%, 8/1/42 272,317 295,553 3.5000%, 2/1/43 877,986 956,163 3.0000%, 3/1/43 2,640,608 2,818,486 3.0000%, 6/1/43 239,567 251,500 3.5000%, 2/1/44 895,812 975,576 4.5000%, 5/1/44 441,050 491,917 3.5000%, 12/1/44 5,472,804 5,938,162 3.0000%, 1/1/45 1,530,310 1,629,837 3.0000%, 1/1/46 195,569 213,727 3.5000%, 7/1/46 6,448,955 7,091,721 3.5000%, 7/1/46 1,209,326 1,296,947 3.0000%, 8/1/46 417,053 440,813 3.0000%, 10/1/46 2,760,171 2,940,296 4.0000%, 3/1/47 547,265 597,622 3.0000%, 4/1/47 520,744 550,413 3.5000%, 4/1/47 213,738 233,584 3.5000%, 9/1/47 2,132,616 2,259,872 3.5000%, 11/1/47 1,744,156 1,872,594 3.5000%, 12/1/47 3,095,893 3,377,360 3.5000%, 12/1/47 1,360,162 1,454,809 3.5000%, 2/1/48 1,470,453 1,571,504 3.5000%, 2/1/48 1,169,883 1,250,609 4.0000%, 3/1/48 1,504,749 1,625,627 4.5000%, 3/1/48 61,833 66,972 4.0000%, 4/1/48 2,242,350 2,391,552 4.0000%, 4/1/48 1,393,808 1,505,226 4.0000%, 5/1/48 2,538,478 2,707,385
Janus Henderson VIT Balanced Portfolio Schedule of Investments December 31, 2020
See Notes to Schedule of Investments and Other Information and Notes to Financial Statements.
20 DECEMBER 31, 2020
Shares orPrincipal Amounts
Value
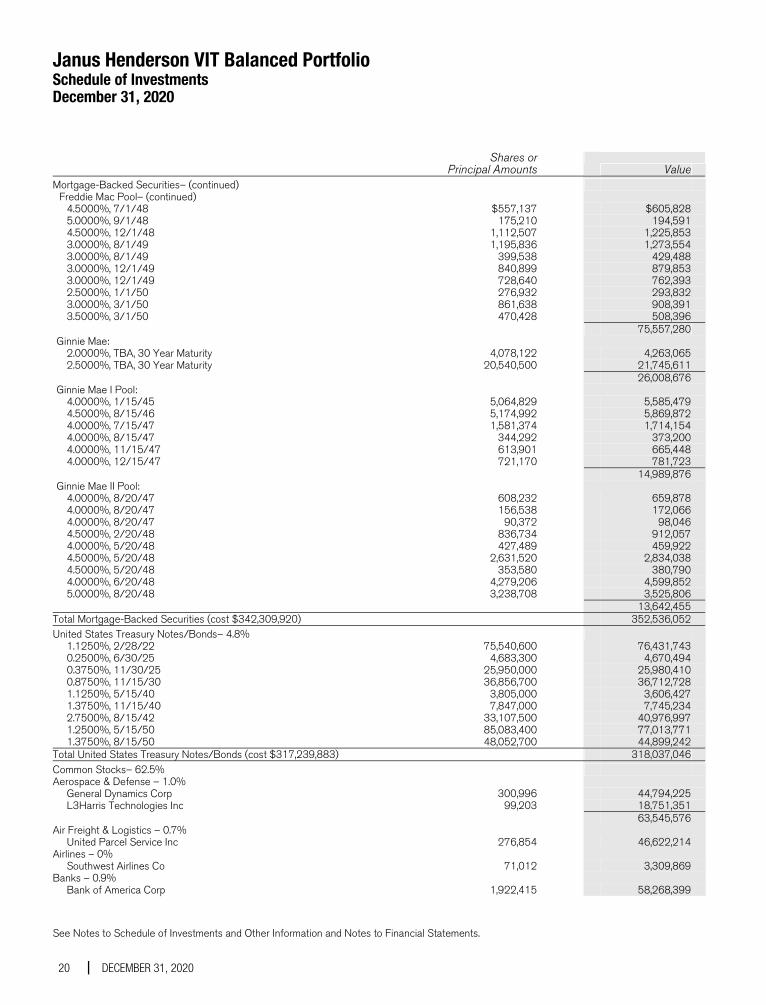
Mortgage-Backed Securities– (continued) Freddie Mac Pool– (continued) 4.5000%, 7/1/48 $557,137 $605,828 5.0000%, 9/1/48 175,210 194,591 4.5000%, 12/1/48 1,112,507 1,225,853 3.0000%, 8/1/49 1,195,836 1,273,554 3.0000%, 8/1/49 399,538 429,488 3.0000%, 12/1/49 840,899 879,853 3.0000%, 12/1/49 728,640 762,393 2.5000%, 1/1/50 276,932 293,832 3.0000%, 3/1/50 861,638 908,391 3.5000%, 3/1/50 470,428 508,396 75,557,280 Ginnie Mae: 2.0000%, TBA, 30 Year Maturity 4,078,122 4,263,065 2.5000%, TBA, 30 Year Maturity 20,540,500 21,745,611 26,008,676 Ginnie Mae I Pool: 4.0000%, 1/15/45 5,064,829 5,585,479 4.5000%, 8/15/46 5,174,992 5,869,872 4.0000%, 7/15/47 1,581,374 1,714,154 4.0000%, 8/15/47 344,292 373,200 4.0000%, 11/15/47 613,901 665,448 4.0000%, 12/15/47 721,170 781,723 14,989,876 Ginnie Mae II Pool: 4.0000%, 8/20/47 608,232 659,878 4.0000%, 8/20/47 156,538 172,066 4.0000%, 8/20/47 90,372 98,046 4.5000%, 2/20/48 836,734 912,057 4.0000%, 5/20/48 427,489 459,922 4.5000%, 5/20/48 2,631,520 2,834,038 4.5000%, 5/20/48 353,580 380,790 4.0000%, 6/20/48 4,279,206 4,599,852 5.0000%, 8/20/48 3,238,708 3,525,806 13,642,455Total Mortgage-Backed Securities (cost $342,309,920) 352,536,052United States Treasury Notes/Bonds– 4.8% 1.1250%, 2/28/22 75,540,600 76,431,743 0.2500%, 6/30/25 4,683,300 4,670,494 0.3750%, 11/30/25 25,950,000 25,980,410 0.8750%, 11/15/30 36,856,700 36,712,728 1.1250%, 5/15/40 3,805,000 3,606,427 1.3750%, 11/15/40 7,847,000 7,745,234 2.7500%, 8/15/42 33,107,500 40,976,997 1.2500%, 5/15/50 85,083,400 77,013,771 1.3750%, 8/15/50 48,052,700 44,899,242Total United States Treasury Notes/Bonds (cost $317,239,883) 318,037,046Common Stocks– 62.5% Aerospace & Defense – 1.0% General Dynamics Corp 300,996 44,794,225 L3Harris Technologies Inc 99,203 18,751,351 63,545,576Air Freight & Logistics – 0.7% United Parcel Service Inc 276,854 46,622,214Airlines – 0% Southwest Airlines Co 71,012 3,309,869Banks – 0.9% Bank of America Corp 1,922,415 58,268,399
Janus Henderson VIT Balanced Portfolio Schedule of Investments December 31, 2020
See Notes to Schedule of Investments and Other Information and Notes to Financial Statements.
Janus Aspen Series 21
Shares orPrincipal Amounts
Value
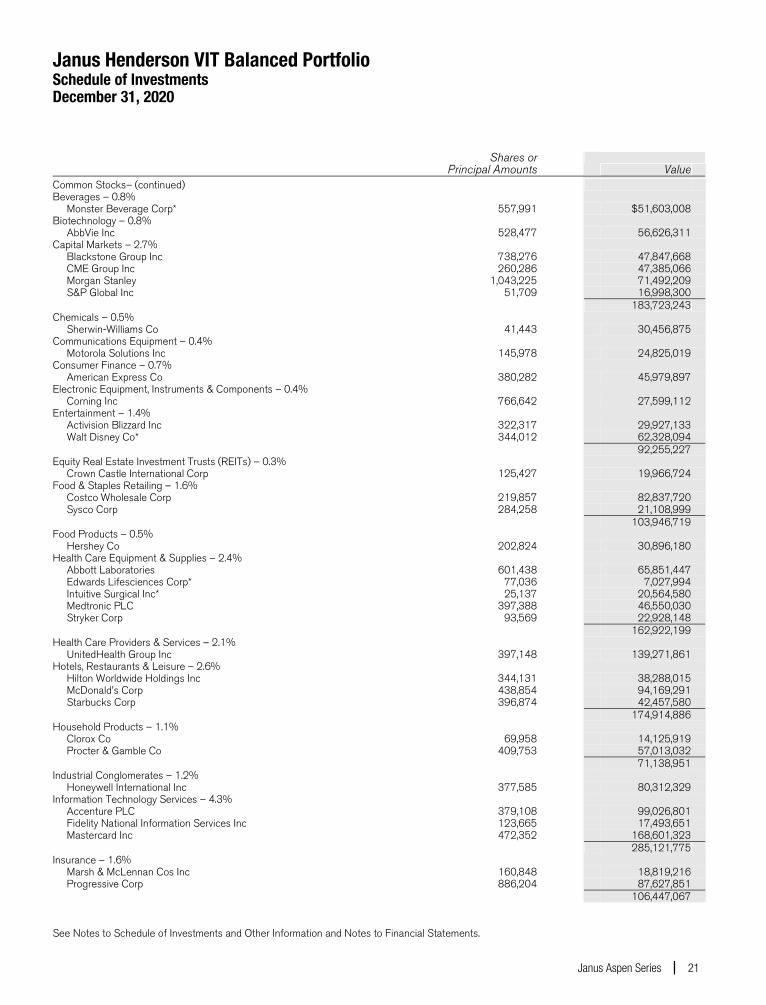
Common Stocks– (continued) Beverages – 0.8% Monster Beverage Corp* 557,991 $51,603,008Biotechnology – 0.8% AbbVie Inc 528,477 56,626,311Capital Markets – 2.7% Blackstone Group Inc 738,276 47,847,668 CME Group Inc 260,286 47,385,066 Morgan Stanley 1,043,225 71,492,209 S&P Global Inc 51,709 16,998,300 183,723,243Chemicals – 0.5% Sherwin-Williams Co 41,443 30,456,875Communications Equipment – 0.4% Motorola Solutions Inc 145,978 24,825,019Consumer Finance – 0.7% American Express Co 380,282 45,979,897Electronic Equipment, Instruments & Components – 0.4% Corning Inc 766,642 27,599,112Entertainment – 1.4% Activision Blizzard Inc 322,317 29,927,133 Walt Disney Co* 344,012 62,328,094 92,255,227Equity Real Estate Investment Trusts (REITs) – 0.3% Crown Castle International Corp 125,427 19,966,724Food & Staples Retailing – 1.6% Costco Wholesale Corp 219,857 82,837,720 Sysco Corp 284,258 21,108,999 103,946,719Food Products – 0.5% Hershey Co 202,824 30,896,180Health Care Equipment & Supplies – 2.4% Abbott Laboratories 601,438 65,851,447 Edwards Lifesciences Corp* 77,036 7,027,994 Intuitive Surgical Inc* 25,137 20,564,580 Medtronic PLC 397,388 46,550,030 Stryker Corp 93,569 22,928,148 162,922,199Health Care Providers & Services – 2.1% UnitedHealth Group Inc 397,148 139,271,861Hotels, Restaurants & Leisure – 2.6% Hilton Worldwide Holdings Inc 344,131 38,288,015 McDonald's Corp 438,854 94,169,291 Starbucks Corp 396,874 42,457,580 174,914,886Household Products – 1.1% Clorox Co 69,958 14,125,919 Procter & Gamble Co 409,753 57,013,032 71,138,951Industrial Conglomerates – 1.2% Honeywell International Inc 377,585 80,312,329Information Technology Services – 4.3% Accenture PLC 379,108 99,026,801 Fidelity National Information Services Inc 123,665 17,493,651 Mastercard Inc 472,352 168,601,323 285,121,775Insurance – 1.6% Marsh & McLennan Cos Inc 160,848 18,819,216 Progressive Corp 886,204 87,627,851 106,447,067
Janus Henderson VIT Balanced Portfolio Schedule of Investments December 31, 2020
See Notes to Schedule of Investments and Other Information and Notes to Financial Statements.
22 DECEMBER 31, 2020
Shares orPrincipal Amounts
Value
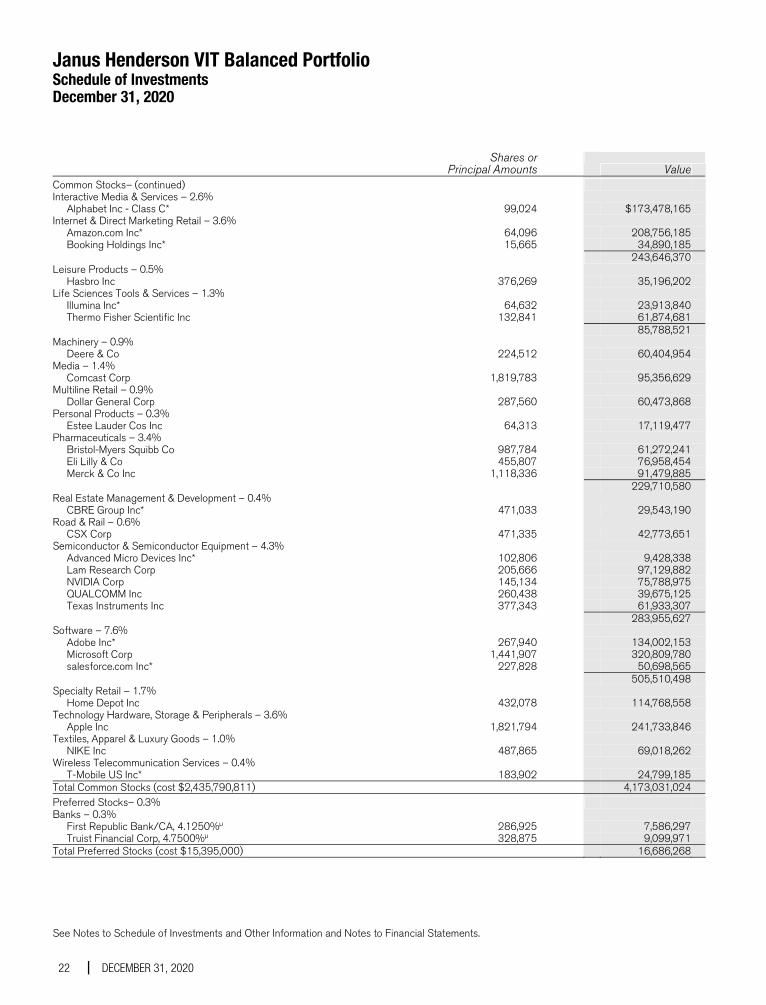
Common Stocks– (continued) Interactive Media & Services – 2.6% Alphabet Inc - Class C* 99,024 $173,478,165Internet & Direct Marketing Retail – 3.6% Amazon.com Inc* 64,096 208,756,185 Booking Holdings Inc* 15,665 34,890,185 243,646,370Leisure Products – 0.5% Hasbro Inc 376,269 35,196,202Life Sciences Tools & Services – 1.3% Illumina Inc* 64,632 23,913,840 Thermo Fisher Scientific Inc 132,841 61,874,681 85,788,521Machinery – 0.9% Deere & Co 224,512 60,404,954Media – 1.4% Comcast Corp 1,819,783 95,356,629Multiline Retail – 0.9% Dollar General Corp 287,560 60,473,868Personal Products – 0.3% Estee Lauder Cos Inc 64,313 17,119,477Pharmaceuticals – 3.4% Bristol-Myers Squibb Co 987,784 61,272,241 Eli Lilly & Co 455,807 76,958,454 Merck & Co Inc 1,118,336 91,479,885 229,710,580Real Estate Management & Development – 0.4% CBRE Group Inc* 471,033 29,543,190Road & Rail – 0.6% CSX Corp 471,335 42,773,651Semiconductor & Semiconductor Equipment – 4.3% Advanced Micro Devices Inc* 102,806 9,428,338 Lam Research Corp 205,666 97,129,882 NVIDIA Corp 145,134 75,788,975 QUALCOMM Inc 260,438 39,675,125 Texas Instruments Inc 377,343 61,933,307 283,955,627Software – 7.6% Adobe Inc* 267,940 134,002,153 Microsoft Corp 1,441,907 320,809,780 salesforce.com Inc* 227,828 50,698,565 505,510,498Specialty Retail – 1.7% Home Depot Inc 432,078 114,768,558Technology Hardware, Storage & Peripherals – 3.6% Apple Inc 1,821,794 241,733,846Textiles, Apparel & Luxury Goods – 1.0% NIKE Inc 487,865 69,018,262Wireless Telecommunication Services – 0.4% T-Mobile US Inc* 183,902 24,799,185Total Common Stocks (cost $2,435,790,811) 4,173,031,024Preferred Stocks– 0.3% Banks – 0.3% First Republic Bank/CA, 4.1250%μ 286,925 7,586,297 Truist Financial Corp, 4.7500%μ 328,875 9,099,971Total Preferred Stocks (cost $15,395,000) 16,686,268
Janus Henderson VIT Balanced Portfolio Schedule of Investments December 31, 2020
See Notes to Schedule of Investments and Other Information and Notes to Financial Statements.
Janus Aspen Series 23
Shares orPrincipal Amounts
Value
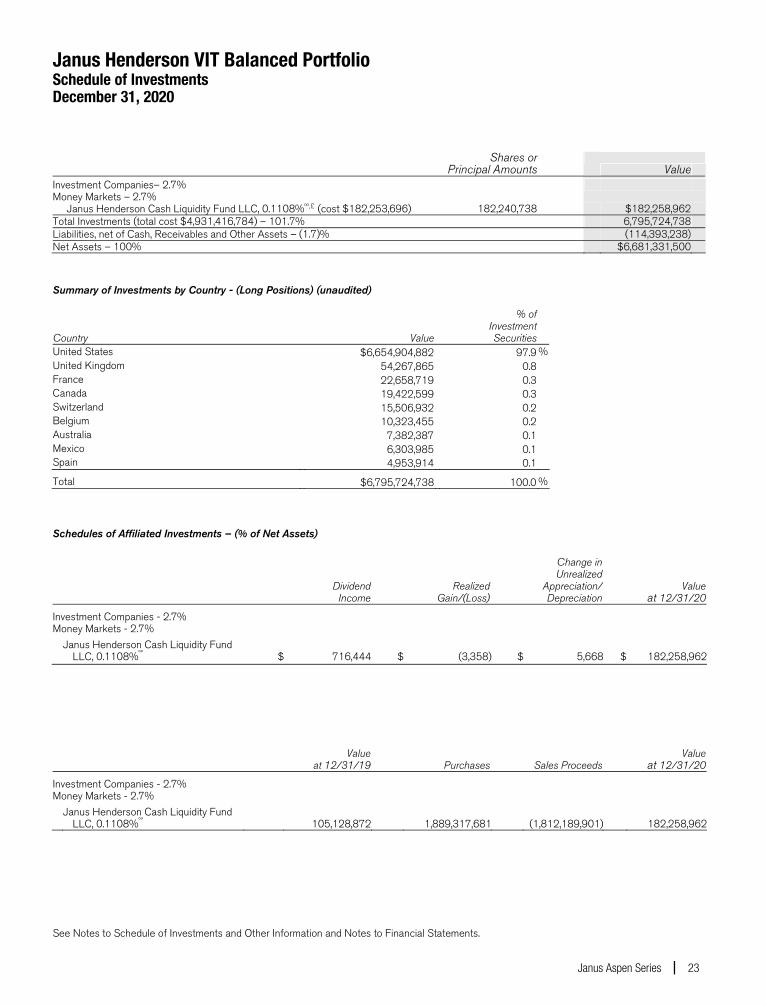
Investment Companies– 2.7% Money Markets – 2.7% Janus Henderson Cash Liquidity Fund LLC, 0.1108%ºº,£((cost $182,253,696) 182,240,738 $182,258,962Total Investments (total cost $4,931,416,784) – 101.7% 6,795,724,738Liabilities, net of Cash, Receivables and Other Assets – (1.7)% (114,393,238)Net Assets – 100% $6,681,331,500 Summary of Investments by Country - (Long Positions) (unaudited) % of Investment Country Value Securities United States $6,654,904,882 97.9 % United Kingdom 54,267,865 0.8 France 22,658,719 0.3 Canada 19,422,599 0.3 Switzerland 15,506,932 0.2 Belgium 10,323,455 0.2 Australia 7,382,387 0.1 Mexico 6,303,985 0.1 Spain 4,953,914 0.1
Total $6,795,724,738 100.0 %
Schedules of Affiliated Investments – (% of Net Assets)
DividendIncome
RealizedGain/(Loss)
Change in Unrealized
Appreciation/ Depreciation
Valueat 12/31/20
Investment Companies - 2.7% Money Markets - 2.7% Janus Henderson Cash Liquidity Fund
LLC, 0.1108%ºº $ 716,444 $ (3,358) $ 5,668 $ 182,258,962
Value at 12/31/19 Purchases Sales Proceeds
Valueat 12/31/20
Investment Companies - 2.7% Money Markets - 2.7% Janus Henderson Cash Liquidity Fund
LLC, 0.1108%ºº 105,128,872 1,889,317,681 (1,812,189,901) 182,258,962
Janus Henderson VIT Balanced Portfolio Notes to Schedule of Investments and Other Information
24 DECEMBER 31, 2020
Balanced Index Balanced Index is an internally-calculated, hypothetical combination of total returns from the S&P 500® Index
(55%) and the Bloomberg Barclays U.S. Aggregate Bond Index (45%).
Bloomberg Barclays U.S. Aggregate Bond Index
Bloomberg Barclays U.S. Aggregate Bond Index is a broad-based measure of the investment grade, US dollar-denominated, fixed-rate taxable bond market.
S&P 500® Index S&P 500® Index reflects U.S. large-cap equity performance and represents broad U.S. equity market performance.
ICE Intercontinental Exchange
LIBOR London Interbank Offered Rate
LLC Limited Liability Company
LP Limited Partnership
PLC Public Limited Company
SOFR Secured Overnight Financing Rate
TBA (To Be Announced) Securities are purchased/sold on a forward commitment basis with an approximate principal amount and no defined maturity date. The actual principal and maturity date will be determined upon settlement when specific mortgage pools are assigned.
144A Securities sold under Rule 144A of the Securities Act of 1933, as amended, are subject to legal and/or contractual restrictions on resale
and may not be publicly sold without registration under the 1933 Act. Unless otherwise noted, these securities have been determined to be liquid under guidelines established by the Board of Trustees. The total value of 144A securities as of the year ended December 31, 2020 is $673,353,732, which represents 10.1% of net assets.
* Non-income producing security.
‡ Variable or floating rate security. Rate shown is the current rate as of December 31, 2020. Certain variable rate securities are not based on a published reference rate and spread; they are determined by the issuer or agent and current market conditions. Reference rate is as of reset date and may vary by security, which may not indicate a reference rate and/or spread in their description.
ÇÇ Security is a U.S. Treasury Inflation-Protected Security (TIPS).
ºº Rate shown is the 7-day yield as of December 31, 2020.
μ Perpetual security. Perpetual securities have no stated maturity date, but they may be called/redeemed by the issuer. The date indicated, if any, represents the next call date.
Ç Step bond. The coupon rate will increase or decrease periodically based upon a predetermined schedule. The rate shown reflects the current rate.
£ The Portfolio may invest in certain securities that are considered affiliated companies. As defined by the Investment Company Act of 1940, as amended, an affiliated company is one in which the Portfolio owns 5% or more of the outstanding voting securities, or a company which is under common ownership or control.
Janus Henderson VIT Balanced Portfolio Notes to Schedule of Investments and Other Information
Janus Aspen Series 25
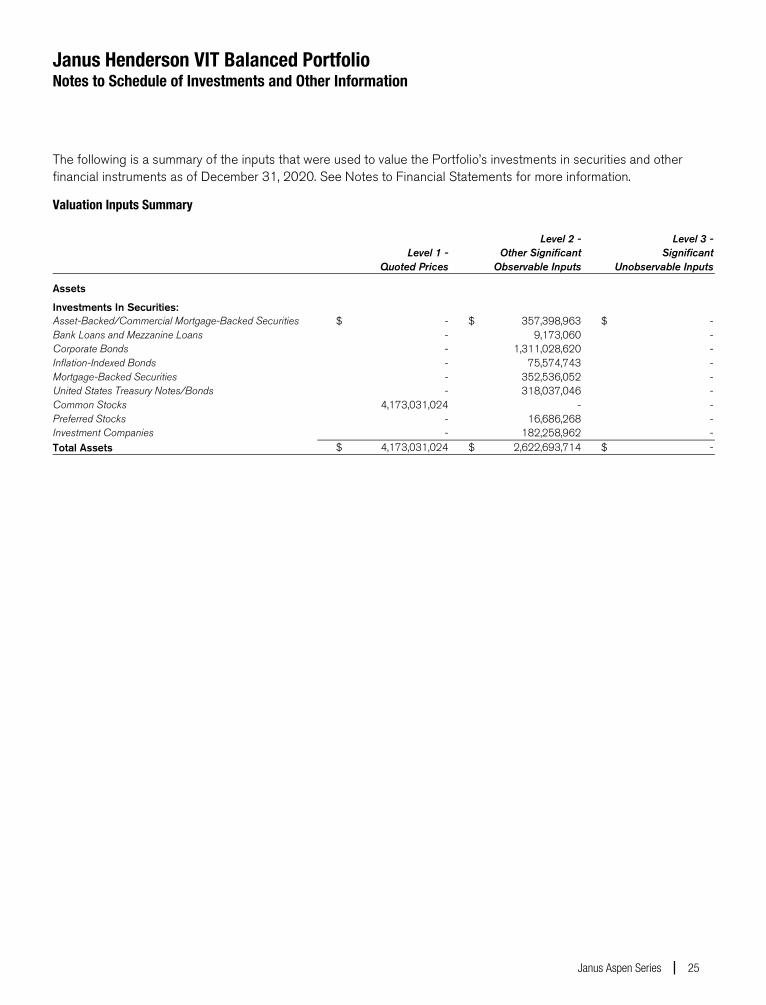
The following is a summary of the inputs that were used to value the Portfolio’s investments in securities and other financial instruments as of December 31, 2020. See Notes to Financial Statements for more information.
Valuation Inputs Summary Level 2 - Level 3 - Level 1 - Other Significant Significant Quoted Prices Observable Inputs Unobservable Inputs
Assets
Investments In Securities: Asset-Backed/Commercial Mortgage-Backed Securities $ - $ 357,398,963 $ -Bank Loans and Mezzanine Loans - 9,173,060 -Corporate Bonds - 1,311,028,620 -Inflation-Indexed Bonds - 75,574,743 -Mortgage-Backed Securities - 352,536,052 -United States Treasury Notes/Bonds - 318,037,046 -Common Stocks 4,173,031,024 - -Preferred Stocks - 16,686,268 -Investment Companies - 182,258,962 -Total Assets $ 4,173,031,024 $ 2,622,693,714 $ -
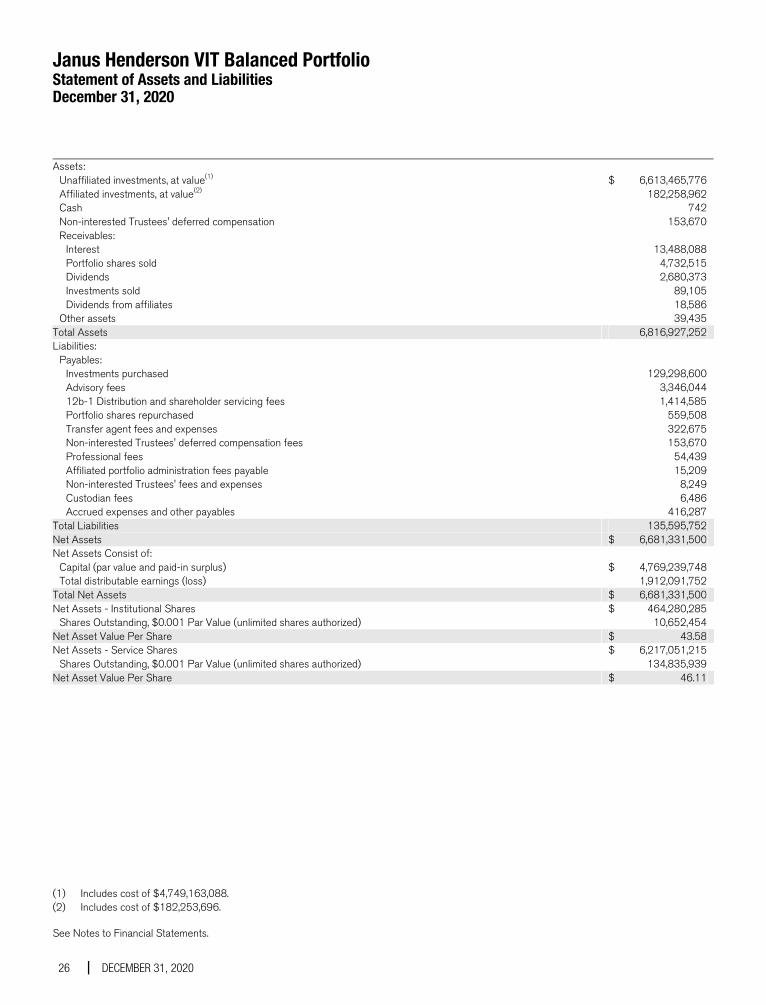
Janus Henderson VIT Balanced Portfolio Statement of Assets and Liabilities December 31, 2020
See Notes to Financial Statements.
26 DECEMBER 31, 2020
Assets: Unaffiliated investments, at value(1) $ 6,613,465,776 Affiliated investments, at value(2) 182,258,962 Cash 742 Non-interested Trustees' deferred compensation 153,670 Receivables: Interest 13,488,088 Portfolio shares sold 4,732,515 Dividends 2,680,373 Investments sold 89,105 Dividends from affiliates 18,586 Other assets 39,435 Total Assets 6,816,927,252 Liabilities: Payables: — Investments purchased 129,298,600 Advisory fees 3,346,044 12b-1 Distribution and shareholder servicing fees 1,414,585 Portfolio shares repurchased 559,508 Transfer agent fees and expenses 322,675 Non-interested Trustees' deferred compensation fees 153,670 Professional fees 54,439 Affiliated portfolio administration fees payable 15,209 Non-interested Trustees' fees and expenses 8,249 Custodian fees 6,486 Accrued expenses and other payables 416,287 Total Liabilities 135,595,752 Net Assets $ 6,681,331,500 Net Assets Consist of: Capital (par value and paid-in surplus) $ 4,769,239,748 Total distributable earnings (loss) 1,912,091,752 Total Net Assets $ 6,681,331,500 Net Assets - Institutional Shares $ 464,280,285 Shares Outstanding, $0.001 Par Value (unlimited shares authorized) 10,652,454 Net Asset Value Per Share $ 43.58 Net Assets - Service Shares $ 6,217,051,215 Shares Outstanding, $0.001 Par Value (unlimited shares authorized) 134,835,939 Net Asset Value Per Share $ 46.11
(1) Includes cost of $4,749,163,088. (2) Includes cost of $182,253,696.
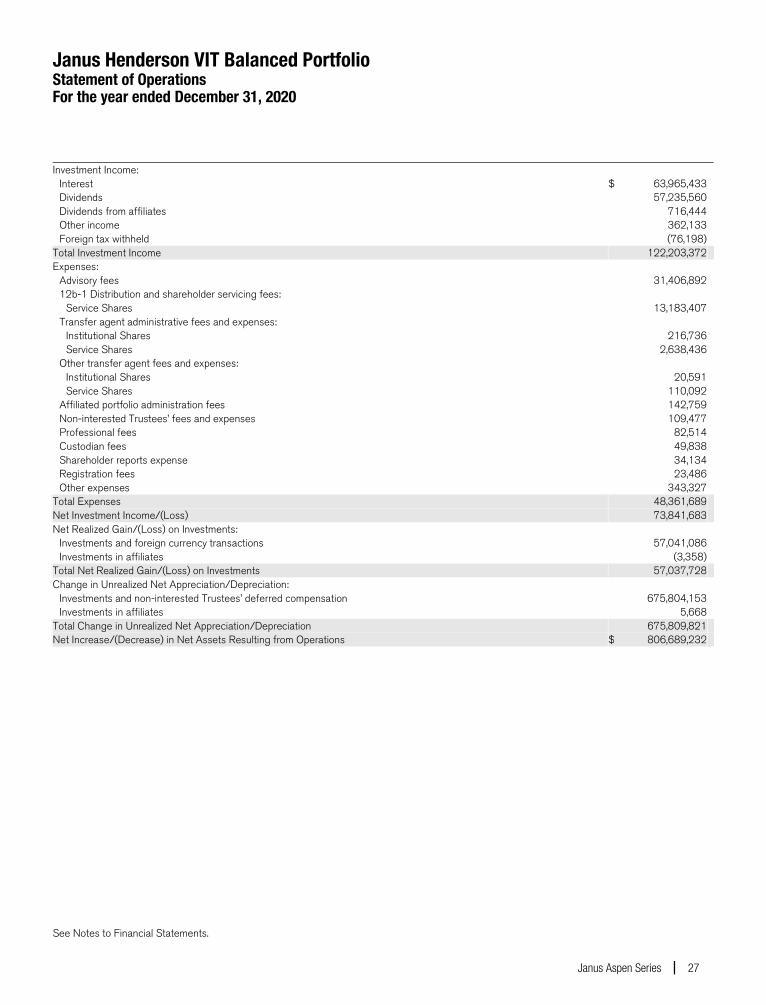
Janus Henderson VIT Balanced Portfolio Statement of Operations For the year ended December 31, 2020
See Notes to Financial Statements.
Janus Aspen Series 27
Investment Income: Interest $ 63,965,433 Dividends 57,235,560 Dividends from affiliates 716,444 Other income 362,133 Foreign tax withheld (76,198) Total Investment Income 122,203,372 Expenses: Advisory fees 31,406,892 12b-1 Distribution and shareholder servicing fees: Service Shares 13,183,407 Transfer agent administrative fees and expenses: Institutional Shares 216,736 Service Shares 2,638,436 Other transfer agent fees and expenses: Institutional Shares 20,591 Service Shares 110,092 Affiliated portfolio administration fees 142,759 Non-interested Trustees’ fees and expenses 109,477 Professional fees 82,514 Custodian fees 49,838 Shareholder reports expense 34,134 Registration fees 23,486 Other expenses 343,327 Total Expenses 48,361,689 Net Investment Income/(Loss) 73,841,683 Net Realized Gain/(Loss) on Investments: Investments and foreign currency transactions 57,041,086 Investments in affiliates (3,358) Total Net Realized Gain/(Loss) on Investments 57,037,728 Change in Unrealized Net Appreciation/Depreciation: Investments and non-interested Trustees’ deferred compensation 675,804,153 Investments in affiliates 5,668 Total Change in Unrealized Net Appreciation/Depreciation 675,809,821 Net Increase/(Decrease) in Net Assets Resulting from Operations $ 806,689,232
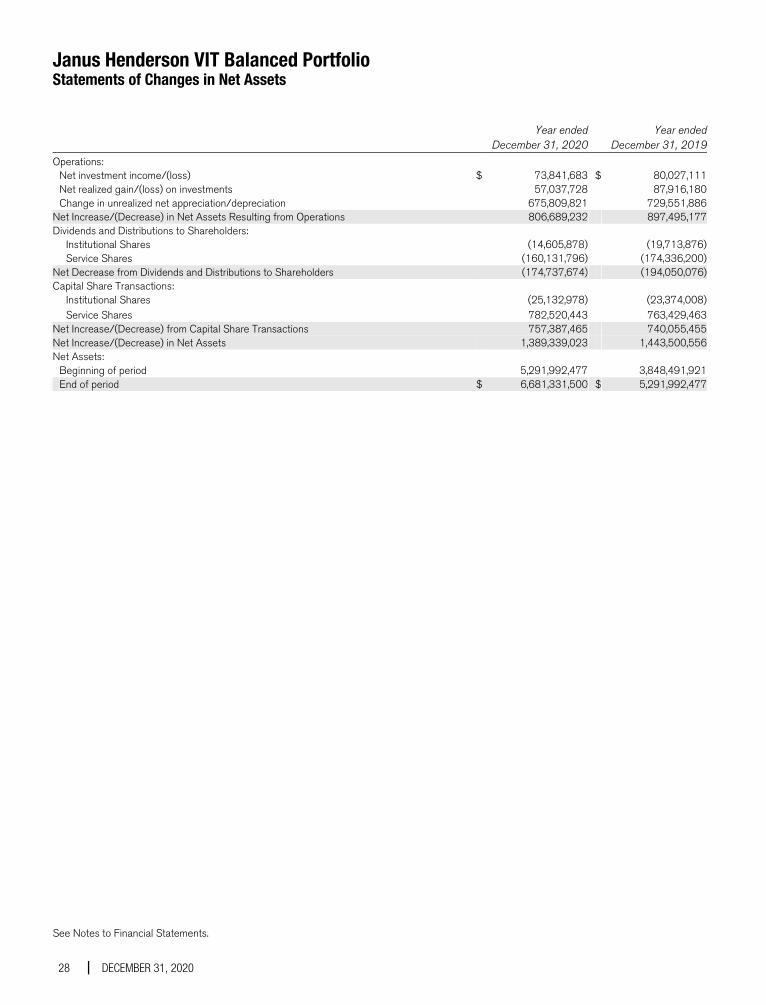
Janus Henderson VIT Balanced Portfolio Statements of Changes in Net Assets
See Notes to Financial Statements.
28 DECEMBER 31, 2020
Year ended
December 31, 2020 Year ended
December 31, 2019
Operations: Net investment income/(loss) $ 73,841,683 $ 80,027,111 Net realized gain/(loss) on investments 57,037,728 87,916,180 Change in unrealized net appreciation/depreciation 675,809,821 729,551,886 Net Increase/(Decrease) in Net Assets Resulting from Operations 806,689,232 897,495,177 Dividends and Distributions to Shareholders: Institutional Shares (14,605,878) (19,713,876) Service Shares (160,131,796) (174,336,200) Net Decrease from Dividends and Distributions to Shareholders (174,737,674) (194,050,076) Capital Share Transactions: Institutional Shares (25,132,978) (23,374,008) Service Shares 782,520,443 763,429,463 Net Increase/(Decrease) from Capital Share Transactions 757,387,465 740,055,455 Net Increase/(Decrease) in Net Assets 1,389,339,023 1,443,500,556 Net Assets: Beginning of period 5,291,992,477 3,848,491,921 End of period $ 6,681,331,500 $ 5,291,992,477
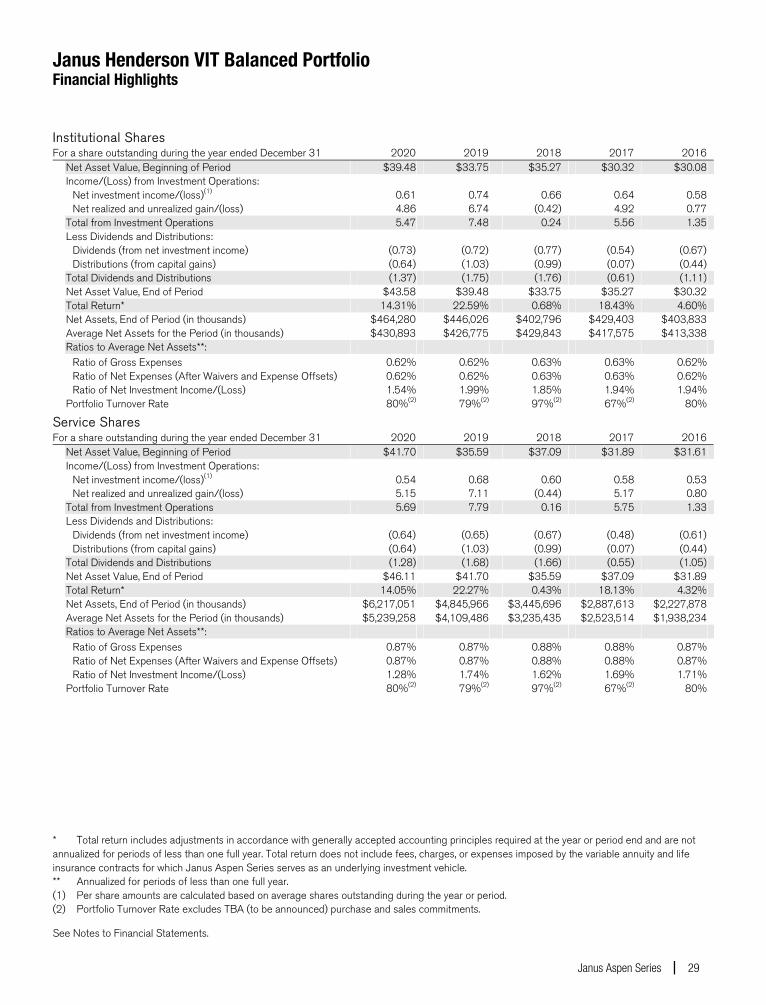
Janus Henderson VIT Balanced Portfolio Financial Highlights
See Notes to Financial Statements.
Janus Aspen Series 29
Institutional Shares For a share outstanding during the year ended December 31 2020 2019 2018 2017 2016 Net Asset Value, Beginning of Period $39.48 $33.75 $35.27 $30.32 $30.08 Income/(Loss) from Investment Operations: Net investment income/(loss)(1) 0.61 0.74 0.66 0.64 0.58 Net realized and unrealized gain/(loss) 4.86 6.74 (0.42) 4.92 0.77 Total from Investment Operations 5.47 7.48 0.24 5.56 1.35 Less Dividends and Distributions: Dividends (from net investment income) (0.73) (0.72) (0.77) (0.54) (0.67) Distributions (from capital gains) (0.64) (1.03) (0.99) (0.07) (0.44) Total Dividends and Distributions (1.37) (1.75) (1.76) (0.61) (1.11) Net Asset Value, End of Period $43.58 $39.48 $33.75 $35.27 $30.32 Total Return* 14.31% 22.59% 0.68% 18.43% 4.60% Net Assets, End of Period (in thousands) $464,280 $446,026 $402,796 $429,403 $403,833 Average Net Assets for the Period (in thousands) $430,893 $426,775 $429,843 $417,575 $413,338 Ratios to Average Net Assets**: Ratio of Gross Expenses 0.62% 0.62% 0.63% 0.63% 0.62% Ratio of Net Expenses (After Waivers and Expense Offsets) 0.62% 0.62% 0.63% 0.63% 0.62% Ratio of Net Investment Income/(Loss) 1.54% 1.99% 1.85% 1.94% 1.94% Portfolio Turnover Rate 80%(2) 79%(2) 97%(2) 67%(2) 80%
Service Shares For a share outstanding during the year ended December 31 2020 2019 2018 2017 2016 Net Asset Value, Beginning of Period $41.70 $35.59 $37.09 $31.89 $31.61 Income/(Loss) from Investment Operations: Net investment income/(loss)(1) 0.54 0.68 0.60 0.58 0.53 Net realized and unrealized gain/(loss) 5.15 7.11 (0.44) 5.17 0.80 Total from Investment Operations 5.69 7.79 0.16 5.75 1.33 Less Dividends and Distributions: Dividends (from net investment income) (0.64) (0.65) (0.67) (0.48) (0.61) Distributions (from capital gains) (0.64) (1.03) (0.99) (0.07) (0.44) Total Dividends and Distributions (1.28) (1.68) (1.66) (0.55) (1.05) Net Asset Value, End of Period $46.11 $41.70 $35.59 $37.09 $31.89 Total Return* 14.05% 22.27% 0.43% 18.13% 4.32% Net Assets, End of Period (in thousands) $6,217,051 $4,845,966 $3,445,696 $2,887,613 $2,227,878 Average Net Assets for the Period (in thousands) $5,239,258 $4,109,486 $3,235,435 $2,523,514 $1,938,234 Ratios to Average Net Assets**: Ratio of Gross Expenses 0.87% 0.87% 0.88% 0.88% 0.87% Ratio of Net Expenses (After Waivers and Expense Offsets) 0.87% 0.87% 0.88% 0.88% 0.87% Ratio of Net Investment Income/(Loss) 1.28% 1.74% 1.62% 1.69% 1.71% Portfolio Turnover Rate 80%(2) 79%(2) 97%(2) 67%(2) 80%
* Total return includes adjustments in accordance with generally accepted accounting principles required at the year or period end and are not annualized for periods of less than one full year. Total return does not include fees, charges, or expenses imposed by the variable annuity and life insurance contracts for which Janus Aspen Series serves as an underlying investment vehicle. ** Annualized for periods of less than one full year. (1) Per share amounts are calculated based on average shares outstanding during the year or period. (2) Portfolio Turnover Rate excludes TBA (to be announced) purchase and sales commitments.
Janus Henderson VIT Balanced Portfolio Notes to Financial Statements
30 DECEMBER 31, 2020
1. Organization and Significant Accounting Policies Janus Henderson VIT Balanced Portfolio (the “Portfolio”) is a series of Janus Aspen Series (the “Trust”), which is organized as a Delaware statutory trust and is registered under the Investment Company Act of 1940, as amended (the “1940 Act”), as an open-end management investment company, and therefore has applied the specialized accounting and reporting guidance in Financial Accounting Standards Board (“FASB”) Accounting Standards Codification (“ASC”) Topic 946. The Trust offers 11 portfolios, each of which offers multiple share classes, with differing investment objectives and policies. The Portfolio seeks long-term capital growth, consistent with preservation of capital and balanced by current income. The Portfolio is classified as diversified, as defined in the 1940 Act.
The Portfolio currently offers two classes of shares: Institutional Shares and Service Shares. Each class represents an interest in the same portfolio of investments. Institutional Shares are offered only in connection with investment in and payments under variable insurance contracts as well as certain qualified retirement plans. Service Shares are offered only in connection with investment in and payments under variable insurance contracts as well as certain qualified retirement plans that require a fee from Portfolio assets to procure distribution and administrative services to contract owners and plan participants.
Shareholders, including other portfolios, participating insurance companies, as well as accounts, may from time to time own (beneficially or of record) a significant percentage of the Portfolio’s Shares and can be considered to “control” the Portfolio when that ownership exceeds 25% of the Portfolio’s assets (and which may differ from control as determined in accordance with United States of America generally accepted accounting priciples ("US GAAP")).
The following accounting policies have been followed by the Portfolio and are in conformity with US GAAP.
Investment Valuation Securities held by the Portfolio are valued in accordance with policies and procedures established by and under the supervision of the Trustees (the “Valuation Procedures”). Equity securities traded on a domestic securities exchange are generally valued at the closing prices on the primary market or exchange on which they trade. If such price is lacking for the trading period immediately preceding the time of determination, such securities are valued at their current bid price. Equity securities that are traded on a foreign exchange are generally valued at the closing prices on such markets. In the event that there is no current trading volume on a particular security in such foreign exchange, the bid price from the primary exchange is generally used to value the security. Securities that are traded on the over-the-counter (“OTC”) markets are generally valued at their closing or latest bid prices as available. Foreign securities and currencies are converted to U.S. dollars using the applicable exchange rate in effect at the close of the New York Stock Exchange (“NYSE”). The Portfolio will determine the market value of individual securities held by it by using prices provided by one or more approved professional pricing services or, as needed, by obtaining market quotations from independent broker-dealers. Most debt securities are valued in accordance with the evaluated bid price supplied by the pricing service that is intended to reflect market value. The evaluated bid price supplied by the pricing service is an evaluation that may consider factors such as security prices, yields, maturities and ratings. Certain short-term securities maturing within 60 days or less may be evaluated and valued on an amortized cost basis provided that the amortized cost determined approximates market value. Securities for which market quotations or evaluated prices are not readily available or deemed unreliable are valued at fair value determined in good faith under the Valuation Procedures. Circumstances in which fair value pricing may be utilized include, but are not limited to: (i) a significant event that may affect the securities of a single issuer, such as a merger, bankruptcy, or significant issuer-specific development; (ii) an event that may affect an entire market, such as a natural disaster or significant governmental action; (iii) a nonsignificant event such as a market closing early or not opening, or a security trading halt; and (iv) pricing of a nonvalued security and a restricted or nonpublic security. Special valuation considerations may apply with respect to “odd-lot” fixed-income transactions which, due to their small size, may receive evaluated prices by pricing services which reflect a large block trade and not what actually could be obtained for the odd-lot position. The Portfolio uses systematic fair valuation models provided by independent third parties to value international equity securities in order to adjust for stale pricing, which may occur between the close of certain foreign exchanges and the close of the NYSE.
Valuation Inputs Summary FASB ASC 820, Fair Value Measurements and Disclosures (“ASC 820”), defines fair value, establishes a framework for measuring fair value, and expands disclosure requirements regarding fair value measurements. This standard emphasizes that fair value is a market-based measurement that should be determined based on the assumptions that
Janus Henderson VIT Balanced Portfolio Notes to Financial Statements
Janus Aspen Series 31
market participants would use in pricing an asset or liability and establishes a hierarchy that prioritizes inputs to valuation techniques used to measure fair value. These inputs are summarized into three broad levels:
Level 1 – Unadjusted quoted prices in active markets the Portfolio has the ability to access for identical assets or liabilities.
Level 2 – Observable inputs other than unadjusted quoted prices included in Level 1 that are observable for the asset or liability either directly or indirectly. These inputs may include quoted prices for the identical instrument on an inactive market, prices for similar instruments, interest rates, prepayment speeds, credit risk, yield curves, default rates and similar data.
Assets or liabilities categorized as Level 2 in the hierarchy generally include: debt securities fair valued in accordance with the evaluated bid or ask prices supplied by a pricing service; securities traded on OTC markets and listed securities for which no sales are reported that are fair valued at the latest bid price (or yield equivalent thereof) obtained from one or more dealers transacting in a market for such securities or by a pricing service approved by the Portfolio’s Trustees; certain short-term debt securities with maturities of 60 days or less that are fair valued at amortized cost; and equity securities of foreign issuers whose fair value is determined by using systematic fair valuation models provided by independent third parties in order to adjust for stale pricing which may occur between the close of certain foreign exchanges and the close of the NYSE. Other securities that may be categorized as Level 2 in the hierarchy include, but are not limited to, preferred stocks, bank loans, swaps, investments in unregistered investment companies, options, and forward contracts.
Level 3 – Unobservable inputs for the asset or liability to the extent that relevant observable inputs are not available, representing the Portfolio’s own assumptions about the assumptions that a market participant would use in valuing the asset or liability, and that would be based on the best information available.
There have been no significant changes in valuation techniques used in valuing any such positions held by the Portfolio since the beginning of the fiscal year.
The inputs or methodology used for fair valuing securities are not necessarily an indication of the risk associated with investing in those securities. The summary of inputs used as of December 31, 2020 to fair value the Portfolio’s investments in securities and other financial instruments is included in the “Valuation Inputs Summary” in the Notes to Schedule of Investments and Other Information.
Investment Transactions and Investment Income Investment transactions are accounted for as of the date purchased or sold (trade date). Dividend income is recorded on the ex-dividend date. Certain dividends from foreign securities will be recorded as soon as the Portfolio is informed of the dividend, if such information is obtained subsequent to the ex-dividend date. Dividends from foreign securities may be subject to withholding taxes in foreign jurisdictions. Interest income is recorded daily on the accrual basis and includes amortization of premiums and accretion of discounts. The Portfolio classifies gains and losses on prepayments received as an adjustment to interest income. Debt securities may be placed in non-accrual status and related interest income may be reduced by stopping current accruals and writing off interest receivables when collection of all or a portion of interest has become doubtful. Gains and losses are determined on the identified cost basis, which is the same basis used for federal income tax purposes. Income, as well as gains and losses, both realized and unrealized, are allocated daily to each class of shares based upon the ratio of net assets represented by each class as a percentage of total net assets.
Expenses The Portfolio bears expenses incurred specifically on its behalf. Each class of shares bears a portion of general expenses, which are allocated daily to each class of shares based upon the ratio of net assets represented by each class as a percentage of total net assets. Expenses directly attributable to a specific class of shares are charged against the operations of such class.
Estimates The preparation of financial statements in conformity with US GAAP requires management to make estimates and assumptions that affect the reported amount of assets and liabilities and disclosure of contingent assets and liabilities at the date of the financial statements, and the reported amounts of income and expenses during the reporting period. Actual results could differ from those estimates.
Janus Henderson VIT Balanced Portfolio Notes to Financial Statements
32 DECEMBER 31, 2020
Indemnifications In the normal course of business, the Portfolio may enter into contracts that contain provisions for indemnification of other parties against certain potential liabilities. The Portfolio’s maximum exposure under these arrangements is unknown, and would involve future claims that may be made against the Portfolio that have not yet occurred. Currently, the risk of material loss from such claims is considered remote.
Foreign Currency Translations The Portfolio does not isolate that portion of the results of operations resulting from the effect of changes in foreign exchange rates on investments from the fluctuations arising from changes in market prices of securities held at the date of the financial statements. Net unrealized appreciation or depreciation of investments and foreign currency translations arise from changes in the value of assets and liabilities, including investments in securities held at the date of the financial statements, resulting from changes in the exchange rates and changes in market prices of securities held.
Currency gains and losses are also calculated on payables and receivables that are denominated in foreign currencies. The payables and receivables are generally related to foreign security transactions and income translations.
Foreign currency-denominated assets and forward currency contracts may involve more risks than domestic transactions, including currency risk, counterparty risk, political and economic risk, regulatory risk and equity risk. Risks may arise from unanticipated movements in the value of foreign currencies relative to the U.S. dollar.
Dividends and Distributions The Portfolio may make semiannual distributions of substantially all of its investment income and an annual distribution of its net realized capital gains (if any).
The Portfolio may make certain investments in real estate investment trusts (“REITs”) which pay dividends to their shareholders based upon funds available from operations. It is quite common for these dividends to exceed the REITs’ taxable earnings and profits, resulting in the excess portion of such dividends being designated as a return of capital. If the Portfolio distributes such amounts, such distributions could constitute a return of capital to shareholders for federal income tax purposes.
Federal Income Taxes The Portfolio intends to continue to qualify as a regulated investment company and distribute all of its taxable income in accordance with the requirements of Subchapter M of the Internal Revenue Code. Management has analyzed the Portfolio’s tax positions taken for all open federal income tax years, generally a three-year period, and has concluded that no provision for federal income tax is required in the Portfolio’s financial statements. The Portfolio is not aware of any tax positions for which it is reasonably possible that the total amounts of unrecognized tax benefits will significantly change in the next twelve months.
2. Other Investments and Strategies
Additional Investment Risk The Portfolio may be invested in lower-rated debt securities that have a higher risk of default or loss of value since these securities may be sensitive to economic changes, political changes, or adverse developments specific to the issuer.
In the aftermath of the 2007-2008 financial crisis, the financial sector experienced reduced liquidity in credit and other fixed-income markets, and an unusually high degree of volatility, both domestically and internationally. In response to the crisis, the United States and certain foreign governments, along with the U.S. Federal Reserve and certain foreign central banks, took a number of unprecedented steps designed to support the financial markets. For example, the enactment of the Dodd-Frank Act in 2010 provided for widespread regulation of financial institutions, consumer financial products and services, broker-dealers, over-the-counter derivatives, investment advisers, credit rating agencies, and mortgage lending, which expanded federal oversight in the financial sector, including the investment management industry. More recently, in response to the COVID-19 pandemic, the U.S. government and the Federal Reserve, as well as certain foreign governments and central banks, have taken extraordinary actions to support local and global economies and the financial markets, including reducing interest rates to record-low levels. Extremely low or negative interest rates may become more prevalent or may not work as intended. As there is little precedent for this situation, the impact on various markets that interest rate or other significant policy changes may have is unknown. The withdrawal of this support, a failure of measures put in place in response to such economic uncertainty, or investor perception that
Janus Henderson VIT Balanced Portfolio Notes to Financial Statements
Janus Aspen Series 33
such efforts were not sufficient could each negatively affect financial markets generally, and the value and liquidity of specific securities. In addition, policy and legislative changes in the United States and in other countries continue to impact many aspects of financial regulation.
Widespread disease, including pandemics and epidemics, and natural or environmental disasters, such as earthquakes, fires, floods, hurricanes, tsunamis and weather-related phenomena generally, have been and can be highly disruptive to economies and markets, adversely impacting individual companies, sectors, industries, markets, currencies, interest and inflation rates, credit ratings, investor sentiment, and other factors affecting the value of a Fund’s investments. Economies and financial markets throughout the world have become increasingly interconnected, which increases the likelihood that events or conditions in one region or country will adversely affect markets or issuers in other regions or countries, including the United States. These disruptions could prevent a Fund from executing advantageous investment decisions in a timely manner and negatively impact a Fund’s ability to achieve its investment objective(s). Any such event(s) could have a significant adverse impact on the value of a Fund. In addition, these disruptions could also impair the information technology and other operational systems upon which the Fund’s service providers, including Janus Capital Management LLC ("Janus Capital") or the subadviser (as applicable), rely, and could otherwise disrupt the ability of employees of the Fund’s service providers to perform essential tasks on behalf of the Fund. Adverse weather conditions may also have a particularly significant negative effect on issuers in the agricultural sector and on insurance and reinsurance companies that insure or reinsure against the impact of natural disasters.
A number of countries in the European Union (the “EU”) have experienced, and may continue to experience, severe economic and financial difficulties. In particular, many EU nations are susceptible to economic risks associated with high levels of debt. Many non-governmental issuers, and even certain governments, have defaulted on, or been forced to restructure, their debts. Many other issuers have faced difficulties obtaining credit or refinancing existing obligations. Financial institutions have in many cases required government or central bank support, have needed to raise capital, and/or have been impaired in their ability to extend credit. As a result, financial markets in the EU have experienced extreme volatility and declines in asset values and liquidity. These difficulties may continue, worsen, or spread further within the EU. Responses to these financial problems by European governments, central banks, and others, including austerity measures and reforms, may not work, may result in social unrest, and may limit future growth and economic recovery or have other unintended consequences. The risk of investing in securities in the European markets may also be heightened due to the referendum in which the United Kingdom voted to exit the EU, commonly known as “Brexit,” which immediately led to significant market volatility around the world, as well as political, economic and legal uncertainty. The United Kingdom formally left the EU on January 31, 2020 and entered into an eleven-month transition period, which expired on December 31, 2020. The negative impact on not only the United Kingdom and European economies could be significant, potentially resulting in increased volatility and illiquidity and lower economic growth for companies that rely significantly on the United Kingdom and/or Europe for their business activities and revenues. Any further exits from the EU, or an increase in the belief that such exits are likely or possible, would likely cause additional market disruption globally and introduce new legal and regulatory uncertainties.
Inflation-Linked Securities The Portfolio may invest in inflation-indexed bonds, including municipal inflation-indexed bonds and corporate inflation-indexed bonds, or in derivatives that are linked to these securities. Inflation-linked bonds are fixed-income securities that have a principal value that is periodically adjusted according to the rate of inflation. If an index measuring inflation falls, the principal value of inflation-indexed bonds will typically be adjusted downward, and consequently the interest payable on these securities (calculated with respect to a smaller principal amount) will be reduced. Because of their inflation adjustment feature, inflation-linked bonds typically have lower yields than conventional fixed-rate bonds. In addition, inflation-linked bonds also normally decline in price when real interest rates rise. In the event of deflation, when prices decline over time, the principal and income of inflation-linked bonds would likely decline, resulting in losses to the Portfolio.
In the case of Treasury Inflation-Protected Securities, also known as TIPS, repayment of original bond principal upon maturity (as adjusted for inflation) is guaranteed by the U.S. Treasury. For inflation-linked bonds that do not provide a similar guarantee, the adjusted principal value of the inflation-linked bond repaid at maturity may be less than the original principal. Other non-U.S. sovereign governments also issue inflation-linked securities (sometimes referred to as “linkers”) that are tied to their own local consumer price indices. In certain of these non-U.S. jurisdictions, the repayment of the original bond principal upon the maturity of an inflation-linked bond is not guaranteed, allowing for the amount of the bond repaid at maturity to be less than par. Inflation-linked bonds may also be issued by, or related to, sovereign
Janus Henderson VIT Balanced Portfolio Notes to Financial Statements
34 DECEMBER 31, 2020
governments of other developed countries, emerging market countries, or companies or other entities not affiliated with governments.
Loans The Portfolio may invest in various commercial loans, including bank loans, bridge loans, debtor-in-possession (“DIP”) loans, mezzanine loans, and other fixed and floating rate loans. These loans may be acquired through loan participations and assignments or on a when-issued basis. Commercial loans will comprise no more than 20% of the Portfolio’s total assets. Below are descriptions of the types of loans held by the Portfolio as of December 31, 2020.
• Bank Loans - Bank loans are obligations of companies or other entities entered into in connection with recapitalizations, acquisitions, and refinancings. The Portfolio’s investments in bank loans are generally acquired as a participation interest in, or assignment of, loans originated by a lender or other financial institution. These investments may include institutionally-traded floating and fixed-rate debt securities.
• Floating Rate Loans – Floating rate loans are debt securities that have floating interest rates, that adjust periodically, and are tied to a benchmark lending rate, such as London Interbank Offered Rate (“LIBOR”). In other cases, the lending rate could be tied to the prime rate offered by one or more major U.S. banks or the rate paid on large certificates of deposit traded in the secondary markets. If the benchmark lending rate changes, the rate payable to lenders under the loan will change at the next scheduled adjustment date specified in the loan agreement. Floating rate loans are typically issued to companies (‘‘borrowers’’) in connection with recapitalizations, acquisitions, and refinancings. Floating rate loan investments are generally below investment grade. Senior floating rate loans are secured by specific collateral of a borrower and are senior in the borrower’s capital structure. The senior position in the borrower’s capital structure generally gives holders of senior loans a claim on certain of the borrower’s assets that is senior to subordinated debt and preferred and common stock in the case of a borrower’s default. Floating rate loan investments may involve foreign borrowers, and investments may be denominated in foreign currencies. Floating rate loans often involve borrowers whose financial condition is troubled or uncertain and companies that are highly leveraged. The Portfolio may invest in obligations of borrowers who are in bankruptcy proceedings. While the Portfolio generally expects to invest in fully funded term loans, certain of the loans in which the Portfolio may invest include revolving loans, bridge loans, and delayed draw term loans.
Purchasers of floating rate loans may pay and/or receive certain fees. The Portfolio may receive fees such as covenant waiver fees or prepayment penalty fees. The Portfolio may pay fees such as facility fees. Such fees may affect the Portfolio’s return.
• Mezzanine Loans - Mezzanine loans are secured by the stock of the company that owns the assets. Mezzanine loans are a hybrid of debt and equity financing that is typically used to fund the expansion of existing companies. A mezzanine loan is composed of debt capital that gives the lender the right to convert to an ownership or equity interest in the company if the loan is not paid back in time and in full. Mezzanine loans typically are the most subordinated debt obligation in an issuer’s capital structure.
Mortgage- and Asset-Backed Securities Mortgage- and asset-backed securities represent interests in “pools” of commercial or residential mortgages or other assets, including consumer and commercial loans or receivables. The Portfolio may purchase fixed or variable rate commercial or residential mortgage-backed securities issued by the Government National Mortgage Association (“Ginnie Mae”), the Federal National Mortgage Association (“Fannie Mae”), the Federal Home Loan Mortgage Corporation (“Freddie Mac”), or other governmental or government-related entities. Ginnie Mae’s guarantees are backed as to the timely payment of principal and interest by the full faith and credit of the U.S. Government. Fannie Mae and Freddie Mac securities are not backed by the full faith and credit of the U.S. Government. In September 2008, the Federal Housing Finance Agency (“FHFA”), an agency of the U.S. Government, placed Fannie Mae and Freddie Mac under conservatorship. Since that time, Fannie Mae and Freddie Mac have received capital support through U.S. Treasury preferred stock purchases and Treasury and Federal Reserve purchases of their mortgage-backed securities. The FHFA and the U.S. Treasury have imposed strict limits on the size of these entities’ mortgage portfolios. The FHFA has the power to cancel any contract entered into by Fannie Mae and Freddie Mac prior to FHFA’s appointment as conservator or receiver, including the guarantee obligations of Fannie Mae and Freddie Mac.
The Portfolio may also purchase other mortgage- and asset-backed securities through single- and multi-seller conduits, collateralized debt obligations, structured investment vehicles, and other similar securities. Asset-backed securities may
Janus Henderson VIT Balanced Portfolio Notes to Financial Statements
Janus Aspen Series 35
be backed by various consumer obligations, including automobile loans, equipment leases, credit card receivables, or other collateral. In the event the underlying loans are not paid, the securities’ issuer could be forced to sell the assets and recognize losses on such assets, which could impact your return. Unlike traditional debt instruments, payments on these securities include both interest and a partial payment of principal. Mortgage- and asset-backed securities are subject to both extension risk, where borrowers pay off their debt obligations more slowly in times of rising interest rates, and prepayment risk, where borrowers pay off their debt obligations sooner than expected in times of declining interest rates. These risks may reduce the Portfolio’s returns. In addition, investments in mortgage- and asset-backed securities, including those comprised of subprime mortgages, may be subject to a higher degree of credit risk, valuation risk, extension risk (if interest rates rise), and liquidity risk than various other types of fixed-income securities. Additionally, although mortgage-backed securities are generally supported by some form of government or private guarantee and/or insurance, there is no assurance that guarantors or insurers will meet their obligations.
Real Estate Investing The Portfolio may invest in equity and debt securities of real estate-related companies. Such companies may include those in the real estate industry or real estate-related industries. These securities may include common stocks, corporate bonds, preferred stocks, and other equity securities, including, but not limited to, mortgage-backed securities, real estate-backed securities, securities of REITs and similar REIT-like entities. A REIT is a trust that invests in real estate-related projects, such as properties, mortgage loans, and construction loans. REITs are generally categorized as equity, mortgage, or hybrid REITs. A REIT may be listed on an exchange or traded OTC.
Sovereign Debt The Portfolio may invest in U.S. and non-U.S. government debt securities (“sovereign debt”). Some investments in sovereign debt, such as U.S. sovereign debt, are considered low risk. However, investments in sovereign debt, especially the debt of less developed countries, can involve a high degree of risk, including the risk that the governmental entity that controls the repayment of sovereign debt may not be willing or able to repay the principal and/or to pay the interest on its sovereign debt in a timely manner. A sovereign debtor’s willingness or ability to satisfy its debt obligation may be affected by various factors including, but not limited to, its cash flow situation, the extent of its foreign currency reserves, the availability of foreign exchange when a payment is due, the relative size of its debt position in relation to its economy as a whole, the sovereign debtor’s policy toward international lenders, and local political constraints to which the governmental entity may be subject. Sovereign debtors may also be dependent on expected disbursements from foreign governments, multilateral agencies, and other entities. The failure of a sovereign debtor to implement economic reforms, achieve specified levels of economic performance, or repay principal or interest when due may result in the cancellation of third party commitments to lend funds to the sovereign debtor, which may further impair such debtor’s ability or willingness to timely service its debts. The Portfolio may be requested to participate in the rescheduling of such sovereign debt and to extend further loans to governmental entities, which may adversely affect the Portfolio’s holdings. In the event of default, there may be limited or no legal remedies for collecting sovereign debt and there may be no bankruptcy proceedings through which the Portfolio may collect all or part of the sovereign debt that a governmental entity has not repaid. In addition, to the extent the Portfolio invests in non-U.S. sovereign debt, it may be subject to currency risk.
TBA Commitments The Portfolio may enter into “to be announced” or “TBA” commitments. TBAs are forward agreements for the purchase or sale of securities, including mortgage-backed securities, for a fixed price, with payment and delivery on an agreed upon future settlement date. The specific securities to be delivered are not identified at the trade date. However, delivered securities must meet specified terms, including issuer, rate, and mortgage terms. Although the particular TBA securities must meet industry-accepted “good delivery” standards, there can be no assurance that a security purchased on forward commitment basis will ultimately be issued or delivered by the counterparty. During the settlement period, the Portfolio will still bear the risk of any decline in the value of the security to be delivered. Because TBA commitments do not require the purchase and sale of identical securities, the characteristics of the security delivered to the Portfolio may be less favorable than the security delivered to the dealer. If the counterparty to a transaction fails to deliver the security, the Portfolio could suffer a loss.
When-Issued, Delayed Delivery and Forward Commitment Transactions The Portfolio may purchase or sell securities on a when-issued, delayed delivery, or forward commitment basis. When purchasing a security on a when-issued, delayed delivery, or forward commitment basis, the Portfolio assumes the rights and risks of ownership of the security, including the risk of price and yield fluctuations, and takes such fluctuations into
Janus Henderson VIT Balanced Portfolio Notes to Financial Statements
36 DECEMBER 31, 2020
account when determining its net asset value. Typically, no income accrues on securities the Portfolio has committed to purchase prior to the time delivery of the securities is made. Because the Portfolio is not required to pay for the security until the delivery date, these risks are in addition to the risks associated with the Portfolio’s other investments. If the other party to a transaction fails to deliver the securities, the Portfolio could miss a favorable price or yield opportunity. If the Portfolio remains substantially fully invested at a time when when-issued, delayed delivery, or forward commitment purchases are outstanding, the purchases may result in a form of leverage.
When the Portfolio has sold a security on a when-issued, delayed delivery, or forward commitment basis, the Portfolio does not participate in future gains or losses with respect to the security. If the other party to a transaction fails to pay for the securities, the Portfolio could suffer a loss. Additionally, when selling a security on a when-issued, delayed delivery, or forward commitment basis without owning the security, the Portfolio will incur a loss if the security’s price appreciates in value such that the security’s price is above the agreed upon price on the settlement date. The Portfolio may dispose of or renegotiate a transaction after it is entered into, and may purchase or sell when-issued, delayed delivery or forward commitment securities before the settlement date, which may result in a gain or loss.
3. Investment Advisory Agreements and Other Transactions with Affiliates The Portfolio pays Janus Capital Management LLC (“Janus Capital”) an investment advisory fee which is calculated daily and paid monthly. The Portfolio’s contractual investment advisory fee rate (expressed as an annual rate) is 0.55% of its average daily net assets.
Janus Services LLC (“Janus Services”), a wholly-owned subsidiary of Janus Capital, is the Portfolio’s transfer agent. Janus Services receives an administrative services fee at an annual rate of 0.05% of the average daily net assets of the Portfolio for arranging for the provision by participating insurance companies and qualified plan service providers of administrative services, including recordkeeping, subaccounting, order processing, or other shareholder services provided on behalf of contract holders or plan participants investing in the Portfolio. Other shareholder services may include the provision of order confirmations, periodic account statements, forwarding prospectuses, shareholder reports, and other materials to existing investors, and answering inquiries regarding accounts. Janus Services expects to use this entire fee to compensate insurance companies and qualified plan service providers for providing these services to their customers who invest in the Portfolio. Any unused portion will be reimbursed to the applicable share class at least annually.
In addition, Janus Services provides or arranges for the provision of certain other internal administrative, recordkeeping, and shareholder relations services for the Portfolio. Janus Services is not compensated for these internal services related to the shares, except for out-of-pocket costs. These amounts are disclosed as “Other transfer agent fees and expenses” on the Statement of Operations.
Under a distribution and shareholder servicing plan (the “Plan”) adopted in accordance with Rule 12b-1 under the 1940 Act, the Service Shares may pay the Trust’s distributor, Janus Distributors LLC (“Janus Distributors”), a wholly-owned subsidiary of Janus Capital, a fee for the sale and distribution and/or shareholder servicing of the Service Shares at an annual rate of up to 0.25% of the average daily net assets of the Service Shares. Under the terms of the Plan, the Trust is authorized to make payments to Janus Distributors for remittance to insurance companies and qualified plan service providers as compensation for distribution and/or shareholder services performed by such entities. These amounts are disclosed as “12b-1 Distribution and shareholder servicing fees” on the Statement of Operations. Payments under the Plan are not tied exclusively to actual 12b-1 distribution and servicing fees, and the payments may exceed 12b-1 distribution and servicing fees actually incurred. If any of the Portfolio’s actual 12b-1 distribution and servicing fees incurred during a calendar year are less than the payments made during a calendar year, the Portfolio will be refunded the difference. Refunds, if any, are included in “12b-1 Distribution and shareholder servicing fees” in the Statement of Operations.
Janus Capital serves as administrator to the Portfolio pursuant to an administration agreement between Janus Capital and the Trust. Under the administration agreement, Janus Capital is obligated to provide or arrange for the provision of certain administration, compliance, and accounting services to the Portfolio, including providing office space for the Portfolio, and is reimbursed by the Portfolio for certain of its costs in providing these services (to the extent Janus Capital seeks reimbursement and such costs are not otherwise waived). In addition, employees of Janus Capital and/or its affiliates may serve as officers of the Trust. The Portfolio pays for some or all of the salaries, fees, and expenses of Janus Capital employees and Portfolio officers, with respect to certain specified administration functions they perform on behalf of the Portfolio. The Portfolio pays these costs based on out-of-pocket expenses incurred by Janus Capital,
Janus Henderson VIT Balanced Portfolio Notes to Financial Statements
Janus Aspen Series 37
and these costs are separate and apart from advisory fees and other expenses paid in connection with the investment advisory services Janus Capital (or any subadvisor, as applicable) provides to the Portfolio. These amounts are disclosed as “Affiliated portfolio administration fees” on the Statement of Operations. In addition, some expenses related to compensation payable to the Portfolio’s Chief Compliance Officer and certain compliance staff, all of whom are employees of Janus Capital and/or its affiliates, are shared with the Portfolio. Total compensation of $34,973 was paid to the Chief Compliance Officer and certain compliance staff by the Trust during the year ended December 31, 2020. The Portfolio's portion is reported as part of “Other expenses” on the Statement of Operations.
The Board of Trustees has adopted a deferred compensation plan (the “Deferred Plan”) for independent Trustees to elect to defer receipt of all or a portion of the annual compensation they are entitled to receive from the Portfolio. All deferred fees are credited to an account established in the name of the Trustees. The amounts credited to the account then increase or decrease, as the case may be, in accordance with the performance of one or more of the Janus Henderson funds that are selected by the Trustees. The account balance continues to fluctuate in accordance with the performance of the selected fund or funds until final payment of all amounts are credited to the account. The fluctuation of the account balance is recorded by the Portfolio as unrealized appreciation/(depreciation) and is included as of December 31, 2020 on the Statement of Assets and Liabilities in the asset, “Non-interested Trustees’ deferred compensation,” and liability, “Non-interested Trustees’ deferred compensation fees.” Additionally, the recorded unrealized appreciation/(depreciation) is included in “Total distributable earnings (loss)” on the Statement of Assets and Liabilities. Deferred compensation expenses for the year ended December 31, 2020 are included in “Non-interested Trustees’ fees and expenses” on the Statement of Operations. Trustees are allowed to change their designation of mutual funds from time to time. Amounts will be deferred until distributed in accordance with the Deferred Plan. Deferred fees of $471,450 were paid by the Trust to the Trustees under the Deferred Plan during the year ended December 31, 2020.
Pursuant to the provisions of the 1940 Act and related rules, the Portfolio may participate in an affiliated or non-affiliated cash sweep program. In the cash sweep program, uninvested cash balances of the Portfolio may be used to purchase shares of affiliated or non-affiliated money market funds or cash management pooled investment vehicles that operate as money market funds. The Portfolio is eligible to participate in the cash sweep program (the “Investing Funds”). As adviser, Janus Capital has an inherent conflict of interest because of its fiduciary duties to the affiliated money market funds or cash management pooled investment vehicles and the Investing Funds. Janus Henderson Cash Liquidity Fund LLC (the “Sweep Vehicle”) is an affiliated unregistered cash management pooled investment vehicle that invests primarily in highly-rated short-term fixed-income securities. The Sweep Vehicle operates pursuant to the provisions of the 1940 Act that govern the operation of money market funds and prices its shares at NAV reflecting market-based values of its portfolio securities (i.e., a “floating” NAV) rounded to the fourth decimal place (e.g., $1.0000). The Sweep Vehicle is permitted to impose a liquidity fee (of up to 2%) on redemptions from the Sweep Vehicle or a redemption gate that temporarily suspends redemptions from the Sweep Vehicle for up to 10 business days during a 90 day period. There are no restrictions on the Portfolio's ability to withdraw investments from the Sweep Vehicle at will, and there are no unfunded capital commitments due from the Portfolio to the Sweep Vehicle. The Sweep Vehicle does not charge any management fee, sales charge or service fee.
Any purchases and sales, realized gains/losses and recorded dividends from affiliated investments during the year ended December 31, 2020 can be found in the “Schedules of Affiliated Investments” located in the Schedule of Investments.
The Portfolio is permitted to purchase or sell securities (“cross-trade”) between itself and other funds or accounts managed by Janus Capital in accordance with Rule 17a-7 under the Investment Company Act of 1940 (“Rule 17a-7”), when the transaction is consistent with the investment objectives and policies of the Portfolio and in accordance with the Internal Cross Trade Procedures adopted by the Trust’s Board of Trustees. These procedures have been designed to ensure that any cross-trade of securities by the Portfolio from or to another fund or account that is or could be considered an affiliate of the Portfolio under certain limited circumstances by virtue of having a common investment adviser, common Officer, or common Trustee complies with Rule 17a-7. Under these procedures, each cross-trade is effected at the current market price to save costs where allowed. During the year ended December 31, 2020, the Portfolio engaged in cross trades amounting to $25,893,453 in purchases and $19,858,633 in sales, resulting in a net realized gain of $749,155. The net realized gain is included within the “Net Realized Gain/(Loss) on Investments” section of the Portfolio’s Statement of Operations.
Janus Henderson VIT Balanced Portfolio Notes to Financial Statements
38 DECEMBER 31, 2020
4. Federal Income Tax The tax components of capital shown in the table below represent: (1) distribution requirements the Portfolio must satisfy under the income tax regulations; (2) losses or deductions the Portfolio may be able to offset against income and gains realized in future years; and (3) unrealized appreciation or depreciation of investments for federal income tax purposes.
Other book to tax differences primarily consist of deferred compensation. The Portfolio has elected to treat gains and losses on forward foreign currency contracts as capital gains and losses, if applicable. Other foreign currency gains and losses on debt instruments are treated as ordinary income for federal income tax purposes pursuant to Section 988 of the Internal Revenue Code.
Loss Deferrals Other Book Net Tax Undistributed
Ordinary IncomeUndistributed
Long-Term GainsAccumulated
Capital LossesLate-Year
Ordinary LossPost-October Capital Loss
to Tax Differences
Appreciation/(Depreciation)
$ 25,337,095 $ 40,603,763 $ - $ - $ - $ (149,551) $1,846,300,445
The aggregate cost of investments and the composition of unrealized appreciation and depreciation of investment securities for federal income tax purposes as of December 31, 2020 are noted below. The primary differences between book and tax appreciation or depreciation of investments are wash sale loss deferrals and investments in partnerships.
Federal Tax Cost Unrealized
AppreciationUnrealized
(Depreciation)Net Tax Appreciation/
(Depreciation) $ 4,949,424,293 $1,857,856,131 $(11,555,686) $ 1,846,300,445
Income and capital gains distributions are determined in accordance with income tax regulations that may differ from US GAAP. These differences are due to differing treatments for items such as net short-term gains, deferral of wash sale losses, foreign currency transactions, and capital loss carryovers. Certain permanent differences such as tax returns of capital and net investment losses noted below have been reclassified to capital.
For the year ended December 31, 2020 Distributions
From Ordinary Income From Long-Term Capital Gains Tax Return of Capital Net Investment Loss
$ 122,041,226 $ 52,696,448 $ - $ -
For the year ended December 31, 2019 Distributions
From Ordinary Income From Long-Term Capital Gains Tax Return of Capital Net Investment Loss $ 77,976,625 $ 116,073,451 $ - $ -
Permanent book to tax basis differences may result in reclassifications between the components of net assets. These differences have no impact on the results of operations or net assets. The following reclassifications have been made to the Portfolio:
Increase/(Decrease) to Capital
Increase/(Decrease) to UndistributedNet Investment Income/Loss
Increase/(Decrease) to Undistributed Net Realized Gain/Loss
$ 1 $ 5,948,073 $ (5,948,074)
Janus Henderson VIT Balanced Portfolio Notes to Financial Statements
Janus Aspen Series 39
5. Capital Share Transactions Year ended December 31, 2020 Year ended December 31, 2019 Shares Amount Shares Amount
Institutional Shares: Shares sold 833,472 $ 32,931,124 761,195 $ 28,340,063 Reinvested dividends and distributions 377,963 14,605,878 536,983 19,713,876 Shares repurchased (1,857,858) (72,669,980) (1,933,358) (71,427,947)Net Increase/(Decrease) (646,423) $ (25,132,978) (635,180) $ (23,374,008)Service Shares: Shares sold 21,712,567 $911,634,210 20,594,452 $809,496,215 Reinvested dividends and distributions 3,917,443 160,131,796 4,493,890 174,336,200 Shares repurchased (7,010,260) (289,245,563) (5,686,724) (220,402,952)Net Increase/(Decrease) 18,619,750 $782,520,443 19,401,618 $763,429,463
6. Purchases and Sales of Investment Securities For the year ended December 31, 2020, the aggregate cost of purchases and proceeds from sales of investment securities (excluding any short-term securities, short-term options contracts, TBAs, and in-kind transactions, as applicable) was as follows:
Purchases of Securities
Proceeds from Salesof Securities
Purchases of Long-Term U.S. Government
Obligations
Proceeds from Sales of Long-Term U.S.
Government Obligations $3,356,216,005 $2,779,083,353 $ 1,625,922,679 $ 1,629,232,260
7. Subsequent Event Management has evaluated whether any events or transactions occurred subsequent to December 31, 2020 and through the date of issuance of the Portfolio’s financial statements and determined that there were no material events or transactions that would require recognition or disclosure in the Portfolio’s financial statements.
Janus Henderson VIT Balanced Portfolio Report of Independent Registered Public Accounting Firm
40 DECEMBER 31, 2020
To the Board of Trustees of Janus Aspen Series and Shareholders of Janus Henderson VIT Balanced Portfolio
Opinion on the Financial Statements We have audited the accompanying statement of assets and liabilities, including the schedule of investments, of Janus Henderson VIT Balanced Portfolio (one of the portfolios constituting Janus Aspen Series, referred to hereafter as the "Portfolio") as of December 31, 2020, the related statement of operations for the year ended December 31, 2020, the statements of changes in net assets for each of the two years in the period ended December 31, 2020, including the related notes, and the financial highlights for each of the five years in the period ended December 31, 2020 (collectively referred to as the “financial statements”). In our opinion, the financial statements present fairly, in all material respects, the financial position of the Portfolio as of December 31, 2020, the results of its operations for the year then ended, the changes in its net assets for each of the two years in the period ended December 31, 2020 and the financial highlights for each of the five years in the period ended December 31, 2020 in conformity with accounting principles generally accepted in the United States of America.
Basis for Opinion These financial statements are the responsibility of the Portfolio’s management. Our responsibility is to express an opinion on the Portfolio’s financial statements based on our audits. We are a public accounting firm registered with the Public Company Accounting Oversight Board (United States) (PCAOB) and are required to be independent with respect to the Portfolio in accordance with the U.S. federal securities laws and the applicable rules and regulations of the Securities and Exchange Commission and the PCAOB.
We conducted our audits of these financial statements in accordance with the standards of the PCAOB. Those standards require that we plan and perform the audit to obtain reasonable assurance about whether the financial statements are free of material misstatement, whether due to error or fraud.
Our audits included performing procedures to assess the risks of material misstatement of the financial statements, whether due to error or fraud, and performing procedures that respond to those risks. Such procedures included examining, on a test basis, evidence regarding the amounts and disclosures in the financial statements. Our audits also included evaluating the accounting principles used and significant estimates made by management, as well as evaluating the overall presentation of the financial statements. Our procedures included confirmation of securities owned as of December 31, 2020 by correspondence with the custodian, transfer agent, and brokers; when replies were not received from brokers, we performed other auditing procedures. We believe that our audits provide a reasonable basis for our opinion.
Denver, Colorado February 16, 2021
We have served as the auditor of one or more investment companies in Janus Henderson Funds since 1990.
Janus Henderson VIT Balanced Portfolio Additional Information (unaudited)
Janus Aspen Series 41
Proxy Voting Policies and Voting Record A description of the policies and procedures that the Portfolio uses to determine how to vote proxies relating to its portfolio securities is available without charge: (i) upon request, by calling 1-800-525-1093; (ii) on the Portfolio’s website at janushenderson.com/proxyvoting; and (iii) on the SEC’s website at http://www.sec.gov. Additionally, information regarding the Portfolio’s proxy voting record for the most recent twelve-month period ended June 30 is also available, free of charge, through janushenderson.com/proxyvoting and from the SEC’s website at http://www.sec.gov.
Full Holdings The Portfolio files its complete portfolio holdings (schedule of investments) with the SEC as an exhibit to Form N-PORT within 60 days of the end of the first and third fiscal quarters, and in the annual report and semiannual report to shareholders. The Portfolio’s Form N-PORT filings and annual and semiannual reports: (i) are available on the SEC’s website at http://www.sec.gov; (ii) may be reviewed and copied at the SEC’s Public Reference Room in Washington, D.C. (information on the Public Reference Room may be obtained by calling 1-800-SEC-0330); and (iii) are available without charge, upon request, by calling a Janus Henderson representative at 1-877-335-2687 (toll free). Portfolio holdings consisting of at least the names of the holdings are generally available on a monthly basis with a 30-day lag under Full Holdings for the Portfolio at janushenderson.com/vit.
APPROVAL OF ADVISORY AGREEMENTS DURING THE PERIOD The Trustees of Janus Aspen Series, each of whom serves as an “independent” Trustee (the “Trustees”), oversee the management of each Portfolio of Janus Aspen Series (each, a “VIT Portfolio,” and collectively, the “VIT Portfolios”), as well as each Fund of Janus Investment Fund (together with the VIT Portfolios, the “Janus Henderson Funds,” and each, a “Janus Henderson Fund”). As required by law, the Trustees determine annually whether to continue the investment advisory agreement for each Janus Henderson Fund and the subadvisory agreements for the Janus Henderson Funds that utilize subadvisers.
In connection with their most recent consideration of those agreements for each Janus Henderson Fund, the Trustees received, and reviewed information provided by Janus Capital and the respective subadvisers in response to requests of the Trustees and their independent legal counsel. They also received and reviewed information and analysis provided by, and in response to requests of, their independent fee consultant. Throughout their consideration of the agreements, the Trustees were advised by their independent legal counsel. The Trustees met with management to consider the agreements, and also met separately in executive session with their independent legal counsel and their independent fee consultant.
At a meeting held on December 9, 2020, based on the Trustees’ evaluation of the information provided by Janus Capital, the subadvisers, and the independent fee consultant, as well as other information, the Trustees determined that the overall arrangements between each Janus Henderson Fund and Janus Capital and each subadviser, as applicable, were fair and reasonable in light of the nature, extent and quality of the services provided by Janus Capital, its affiliates and the subadvisers, the fees charged for those services, and other matters that the Trustees considered relevant in the exercise of their business judgment. At that meeting, the Trustees unanimously approved the continuation of the investment advisory agreement for each Janus Henderson Fund, and the subadvisory agreement for each subadvised Janus Henderson Fund, for the period from February 1, 2021 through February 1, 2022, subject to earlier termination as provided for in each agreement.
In considering the continuation of those agreements, the Trustees reviewed and analyzed various factors that they determined were relevant, including the factors described below, none of which by itself was considered dispositive. However, the material factors and conclusions that formed the basis for the Trustees’ determination to approve the continuation of the agreements are discussed separately below. Also included is a summary of the independent fee consultant’s conclusions and opinions that arose during, and were included as part of, the Trustees’ consideration of the agreements. “Management fees,” as used herein, reflect actual annual advisory fees and, for the purpose of peer comparisons any administration fees (excluding out of pocket costs), net of any waivers, paid by a fund as a percentage of average net assets.
Nature, Extent and Quality of Services The Trustees reviewed the nature, extent and quality of the services provided by Janus Capital and the subadvisers to the Janus Henderson Funds, taking into account the investment objective, strategies and policies of each Janus Henderson Fund, and the knowledge the Trustees gained from their regular meetings with management on at least a
Janus Henderson VIT Balanced Portfolio Additional Information (unaudited)
42 DECEMBER 31, 2020
quarterly basis and their ongoing review of information related to the Janus Henderson Funds. In addition, the Trustees reviewed the resources and key personnel of Janus Capital and each subadviser, particularly noting those employees who provide investment and risk management services to the Janus Henderson Funds. The Trustees also considered other services provided to the Janus Henderson Funds by Janus Capital or the subadvisers, such as managing the execution of portfolio transactions and the selection of broker-dealers for those transactions. The Trustees considered Janus Capital’s role as administrator to the Janus Henderson Funds, noting that Janus Capital generally does not receive a fee for its services but is reimbursed for its out-of-pocket costs. The Trustees considered the role of Janus Capital in monitoring adherence to the Janus Henderson Funds’ investment restrictions, providing support services for the Trustees and Trustee committees, and overseeing communications with shareholders and the activities of other service providers, including monitoring compliance with various policies and procedures of the Janus Henderson Funds and with applicable securities laws and regulations.
In this regard, the independent fee consultant noted that Janus Capital provides a number of different services for the Janus Henderson Funds and fund shareholders, ranging from investment management services to various other servicing functions, and that, in its view, Janus Capital is a capable provider of those services. The independent fee consultant also provided its belief that Janus Capital has developed a number of institutional competitive advantages that should enable it to provide superior investment and service performance over the long term.
The Trustees concluded that the nature, extent and quality of the services provided by Janus Capital or the subadviser to each Janus Henderson Fund were appropriate and consistent with the terms of the respective advisory and subadvisory agreements, and that, taking into account steps taken to address those Janus Henderson Funds whose performance lagged that of their peers for certain periods, the Janus Henderson Funds were likely to benefit from the continued provision of those services. They also concluded that Janus Capital and each subadviser had sufficient personnel, with the appropriate education and experience, to serve the Janus Henderson Funds effectively and had demonstrated its ability to attract well-qualified personnel.
Performance of the Funds The Trustees considered the performance results of each Janus Henderson Fund over various time periods. They noted that they considered Janus Henderson Fund performance data throughout the year, including periodic meetings with each Janus Henderson Fund’s portfolio manager(s), and also reviewed information comparing each Janus Henderson Fund’s performance with the performance of comparable funds and peer groups identified by Broadridge Financial Solutions, Inc. (“Broadridge”), an independent data provider, and with the Janus Henderson Fund’s benchmark index. In this regard, the independent fee consultant found that the overall Janus Henderson Funds’ performance has been reasonable: for the 36 months ended September 30, 2020, approximately 75% of the Janus Henderson Funds were in the top two quartiles of performance versus Broadridge peers, and for the 12 months ended September 30, 2020, approximately 62% of the Janus Henderson Funds were in the top two quartiles of performance versus Broadridge peers.
The Trustees considered the performance of each Janus Henderson Fund, noting that performance may vary by share class, and noted the following with respect to the VIT Portfolios:
• For Janus Henderson Balanced Portfolio, the Trustees noted that the Fund’s performance was in the first Broadridge quartile for the 36 months ended May 31, 2020 and the first Broadridge quartile for the 12 months ended May 31, 2020.
• For Janus Henderson Enterprise Portfolio, the Trustees noted that the Fund’s performance was in the bottom Broadridge quartile for the 36 months ended May 31, 2020 and the bottom Broadridge quartile for the 12 months ended May 31, 2020. The Trustees noted the reasons for the Fund’s underperformance and the steps Janus Capital had taken or was taking to improve performance.
• For Janus Henderson Flexible Bond Portfolio, the Trustees noted that the Fund’s performance was in the third Broadridge quartile for the 36 months ended May 31, 2020 and the first Broadridge quartile for the 12 months ended May 31, 2020. The Trustees noted the reasons for the Fund’s underperformance and the steps Janus Capital had taken or was taking to improve performance, and that the performance trend was improving.
Janus Henderson VIT Balanced Portfolio Additional Information (unaudited)
Janus Aspen Series 43
• For Janus Henderson Forty Portfolio, the Trustees noted that the Fund’s performance was in the second Broadridge quartile for the 36 months ended May 31, 2020 and the second Broadridge quartile for the 12 months ended May 31, 2020.
• For Janus Henderson Global Research Portfolio, the Trustees noted that the Fund’s performance was in the third Broadridge quartile for the 36 months ended May 31, 2020 and the bottom Broadridge quartile for the 12 months ended May 31, 2020. The Trustees noted the reasons for the Fund’s underperformance, while also noting that the Fund has a performance fee structure that results in lower management fees during periods of underperformance, and the steps Janus Capital had taken or was taking to improve performance.
• For Janus Henderson Global Technology and Innovation Portfolio, the Trustees noted that the Fund’s performance was in the first Broadridge quartile for the 36 months ended May 31, 2020 and the second Broadridge quartile for the 12 months ended May 31, 2020.
• For Janus Henderson Mid Cap Value Portfolio, the Trustees noted that the Fund’s performance was in the third Broadridge quartile for the 36 months ended May 31, 2020 and the third Broadridge quartile for the 12 months ended May 31, 2020. The Trustees noted the reasons for the Fund’s underperformance, while also noting that the Fund has a performance fee structure that results in lower management fees during periods of underperformance, and the steps Janus Capital and Perkins had taken or were taking to improve performance.
• For Janus Henderson Overseas Portfolio, the Trustees noted that the Fund’s performance was in the bottom Broadridge quartile for the 36 months ended May 31, 2020 and the third Broadridge quartile for the 12 months ended May 31, 2020. The Trustees noted the reasons for the Fund’s underperformance, while also noting that the Fund has a performance fee structure that results in lower management fees during periods of underperformance and the steps Janus Capital had taken or was taking to improve performance.
• For Janus Henderson Research Portfolio, the Trustees noted that the Fund’s performance was in the third Broadridge quartile for the 36 months ended May 31, 2020 and the third Broadridge quartile for the 12 months ended May 31, 2020. The Trustees noted the reasons for the Fund’s underperformance, while also noting that the Fund has a performance fee structure that results in lower management fees during periods of underperformance, and the steps Janus Capital had taken or was taking to improve performance.
• For Janus Henderson U.S. Low Volatility Portfolio, the Trustees noted that the Fund’s performance was in the second Broadridge quartile for the 36 months ended May 31, 2020 and the third Broadridge quartile for the 12 months ended May 31, 2020.
In consideration of each Janus Henderson Fund’s performance, the Trustees concluded that, taking into account the factors relevant to performance, as well as other considerations, including steps taken to improve performance, the Janus Henderson Fund’s performance warranted continuation of such Janus Henderson Fund’s investment advisory and subadvisory agreement(s).
Costs of Services Provided The Trustees examined information regarding the fees and expenses of each Janus Henderson Fund in comparison to similar information for other comparable funds as provided by Broadridge, an independent data provider. They also reviewed an analysis of that information provided by their independent fee consultant and noted that the rate of management fees (investment advisory fees and any administration fees but excluding out-of-pocket costs) for many of the Janus Henderson Funds, after applicable waivers, was below the average management fee rate of the respective peer group of funds selected by an independent data provider. The Trustees also examined information regarding the subadvisory fees charged for subadvisory services, as applicable, noting that all such fees were paid by Janus Capital out of its management fees collected from such Janus Henderson Fund.
The independent fee consultant provided its belief that the management fees charged by Janus Capital to each of the Janus Henderson Funds under the current investment advisory and administration agreements are reasonable in relation to the services provided by Janus Capital. The independent fee consultant found: (1) the total expenses and management fees of the Janus Henderson Funds to be reasonable relative to other comparable mutual funds; (2) the total expenses, on average, were 10% under the average total expenses of the respective Broadridge Expense Group peers; and (3) and the management fees for the Janus Henderson Funds, on average, were 9% under the average management fees for the respective Broadridge Expense Group. The Trustees also considered the total expenses for
Janus Henderson VIT Balanced Portfolio Additional Information (unaudited)
44 DECEMBER 31, 2020
each share class of each Janus Henderson Fund compared to the average total expenses for its Broadridge Expense Group and to average total expenses for its Broadridge Expense Universe.
For certain Janus Henderson Funds, the independent fee consultant also performed a systematic “focus list” analysis of expenses which assessed fund fees in the context of fund performance being delivered. Based on this analysis, the independent fee consultant found that the combination of service quality/performance and expenses on these individual Janus Henderson Funds was reasonable in light of performance trends, performance histories, and existence of performance fees, breakpoints, and/or expense waivers on such Janus Henderson Funds.
The Trustees considered the methodology used by Janus Capital and each subadviser in determining compensation payable to portfolio managers, the competitive environment for investment management talent, and the competitive market for mutual funds in different distribution channels.
The Trustees also reviewed management fees charged by Janus Capital and each subadviser to comparable separate account clients and to comparable non-affiliated funds subadvised by Janus Capital or by a subadviser (for which Janus Capital or the subadviser provides only or primarily portfolio management services). Although in most instances subadvisory and separate account fee rates for various investment strategies were lower than management fee rates for Janus Henderson Funds having a similar strategy, the Trustees considered that Janus Capital noted that, under the terms of the management agreements with the Janus Henderson Funds, Janus Capital performs significant additional services for the Janus Henderson Funds that it does not provide to those other clients, including administration services, oversight of the Janus Henderson Funds’ other service providers, trustee support, regulatory compliance and numerous other services, and that, in serving the Janus Henderson Funds, Janus Capital assumes many legal risks and other costs that it does not assume in servicing its other clients. Moreover, they noted that the independent fee consultant found that: (1) the management fees Janus Capital charges to the Janus Henderson Funds are reasonable in relation to the management fees Janus Capital charges to funds subadvised by Janus Capital and to the fees Janus Capital charges to its institutional separate account clients; (2) these subadvised and institutional separate accounts have different service and infrastructure needs and operate in markets very distinct relative to retail funds; and (3) Janus Henderson mutual fund investors enjoy reasonable fees relative to the fees charged to Janus Henderson subadvised fund and separate account investors; (4) 9 of 10 Janus Henderson Funds have lower management fees than similar funds subadvised by Janus Capital; and (5) 5 of 8 Janus Henderson Funds have lower management fees than similar separate accounts managed by Janus Capital.
The Trustees considered the fees for each Janus Henderson Fund for its fiscal year ended in 2019, including the VIT Portfolios, and noted the following with regard to each VIT Portfolio’s total expenses, net of applicable fee waivers (the VIT Portfolio’s “total expenses”):
• For Janus Henderson Balanced Portfolio, the Trustees noted that, although the Fund’s total expenses exceeded the peer group average for one share class, overall the Fund’s total expenses were reasonable.
• For Janus Henderson Enterprise Portfolio, the Trustees noted that, although the Fund’s total expenses exceeded the peer group average for one share class, overall the Fund’s total expenses were reasonable.
• For Janus Henderson Flexible Bond Portfolio, the Trustees noted that, although the Fund’s total expenses exceeded the peer group for one share class, overall the Fund’s total expenses were reasonable. The Trustees also noted that Janus Capital has contractually agreed to limit the Fund’s expenses, although this limit did not apply because the Fund’s total expenses were already below the applicable fee limit.
• For Janus Henderson Forty Portfolio, the Trustees noted that, although the Fund’s total expenses exceeded the peer group average for one share class, overall the Fund’s total expenses were reasonable.
• For Janus Henderson Global Research Portfolio, the Trustees noted that, although the Fund’s total expenses exceeded the peer group average for one share class, overall the Fund’s total expenses were reasonable.
• For Janus Henderson Global Technology and Innovation Portfolio, the Trustees noted that the Fund’s total expenses were below the peer group for both share classes.
• For Janus Henderson Mid Cap Value Portfolio, the Trustees noted that, although the Fund’s total expenses exceeded the peer group for one share class, overall the Fund’s total expenses were reasonable. The Trustees also noted that Janus Capital has contractually agreed to limit the Fund’s expenses, although this limit did not apply because the Fund’s total expenses were already below the applicable fee limit.
Janus Henderson VIT Balanced Portfolio Additional Information (unaudited)
Janus Aspen Series 45
• For Janus Henderson Overseas Portfolio, the Trustees noted that the Fund’s total expenses were below the peer group for both share classes.
• For Janus Henderson Research Portfolio, the Trustees noted that the Fund’s total expenses were below the peer group average for both share classes.
• For Janus Henderson U.S. Low Volatility Portfolio, the Trustees noted that the Fund’s total expenses were below the peer group for its sole share class.
The Trustees reviewed information on the overall profitability to Janus Capital and its affiliates of their relationship with the Janus Henderson Funds, and considered profitability data of other publicly traded mutual fund advisers. The Trustees recognized that profitability comparisons among fund managers are difficult because of the variation in the type of comparative information that is publicly available, and the profitability of any fund manager is affected by numerous factors, including the organizational structure of the particular fund manager, differences in complex size, difference in product mix, difference in types of business (mutual fund, institutional and other), differences in the types of funds and other accounts it manages, possible other lines of business, the methodology for allocating expenses, and the fund manager’s capital structure and cost of capital.
Additionally, the Trustees considered the estimated profitability to Janus Capital from the investment management services it provided to each Janus Henderson Fund. In their review, the Trustees considered whether Janus Capital and each subadviser receive adequate incentives and resources to manage the Janus Henderson Funds effectively. In reviewing profitability, the Trustees noted that the estimated profitability for an individual Janus Henderson Fund is necessarily a product of the allocation methodology utilized by Janus Capital to allocate its expenses as part of the estimated profitability calculation. In this regard, the Trustees noted that the independent fee consultant found that (1) the expense allocation methodology and rationales utilized by Janus Capital were reasonable and (2) no clear correlation exists between expense allocations and operating margins. The Trustees also considered that the estimated profitability for an individual Janus Henderson Fund was influenced by a number of factors, including not only the allocation methodology selected, but also the presence of fee waivers and expense caps, and whether the Janus Henderson Fund’s investment management agreement contained breakpoints or a performance fee component. The Trustees determined, after taking into account these factors, among others, that Janus Capital’s estimated profitability with respect to each Janus Henderson Fund was not unreasonable in relation to the services provided, and that the variation in the range of such estimated profitability among the Janus Henderson Funds was not a material factor in the Board’s approval of the reasonableness of any Janus Henderson Fund’s investment management fees.
The Trustees concluded that the management fees payable by each Janus Henderson Fund to Janus Capital and its affiliates, as well as the fees paid by Janus Capital to the subadvisers of subadvised Janus Henderson Funds, were reasonable in relation to the nature, extent, and quality of the services provided, taking into account the fees charged by other advisers for managing comparable mutual funds with similar strategies, the fees Janus Capital and the subadvisers charge to other clients, and, as applicable, the impact of fund performance on management fees payable by the Janus Henderson Funds. The Trustees also concluded that each Janus Henderson Fund’s total expenses were reasonable, taking into account the size of the Janus Henderson Fund, the quality of services provided by Janus Capital and any subadviser, the investment performance of the Janus Henderson Fund, and any expense limitations agreed to or provided by Janus Capital.
Economies of Scale The Trustees considered information about the potential for Janus Capital to realize economies of scale as the assets of the Janus Henderson Funds increase. They noted that their independent fee consultant published a report to the Trustees in November 2019 which provided its research and analysis into economies of scale. They also noted that, although many Janus Henderson Funds pay advisory fees at a fixed base rate as a percentage of net assets, without any breakpoints or performance fees, their independent fee consultant concluded that 73% of these Janus Henderson Funds’ have contractual management fees (gross of waivers) below their Broadridge Expense Group averages. They also noted the following: (1) that for those Janus Henderson Funds whose expenses are being reduced by the contractual expense limitations of Janus Capital, Janus Capital is subsidizing certain of these Janus Henderson Funds because they have not reached adequate scale; (2) as the assets of some of the Janus Henderson Funds have declined in the past few years, certain of those Janus Henderson Funds have benefited from having advisory fee rates that have remained constant rather than increasing as assets declined; (3) performance fee structures have been implemented for various Janus Henderson Funds that have caused the effective rate of advisory fees payable by such

Janus Henderson VIT Balanced Portfolio Additional Information (unaudited)
46 DECEMBER 31, 2020
Janus Henderson Fund to vary depending on the investment performance of the Janus Henderson Fund relative to its benchmark index over the measurement period; and (4) a few Janus Henderson Funds have fee schedules with breakpoints and reduced fee rates above certain asset levels. The Trustees also noted that the Janus Henderson Funds share directly in economies of scale through the significant investments made by Janus Capital and its affiliates related to services provided to the Funds and the lower charges of third-party service providers that are based in part on the combined scale of all of the Janus Henderson Funds.
The Trustees also considered the independent fee consultant’s conclusion that, given the limitations of various analytical approaches to economies of scale and their conflicting results, it is difficult to analytically confirm or deny the existence of economies of scale in the Janus Henderson complex. In this regard, the independent consultant concluded that (1) to the extent there were economies of scale at Janus Capital, Janus Capital’s general strategy of setting fixed management fees below peers appeared to share any such economies with investors even on smaller Janus Henderson Funds which have not yet achieved those economies and (2) by setting lower fixed fees from the start on these Janus Henderson Funds, Janus Capital appeared to be investing to increase the likelihood that these Janus Henderson Funds will grow to a level to achieve any economies of scale that may exist. Further, the independent fee consultant provided its belief that Janus Henderson Fund investors are well-served by the fee levels and performance fee structures in place on the Janus Henderson Funds in light of any economies of scale that may be present at Janus Capital.
Based on all of the information reviewed, including the recent and past research and analysis conducted by the Trustees’ independent fee consultant, the Trustees concluded that the current fee structure of each Janus Henderson Fund was reasonable and that the current rates of fees do reflect a sharing between Janus Capital and the Janus Henderson Fund of any economies of scale that may be present at the current asset level of the Janus Henderson Fund.
Other Benefits to Janus Capital The Trustees also considered benefits that accrue to Janus Capital and its affiliates and subadvisers to the Janus Henderson Funds from their relationships with the Janus Henderson Funds. They recognized that two affiliates of Janus Capital separately serve the Janus Henderson Funds as transfer agent and distributor, respectively, and the transfer agent receives compensation directly from the non-money market funds for services provided, and that such compensation contributes to the overall profitability of Janus Capital and its affiliates that results from their relationship with the Janus Henderson Funds. The Trustees also considered Janus Capital’s past and proposed use of commissions paid by the Janus Henderson Funds on portfolio brokerage transactions to obtain proprietary and third-party research products and services benefiting the Janus Henderson Fund and/or other clients of Janus Capital and Janus Capital, and/or a subadviser to a Janus Henderson Fund. The Trustees concluded that Janus Capital’s and the subadvisers’ use of these types of client commission arrangements to obtain proprietary and third-party research products and services was consistent with regulatory requirements and guidelines and was likely to benefit each Janus Henderson Fund. The Trustees also concluded that, other than the services provided by Janus Capital and its affiliates and subadvisers pursuant to the agreements and the fees to be paid by each Janus Henderson Fund therefor, the Janus Henderson Funds and Janus Capital and the subadvisers may potentially benefit from their relationship with each other in other ways. They concluded that Janus Capital and its affiliates share directly in economies of scale through the lower charges of third-party service providers that are based in part on the combined scale of the Janus Henderson Funds and other clients serviced by Janus Capital and its affiliates. They also concluded that Janus Capital and/or the subadvisers benefit from the receipt of research products and services acquired through commissions paid on portfolio transactions of the Janus Henderson Funds and that the Janus Henderson Funds benefit from Janus Capital’s and/or the subadvisers’ receipt of those products and services as well as research products and services acquired through commissions paid by other clients of Janus Capital and/or other clients of the subadvisers. They further concluded that the success of any Janus Henderson Fund could attract other business to Janus Capital, the subadvisers or other Janus Henderson funds, and that the success of Janus Capital and the subadvisers could enhance Janus Capital’s and the subadvisers’ ability to serve the Janus Henderson Funds.
Janus Henderson VIT Balanced Portfolio Useful Information About Your Portfolio Report (unaudited)
Janus Aspen Series 47
Management Commentary The Management Commentary in this report includes valuable insight as well as statistical information to help you understand how your Portfolio’s performance and characteristics stack up against those of comparable indices.
If the Portfolio invests in foreign securities, this report may include information about country exposure. Country exposure is based primarily on the country of risk. A company may be allocated to a country based on other factors such as location of the company’s principal office, the location of the principal trading market for the company’s securities, or the country where a majority of the company’s revenues are derived.
Please keep in mind that the opinions expressed in the Management Commentary are just that: opinions. They are a reflection based on best judgment at the time this report was compiled, which was December 31, 2020. As the investing environment changes, so could opinions. These views are unique and are not necessarily shared by fellow employees or by Janus Henderson in general.
Performance Overviews Performance overview graphs compare the performance of a hypothetical $10,000 investment in the Portfolio with one or more widely used market indices. When comparing the performance of the Portfolio with an index, keep in mind that market indices are not available for investment and do not reflect deduction of expenses.
Average annual total returns are quoted for a Portfolio with more than one year of performance history. Average annual total return is calculated by taking the growth or decline in value of an investment over a period of time, including reinvestment of dividends and distributions, then calculating the annual compounded percentage rate that would have produced the same result had the rate of growth been constant throughout the period. Average annual total return does not reflect the deduction of taxes that a shareholder would pay on Portfolio distributions or redemptions of Portfolio shares.
Cumulative total returns are quoted for a Portfolio with less than one year of performance history. Cumulative total return is the growth or decline in value of an investment over time, independent of the period of time involved. Cumulative total return does not reflect the deduction of taxes that a shareholder would pay on Portfolio distributions or redemptions of Portfolio shares.
Pursuant to federal securities rules, expense ratios shown in the performance chart reflect subsidized (if applicable) and unsubsidized ratios. The total annual fund operating expenses ratio is gross of any fee waivers, reflecting the Portfolio’s unsubsidized expense ratio. The net annual fund operating expenses ratio (if applicable) includes contractual waivers of Janus Capital and reflects the Portfolio’s subsidized expense ratio. Ratios may be higher or lower than those shown in the “Financial Highlights” in this report.
Schedule of Investments Following the performance overview section is the Portfolio’s Schedule of Investments. This schedule reports the types of securities held in the Portfolio on the last day of the reporting period. Securities are usually listed by type (common stock, corporate bonds, U.S. Government obligations, etc.) and by industry classification (banking, communications, insurance, etc.). Holdings are subject to change without notice.
The value of each security is quoted as of the last day of the reporting period. The value of securities denominated in foreign currencies is converted into U.S. dollars.
If the Portfolio invests in foreign securities, it will also provide a summary of investments by country. This summary reports the Portfolio exposure to different countries by providing the percentage of securities invested in each country. The country of each security represents the country of risk. The Portfolio’s Schedule of Investments relies upon the industry group and country classifications published by Barclays and/or MSCI Inc.
Tables listing details of individual forward currency contracts, futures, written options, swaptions, and swaps follow the Portfolio’s Schedule of Investments (if applicable).
Statement of Assets and Liabilities This statement is often referred to as the “balance sheet.” It lists the assets and liabilities of the Portfolio on the last day of the reporting period.
Janus Henderson VIT Balanced Portfolio Useful Information About Your Portfolio Report (unaudited)
48 DECEMBER 31, 2020
The Portfolio’s assets are calculated by adding the value of the securities owned, the receivable for securities sold but not yet settled, the receivable for dividends declared but not yet received on securities owned, and the receivable for Portfolio shares sold to investors but not yet settled. The Portfolio’s liabilities include payables for securities purchased but not yet settled, Portfolio shares redeemed but not yet paid, and expenses owed but not yet paid. Additionally, there may be other assets and liabilities such as unrealized gain or loss on forward currency contracts.
The section entitled “Net Assets Consist of” breaks down the components of the Portfolio’s net assets. Because the Portfolio must distribute substantially all earnings, you will notice that a significant portion of net assets is shareholder capital.
The last section of this statement reports the net asset value (“NAV”) per share on the last day of the reporting period. The NAV is calculated by dividing the Portfolio’s net assets for each share class (assets minus liabilities) by the number of shares outstanding.
Statement of Operations This statement details the Portfolio’s income, expenses, realized gains and losses on securities and currency transactions, and changes in unrealized appreciation or depreciation of Portfolio holdings.
The first section in this statement, entitled “Investment Income,” reports the dividends earned from securities and interest earned from interest-bearing securities in the Portfolio.
The next section reports the expenses incurred by the Portfolio, including the advisory fee paid to the investment adviser, transfer agent fees and expenses, and printing and postage for mailing statements, financial reports and prospectuses. Expense offsets and expense reimbursements, if any, are also shown.
The last section lists the amounts of realized gains or losses from investment and foreign currency transactions, and changes in unrealized appreciation or depreciation of investments and foreign currency-denominated assets and liabilities. The Portfolio will realize a gain (or loss) when it sells its position in a particular security. A change in unrealized gain (or loss) refers to the change in net appreciation or depreciation of the Portfolio during the reporting period. “Net Realized and Unrealized Gain/(Loss) on Investments” is affected both by changes in the market value of Portfolio holdings and by gains (or losses) realized during the reporting period.
Statements of Changes in Net Assets These statements report the increase or decrease in the Portfolio’s net assets during the reporting period. Changes in the Portfolio’s net assets are attributable to investment operations, dividends and distributions to investors, and capital share transactions. This is important to investors because it shows exactly what caused the Portfolio’s net asset size to change during the period.
The first section summarizes the information from the Statement of Operations regarding changes in net assets due to the Portfolio’s investment operations. The Portfolio’s net assets may also change as a result of dividend and capital gains distributions to investors. If investors receive their dividends and/or distributions in cash, money is taken out of the Portfolio to pay the dividend and/or distribution. If investors reinvest their dividends and/or distributions, the Portfolio’s net assets will not be affected. If you compare the Portfolio’s “Net Decrease from Dividends and Distributions” to “Reinvested Dividends and Distributions,” you will notice that dividends and distributions have little effect on the Portfolio’s net assets. This is because the majority of the Portfolio’s investors reinvest their dividends and/or distributions.
The reinvestment of dividends and distributions is included under “Capital Share Transactions.” “Capital Shares” refers to the money investors contribute to the Portfolio through purchases or withdrawals via redemptions. The Portfolio’s net assets will increase and decrease in value as investors purchase and redeem shares from the Portfolio.
Financial Highlights This schedule provides a per-share breakdown of the components that affect the Portfolio’s NAV for current and past reporting periods as well as total return, asset size, ratios, and portfolio turnover rate.
The first line in the table reflects the NAV per share at the beginning of the reporting period. The next line reports the net investment income/(loss) per share. Following is the per share total of net gains/(losses), realized and unrealized. Per share dividends and distributions to investors are then subtracted to arrive at the NAV per share at the end of the period. The next line reflects the total return for the period. The total return may include adjustments in accordance with
Janus Henderson VIT Balanced Portfolio Useful Information About Your Portfolio Report (unaudited)
Janus Aspen Series 49
generally accepted accounting principles required at the period end for financial reporting purposes. As a result, the total return may differ from the total return reflected for individual shareholder transactions. Also included are ratios of expenses and net investment income to average net assets.
The Portfolio’s expenses may be reduced through expense offsets and expense reimbursements. The ratios shown reflect expenses before and after any such offsets and reimbursements.
The ratio of net investment income/(loss) summarizes the income earned less expenses, divided by the average net assets of the Portfolio during the reporting period. Do not confuse this ratio with the Portfolio’s yield. The net investment income ratio is not a true measure of the Portfolio’s yield because it does not take into account the dividends distributed to the Portfolio’s investors.
The next figure is the portfolio turnover rate, which measures the buying and selling activity in the Portfolio. Portfolio turnover is affected by market conditions, changes in the asset size of the Portfolio, fluctuating volume of shareholder purchase and redemption orders, the nature of the Portfolio’s investments, and the investment style and/or outlook of the portfolio manager(s) and/or investment personnel. A 100% rate implies that an amount equal to the value of the entire portfolio was replaced once during the fiscal year; a 50% rate means that an amount equal to the value of half the portfolio is traded in a year; and a 200% rate means that an amount equal to the value of the entire portfolio is traded every six months.

Janus Henderson VIT Balanced Portfolio Designation Requirements (unaudited)
50 DECEMBER 31, 2020
For federal income tax purposes, the Portfolio designated the following for the year ended December 31, 2020:
Capital Gain Distributions $52,696,448Dividends Received Deduction Percentage 56%

Janus Henderson VIT Balanced Portfolio Trustees and Officers (unaudited)
Janus Aspen Series 51
The following are the Trustees and officers of the Trust, together with a brief description of their principal occupations during the last five years (principal occupations for certain Trustees may include periods over five years). The Portfolio’s Statement of Additional Information includes additional information about the Trustees and officers and is available, without charge, by calling 1-877-335-2687.
Each Trustee has served in that capacity since he or she was originally elected or appointed. The Trustees do not serve a specified term of office. Each Trustee will hold office until the termination of the Trust or his or her earlier death, resignation, retirement, incapacity, or removal. Under the Portfolio’s Governance Procedures and Guidelines, the policy is for Trustees to retire no later than the end of the calendar year in which the Trustee turns 75. The Trustees review the Portfolio’s Governance Procedures and Guidelines from time to time and may make changes they deem appropriate. The Portfolio’s Nominating and Governance Committee will consider nominees for the position of Trustee recommended by shareholders. Shareholders may submit the name of a candidate for consideration by the Committee by submitting their recommendations to the Trust’s Secretary. Each Trustee is currently a Trustee of one other registered investment company advised by Janus Capital: Janus Investment Fund. Collectively, these two registered investment companies consist of 56 series or funds referred to herein as the Fund Complex.
The Trust’s officers are elected annually by the Trustees for a one-year term. Certain officers also serve as officers of Janus Investment Fund. Certain officers of the Portfolio may also be officers and/or directors of Janus Capital. Except as otherwise disclosed, Portfolio officers receive no compensation from the Portfolio, except for the Portfolio’s Chief Compliance Officer, as authorized by the Trustees.
Janus Henderson VIT Balanced Portfolio Trustees and Officers (unaudited)
52 DECEMBER 31, 2020
TRUSTEES
Name, Address, and Age
Positions Held with the Trust
Length of Time Served
Principal Occupations During the Past Five Years
Number of Portfolios/Funds in Fund Complex Overseen by Trustee
Other Directorships Held by Trustee During the Past Five Years
Independent Trustees
William F. McCalpin 151 Detroit Street Denver, CO 80206 DOB: 1957
Chairman Trustee
1/08-Present 6/02-Present
Independent Consultant (since 2019) and Chief Operating Officer, muun chi LLC (organic food business) (since 2020). Formerly, Managing Partner, Impact Investments, Athena Capital Advisors LLC (independent registered investment advisor) (2016-2019), Managing Director, Holos Consulting LLC (provides consulting services to foundations and other nonprofit organizations) (2009-2016), Chief Executive Officer, Imprint Capital Advisors (impact investment firm) (2013-2015), and Executive Vice President and Chief Operating Officer of The Rockefeller Brothers Fund (a private family foundation) (1998-2006).
56 Director of Mutual Fund Directors Forum (a non-profit organization serving independent directors of U.S. mutual funds) (since 2016), Chairman of the Board and Trustee of The Investment Fund for Foundations Investment Program (TIP) (consisting of 2 funds) (since 2008), and Director of the F.B. Heron Foundation (a private grantmaking foundation) (since 2006).
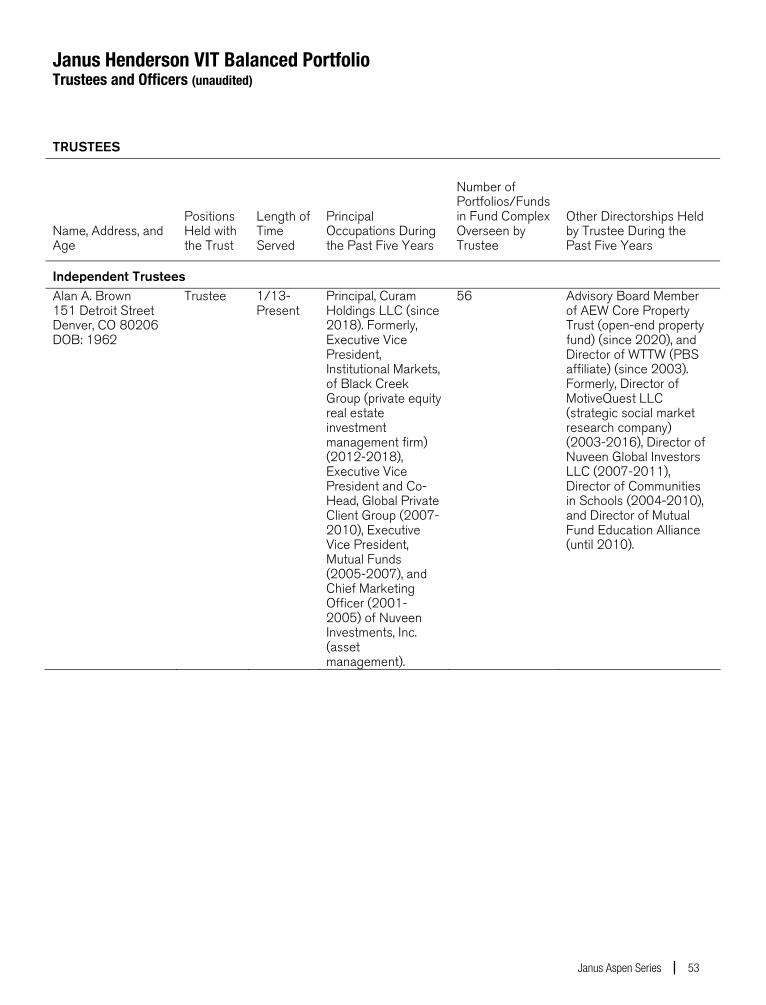
Janus Henderson VIT Balanced Portfolio Trustees and Officers (unaudited)
Janus Aspen Series 53
TRUSTEES
Name, Address, and Age
Positions Held with the Trust
Length of Time Served
Principal Occupations During the Past Five Years
Number of Portfolios/Funds in Fund Complex Overseen by Trustee
Other Directorships Held by Trustee During the Past Five Years
Independent Trustees
Alan A. Brown 151 Detroit Street Denver, CO 80206 DOB: 1962
Trustee 1/13-Present
Principal, Curam Holdings LLC (since 2018). Formerly, Executive Vice President, Institutional Markets, of Black Creek Group (private equity real estate investment management firm) (2012-2018), Executive Vice President and Co-Head, Global Private Client Group (2007-2010), Executive Vice President, Mutual Funds (2005-2007), and Chief Marketing Officer (2001-2005) of Nuveen Investments, Inc. (asset management).
56 Advisory Board Member of AEW Core Property Trust (open-end property fund) (since 2020), and Director of WTTW (PBS affiliate) (since 2003). Formerly, Director of MotiveQuest LLC (strategic social market research company) (2003-2016), Director of Nuveen Global Investors LLC (2007-2011), Director of Communities in Schools (2004-2010), and Director of Mutual Fund Education Alliance (until 2010).

Janus Henderson VIT Balanced Portfolio Trustees and Officers (unaudited)
54 DECEMBER 31, 2020
TRUSTEES
Name, Address, and Age
Positions Held with the Trust
Length of Time Served
Principal Occupations During the Past Five Years
Number of Portfolios/Funds in Fund Complex Overseen by Trustee
Other Directorships Held by Trustee During the Past Five Years
Independent Trustees
William D. Cvengros 151 Detroit Street Denver, CO 80206 DOB: 1948
Trustee 1/11-Present
Chief Executive Officer of SJC Capital, LLC (a personal investment company and consulting firm) (since 2002). Formerly, Chief Executive Officer and President of PIMCO Advisors Holdings L.P. (a publicly traded investment management firm) (1994-2000), and Chief Investment Officer (1987-1994) and Vice Chairman and Director (1990-1994) of Pacific Life Insurance Company (a mutual life insurance and annuity company) (1987-1994).
56 Advisory Board Member, RevOZ Fund LP and related funds (real estate investments for opportunity zones) (since 2020), and Advisory Board Member, Innovate Partners Emerging Growth and Equity Fund I (early stage venture capital fund) (since 2014). Formerly, Managing Trustee of National Retirement Partners Liquidating Trust (2013-2016), Chairman, National Retirement Partners, Inc. (formerly a network of advisors to 401(k) plans) (2005-2013), Director of Prospect Acquisition Corp. (a special purpose acquisition corporation) (2007-2009), Director of RemedyTemp, Inc. (temporary help services company) (1996-2006), and Trustee of PIMCO Funds Multi-Manager Series (1990-2000) and Pacific Life Variable Life & Annuity Trusts (1987-1994).
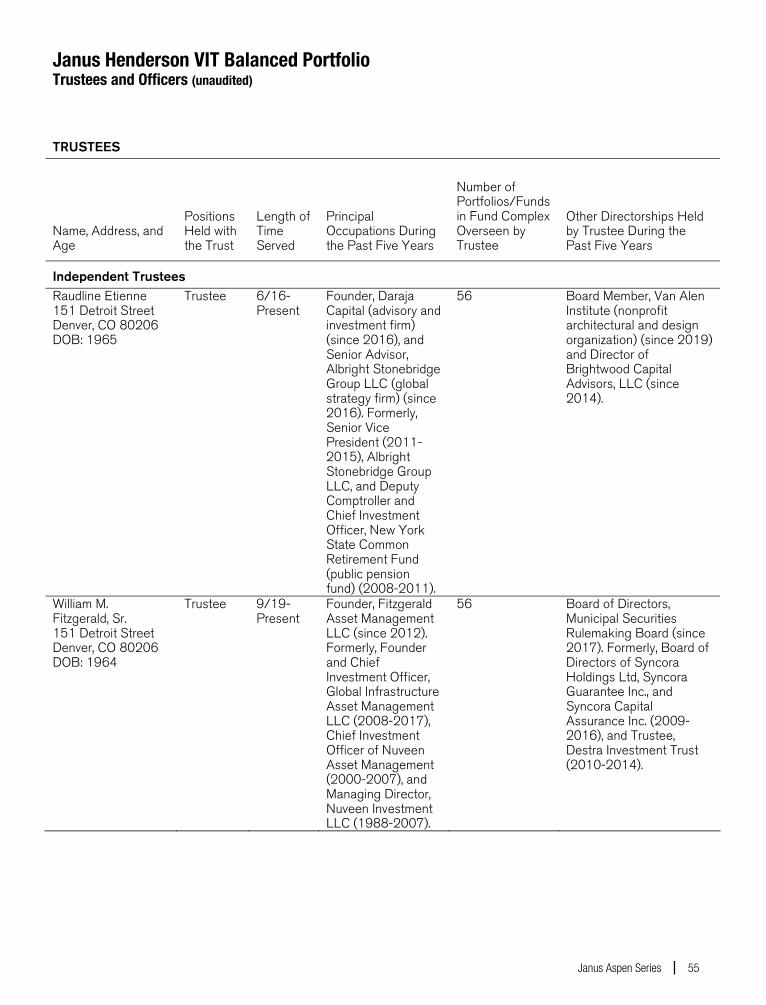
Janus Henderson VIT Balanced Portfolio Trustees and Officers (unaudited)
Janus Aspen Series 55
TRUSTEES
Name, Address, and Age
Positions Held with the Trust
Length of Time Served
Principal Occupations During the Past Five Years
Number of Portfolios/Funds in Fund Complex Overseen by Trustee
Other Directorships Held by Trustee During the Past Five Years
Independent Trustees
Raudline Etienne 151 Detroit Street Denver, CO 80206 DOB: 1965
Trustee 6/16-Present
Founder, Daraja Capital (advisory and investment firm) (since 2016), and Senior Advisor, Albright Stonebridge Group LLC (global strategy firm) (since 2016). Formerly, Senior Vice President (2011-2015), Albright Stonebridge Group LLC, and Deputy Comptroller and Chief Investment Officer, New York State Common Retirement Fund (public pension fund) (2008-2011).
56 Board Member, Van Alen Institute (nonprofit architectural and design organization) (since 2019) and Director of Brightwood Capital Advisors, LLC (since 2014).
William M. Fitzgerald, Sr. 151 Detroit Street Denver, CO 80206 DOB: 1964
Trustee 9/19-Present
Founder, Fitzgerald Asset Management LLC (since 2012). Formerly, Founder and Chief Investment Officer, Global Infrastructure Asset Management LLC (2008-2017), Chief Investment Officer of Nuveen Asset Management (2000-2007), and Managing Director, Nuveen Investment LLC (1988-2007).
56 Board of Directors, Municipal Securities Rulemaking Board (since 2017). Formerly, Board of Directors of Syncora Holdings Ltd, Syncora Guarantee Inc., and Syncora Capital Assurance Inc. (2009-2016), and Trustee, Destra Investment Trust (2010-2014).
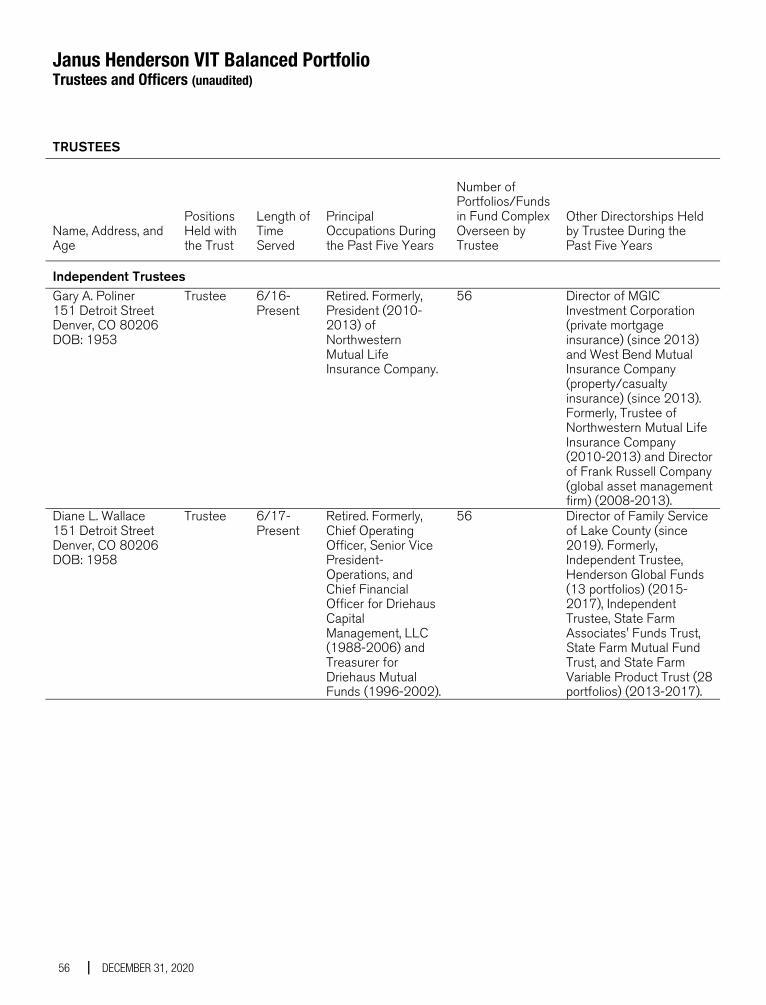
Janus Henderson VIT Balanced Portfolio Trustees and Officers (unaudited)
56 DECEMBER 31, 2020
TRUSTEES
Name, Address, and Age
Positions Held with the Trust
Length of Time Served
Principal Occupations During the Past Five Years
Number of Portfolios/Funds in Fund Complex Overseen by Trustee
Other Directorships Held by Trustee During the Past Five Years
Independent Trustees
Gary A. Poliner 151 Detroit Street Denver, CO 80206 DOB: 1953
Trustee 6/16-Present
Retired. Formerly, President (2010-2013) of Northwestern Mutual Life Insurance Company.
56 Director of MGIC Investment Corporation (private mortgage insurance) (since 2013) and West Bend Mutual Insurance Company (property/casualty insurance) (since 2013). Formerly, Trustee of Northwestern Mutual Life Insurance Company (2010-2013) and Director of Frank Russell Company (global asset management firm) (2008-2013).
Diane L. Wallace 151 Detroit Street Denver, CO 80206 DOB: 1958
Trustee 6/17-Present
Retired. Formerly, Chief Operating Officer, Senior Vice President-Operations, and Chief Financial Officer for Driehaus Capital Management, LLC (1988-2006) and Treasurer for Driehaus Mutual Funds (1996-2002).
56 Director of Family Service of Lake County (since 2019). Formerly, Independent Trustee, Henderson Global Funds (13 portfolios) (2015-2017), Independent Trustee, State Farm Associates' Funds Trust, State Farm Mutual Fund Trust, and State Farm Variable Product Trust (28 portfolios) (2013-2017).
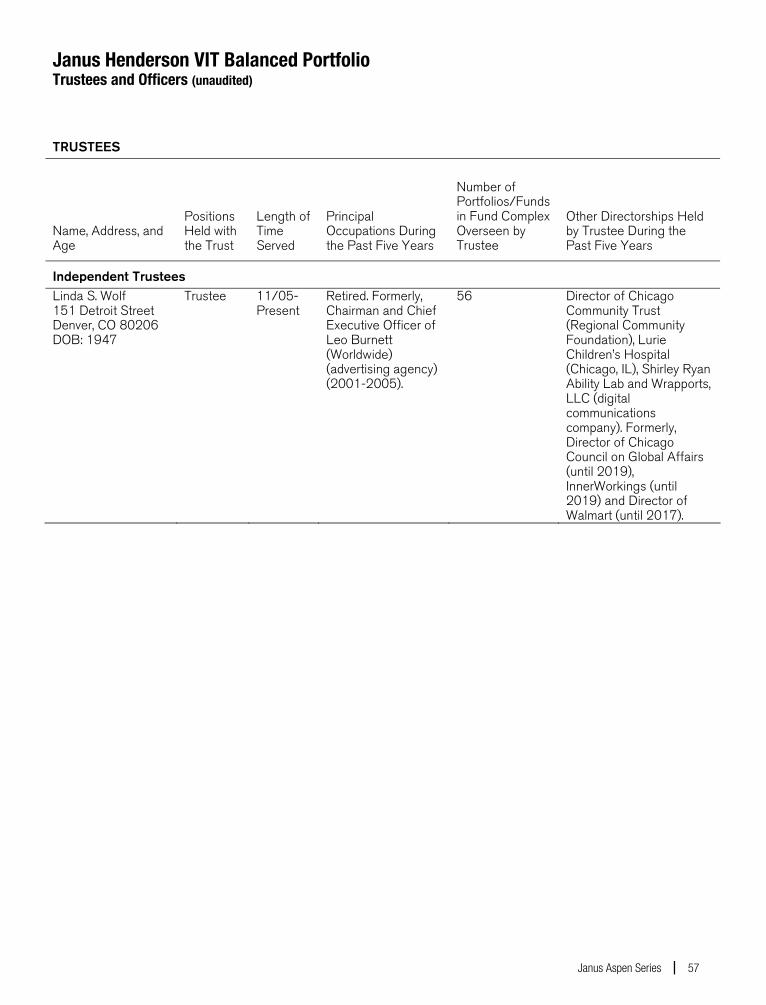
Janus Henderson VIT Balanced Portfolio Trustees and Officers (unaudited)
Janus Aspen Series 57
TRUSTEES
Name, Address, and Age
Positions Held with the Trust
Length of Time Served
Principal Occupations During the Past Five Years
Number of Portfolios/Funds in Fund Complex Overseen by Trustee
Other Directorships Held by Trustee During the Past Five Years
Independent Trustees
Linda S. Wolf 151 Detroit Street Denver, CO 80206 DOB: 1947
Trustee 11/05-Present
Retired. Formerly, Chairman and Chief Executive Officer of Leo Burnett (Worldwide) (advertising agency) (2001-2005).
56 Director of Chicago Community Trust (Regional Community Foundation), Lurie Children’s Hospital (Chicago, IL), Shirley Ryan Ability Lab and Wrapports, LLC (digital communications company). Formerly, Director of Chicago Council on Global Affairs (until 2019), InnerWorkings (until 2019) and Director of Walmart (until 2017).

Janus Henderson VIT Balanced Portfolio Trustees and Officers (unaudited)
58 DECEMBER 31, 2020
OFFICERS Name, Address, and Age
Positions Held with the Trust Term of Office* and Length of Time Served
Principal Occupations During the Past Five Years
Jeremiah Buckley 151 Detroit Street Denver, CO 80206 DOB: 1976
Executive Vice President and Co-Portfolio Manager Janus Henderson Balanced Portfolio
12/15-Present
Portfolio Manager for other Janus Henderson accounts.
Marc Pinto 151 Detroit Street Denver, CO 80206 DOB: 1961
Executive Vice President and Co-Portfolio Manager Janus Henderson Balanced Portfolio
5/05-Present
Portfolio Manager for other Janus Henderson accounts.
Michael Keough 151 Detroit Street Denver, CO 80206 DOB: 1978
Executive Vice President and Co-Portfolio Manager Janus Henderson Balanced Portfolio
12/19 - Present Portfolio Manager for other Janus Henderson accounts.
Greg Wilensky 151 Detroit Street Denver, CO 80206 DOB: 1967
Executive Vice President and Co-Portfolio Manager Janus Henderson Balanced Portfolio
2/20-Present Head of U.S. Fixed Income of Janus Henderson Investors and Portfolio Manager for other Janus Henderson accounts. Formerly, Director and Lead Portfolio Manager of the U.S. Multi-Sector Fixed Income team at AllianceBernstein (2007-2019).
* Officers are elected at least annually by the Trustees for a one-year term and may also be elected from time to time by the Trustees for an interim period.

Janus Henderson VIT Balanced Portfolio Trustees and Officers (unaudited)
Janus Aspen Series 59
OFFICERS Name, Address, and Age
Positions Held with the Trust Term of Office* and Length of Time Served
Principal Occupations During the Past Five Years
Bruce L. Koepfgen 151 Detroit Street Denver, CO 80206 DOB: 1952
President and Chief Executive Officer
7/14-Present Executive Vice President and Head of North America at Janus Henderson Investors (since 2017), President and Head of North America at Janus Capital Management LLC (since 2013 and 2017, respectively), President at Janus Capital Group Inc. (since 2013), President and Director at Janus International Holding LLC (since 2019 and 2011, respectively), President at Janus Holdings LLC (since 2019), President and Director at Janus Management Holdings Corporation (since 2017 and 2012, respectively), Executive Vice President and Head of North America at Janus Distributors LLC (since 2011 and 2019, respectively), Vice President and Director at Intech Investment Management LLC (since 2012), and Executive Vice President at Perkins Investment Management LLC (since 2011). Formerly, Executive Vice President at Janus Capital Group Inc., Janus International Holding LLC, and Janus Management Holdings Corporation (2011-2019), Director at Perkins Investment Management LLC (2011-2019), and Chief Financial Officer at Janus Capital Group Inc. (2011-2013).
* Officers are elected at least annually by the Trustees for a one-year term and may also be elected from time to time by the Trustees for an interim period.
Janus Henderson VIT Balanced Portfolio Trustees and Officers (unaudited)
60 DECEMBER 31, 2020
OFFICERS Name, Address, and Age
Positions Held with the Trust Term of Office* and Length of Time Served
Principal Occupations During the Past Five Years
Kristin Mariani 151 Detroit Street Denver, CO 80206 DOB: 1966
Vice President, Chief Compliance Officer, and Anti-Money Laundering Officer
7/20-Present Head of Compliance, North America for Janus Henderson Investors (since September 2020), and Chief Compliance Officer for Janus Capital Management LLC (since September 2017). Formerly, Global Head of Investment Management Compliance for Janus Henderson Investors (February 2019 – August 2020), Vice President, Head of Global Distribution Compliance and Chief Compliance Officer of Janus Henderson Distributors (May 2017-September 2017), Vice President, Compliance at Janus Capital Group Inc., Janus Capital Management LLC, and Janus Distributors LLC (2009-2017).
Jesper Nergaard 151 Detroit Street Denver, CO 80206 DOB: 1962
Chief Financial Officer Vice President, Treasurer, and Principal Accounting Officer
3/05-Present 2/05-Present
Head of U.S. Fund Administration, Janus Henderson Investors and Janus Services LLC.
Abigail J. Murray 151 Detroit Street Denver, CO 80206 DOB: 1975
Vice President, Chief Legal Officer, and Secretary
12/20-Present Managing Counsel (2020-present). Formerly, Senior Counsel for Invesco Ltd. (2017-2020), and Vice President and Senior Counsel, ALPS Fund Services, Inc. and Assistant General Counsel, ALPS Advisors, Inc. (2015-2017).
* Officers are elected at least annually by the Trustees for a one-year term and may also be elected from time to time by the Trustees for an interim period.

Janus Henderson VIT Balanced Portfolio Notes
Janus Aspen Series 61
NotesPage1

This report is submitted for the general information of shareholders of the Portfolio. It is not an offer or solicitation for the Portfolio and is not authorized for distribution to prospective investors unless preceded or accompanied by an effective prospectus. Janus Henderson, Janus, Henderson, Perkins, and Intech are trademarks of Janus Henderson Group plc or one of its subsidiaries. © Janus Henderson Group plc Janus Henderson Distributors
109-02-81113 03-21