Embed Size (px)
Citation preview

8/13/2019 Kri05
http://slidepdf.com/reader/full/kri05 1/177
EERL 2005-01
Earthquake Engineering
Research Laboratory
Performance of 18-Story Steel Moment-Frame Buildings During a Large
San Andreas Earthquake – A Southern California-Wide End-to-End
Simulation
by
Swaminathan Krishnan, Chen Ji, Dimitri Komatitsch, and Jeroen Tromp
This study was conducted at the
Seismological Laboratory
1891
C A
L I F
O
R N
I A
I N
S T I TU T E O
F T E
C H
N
O L
O G Y
California Institute of TechnologyPasadena, California
2005

8/13/2019 Kri05
http://slidepdf.com/reader/full/kri05 2/177
ii
c 2005
Swaminathan Krishnan, Chen Ji, Dimitri Komatitsch, and Jeroen Tromp
All Rights Reserved

8/13/2019 Kri05
http://slidepdf.com/reader/full/kri05 3/177
iii
Acknowledgements
We wish to gratefully acknowledge the funding provided by the Seismological Laboratory at the California Institute
of Technology. We also wish to thank Professors John F. Hall, Thomas Heaton, and Hiroo Kanamori of the California
Institute of Technology for their insights and advice during the course of this study. The numerical simulations were
performed on the Division of Geological & Planetary Sciences Dell cluster at the California Institute of Technology,
USA, and the Seawulf cluster at the University of Toronto, Canada.

8/13/2019 Kri05
http://slidepdf.com/reader/full/kri05 4/177
iv
Summary
The mitigation of seismic risk in urban areas in the United States and abroad is of major concern for all governments.
Unfortunately no comprehensive studies have attempted to address this issue in a rigorous, quantitative manner. This
study tackles this problem head-on for two 18-story steel moment-frame buildings in southern California. The ap-
proach adopted here can be used as a template to study earthquake risk in other seismically sensitive regions of the
world, such as Taiwan, Japan, Indonesia, China, South American countries (Chile, Bolivia, etc.), and the west coast of
the United States (in particular, Seattle).
In 1857 a large earthquake of magnitude 7.9 [1] occurred on the San Andreas fault with rupture initiating at
Parkfield in Central California and propagating in a southeasterly direction over a distance of more than 360 km.
Such a unilateral rupture produces significant directivity toward the San Fernando and Los Angeles basins. Indeed,
newspaper reports (Los Angeles Star [2, 3]) of sloshing observed in the Los Angeles river point to long-duration (1–2
min) and long-period (2–8 s) shaking which could have a severe impact on present-day tall buildings, especially in the
mid-height range. To assess the risk posing the two steel moment-frame buildings from an 1857-like earthquake on theSan Andreas fault, a finite source model of the magnitude 7.9 November 3, 2002 Denali fault earthquake is mapped on
to the San Andreas fault with rupture initiating at Parkfield in Central California and propagating a distance of about
290 km in a south-easterly direction. As the rupture proceeds down south from Parkfield and hits the big bend on the
San Andreas fault it sheds off a significant amount of energy into the San Fernando valley, generating large amplitude
ground motion there. A good portion of this energy spills over into the Los Angeles basin with many cities along
the coast such as Santa Monica and Seal Beach and more inland areas going east from Seal beach towards Anaheim
experiencing long-duration shaking. In addition, the tail-end of the rupture sheds energy from SH/Love waves into the
San Gabriel valley (Baldwin Park-La Puente region). These seismic waves get trapped and amplified in the basin. The
peak velocity is of the order of 1 m.s−1 in the Los Angeles basin, including downtown Los Angeles, and 2 m.s−1 in the
San Fernando valley. Significant displacements occur in the basins but not in the mountains. The peak displacements
are in the neighborhood of 1 m in the Los Angeles basin and 2 m in the San Fernando valley. The ground motionsimulation is performed using the spectral element method based seismic wave propagation program, SPECFEM3D.
To study the effects of the ground motion simulated at 636 sites (spread across southern California, spaced at
about 3.5 km each way), computer models of an existing 18-story steel moment-frame building and a redesigned
building with the same configuration (redesigned to current standards using the 1997 Uniform Building Code) are
analyzed using the nonlinear structural analysis program, FRAME3D. For these analyses, the building Y direction is
aligned with the geographical north direction. As expected, the existing building model fares much worse than the
redesigned building model. Fracture occurs in at least 25% of the connections in this building when located in the
San Fernando valley. About 10% of connections fracture in the building when located in downtown Los Angeles and
the mid-Wilshire district (Beverly Hills), while the numbers are about 20% when it is located in Santa Monica, west
Los Angeles, Inglewood , Alhambra, Baldwin Park, La Puente, Downey, Norwalk, Brea, Fullerton, Anaheim and Seal
Beach. The peak interstory drifts in the middle-third and bottom-third of the existing building are far greater than the
top-third pointing to damage being localized to the lower floors. The localization of damage in the lower floors rather
than the upper floors could potentially be worse because of the risk of more floors pancaking on top of each other if a
single story gives way. Consistent with the extent of fracture observed, the peak drifts in the existing building exceed
0.10 when located in the San Fernando valley, Baldwin Park and neighboring cities, Santa Monica, west Los Angeles
and neighboring cities, Norwalk and neighboring cities, and Seal Beach and neighboring cities, which is well into the
postulated collapse regime. When located in downtown Los Angeles and the mid-Wilshire district, the building would

8/13/2019 Kri05
http://slidepdf.com/reader/full/kri05 5/177
v
barely satisfy the collapse prevention criteria set by FEMA [4] with peak drifts of about 0.05.
The performance of the newly designed 18-story steel building is significantly better than the existing building
for the entire region. However, the new building still has significant drifts indicative of serious damage when located
in the San Fernando valley or the Baldwin Park area. When located in coastal cities (such as Santa Monica, Seal
Beach etc.), the Wilshire-corridor (west Los Angeles, Beverly Hills, etc.), Norwalk and neighboring cities, or the
booming Orange County cities of Anaheim and Santa Ana, it has peak drifts of about 0.05 once again barely satisfying
the FEMA collapse prevention criteria [5]. In downtown Los Angeles it does not undergo much damage in this
scenario. Thus, even though this building has been designed according to the latest code it suffers damage that would
necessitate closure for some time following the earthquake in most areas, but this should be expected since this is a
large earthquake and building codes are written to limit the loss of life and ensure “collapse prevention” for such large
earthquakes and not necessarily limit damage.
A second scenario considered in the study involves the same Denali earthquake source mapped to the San Andreas
fault but with rupture initiating in the south and propagating to the north (with the largest amount of slip occurring to
the north in Central California) instead of the other way around. The results of such a scenario indicate that ground
shaking would be far less severe demonstrating the effects of directivity and slip distribution in dictating the level of
ground shaking and the associated damage in buildings. The peak drifts in existing and redesigned building models
are in the range of 0.02–0.04 indicating that there is no significant danger of collapse. However, damage would stillbe significant enough to warrant building closures and compromise life safety in some instances.
The ground motion simulation and the structural damage modeling procedures are validated using data from the
January 17, 1994, Northridge earthquake while the band-limited nature of the ground motion simulation (limited to
a shortest period of 2 s by the current state of knowledge of the 3-D Earth structure) is shown to have no significant
effect on the response of the two tall buildings considered here with the use of observed records from the 1999 Chi
Chi earthquake in Taiwan and the 2001 Tokachi-Oki earthquake in Japan.

8/13/2019 Kri05
http://slidepdf.com/reader/full/kri05 6/177
vi
Contents
Acknowledgements iii
Summary iv
1 Introduction 1
1.1 Scope of the Simulation . . . . . . . . . . . . . . . . . . . . . . . . . . . . . . . . . . . . . . . . . . 2
1.1.1 Scenarios Considered . . . . . . . . . . . . . . . . . . . . . . . . . . . . . . . . . . . . . . . 2
1.1.2 Buildings Considered . . . . . . . . . . . . . . . . . . . . . . . . . . . . . . . . . . . . . . . 2
1.1.3 End-to-End Simulations . . . . . . . . . . . . . . . . . . . . . . . . . . . . . . . . . . . . . 3
2 Building Details 4
2.1 Existing Building . . . . . . . . . . . . . . . . . . . . . . . . . . . . . . . . . . . . . . . . . . . . . 4
2.2 Redesigned (New) Building . . . . . . . . . . . . . . . . . . . . . . . . . . . . . . . . . . . . . . . . 4
2.3 Gravity Loading Criteria for the Two Buildings . . . . . . . . . . . . . . . . . . . . . . . . . . . . . 5
2.4 Seismic Criteria for the Design of the New Building . . . . . . . . . . . . . . . . . . . . . . . . . . . 5
2.5 Wind Criteria for the Design of the New Building . . . . . . . . . . . . . . . . . . . . . . . . . . . . 9
2.6 Design of the New Building per UBC97 Using the Commercial Program ETABS . . . . . . . . . . . 11
2.7 Nonlinear Analysis of Buildings . . . . . . . . . . . . . . . . . . . . . . . . . . . . . . . . . . . . . 14
2.7.1 Analysis Assumptions . . . . . . . . . . . . . . . . . . . . . . . . . . . . . . . . . . . . . . 14
2.7.2 Pushover Analyses of the Two Buildings . . . . . . . . . . . . . . . . . . . . . . . . . . . . 15
3 Software Used for the End-to-End Simulations 20
3.1 SPECFEM3D . . . . . . . . . . . . . . . . . . . . . . . . . . . . . . . . . . . . . . . . . . . . . . . 20
3.2 FRAME3D . . . . . . . . . . . . . . . . . . . . . . . . . . . . . . . . . . . . . . . . . . . . . . . . 20
4 Limitations of the Study 23
5 Validation Using the Northridge Earthquake Data 25
6 Effect of Filtering Records on Building Analyses 32
7 Past Earthquakes on the San Andreas Fault 37
8 Source Model Used in the Simulation of the Magnitude 7.9 Earthquakes on the San Andreas Fault 38
9 Scenario 1: North-to-South Rupture of the San Andreas Fault 44
10 Scenario 2: South-to-North Rupture of the San Andreas Fault 58
11 Conclusions 70
12 Future Research 72

8/13/2019 Kri05
http://slidepdf.com/reader/full/kri05 7/177
8/13/2019 Kri05
http://slidepdf.com/reader/full/kri05 8/177
viii
List of Figures
1.1 Geographical scope of the simulation (The color scheme reflects topography, with green denoting low
elevation and yellow denoting mountains): The solid black triangles denote the 636 sites at which
seismograms are computed and buildings are analyzed. The white box is the surface projection of the
Northridge fault. The red line in the inset is the surface trace of the 290 km rupture of the San Andreas
fault that is the primary focus of this study. The area enclosed by the blue polygon denotes the region
covered by the 636 sites. . . . . . . . . . . . . . . . . . . . . . . . . . . . . . . . . . . . . . . . . . 3
2.1 Structural models of buildings studied: [A] Perspective view of existing building (designed using
codes prior to the 1997 Uniform Building Code). [B] Perspective view of redesigned (new) building
(redesigned using the 1997 Uniform Building Code). . . . . . . . . . . . . . . . . . . . . . . . . . . 5
2.2 Plans of the existing building showing the location of columns and moment-frame (MF) beams (the
frame elevations with beam and column sizes are given in Appendix B). . . . . . . . . . . . . . . . . 6
2.3 Plans of the redesigned building showing the location of columns and moment-frame (MF) beams (the
frame elevations with beam and column sizes are given in Appendix C). Note the greater number of
moment-frame bays in the redesigned building. . . . . . . . . . . . . . . . . . . . . . . . . . . . . . 7
2.4 The 1997 Uniform Building Code response spectrum used in the design of the new building (C a =
0.48 and C v = 0.64). . . . . . . . . . . . . . . . . . . . . . . . . . . . . . . . . . . . . . . . . . . . 10
2.5 Pushover analysis of the existing and the redesigned buildings: (A) X direction pushover – roof dis-
placement versus base shear. (B) X direction pushover – base shear (solid lines) and roof displacements
(dashed lines) as functions of time. (C) Y direction pushover – roof displacement versus base shear.
(D) Y direction pushover – base shear (solid lines) and roof displacements (dashed lines) as functions
of time. . . . . . . . . . . . . . . . . . . . . . . . . . . . . . . . . . . . . . . . . . . . . . . . . . . 19
3.1 Element arrangement in frame model showing joint nodes, attachment points, local beam nodes and
coordinate systems. . . . . . . . . . . . . . . . . . . . . . . . . . . . . . . . . . . . . . . . . . . . . 22
5.1 Slip model for the January 17, 1994, magnitude 6.7 Northridge earthquake determined using a wavelet
transform approach. The red star denotes the hypocenter and the white arrows denote the slip vector.
The dip angle of the fault is 40 degrees (see Figure 1.1 for the surface projection of the fault) . . . . . 25
5.2 Northridge simulation – Data versus synthetic seismograms: (A) nearby stations north of the rupture;
(B) distant stations. . . . . . . . . . . . . . . . . . . . . . . . . . . . . . . . . . . . . . . . . . . . . 26
5.3 Northridge validation – analysis of existing building in Woodland Hills subjected to Oxnard Blvd.
record (WHOX): Measured 18th floor (A) N-S and (B) E-W displacements versus corresponding com-
puted displacements. . . . . . . . . . . . . . . . . . . . . . . . . . . . . . . . . . . . . . . . . . . . 28
5.4 Analysis of the existing building subjected to the Oxnard Boulevard, Woodland Hills (WHOX) record
from Northridge earthquake (station located 0.5 mile from the building): Observed connection frac-
tures (squares) versus simulated fractures (solid triangles) – (A) South moment-frame (along grid A,
east-west direction) of the building (Frame 1); (B) North moment-frame (along grid D, east-west di-
rection) of the building (Frame 4); (C) West moment-frame (along grid 1, north-south direction) of
the building (Frame 6); (D) East moment-frame (along grid 6, north-south direction) of the building
(Frame 7). . . . . . . . . . . . . . . . . . . . . . . . . . . . . . . . . . . . . . . . . . . . . . . . . . 29
8/13/2019 Kri05
http://slidepdf.com/reader/full/kri05 9/177
ix
5.5 Comparison of the horizontal components of velocity of three records from the 1994 Northridge earth-
quake, SATI, CNPK, and WHOX (Source: URS Corporation). . . . . . . . . . . . . . . . . . . . . . 30
5.6 Permanent offsets on the four faces of the existing building model (penthouse plan shown here) com-
puted using the WHOX record from the Northridge earthquake. . . . . . . . . . . . . . . . . . . . . . 31
6.1 Pseudo-acceleration response spectra of records (north component) from the Chi-Chi and Tokachi-Oki
earthquakes: Comparison of spectra of unfiltered (solid) and filtered (dashed) records. . . . . . . . . . 336.2 Pseudo-acceleration response spectra of records (east component) from the Chi-Chi and Tokachi-Oki
earthquakes: Comparison of spectra of unfiltered (solid) and filtered (dashed) records. . . . . . . . . . 34
6.3 Peak drifts observed in the existing building – analyses using filtered and unfiltered records. Pen colors
used to plot the points match those used in Figures 6.1 and 6.2. . . . . . . . . . . . . . . . . . . . . . 35
6.4 Peak drifts observed in the redesigned building – analyses using filtered and unfiltered records. Pen
colors used to plot the points match those used in Figures 6.1 and 6.2. . . . . . . . . . . . . . . . . . 36
8.1 Slip distribution of the 2002 Denali earthquake constrained by teleseismic body and strong motion
waveforms as well as GPS vectors. The color scheme reflects the slip amplitude and contours reflect
the rupture initiation time. The hypocenter is indicated by the red star. White arrows denote the slip
direction and magnitude . . . . . . . . . . . . . . . . . . . . . . . . . . . . . . . . . . . . . . . . . 38
8.2 Surface slip, particle velocity, and rupture time, for the simulated magnitude 7.9 earthquake on the San
Andreas fault – north-to-south rupture. . . . . . . . . . . . . . . . . . . . . . . . . . . . . . . . . . . 39
8.3 Surface slip, particle velocity, and rupture time, for the simulated magnitude 7.9 earthquake on the San
Andreas fault – north-to-south rupture, capped particle velocity case. . . . . . . . . . . . . . . . . . . 40
8.4 1999 ChiChi earthquake: Peak ground velocities. . . . . . . . . . . . . . . . . . . . . . . . . . . . . 42
8.5 Denali source inversion: Data (black) versus synthetic seismograms (red) for Pump Station 10 (3 km
from the fault trace). . . . . . . . . . . . . . . . . . . . . . . . . . . . . . . . . . . . . . . . . . . . 43
9.1 M w7.9 earthquake (north-to-south rupture) on the San Andreas Fault – ground shaking: Map of peak
velocities (east component). . . . . . . . . . . . . . . . . . . . . . . . . . . . . . . . . . . . . . . . 47
9.2 M w7.9 earthquake (north-to-south rupture) on the San Andreas fault – ground shaking: Map of peak
velocities (north component). . . . . . . . . . . . . . . . . . . . . . . . . . . . . . . . . . . . . . . . 48
9.3 M w7.9 earthquake (north-to-south rupture) on the San Andreas fault – ground shaking: Map of peak
velocities (vertical component). . . . . . . . . . . . . . . . . . . . . . . . . . . . . . . . . . . . . . . 48
9.4 M w7.9 earthquake (north-to-south rupture) on the San Andreas fault – ground shaking: Map of peak
displacements (east component). . . . . . . . . . . . . . . . . . . . . . . . . . . . . . . . . . . . . . 49
9.5 M w7.9 earthquake (north-to-south rupture) on the San Andreas fault – ground shaking: Map of peak
displacements (north component). . . . . . . . . . . . . . . . . . . . . . . . . . . . . . . . . . . . . 49
9.6 M w7.9 earthquake (north-to-south rupture) on the San Andreas fault – ground shaking: Map of peak
displacements (vertical component). . . . . . . . . . . . . . . . . . . . . . . . . . . . . . . . . . . . 50
9.7 M w7.9 earthquake (north-to-south rupture) on the San Andreas fault – existing building performance:
Peak drift ratios in the top-third of the building. . . . . . . . . . . . . . . . . . . . . . . . . . . . . . 51
9.8 M w7.9 earthquake (north-to-south rupture) on the San Andreas fault – existing building performance:
Peak drift ratios in the middle-third of the building. . . . . . . . . . . . . . . . . . . . . . . . . . . . 52
9.9 M w7.9 earthquake (north-to-south rupture) on the San Andreas fault – existing building performance:
Peak drift ratios in the bottom-third of the building. . . . . . . . . . . . . . . . . . . . . . . . . . . . 52
9.10 M w7.9 earthquake (north-to-south rupture) on the San Andreas fault – existing building performance:
Peak drift ratios anywhere in the building. . . . . . . . . . . . . . . . . . . . . . . . . . . . . . . . . 53

8/13/2019 Kri05
http://slidepdf.com/reader/full/kri05 10/177
x
9.11 M w7.9 earthquake (north-to-south rupture) on the San Andreas fault – existing building performance:
Permanent offset at the penthouse level. . . . . . . . . . . . . . . . . . . . . . . . . . . . . . . . . . 53
9.12 M w7.9 earthquake (north-to-south rupture) on the San Andreas fault – existing building performance:
Percentage of connections that fracture (out of a total of 710 connections with the two ends of each
moment-frame beam and column defined as connections). . . . . . . . . . . . . . . . . . . . . . . . . 54
9.13 M w7.9 earthquake (north-to-south rupture) on the San Andreas fault – redesigned building perfor-
mance: Peak drift ratios in the top-third of the building. . . . . . . . . . . . . . . . . . . . . . . . . . 55
9.14 M w7.9 earthquake (north-to-south rupture) on the San Andreas fault – redesigned building perfor-
mance: Peak drift ratios in the middle-third of the building. . . . . . . . . . . . . . . . . . . . . . . . 55
9.15 M w7.9 earthquake (north-to-south rupture) on the San Andreas fault – redesigned building perfor-
mance: Peak drift ratios in the bottom-third of the building. . . . . . . . . . . . . . . . . . . . . . . . 56
9.16 M w7.9 earthquake (north-to-south rupture) on the San Andreas fault – Redesigned Building Perfor-
mance: Peak drift ratios anywhere in the building. . . . . . . . . . . . . . . . . . . . . . . . . . . . . 56
9.17 M w7.9 earthquake (north-to-south rupture) on the San Andreas Fault – redesigned building perfor-
mance: Permanent offset at the penthouse level. . . . . . . . . . . . . . . . . . . . . . . . . . . . . . 57
10.1 Surface slip, particle velocity, and rupture time, for the simulated magnitude 7.9 earthquake on the San
Andreas fault – south-to-north rupture . . . . . . . . . . . . . . . . . . . . . . . . . . . . . . . . . . 59
10.2 M w7.9 earthquake (south-to-north rupture) on the San Andreas fault – ground shaking: Map of peak
velocities (east component). . . . . . . . . . . . . . . . . . . . . . . . . . . . . . . . . . . . . . . . 60
10.3 M w7.9 earthquake (south-to-north rupture) on the San Andreas fault – ground shaking: Map of peak
velocities (north component). . . . . . . . . . . . . . . . . . . . . . . . . . . . . . . . . . . . . . . . 60
10.4 M w7.9 earthquake (south-to-north rupture) on the San Andreas fault – ground shaking: Map of peak
velocities (vertical component). . . . . . . . . . . . . . . . . . . . . . . . . . . . . . . . . . . . . . . 61
10.5 M w7.9 earthquake (south-to-north rupture) on the San Andreas fault – ground shaking: Map of peak
displacements (east component). . . . . . . . . . . . . . . . . . . . . . . . . . . . . . . . . . . . . . 61
10.6 M w7.9 earthquake (south-to-north rupture) on the San Andreas fault – ground shaking: Map of peak
displacements (north component). . . . . . . . . . . . . . . . . . . . . . . . . . . . . . . . . . . . . 6210.7 M w7.9 earthquake (south-to-north rupture) on the San Andreas fault – ground shaking: Map of peak
displacements (vertical component). . . . . . . . . . . . . . . . . . . . . . . . . . . . . . . . . . . . 62
10.8 M w7.9 earthquake (south-to-north rupture) on the San Andreas fault – existing building performance:
Peak drift ratios in the top-third of the building. . . . . . . . . . . . . . . . . . . . . . . . . . . . . . 63
10.9 M w7.9 earthquake (south-to-north rupture) on the San Andreas fault – existing building performance:
Peak drift ratios in the middle-third of the building. . . . . . . . . . . . . . . . . . . . . . . . . . . . 64
10.10M w7.9 earthquake (south-to-north rupture) on the San Andreas fault – existing building performance:
Peak drift ratios in the bottom-third of the building. . . . . . . . . . . . . . . . . . . . . . . . . . . . 64
10.11M w7.9 earthquake (south-to-north rupture) on the San Andreas fault – existing building performance:
Peak drift ratios anywhere in the building. . . . . . . . . . . . . . . . . . . . . . . . . . . . . . . . . 65
10.12M w7.9 earthquake (south-to-north rupture) on the San Andreas fault – existing building performance:
Permanent offset at the penthouse level. . . . . . . . . . . . . . . . . . . . . . . . . . . . . . . . . . 65
10.13M w7.9 earthquake (south-to-north rupture) on the San Andreas fault – existing building performance:
Percentage of connections that fracture (out of a total of 710 connections with the two ends of each
moment-frame beam and column defined as connections). . . . . . . . . . . . . . . . . . . . . . . . . 66
10.14M w7.9 earthquake (south-to-north rupture) on the San Andreas fault – redesigned building perfor-
mance: Peak drift ratios in the top-third of the building. . . . . . . . . . . . . . . . . . . . . . . . . . 67

8/13/2019 Kri05
http://slidepdf.com/reader/full/kri05 11/177
xi
10.15M w7.9 earthquake (south-to-north rupture) on the San Andreas fault – redesigned building perfor-
mance: Peak drift ratios in the middle-third of the building. . . . . . . . . . . . . . . . . . . . . . . . 67
10.16M w7.9 earthquake (south-to-north rupture) on the San Andreas fault – redesigned building perfor-
mance: Peak drift ratios in the bottom-third of the building. . . . . . . . . . . . . . . . . . . . . . . . 68
10.17M w7.9 earthquake (south-to-north rupture) on the San Andreas fault – redesigned building perfor-
mance: Peak drift ratios anywhere in the building. . . . . . . . . . . . . . . . . . . . . . . . . . . . . 68
10.18M w7.9 earthquake (south-to-north rupture) on the San Andreas fault – redesigned building perfor-
mance: Permanent offset at the penthouse level. . . . . . . . . . . . . . . . . . . . . . . . . . . . . . 69
B.1 Frame 1 elevation: Existing building . . . . . . . . . . . . . . . . . . . . . . . . . . . . . . . . . . . 75
B.2 Frame 2 elevation: Existing building . . . . . . . . . . . . . . . . . . . . . . . . . . . . . . . . . . . 76
B.3 Frame 3 elevation: Existing building . . . . . . . . . . . . . . . . . . . . . . . . . . . . . . . . . . . 77
B.4 Frame 4 elevation: Existing building . . . . . . . . . . . . . . . . . . . . . . . . . . . . . . . . . . . 78
B.5 Frame 5 elevation: Existing building . . . . . . . . . . . . . . . . . . . . . . . . . . . . . . . . . . . 79
B.6 Frame 6 elevation: Existing building . . . . . . . . . . . . . . . . . . . . . . . . . . . . . . . . . . . 80
C.1 Frame 1 elevation: Redesigned building . . . . . . . . . . . . . . . . . . . . . . . . . . . . . . . . . 82
C.2 Frame 2 elevation: Redesigned building . . . . . . . . . . . . . . . . . . . . . . . . . . . . . . . . . 83
C.3 Frame 3 elevation: Redesigned building . . . . . . . . . . . . . . . . . . . . . . . . . . . . . . . . . 84
C.4 Frame 4 elevation: Redesigned building . . . . . . . . . . . . . . . . . . . . . . . . . . . . . . . . . 85
C.5 Frame 5 elevation: Redesigned building . . . . . . . . . . . . . . . . . . . . . . . . . . . . . . . . . 86
C.6 Frame 6 elevation: Redesigned building . . . . . . . . . . . . . . . . . . . . . . . . . . . . . . . . . 87
C.7 Frame 7 elevation: Redesigned building . . . . . . . . . . . . . . . . . . . . . . . . . . . . . . . . . 88
C.8 Frame 8 elevation: Redesigned building . . . . . . . . . . . . . . . . . . . . . . . . . . . . . . . . . 89
C.9 Frame 9 elevation: Redesigned building . . . . . . . . . . . . . . . . . . . . . . . . . . . . . . . . . 90
D.1 M w7.9 earthquake (north-to-south rupture) on the San Andreas fault – existing building performance:
Percentage of connections with plastic rotation exceeding the FEMA356 Immediate Occupancy (IO)
level. . . . . . . . . . . . . . . . . . . . . . . . . . . . . . . . . . . . . . . . . . . . . . . . . . . . . 91
D.2 M w7.9 earthquake (north-to-south rupture) on the San Andreas fault – existing building performance:
Percentage of connections with plastic rotation exceeding the FEMA356 Life Safety (LS) level. . . . 92
D.3 M w7.9 earthquake (north-to-south rupture) on the San Andreas fault – existing building performance:
Percentage of connections with plastic rotation exceeding the FEMA356 Collapse Prevention (CP) level. 92
D.4 M w7.9 earthquake (north-to-south rupture) on the San Andreas fault – redesigned building perfor-
mance: Percentage of connections with plastic rotation exceeding the FEMA356 Immediate Occu-
pancy (IO) level. . . . . . . . . . . . . . . . . . . . . . . . . . . . . . . . . . . . . . . . . . . . . . 93
D.5 M w7.9 earthquake (north-to-south rupture) on the San Andreas fault – redesigned building perfor-
mance: Percentage of connections with plastic rotation exceeding the FEMA356 Life Safety (LS)
level. . . . . . . . . . . . . . . . . . . . . . . . . . . . . . . . . . . . . . . . . . . . . . . . . . . . . 93
D.6 M w7.9 earthquake (north-to-south rupture) on the San Andreas fault – redesigned building perfor-
mance: Percentage of connections with plastic rotation exceeding the FEMA356 Collapse Prevention
(CP) level. . . . . . . . . . . . . . . . . . . . . . . . . . . . . . . . . . . . . . . . . . . . . . . . . . 94
E.1 M w7.9 earthquake (south-to-north rupture) on the San Andreas fault – existing building performance:
Percentage of connections with plastic rotation exceeding the FEMA356 Immediate Occupancy (IO)
level. . . . . . . . . . . . . . . . . . . . . . . . . . . . . . . . . . . . . . . . . . . . . . . . . . . . . 95

8/13/2019 Kri05
http://slidepdf.com/reader/full/kri05 12/177
xii
E.2 M w7.9 earthquake (south-to-north rupture) on the San Andreas fault – existing building performance:
Percentage of connections with plastic rotation exceeding the FEMA356 Life Safety (LS) level. . . . 96
E.3 M w7.9 earthquake (south-to-north rupture) on the San Andreas fault – existing building performance:
Percentage of connections with plastic rotation exceeding the FEMA356 Collapse Prevention (CP) level. 96
E.4 M w7.9 earthquake (south-to-north rupture) on the San Andreas fault – redesigned building perfor-
mance: Percentage of connections with plastic rotation exceeding the FEMA356 Immediate Occu-
pancy (IO) level. . . . . . . . . . . . . . . . . . . . . . . . . . . . . . . . . . . . . . . . . . . . . . 97
E.5 M w7.9 earthquake (south-to-north rupture) on the San Andreas fault – redesigned building perfor-
mance: Percentage of connections with plastic rotation exceeding the FEMA356 Life Safety (LS)
level. . . . . . . . . . . . . . . . . . . . . . . . . . . . . . . . . . . . . . . . . . . . . . . . . . . . . 97
E.6 M w7.9 earthquake (south-to-north rupture) on the San Andreas fault – redesigned building perfor-
mance: Percentage of connections with plastic rotation exceeding the FEMA356 Collapse Prevention
(CP) level. . . . . . . . . . . . . . . . . . . . . . . . . . . . . . . . . . . . . . . . . . . . . . . . . . 98
F.1 M w7.9 earthquake (south-to north rupture) on the San Andreas fault – snapshot of building deforma-
tion immediately following the earthquake (scaled up by a factor of 5): Thousand Oaks. Also shown
are the time-histories of the three components of the ground velocity and displacement (bandpass-
filtered between 2 s and 1000 s), and the east and north components of the penthouse displacement of
the existing and redesigned building models. . . . . . . . . . . . . . . . . . . . . . . . . . . . . . . . 100
F.2 Peak east-west/X (white bars) and north-south/Y (black bars) drifts in each story of the existing build-
ing model: Thousand Oaks (the drift scale is saturated at 0.10). . . . . . . . . . . . . . . . . . . . . . 101
F.3 Plastic rotation in percent of a radian in the moment-frames of the existing building model: Thousand
Oaks – (A) Moment-frame along grid A (east-west direction); (B) Moment-frame along grid D (east-
west direction); (C) Moment-frame along grid 1 (north-south direction); (D) Moment-frame along grid
6 (north-south direction). See Figure 2.2 for moment-frame configuration. . . . . . . . . . . . . . . . 102
F.4 Beam bottom-flange weld fracture locations in the moment-frames of the existing building model:
Thousand Oaks – (A) Moment-frame along grid A (east-west direction); (B) Moment-frame along
grid D (east-west direction); (C) Moment-frame along grid 1 (north-south direction); (D) Moment-frame along grid 6 (north-south direction). See Figure 2.2 for moment-frame configuration. . . . . . . 103
F.5 Peak east-west/X (white bars) and north-south/Y (black bars) drifts in each story of the redesigned
building model: Thousand Oaks. . . . . . . . . . . . . . . . . . . . . . . . . . . . . . . . . . . . . . 104
F.6 Plastic rotation in percent of a radian in the moment-frames of the redesigned building model: Thou-
sand Oaks – (A) Moment-frame along grid A (east-west direction); (B) Moment-frame along grid B
(east-west direction); (C) Moment-frame along grid D (east-west direction); (D) Moment-frame along
grid E (east-west direction). See Figure 2.3 for moment-frame configuration. . . . . . . . . . . . . . 105
F.7 Plastic rotation in percent of a radian in the moment-frames of the redesigned building model: Thou-
sand Oaks – (A) Moment-frame along grid 1 (north-south direction); (B) Moment-frame along grid
2 (north-south direction); (C) Moment-frame along grid 5 (north-south direction); (D) Moment-frame
along grid 6 (north-south direction). See Figure 2.3 for moment-frame configuration. . . . . . . . . . 106
F.8 M w7.9 earthquake (south-to-north rupture) on the San Andreas fault – snapshot of building deforma-
tion immediately following the earthquake (scaled up by a factor of 5): Northridge. Also shown are
the time-histories of the three components of the ground velocity and displacement (bandpass-filtered
between 2 s and 1000 s), and the east and north components of the penthouse displacement of the
existing and redesigned building models. . . . . . . . . . . . . . . . . . . . . . . . . . . . . . . . . . 107
8/13/2019 Kri05
http://slidepdf.com/reader/full/kri05 13/177
xiii
F.9 Peak east-west/X (white bars) and north-south/Y (black bars) drifts in each story of the existing build-
ing model: Northridge (the drift scale is saturated at 0.10). . . . . . . . . . . . . . . . . . . . . . . . 108
F.10 Plastic rotation in percent of a radian in the moment-frames of the existing building model: Northridge
– (A) Moment-frame along grid A (east-west direction); (B) Moment-frame along grid D (east-west
direction); (C) Moment-frame along grid 1 (north-south direction); (D) Moment-frame along grid 6
(north-south direction). See Figure 2.2 for moment-frame configuration. . . . . . . . . . . . . . . . . 109
F.11 Beam bottom-flange weld fracture locations in the moment-frames of the existing building model:
Northridge – (A) Moment-frame along grid A (east-west direction); (B) Moment-frame along grid
D (east-west direction); (C) Moment-frame along grid 1 (north-south direction); (D) Moment-frame
along grid 6 (north-south direction). See Figure 2.2 for moment-frame configuration. . . . . . . . . . 110
F.12 Peak east-west/X (white bars) and north-south/Y (black bars) drifts in each story of the redesigned
building model: Northridge. . . . . . . . . . . . . . . . . . . . . . . . . . . . . . . . . . . . . . . . 111
F.13 Plastic rotation in percent of a radian in the moment-frames of the redesigned building model: Northridge
– (A) Moment-frame along grid A (east-west direction); (B) Moment-frame along grid B (east-west
direction); (C) Moment-frame along grid D (east-west direction); (D) Moment-frame along grid E
(east-west direction). See Figure 2.3 for moment-frame configuration. . . . . . . . . . . . . . . . . . 112
F.14 Plastic rotation in percent of a radian in the moment-frames of the redesigned building model: Northridge– (A) Moment-framealong grid 1 (north-southdirection); (B) Moment-framealong grid 2 (north-south
direction); (C) Moment-frame along grid 5 (north-south direction); (D) Moment-frame along grid 6
(north-south direction). See Figure 2.3 for moment-frame configuration. . . . . . . . . . . . . . . . . 113
F.15 M w7.9 earthquake (south-to-north rupture) on the San Andreas fault – snapshot of building deforma-
tion immediately following the earthquake (scaled up by a factor of 5): West Los Angeles. Also shown
are the time-histories of the three components of the ground velocity and displacement (bandpass-
filtered between 2 s and 1000 s), and the east and north components of the penthouse displacement of
the existing and redesigned building models. . . . . . . . . . . . . . . . . . . . . . . . . . . . . . . . 114
F.16 Peak east-west/X (white bars) and north-south/Y (black bars) drifts in each story of the existing build-
ing model: West Los Angeles (the drift scale is saturated at 0.10). . . . . . . . . . . . . . . . . . . . 115
F.17 Plastic rotation in percent of a radian in the moment-frames of the existing building model: West
Los Angeles – (A) Moment-frame along grid A (east-west direction); (B) Moment-frame along grid
D (east-west direction); (C) Moment-frame along grid 1 (north-south direction); (D) Moment-frame
along grid 6 (north-south direction). See Figure 2.2 for moment-frame configuration. . . . . . . . . . 116
F.18 Beam bottom-flange weld fracture locations in the moment-frames of the existing building model:
West Los Angeles – (A) Moment-frame along grid A (east-west direction); (B) Moment-frame along
grid D (east-west direction); (C) Moment-frame along grid 1 (north-south direction); (D) Moment-
frame along grid 6 (north-south direction). See Figure 2.2 for moment-frame configuration. . . . . . . 117
F.19 Peak east-west/X (white bars) and north-south/Y (black bars) drifts in each story of the redesigned
building model: West Los Angeles. . . . . . . . . . . . . . . . . . . . . . . . . . . . . . . . . . . . . 118
F.20 Plastic rotation in percent of a radian in the moment-frames of the redesigned building model: West
Los Angeles – (A) Moment-frame along grid A (east-west direction); (B) Moment-frame along grid B
(east-west direction); (C) Moment-frame along grid D (east-west direction); (D) Moment-frame along
grid E (east-west direction). See Figure 2.3 for moment-frame configuration. . . . . . . . . . . . . . 119
F.21 Plastic rotation in percent of a radian in the moment-frames of the redesigned building model: West
Los Angeles – (A) Moment-frame along grid 1 (north-south direction); (B) Moment-frame along grid
2 (north-south direction); (C) Moment-frame along grid 5 (north-south direction); (D) Moment-frame
along grid 6 (north-south direction). See Figure 2.3 for moment-frame configuration. . . . . . . . . . 120

8/13/2019 Kri05
http://slidepdf.com/reader/full/kri05 14/177
xiv
F.22 M w7.9 earthquake (south-to-north rupture) on the San Andreas fault – snapshot of building defor-
mation immediately following the earthquake (scaled up by a factor of 5): Downtown Los Angeles.
Also shown are the time-histories of the three components of the ground velocity and displacement
(bandpass-filtered between 2 s and 1000 s), and the east and north components of the penthouse dis-
placement of the existing and redesigned building models. . . . . . . . . . . . . . . . . . . . . . . . 121
F.23 Peak east-west/X (white bars) and north-south/Y (black bars) drifts in each story of the existing build-
ing model: Downtown Los Angeles. . . . . . . . . . . . . . . . . . . . . . . . . . . . . . . . . . . . 122
F.24 Plastic rotation in percent of a radian in the moment-frames of the existing building model: Downtown
Los Angeles – (A) Moment-frame along grid A (east-west direction); (B) Moment-frame along grid
D (east-west direction); (C) Moment-frame along grid 1 (north-south direction); (D) Moment-frame
along grid 6 (north-south direction). See Figure 2.2 for moment-frame configuration. . . . . . . . . . 123
F.25 Beam bottom-flange weld fracture locations in the moment-frames of the existing building model:
Downtown Los Angeles – (A) Moment-frame along grid A (east-west direction); (B) Moment-frame
along grid D (east-west direction); (C) Moment-framealong grid 1 (north-southdirection); (D) Moment-
frame along grid 6 (north-south direction). See Figure 2.2 for moment-frame configuration. . . . . . . 124
F.26 Peak east-west/X (white bars) and north-south/Y (black bars) drifts in each story of the redesigned
building model: Downtown Los Angeles. . . . . . . . . . . . . . . . . . . . . . . . . . . . . . . . . 125F.27 Plastic rotation in percent of a radian in the moment-frames of the redesigned building model: Down-
town Los Angeles – (A) Moment-frame along grid A (east-west direction); (B) Moment-frame along
grid B (east-west direction); (C) Moment-frame along grid D (east-west direction); (D) Moment-frame
along grid E (east-west direction). See Figure 2.3 for moment-frame configuration. . . . . . . . . . . 126
F.28 Plastic rotation in percent of a radian in the moment-frames of the redesigned building model: Down-
town Los Angeles – (A) Moment-frame along grid 1 (north-south direction); (B) Moment-frame along
grid 2 (north-south direction); (C) Moment-frame along grid 5 (north-south direction); (D) Moment-
frame along grid 6 (north-south direction). See Figure 2.3 for moment-frame configuration. . . . . . . 127
F.29 M w7.9 earthquake (south-to-north rupture) on the San Andreas fault – snapshot of building deforma-
tion immediately following the earthquake (scaled up by a factor of 5): Baldwin Park. Also shown are
the time-histories of the three components of the ground velocity and displacement (bandpass-filtered
between 2 s and 1000 s), and the east and north components of the penthouse displacement of the
existing and redesigned building models. . . . . . . . . . . . . . . . . . . . . . . . . . . . . . . . . . 128
F.30 Peak east-west/X (white bars) and north-south/Y (black bars) drifts in each story of the existing build-
ing model: Baldwin Park (the drift scale is saturated at 0.10). . . . . . . . . . . . . . . . . . . . . . . 129
F.31 Plastic rotation in percent of a radian in the moment-frames of the existing building model: Baldwin
Park – (A) Moment-frame along grid A (east-west direction); (B) Moment-frame along grid D (east-
west direction); (C) Moment-frame along grid 1 (north-south direction); (D) Moment-frame along grid
6 (north-south direction). See Figure 2.2 for moment-frame configuration. . . . . . . . . . . . . . . . 130
F.32 Beam bottom-flange weld fracture locations in the moment-frames of the existing building model:
Baldwin Park – (A) Moment-frame along grid A (east-west direction); (B) Moment-frame along grid
D (east-west direction); (C) Moment-frame along grid 1 (north-south direction); (D) Moment-frame
along grid 6 (north-south direction). See Figure 2.2 for moment-frame configuration. . . . . . . . . . 131
F.33 Peak east-west/X (white bars) and north-south/Y (black bars) drifts in each story of the redesigned
building model: Baldwin Park. . . . . . . . . . . . . . . . . . . . . . . . . . . . . . . . . . . . . . . 132
8/13/2019 Kri05
http://slidepdf.com/reader/full/kri05 15/177
xv
F.34 Plastic rotation in percent of a radian in the moment-frames of the redesigned building model: Baldwin
Park – (A) Moment-frame along grid A (east-west direction); (B) Moment-frame along grid B (east-
west direction); (C) Moment-frame along grid D (east-west direction); (D) Moment-frame along grid
E (east-west direction). See Figure 2.3 for moment-frame configuration. . . . . . . . . . . . . . . . . 133
F.35 Plastic rotation in percent of a radian in the moment-frames of the redesigned building model: Baldwin
Park – (A) Moment-frame along grid 1 (north-south direction); (B) Moment-frame along grid 2 (north-
south direction); (C) Moment-frame along grid 5 (north-south direction); (D) Moment-frame along
grid 6 (north-south direction). See Figure 2.3 for moment-frame configuration. . . . . . . . . . . . . 134
F.36 M w7.9 earthquake south-to-north rupture) on the San Andreas fault – snapshot of building deformation
immediately following the earthquake (scaled up by a factor of 5): Anaheim. Also shown are the time-
histories of the three components of the ground velocity and displacement (bandpass-filtered between
2 s and 1000 s), and the east and north components of the penthouse displacement of the existing and
redesigned building models. . . . . . . . . . . . . . . . . . . . . . . . . . . . . . . . . . . . . . . . 135
F.37 Peak east-west/X (white bars) and north-south/Y (black bars) drifts in each story of the existing build-
ing model: Anaheim (the drift scale is saturated at 0.10). . . . . . . . . . . . . . . . . . . . . . . . . 136
F.38 Plastic rotation in percent of a radian in the moment-frames of the existing building model: Anaheim
– (A) Moment-frame along grid A (east-west direction); (B) Moment-frame along grid D (east-westdirection); (C) Moment-frame along grid 1 (north-south direction); (D) Moment-frame along grid 6
(north-south direction). See Figure 2.2 for moment-frame configuration. . . . . . . . . . . . . . . . . 137
F.39 Beam bottom-flange weld fracture locations in the moment-frames of the existing building model:
Anaheim – (A) Moment-frame along grid A (east-west direction); (B) Moment-frame along grid D
(east-west direction); (C) Moment-frame along grid 1 (north-south direction); (D) Moment-frame
along grid 6 (north-south direction). See Figure 2.2 for moment-frame configuration. . . . . . . . . . 138
F.40 Peak east-west/X (white bars) and north-south/Y (black bars) drifts in each story of the redesigned
building model: Anaheim. . . . . . . . . . . . . . . . . . . . . . . . . . . . . . . . . . . . . . . . . 139
F.41 Plastic rotation in percent of a radian in the moment-frames of the redesigned building model: Ana-
heim – (A) Moment-frame along grid A (east-west direction); (B) Moment-frame along grid B (east-
west direction); (C) Moment-frame along grid D (east-west direction); (D) Moment-frame along grid
E (east-west direction). See Figure 2.3 for moment-frame configuration. . . . . . . . . . . . . . . . . 140
F.42 Plastic rotation in percent of a radian in the moment-frames of the redesigned building model: Ana-
heim – (A) Moment-framealong grid 1 (north-southdirection); (B) Moment-framealong grid 2 (north-
south direction); (C) Moment-frame along grid 5 (north-south direction); (D) Moment-frame along
grid 6 (north-south direction). See Figure 2.3 for moment-frame configuration. . . . . . . . . . . . . 141
F.43 M w7.9 earthquake (south-to-north rupture) on the San Andreas fault – snapshot of building deforma-
tion immediately following the earthquake (scaled up by a factor of 5): Long Beach. Also shown are
the time-histories of the three components of the ground velocity and displacement (bandpass-filtered
between 2 s and 1000 s), and the east and north components of the penthouse displacement of the
existing and redesigned building models. . . . . . . . . . . . . . . . . . . . . . . . . . . . . . . . . . 142
F.44 Peak east-west/X (white bars) and north-south/Y (black bars) drifts in each story of the existing build-
ing model: Long Beach. . . . . . . . . . . . . . . . . . . . . . . . . . . . . . . . . . . . . . . . . . 143
F.45 Plastic rotation in percent of a radian in the moment-frames of the existing building model: Long
Beach – (A) Moment-frame along grid A (east-west direction); (B) Moment-frame along grid D (east-
west direction); (C) Moment-frame along grid 1 (north-south direction); (D) Moment-frame along grid
6 (north-south direction). See Figure 2.2 for moment-frame configuration. . . . . . . . . . . . . . . . 144
8/13/2019 Kri05
http://slidepdf.com/reader/full/kri05 16/177
xvi
F.46 Beam bottom-flange weld fracture locations in the moment-frames of the existing building model:
Long Beach – (A) Moment-frame along grid A (east-west direction); (B) Moment-frame along grid
D (east-west direction); (C) Moment-frame along grid 1 (north-south direction); (D) Moment-frame
along grid 6 (north-south direction). See Figure 2.2 for moment-frame configuration. . . . . . . . . . 145
F.47 Peak east-west/X (white bars) and north-south/Y (black bars) drifts in each story of the redesigned
building model: Long Beach. . . . . . . . . . . . . . . . . . . . . . . . . . . . . . . . . . . . . . . . 146
F.48 Plastic rotation in percent of a radian in the moment-frames of the redesigned building model: Long
Beach – (A) Moment-frame along grid A (east-west direction); (B) Moment-frame along grid B (east-
west direction); (C) Moment-frame along grid D (east-west direction); (D) Moment-frame along grid
E (east-west direction). See Figure 2.3 for moment-frame configuration. . . . . . . . . . . . . . . . . 147
F.49 Plastic rotation in percent of a radian in the moment-frames of the redesigned building model: Long
Beach – (A) Moment-frame along grid 1 (north-south direction); (B) Moment-frame along grid 2
(north-south direction); (C) Moment-frame along grid 5 (north-south direction); (D) Moment-frame
along grid 6 (north-south direction). See Figure 2.3 for moment-frame configuration. . . . . . . . . . 148
F.50 M w7.9 earthquake (south-to-north rupture) on the San Andreas fault – snapshot of building deforma-
tion immediately following the earthquake (scaled up by a factor of 5): Santa Ana. Also shown are
the time-histories of the three components of the ground velocity and displacement (bandpass-filteredbetween 2 s and 1000 s), and the east and north components of the penthouse displacement of the
existing and redesigned building models. . . . . . . . . . . . . . . . . . . . . . . . . . . . . . . . . . 149
F.51 Peak east-west/X (white bars) and north-south/Y (black bars) drifts in each story of the existing build-
ing model: Santa Ana. . . . . . . . . . . . . . . . . . . . . . . . . . . . . . . . . . . . . . . . . . . 150
F.52 Plastic rotation in percent of a radian in the moment-frames of the existing building model: Santa Ana
– (A) Moment-frame along grid A (east-west direction); (B) Moment-frame along grid D (east-west
direction); (C) Moment-frame along grid 1 (north-south direction); (D) Moment-frame along grid 6
(north-south direction). See Figure 2.2 for moment-frame configuration. . . . . . . . . . . . . . . . . 151
F.53 Beam bottom-flange weld fracture locations in the moment-frames of the existing building model:
Santa Ana – (A) Moment-frame along grid A (east-west direction); (B) Moment-frame along grid
D (east-west direction); (C) Moment-frame along grid 1 (north-south direction); (D) Moment-frame
along grid 6 (north-south direction). See Figure 2.2 for moment-frame configuration. . . . . . . . . . 152
F.54 Peak east-west/X (white bars) and north-south/Y (black bars) drifts in each story of the redesigned
building model: Santa Ana. . . . . . . . . . . . . . . . . . . . . . . . . . . . . . . . . . . . . . . . . 153
F.55 Plastic rotation in percent of a radian in the moment-frames of the redesigned building model: Santa
Ana – (A) Moment-frame along grid A (east-west direction); (B) Moment-frame along grid B (east-
west direction); (C) Moment-frame along grid D (east-west direction); (D) Moment-frame along grid
E (east-west direction). See Figure 2.3 for moment-frame configuration. . . . . . . . . . . . . . . . . 154
F.56 Plastic rotation in percent of a radian in the moment-frames of the redesigned building model: Santa
Ana – (A) Moment-frame along grid 1 (north-south direction); (B) Moment-frame along grid 2 (north-
south direction); (C) Moment-frame along grid 5 (north-south direction); (D) Moment-frame along
grid 6 (north-south direction). See Figure 2.3 for moment-frame configuration. . . . . . . . . . . . . 155

8/13/2019 Kri05
http://slidepdf.com/reader/full/kri05 17/177
xvii
List of Tables
2.1 Gravity loading criteria (UBC97 [6]). . . . . . . . . . . . . . . . . . . . . . . . . . . . . . . . . . . 8
2.2 Seismic design criteria (UBC97 [6]). . . . . . . . . . . . . . . . . . . . . . . . . . . . . . . . . . . . 9
2.3 Wind design criteria (UBC97 [6]). . . . . . . . . . . . . . . . . . . . . . . . . . . . . . . . . . . . . 9
2.4 Seismic design parameters for the new building. . . . . . . . . . . . . . . . . . . . . . . . . . . . . . 12
2.5 Wind design parameters for the new building. . . . . . . . . . . . . . . . . . . . . . . . . . . . . . . 12
2.6 Building natural periods and modal directions (first 3 modes). . . . . . . . . . . . . . . . . . . . . . . 13
2.7 Building seismic drift ratios. . . . . . . . . . . . . . . . . . . . . . . . . . . . . . . . . . . . . . . . 14
2.8 Building wind drift ratios. . . . . . . . . . . . . . . . . . . . . . . . . . . . . . . . . . . . . . . . . . 14
2.9 Steel material properties used in the analysis of the existing building model. . . . . . . . . . . . . . . 16
2.10 Steel material properties used in the analysis of the redesigned building model. . . . . . . . . . . . . 17
F.1 Classification of existing building model performance based on plastic rotation in panel zones, and at
the ends of beams and columns, using FEMA356 acceptance criteria: Thousand Oaks. . . . . . . . . 101
F.2 Plastic rotation in panel zones, and at the ends of beams and columns of the existing building model:
Thousand Oaks. . . . . . . . . . . . . . . . . . . . . . . . . . . . . . . . . . . . . . . . . . . . . . . 101
F.3 Classification of redesigned building model performance based on plastic rotation in panel zones, and
at the ends of beams and columns, using FEMA356 acceptance criteria: Thousand Oaks. . . . . . . . 104
F.4 Plastic rotation in panel zones, and at the ends of beams and columns of the redesigned building model:
Thousand Oaks. . . . . . . . . . . . . . . . . . . . . . . . . . . . . . . . . . . . . . . . . . . . . . . 104
F.5 Classification of existing building model performance based on plastic rotation in panel zones, and at
the ends of beams and columns, using FEMA356 acceptance criteria: Northridge. . . . . . . . . . . . 108
F.6 Plastic rotation in panel zones, and at the ends of beams and columns of the existing building model:
Northridge. . . . . . . . . . . . . . . . . . . . . . . . . . . . . . . . . . . . . . . . . . . . . . . . . 108F.7 Classification of redesigned building model performance based on plastic rotation in panel zones, and
at the ends of beams and columns, using FEMA356 acceptance criteria: Northridge. . . . . . . . . . . 111
F.8 Plastic rotation in panel zones, and at the ends of beams and columns of the redesigned building model:
Northridge. . . . . . . . . . . . . . . . . . . . . . . . . . . . . . . . . . . . . . . . . . . . . . . . . 111
F.9 Classification of existing building model performance based on plastic rotation in panel zones, and at
the ends of beams and columns, using FEMA356 acceptance criteria: West Los Angeles. . . . . . . . 115
F.10 Plastic rotation in panel zones, and at the ends of beams and columns of the existing building model:
West Los Angeles. . . . . . . . . . . . . . . . . . . . . . . . . . . . . . . . . . . . . . . . . . . . . 115
F.11 Classification of redesigned building model performance based on plastic rotation in panel zones, and
at the ends of beams and columns, using FEMA356 acceptance criteria: West Los Angeles. . . . . . . 118
F.12 Plastic rotation in panel zones, and at the ends of beams and columns of the redesigned building model:West Los Angeles. . . . . . . . . . . . . . . . . . . . . . . . . . . . . . . . . . . . . . . . . . . . . 118
F.13 Classification of existing building model performance based on plastic rotation in panel zones, and at
the ends of beams and columns, using FEMA356 acceptance criteria: Downtown Los Angeles. . . . . 122
F.14 Plastic rotation in panel zones, and at the ends of beams and columns of the existing building model:
Downtown Los Angeles. . . . . . . . . . . . . . . . . . . . . . . . . . . . . . . . . . . . . . . . . . 122
8/13/2019 Kri05
http://slidepdf.com/reader/full/kri05 18/177
xviii
F.15 Classification of redesigned building model performance based on plastic rotation in panel zones, and
at the ends of beams and columns, using FEMA356 acceptance criteria: Downtown Los Angeles. . . . 125
F.16 Plastic rotation in panel zones, and at the ends of beams and columns of the redesigned building model:
Downtown Los Angeles. . . . . . . . . . . . . . . . . . . . . . . . . . . . . . . . . . . . . . . . . . 125
F.17 Classification of existing building model performance based on plastic rotation in panel zones, and at
the ends of beams and columns, using FEMA356 acceptance criteria: Baldwin Park. . . . . . . . . . 129
F.18 Plastic rotation in panel zones, and at the ends of beams and columns of the existing building model:
Baldwin Park. . . . . . . . . . . . . . . . . . . . . . . . . . . . . . . . . . . . . . . . . . . . . . . . 129
F.19 Classification of redesigned building model performance based on plastic rotation in panel zones, and
at the ends of beams and columns, using FEMA356 acceptance criteria: Baldwin Park. . . . . . . . . 132
F.20 Plastic rotation in panel zones, and at the ends of beams and columns of the redesigned building model:
Baldwin Park. . . . . . . . . . . . . . . . . . . . . . . . . . . . . . . . . . . . . . . . . . . . . . . . 132
F.21 Classification of existing building model performance based on plastic rotation in panel zones, and at
the ends of beams and columns, using FEMA356 acceptance criteria: Anaheim. . . . . . . . . . . . . 136
F.22 Plastic rotation in panel zones, and at the ends of beams and columns of the existing building model:
Anaheim. . . . . . . . . . . . . . . . . . . . . . . . . . . . . . . . . . . . . . . . . . . . . . . . . . 136
F.23 Classification of redesigned building model performance based on plastic rotation in panel zones, andat the ends of beams and columns, using FEMA356 acceptance criteria: Anaheim. . . . . . . . . . . . 139
F.24 Plastic rotation in panel zones, and at the ends of beams and columns of the redesigned building model:
Anaheim. . . . . . . . . . . . . . . . . . . . . . . . . . . . . . . . . . . . . . . . . . . . . . . . . . 139
F.25 Classification of existing building model performance based on plastic rotation in panel zones, and at
the ends of beams and columns, using FEMA356 acceptance criteria: Long Beach. . . . . . . . . . . 143
F.26 Plastic rotation in panel zones, and at the ends of beams and columns of the existing building model:
Long Beach. . . . . . . . . . . . . . . . . . . . . . . . . . . . . . . . . . . . . . . . . . . . . . . . . 143
F.27 Classification of redesigned building model performance based on plastic rotation in panel zones, and
at the ends of beams and columns, using FEMA356 acceptance criteria: Long Beach. . . . . . . . . . 146
F.28 Plastic rotation in panel zones, and at the ends of beams and columns of the redesigned building model:
Long Beach. . . . . . . . . . . . . . . . . . . . . . . . . . . . . . . . . . . . . . . . . . . . . . . . . 146
F.29 Classification of existing building model performance based on plastic rotation in panel zones, and at
the ends of beams and columns, using FEMA356 acceptance criteria: Santa Ana. . . . . . . . . . . . 150
F.30 Plastic rotation in panel zones, and at the ends of beams and columns of the existing building model:
Santa Ana. . . . . . . . . . . . . . . . . . . . . . . . . . . . . . . . . . . . . . . . . . . . . . . . . . 150
F.31 Classification of redesigned building model performance based on plastic rotation in panel zones, and
at the ends of beams and columns, using FEMA356 acceptance criteria: Santa Ana. . . . . . . . . . . 153
F.32 Plastic rotation in panel zones, and at the ends of beams and columns of the redesigned building model:
Santa Ana. . . . . . . . . . . . . . . . . . . . . . . . . . . . . . . . . . . . . . . . . . . . . . . . . . 153
8/13/2019 Kri05
http://slidepdf.com/reader/full/kri05 19/177
1
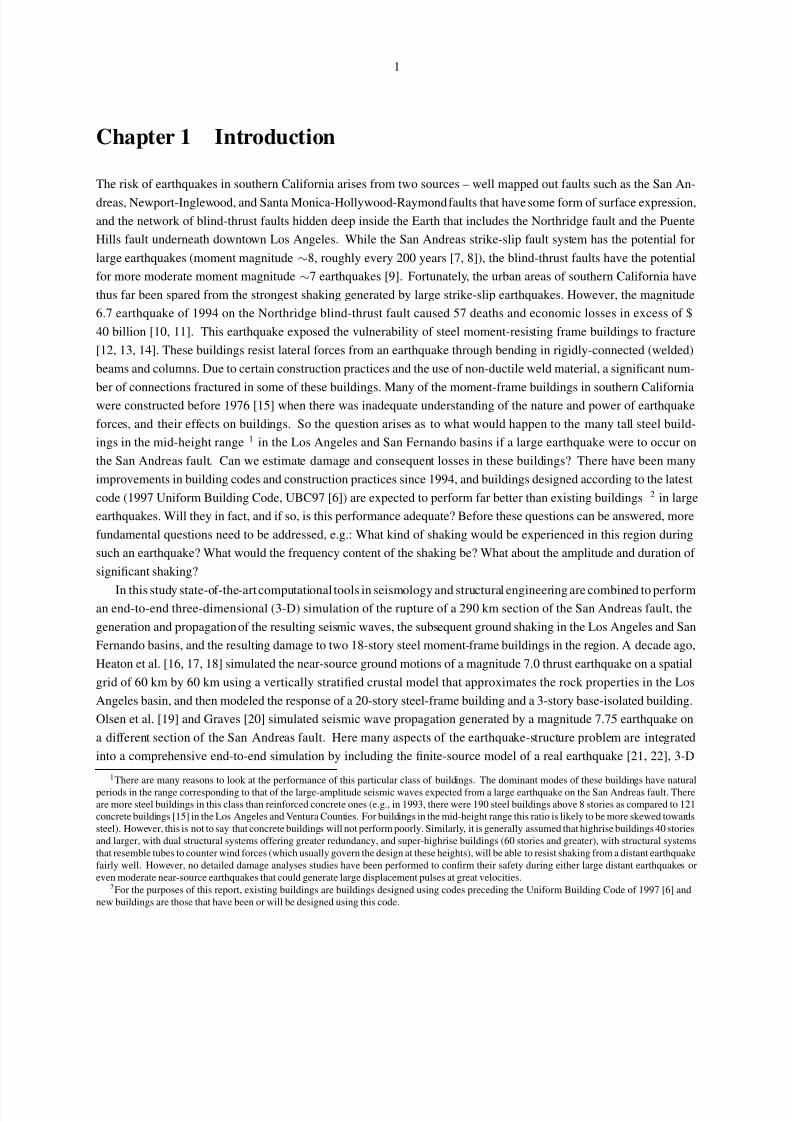
Chapter 1 Introduction
The risk of earthquakes in southern California arises from two sources – well mapped out faults such as the San An-
dreas, Newport-Inglewood, and Santa Monica-Hollywood-Raymond faults that have some form of surface expression,
and the network of blind-thrust faults hidden deep inside the Earth that includes the Northridge fault and the Puente
Hills fault underneath downtown Los Angeles. While the San Andreas strike-slip fault system has the potential for
large earthquakes (moment magnitude ∼8, roughly every 200 years [7, 8]), the blind-thrust faults have the potential
for more moderate moment magnitude ∼7 earthquakes [9]. Fortunately, the urban areas of southern California have
thus far been spared from the strongest shaking generated by large strike-slip earthquakes. However, the magnitude
6.7 earthquake of 1994 on the Northridge blind-thrust fault caused 57 deaths and economic losses in excess of $
40 billion [10, 11]. This earthquake exposed the vulnerability of steel moment-resisting frame buildings to fracture
[12, 13, 14]. These buildings resist lateral forces from an earthquake through bending in rigidly-connected (welded)
beams and columns. Due to certain construction practices and the use of non-ductile weld material, a significant num-
ber of connections fractured in some of these buildings. Many of the moment-frame buildings in southern Californiawere constructed before 1976 [15] when there was inadequate understanding of the nature and power of earthquake
forces, and their effects on buildings. So the question arises as to what would happen to the many tall steel build-
ings in the mid-height range 1 in the Los Angeles and San Fernando basins if a large earthquake were to occur on
the San Andreas fault. Can we estimate damage and consequent losses in these buildings? There have been many
improvements in building codes and construction practices since 1994, and buildings designed according to the latest
code (1997 Uniform Building Code, UBC97 [6]) are expected to perform far better than existing buildings 2 in large
earthquakes. Will they in fact, and if so, is this performance adequate? Before these questions can be answered, more
fundamental questions need to be addressed, e.g.: What kind of shaking would be experienced in this region during
such an earthquake? What would the frequency content of the shaking be? What about the amplitude and duration of
significant shaking?
In this study state-of-the-art computational tools in seismology and structural engineering are combined to performan end-to-end three-dimensional (3-D) simulation of the rupture of a 290 km section of the San Andreas fault, the
generation and propagation of the resulting seismic waves, the subsequent ground shaking in the Los Angeles and San
Fernando basins, and the resulting damage to two 18-story steel moment-frame buildings in the region. A decade ago,
Heaton et al. [16, 17, 18] simulated the near-source ground motions of a magnitude 7.0 thrust earthquake on a spatial
grid of 60 km by 60 km using a vertically stratified crustal model that approximates the rock properties in the Los
Angeles basin, and then modeled the response of a 20-story steel-frame building and a 3-story base-isolated building.
Olsen et al. [19] and Graves [20] simulated seismic wave propagation generated by a magnitude 7.75 earthquake on
a different section of the San Andreas fault. Here many aspects of the earthquake-structure problem are integrated
into a comprehensive end-to-end simulation by including the finite-source model of a real earthquake [21, 22], 3-D
1There are many reasons to look at the performance of this particular class of buildings. The dominant modes of these buildings have natural
periods in the range corresponding to that of the large-amplitude seismic waves expected from a large earthquake on the San Andreas fault. There
are more steel buildings in this class than reinforced concrete ones (e.g., in 1993, there were 190 steel buildings above 8 stories as compared to 121
concrete buildings [15] in the Los Angeles and Ventura Counties. For buildings in the mid-height range this ratio is likely to be more skewed towards
steel). However, this is not to say that concrete buildings will not perform poorly. Similarly, it is generally assumed that highrise buildings 40 stories
and larger, with dual structural systems offering greater redundancy, and super-highrise buildings (60 stories and greater), with structural systems
that resemble tubes to counter wind forces (which usually govern the design at these heights), will be able to resist shaking from a distant earthquake
fairly well. However, no detailed damage analyses studies have been performed to confirm their safety during either large distant earthquakes or
even moderate near-source earthquakes that could generate large displacement pulses at great velocities.2For the purposes of this report, existing buildings are buildings designed using codes preceding the Uniform Building Code of 1997 [6] and
new buildings are those that have been or will be designed using this code.

8/13/2019 Kri05
http://slidepdf.com/reader/full/kri05 20/177
2
Earth structure [23, 24], 3-D seismic wave propagation [25], and 3-D nonlinear damage analyses of buildings using
three-component ground motion [26, 27], validating these procedures using real data from recent earthquakes.
1.1 Scope of the Simulation
The seismological domain of our analysis includes all of southern California and extends north into the central valleybeyond Parkfield. However, we restricted the engineering analysis to the main sedimentary basins of San Fernando,
Los Angeles, and San Gabriel (Figure 1.1). For the scenarios considered in this study, ground motions south of
Irvine going towards San Diego are unlikely to be strong enough to warrant a detailed engineering analysis. While
the population of tall buildings in southern California is quite widespread, a major fraction is located in and around
downtown Los Angeles, the mid-Wilshire district, west Los Angeles, and Santa Monica. There are quite a few tall
buildings spread across the San Fernando valley as well, e.g., in Woodland Hills, Canoga Park, and Camarillo. There
are about 30-40 tall buildings in Orange County (comprising the cities of Orange, Irvine, Costa Mesa, Newport Beach,
Anaheim, Santa Ana, Garden Grove, etc.). A host of new tall buildings are being planned in Orange County with
thirteen proposed high-rises in the cities of Anaheim and Santa Ana. Unfortunately, an inventory of steel buildings of
different heights with geographical distribution is not readily available. The best available data in this regard comes
from the EQE report [15] that states that in 1993 there were 190 steel buildings taller than 8 stories in Los Angeles andVentura counties but had little information regarding their location and breakup in terms of height (beyond 8 stories).
Given this lack of information on existing buildings, it was decided to divide the entire southern California region into
a uniformly spaced grid (with a spacing of 1/32 of a degree or approximately 3.5 km each way) consisting of 636 sites
shown by solid triangles in Figure 1.1. The strategy was to place structural models of the buildings considered in this
study at each of these sites on the grid and analyze them for ground motion from the scenario earthquake considered.
The results are presented in the form of damage/drift performance maps.
1.1.1 Scenarios Considered
Two scenarios involving the rupture of a 290 km segment of the San Andreas fault are considered in this study. The
first scenario consists of the rupture initiating at Parkfield in central California and propagating in a south-easterlydirection with the slip increasing gradually from Parkfield to a maximum value just north-west of the region of interest
and dropping off abruptly to zero (Figure 1.1, inset). This slip distribution is derived from a finite-source inversion of
the November 3, 2002, Denali earthquake. The second scenario consists of the same source butflipped in direction with
the rupture initiating just north of the region of interest and terminating at Parkfield with the peak slip occurring close
to Parkfield. These two scenarios were specifically chosen to illustrate the effects of directivity and slip distribution
on the computed ground motion.
1.1.2 Buildings Considered
Two buildings have been considered in this study. The base building is an existing 18-story steel moment-frame build-
ing located on Canoga Avenue in Woodland Hills that had significant damage (moment-frame connection fractures)during the 1994 Northridge earthquake. This building has been the subject of detailed study by many research groups
following the Northridge earthquake [13]. The second building is similar to the base building, but the structural system
(lateral force-resisting system) has been redesigned according to the current building code, the 1997 Uniform Building
Code (UBC97 [6]). The two fundamental differences between these two buildings is that the new building has been
designed for larger earthquake forces (accounting for near-source effects) and for stringent redundancy requirements
in the lateral force-resisting system. This leads to significantly different dynamic properties for the buildings. In gen-

8/13/2019 Kri05
http://slidepdf.com/reader/full/kri05 21/177
3
-119˚ -118.75˚ -118.5˚ -118.25˚ -118˚ -117.75˚
33.75˚
34˚
34.25˚
Alhambra
Anaheim
Azusa
Baldwin ParkBeverly Hills
Brea
BurbankCanoga Park
Chatsworth
Compton
Diamo
DowneyEl Segundo
Encino
Fullerton
Hollywood
Huntington Beach
Inglewood
Irvine
La Canada
La Puente
Long Beach
Los AngelesMalibu
Monrovia
Montebello
North Hollywood
Northridge
Norwalk
Pasadena
Point Dume
San Fernando
Santa An
Santa Monica
Seal Beach
Simi ValleySunland
Thousand Oaks
Torrance
Whittier
0 7.5 15
km
-120˚ -118˚
34˚
36˚
-120˚ -118˚
34˚
36˚Parkfield
Los Angeles
Figure 1.1: Geographical scope of the simulation (The color scheme reflects topography, with green denoting low
elevation and yellow denoting mountains): The solid black triangles denote the 636 sites at which seismograms are
computed and buildings are analyzed. The white box is the surface projection of the Northridge fault. The red line inthe inset is the surface trace of the 290 km rupture of the San Andreas fault that is the primary focus of this study. The
area enclosed by the blue polygon denotes the region covered by the 636 sites.
eral the redesigned building can be expected to perform better than the existing building in the event of an earthquake.
The description of the two buildings, the design methodology for the new building, and the detailed comparison of the
two buildings in terms of dynamic properties, static strength, and ductility, are presented in Chapter 2.
1.1.3 End-to-End Simulations
An end-to-end simulation is one that includes the simulation of fault rupture, seismic wave propagation, ground mo-
tion computation, and structural damage analyses. Chapter 3 details the state-of-the-art seismological and structural
computational tools used for the end-to-end simulations in this study. The rest of the report is devoted to the valida-
tion of the simulation procedure using data from the Northridge eathquake (Chapter 5), the validity of utilizing theband-limited simulated ground motion for the analysis of the two buildings (Chapter 6), the historical activity on the
San Andreas fault with emphasis on the 1857 earthquake (Chapter 7), description of the source model used in the
simulations (Chapter 8), and the results of the two scenario earthquake simulations (Chapters 9 and 10). The last two
chapters (11 and 12) summarize the main findings of the study and outline the future direction for research in this
critical area of seismic research.
8/13/2019 Kri05
http://slidepdf.com/reader/full/kri05 22/177
4
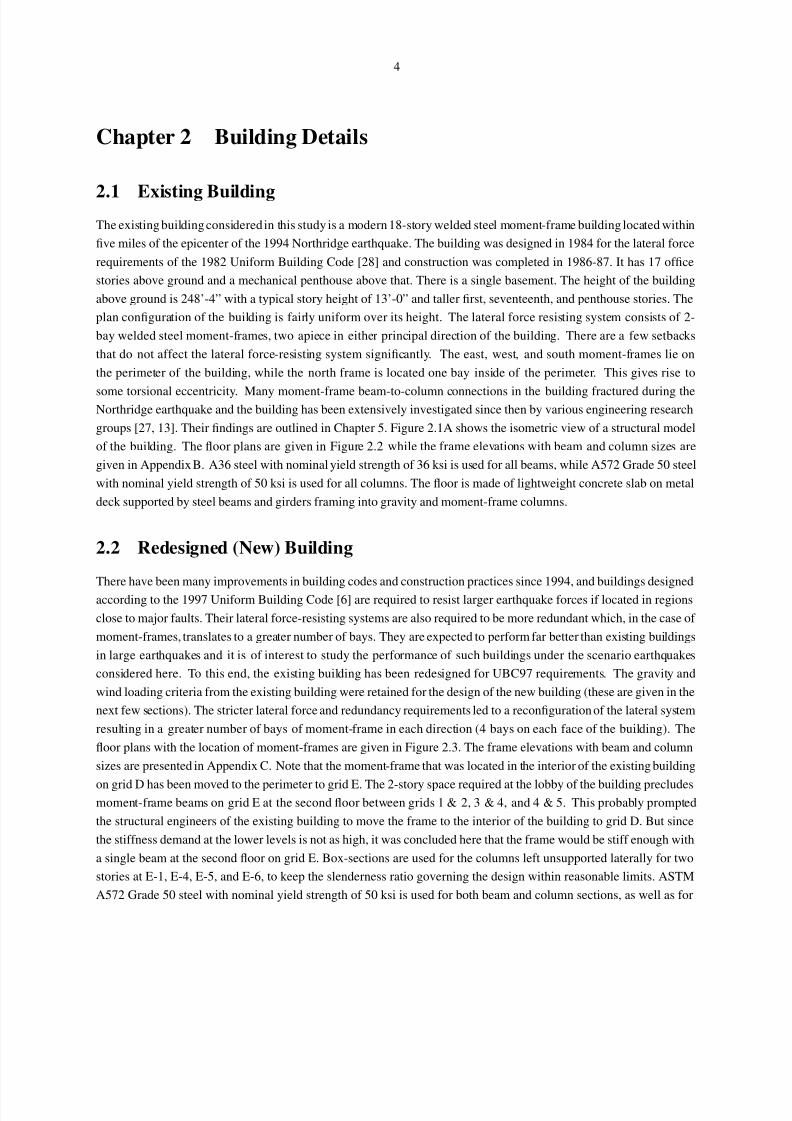
Chapter 2 Building Details
2.1 Existing BuildingThe existing building considered in this study is a modern 18-story welded steel moment-frame building located within
five miles of the epicenter of the 1994 Northridge earthquake. The building was designed in 1984 for the lateral force
requirements of the 1982 Uniform Building Code [28] and construction was completed in 1986-87. It has 17 office
stories above ground and a mechanical penthouse above that. There is a single basement. The height of the building
above ground is 248’-4” with a typical story height of 13’-0” and taller first, seventeenth, and penthouse stories. The
plan configuration of the building is fairly uniform over its height. The lateral force resisting system consists of 2-
bay welded steel moment-frames, two apiece in either principal direction of the building. There are a few setbacks
that do not affect the lateral force-resisting system significantly. The east, west, and south moment-frames lie on
the perimeter of the building, while the north frame is located one bay inside of the perimeter. This gives rise to
some torsional eccentricity. Many moment-frame beam-to-column connections in the building fractured during theNorthridge earthquake and the building has been extensively investigated since then by various engineering research
groups [27, 13]. Their findings are outlined in Chapter 5. Figure 2.1A shows the isometric view of a structural model
of the building. The floor plans are given in Figure 2.2 while the frame elevations with beam and column sizes are
given in Appendix B. A36 steel with nominal yield strength of 36 ksi is used for all beams, while A572 Grade 50 steel
with nominal yield strength of 50 ksi is used for all columns. The floor is made of lightweight concrete slab on metal
deck supported by steel beams and girders framing into gravity and moment-frame columns.
2.2 Redesigned (New) Building
There have been many improvements in building codes and construction practices since 1994, and buildings designed
according to the 1997 Uniform Building Code [6] are required to resist larger earthquake forces if located in regions
close to major faults. Their lateral force-resisting systems are also required to be more redundant which, in the case of
moment-frames, translates to a greater number of bays. They are expected to perform far better than existing buildings
in large earthquakes and it is of interest to study the performance of such buildings under the scenario earthquakes
considered here. To this end, the existing building has been redesigned for UBC97 requirements. The gravity and
wind loading criteria from the existing building were retained for the design of the new building (these are given in the
next few sections). The stricter lateral force and redundancy requirements led to a reconfiguration of the lateral system
resulting in a greater number of bays of moment-frame in each direction (4 bays on each face of the building). The
floor plans with the location of moment-frames are given in Figure 2.3. The frame elevations with beam and column
sizes are presented in Appendix C. Note that the moment-frame that was located in the interior of the existing building
on grid D has been moved to the perimeter to grid E. The 2-story space required at the lobby of the building precludesmoment-frame beams on grid E at the second floor between grids 1 & 2, 3 & 4, and 4 & 5. This probably prompted
the structural engineers of the existing building to move the frame to the interior of the building to grid D. But since
the stiffness demand at the lower levels is not as high, it was concluded here that the frame would be stiff enough with
a single beam at the second floor on grid E. Box-sections are used for the columns left unsupported laterally for two
stories at E-1, E-4, E-5, and E-6, to keep the slenderness ratio governing the design within reasonable limits. ASTM
A572 Grade 50 steel with nominal yield strength of 50 ksi is used for both beam and column sections, as well as for

8/13/2019 Kri05
http://slidepdf.com/reader/full/kri05 23/177
5
0 10 20 30 40020
0
10
20
30
40
50
60
70
A
0 10 20 30 40020
0
10
20
30
40
50
60
70
B
Figure 2.1: Structural models of buildings studied: [A] Perspective view of existing building (designed using codes
prior to the 1997 Uniform Building Code). [B] Perspective view of redesigned (new) building (redesigned using the
1997 Uniform Building Code).
doubler plates that are provided to strengthen panel zones.
2.3 Gravity Loading Criteria for the Two Buildings
The gravity loading criteria for both buildings are given in Table 2.1. The loads are based on the occupancy particular
to each floor. Thus, the loads on the typical floor of the two buildings correspond to the “office” occupancy category in
this table while the loads on the mechanical/penthouse floor and the roof correspond to those listed in the “mechanical”
and “roof” occupancy categories, respectively. Other loads not listed in the table include the self-weight of the lateral
force-resisting system (moment-frame beams and columns) and the gravity columns.
2.4 Seismic Criteria for the Design of the New Building
All of southern California (the domain of interest in this study) falls under Seismic Zone 4 [6]. Hence, the new building
is designed for Zone 4 requirements. It is assumed that the building is located at a distance of 5 km from a Type A
fault 1. The soil at the site is assumed to be of Type S b which corresponds to a rock site with shear wave velocity in
1Seismic source types are classified based on the maximum magnitude, M, and the slip rate, SR, on the fault. Type A sources are faults that
have a moment magnitude potential of M ≥ 7.0 and a slip rate SR ≥ 5mm/yr. These types of faults are considered to be active and capable of

8/13/2019 Kri05
http://slidepdf.com/reader/full/kri05 24/177
6
1 2 3 4 5
E
6
Y
X
D
C
B
A
1
2
5
4
6
3
7
North
MF MF
M F
M F
M F
M F
9.25 m 9.55 m
SECOND FLOOR PLAN
MF MF
9.55 m 9.25 m9.55 m
(31’−4") (31’−4") (30’−4")(30’−4") (31’−4")
( 2 8 ’ − 0 "
)
8 . 5
3 m
9 . 2
5 m
( 3 0 ’ − 4 " )
8 . 5
3 m
( 2 8 ’ − 0 " )
9 . 2
5 m
( 3 0 ’ − 4 " )
A
1 2 3 4 5
E
6
Y
X
D
C
B
A
1
2
5
4
6
3
7
North
MF MF
M F
M F
M F
M F
PLAN OF THIRD AND FOURTH FLOORS
9.25 m 9.55 m
MF MF
(30’−4") (31’−4")
9.55 m 9.25 m
(31’−4") (31’−4") (30’−4")
9.55 m
9 . 2
5 m
( 3 0 ’ − 4 " )
8 . 5
3 m
( 2 8 ’ − 0 " )
8 . 5
3 m
( 2 8 ’ − 0 "
)
( 3 0 ’ − 4 " )
9 . 2
5 m
B
1 2 3 4 5
E
6
Y
X
D
C
B
A
1
2
5
4
6
3
7
North
MF MF
M F
M F
M F
M F
TYPICAL PLAN − FLOORS 5 THROUGH 17
9.25 m 9.55 m
MF MF
9.55 m 9.55 m 9.25 m
(30’−4")(31’−4") (31’−4")(30’−4") (31’−4")
8 . 5
3 m
( 2 8 ’ − 0 " )
9 . 2
5 m
( 3 0 ’ − 4 " )
8 . 5
3 m
( 2 8 ’ − 0 " )
( 3 0 ’ − 4 " )
9 . 2
5 m
C
1 2 3 4 5
E
6
Y
X
D
C
B
A
1
2
5
4
6
3
7
North
MF MF
M F
M F
M F
9.25 m 9.55 m
PENTHOUSE PLAN
M F
MF MF
( 2 8 ’ − 0 " )
9 . 2
5 m
( 3 0 ’ − 4 " )
(31’−4")(30’−4")
9.55 m 9.55 m 9.25 m
(30’−4")(31’−4") (31’−4")
8 . 5
3 m
9 . 2
5 m
( 3 0 ’ − 4 " )
( 2 8 ’ − 0 " )
8 . 5
3 m
D
2 3 4 5
E
Y
X
D
C
B
A
1
2
5
4
3
North
MF
ROOF PLAN
MFMF
9.55 m 9.55 m
(31’−4") (31’−4")(31’−4")
9.55 m
9 . 2
5 m
( 2 8 ’ − 0 " )
( 3 0 ’ − 4 " )
8 . 5
3 m
8 . 5
3 m
( 2 8 ’ − 0 " )
9 . 2
5 m
( 3 0 ’ − 4 " )
E
Figure 2.2: Plans of the existing building showing the location of columns and moment-frame (MF) beams (the frameelevations with beam and column sizes are given in Appendix B).

8/13/2019 Kri05
http://slidepdf.com/reader/full/kri05 25/177
7
1 2 3 4 5
E
6
Y
X
D
C
B
A
1
2
5
4
6 987
3
North
MF MF MF
MF
M F
M F
M F
M F
M F
M F
M F
MF
MF
9.25 m 9.55 m
SECOND FLOOR PLAN
9.55 m 9.55 m
(31’−4") (31’−4")
9.25 m
(30’−4")(30’−4") (31’−4")
9 . 2
5 m
( 3 0 ’ − 4 " )
8 . 5
3 m
( 2 8 ’ − 0 " )
8 . 5
3 m
( 2 8 ’ − 0 "
)
9 . 2
5 m
( 3 0 ’ − 4 " )
A
1 2 3 4 5
E
6
Y
X
D
C
B
A
1
2
5
4
6 987
3
North
MF MF MF
MF MF MF
M F
M F
M F
M F
M F
M F
M F
M F
MF
MF
PLAN OF THIRD AND FOURTH FLOORS
9.25 m 9.55 m
(30’−4") (31’−4")
9.55 m 9.55 m 9.25 m
(31’−4") (31’−4") (30’−4")
9 . 2
5 m
( 3 0 ’ − 4 " )
8 . 5
3 m
( 2 8 ’ − 0 "
)
8 . 5
3 m
( 2 8 ’ − 0 " )
9 . 2
5 m
( 3 0 ’ − 4 " )
B
1 2 3 4 5
E
6
Y
X
D
C
B
A
1
2
5
4
6 987
3
North
MF MF MF
MF MF MF
M F
M F
M F
M F
M F
M F
M F
M F
MF
MF
TYPICAL PLAN − FLOORS 5 THROUGH 17
9.25 m 9.55 m
8 . 5
3 m
9 . 2
5 m
( 2 8 ’ − 0 " )
( 3 0 ’ − 4 " )
(31’−4")(30’−4")
9.25 m
(30’−4")
9.55 m 9.55 m
(31’−4") (31’−4")
8 . 5
3 m
( 2 8 ’ − 0 " )
9 . 2
5 m
( 3 0 ’ − 4 " )
C
1 2 3 4 5
E
6
Y
X
D
C
B
A
1
2
5
4
6 987
3
North
MF MF MF
MF MF MF
M F
M F
M F
M F
M F
M F
M F
MF
MF
9.25 m 9.55 m
PENTHOUSE PLAN
M F
M F
M F
(30 ’− 4" ) (31 ’− 4" )
8 . 5
3 m
( 2 8 ’ − 0 " )
9 . 2
5 m
( 3 0 ’ − 4 " )
9.25 m
(30’−4")
9.55 m
(31’−4")
9.55 m
(31’−4")
8 . 5
3 m
( 2 8 ’ − 0 " )
9 . 2
5 m
( 3 0 ’ − 4 " )
D
2 3 4 5
E
Y
X
D
C
B
A
1
2
5
4
87
3
North
MF
MF
9.55 m
ROOF PLAN
M F
M F
(31’−4") (31’−4")
9.55 m 9.55 m
(31’−4")
8 . 5
3 m
( 2 8 ’ − 0 " )
9 . 2
5 m
( 3 0 ’ − 4 " )
8 . 5
3 m
( 2 8 ’ − 0 " )
9 . 2
5 m
( 3 0 ’ − 4 " )
E
Figure 2.3: Plans of the redesigned building showing the location of columns and moment-frame (MF) beams (theframe elevations with beam and column sizes are given in Appendix C). Note the greater number of moment-frame
bays in the redesigned building.

8/13/2019 Kri05
http://slidepdf.com/reader/full/kri05 26/177
8
Occupancy Item Load ( kg
m2 )
Office Concrete Slab on Metal Deck 255.00Floor Fill (Carpet) 10.00
Partitions (Metal Stud & Dry Wall) 100.00
Mechanical 50.00
Floor Framing 15.00
Live Load 250.00
Mechanical Concrete Slab on Metal Deck 255.00
Floor Fill 120.00
Mechanical 35.00
Floor Framing 40.00
Live Load 1200.00
Roof Concrete Slab on Metal Deck 255.00
Waterproofing 10.00Mechanical 35.00
Floor Framing 15.00
Live Load 250.00
Cladding Glass Cladding 40.00
Table 2.1: Gravity loading criteria (UBC97 [6]).

8/13/2019 Kri05
http://slidepdf.com/reader/full/kri05 27/177
9
Seismic Zone Factor (Z ) 0.400
Seismic Source Type A
Closest Distance to Source 5.000 kmSoil Type Sb
Importance Factor (I ) 1.000
Structural System Factor (R) 8.500
Structural Over-strength Factor (Ω0) 2.800
Near-Source Factor (N a) 1.200
Near-Source Factor (N v) 1.600
Seismic Coefficient (C a) 0.480
Seismic Coefficient (C v) 0.640
Lateral System Type Factor (C t) 0.085
Table 2.2: Seismic design criteria (UBC97 [6]).
Exposure B
Basic Wind Speed (v) 70.00 mphImportance Factor (I w) 1.00
Windward Coefficient (C q) 0.80Leeward Coefficient (C q) 0.50
Table 2.3: Wind design criteria (UBC97 [6]).
the range of 760–1500 m.s−1. It should be recognized that these criteria may vary from one analysis site to the next in
southern California but would be applicable to a large proportion of the considered analysis sites. The seismic design
criteria for the new building are given in Table 2.2. Based on these criteria, the UBC97 design spectrum is computed
and is shown in Figure 2.4.
2.5 Wind Criteria for the Design of the New Building
The new building is assumed to be located in an area that is categorized as Exposure B 2. The wind design criteria
for the new building are given in Table 2.3. Like the seismic criteria, the wind criteria assumed here would not be
applicable to all the analysis sites but is fairly representative of southern Californian conditions.
producing large magnitude events. Most segments of the San Andreas fault fall under this category. See reference [26] for a summary of the design
of buildings using UBC97.2The code classifies terrains into three exposure categories, B, C, and D. Exposure B has terrain with buildings, forest, or surface irregularities,
covering at least 20% of the ground level area extending 1 mile or more from the site. Exposures C and D correspond to progressively flatter terrain.
Using the basic wind speed, defined as the fastest-mile wind speed associated with an annual probability of 0.02 measured at a point 10 m above
the ground for an area having exposure category C, the wind stagnation pressure on the building is computed which is then corrected for height,exposure, gust conditions, and structure type to arrive at the incident wind forces on the windward and leeward faces of the building.
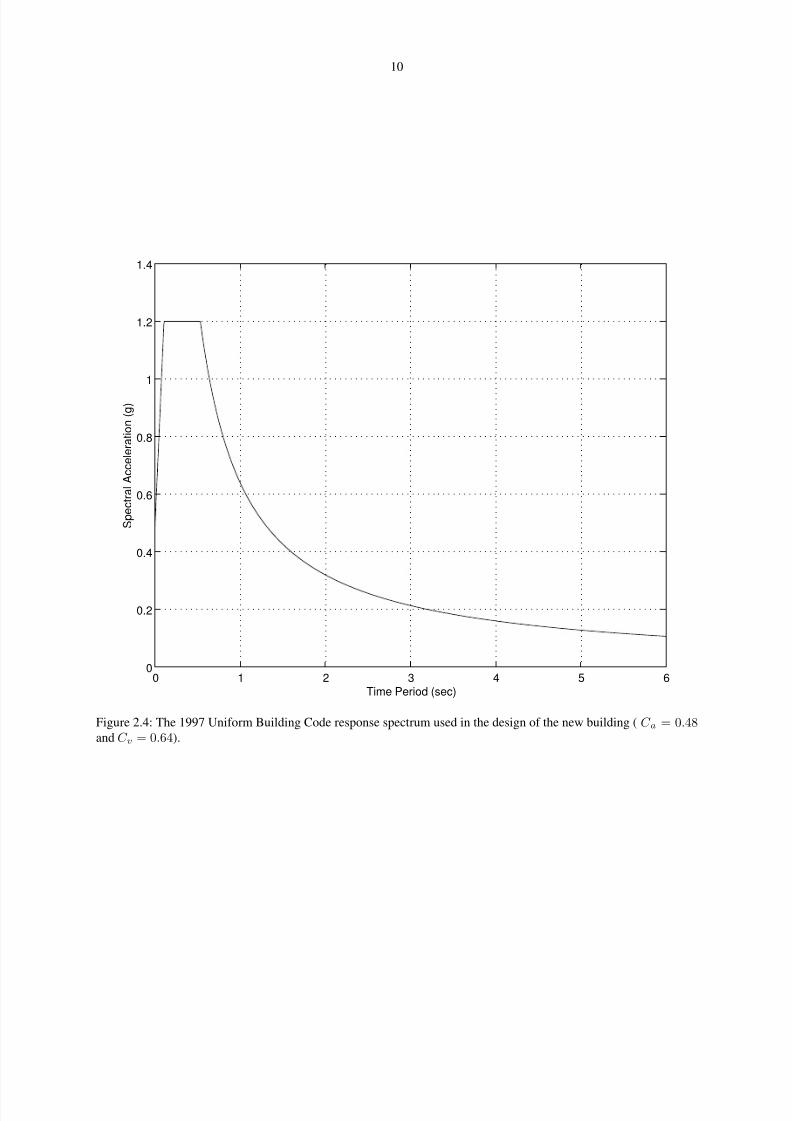
8/13/2019 Kri05
http://slidepdf.com/reader/full/kri05 28/177
10
0 1 2 3 4 5 60
0.2
0.4
0.6
0.8
1
1.2
1.4
Time Period (sec)
S p e c t r a l A c c e l e r a t i o n
( g )
Figure 2.4: The 1997 Uniform Building Code response spectrum used in the design of the new building ( C a = 0.48
and C v = 0.64).
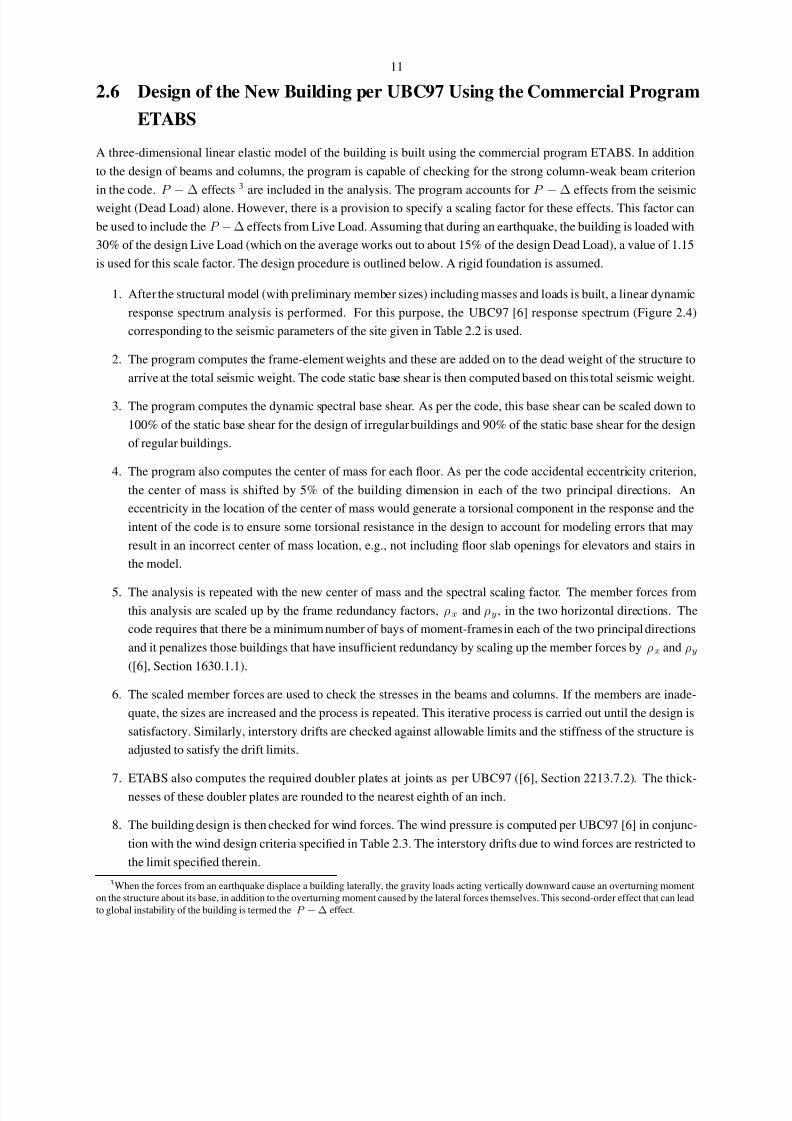
8/13/2019 Kri05
http://slidepdf.com/reader/full/kri05 29/177
11
2.6 Design of the New Building per UBC97 Using the Commercial Program
ETABS
A three-dimensional linear elastic model of the building is built using the commercial program ETABS. In addition
to the design of beams and columns, the program is capable of checking for the strong column-weak beam criterion
in the code. P −∆
effects
3
are included in the analysis. The program accounts for P −∆
effects from the seismicweight (Dead Load) alone. However, there is a provision to specify a scaling factor for these effects. This factor can
be used to include the P −∆ effects from Live Load. Assuming that during an earthquake, the building is loaded with
30% of the design Live Load (which on the average works out to about 15% of the design Dead Load), a value of 1.15
is used for this scale factor. The design procedure is outlined below. A rigid foundation is assumed.
1. After the structural model (with preliminary member sizes) including masses and loads is built, a linear dynamic
response spectrum analysis is performed. For this purpose, the UBC97 [6] response spectrum (Figure 2.4)
corresponding to the seismic parameters of the site given in Table 2.2 is used.
2. The program computes the frame-element weights and these are added on to the dead weight of the structure to
arrive at the total seismic weight. The code static base shear is then computed based on this total seismic weight.
3. The program computes the dynamic spectral base shear. As per the code, this base shear can be scaled down to
100% of the static base shear for the design of irregular buildings and 90% of the static base shear for the design
of regular buildings.
4. The program also computes the center of mass for each floor. As per the code accidental eccentricity criterion,
the center of mass is shifted by 5% of the building dimension in each of the two principal directions. An
eccentricity in the location of the center of mass would generate a torsional component in the response and the
intent of the code is to ensure some torsional resistance in the design to account for modeling errors that may
result in an incorrect center of mass location, e.g., not including floor slab openings for elevators and stairs in
the model.
5. The analysis is repeated with the new center of mass and the spectral scaling factor. The member forces from
this analysis are scaled up by the frame redundancy factors, ρx and ρy, in the two horizontal directions. The
code requires that there be a minimum number of bays of moment-frames in each of the two principal directions
and it penalizes those buildings that have insufficient redundancy by scaling up the member forces by ρx and ρy
([6], Section 1630.1.1).
6. The scaled member forces are used to check the stresses in the beams and columns. If the members are inade-
quate, the sizes are increased and the process is repeated. This iterative process is carried out until the design is
satisfactory. Similarly, interstory drifts are checked against allowable limits and the stiffness of the structure is
adjusted to satisfy the drift limits.
7. ETABS also computes the required doubler plates at joints as per UBC97 ([6], Section 2213.7.2). The thick-
nesses of these doubler plates are rounded to the nearest eighth of an inch.
8. The building design is then checked for wind forces. The wind pressure is computed per UBC97 [6] in conjunc-
tion with the wind design criteria specified in Table 2.3. The interstory drifts due to wind forces are restricted to
the limit specified therein.
3When the forces from an earthquake displace a building laterally, the gravity loads acting vertically downward cause an overturning moment
on the structure about its base, in addition to the overturning moment caused by the lateral forces themselves. This second-order effect that can lead
to global instability of the building is termed the P −∆ effect.

8/13/2019 Kri05
http://slidepdf.com/reader/full/kri05 30/177
12
Height of Building (H n in meters) 75.690
Code Fundamental Period (sec) 2.181
Base Shear (V ∗) 6.024%+
Static Base Shear (metric Tonnes) 773.20+
Base Shear for X-Drift 2.074%Computation∗
Base Shear for Y-Drift 2.074%
Computation∗
System Redundancy Factor (ρx) 1.244
System Redundancy Factor (ρy) 1.249
Irregular Building? No
Seismic Inelastic Drift Ratio 0.02
Limit, ∆max
M
* % of Seismic Weight
+ Only 90% of this is used for design
Table 2.4: Seismic design parameters for the new building.
X-Direction Base Shear (metric Tonnes) 282.17
Y-Direction Base Shear (metric Tonnes) 374.06
Drift Ratio Limit 0.0025
Table 2.5: Wind design parameters for the new building.
The seismic design parameters and the wind design parameters for the new building are given in Tables 2.4 and
2.5, respectively.
The redesign of the existing building resulted in an average steel weight of 65.7 kg/m 2 compared to an average
steel weight of 60.1 kg/m2 for the existing building (these are based on a combined floor area of the second and upper
floors including the roof amounting to 26338 m2). These numbers include the allowance for floor framing given in
Table 2.1.
The computed natural periods and modal directions for both buildings are given in Table 2.6. These are based
on the assumption that Live Load does not contribute to the seismic mass (UBC97 guideline). The modal direction
factors identify the predominant direction of excitation associated with each of the modes. The factors are percentages
associated with the X- and Y-translational and Z-rotational directions. The sum of the three values add up to 100. The

8/13/2019 Kri05
http://slidepdf.com/reader/full/kri05 31/177
13
Building ID Mode Number Period (sec) Modal Direction Factors
X-Trans Y-Trans Z-Rotn
EB1 1 4.43 97.86 0.10 2.04
2 4.22 0.10 99.89 0.01
3 2.47 2.06 0.03 97.91
EB1R 1 3.72 47.24 52.72 0.04
2 3.51 52.71 47.27 0.02
3 2.24 0.08 0.01 99.91
Table 2.6: Building natural periods and modal directions (first 3 modes).
factors of a particular mode are given by:
%X = 100i
M iφ2X,i (2.1)
%Y = 100
i
M iφ2Y,i (2.2)
%Z = 100
i
M θ,iφ2θZ,i (2.3)
where the summations are over all the stories, M i and M θ,i represent the translational mass and the mass moment of
inertia of the ith story, respectively, φX,i and φY,i represent the X and Y -translational mode shape components at the
ith story, respectively, and φθZ,i represents the corresponding Z -rotational mode shape component.
The computed interstory drift ratios from the response spectral analyses of the redesigned building are given in
Table 2.7. The X and Y drifts corresponding to two cases – spectral direction corresponding to building X and Y
directions – are listed. The elastic drift, ∆s, is computed for each case by taking the square root of the sum of the
squares (SRSS) of these drifts.
As per the Uniform Building Code [6], the Maximum Inelastic Response Drift, ∆M , of the structure is extrapolated
from the elastic drift ratio, ∆s, as follows:
∆M = 0.7R∆s (2.4)
where R is the Structural System Factor given in Table 2.2.
The code requires that the calculated interstory story drift, ∆M , not exceed ∆maxM = 0.025 for structures having a
fundamental period of less than 0.7 seconds and ∆maxM = 0.02 for structures with greater periods.
The computed drift ratios from the wind analysis of the redesigned building are given in Table 2.8. The limit of
0.0025, although not set by the code, is enforced in the design of tall buildings so that non-structural components such
as facades and partitions can be designed to accommodate this movement during design wind-storms. In the case of
the new building this requirement governs the design of the beams. When compared to columns, beams usually play
a greater role in controlling the stiffness of moment-frames.
8/13/2019 Kri05
http://slidepdf.com/reader/full/kri05 32/177
14
Building ID Spectral Direction X-Drift Y-Drift SRSS ∆s SRSS ∆M ∆maxM
EB1R X 0.0015 0.0007 0.0017 0.0098 0.0200Y 0.0007 0.0015 0.0017 0.0098 0.0200
Table 2.7: Building seismic drift ratios.
Building ID Wind Direction X-Drift Y-Drift SRSS ∆w ∆maxw
EB1R X 0.00180 0.00011 0.00180 0.00250
Y 0.00015 0.00240 0.00240 0.00250
Table 2.8: Building wind drift ratios.
2.7 Nonlinear Analysis of Buildings
3-D structural models of both the existing and the redesigned buildings are built using elastofiber elements for moment-
frame beams and columns, panel-zone elements (with linear-quadratic shear stress-strain behavior) for joints, and
elastic plane-stress elements for floor diaphragms. Gravity columns are modeled using plastic-hinge elements. Loads
on these columns contribute to the P − ∆ effect (see footnote 2 in Section 2.6) that plays a significant role in tall
building response. Gravity beams that are used for supporting the floor slab and are pin-connected (simply supported
at their ends with no moment transfer) are not included in the model as they do not contribute stiffness or strength
to the lateral force-resisting system. The SAC report [13], from which the structural details of the existing building
are extracted, does not clearly indicate whether the joints in the existing building were reinforced with doubler plates
or not. For this study, it is assumed that doubler plates are not provided in the existing building. The new building
designed for UBC97 regulations does have doubler plates reinforcing the panel zones in some of the beam-column
connections. These are included in the computer model of the new building. In order to compute reactions at the base
of the buildings, translational springs with large stiffness are placed in the two principal directions of the building at
the base of all the columns. Pushover analyses are performed on the two building models in either direction to assess
and compare their static lateral strengths and ductility. All the nonlinear analyses are carried out using the program,
FRAME3D, details of which are given in the next chapter.
2.7.1 Analysis Assumptions
The following are the assumptions made in the analyses:
1. A rigid foundation is assumed with the base of all columns assumed fixed. Soil-structure interaction (SSI) is not
included.
2. Strength degradation in the various elements due to weld fracture is included for the existing building but not
for the new building (since weld defects have been corrected following the lessons learnt from the Northridge
earthquake of 1994 and this mode of failure is not expected to occur in buildings built today). Thus, for the new
building model collapse can occur only through P −∆ effects, whereas, for the existing building model element
failures due to weld fractures in combination with P − ∆ effects could result in global instability, especially if

8/13/2019 Kri05
http://slidepdf.com/reader/full/kri05 33/177
15
the element happens to be a column in a lower story. While many probabilistic distributions of fiber fracture
strains for elastofiber beam and column elements are investigated for the pushover analyses (described in the
next section) and the validation of the numerical procedure using data from the Northridge earthquake (Chapter
5), the more realistic FRAC-S distribution described in the next section is used for the San Andreas simulations
(Chapters 9 and 10).
3. Composite action arising out of the shear connection between the concrete slab on metal deck and the moment-frame beams is not included.
4. At each level, the story mass is lumped at column locations based on plan tributary area.
5. 30% of the Live Load is included along with the Dead Load in the lumped masses.
6. An average of 30% of the Live Load is included in the gravity loads for ground motion analyses.
7. Gravity columns are modeled using plastic hinge elements and their contribution to the P − ∆ effects is auto-
matically included. They are assumed continuous over the height of the building.
8. Trusses and horizontal braces are modeled using plastic hinge elements with pinned-end conditions.
9. Detailed material properties used in the analysis of the existing and redesigned building models are given in
Tables 2.9 and 2.10, respectively.
10. An effective thickness of 10.16 cm (4 inches) is assumed for the plane-stress elements representing the concrete
slab on metal deck.
11. The concrete elastic modulus is taken to be 2.53x10⁹ kg/m2 (3605 ksi) corresponding to a compressive strength
f c of 2.81x10⁶ kg/m2 (4 ksi).
12. Poisson’s ratio for the plane-stress elements is taken to be 0.3.
2.7.2 Pushover Analyses of the Two Buildings
To quantify the actual strength and ductility (deformation potential) of the two buildings in the two principal direc-
tions, pushover analyses are performed in either direction. In these analyses the building is subjected to a slow, ramped,
horizontal ground acceleration that increases at the constant rate of 0.3 g/minute, and its response is computed dynam-
ically. The structural model is identical to that used in the earthquake analyses except that masses for the horizontal
degrees of freedom are recalculated to total the seismic design mass, W/g, with a distribution that is proportional to the
UBC97 [6] seismic static design loads. Thus, in this analysis technique the lateral loads are essentially the horizontal
seismic design forces proportionally increasing with time at a slow rate. The results of this analysis can also be used
to quantify the ductility of the building in terms of its post-yield displacement capacity.
The results of the pushover analyses of both buildings are presented in Figure 2.5. The base shear in the direction
of pushing is shown plotted as a percentage of the seismic weight of the building against the displacement at the 18
th
floor (penthouse level) for the two models of the existing building that include fracture, denoted by “EB1-FRAC-S” &
“EB1-FRAC-W”, and fracture-excluded models of the existing and redesigned buildings, denoted by “EB1-UNFRAC”
and “EB1R-UNFRAC”, respectively. The seismic weights computed according to UBC97 for the existing and new
buildings are 12689 metric tonnes (27974 K) and 12835 metric tonnes (28297 K), respectively. The ultimate strength of
the existing building model in the X direction varies between 7.5% and 7.85% of its seismic weight for the three cases
– FRAC-S, FRAC-W, & UNFRAC, while the ultimate strength of the redesigned building model in the X direction
is 9.5% of its seismic weight. Plotted on Figure 2.5B are the base shear as a percentage of the seismic weight (solid

8/13/2019 Kri05
http://slidepdf.com/reader/full/kri05 34/177

8/13/2019 Kri05
http://slidepdf.com/reader/full/kri05 35/177

8/13/2019 Kri05
http://slidepdf.com/reader/full/kri05 36/177

8/13/2019 Kri05
http://slidepdf.com/reader/full/kri05 37/177
19
0 0.76 1.52 2.29 3.05 3.810
0.02
0.04
0.06
0.08
0.1
EB1−FRAC−W
EB1−FRAC−S
EB1−UNFRAC
EB1R−UNFRAC
Roof X Displacement (m)
X B a s e S h e a r ( F r a c t i o n o f S e i s m i c W e i g
h t )
A
0 20 40 60 80 1000
0.02
0.04
0.06
0.08
0.1
EB1−FRAC−W
EB1−FRAC−S
EB1−UNFRAC
EB1R−UNFRAC
Time (sec)
S o l i d L i n e −
X B a s e S h e a r ( F r a c t i o n o f S e i s m i c W e i g h t )
0 20 40 60 80 1000
0.76
1.52
2.29
3.05
3.81
D a s h e d L i n e −
R o o f X D i s p l a c e m e n t ( m
)
B
0 0.76 1.52 2.29 3.05 3.810
0.02
0.04
0.06
0.08
0.1
EB1−FRAC−W
EB1−FRAC−S
EB1−UNFRAC
EB1R−UNFRAC
Roof Y Displacement (m)
Y B a s e S h e a r ( F r a c t i o n o f S e i s m i c W e i g h t )
C
0 20 40 60 80 1000
0.02
0.04
0.06
0.08
0.1
EB1−FRAC−W
EB1−FRAC−S
EB1−UNFRAC
EB1R−UNFRAC
Time (sec)
S o l i d L i n e −
Y B a s e S h e a r ( F r a c t i o n o f S e i s m i c W e i g h t )
0 20 40 60 80 1000
0.76
1.52
2.29
3.05
3.81
D a s h e d L i n e −
R o o f Y D i s p l a c e m e n t ( m )
D
Figure 2.5: Pushover analysis of the existing and the redesigned buildings: (A) X direction pushover – roof displace-
ment versus base shear. (B) X direction pushover – base shear (solid lines) and roof displacements (dashed lines) as
functions of time. (C) Y direction pushover – roof displacement versus base shear. (D) Y direction pushover – baseshear (solid lines) and roof displacements (dashed lines) as functions of time.
8/13/2019 Kri05
http://slidepdf.com/reader/full/kri05 38/177
20
Chapter 3 Software Used for the End-to-End Simulations
3.1 SPECFEM3DSPECFEM3D (http://www.geodynamics.org) is a 3-D seismic wave propagation software that uses the spectral ele-
ment method [25] which is based upon a weak formulation of the equations of motion and combines the flexibility
of a finite-element method with the accuracy of a global pseudospectral method. The finite-element mesh honors all
first- and second-order discontinuities in the Earth model. To maintain a relatively constant resolution throughout the
model in terms of the number of grid points per wavelength, the size of the elements is increased with depth in a
conforming fashion, thus retaining a diagonal mass matrix. In the Earth’s mantle and inner core we solve the wave
equation in terms of displacement, whereas in the liquid outer core we use a formulation based upon a scalar potential.
The three domains are matched at the inner core-outer core and core-mantle boundaries, honoring the continuity of
traction and the normal component of velocity. The mesher accommodates lateral variations in compressional wave
speed, shear-wave speed, and density, a 3-D crustal model, ellipticity, as well as topography and bathymetry. Thesolver can handle fully anisotropic 3-D Earth models as well as attenuation, and incorporates the effects of the oceans,
rotation, and self-gravitation in the context of the Cowling approximation.
To simulate ground motion in the Los Angeles basin from regional earthquakes, a special version of SPECFEM3D,
SPECFEM3D BASIN, tailored to simulate seismic wave propagation in sedimentary basins is used. The mesh gener-
ator is specifically written for the simulation of wave propagation in southern California, but can be modified for use
in other geographical areas. The solver is completely general and can be used to simulate seismic wave propagation on
regional and local scales. The sedimentary basin model (Harvard-LA velocity model [29]) is constrained by hundreds
of petroleum industry well logs and more than 20000 km of seismic reflection profiles. The numerical simulations
account for three-dimensional variations of seismic wave speeds and density, topography and bathymetry, and attenu-
ation. This method has been shown to reliably model ground motion down to a period of approximately 2 s [23, 24].
Thus the simulated ground motions can only be used to study the behavior of building structures whose dominant
modes of vibration have natural periods greater than 2 s, which implies tall buildings of 15 stories or more. The top
soil layer is not included in the Earth model due to lack of sufficient data and the numerical complexity associated with
low shear wave velocities in the layer (the minimum S-wave speed in the basin for the Harvard-LA velocity model is
687 m.s−1) which would require a very dense numerical grid to be correctly sampled. This typically softer layer may
have the effect of amplifying the ground motion.
3.2 FRAME3D
Nonlinear damage analyses of the building models subjected to the simulated ground motion in this study are carried
out using the program FRAME3D (http://www.frame3d.caltech.edu) that is based on the finite-element method andis capable of performing time-history analysis. A three-dimensional structural model of a framed building using this
program consists of grids of beams and columns. The setup of the model is comprised of three element classes: panel
zone elements for joints, beam elements for beams and columns, and diaphragm elements for floor and roof slabs.
The arrangement of these elements in a typical structural model is illustrated in Figure 3.1. The two beam element
types can be used for either beams or columns. The plastic hinge beam element consists of two nodes at which biaxial
flexural yielding is permitted, leading to the formation of plastic hinges. Elastic rotational springs are connected across
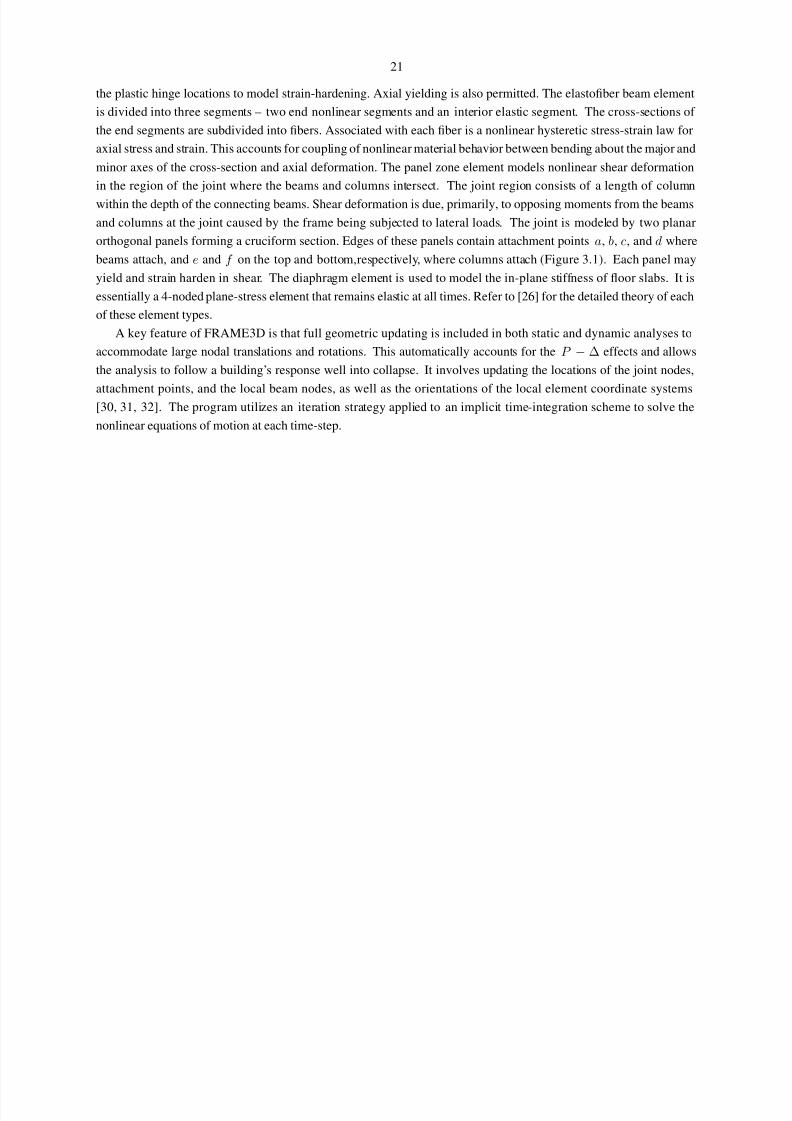
8/13/2019 Kri05
http://slidepdf.com/reader/full/kri05 39/177
21
the plastic hinge locations to model strain-hardening. Axial yielding is also permitted. The elastofiber beam element
is divided into three segments – two end nonlinear segments and an interior elastic segment. The cross-sections of
the end segments are subdivided into fibers. Associated with each fiber is a nonlinear hysteretic stress-strain law for
axial stress and strain. This accounts for coupling of nonlinear material behavior between bending about the major and
minor axes of the cross-section and axial deformation. The panel zone element models nonlinear shear deformation
in the region of the joint where the beams and columns intersect. The joint region consists of a length of column
within the depth of the connecting beams. Shear deformation is due, primarily, to opposing moments from the beams
and columns at the joint caused by the frame being subjected to lateral loads. The joint is modeled by two planar
orthogonal panels forming a cruciform section. Edges of these panels contain attachment points a, b, c, and d where
beams attach, and e and f on the top and bottom,respectively, where columns attach (Figure 3.1). Each panel may
yield and strain harden in shear. The diaphragm element is used to model the in-plane stiffness of floor slabs. It is
essentially a 4-noded plane-stress element that remains elastic at all times. Refer to [26] for the detailed theory of each
of these element types.
A key feature of FRAME3D is that full geometric updating is included in both static and dynamic analyses to
accommodate large nodal translations and rotations. This automatically accounts for the P − ∆ effects and allows
the analysis to follow a building’s response well into collapse. It involves updating the locations of the joint nodes,
attachment points, and the local beam nodes, as well as the orientations of the local element coordinate systems[30, 31, 32]. The program utilizes an iteration strategy applied to an implicit time-integration scheme to solve the
nonlinear equations of motion at each time-step.

8/13/2019 Kri05
http://slidepdf.com/reader/full/kri05 40/177
22
Y’Z’
X’
Y ’
Z ’
X ’
X
Z Y
_
X
_
Y
_
Z
1
2
Plastic hinge
beam element
Elastofiber
beam element
Diaphragm element
(reduced size)
b
c
f
J K
L
J K
M
b
c
f
ee
a a
dd
e
a
c
d
b
f
4 231
1
2
Panel zone element
Segments
Joint Nodes: J, K, L, M
Attachment Points: a, b, c, d, e, f
Local Beam Nodes: 1, 2, 3, 4
Figure 3.1: Element arrangement in frame model showing joint nodes, attachment points, local beam nodes and
coordinate systems.

8/13/2019 Kri05
http://slidepdf.com/reader/full/kri05 41/177
23
Chapter 4 Limitations of the Study
For a study such as this, that is of interest to various stake-holders that do not necessarily have a seismological or
structural or technical background, it is crucial to list the limitations clearly to put the results in the right perspective.
It is in this spirit that the following key limitations should be recognized while considering the results:
1. Validation of the numerical procedures adopted here is based on the magnitude 6.7 Northridge earthquake of
January 17, 1994, while the scenario earthquakes simulated here are of magnitude 7.9 (with about two orders of
magnitude greater energy release). Similarly, the source mechanism of the Northridge earthquake was a thrust
mechanism that did not break the surface while the San Andreas simulation is one of strike-slip source mecha-
nism with surface break. Furthermore, the amount of data collected during the Northridge earthquake, especially
from building response, is fairly limited, and this restricts the extent to which the numerical procedures can be
convincingly validated.
2. For the San Andreas simulation, only a single source model (from the finite-source inversion of the Nov. 3,2002, Denali, Alaska earthquake) has been considered. Other sources could give noticeably different results.
Having said this, the potential for large earthquakes with comparable amounts of slip does exist as evidenced
by the San Andreas earthquake in 1857 (see Chapter 7), and it is critical to estimate accurately the implications
through detailed modeling of at least one scenario at the expense of loss of generality.
3. The top soil layer (of about 30 m) close to the free surface is not included in the Earth model due to lack
of sufficient data and the numerical complexity associated with low shear wave velocities in the layer. This
typically softer layer may have the effect of amplifying the ground motion [33, 34]. Theoretically, the peak
amplification occurs at periods T m = 4d1/mβ 1,m = 1, 3, 5, etc. where d1 is the depth and β 1 is the shear-
wave velocity in the overburden soft layer, and is given by ρ2β 2/ρ1β 1 where ρ2 and ρ1 are the densities of the
basement and the overburden, respectively, andβ 2 is the shear-wave velocity in the basement. This amplificationcould be quite different from place to place based on the depth of the top-soil layer, the density contrast, and the
shear-wave speed contrast between the underlying basement and the overburden layer, and there is insufficient
data to determine the amplification in the entire region. Having said this, the buildings that we analyze are
long-period structures most affected by long-period waves with wavelengths far greater than the depth of the
unmodeled soil layer; these waves simply do not see the layer and as a result the effect of the top soil layer on
the simulated ground motion (with periods longer than 2 s) is likely to be insignificant. Furthermore, maps of
the geotechnical layer do not currently exist for southern California. A final limitation is that 3-D seismic wave
propagation codes that can handle a geotechnical layer are currently not available. Including the geotechnical
layer, when a model becomes available, will require the consideration of very high frequencies and much higher
resolution, and therefore the numerical cost would be high.
4. Ground motion, simulated using SPECFEM3D BASIN, in the Los Angeles basin has been shown to be accurate
down to a period of only 2 s [24]. Hence computed ground motions have been lowpass-filtered to this period
using a Butterworth filter (actually bandpass-filtered between 2 and 1000 s). The effect of filtering ground
motions on the response of tall buildings (especially of the type considered here) has been shown not to be
significant in Chapter 6. Nevertheless, this could vary from case to case and the results should be viewed upon
as being in the ballpark of (and not exactly) what to expect from such an earthquake.
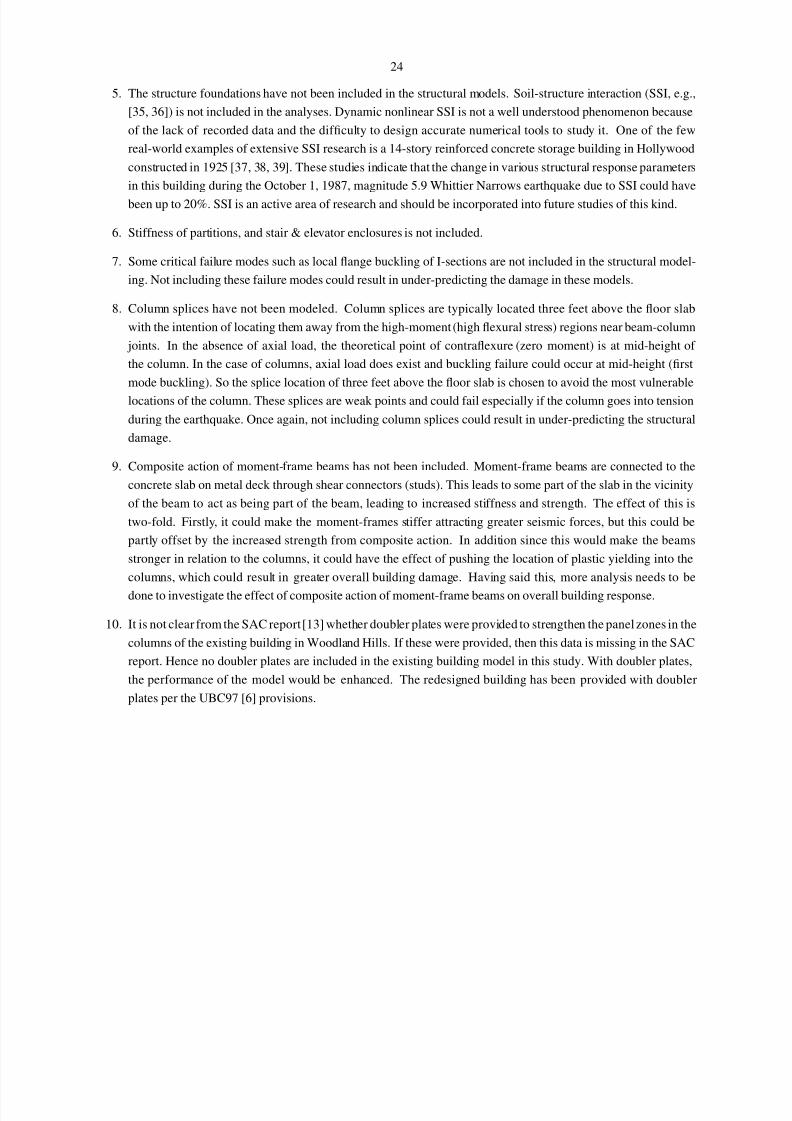
8/13/2019 Kri05
http://slidepdf.com/reader/full/kri05 42/177

8/13/2019 Kri05
http://slidepdf.com/reader/full/kri05 43/177
25
Chapter 5 Validation Using the Northridge Earthquake Data
The first step in a study such as this is the validation of the numerical procedure using data from a regional earthquake.
The only major regional earthquake for which extensive data has been recorded in southern California is the magnitude
6.7, January 17, 1994, Northridge earthquake. Two independent data sets are required for validation. Using the first
data set, a finite source model of the earthquake is created which is then used to simulate ground motion in the region.
The computed seismograms are then compared against the second data set for validation.
While many research groups have determined kinematic fault models by fitting seismic waveform data [40, 41], a
wavelet transform approach [21] that can extract more information about slip heterogeneity by simultaneously consid-
ering both the time and frequency characteristics of the waveforms is used. The resulting finite-source model is shown
in Figure 5.1. Using the spectral-element method [25], ground motion generated by this finite-source model of the
Northridge earthquake is then simulated. In addition to the 636 sites under consideration, seismograms are computed
at southern Californian seismic stations that recorded the shaking during the earthquake. The synthetic seismograms
(red) are compared against the recorded data (black) at nearby stations north of the fault and at distant stations inFigure 5.2. All the waveforms are lowpass-filtered with a corner period of 2 s (in practice, they are bandpass-filtered
between 2–1000s). The synthetic seismograms are able to capture the large pulses in the nearby stations while there is
a very good match in most waveforms corresponding to distant stations.
5
10
15
20
D e p t h k m
-10 -5 0
km
5
10
15
20
D e p t h k m
-10 -5 0
km
5
10
15
20
D e p t h k m
-10 -5 0
km
Strike= 122 degrees
0 25 50 75 100 125 150 175 200
cm
Figure 5.1: Slip model for the January 17, 1994, magnitude 6.7 Northridge earthquake determined using a wavelettransform approach. The red star denotes the hypocenter and the white arrows denote the slip vector. The dip angle of
the fault is 40 degrees (see Figure 1.1 for the surface projection of the fault)
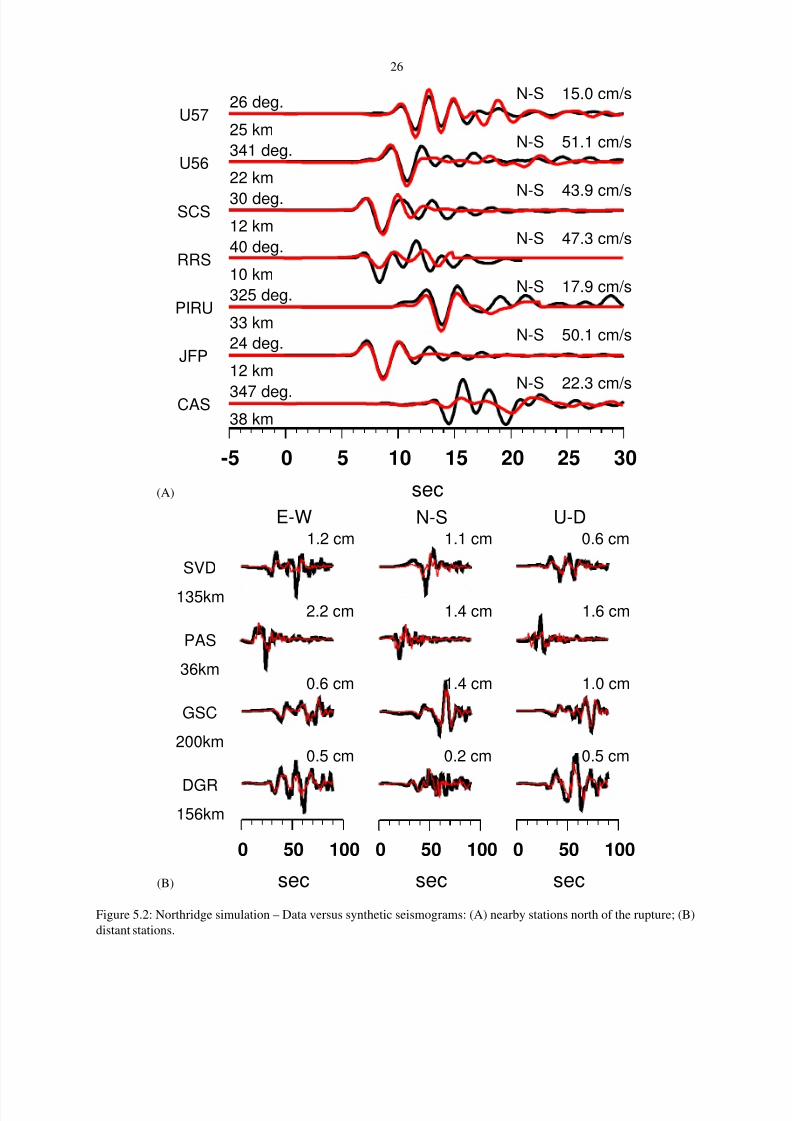
8/13/2019 Kri05
http://slidepdf.com/reader/full/kri05 44/177
26
(A)
-5 0 5 10 15 20 25 30
sec
CAS
N-S 22.3 cm/s347 deg.
38 km
JFP
N-S 50.1 cm/s24 deg.
12 km
PIRU
N-S 17.9 cm/s325 deg.
33 km
RRS
N-S 47.3 cm/s40 deg.
10 km
SCSN-S 43.9 cm/s30 deg.
12 km
U56
N-S 51.1 cm/s341 deg.
22 km
U57
N-S 15.0 cm/s26 deg.
25 km
(B)
0 50 100
sec
0 50 100
sec
0 50 100
sec
DGR
156km
0.5 cm 0.2 cm 0.5 cm
GSC
200km
0.6 cm 1.4 cm 1.0 cm
PAS
36km
2.2 cm 1.4 cm 1.6 cm
SVD
135km
1.2 cm 1.1 cm 0.6 cm
E-W N-S U-D
Figure 5.2: Northridge simulation – Data versus synthetic seismograms: (A) nearby stations north of the rupture; (B)
distant stations.

8/13/2019 Kri05
http://slidepdf.com/reader/full/kri05 45/177
27
While there is a sufficient amount of ground motion data to validate the seismological component of the numerical
procedure, the same is not true of tall building performance. Not many tall buildings in the region were instrumented
at the time, especially of the type considered here (18-story steel moment-frame buildings). One building that was
instrumented was the 18-story steel moment-frame building described in Chapter 2. This building, located in Wood-
land Hills, was designed in 1984 using the 1982 Uniform Building Code and constructed in 1986-87. A computer
model of this building is illustrated in Figure 2.1A. Following the Northridge earthquake, problems associated with
the alignment of elevators prompted a survey which evaluated the plumbness of the building. The survey indicated that
the building was leaning 6 inches to the north at roof level. A damage investigation of the building revealed fracture
in 29 out of the 154 beam bottom flange-to-column welds in the east and west moment-resisting frames [13]. The
investigation included visual inspection of all moment-frame beam bottom flange-to-column welds, and the ultrasonic
testing of 39 top flange-to-column welds and some bottom flange-to-column welds. The west moment-frame had 23
weld fractures while the east moment-frame had 6 fractures. No weld fractures were observed in the north and south
moment-frames. No top flange weld-fractures were observed in any of the moment-frames. All fractures that were
observed were visible from the top of the bottom flange. The fractures included cracks through the weld, cracks at the
back of the weld adjacent to the column flange, and cracks that went into the column flange and exited the column
flange above the weld. All weld fractures seemed to have initiated from the root of the full penetration welds.
There was a three-component SMA-1 accelerograph on the 18
th
floor of the building that recorded the flooracceleration [42]. Unfortunately, the closest free-field seismometer was at the Oxnard Boulevard seismic station
(WHOX) located in Woodland Hills, about half a mile away from the building. Nevertheless, the building model was
analyzed for shaking from the recorded WHOX data. This nonlinear damage analysis of the structure was performed
using the finite-element-method-based program, FRAME3D, described in Chapter 3.
The computed displacements at the 18th floor in the north-south and east-west directions are compared against the
corresponding measured displacements in Figure 5.3. The computed peak displacement in the north-south direction
is within 5% of the measured displacement. However, the peak displacement in the east-west direction is off by a
factor of 2. There is a minor lengthening of the period in the measured displacement that is not captured by the
computed displacements. Also, the measured displacement attenuates faster than the computed displacement. These
differences could be due to any or all of the following reasons: the ground motion used in the analysis was not
recorded at the base of the building but half-a-mile away; the instrument at the roof was maintained by the owner of
the building and its reliability is uncertain; rocking of the building about its base (due to the finite stiffness of the soil),
which is not included in the fixed-base structural model, could contaminate the displacement record measured at the
roof and the observed period may actually be a combination of purely translational and rocking modes; as damage
accumulates in a building during an earthquake, (non-hysteretic) damping increases significantly. However, in the
structural model while hysteretic damping is modeled accurately in a non-linear fashion, non-hysteretic supplemental
damping is considered to be viscous and linear, and as damage accumulates it does not increase correspondingly.
The location of the fractures in the four moment-frames in the building from the analyses is compared against the
location of observed fractures in the building in Figure 5.4. Since all the fractures were observed in the bottom flange
weld [13], for the purposes of this analysis, the fracture strain in all the welds in the building model, except the beam
bottom-flange welds, was taken to be far greater than the steel fiber rupture strain. The fracture strain for the beam
bottom-flange welds was varied and the structural analysis was carried out repeatedly until the total number of weld
fractures in the model matched the observed number of fractures in the building following the Northridge earthquake.
A beam bottom-flange weld fracture strain of 1.05 times the yield strain, y, results in a total of 29 weld fractures in
the analysis which is the same as what was observed in the field. The fracture distribution in the various moment-
frames of the model is now compared against that observed in the building in Figure 5.4. In both cases the fractures
are confined to the north-south moment-frames. Majority of the fractures occur in the top-third of the moment-frames
in both cases. However, while most fractures (23) in the building occurred in the west moment-frame with fewer
8/13/2019 Kri05
http://slidepdf.com/reader/full/kri05 46/177
28
(A)
0 10 20 30 40 50 60−50
0
50Penthouse (18th Floor) north−south displacement response
sec
D i s p l a c e m e n t ( c m )
MeasuredComputed (west face)Computed (east face)
(B)
0 10 20 30 40 50 60−50
0
50Penthouse (18th Floor) east−west displacement response
sec
D i s p l a c e m e n t ( c m )
MeasuredComputed (north face)Computed (south face)
Figure 5.3: Northridge validation – analysis of existing building in Woodland Hills subjected to Oxnard Blvd. record
(WHOX): Measured 18th floor (A) N-S and (B) E-W displacements versus corresponding computed displacements.
fractures (6) in the east moment-frame, the reverse is true for the model with 6 fractures in the west moment-frame
and 20 fractures in the east moment-frame. If the sign of the east component of the ground motion is reversed, then
the damage pattern in the model is similar to the observed pattern. However, based on personal communications
with the California Geological Survey (CGS), it was determined that the recording instrument was a three-component
SMA-1 strong motion accelerograph for which the orientation reversal of one of the two horizontal components is
possible only in conjunction with the orientation reversal of the other horizontal component. The direction of the
first arrival of the Oxnard Boulevard, Woodland Hills (WHOX, latitude 34.18, longitude -118.59) record (velocity)
north component, agrees well with the north components of two nearby records, Canoga Park (CNPK, latitude 34.212,
longitude -118.607) and Saticoy Street (SATI, latitude 34.209, longitude -118.517) as shown in Figure 5.5. This
indicates that the orientation of the north component of the WHOX instrument is correct implying that the orientation
of the east component must be correct as well since the instrument is of the SMA-1 type. But the orientation of the firstarrival of the east component of the WHOX instrument seems to be out-of-phase with that of the CNPK instrument
(also of the SMA-1 type) which cannot be explained. Adding to the mystery is the fact that a twin building with the
same configuration, design, and orientation had a very different damage pattern compared to the building considered
here (based on personal communication with Mr. Terrence Paret, Wiss, Janney, Elstner Associates, Inc.). The details
of this building were not included in the SAC report [13].
To summarize, the seismological component of the numerical procedure was validated adequately using the mea-

8/13/2019 Kri05
http://slidepdf.com/reader/full/kri05 47/177
29
−10 0 10 20 30 40 500
10
20
30
40
50
60
70
A
−10 0 10 20 30 40 500
10
20
30
40
50
60
70
B
−10 0 10 20 30 400
10
20
30
40
50
60
70
C
−10 0 10 20 30 400
10
20
30
40
50
60
70
D
Figure 5.4: Analysis of the existing building subjected to the Oxnard Boulevard, Woodland Hills (WHOX) record fromNorthridge earthquake (station located 0.5 mile from the building): Observed connection fractures (squares) versus
simulated fractures (solid triangles) – (A) South moment-frame (along grid A, east-west direction) of the building
(Frame 1); (B) North moment-frame (along grid D, east-west direction) of the building (Frame 4); (C) West moment-
frame (along grid 1, north-south direction) of the building (Frame 6); (D) East moment-frame(along grid 6, north-south
direction) of the building (Frame 7).

8/13/2019 Kri05
http://slidepdf.com/reader/full/kri05 48/177
30
Velocity
time (sec)
0.0 10.0 20.0 30.0 40.0 50.0 60.0
a m p l i t u d e
70.00
0.0
sati 061.165
70.00
0.0
cnpk 061.063
60.00
0.0
whox 057.709
40.00
0.0
sati 9031.114
40.00
0.0
cnpk 9032.172
50.00
0.0
whox 9041.887
: : :.
Figure 5.5: Comparison of the horizontal components of velocity of three records from the 1994 Northridge earth-
quake, SATI, CNPK, and WHOX (Source: URS Corporation).
sured records from the 1994 Northridge earthquake. However, the structural component of the procedure could be
validated only to a limited extent due to unavailability of suitable data and variability in the quality of construction
resulting in uncertainty in the modeling environment. While the various elements used for modeling buildings in the
program FRAME3D have been tested individually [31, 32], validation of an assembled building has been a challenge.
The pre-Northridge weld defects in steel moment-frames were due to many reasons, some of them human. Here is an
extract from the Federal Emergency Management Agency document, FEMA-353 [43]: ‘The joint between the bottom
beam flange and column flange is typically made as a downhand field weld, often by a welder sitting on top of the
beam flange, in a so-called “wildcat” position. To make the weld from this position each pass must be interrupted at
the beam web, with either a start or stop of the weld at this location. This welding technique often results in poor
quality welding at this critical location, with slag inclusions, lack of fusion and other defects. These defects can serve
as crack initiators, when the connection is subjected to severe stress and strain demands.’ From this description, it is
clear that the presence or absence of defects in welds can and is often dictated by the skill and ability of the welder.
Finally, a note on the permanent tilt of the building at the penthouse level. Surveys conducted after the Northridge
earthquake to check how far the building was tilted out-of-plumb indicated that the building was leaning six inches to
the north [13]. The permanent tilt 1 on the four faces of the computational model are shown in Figure 5.6. Twisting of
1Permanent tilt at a given location in the building model is computed by taking the displacement time-history at that location and lowpass-
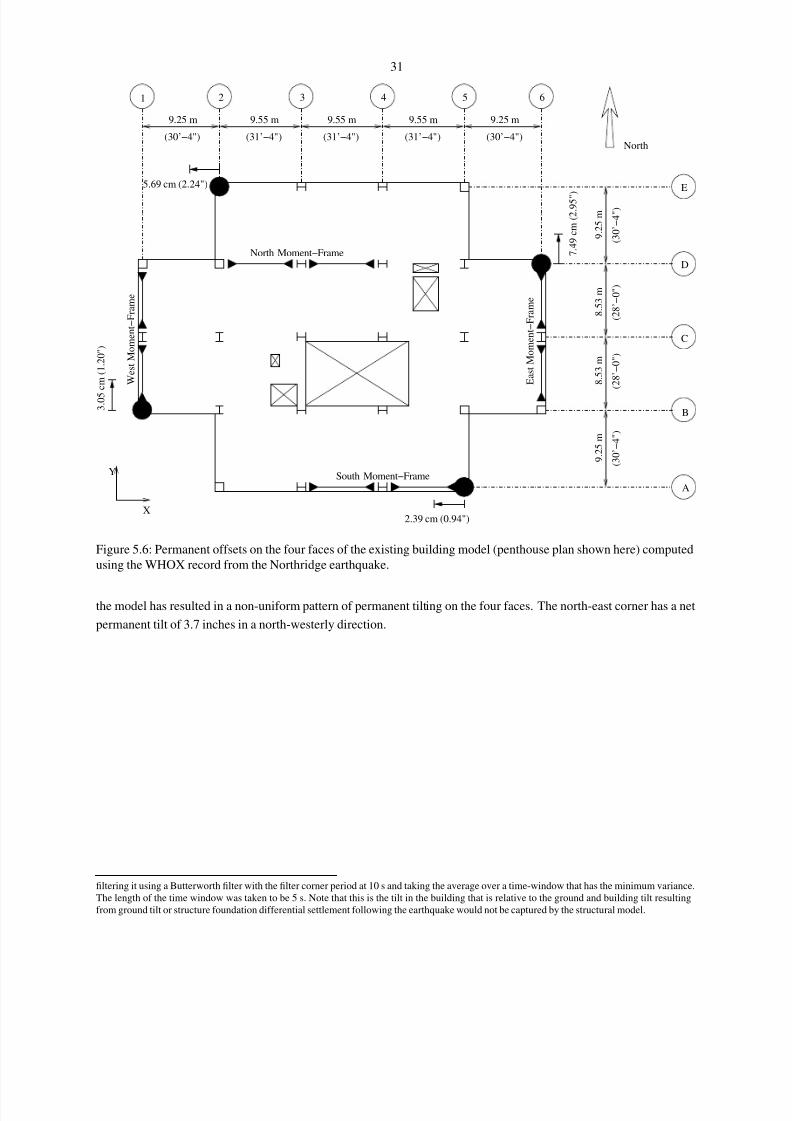
8/13/2019 Kri05
http://slidepdf.com/reader/full/kri05 49/177
31
1 2 3 4 5
E
6
Y
X
D
C
B
A
North Moment−Frame
South Moment−Frame
E a s t M o m e n t − F r a m e
W e s t M o m e n t − F r a m e
North
9.25 m 9.55 m
( 3 0 ’ − 4 " )
( 3 0 ’ − 4 " )
9 . 2
5 m
( 2 8 ’ − 0 " )
8 . 5
3 m
( 2 8 ’ − 0 " )
8 . 5
3 m
9 . 2
5 m
9.55 m 9.55 m
(31’−4") (31’−4")
9.25 m
(30’−4")(30’−4") (31’−4")
5.69 cm (2.24")
3 . 0 5
c m ( 1 . 2
0 " )
7 . 4
9 c m ( 2 . 9 5 "
)
2.39 cm (0.94")
Figure 5.6: Permanent offsets on the four faces of the existing building model (penthouse plan shown here) computed
using the WHOX record from the Northridge earthquake.
the model has resulted in a non-uniform pattern of permanent tilting on the four faces. The north-east corner has a net
permanent tilt of 3.7 inches in a north-westerly direction.
filtering it using a Butterworth filter with the filter corner period at 10 s and taking the average over a time-window that has the minimum variance.
The length of the time window was taken to be 5 s. Note that this is the tilt in the building that is relative to the ground and building tilt resulting
from ground tilt or structure foundation differential settlement following the earthquake would not be captured by the structural model.

8/13/2019 Kri05
http://slidepdf.com/reader/full/kri05 50/177
32
Chapter 6 Effect of Filtering Records on Building Analyses
As described in Chapter 4, ground motion simulated using SPECFEM3D BASIN in the Los Angeles basin has been
shown to be accurate down to a period of only 2 s. Due to this limitation, all the broadband time-histories computed
using SPECFEM3D BASIN are lowpass-filtered using a Butterworth filter with the corner period at 2 s (in practice
bandpass-filtered between 2 s and 1000 s). The filtered ground motion records are used as input to building analyses.
However, building response is a function of the entire frequency band of the ground motion with the building higher
modes corresponding to shorter periods getting excited by high-frequency ground motion. So the question arises as
to what the effect of excluding the high-frequency ground motion is on the response of the buildings considered in
this study. Since dominant modes of the two 18-story buildings considered here have periods greater than 2 s, it is
theorized that the effect of the higher-frequencies in the ground motion may not have a significant impact on their
response. To confirm this hypothesis, the following study has been performed:
1. A total of 13 three-component records from the magnitude 7.5, September 21, 1999, Chi-Chi earthquake in Tai-
wan, and the magnitude 8.3, September 26, 2001, Tokachi-Oki earthquake in Japan, are considered. Response
spectra of the north and east components of these records are shown in Figures 6.1 and 6.2, respectively. Also
shown on these plots are the fundamental periods of the existing and redesigned buildings, and the corner period
of the lowpass-filter for comparison. From the spectra, it is clear that the chosen records span a wide range of
intensities of ground motion.
2. These records are bandpass-filtered between 2 s and 1000 s.
3. Nonlinear analyses of the existing and redesigned building models subjected to the filtered and unfiltered records
are carried out using FRAME3D. Shown in Figures 6.3 and 6.4 are the peak interstory drift ratios computed in
either building model using the filtered records plotted against those computed using the corresponding unfil-
tered records. If the high-frequency ground motion had no effect whatsoever on the response of the buildings,then all the points would fall on the diagonal. The fact that most of the points are aligned quite closely with
the diagonal indicates that the effect of high-frequency ground motion (the range of frequencies not included in
this study) on the building response (for the two buildings considered in this study) is not significant and can be
safely ignored. In essence the initial S wave damages the building leading to its softening, thus shifting its natu-
ral frequency spectrum farther into the long-period regime and further reducing the effect of the high-frequency
content in the ground motion. Note that the pen colors used to plot the points on these figures correspond to
those used in plotting the response spectra in Figures 6.1 and 6.2. Thus, each point can be identified with the
corresponding ground motion record.

8/13/2019 Kri05
http://slidepdf.com/reader/full/kri05 51/177
33
0 1 2 3 4 5 6 7 80
100
200
300
400
500
600
700
800
900
1000
CWBC101
CWBT049
CWBT063
CWBT109
CWBT116
CWBT120
HKD077
HKD091
HKD096
HKD100
HKD109
HKD112
HKD113
E x i s t i n g B l d g F u n d a m e n t a l P
e r i o d T E W = 4 . 4
3 s
E x i s t i n g B l d g F u n d a m e n t a l P
e r i o d T N S = 4 . 2
2 s
R e d e s i g n e d B l d g F u n d a m e n
t a l P e r i o d T N 4 2 E = 3 . 7
1 s
R e d e s i g n e d B l d g F u n d a m e n
t a l P e r i o d T N 4 8 W = 3 . 5
1 s
L o w −
P a s s C u t o f f P e r i o d T
F = 2 . 0
0 s
Period (s)
S p e c t r a l A c c e l e r a t i o n ( c m / s
2 )
Response Spectra of Unfiltered (Solid) andLow−Pass Filtered (Dashed) Acceleration Records
from the Chi−Chi and Tokachi−Oki Earthquakes − NS Component
Figure 6.1: Pseudo-acceleration response spectra of records (north component) from the Chi-Chi and Tokachi-Oki
earthquakes: Comparison of spectra of unfiltered (solid) and filtered (dashed) records.

8/13/2019 Kri05
http://slidepdf.com/reader/full/kri05 52/177
34
0 1 2 3 4 5 6 7 80
100
200
300
400
500
600
700
800
900
1000
CWBC101
CWBT049
CWBT063
CWBT109
CWBT116
CWBT120
HKD077
HKD091
HKD096
HKD100
HKD109
HKD112
HKD113
E x i s t i n g B l d g F u n d a m e n t a l P
e r i o d T E W = 4 . 4
3 s
E x i s t i n g B l d g F u n d a m e n t a l P
e r i o d T N S = 4 . 2
2 s
R e d e s i g n e d B l d g F u n d a m e n
t a l P e r i o d T N 4 2 E = 3 . 7
1 s
R e d e s i g n e d B l d g F u n d a m e n
t a l P e r i o d T N 4 8 W = 3 . 5
1 s
L o w −
P a s s C u t o f f P e r i o d T
F = 2 . 0
0 s
Period (s)
S p e c t r a l A c c e l e r a t i o n ( c m / s
2 )
Response Spectra of Unfiltered (Solid) andLow−Pass Filtered (Dashed) Acceleration Records
from the Chi−Chi and Tokachi−Oki Earthquakes − EW Component
Figure 6.2: Pseudo-acceleration response spectra of records (east component) from the Chi-Chi and Tokachi-Oki
earthquakes: Comparison of spectra of unfiltered (solid) and filtered (dashed) records.

8/13/2019 Kri05
http://slidepdf.com/reader/full/kri05 53/177
35
0 0.01 0.02 0.03 0.04 0.05 0.06 0.07 0.08 0.09 0.10
0.01
0.02
0.03
0.04
0.05
0.06
0.07
0.08
0.09
0.1
CWBC101
CWBT049
CWBT063
CWBT109
CWBT116CWBT120
HKD077
HKD091
HKD096HKD100
HKD109
HKD112HKD113
ChiChi
Tokachi−Oki
Peak Drift (Using Unfiltered Records)
P e a k D r i f t ( U s i n g F i l t e r e d R e c o r
d s )
Existing Building
Figure 6.3: Peak drifts observed in the existing building – analyses using filtered and unfiltered records. Pen colors
used to plot the points match those used in Figures 6.1 and 6.2.

8/13/2019 Kri05
http://slidepdf.com/reader/full/kri05 54/177
36
0 0.01 0.02 0.03 0.04 0.05 0.06 0.07 0.08 0.09 0.10
0.01
0.02
0.03
0.04
0.05
0.06
0.07
0.08
0.09
0.1
CWBC101
CWBT049
CWBT063
CWBT109
CWBT116CWBT120
HKD077
HKD091
HKD096HKD100
HKD109
HKD112HKD113
ChiChi
Tokachi−Oki
Peak Drift (Using Unfiltered Records)
P e a k D r i f t ( U s i n g F i l t e r e d R e c o r
d s )
Redesigned Building
Figure 6.4: Peak drifts observed in the redesigned building – analyses using filtered and unfiltered records. Pen colors
used to plot the points match those used in Figures 6.1 and 6.2.
8/13/2019 Kri05
http://slidepdf.com/reader/full/kri05 55/177
37
Chapter 7 Past Earthquakes on the San Andreas Fault
Paleoseismology, the recognition and characterization of past earthquakes from evidence in the geological record, has
contributed fundamentally to understanding earthquakes by extending the known record of earthquakes into past cen-
turies and millennia. This extension of the historic and instrumental record has revealed the size, location, and timing
of past earthquakes, as well as some clues about the length and regularity of earthquake cycles, and the variability of
rupture magnitude and extent from event to event on a particular fault [44]. Extensive radiocarbon dating of earth-
quakes has been carried out at Pallett Creek, a paleoseismic site astride the San Andreas fault 55 km northeast of Los
Angeles. This site contains a record of twelve large earthquakes preserved in interbedded marsh and stream deposits
[7]. The dating of the ten most recent of these episodes leads to an estimate of the average interval between these
episodes of about 132 years [44]. Five of the nine intervals are shorter than a century; three of the remaining four
intervals are about two to three centuries long. These ten episodes occurred in four clusters, each of which consists of
two or three events. Earthquakes within the clusters are separated by periods of several decades, but the clusters are
separated by dormant periods of two to three centuries.The last major earthquake on the southern half of the San Andreas fault was the Fort Tejon earthquake (magnitude
originally estimated to be 7.9 by Sieh [1], but subsequently upgraded to approximately 8.25 by the US Geological Sur-
vey) that occurred on January 9, 1857, which was preceded by two estimated-magnitude 7.0 earthquakes on December
8 and 21, 1812. The 1857 event was produced by several meters of sudden lateral slip along the south-central reach
of the fault and was felt over at least 350,000 km2 [1]. Most reports indicate that the duration of the earthquake was
between 1 and 3 min. Based on paleoseismological evidence, Kerry Sieh [1] reconstructed the slip distribution along
the fault for this event. The rupture initiated at Cholame about 25 km south of Parkfield in Central California, grew to
a peak slip of about 9.5 m at Wallace Creek (about 67 km from Cholame), and propagated south past Wrightwood in
southern California for a total distance of about 330 km.
The next day, the following account appeared in the Los Angeles Star newspaper [2]: “Doors were slammed to
and fro, water was turned out of bowls and pitchers, and in the river the water rushed violently to one bank and thenback again, the motion being repeated several times”. William Wallace of Los Angeles wrote in his journal [3]: “This
morning at 8.5 o’clock, I was walking to Wolfskill’s and was near his brick house. Suddenly I felt a sort of vertigo.
My legs refused to support me. I swayed to and fro like a drunken man. The ground rose up before me, and I reached
out my hand to sustain myself against the wall. The wall cracked and rocked. The water which usually runs downhill
had doubled upon itself and was rushing with fury towards me. When I saw this, the idea of an earthquake occurred
to me. The ground swayed vertically back and forth, without violence, but with considerable force continuing about
1.5 minutes.”
Both of these accounts are indicative of long-period, large-amplitude, long-duration ground motion. Since tall
buildings have long natural periods, this could impose a severe demand on the tall building stock in southern California.
According to Weldon et al. [45], even though the current 148-year hiatus in activity on the San Andreas fault is
not exceptional, since no lull in the past 1600 years appears to have lasted more than about 200 years when the current
hiatus ends, a substantial portion of the fault is likely to rupture either as a single long rupture or a series of overlapping
ruptures in a short time interval.
To conclude, the potential for a big earthquake with a large amount of slip on the San Andreas fault exists. In order
to prepare for this, it is critical to quantify the effects of such a scenario and this study is an effort in that direction.
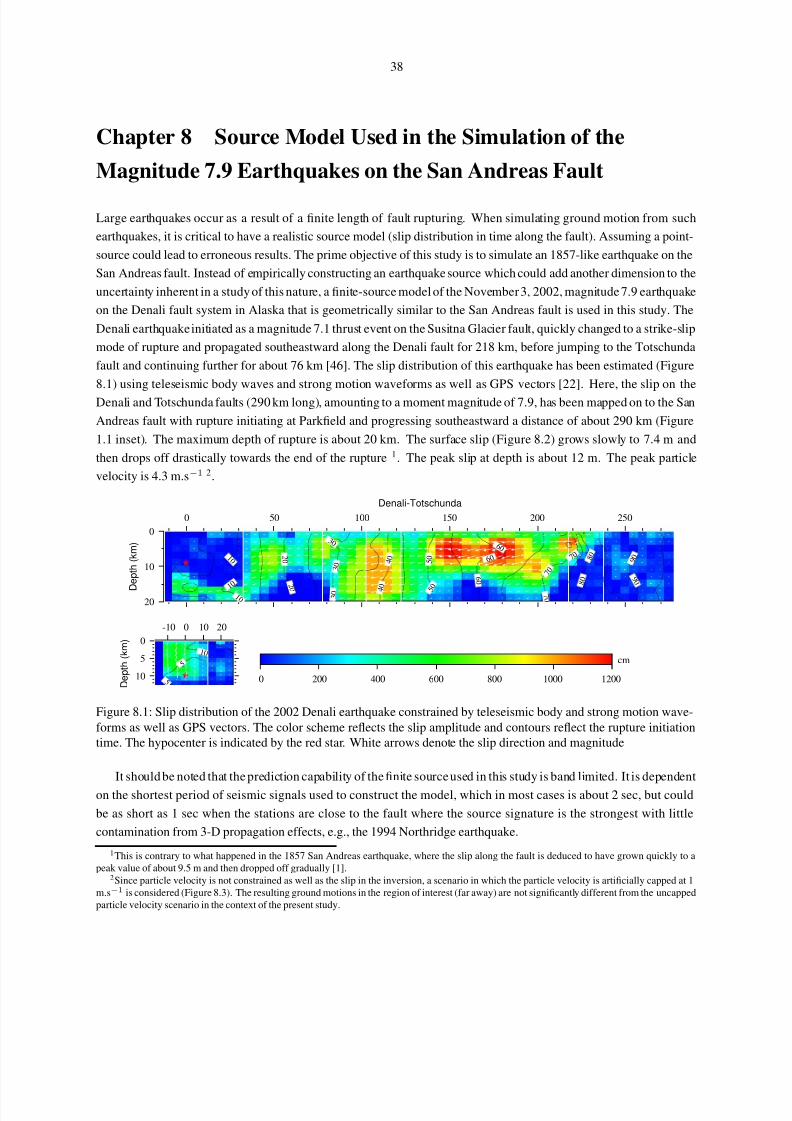
8/13/2019 Kri05
http://slidepdf.com/reader/full/kri05 56/177
38
Chapter 8 Source Model Used in the Simulation of the
Magnitude 7.9 Earthquakes on the San Andreas Fault
Large earthquakes occur as a result of a finite length of fault rupturing. When simulating ground motion from such
earthquakes, it is critical to have a realistic source model (slip distribution in time along the fault). Assuming a point-
source could lead to erroneous results. The prime objective of this study is to simulate an 1857-like earthquake on the
San Andreas fault. Instead of empirically constructing an earthquake source which could add another dimension to the
uncertainty inherent in a study of this nature, a finite-source model of the November 3, 2002, magnitude 7.9 earthquake
on the Denali fault system in Alaska that is geometrically similar to the San Andreas fault is used in this study. The
Denali earthquake initiated as a magnitude 7.1 thrust event on the Susitna Glacier fault, quickly changed to a strike-slip
mode of rupture and propagated southeastward along the Denali fault for 218 km, before jumping to the Totschunda
fault and continuing further for about 76 km [46]. The slip distribution of this earthquake has been estimated (Figure
8.1) using teleseismic body waves and strong motion waveforms as well as GPS vectors [22]. Here, the slip on the
Denali and Totschunda faults (290 km long), amounting to a moment magnitude of 7.9, has been mapped on to the San
Andreas fault with rupture initiating at Parkfield and progressing southeastward a distance of about 290 km (Figure
1.1 inset). The maximum depth of rupture is about 20 km. The surface slip (Figure 8.2) grows slowly to 7.4 m and
then drops off drastically towards the end of the rupture 1. The peak slip at depth is about 12 m. The peak particle
velocity is 4.3 m.s−1 2.
0
10
20 D
e p t h ( k m )
0 50 100 150 200 250
Denali-Totschunda
1 0
1 0
1 0
2 0
2
0
3 0
3 0
3 0
4 0
4 0
5 0
5 0
6 0
6 0
6 0
7 0
7 0
7 0
8 0
8 0
9 0
9 0
0
5
10 D e p t h ( k m )
-10 0 10
5
5
10
20
0 200 400 600 800 1000 1200
cm
Figure 8.1: Slip distribution of the 2002 Denali earthquake constrained by teleseismic body and strong motion wave-
forms as well as GPS vectors. The color scheme reflects the slip amplitude and contours reflect the rupture initiationtime. The hypocenter is indicated by the red star. White arrows denote the slip direction and magnitude
It should be noted that the prediction capability of the finite source used in this study is band limited. It is dependent
on the shortest period of seismic signals used to construct the model, which in most cases is about 2 sec, but could
be as short as 1 sec when the stations are close to the fault where the source signature is the strongest with little
contamination from 3-D propagation effects, e.g., the 1994 Northridge earthquake.
1This is contrary to what happened in the 1857 San Andreas earthquake, where the slip along the fault is deduced to have grown quickly to a
peak value of about 9.5 m and then dropped off gradually [1].2Since particle velocity is not constrained as well as the slip in the inversion, a scenario in which the particle velocity is artificially capped at 1
m.s−1 is considered (Figure 8.3). The resulting ground motions in the region of interest (far away) are not significantly different from the uncapped
particle velocity scenario in the context of the present study.
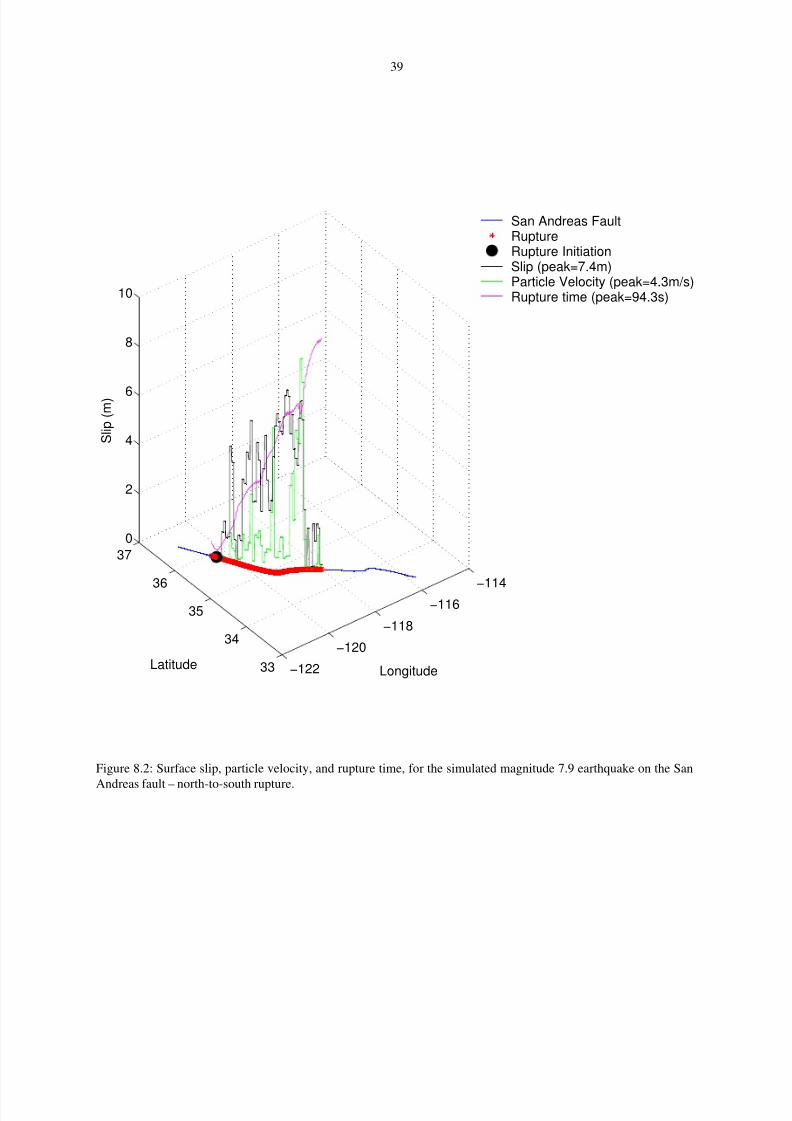
8/13/2019 Kri05
http://slidepdf.com/reader/full/kri05 57/177

8/13/2019 Kri05
http://slidepdf.com/reader/full/kri05 58/177
40
−122
−120
−118
−116−114
33
34
35
36
37
0
2
4
6
8
10
LongitudeLatitude
S l i p ( m )
San Andreas FaultRuptureRupture InitiationSlip (peak=7.4m)Particle Velocity (peak=1.0m/s)Rupture time (peak=94.3s)
Figure 8.3: Surface slip, particle velocity, and rupture time, for the simulated magnitude 7.9 earthquake on the San
Andreas fault – north-to-south rupture, capped particle velocity case.

8/13/2019 Kri05
http://slidepdf.com/reader/full/kri05 59/177
41
Strong motion data in tandem with teleseismic and GPS data is used to constrain the Denali earthquake finite-
source model. To demonstrate that finite-source models can be significantly improved by combining different types of
data, a numerical experiment is conducted using the extensive strong motion dataset of the 1999 ChiChi earthquake.
In addition to the data from many strong motion and GPS stations, twenty-one teleseismic P-waveforms downloaded
from the Incorporated Research Institutions for Seismology (IRIS) data center have been included.
Three finite-source models (Figure 8.4) are constructed:
1. In the first case, teleseismic data alone is used to construct a single-plane fault model. The fault plane has
a strike of 18 and a dip angle of 30 to the east. The location of the fault is defined using the hypocenter
location obtained by the local network managed by Central Weather Bureau (CWB), Taiwan. The rupture plane
is allowed to extend generously from surface to Moho and is divided into subfaults with dimensions of 5 km by
5 km. The inverted results are referred to as “Teleseismic”.
2. In the second case, teleseismic data is combined with GPS data for the inversion of the rupture history, this
time on a more realistic 3-plane fault geometry constructed using static data only [47]. In this case, the vertical
extension of fault plane is limited to 18 km based on the previous GPS inversion. The inverted results in this
case are referred to as “Tele+GPS”.
3. In the third case, selected strong motion data is combined with GPS data and a more complex rise time function
representation [22] is used to constrain the slip model. Given the abundant data involved and the care taken in its
analysis, this model can be considered to be the most accurate representation of the actual rupture. It is labeled
as “Strong+GPS”.
Of the three models, the “Teleseismic” model explains the teleseismic data set the best. Adding the static data
and using a realistic fault geometry only slightly decreases the waveform fits. This is consistent with the fact that
the co-seismic field dominates the GPS measurements [48]. In addition, it suggests that fault bending could not be
resolved using teleseismic P waves alone. Adding other teleseismic phases, such as SH, may be able to resolve this.
The slip distributions of “Tele+GPS” and “Strong+GPS” models are quite similar to each other but there are substantial
discrepancies between these and the slip distribution of the “Teleseismic” model, particularly at the northern end. This
is primarily due to the difference in the assumed fault geometry. However, the big asperities of the “Teleseismic” are
still very similar to the preferred model, “Strong+GPS”, and not all events of this size have such radial geometrical
complexity.
For the Denali earthquake source inversion, all the above mentioned datasets have been used and fault geometry has
been constructed based on the surface break. Taking into consideration the limited number of strong motion and GPS
stations, the accuracy of the Denali earthquake source model can be considered to be similar to the “Tele+GPS” case
discussed above. While it is possible that the ground shaking could be underestimated to some extent, the simulations
resulting from the use of this source model would be sufficiently reliable for the purposes of this study.
Finally, for the case of the Denali earthquake source inversion, synthetic seismograms have been computed at
Pump Station 10 which is the only near-fault station and they match very well with the data in both velocity and
displacement (Figure 8.5). Note that the shortest period used in the inversion is 2 sec.

8/13/2019 Kri05
http://slidepdf.com/reader/full/kri05 60/177
42
120˚ 40' 121˚ 00' 121˚ 20'
23˚ 40'
24˚ 00'
24˚ 20'
120˚ 40' 121˚ 00' 121˚ 20'
23˚ 40'
24˚ 00'
24˚ 20'
120˚ 40' 121˚ 00' 121˚ 20'
23˚ 40'
24˚ 00'
24˚ 20'
120˚ 40' 121˚ 00' 121˚ 20'
23˚ 40'
24˚ 00'
24˚ 20'
120˚ 40' 121˚ 00' 121˚ 20'
23˚ 40'
24˚ 00'
24˚ 20'
Observation
30 km
120˚ 40' 121˚ 00' 121˚ 20'
23˚ 40'
24˚ 00'
24˚ 20'
120˚ 40' 121˚ 00' 121˚ 20'
23˚ 40'
24˚ 00'
24˚ 20'
120˚ 40' 121˚ 00' 121˚ 20'
23˚ 40'
24˚ 00'
24˚ 20'
Teleseismic
30 km
120˚ 40' 121˚ 00' 121˚ 20'
23˚ 40'
24˚ 00'
24˚ 20'
120˚ 40' 121˚ 00' 121˚ 20'
23˚ 40'
24˚ 00'
24˚ 20'
120˚ 40' 121˚ 00' 121˚ 20'
23˚ 40'
24˚ 00'
24˚ 20'
120˚ 40' 121˚ 00' 121˚ 20'
23˚ 40'
24˚ 00'
24˚ 20'
Tele+GPS
30 km
120˚ 40' 121˚ 00' 121˚ 20'
23˚ 40'
24˚ 00'
24˚ 20'
120˚ 40' 121˚ 00' 121˚ 20'
23˚ 40'
24˚ 00'
24˚ 20'
120˚ 40' 121˚ 00' 121˚ 20'
23˚ 40'
24˚ 00'
24˚ 20'
120˚ 40' 121˚ 00' 121˚ 20'
23˚ 40'
24˚ 00'
24˚ 20'
Strong+GPS
30 km
0 30 60 90 120 150 180 210 240 270 300
cm/sec
Figure 8.4: 1999 ChiChi earthquake: Peak ground velocities.

8/13/2019 Kri05
http://slidepdf.com/reader/full/kri05 61/177
43
Figure 8.5: Denali source inversion: Data (black) versus synthetic seismograms (red) for Pump Station 10 (3 km fromthe fault trace).
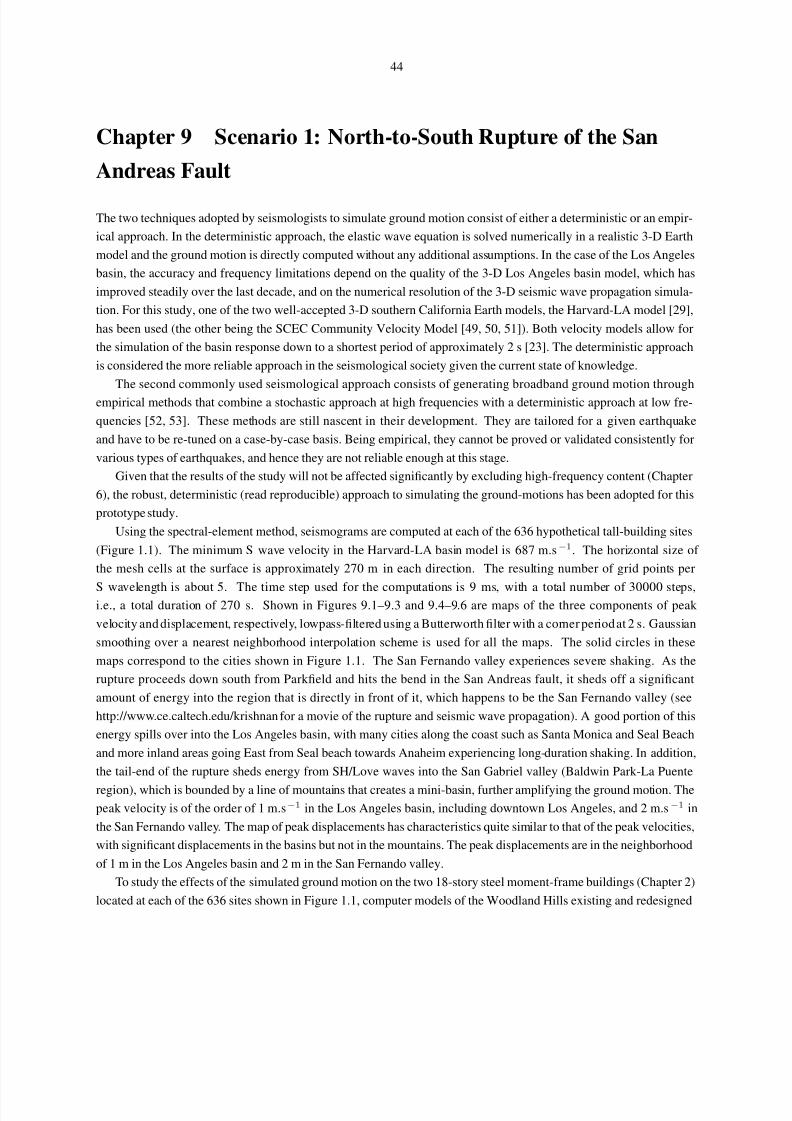
8/13/2019 Kri05
http://slidepdf.com/reader/full/kri05 62/177
44
Chapter 9 Scenario 1: North-to-South Rupture of the San
Andreas Fault
The two techniques adopted by seismologists to simulate ground motion consist of either a deterministic or an empir-
ical approach. In the deterministic approach, the elastic wave equation is solved numerically in a realistic 3-D Earth
model and the ground motion is directly computed without any additional assumptions. In the case of the Los Angeles
basin, the accuracy and frequency limitations depend on the quality of the 3-D Los Angeles basin model, which has
improved steadily over the last decade, and on the numerical resolution of the 3-D seismic wave propagation simula-
tion. For this study, one of the two well-accepted 3-D southern California Earth models, the Harvard-LA model [29],
has been used (the other being the SCEC Community Velocity Model [49, 50, 51]). Both velocity models allow for
the simulation of the basin response down to a shortest period of approximately 2 s [23]. The deterministic approach
is considered the more reliable approach in the seismological society given the current state of knowledge.
The second commonly used seismological approach consists of generating broadband ground motion through
empirical methods that combine a stochastic approach at high frequencies with a deterministic approach at low fre-
quencies [52, 53]. These methods are still nascent in their development. They are tailored for a given earthquake
and have to be re-tuned on a case-by-case basis. Being empirical, they cannot be proved or validated consistently for
various types of earthquakes, and hence they are not reliable enough at this stage.
Given that the results of the study will not be affected significantly by excluding high-frequency content (Chapter
6), the robust, deterministic (read reproducible) approach to simulating the ground-motions has been adopted for this
prototype study.
Using the spectral-element method, seismograms are computed at each of the 636 hypothetical tall-building sites
(Figure 1.1). The minimum S wave velocity in the Harvard-LA basin model is 687 m.s−1. The horizontal size of
the mesh cells at the surface is approximately 270 m in each direction. The resulting number of grid points per
S wavelength is about 5. The time step used for the computations is 9 ms, with a total number of 30000 steps,i.e., a total duration of 270 s. Shown in Figures 9.1–9.3 and 9.4–9.6 are maps of the three components of peak
velocity and displacement, respectively, lowpass-filtered using a Butterworth filter with a corner period at 2 s. Gaussian
smoothing over a nearest neighborhood interpolation scheme is used for all the maps. The solid circles in these
maps correspond to the cities shown in Figure 1.1. The San Fernando valley experiences severe shaking. As the
rupture proceeds down south from Parkfield and hits the bend in the San Andreas fault, it sheds off a significant
amount of energy into the region that is directly in front of it, which happens to be the San Fernando valley (see
http://www.ce.caltech.edu/krishnan for a movie of the rupture and seismic wave propagation). A good portion of this
energy spills over into the Los Angeles basin, with many cities along the coast such as Santa Monica and Seal Beach
and more inland areas going East from Seal beach towards Anaheim experiencing long-duration shaking. In addition,
the tail-end of the rupture sheds energy from SH/Love waves into the San Gabriel valley (Baldwin Park-La Puente
region), which is bounded by a line of mountains that creates a mini-basin, further amplifying the ground motion. The
peak velocity is of the order of 1 m.s−1 in the Los Angeles basin, including downtown Los Angeles, and 2 m.s−1 in
the San Fernando valley. The map of peak displacements has characteristics quite similar to that of the peak velocities,
with significant displacements in the basins but not in the mountains. The peak displacements are in the neighborhood
of 1 m in the Los Angeles basin and 2 m in the San Fernando valley.
To study the effects of the simulated ground motion on the two 18-story steel moment-frame buildings (Chapter 2)
located at each of the 636 sites shown in Figure 1.1, computer models of the Woodland Hills existing and redesigned

8/13/2019 Kri05
http://slidepdf.com/reader/full/kri05 63/177
45
buildings described in Chapter 2 are analyzed. As before, the analyses are performed using the FRAME3D program
[30]. The peak interstory drift is the most reliable performance measure to evaluate structural performance. The
Federal Emergency Management Agency (FEMA) proposes limits on the peak drift ratio for classifying building
performance 1. Another damage measure that can be used to rate structure performance is plastic rotation in beams,
columns and panel zones. Plastic rotation at the ends of beams and columns is defined as the permanent rotation
after unloading the element that has yielded in flexure and is measured in radians or % of a radian. Panel-zone
plastic rotation is defined as the unrecoverable permanent shear strain in the joint and is also measured in radians or
% of a radians. Excessive plastic rotations in the panel zones, beams and columns indicate damage and structural
degradation, important factors in collapse potential. These plastic rotations can be compared against the structural
performance levels set by the FEMA [4]. Even though this FEMA document is meant for the seismic rehabilitation
of existing buildings, in this study the same performance standards are utilized for the redesigned building model as
well for comparison with the existing building model. The three structural performance levels specified in FEMA-356
are Collapse Prevention, Life Safety, and Immediate Occupancy in decreasing order of structural damage. The plastic
rotations at the ends of beams and columns, and in the panel zones can be compared to the acceptable limits prescribed
in FEMA-356 [4] for each of the performance levels, and based on this, the performance of each of these components
can be classified into one of IO, LS, CP performance levels or, alternately, a collapsed state.
In the modeling of the existing building beam-to-column connections, the fracture mode of failure that was widelyobserved during the Northridge earthquake is included. In the presence of weld-fracture, it is not clear how the per-
formance levels can be assigned to beam-column components based on plastic rotations. For example, upon fracture
of all fibers at the end of a beam, its stiffness drops to zero under tension and the beam would not be able to carry ad-
ditional moment and hence the beam-end rotation does not grow any further. For small fracture strains the connection
may fracture, but since the rotation is small, the connection could receive a “good” performance rating. Thus, while
technically a fractured connection should receive a “CO” rating, it may end up with an “LS” rating. Hence, for the
existing building model it may be better to classify connection performance using the fracture index which represents
the percentage of connections in the building that fractured. Since the Northridge earthquake, this defect has been
corrected and this mode of failure is not expected in buildings built today. So for the redesigned building, the per-
formance indices based on the plastic rotations may be reasonable. Despite the complications arising out of fracture,
the performance indices based on plastic rotation are provided for the existing building as well for comparison with
the redesigned building. The results corresponding to the performance of the building models based on the plastic
rotations are presented in Appendices D and E. Nevertheless, it is better to judge the performance of the existing and
redesigned building models based on the interstory drift measure as it is devoid of the subjectivity associated with the
empirical limits proposed for plastic rotations.
To put the results on existing buildings in perspective, note that while the population of tall buildings in southern
California is quite widespread, a major fraction is located in downtown Los Angeles, the mid-Wilshire district (Beverly
Hills), west Los Angeles, and Santa Monica. There are quite a few tall buildings spread across the San Fernando valley
as well, e.g., in Woodland Hills and Canoga Park, and 30-40 tall buildings in Orange County (comprising the cities of
Orange, Irvine, Costa Mesa, Newport Beach, Anaheim, Santa Ana, Garden Grove, etc.). A host of new tall buildings
are being planned in Orange County with thirteen proposed high-rises in the cities of Anaheim and Santa Ana.
1Since there is very little usable data to assess the performance of tall buildings based on calculated interstory drifts, in this study an empirical
approach proposed by the Federal Emergency Management Agency (FEMA) is taken. For rehabilitation of existing buildings, FEMA 356 [4]
defines three performance levels: Immediate Occupancy (IO) refers to a post-earthquake damage state in which very limited structural damage
has occurred. The risk of life-threatening injury as a result of structural damage is very low, and although some minor structural repairs may
be appropriate, these would generally not be required prior to reoccupancy. Life Safety (LS) is a post-earthquake damage state that includes
damage to structural components but retains a margin against onset of partial or total collapse. Collapse Prevention (CP) refers to a post-earthquake
damage state that includes damage to structural components such that the structure continues to support gravity loads but retains no margin against
collapse. For existing buildings, the interstory drift limits for the IO, LS, and CP performance levels specified by FEMA are 0.007, 0.025, and 0.05,
respectively. For the design of new steel moment-frame buildings, FEMA 350 [5] defines only two performance levels, the IO and CP levels. For
buildings taller than 12 stories, the specified interstory drift limits for these levels are 0.01 and 0.06, respectively.
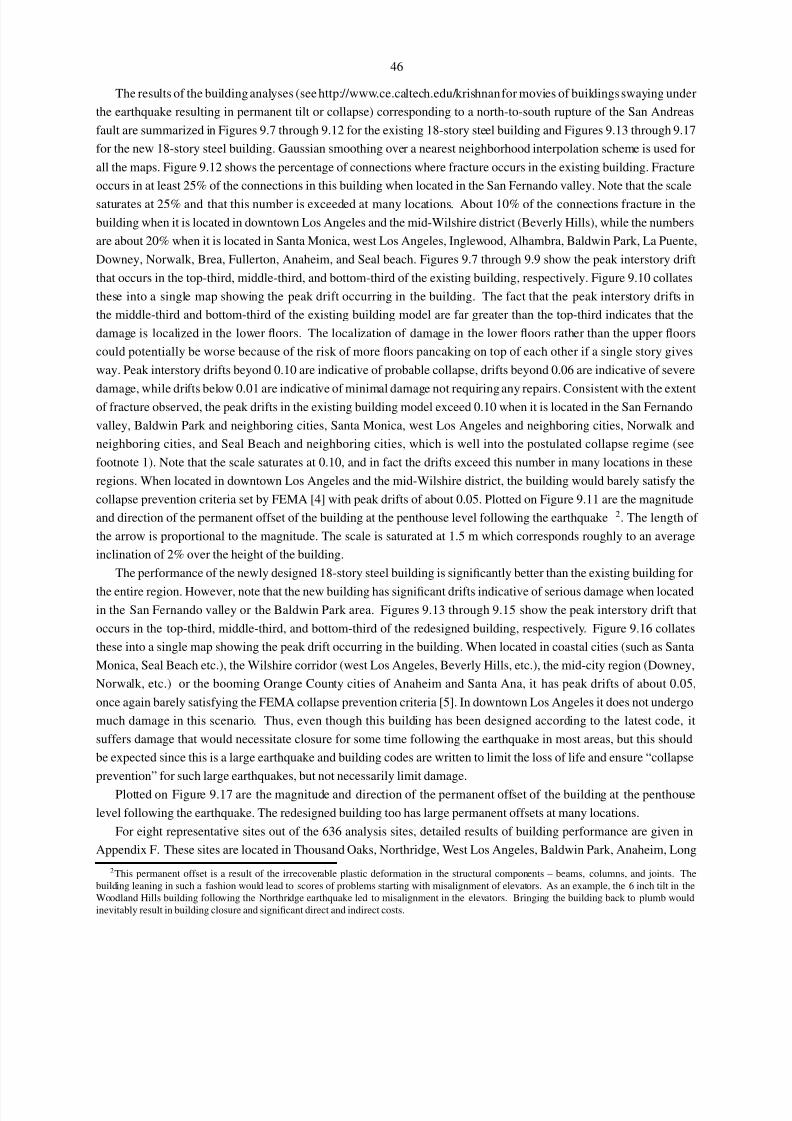
8/13/2019 Kri05
http://slidepdf.com/reader/full/kri05 64/177
46
The results of the building analyses (see http://www.ce.caltech.edu/krishnan for movies of buildings swaying under
the earthquake resulting in permanent tilt or collapse) corresponding to a north-to-south rupture of the San Andreas
fault are summarized in Figures 9.7 through 9.12 for the existing 18-story steel building and Figures 9.13 through 9.17
for the new 18-story steel building. Gaussian smoothing over a nearest neighborhood interpolation scheme is used for
all the maps. Figure 9.12 shows the percentage of connections where fracture occurs in the existing building. Fracture
occurs in at least 25% of the connections in this building when located in the San Fernando valley. Note that the scale
saturates at 25% and that this number is exceeded at many locations. About 10% of the connections fracture in the
building when it is located in downtown Los Angeles and the mid-Wilshire district (Beverly Hills), while the numbers
are about 20% when it is located in Santa Monica, west Los Angeles, Inglewood, Alhambra, Baldwin Park, La Puente,
Downey, Norwalk, Brea, Fullerton, Anaheim, and Seal beach. Figures 9.7 through 9.9 show the peak interstory drift
that occurs in the top-third, middle-third, and bottom-third of the existing building, respectively. Figure 9.10 collates
these into a single map showing the peak drift occurring in the building. The fact that the peak interstory drifts in
the middle-third and bottom-third of the existing building model are far greater than the top-third indicates that the
damage is localized in the lower floors. The localization of damage in the lower floors rather than the upper floors
could potentially be worse because of the risk of more floors pancaking on top of each other if a single story gives
way. Peak interstory drifts beyond 0.10 are indicative of probable collapse, drifts beyond 0.06 are indicative of severe
damage, while drifts below 0.01 are indicative of minimal damage not requiring any repairs. Consistent with the extentof fracture observed, the peak drifts in the existing building model exceed 0.10 when it is located in the San Fernando
valley, Baldwin Park and neighboring cities, Santa Monica, west Los Angeles and neighboring cities, Norwalk and
neighboring cities, and Seal Beach and neighboring cities, which is well into the postulated collapse regime (see
footnote 1). Note that the scale saturates at 0.10, and in fact the drifts exceed this number in many locations in these
regions. When located in downtown Los Angeles and the mid-Wilshire district, the building would barely satisfy the
collapse prevention criteria set by FEMA [4] with peak drifts of about 0.05. Plotted on Figure 9.11 are the magnitude
and direction of the permanent offset of the building at the penthouse level following the earthquake 2. The length of
the arrow is proportional to the magnitude. The scale is saturated at 1.5 m which corresponds roughly to an average
inclination of 2% over the height of the building.
The performance of the newly designed 18-story steel building is significantly better than the existing building for
the entire region. However, note that the new building has significant drifts indicative of serious damage when located
in the San Fernando valley or the Baldwin Park area. Figures 9.13 through 9.15 show the peak interstory drift that
occurs in the top-third, middle-third, and bottom-third of the redesigned building, respectively. Figure 9.16 collates
these into a single map showing the peak drift occurring in the building. When located in coastal cities (such as Santa
Monica, Seal Beach etc.), the Wilshire corridor (west Los Angeles, Beverly Hills, etc.), the mid-city region (Downey,
Norwalk, etc.) or the booming Orange County cities of Anaheim and Santa Ana, it has peak drifts of about 0.05,
once again barely satisfying the FEMA collapse prevention criteria [5]. In downtown Los Angeles it does not undergo
much damage in this scenario. Thus, even though this building has been designed according to the latest code, it
suffers damage that would necessitate closure for some time following the earthquake in most areas, but this should
be expected since this is a large earthquake and building codes are written to limit the loss of life and ensure “collapse
prevention” for such large earthquakes, but not necessarily limit damage.
Plotted on Figure 9.17 are the magnitude and direction of the permanent offset of the building at the penthouse
level following the earthquake. The redesigned building too has large permanent offsets at many locations.
For eight representative sites out of the 636 analysis sites, detailed results of building performance are given in
Appendix F. These sites are located in Thousand Oaks, Northridge, West Los Angeles, Baldwin Park, Anaheim, Long
2This permanent offset is a result of the irrecoverable plastic deformation in the structural components – beams, columns, and joints. The
building leaning in such a fashion would lead to scores of problems starting with misalignment of elevators. As an example, the 6 inch tilt in the
Woodland Hills building following the Northridge earthquake led to misalignment in the elevators. Bringing the building back to plumb would
inevitably result in building closure and significant direct and indirect costs.

8/13/2019 Kri05
http://slidepdf.com/reader/full/kri05 65/177
47
Beach, and Santa Ana. Of these, the existing building model is seen collapsing in Thousand Oaks and Northridge.
Included in this appendix are snapshots of building deformation immediately following the earthquake, time histories
of the three components of ground velocity and displacement (bandpass-filtered between 2 s and 1000 s), time histories
of the east and north components of the penthouse displacements of the existing and redesigned building models,
tables detailing the performance of the structural components (plastic rotation in beams, columns, and panel zones),
bar diagrams illustrating the peak interstory drifts over the height of the two building models, maps of plastic rotation
in beams, columns, and panel zones, and, finally, maps of fracture locations in the moment-frames of the existing
building.
It should be mentioned that for the north-to-south rupture of the San Andreas fault considered here, if the slip
distribution along the fault were like the 1857 earthquake, i.e., rising quickly to the peak value and then gradually
dropping off [1], instead of the other way around, results could be quite different. Also, directivity can have a signif-
icant impact on ground shaking and the resulting building damage. For example, for a south-to-north rupture of the
same earthquake described in the next chapter, building damage is far less severe.
-119˚ -118.75˚ -118.5˚ -118.25˚ -118˚ -117.75˚
33.75˚
34˚
34.25˚
0.2
0.4
0 .4
0 . 4
0 . 4
0. 4
0 .6
0 . 6
0 . 6
0.6
0 .6
0 . 6 0. 6
0. 6
0 . 6
0. 8
0 . 8
0 . 8
0 . 8
0 . 8
1
1
1
1.2 1. 2
1 . 2
1 . 4
1 . 4
1 . 6
1 . 6
1
. 6
1.8
1 . 8
2
2
-119˚ -118.75˚ -118.5˚ -118.25˚ -118˚ -117.75˚
33.75˚
34˚
34.25˚
0.0 0.2 0.4 0.6 0.8 1.0 1.2 1.4 1.6 1.8 2.0
Alhambra
Anaheim
Azusa
Baldwin ParkBeverly Hills
Brea
BurbankCanoga Park
Chatsworth
Compton
Diamon
DowneyEl Segundo
Encino
Fullerton
Hollywood
Huntington Beach
Inglewood
Irvine
La Canada
La Puente
Long Beach
Los AngelesMalibu
Monrovia
Montebello
North Hollywood
Northridge
Norwalk
Pasadena
Point Dume
San Fernando
Santa Ana
Santa Monica
Seal Beach
Simi ValleySunland
Thousand Oaks
Torrance
Whittier
E-W Vel (m/s)
Figure 9.1: M w7.9 earthquake (north-to-south rupture) on the San Andreas Fault – ground shaking: Map of peak
velocities (east component).

8/13/2019 Kri05
http://slidepdf.com/reader/full/kri05 66/177
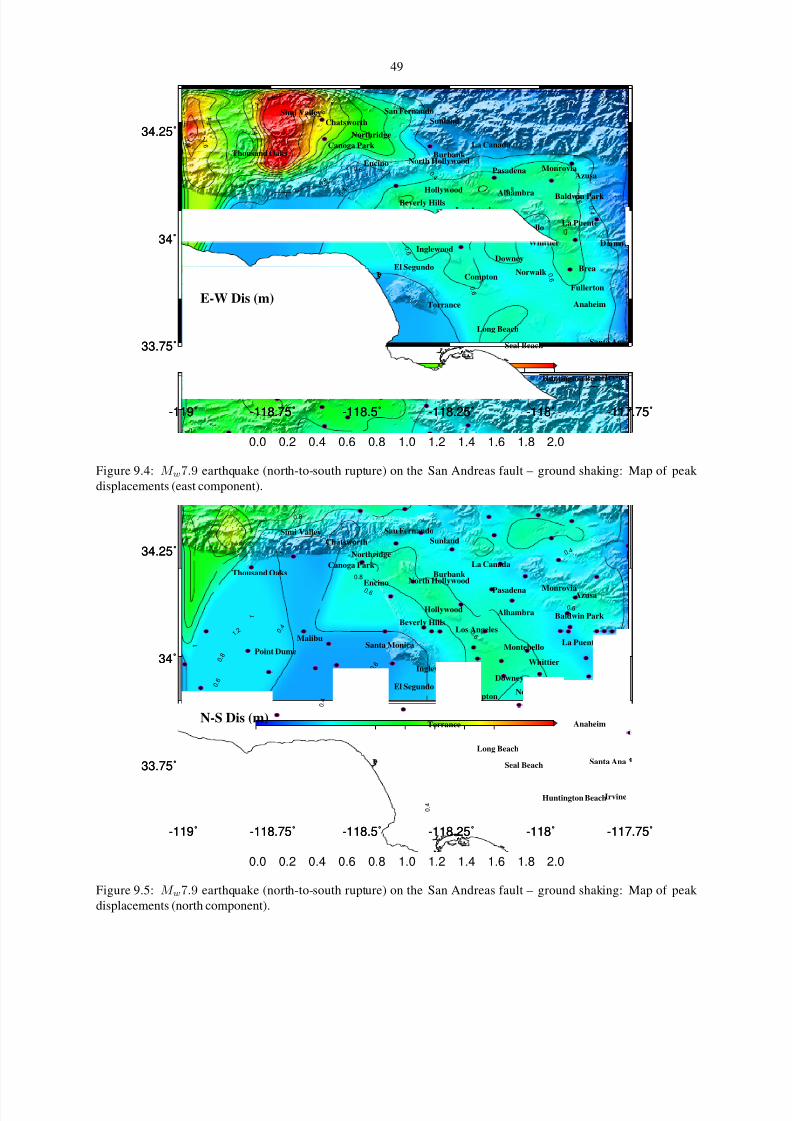
8/13/2019 Kri05
http://slidepdf.com/reader/full/kri05 67/177
49
-119˚ -118.75˚ -118.5˚ -118.25˚ -118˚ -117.75˚
33.75˚
34˚
34.25˚
0.2
0 . 4
0 . 4
0 . 4
0 . 4
0 . 4
0.6
0 . 6
0 . 6
0 . 6
0 . 6
0 . 6
0. 6 0.
8
0 . 8
1
1
1
1 .2
1 . 2
1 .4
1 . 4
1 .
4 .
1 . 6
1 . 6
1 . 6
1. 8
1. 8
1 . 8
2
2
-119˚ -118.75˚ -118.5˚ -118.25˚ -118˚ -117.75˚
33.75˚
34˚
34.25˚
0.0 0.2 0.4 0.6 0.8 1.0 1.2 1.4 1.6 1.8 2.0
Alhambra
Anaheim
Azusa
Baldwin ParkBeverly Hills
Brea
BurbankCanoga Park
Chatsworth
Compton
Diamon
DowneyEl Segundo
Encino
Fullerton
Hollywood
Huntington Beach
Inglewood
Irvine
La Canada
La Puente
Long Beach
Los AngelesMalibu
Monrovia
Montebello
North Hollywood
Northridge
Norwalk
Pasadena
Point Dume
San Fernando
Santa Ana
Santa Monica
Seal Beach
Simi ValleySunland
Thousand Oaks
Torrance
Whittier
E-W Dis (m)
Figure 9.4: M w7.9 earthquake (north-to-south rupture) on the San Andreas fault – ground shaking: Map of peak
displacements (east component).
-119˚ -118.75˚ -118.5˚ -118.25˚ -118˚ -117.75˚
33.75˚
34˚
34.25˚
0 . 4
0 . 4
0 .
4
0 . 4
0. 4
0 . 6
0. 6
0 .6
0 . 6
0 .6
0 . 6
0.8
0.8
0 . 8
1
1
1
1
1. 2
-119˚ -118.75˚ -118.5˚ -118.25˚ -118˚ -117.75˚
33.75˚
34˚
34.25˚
0.0 0.2 0.4 0.6 0.8 1.0 1.2 1.4 1.6 1.8 2.0
Alhambra
Anaheim
Azusa
Baldwin ParkBeverly Hills
Brea
BurbankCanoga Park
Chatsworth
Compton
Diamon
DowneyEl Segundo
Encino
Fullerton
Hollywood
Huntington Beach
Inglewood
Irvine
La Canada
La Puente
Long Beach
Los AngelesMalibu
Monrovia
Montebello
North Hollywood
Northridge
Norwalk
Pasadena
Point Dume
San Fernando
Santa Ana
Santa Monica
Seal Beach
Simi ValleySunland
Thousand Oaks
Torrance
Whittier
N-S Dis (m)
Figure 9.5: M w7.9 earthquake (north-to-south rupture) on the San Andreas fault – ground shaking: Map of peak
displacements (north component).
8/13/2019 Kri05
http://slidepdf.com/reader/full/kri05 68/177
50
-119˚ -118.75˚ -118.5˚ -118.25˚ -118˚ -117.75˚
33.75˚
34˚
34.25˚
0. 2
0 .2
0. 2
0 . 2
0 .2
0.2
0 . 2
0 . 2
0 .2
0 . 4
0 . 4
-119˚ -118.75˚ -118.5˚ -118.25˚ -118˚ -117.75˚
33.75˚
34˚
34.25˚
0.0 0.2 0.4 0.6 0.8 1.0 1.2 1.4 1.6 1.8 2.0
Alhambra
Anaheim
Azusa
Baldwin ParkBeverly Hills
Brea
BurbankCanoga Park
Chatsworth
Compton
Diamon
DowneyEl Segundo
Encino
Fullerton
Hollywood
Huntington Beach
Inglewood
Irvine
La Canada
La Puente
Long Beach
Los AngelesMalibu
Monrovia
Montebello
North Hollywood
Northridge
Norwalk
Pasadena
Point Dume
San Fernando
Santa Ana
Santa Monica
Seal Beach
Simi ValleySunland
Thousand Oaks
Torrance
Whittier
Z Dis (m)
Figure 9.6: M w7.9 earthquake (north-to-south rupture) on the San Andreas fault – ground shaking: Map of peak
displacements (vertical component).
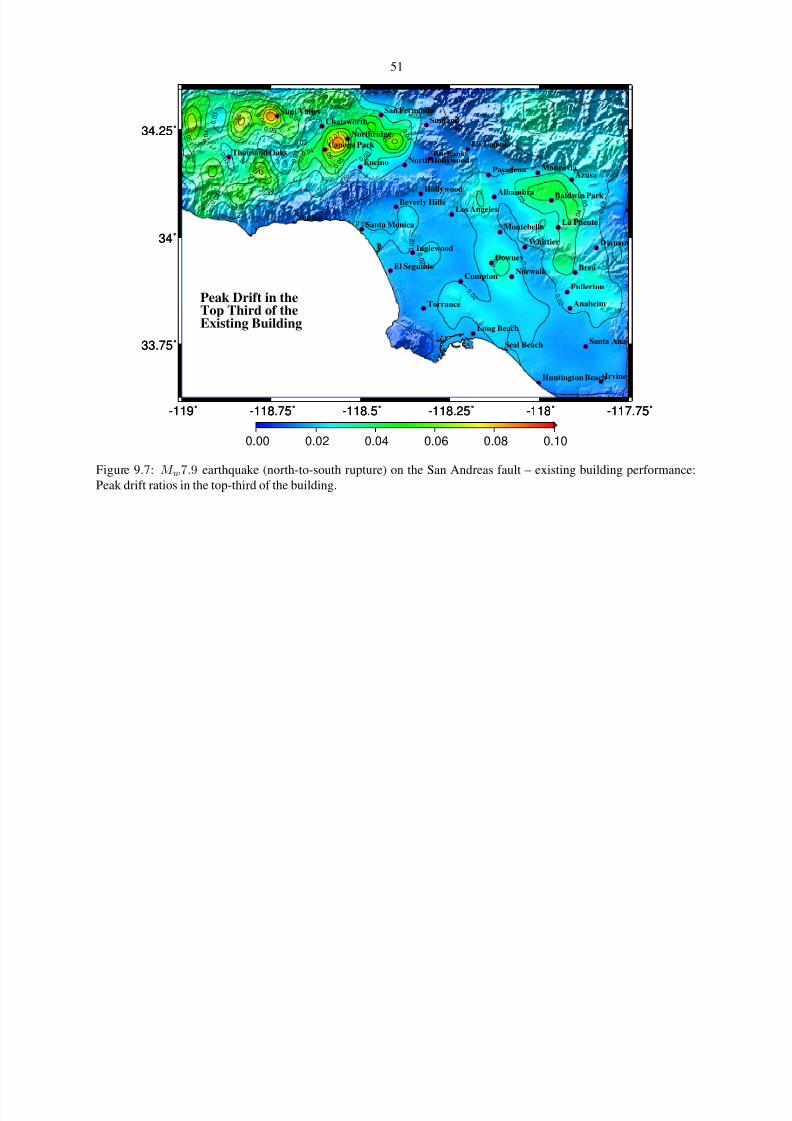
8/13/2019 Kri05
http://slidepdf.com/reader/full/kri05 69/177

8/13/2019 Kri05
http://slidepdf.com/reader/full/kri05 70/177
52
-119˚ -118.75˚ -118.5˚ -118.25˚ -118˚ -117.75˚
33.75˚
34˚
34.25˚
0 .0 2
0. 0 2 0.
0 2
0 . 0 2
0 . 0 2
0. 0 2
0.03
0 .0 3
0 .0 3
0 .0 3
0 .0 3
0 . 0 3
0. 0 4
0 . 0 4
0 .0 4
0 .0 4
0 .0 4
0 . 0
4
0 . 0 4
0. 0 5
0 . 0 5
0. 0 5
0. 0 5
0. 0 5
0.05
0 . 0
5
0 .
0 5
0 .0 6
0.06
0 . 0
6
0 . 0 6
0 . 0 6
0. 0 6
0. 0 6
0.06
0 . 0
6
0.07
0.07
0 . 0
7
0 . 0 7 0 .0 7
0 . 0 7
0 .0 7
0 . 0
7
0 . 0 7
0 .0 8
0. 0 8
0 . 0 8
0 . 0 8
0 . 0
8
0 . 0 8
0 .0 8
0. 0 8
0.0 9
0 . 0
9
0 . 0 9
0 .
0 9
0 .0 9
0. 0 9
0.09
0.1
0 . 1
0 . 1
0 . 1
0. 1
0 .1
0 .1
-119˚ -118.75˚ -118.5˚ -118.25˚ -118˚ -117.75˚
33.75˚
34˚
34.25˚
0.00 0.02 0.04 0.06 0.08 0.10
Alhambra
Anaheim
Azusa
Baldwin ParkBeverly Hills
Brea
BurbankCanoga Park
Chatsworth
Compton
Diamon
DowneyEl Segundo
Encino
Fullerton
Hollywood
Huntington Beach
Inglewood
Irvine
La Canada
La Puente
Long Beach
Los AngelesMalibu
Monrovia
Montebello
North Hollywood
Northridge
Norwalk
Pasadena
Point Dume
San Fernando
Santa Ana
Santa Monica
Seal Beach
Simi ValleySunland
Thousand Oaks
Torrance
Whittier
Peak Drift in theMiddle Third of theExisting Building
Figure 9.8: M w7.9 earthquake (north-to-south rupture) on the San Andreas fault – existing building performance:
Peak drift ratios in the middle-third of the building.
-119˚ -118.75˚ -118.5˚ -118.25˚ -118˚ -117.75˚
33.75˚
34˚
34.25˚
0 .0 2
0. 0 2
0. 0 2
0 . 0 2
0 .0 2
0. 0 2
0.0 3
0 .0 3
0 . 0 3
0 . 0
3
0 . 0 3
0 . 0 3
0. 0 4
0 . 0
4
0 . 0 4
0 .0 4
0.04
0 . 0
4
0 . 0
4
0 . 0 4
0. 0 5
0. 0 5
0 . 0 5
0.05
0.05
0 . 0
5
0 . 0 5
0 .0 5
0 . 0 6
0.06
0 . 0
6
0 . 0 6
0 .0 6
0. 0 6
0 .0 6
0 .
0 6
0.06
0.07
0 . 0 7
0 . 0
7
0 . 0 7
0 . 0 7
0 .0 7
0 . 0 7
0 . 0 7
0 . 0 7
0.08
0 . 0
8
0 . 0 8
0 . 0 8
0. 0 8
0 . 0 8
0 .0 8
0. 0 8
0 . 0
9
0 . 0
9
0.09
0 . 0 9
0 . 0 9
0 . 0 9
0.0 9
0 . 1
0 . 1
0 . 1
0 . 1
0. 1
0 .1
-119˚ -118.75˚ -118.5˚ -118.25˚ -118˚ -117.75˚
33.75˚
34˚
34.25˚
0.00 0.02 0.04 0.06 0.08 0.10
Alhambra
Anaheim
Azusa
Baldwin ParkBeverly Hills
Brea
BurbankCanoga Park
Chatsworth
Compton
Diamon
DowneyEl Segundo
Encino
Fullerton
Hollywood
Huntington Beach
Inglewood
Irvine
La Canada
La Puente
Long Beach
Los AngelesMalibu
Monrovia
Montebello
North Hollywood
Northridge
Norwalk
Pasadena
Point Dume
San Fernando
Santa Ana
Santa Monica
Seal Beach
Simi ValleySunland
Thousand Oaks
Torrance
Whittier
Peak Drift in theBottom Third of theExisting Building
Figure 9.9: M w7.9 earthquake (north-to-south rupture) on the San Andreas fault – existing building performance:
Peak drift ratios in the bottom-third of the building.

8/13/2019 Kri05
http://slidepdf.com/reader/full/kri05 71/177
53
-119˚ -118.75˚ -118.5˚ -118.25˚ -118˚ -117.75˚
33.75˚
34˚
34.25˚
0 .0 2
0. 0 2
0. 0 2
0 . 0 2
0 .
0 2
0. 0 2
0.03
0 .0 3
0 .0 3
0 .0 3
0 . 0 3
0 . 0 3
0. 0 4
0 . 0 4
0 .0 4
0 .0 4
0 .0 4
0 . 0 4
0 . 0
4
0. 0 5
0. 0 5
0 . 0 5
0 . 0 5
0.05
0 . 0
5
0 .
0 5
0 .0 5
0 . 0 6
0.06
0 . 0
6
0 . 0 6
0 . 0 6
0. 0 6
0. 0 6
0. 06
0 . 0
6
0.07
0.07
0 . 0
7
0 . 0 7
0 .0 7
0 . 0 7
0 . 0
7
0 . 0
7
0 . 0
7
0. 0 8
0. 0 8
0 . 0
8
0 . 0 8
0 . 0 8
0 . 0 8
0 .0 8
0. 0 8
0.09
0 . 0
9
0 . 0 9
0 .
0 9
0 .0 9 0 . 0 9
0.09
0.1
0 . 1
0 . 1
0 . 1 0
. 1
0. 1
0 .1
-119˚ -118.75˚ -118.5˚ -118.25˚ -118˚ -117.75˚
33.75˚
34˚
34.25˚
0.00 0.02 0.04 0.06 0.08 0.10
Alhambra
Anaheim
Azusa
Baldwin ParkBeverly Hills
Brea
BurbankCanoga Park
Chatsworth
Compton
Diamon
DowneyEl Segundo
Encino
Fullerton
Hollywood
Huntington Beach
Inglewood
Irvine
La Canada
La Puente
Long Beach
Los AngelesMalibu
Monrovia
Montebello
North Hollywood
Northridge
Norwalk
Pasadena
Point Dume
San Fernando
Santa Ana
Santa Monica
Seal Beach
Simi ValleySunland
Thousand Oaks
Torrance
Whittier
Existing BuildingDrift Index
Figure 9.10: M w7.9 earthquake (north-to-south rupture) on the San Andreas fault – existing building performance:
Peak drift ratios anywhere in the building.
-119˚ -118.75˚ -118.5˚ -118.25˚ -118˚ -117.75˚
33.75˚
34˚
34.25˚
0.0 0.2 0.4 0.6 0.8 1.0 1.2 1.4
Alhambra
Anaheim
Azusa
Baldwin ParkBeverly Hills
Brea
BurbankCanoga Park
Chatsworth
Compton
Diamon
DowneyEl Segundo
Encino
Fullerton
Hollywood
Huntington Beach
Inglewood
Irvine
La Canada
La Puente
Long Beach
Los AngelesMalibu
Monrovia
Montebello
North Hollywood
Northridge
Norwalk
Pasadena
Point Dume
San Fernando
Santa Ana
Santa Monica
Seal Beach
Simi ValleySunland
Thousand Oaks
Torrance
Whittier
Permanent Tilt (m) at thePenthouse of the Existing Building(Arrow denotes tilt direction)
Figure 9.11: M w7.9 earthquake (north-to-south rupture) on the San Andreas fault – existing building performance:
Permanent offset at the penthouse level.

8/13/2019 Kri05
http://slidepdf.com/reader/full/kri05 72/177
54
-119˚ -118.75˚ -118.5˚ -118.25˚ -118˚ -117.75˚
33.75˚
34˚
34.25˚
2 .5
2.5
2 . 5
2 .
5
2 . 5
5
5
5
5
5
5
7. 5
7.57 . 5
7. 5
7 .5
7 . 5
1 0
1 0
1 0
1 0
1 0
1 0
10
10
1 0
1 2 . 5
1 2
. 5
1 2 .5
1 2
. 5
12 .5
12 .5
1 2.5
1 2.5
1 2. 5
1 2
. 5
1 2
. 5
1 5
1 5
1 5
1 5
1 5
1 5
1 5
17 .5
1 7
. 5
17.5
1 7.51 7 . 5
20
2 0
2 0
2 2 .5
2 2. 5
2 2 .
5
2 2 . 5
2 5
25
2 5
2 5
-119˚ -118.75˚ -118.5˚ -118.25˚ -118˚ -117.75˚
33.75˚
34˚
34.25˚
0.0 4.5 9.0 13.5 18.0 22.5
Alhambra
Anaheim
Azusa
Baldwin ParkBeverly Hills
Brea
BurbankCanoga Park
Chatsworth
Compton
Diamon
DowneyEl Segundo
Encino
Fullerton
Hollywood
Huntington Beach
Inglewood
Irvine
La Canada
La Puente
Long Beach
Los AngelesMalibu
Monrovia
Montebello
North Hollywood
Northridge
Norwalk
Pasadena
Point Dume
San Fernando
Santa Ana
Santa Monica
Seal Beach
Simi ValleySunland
Thousand Oaks
Torrance
Whittier
Existing BuildingConnection FracturePercentage
Figure 9.12: M w7.9 earthquake (north-to-south rupture) on the San Andreas fault – existing building performance:
Percentage of connections that fracture (out of a total of 710 connections with the two ends of each moment-framebeam and column defined as connections).

8/13/2019 Kri05
http://slidepdf.com/reader/full/kri05 73/177
55
-119˚ -118.75˚ -118.5˚ -118.25˚ -118˚ -117.75˚
33.75˚
34˚
34.25˚
0 .0 1
0.01
0. 0 1
0.01
0 . 0
1
0. 0 2
0 . 0 2
.
0 . 0 2
0.020 . 0 2
0 . 0 2
0 . 0 2
0 . 0 2
0 . 0 2
0
. 0 2
0 . 0 2
0 . 0 2
0.0 3
0 .0 3
0. 0 3
0 .0 3
0 . 0
3
0. 0 3
0 . 0
3
0 . 0
3
0 . 0
4
0. 0 4
-119˚ -118.75˚ -118.5˚ -118.25˚ -118˚ -117.75˚
33.75˚
34˚
34.25˚
0.00 0.02 0.04 0.06 0.08 0.10
Alhambra
Anaheim
Azusa
Baldwin ParkBeverly Hills
Brea
BurbankCanoga Park
Chatsworth
Compton
Diamon
DowneyEl Segundo
Encino
Fullerton
Hollywood
Huntington Beach
Inglewood
Irvine
La Canada
La Puente
Long Beach
Los AngelesMalibu
Monrovia
Montebello
North Hollywood
Northridge
Norwalk
Pasadena
Point Dume
San Fernando
Santa Ana
Santa Monica
Seal Beach
Simi ValleySunland
Thousand Oaks
Torrance
Whittier
Peak Drift in theTop Third of theNew Building
Figure 9.13: M w7.9 earthquake (north-to-south rupture) on the San Andreas fault – redesigned building performance:
Peak drift ratios in the top-third of the building.
-119˚ -118.75˚ -118.5˚ -118.25˚ -118˚ -117.75˚
33.75˚
34˚
34.25˚
0.01
0.01
0.0 2
0 .0 2
0 . 0 2
0 . 0
2
0. 0 2
0.0 2
0 .0 2
0 .0 3
0 . 0
3
0 .0 3
0 . 0
3
0 . 0 3
0 . 0 3
0 . 0 3
0.03
0 . 0 3
0 . 0 3
0. 0 4
0 . 0 4
0 . 0
4
0 .0 4
0 .
0 4
0 . 0 4
0 . 0 4
0.04
0 .0 4
0 . 0
4
0 . 0
4
0.05
0 .
0 5
0. 0 5
0 . 0
5
0 . 0 5
0.05
0. 0 6
0 . 0 6
0 . 0 6
0 .0 6
0. 0 70
7
0.080 . 0 8
0 .0 9
0 . 0 9
0 . 0 9
0 .1
0 .
1
0 . 1
-119˚ -118.75˚ -118.5˚ -118.25˚ -118˚ -117.75˚
33.75˚
34˚
34.25˚
0.00 0.02 0.04 0.06 0.08 0.10
Alhambra
Anaheim
Azusa
Baldwin ParkBeverly Hills
Brea
BurbankCanoga Park
Chatsworth
Compton
Diamon
DowneyEl Segundo
Encino
Fullerton
Hollywood
Huntington Beach
Inglewood
Irvine
La Canada
La Puente
Long Beach
Los AngelesMalibu
Monrovia
Montebello
North Hollywood
Northridge
Norwalk
Pasadena
Point Dume
San Fernando
Santa Ana
Santa Monica
Seal Beach
Simi ValleySunland
Thousand Oaks
Torrance
Whittier
Peak Drift in theMiddle Third of theNew Building
Figure 9.14: M w7.9 earthquake (north-to-south rupture) on the San Andreas fault – redesigned building performance:
Peak drift ratios in the middle-third of the building.
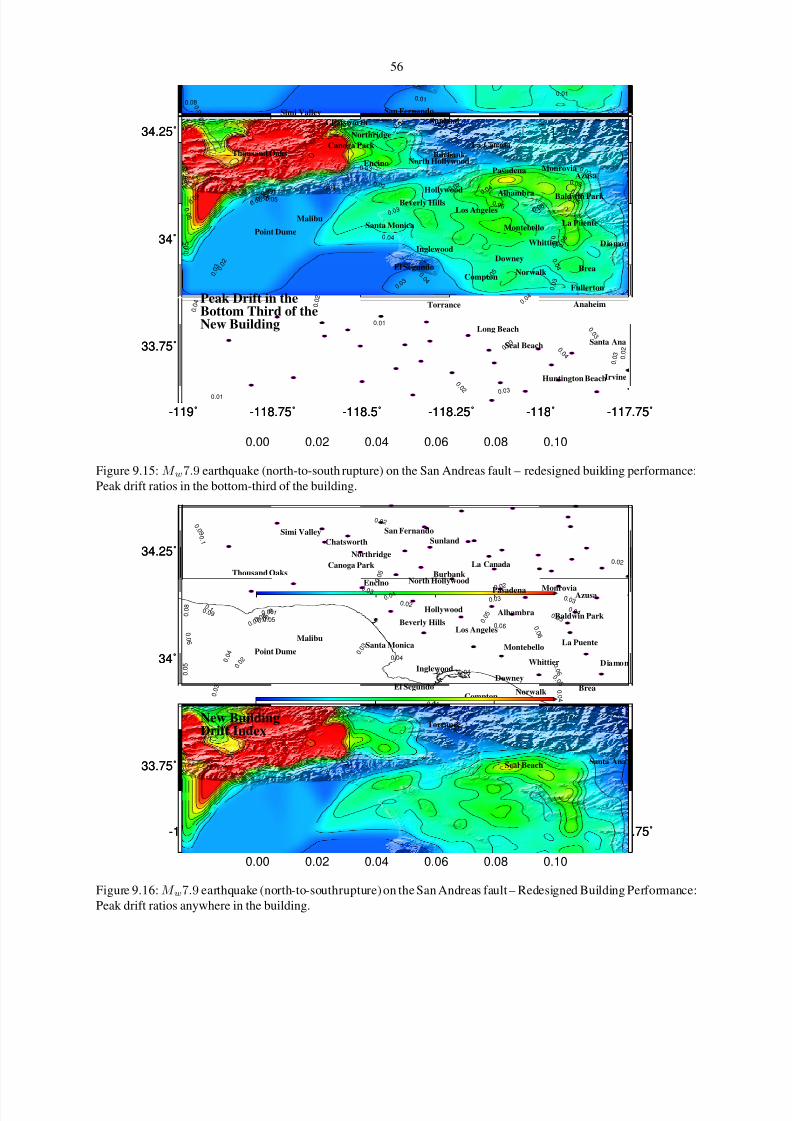
8/13/2019 Kri05
http://slidepdf.com/reader/full/kri05 74/177
56
-119˚ -118.75˚ -118.5˚ -118.25˚ -118˚ -117.75˚
33.75˚
34˚
34.25˚
0.01
0.01
0.010 .0 1
0 .0 2
0 . 0 2
0 .0 2
0 . 0
2
0 . 0
2
0 . 0
2
0. 0 2
0.03
0 . 0
3
0 .0 3
0 . 0
3
0. 0 3
0 . 0 3
0. 0 3
0 . 0
3
0 . 0 3
0. 0 3
0.04
0 . 0
4
0. 0 4
0 .0 4
0 . 0 4
0 . 0 4
0. 0 4
0.04
0 . 0
4
0 . 0 4
0.05
0 .
0 5
0 .0 5
0 . 0 5
0 . 0 5
0. 0 6
0 . 0 6
0 .0 6 0. 0
6
0 . 0 6
0. 0 7
.
7
0. 0 8
. 0 8
0.08
0. 0 9
0 . 0 9
0 . 0 9
0 .1
0 . 1
0 . 1
-119˚ -118.75˚ -118.5˚ -118.25˚ -118˚ -117.75˚
33.75˚
34˚
34.25˚
0.00 0.02 0.04 0.06 0.08 0.10
Alhambra
Anaheim
Azusa
Baldwin ParkBeverly Hills
Brea
BurbankCanoga Park
Chatsworth
Compton
Diamon
DowneyEl Segundo
Encino
Fullerton
Hollywood
Huntington Beach
Inglewood
Irvine
La Canada
La Puente
Long Beach
Los AngelesMalibu
Monrovia
Montebello
North Hollywood
Northridge
Norwalk
Pasadena
Point Dume
San Fernando
Santa Ana
Santa Monica
Seal Beach
Simi ValleySunland
Thousand Oaks
Torrance
Whittier
Peak Drift in theBottom Third of theNew Building
Figure 9.15: M w7.9 earthquake (north-to-south rupture) on the San Andreas fault – redesigned building performance:
Peak drift ratios in the bottom-third of the building.
-119˚ -118.75˚ -118.5˚ -118.25˚ -118˚ -117.75˚
33.75˚
34˚
34.25˚
0.01
0.01
0.0 2
0 .0 2
0 . 0 2
0 . 0
2
0.02
0. 0 2
0 .0 2
0 .0 3
0 . 0
3
0 .0 3
0 . 0
3
0 .0 3
0 . 0 3
0 . 0 3
0.0 3
0 . 0 3
0. 0 4
0 . 0 4
0 .0 4
0 . 0 4
0. 0 4
0.04
0.04
0.04
0 .0 4
0 . 0 4
0.05
0 .
0 5
0 . 0
5
0 .0 5
0 . 0
5
0 . 0 5
0 .0 5
0. 0 6
0 . 0 6
0.06 0 . 0 6
0 . 0 6
0. 0 7
.
0. 0 8 0
. 0 8
0.0 90 .0 9
0 . 0 9
0 .1
0 .1
0 . 1
-119˚ -118.75˚ -118.5˚ -118.25˚ -118˚ -117.75˚
33.75˚
34˚
34.25˚
0.00 0.02 0.04 0.06 0.08 0.10
Alhambra
Anaheim
Azusa
Baldwin ParkBeverly Hills
Brea
BurbankCanoga Park
Chatsworth
Compton
Diamon
DowneyEl Segundo
Encino
Fullerton
Hollywood
Huntington Beach
Inglewood
Irvine
La Canada
La Puente
Long Beach
Los AngelesMalibu
Monrovia
Montebello
North Hollywood
Northridge
Norwalk
Pasadena
Point Dume
San Fernando
Santa Ana
Santa Monica
Seal Beach
Simi ValleySunland
Thousand Oaks
Torrance
Whittier
New BuildingDrift Index
Figure 9.16: M w7.9 earthquake (north-to-southrupture) on the San Andreas fault – Redesigned Building Performance:
Peak drift ratios anywhere in the building.

8/13/2019 Kri05
http://slidepdf.com/reader/full/kri05 75/177
57
-119˚ -118.75˚ -118.5˚ -118.25˚ -118˚ -117.75˚
33.75˚
34˚
34.25˚
0.0 0.2 0.4 0.6 0.8 1.0 1.2 1.4
Alhambra
Anaheim
Azusa
Baldwin ParkBeverly Hills
Brea
BurbankCanoga Park
Chatsworth
Compton
Diamon
DowneyEl Segundo
Encino
Fullerton
Hollywood
Huntington Beach
Inglewood
Irvine
La Canada
La Puente
Long Beach
Los AngelesMalibu
Monrovia
Montebello
North Hollywood
Northridge
Norwalk
Pasadena
Point Dume
San Fernando
Santa Ana
Santa Monica
Seal Beach
Simi ValleySunland
Thousand Oaks
Torrance
Whittier
Permanent Tilt (m) at thePenthouse of the New Building(Arrow denotes tilt direction)
Figure 9.17: M w7.9 earthquake (north-to-south rupture) on the San Andreas Fault – redesigned building performance:
Permanent offset at the penthouse level.

8/13/2019 Kri05
http://slidepdf.com/reader/full/kri05 76/177
58
Chapter 10 Scenario 2: South-to-North Rupture of the San
Andreas Fault
A natural question to ask is what would happen if the rupture were to proceed from south to north instead of the
other way around with the peak slip occurring close to Parkfield. The results of such a scenario (surface slip for
which is shown in Figure 10.1), presented in this chapter, indicate that ground shaking would be far less severe. This
demonstrates the effect of directivity and slip distribution in dictating the level of ground shaking and the associated
damage in buildings.
Shown in Figures 10.2–10.4 and 10.5–10.7 are the peak velocities and displacements, respectively, of the ground
motion time-histories lowpass-filtered using a Butterworth filter with a corner period at 2 s. While the San Fernando
valley still experiences the most shaking, Santa Monica and, to some extent, Baldwin Park are not too far behind. The
peak velocities are of the order of 0.6 m.s−1 in the San Fernando valley, 0.5 m.s−1 in Santa Monica and El Segundo,
and 0.3 m.s−1 in the remaining parts of Los Angeles and Orange Counties. The corresponding peak displacements are
in the range of 0.5-0.6 m in the San Fernando valley, 0.4-0.5 m in Santa Monica and El Segundo, and 0.3-0.4 m in the
remaining parts of Los Angeles and Orange Counties.
The reduced level of shaking is reflected in the results of the building analyses (Figures 10.8–10.13 for the existing
building model and Figures 10.14–10.18 for the redesigned building model). Figure 10.13 shows the percentage of
connections where fracture occurs in the existing building model. Fracture occurs in 3–7% of the connections in this
building when located in the San Fernando valley. About 4–5% of the connections fracture in the building model when
it is located in Santa Monica or El Segundo. In most other areas, there is little or no risk associated with moment-frame
connection fractures. Figures 10.8 through 10.10 show the peak interstory drift that occurs in the top-third, middle-
third, and bottom-third of the existing building, respectively. Figure 10.11 collates these into a single map showing
the peak drift occurring in the building. As for rupture scenario 1, the peak interstory drifts in the middle-third and
bottom-third of the existing building are greater than the top-third which indicates that the damage is localized in thelower floors. Peak interstory drifts beyond 0.06 are indicative of severe damage, while drifts below 0.01 are indicative
of minimal damage not requiring any repairs. Peak drifts are in the neighborhood of 0.03 in the San Fernando valley,
Santa Monica, El Segundo and Baldwin Park. Peak drifts in most other areas are less than 0.02. Plotted on Figure
10.12 are the magnitude and direction of the permanent offset of the existing building model at the penthouse level
following the earthquake. Once again, the length of the arrow is proportional to the magnitude. There is negligible
permanent tilting of the existing building model in the entire domain of the analysis. This is dramatically different
from scenario 1 results once again revealing the role of directivity and slip distribution in dictating the level of damage.
The performance of the newly designed 18-story steel building is slightly better than the existing building for the
entire region. Figures 10.14 through 10.16 show the peak interstory drift that occurs in the top-third, middle-third, and
bottom-third of the redesigned building, respectively. Figure 10.17 collates these into a single map showing the peak
drift occurring in the building. Peak drifts are in the neighborhood of 0.02–0.03 when the building model is located
in the San Fernando valley, Santa Monica, El Segundo and Baldwin Park. Building peak drifts in most other areas are
in the neighborhood of 0.01. Plotted on Figure 10.18 are the magnitude and direction of the permanent offset of the
redesigned building model at the penthouse level following the earthquake.
To summarize, the results for both the existing and redesigned building models indicate that there is no significant
danger of collapse. However, damage would still be significant enough to warrant building closures and compromise
life safety in some instances.

8/13/2019 Kri05
http://slidepdf.com/reader/full/kri05 77/177
59
−122
−120
−118
−116−114
33
34
35
36
37
0
2
4
6
8
10
LongitudeLatitude
S l i p ( m )
San Andreas FaultRuptureRupture InitiationSlip (peak=7.4m)Particle Velocity (peak=4.3m/s)Rupture time (peak=94.3s)
Figure 10.1: Surface slip, particle velocity, and rupture time, for the simulated magnitude 7.9 earthquake on the San
Andreas fault – south-to-north rupture

8/13/2019 Kri05
http://slidepdf.com/reader/full/kri05 78/177
60
-119˚ -118.75˚ -118.5˚ -118.25˚ -118˚ -117.75˚
33.75˚
34˚
34.25˚
0 . 1
0.1
0 . 1
0 .1
0. 2
0 . 2
0 . 2
0 . 2
0. 2
0 .2
0. 2
0 . 2
0 . 3
0 . 3
. 3
0 . 3
0 . 3
0 . 4
0 .4
0 . 4
0. 4
0 .5
0 . 5
0 . 5
0 .6
0 . 6
0.6
-119˚ -118.75˚ -118.5˚ -118.25˚ -118˚ -117.75˚
33.75˚
34˚
34.25˚
0.0 0.1 0.2 0.3 0.4 0.5 0.6 0.7 0.8 0.9 1.0
Alhambra
Anaheim
Azusa
Baldwin ParkBeverly Hills
Brea
BurbankCanoga Park
Chatsworth
Compton
Diamon
DowneyEl Segundo
Encino
Fullerton
Hollywood
Huntington Beach
Inglewood
Irvine
La Canada
La Puente
Long Beach
Los AngelesMalibu
Monrovia
Montebello
North Hollywood
Northridge
Norwalk
Pasadena
Point Dume
San Fernando
Santa Ana
Santa Monica
Seal Beach
Simi ValleySunland
Thousand Oaks
Torrance
Whittier
E-W Vel (m/s)
Figure 10.2: M w7.9 earthquake (south-to-north rupture) on the San Andreas fault – ground shaking: Map of peak
velocities (east component).
-119˚ -118.75˚ -118.5˚ -118.25˚ -118˚ -117.75˚
33.75˚
34˚
34.25˚
0 .1
0 . 1 0
. 1
0. 1
0 .1
0 .
1
0 .2
0.2
.2
0 .2
0 . 2
0 .2
0 . 2
0 .2
0. 3
0 . 3
0 .3 0 . 3
0 .4
0 . 4
-119˚ -118.75˚ -118.5˚ -118.25˚ -118˚ -117.75˚
33.75˚
34˚
34.25˚
0.0 0.1 0.2 0.3 0.4 0.5 0.6 0.7 0.8 0.9 1.0
Alhambra
Anaheim
Azusa
Baldwin ParkBeverly Hills
Brea
BurbankCanoga Park
Chatsworth
Compton
Diamon
DowneyEl Segundo
Encino
Fullerton
Hollywood
Huntington Beach
Inglewood
Irvine
La Canada
La Puente
Long Beach
Los AngelesMalibu
Monrovia
Montebello
North Hollywood
Northridge
Norwalk
Pasadena
Point Dume
San Fernando
Santa Ana
Santa Monica
Seal Beach
Simi ValleySunland
Thousand Oaks
Torrance
Whittier
N-S Vel (m/s)
Figure 10.3: M w7.9 earthquake (south-to-north rupture) on the San Andreas fault – ground shaking: Map of peak
velocities (north component).

8/13/2019 Kri05
http://slidepdf.com/reader/full/kri05 79/177
61
-119˚ -118.75˚ -118.5˚ -118.25˚ -118˚ -117.75˚
33.75˚
34˚
34.25˚
0 . 1
0 .1
0. 1
0. 1
0 . 1
0.1
0. 1
0 . 1
-119˚ -118.75˚ -118.5˚ -118.25˚ -118˚ -117.75˚
33.75˚
34˚
34.25˚
0.0 0.1 0.2 0.3 0.4 0.5 0.6 0.7 0.8 0.9 1.0
Alhambra
Anaheim
Azusa
Baldwin ParkBeverly Hills
Brea
BurbankCanoga Park
Chatsworth
Compton
Diamon
DowneyEl Segundo
Encino
Fullerton
Hollywood
Huntington Beach
Inglewood
Irvine
La Canada
La Puente
Long Beach
Los AngelesMalibu
Monrovia
Montebello
North Hollywood
Northridge
Norwalk
Pasadena
Point Dume
San Fernando
Santa Ana
Santa Monica
Seal Beach
Simi ValleySunland
Thousand Oaks
Torrance
Whittier
Z Vel (m/s)
Figure 10.4: M w7.9 earthquake (south-to-north rupture) on the San Andreas fault – ground shaking: Map of peak
velocities (vertical component).
-119˚ -118.75˚ -118.5˚ -118.25˚ -118˚ -117.75˚
33.75˚
34˚
34.25˚ 0
. 0 8
0.16
0. 1 6 0
. 1 6
0 .1 6
0 .16
0 . 1 6
0 . 1 6
0 . 1 6
0. 2 4
0 . 2
4
0. 2 4
0 . 2 4
0.24 0 . 2 4
0 . 3
2
0 . 3 2
.
0 . 3 2
0 . 3
2
0 . 4
0 . 4
.
0 . 4
0 . 4
0 . 4 8
0 . 4 8
0 .4 8
0 .5 6
0 . 5 6
0. 5 6
0.64
-119˚ -118.75˚ -118.5˚ -118.25˚ -118˚ -117.75˚
33.75˚
34˚
34.25˚
0.0 0.1 0.2 0.3 0.4 0.5 0.6 0.7 0.8
Alhambra
Anaheim
Azusa
Baldwin ParkBeverly Hills
Brea
BurbankCanoga Park
Chatsworth
Compton
Diamon
DowneyEl Segundo
Encino
Fullerton
Hollywood
Huntington Beach
Inglewood
Irvine
La Canada
La Puente
Long Beach
Los AngelesMalibu
Monrovia
Montebello
North Hollywood
Northridge
Norwalk
Pasadena
Point Dume
San Fernando
Santa Ana
Santa Monica
Seal Beach
Simi ValleySunland
Thousand Oaks
Torrance
Whittier
E-W Dis (m)
Figure 10.5: M w7.9 earthquake (south-to-north rupture) on the San Andreas fault – ground shaking: Map of peak
displacements (east component).

8/13/2019 Kri05
http://slidepdf.com/reader/full/kri05 80/177
62
-119˚ -118.75˚ -118.5˚ -118.25˚ -118˚ -117.75˚
33.75˚
34˚
34.25˚
0 .
0 8
0.08
0. 1 6
0. 1 6
0 . 1
6
0. 1 6
0 . 1 6
.
0 .16
0 . 2 4
0 . 2 4
.
0. 2 4 0
. 2 4
0 . 2 4
0 .2 4
0 . 2 4
0. 3 2
0. 3 2
0 . 4
. 4
0. 4 8
0 .4 8
-119˚ -118.75˚ -118.5˚ -118.25˚ -118˚ -117.75˚
33.75˚
34˚
34.25˚
0.0 0.1 0.2 0.3 0.4 0.5 0.6 0.7 0.8
Alhambra
Anaheim
Azusa
Baldwin ParkBeverly Hills
Brea
BurbankCanoga Park
Chatsworth
Compton
Diamon
DowneyEl Segundo
Encino
Fullerton
Hollywood
Huntington Beach
Inglewood
Irvine
La Canada
La Puente
Long Beach
Los AngelesMalibu
Monrovia
Montebello
North Hollywood
Northridge
Norwalk
Pasadena
Point Dume
San Fernando
Santa Ana
Santa Monica
Seal Beach
Simi ValleySunland
Thousand Oaks
Torrance
Whittier
N-S Dis (m)
Figure 10.6: M w7.9 earthquake (south-to-north rupture) on the San Andreas fault – ground shaking: Map of peak
displacements (north component).
-119˚ -118.75˚ -118.5˚ -118.25˚ -118˚ -117.75˚
33.75˚
34˚
34.25˚
0. 0 8
0 . 0 8
0 . 0
8
0 .0 8
0 . 0
8
.
0.16
0 .1 6
0 . 1 6
-119˚ -118.75˚ -118.5˚ -118.25˚ -118˚ -117.75˚
33.75˚
34˚
34.25˚
0.0 0.1 0.2 0.3 0.4 0.5 0.6 0.7 0.8
Alhambra
Anaheim
Azusa
Baldwin ParkBeverly Hills
Brea
BurbankCanoga Park
Chatsworth
Compton
Diamon
DowneyEl Segundo
Encino
Fullerton
Hollywood
Huntington Beach
Inglewood
Irvine
La Canada
La Puente
Long Beach
Los AngelesMalibu
Monrovia
Montebello
North Hollywood
Northridge
Norwalk
Pasadena
Point Dume
San Fernando
Santa Ana
Santa Monica
Seal Beach
Simi ValleySunland
Thousand Oaks
Torrance
Whittier
Z Dis (m)
Figure 10.7: M w7.9 earthquake (south-to-north rupture) on the San Andreas fault – ground shaking: Map of peak
displacements (vertical component).
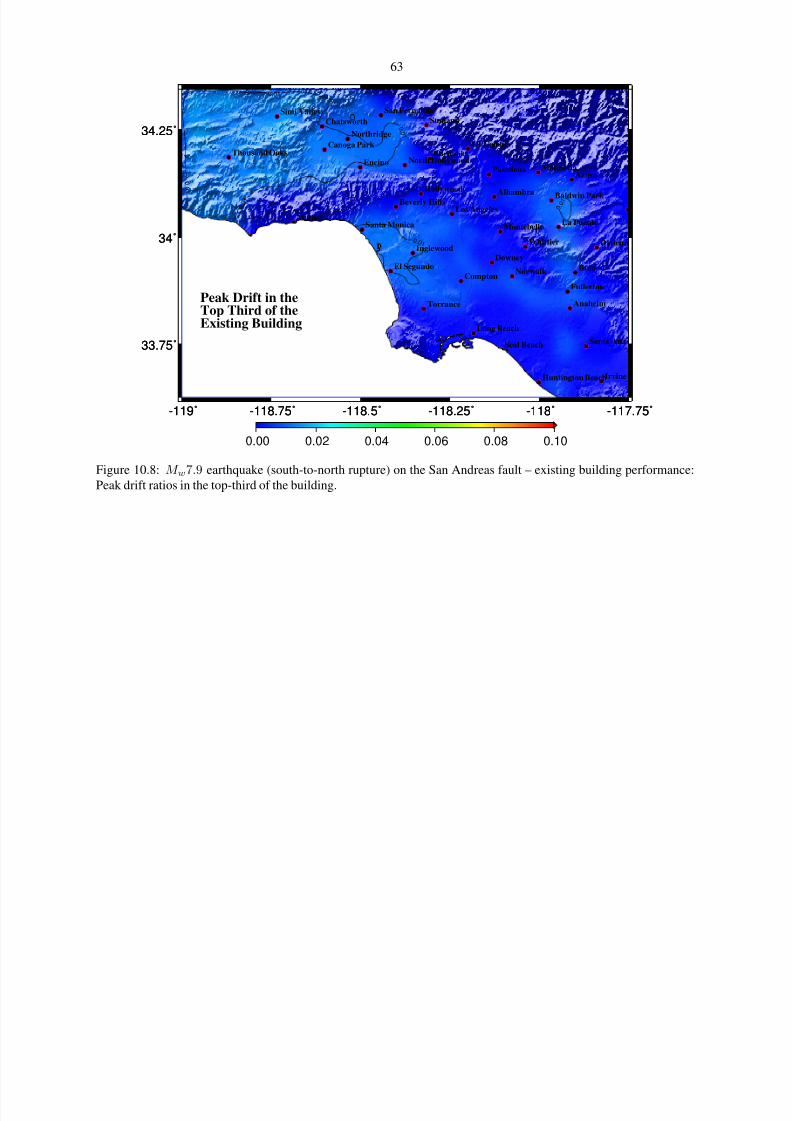
8/13/2019 Kri05
http://slidepdf.com/reader/full/kri05 81/177
63
-119˚ -118.75˚ -118.5˚ -118.25˚ -118˚ -117.75˚
33.75˚
34˚
34.25˚
0.01
0 . 0 1
0 . 0 1
0 .
0 1
0 . 0 1
0 .0 1 0
. 0 1
-119˚ -118.75˚ -118.5˚ -118.25˚ -118˚ -117.75˚
33.75˚
34˚
34.25˚
0.00 0.02 0.04 0.06 0.08 0.10
Alhambra
Anaheim
Azusa
Baldwin ParkBeverly Hills
Brea
BurbankCanoga Park
Chatsworth
Compton
Diamon
DowneyEl Segundo
Encino
Fullerton
Hollywood
Huntington Beach
Inglewood
Irvine
La Canada
La Puente
Long Beach
Los AngelesMalibu
Monrovia
Montebello
North Hollywood
Northridge
Norwalk
Pasadena
Point Dume
San Fernando
Santa Ana
Santa Monica
Seal Beach
Simi ValleySunland
Thousand Oaks
Torrance
Whittier
Peak Drift in theTop Third of theExisting Building
Figure 10.8: M w7.9 earthquake (south-to-north rupture) on the San Andreas fault – existing building performance:
Peak drift ratios in the top-third of the building.

8/13/2019 Kri05
http://slidepdf.com/reader/full/kri05 82/177
64
-119˚ -118.75˚ -118.5˚ -118.25˚ -118˚ -117.75˚
33.75˚
34˚
34.25˚
0.01
0 . 0 1
0 . 0
1
0 . 0
1
0 . 0
1
0. 0 1
0. 0 1
0 . 0
1
0.02
0. 0 2
0 .
0 2
0. 0 2
0 . 0
2
0.0 2
0 .0 2
0 . 0 3
0 . 0 3
0 . 0 4
-119˚ -118.75˚ -118.5˚ -118.25˚ -118˚ -117.75˚
33.75˚
34˚
34.25˚
0.00 0.02 0.04 0.06 0.08 0.10
Alhambra
Anaheim
Azusa
Baldwin ParkBeverly Hills
Brea
BurbankCanoga Park
Chatsworth
Compton
Diamon
DowneyEl Segundo
Encino
Fullerton
Hollywood
Huntington Beach
Inglewood
Irvine
La Canada
La Puente
Long Beach
Los AngelesMalibu
Monrovia
Montebello
North Hollywood
Northridge
Norwalk
Pasadena
Point Dume
San Fernando
Santa Ana
Santa Monica
Seal Beach
Simi ValleySunland
Thousand Oaks
Torrance
Whittier
Peak Drift in theMiddle Third of theExisting Building
Figure 10.9: M w7.9 earthquake (south-to-north rupture) on the San Andreas fault – existing building performance:
Peak drift ratios in the middle-third of the building.
-119˚ -118.75˚ -118.5˚ -118.25˚ -118˚ -117.75˚
33.75˚
34˚
34.25˚
0.01
0 . 0 1
0 . 0
1
0 . 0
1
0 .0 1
0. 0 1
0.01
0 . 0
1
0.02
0 .
0 2
0 . 0
2
0. 0 2
0 . 0 2
0 . 0
2
0 .0 2 0
. 0 2
0 .0 3
0 . 0 3
0 . 0 3
0. 0 3
0 . 0 4
-119˚ -118.75˚ -118.5˚ -118.25˚ -118˚ -117.75˚
33.75˚
34˚
34.25˚
0.00 0.02 0.04 0.06 0.08 0.10
Alhambra
Anaheim
Azusa
Baldwin ParkBeverly Hills
Brea
BurbankCanoga Park
Chatsworth
Compton
Diamon
DowneyEl Segundo
Encino
Fullerton
Hollywood
Huntington Beach
Inglewood
Irvine
La Canada
La Puente
Long Beach
Los AngelesMalibu
Monrovia
Montebello
North Hollywood
Northridge
Norwalk
Pasadena
Point Dume
San Fernando
Santa Ana
Santa Monica
Seal Beach
Simi ValleySunland
Thousand Oaks
Torrance
Whittier
Peak Drift in theBottom Third of theExisting Building
Figure 10.10: M w7.9 earthquake (south-to-north rupture) on the San Andreas fault – existing building performance:
Peak drift ratios in the bottom-third of the building.

8/13/2019 Kri05
http://slidepdf.com/reader/full/kri05 83/177
65
-119˚ -118.75˚ -118.5˚ -118.25˚ -118˚ -117.75˚
33.75˚
34˚
34.25˚
0.01
0 . 0 1
0 . 0
1
0 . 0
1
0 .0 1
0. 0 1
0.01
0. 0 1
0. 0 2
0. 0 2
0 .
0 2
0. 0 2
0 .0 2
0 . 0 2
0 .0 3
0 . 0 3
0 . 0
3
0. 0 3
0 . 0 4
-119˚ -118.75˚ -118.5˚ -118.25˚ -118˚ -117.75˚
33.75˚
34˚
34.25˚
0.00 0.02 0.04 0.06 0.08 0.10
Alhambra
Anaheim
Azusa
Baldwin ParkBeverly Hills
Brea
BurbankCanoga Park
Chatsworth
Compton
Diamon
DowneyEl Segundo
Encino
Fullerton
Hollywood
Huntington Beach
Inglewood
Irvine
La Canada
La Puente
Long Beach
Los AngelesMalibu
Monrovia
Montebello
North Hollywood
Northridge
Norwalk
Pasadena
Point Dume
San Fernando
Santa Ana
Santa Monica
Seal Beach
Simi ValleySunland
Thousand Oaks
Torrance
Whittier
Existing BuildingDrift Index
Figure 10.11: M w7.9 earthquake (south-to-north rupture) on the San Andreas fault – existing building performance:
Peak drift ratios anywhere in the building.
-119˚ -118.75˚ -118.5˚ -118.25˚ -118˚ -117.75˚
33.75˚
34˚
34.25˚
0.0 0.2 0.4 0.6 0.8 1.0 1.2 1.4
Alhambra
Anaheim
Azusa
Baldwin ParkBeverly Hills
Brea
BurbankCanoga Park
Chatsworth
Compton
Diamon
DowneyEl Segundo
Encino
Fullerton
Hollywood
Huntington Beach
Inglewood
Irvine
La Canada
La Puente
Long Beach
Los AngelesMalibu
Monrovia
Montebello
North Hollywood
Northridge
Norwalk
Pasadena
Point Dume
San Fernando
Santa Ana
Santa Monica
Seal Beach
Simi ValleySunland
Thousand Oaks
Torrance
Whittier
Permanent Tilt (m) at thePenthouse of the Existing Building(Arrow denotes tilt direction)
Figure 10.12: M w7.9 earthquake (south-to-north rupture) on the San Andreas fault – existing building performance:
Permanent offset at the penthouse level.
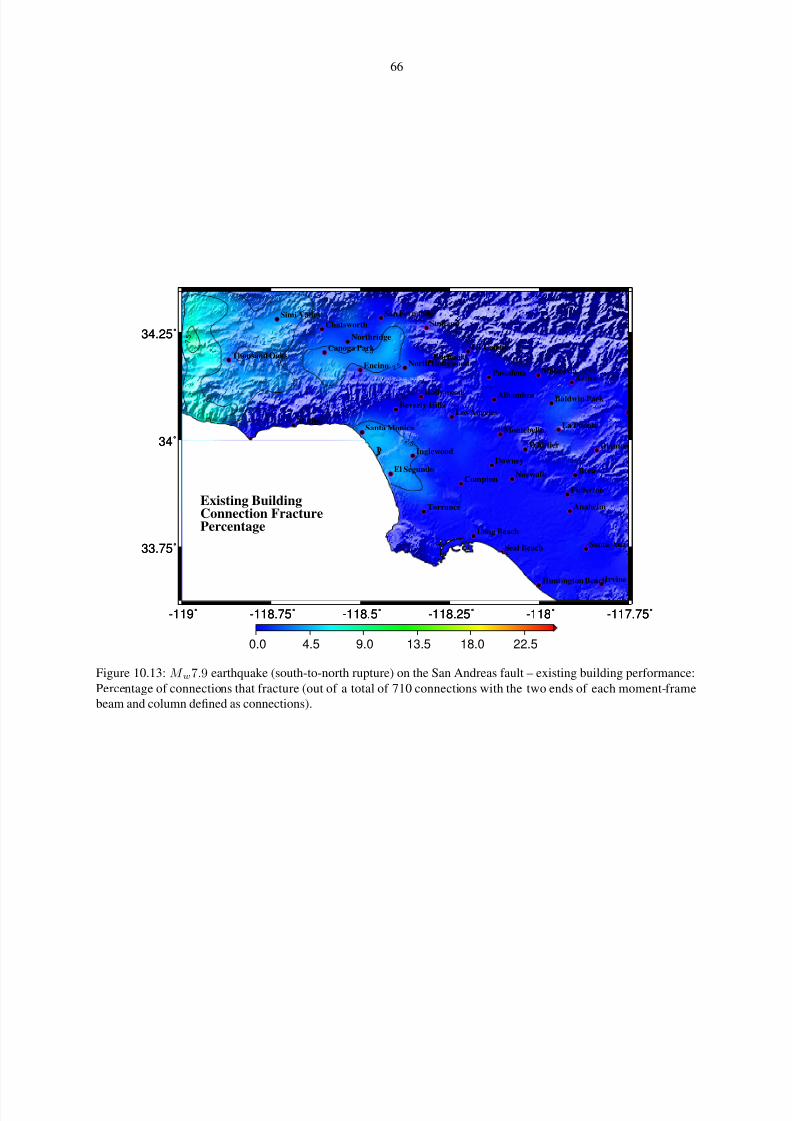
8/13/2019 Kri05
http://slidepdf.com/reader/full/kri05 84/177
66
-119˚ -118.75˚ -118.5˚ -118.25˚ -118˚ -117.75˚
33.75˚
34˚
34.25˚
2 . 5
.5
2. 5
2 .5
2 .5
2 . 5
5
5
7 . 5
-119˚ -118.75˚ -118.5˚ -118.25˚ -118˚ -117.75˚
33.75˚
34˚
34.25˚
0.0 4.5 9.0 13.5 18.0 22.5
Alhambra
Anaheim
Azusa
Baldwin ParkBeverly Hills
Brea
BurbankCanoga Park
Chatsworth
Compton
Diamon
DowneyEl Segundo
Encino
Fullerton
Hollywood
Huntington Beach
Inglewood
Irvine
La Canada
La Puente
Long Beach
Los AngelesMalibu
Monrovia
Montebello
North Hollywood
Northridge
Norwalk
Pasadena
Point Dume
San Fernando
Santa Ana
Santa Monica
Seal Beach
Simi ValleySunland
Thousand Oaks
Torrance
Whittier
Existing BuildingConnection FracturePercentage
Figure 10.13: M w7.9 earthquake (south-to-north rupture) on the San Andreas fault – existing building performance:
Percentage of connections that fracture (out of a total of 710 connections with the two ends of each moment-framebeam and column defined as connections).

8/13/2019 Kri05
http://slidepdf.com/reader/full/kri05 85/177
67
-119˚ -118.75˚ -118.5˚ -118.25˚ -118˚ -117.75˚
33.75˚
34˚
34.25˚
0.01
0 .0 1
0 .
0 1
0.01
0 . 0 1
0.01
0 . 0
1
0 .0 1
-119˚ -118.75˚ -118.5˚ -118.25˚ -118˚ -117.75˚
33.75˚
34˚
34.25˚
0.00 0.02 0.04 0.06 0.08 0.10
Alhambra
Anaheim
Azusa
Baldwin ParkBeverly Hills
Brea
BurbankCanoga Park
Chatsworth
Compton
Diamon
DowneyEl Segundo
Encino
Fullerton
Hollywood
Huntington Beach
Inglewood
Irvine
La Canada
La Puente
Long Beach
Los AngelesMalibu
Monrovia
Montebello
North Hollywood
Northridge
Norwalk
Pasadena
Point Dume
San Fernando
Santa Ana
Santa Monica
Seal Beach
Simi ValleySunland
Thousand Oaks
Torrance
Whittier
Peak Drift in theTop Third of theNew Building
Figure 10.14: M w7.9 earthquake (south-to-north rupture) on the San Andreas fault – redesigned building performance:
Peak drift ratios in the top-third of the building.
-119˚ -118.75˚ -118.5˚ -118.25˚ -118˚ -117.75˚
33.75˚
34˚
34.25˚
0 .0 1
0 . 0 1
0 . 0
1
0 . 0 1
0. 0 1
0 . 0 1
0 .0 2
0 . 0
2
0. 0 2
0 .0 2
0 . 0 3
-119˚ -118.75˚ -118.5˚ -118.25˚ -118˚ -117.75˚
33.75˚
34˚
34.25˚
0.00 0.02 0.04 0.06 0.08 0.10
Alhambra
Anaheim
Azusa
Baldwin ParkBeverly Hills
Brea
BurbankCanoga Park
Chatsworth
Compton
Diamon
DowneyEl Segundo
Encino
Fullerton
Hollywood
Huntington Beach
Inglewood
Irvine
La Canada
La Puente
Long Beach
Los AngelesMalibu
Monrovia
Montebello
North Hollywood
Northridge
Norwalk
Pasadena
Point Dume
San Fernando
Santa Ana
Santa Monica
Seal Beach
Simi ValleySunland
Thousand Oaks
Torrance
Whittier
Peak Drift in theMiddle Third of theNew Building
Figure 10.15: M w7.9 earthquake (south-to-north rupture) on the San Andreas fault – redesigned building performance:
Peak drift ratios in the middle-third of the building.

8/13/2019 Kri05
http://slidepdf.com/reader/full/kri05 86/177
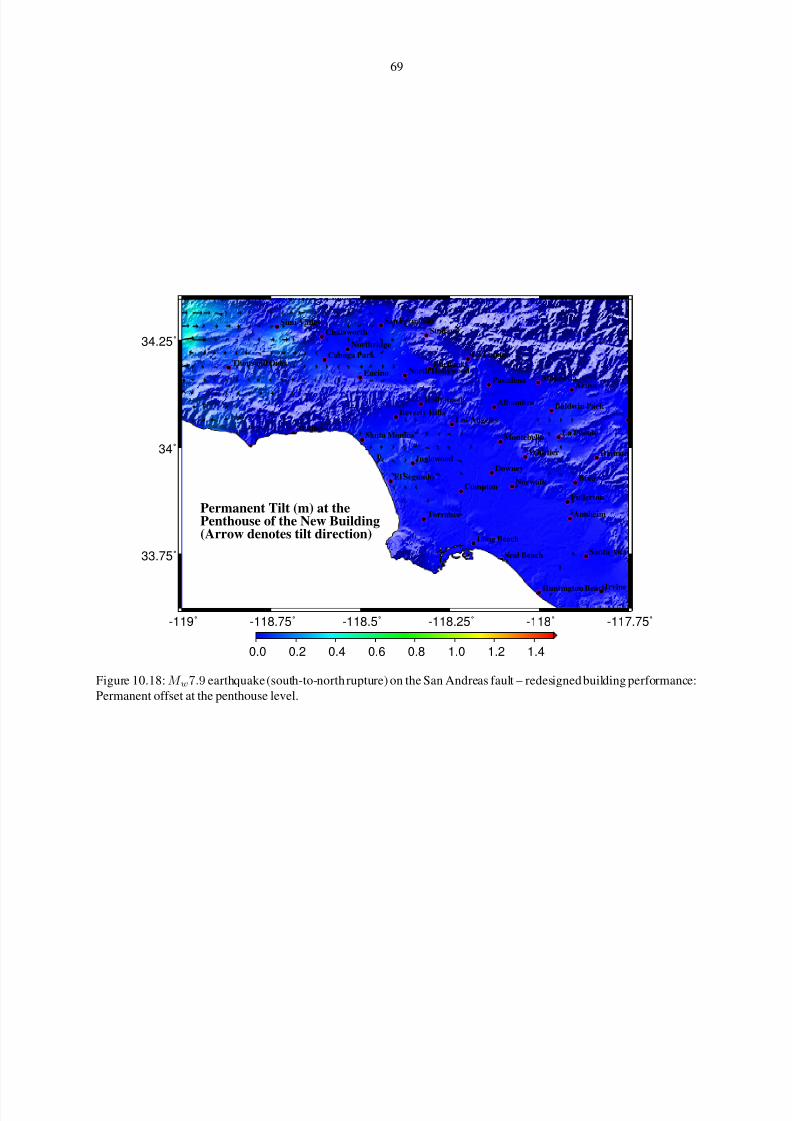
8/13/2019 Kri05
http://slidepdf.com/reader/full/kri05 87/177
69
-119˚ -118.75˚ -118.5˚ -118.25˚ -118˚ -117.75˚
33.75˚
34˚
34.25˚
0.0 0.2 0.4 0.6 0.8 1.0 1.2 1.4
Alhambra
Anaheim
Azusa
Baldwin ParkBeverly Hills
Brea
BurbankCanoga Park
Chatsworth
Compton
Diamon
DowneyEl Segundo
Encino
Fullerton
Hollywood
Huntington Beach
Inglewood
Irvine
La Canada
La Puente
Long Beach
Los AngelesMalibu
Monrovia
Montebello
North Hollywood
Northridge
Norwalk
Pasadena
Point Dume
San Fernando
Santa Ana
Santa Monica
Seal Beach
Simi ValleySunland
Thousand Oaks
Torrance
Whittier
Permanent Tilt (m) at thePenthouse of the New Building(Arrow denotes tilt direction)
Figure 10.18: M w7.9 earthquake (south-to-north rupture) on the San Andreas fault – redesigned building performance:
Permanent offset at the penthouse level.

8/13/2019 Kri05
http://slidepdf.com/reader/full/kri05 88/177
70
Chapter 11 Conclusions
Comprehensive end-to-end simulations of two magnitude 7.9 earthquakes on the San Andreas fault and the resulting
damage on models of an existing and a redesigned 18-story steel moment-frame building have been performed. The
2002 Denali earthquake finite-source model has been mapped to the San Andreas fault and ground motions in the
southern California region are computed at 636 chosen sites for two rupture scenarios – (a) north to south with rupture
initiating at Parkfield; and (b) south to north with rupture terminating at Parkfield. 3-D computer models of an existing
building in Woodland Hills that got damaged during the 1994 Northridge earthquake and the same building redesigned
according to the 1997 Uniform Building Code are analyzed for the three-component ground motion (lowpass-filtered
using a Butterworth filter with a corner period of 2 s) at each of the 636 considered sites. Performance of the building
models has been classified primarily based on the peak interstory drift ratio.
The following are the conclusions of this study:
1. For the north-to-south rupture scenario, the peak ground velocity is of the order of 2 m.s−1 in the San Fernando
Valley and 1 m.s−1 in the Los Angeles basin, while the corresponding numbers for the south-to-north rupture
scenario are 0.6 m.s−1 and 0.4 m.s−1, respectively.
2. For the north-to-south rupture scenario, the peak ground displacement is of the order of 2 m in the San Fernando
Valley and 1 m in the Los Angeles basin, while the corresponding numbers for the south-to-north rupture sce-
nario are 0.6 m and 0.4 m respectively. The stark contrast between the ground motions in the two cases is an
illustration of the effects of directivity and slip distribution in dictating the intensity of ground motion.
3. Under the ground motion from the north-to-south rupture, peak drifts in the existing building model far exceed
0.10 in the San Fernando Valley, Santa Monica and West Los Angeles, Baldwin Park and neighboring cities,
Compton and neighboring cities, and Seal Beach and neighboring cities. Peak drifts are in the 0.06–0.08 range
in Huntington Beach, Santa Ana, Anaheim and neighboring cities, while the numbers are in the 0.04–0.06 rangefor the remaining areas including downtown Los Angeles. Peak drifts exceeding 0.10 are indicative of probable
collapse, while drifts exceeding 0.06 are indicative of severe damage. Peak drifts in excess of 0.025 could
compromise life-safety.
4. The results for the redesigned building are better than the existing building. However, the peak drifts in many
areas in the San Fernando valley still exceed 0.10, and they are in the range of 0.04–0.06 for most cities in the
Los Angeles basin. While this may not conclusively be indicative of collapse, it certainly points to significant
damage and may result in building closures.
5. Under the ground motion from the south-to-north rupture, the peak drifts in existing and redesigned building
models are in the range of 0.02–0.04, indicating that there is no significant danger of collapse. However, this
is indicative of damage significant enough to warrant building closures and compromise life safety in some
instances.
Finally, these conclusions are particular to the two 18-story steel moment-frame buildings considered in the study.
Other buildings with varied configuration, constructed with other materials, and having distinct frequency content
could have damage patterns quite different from the results presented here. Having said this, the fact remains that the
potential for a big earthquake with a large amount of slip on the San Andreas fault exists, and with the current state

8/13/2019 Kri05
http://slidepdf.com/reader/full/kri05 89/177
71
of knowledge of the southern Californian Earth structure, this study indicates that serious damage occurs in these two
18-story steel moment-frame buildings in at least one of the plausible scenarios.
8/13/2019 Kri05
http://slidepdf.com/reader/full/kri05 90/177
72
Chapter 12 Future Research
The field of end-to-end simulations is still nascent in its development and is the wave of the future. The advent of
parallel computing as a seismological tool in the last decade has revolutionized the field. As more data becomes
available, simulations can be validated and improved tremendously. In the coming decade, it is inevitable that this
field will take center-stage in the assessment of infrastructure in the United States and elsewhere.
Future work in this area could involve one or many of the following aspects:
1. Improving the source models: This requires data gathering for earthquakes of various magnitudes on the faults
of interest in a given region. It is crucial to not only have a greater number of data sets, but also have a variety
of data types. Combinations of GPS, strong motion and teleseismic data sets yield the best results in terms of
characterizing the source.
2. This work needs to be extended to other faults in southern California so that a broad picture of risk associated
with regional earthquakes emerges. Some important faults in the region which require immediate attention arethe Newport-Inglewood and Santa Monica-Hollywood-Raymond fault systems in addition to blind-thrust faults
such as the Puente Hills fault under downtown Los Angeles.
3. The Earth velocity model needs to be improved to enable reliable simulation of broad-band ground motion. This
is especially critical for the assessment of short structures (including wood-frame structures). This requires the
procurement of large amounts of data from future earthquakes.
4. Validation of the numerical procedures, both seismological and structural, require ground-motion and building-
motion and building-damage data from future earthquakes. Items 1 through 4 call for increased seismic instru-
mentation in the region including extensive instrumentation of building and other civil structures.
5. This work needs to be extended to other types of buildings. These should be classified based on type of lat-eral system, material (reinforced concrete, steel, wood etc.), geometry (height, plan), and function (residential,
commercial, etc.).
6. Improving structural component and assembly modeling . This involves eliminating some of the limitations of
this study described in Chapter 4 including, but not limited to, soil-structure interaction, column splices, column
local flange buckling, composite action of beams, stiffness from partitions and elevator/stair enclosures, etc.
7. Including the top-soil layer in the ground motion simulation.
8. Performing similar analyses in other regions in the world. To start with, this involves instrumenting the region,
recording data from regional and distant earthquakes, and creating and validating regional Earth models. Once
the computational infrastructure is ready, the procedures described in this study can be adopted to performend-to-end simulations.

8/13/2019 Kri05
http://slidepdf.com/reader/full/kri05 91/177
73
Appendix A Section Database
The sizes of box-sections used for beams and columns in the redesigned building (see Appendix C for beam and
column sizes) are provided in this appendix. The sizes of wide-flange sections shown in Appendices B and C are taken
from the AISC LRFD manual of steel construction [54].
Section Designation H (m) B (m) T f (m) T w (m)
B14x14x171 0.350 0.350 0.025 0.025
B16x16x227 0.400 0.400 0.029 0.029
B18x18x282 0.450 0.450 0.032 0.032
B20x20x352 0.500 0.500 0.036 0.036
B22x22x430 0.550 0.550 0.040 0.040
B30x24x668 0.750 0.600 0.045 0.055

8/13/2019 Kri05
http://slidepdf.com/reader/full/kri05 92/177
74
Appendix B Existing Building Frame Elevations and Beam
and Column Sizes

8/13/2019 Kri05
http://slidepdf.com/reader/full/kri05 93/177
75
41 2 3 5
W36x135
W36x150
W36x150
W36x170
W36x170
W36x194
W36x194
W36x230
W36x230
W36x300
W36x230
W36x230
W36x230
W36x230
W36x230
W36x230
W36x300
W14x730
W14x730
W14x500
W14x500
W14x455
W14x455
W14x426
W14x426
W14x398
W14x398
W14x370
W14x370
W14x342
W14x342
W14x311
W14x311
W14x311
W14x730
W14x730
W14x500
W14x500
W14x455
W14x455
W14x426
W14x426
W14x398
W14x398
W14x370
W14x370
W14x342
W14x342
W14x311
W14x311
W14x311
W14x311
W14x730
W14x730
W14x500
W14x500
W14x455
W14x455
W14x426
W14x426
W14x398
W14x398
W14x370
W14x370
W14x342
W14x342
W14x311
W14x311
W14x311
W14x311
W14x159
W14x159
W14x132
W14x132
W14x120
W14x120
W14x99
W14x99
W14x90
W14x90
W14x74
W14x74
W14x61
W14x61
W14x43
W14x43
W14x43
W10x33
W12x65
W12x65
W14x730
W14x730
W8x24
W36x135
W36x150
W36x150
W36x170
W36x170
W36x194
W36x194
W36x230
W36x230
W36x300
W36x230
W36x230
W36x230
W36x230
W36x230
W36x230
W36x300
W30x99
6
9.25 m 9.55 m
Depth (in) x Width (in) x Weight (lb/ft)Section Designation:
LEGEND: W − Wide−flange sectionB − Box section
E−W FRAME (1) ALONG GRID A: ELEVATION
Depth (in) x Weight (lb/ft)
(30’−4") (31’−4")
Level 17F El. 65.63 m (215’−4")
4.78 m (15’−8")
Level 16F El. 61.67 m (202’−4")
Level 15F El. 57.71 m (189’−4")
Level ROOF El. 75.69 m (248’−4")
Level Penthouse El. 70.41 m (231’−0")
Level 14F El. 53.75 m (176’−4")
Level 13F El. 49.78 m (163’−4")
Level 12F El. 45.82 m (150’−4")
Level 11F El. 41.86 m (137’−4")
Level 10F El. 37.90 m (124’−4")
Level 9F El. 33.93 m (111’−4")
Level 8F El. 29.97 m (98’−4")
Level 7F El. 26.01 m (85’−4")
Level 6F El. 22.05 m (72’−4")
Level 5F El. 18.09 m (59’−4")
Level 4F El. 14.12 m (46’−4")
Level 3F El. 10.16 m (33’−4")
Level 2F El. 6.20 m (20’−4")
Level 1F El. 0.00 m (0’−0")
9.55 m 9.55 m 9.25 m
(30’−4")(31’−4") (31’−4")
6.20 m (20’−4")
3.96 m (13’−0")
3.96 m (13’−0")
3.96 m (13’−0")
3.96 m (13’−0")
3.96 m (13’−0")
3.96 m (13’−0")
3.96 m (13’−0")
3.96 m (13’−0")
3.96 m (13’−0")
3.96 m (13’−0")
3.96 m (13’−0")
3.96 m (13’−0")
3.96 m (13’−0")
3.96 m (13’−0")
3.96 m (13’−0")
5.28 m (17’−4")
Figure B.1: Frame 1 elevation: Existing building

8/13/2019 Kri05
http://slidepdf.com/reader/full/kri05 94/177
76
431 2 5
W14x730
W14x730
W14x500
W14x500
W14x455
W14x455
W14x426
W14x426
W14x398
W14x398
W14x370
W14x370
W14x342
W14x342
W14x311
W14x311
W14x311
W14x730
W14x730
W14x500
W14x500
W14x455
W14x455
W14x426
W14x426
W14x398
W14x398
W14x370
W14x370
W14x342
W14x342
W14x311
W14x311
W14x311
W14x283
W14x283
W14x283
W14x283
W14x193
W14x193
W14x176
W14x176
W14x143
W14x143
W14x120
W14x120
W14x68
W14x90
W14x90
W14x68
W14x61
W14x61
W14x283
W14x283
W14x283
W14x283
W14x193
W14x193
W14x176
W14x176
W14x143
W14x143
W14x120
W14x120
W14x68
W14x90
W14x90
W14x68
W14x61
W14x61
W14x283
W14x233
W14x233
W14x283
W14x193
W14x193
W14x159
W14x159
W14x132
W14x132
W14x109
W14x109
W14x68
W14x90
W14x90
W14x211
W14x211
W14x68
W14x283
W14x233
W14x233
W14x283
W14x193
W14x193
W14x159
W14x159
W14x132
W14x132
W14x109
W14x109
W14x68
W14x90
W14x90
W14x211
W14x211
W14x68
6
9.25 m 9.55 m
Depth (in) x Width (in) x Weight (lb/ft)Section Designation:
LEGEND: W − Wide−flange sectionB − Box section
E−W FRAME (2) ALONG GRID B: ELEVATION
Depth (in) x Weight (lb/ft)
(30’−4") (31’−4")
4.78 m (15’−8")
Level ROOF El. 75.69 m (248’−4")
Level Penthouse El. 70.41 m (231’−0")
Level 17F El. 65.63 m (215’−4")
Level 16F El. 61.67 m (202’−4")
Level 15F El. 57.71 m (189’−4")
Level 14F El. 53.75 m (176’−4")
Level 13F El. 49.78 m (163’−4")
Level 12F El. 45.82 m (150’−4")
Level 11F El. 41.86 m (137’−4")
Level 10F El. 37.90 m (124’−4")
Level 9F El. 33.93 m (111’−4")
Level 8F El. 29.97 m (98’−4")
Level 7F El. 26.01 m (85’−4")
Level 6F El. 22.05 m (72’−4")
Level 5F El. 18.09 m (59’−4")
Level 4F El. 14.12 m (46’−4")
Level 3F El. 10.16 m (33’−4")
Level 2F El. 6.20 m (20’−4")
Level 1F El. 0.00 m (0’−0")
6.20 m (20’−4")
3.96 m (13’−0")
9.55 m 9.55 m 9.25 m
(31’−4") (31’−4") (30’−4")
3.96 m (13’−0")
3.96 m (13’−0")
3.96 m (13’−0")
3.96 m (13’−0")
3.96 m (13’−0")
3.96 m (13’−0")
3.96 m (13’−0")
3.96 m (13’−0")
3.96 m (13’−0")
3.96 m (13’−0")
3.96 m (13’−0")
3.96 m (13’−0")
3.96 m (13’−0")
3.96 m (13’−0")
5.28 m (17’−4")
Figure B.2: Frame 2 elevation: Existing building

8/13/2019 Kri05
http://slidepdf.com/reader/full/kri05 95/177
77
42 51
W14x730
W14x730
W14x500
W14x500
W14x455
W14x455
W14x426
W14x426
W14x398
W14x398
W14x370
W14x370
W14x342
W14x342
W14x311
W14x311
W14x311
W14x233
W14x211
W14x211
W14x283
W14x283
W14x176
W14x132
W14x132
W14x176
W14x159
W14x159
W14x233
W14x99
W14x99
W14x61
W14x61
W14x82
W14x82
W14x730
W14x730
W14x500
W14x500
W14x455
W14x455
W14x426
W14x426
W14x398
W14x398
W14x370
W14x370
W14x342
W14x342
W14x311
W14x311
W14x311
3
W14x233
W14x211
W14x211
W14x283
W14x283
W14x193
W14x132
W14x132
W14x193
W14x159
W14x233
W14x68
W14x68
W14x90
W14x90
W14x159
W14x109
W14x109
W14x233
W14x211
W14x211
W14x283
W14x283
W14x193
W14x132
W14x132
W14x193
W14x159
W14x233
W14x68
W14x68
W14x90
W14x90
W14x159
W14x109
W14x109
W14x257
W14x233
W14x233
W14x311
W14x311
W14x211
W14x145
W14x145
W14x211
W14x176
W14x176
W14x257
W14x68
W14x68
W14x90
W14x90
W14x120
W14x120
6
9.25 m 9.55 m
Depth (in) x Width (in) x Weight (lb/ft)Section Designation:
LEGEND: W − Wide−flange sectionB − Box section
E−W FRAME (3) ALONG GRID C: ELEVATION
Depth (in) x Weight (lb/ft)
(31’−4")(30’−4")
4.78 m (15’−8")
Level 17F El. 65.63 m (215’−4")
Level Penthouse El. 70.41 m (231’−0")
Level ROOF El. 75.69 m (248’−4")
Level 16F El. 61.67 m (202’−4")
Level 15F El. 57.71 m (189’−4")
Level 14F El. 53.75 m (176’−4")
Level 13F El. 49.78 m (163’−4")
Level 12F El. 45.82 m (150’−4")
Level 11F El. 41.86 m (137’−4")
Level 10F El. 37.90 m (124’−4")
Level 9F El. 33.93 m (111’−4")
Level 8F El. 29.97 m (98’−4")
Level 7F El. 26.01 m (85’−4")
Level 6F El. 22.05 m (72’−4")
Level 5F El. 18.09 m (59’−4")
Level 4F El. 14.12 m (46’−4")
Level 3F El. 10.16 m (33’−4")
Level 2F El. 6.20 m (20’−4")
Level 1F El. 0.00 m (0’−0")
6.20 m (20’−4")
3.96 m (13’−0")
9.55 m 9.55 m
(31’−4") (31’−4")
9.25 m
(30’−4")
3.96 m (13’−0")
3.96 m (13’−0")
3.96 m (13’−0")
3.96 m (13’−0")
3.96 m (13’−0")
3.96 m (13’−0")
3.96 m (13’−0")
3.96 m (13’−0")
3.96 m (13’−0")
3.96 m (13’−0")
3.96 m (13’−0")
3.96 m (13’−0")
3.96 m (13’−0")
3.96 m (13’−0")
5.28 m (17’−4")
Figure B.3: Frame 3 elevation: Existing building

8/13/2019 Kri05
http://slidepdf.com/reader/full/kri05 96/177
78
431
W30x99
W33x141
W33x152
W33x152
W33x201
W33x201
W33x221
W33x221
W33x241
W33x241
W33x241
W33x241
W33x241
W33x241
W33x241
W33x241
W33x241
W36x300
2
W30x99
W33x141
W33x152
W33x152
W33x201
W33x201
W33x221
W33x221
W33x241
W33x241
W33x241
W33x241
W33x241
W33x241
W33x241
W33x241
W33x241
W36x300
W14x455
W14x730
W14x730
W14x500
W14x500
W14x455
W14x426
W14x426
W14x398
W14x398
W14x370
W14x370
W14x342
W14x342
W14x311
W14x311
W14x311
W14x311
W14x455
W14x730
W14x730
W14x500
W14x500
W14x455
W14x426
W14x426
W14x398
W14x398
W14x370
W14x370
W14x342
W14x342
W14x311
W14x311
W14x311
W14x311
W14x455
W14x730
W14x730
W14x500
W14x500
W14x455
W14x426
W14x426
W14x398
W14x398
W14x370
W14x370
W14x342
W14x342
W14x311
W14x311
W14x311
W14x311
W14x455
W14x500
W14x500
W14x455
W14x426
W14x426
W14x398
W14x398
W14x370
W14x370
W14x342
W14x342
W14x311
W14x311
W14x311
W14x500
W14x500
5
W14x211
W14x283
W14x283
W14x233
W14x233
W14x211
W14x176
W14x176
W14x159
W14x159
W14x132
W14x132
W14x99
W14x99
W14x82
W14x82
W14x61
W14x61
W14x455
W14x730
W14x730
W14x500
W14x500
W14x455
W14x426
W14x426
W14x398
W14x398
W14x370
W14x370
W14x342
W14x342
W14x311
W14x311
W14x311
6
9.25 m 9.55 m
Depth (in) x Width (in) x Weight (lb/ft)Section Designation:
LEGEND: W − Wide−flange sectionB − Box section
E−W FRAME (4) ALONG GRID D: ELEVATION
Depth (in) x Weight (lb/ft)
(30’−4") (31’−4")
4.78 m (15’−8")
Level Penthouse El. 70.41 m (231’−0")
Level 17F El. 65.63 m (215’−4")
Level 16F El. 61.67 m (202’−4")
Level 15F El. 57.71 m (189’−4")
Level 14F El. 53.75 m (176’−4")
Level 13F El. 49.78 m (163’−4")
Level 12F El. 45.82 m (150’−4")
Level 11F El. 41.86 m (137’−4")
Level 10F El. 37.90 m (124’−4")
Level 9F El. 33.93 m (111’−4")
Level 8F El. 29.97 m (98’−4")
Level 7F El. 26.01 m (85’−4")
Level 6F El. 22.05 m (72’−4")
Level 5F El. 18.09 m (59’−4")
Level 4F El. 14.12 m (46’−4")
Level 3F El. 10.16 m (33’−4")
Level 2F El. 6.20 m (20’−4")
Level 1F El. 0.00 m (0’−0")
6.20 m (20’−4")
3.96 m (13’−0")
9.55 m
(31’−4")
9.55 m
(31’−4")
9.25 m
(30’−4")
3.96 m (13’−0")
3.96 m (13’−0")
3.96 m (13’−0")
3.96 m (13’−0")
3.96 m (13’−0")
3.96 m (13’−0")
3.96 m (13’−0")
3.96 m (13’−0")
3.96 m (13’−0")
3.96 m (13’−0")
3.96 m (13’−0")
3.96 m (13’−0")
3.96 m (13’−0")
3.96 m (13’−0")
5.28 m (17’−4")
Level ROOF El. 75.69 m (248’−4")
Figure B.4: Frame 4 elevation: Existing building

8/13/2019 Kri05
http://slidepdf.com/reader/full/kri05 97/177
79
41 2 3 5
W14x43
W14x43
W14x43
W14x61
W14x61
W14x74
W14x74
W14x90
W14x90
W14x99
W14x99
W14x120
W14x120
W14x132
W14x132
W14x211
W14x211
W14x43
W14x43
W14x43
W14x61
W14x61
W14x74
W14x74
W14x90
W14x90
W14x99
W14x99
W14x120
W14x120
W14x132
W14x132
W14x211
W14x211
W14x48
W14x53
W14x53
W14x68
W14x68
W14x82
W14x82
W14x90
W14x90
W14x132
W14x132
W14x145
W14x145
W14x233
W14x233
W14x48
W14x109
W14x109
W14x48
W14x53
W14x53
W14x68
W14x68
W14x82
W14x82
W14x90
W14x90
W14x132
W14x132
W14x145
W14x145
W14x233
W14x233
W14x48
W14x109
W14x109
6
9.25 m 9.55 m
Depth (in) x Width (in) x Weight (lb/ft)Section Designation:
LEGEND: W − Wide−flange sectionB − Box section
Depth (in) x Weight (lb/ft)
W14x730
W14x730
W12x65
W12x65
W8x24
W10x33
E−W FRAME (5) ALONG GRID E: ELEVATION
(31’−4")(30’−4")
4.78 m (15’−8")
Level ROOF El. 75.69 m (248’−4")
Level Penthouse El. 70.41 m (231’−0")
Level 17F El. 65.63 m (215’−4")
Level 16F El. 61.67 m (202’−4")
Level 15F El. 57.71 m (189’−4")
Level 14F El. 53.75 m (176’−4")
Level 13F El. 49.78 m (163’−4")
Level 12F El. 45.82 m (150’−4")
Level 11F El. 41.86 m (137’−4")
Level 10F El. 37.90 m (124’−4")
Level 9F El. 33.93 m (111’−4")
Level 8F El. 29.97 m (98’−4")
Level 7F El. 26.01 m (85’−4")
Level 6F El. 22.05 m (72’−4")
Level 5F El. 18.09 m (59’−4")
Level 4F El. 14.12 m (46’−4")
Level 3F El. 10.16 m (33’−4")
Level 2F El. 6.20 m (20’−4")
3.96 m (13’−0")
6.20 m (20’−4")
Level 1F El. 0.00 m (0’−0")
9.55 m 9.55 m
(31’−4") (31’−4")
9.25 m
(30’−4")
3.96 m (13’−0")
3.96 m (13’−0")
3.96 m (13’−0")
3.96 m (13’−0")
3.96 m (13’−0")
3.96 m (13’−0")
3.96 m (13’−0")
3.96 m (13’−0")
3.96 m (13’−0")
3.96 m (13’−0")
3.96 m (13’−0")
3.96 m (13’−0")
3.96 m (13’−0")
5.28 m (17’−4")
3.96 m (13’−0")
Figure B.5: Frame 5 elevation: Existing building

8/13/2019 Kri05
http://slidepdf.com/reader/full/kri05 98/177
80
E
Depth (in) x Width (in) x Weight (lb/ft)Section Designation:
LEGEND: W − Wide−flange sectionB − Box section
Depth (in) x Weight (lb/ft)B C DA
W36x300
W36x300
W36x230
W36x230
W36x230
W36x230
W36x230
W36x230
W36x230
W36x230
W36x194
W36x194
W36x170
W36x170
W36x150
W36x150
W36x135
W36x300
W36x300
W36x230
W36x230
W36x230
W36x230
W36x230
W36x230
W36x230
W36x230
W36x194
W36x194
W36x170
W36x170
W36x150
W36x150
W36x135
W14x730
W14x730
W14x500
W14x500
W14x455
W14x455
W14x426
W14x426
W14x398
W14x398
W14x370
W14x370
W14x342
W14x342
W14x311
W14x311
W14x311
W14x730
W14x730
W14x500
W14x500
W14x455
W14x455
W14x426
W14x426
W14x398
W14x398
W14x370
W14x370
W14x342
W14x342
W14x311
W14x311
W14x311
W14x730
W14x730
W14x500
W14x500
W14x455
W14x455
W14x426
W14x426
W14x398
W14x398
W14x370
W14x370
W14x342
W14x342
W14x311
W14x311
W14x311
W10x33
W12x65
W12x65
N−S FRAME (6) ALONG GRID 1: ELEVATION
8.53 m9.25 m
W8x24
W36x300
W14x730
(30’−4") (28’−0")
8.53 m
(28’−0")
9.25 m
(30’−4")
4.78 m (15’−8")
Level 17F El. 65.63 m (215’−4")
Level Penthouse El. 70.41 m (231’−0")
Level ROOF El. 75.69 m (248’−4")
Level 16F El. 61.67 m (202’−4")
Level 15F El. 57.71 m (189’−4")
Level 14F El. 53.75 m (176’−4")
Level 13F El. 49.78 m (163’−4")
Level 12F El. 45.82 m (150’−4")
Level 11F El. 41.86 m (137’−4")
Level 10F El. 37.90 m (124’−4")
Level 9F El. 33.93 m (111’−4")
Level 8F El. 29.97 m (98’−4")
Level 7F El. 26.01 m (85’−4")
Level 6F El. 22.05 m (72’−4")
Level 5F El. 18.09 m (59’−4")
Level 4F El. 14.12 m (46’−4")
Level 3F El. 10.16 m (33’−4")
Level 2F El. 6.20 m (20’−4")
3.96 m (13’−0")
6.20 m (20’−4")
Level 1F El. 0.00 m (0’−0")
3.96 m (13’−0")
3.96 m (13’−0")
3.96 m (13’−0")
3.96 m (13’−0")
3.96 m (13’−0")
3.96 m (13’−0")
3.96 m (13’−0")
3.96 m (13’−0")
3.96 m (13’−0")
3.96 m (13’−0")
3.96 m (13’−0")
3.96 m (13’−0")
3.96 m (13’−0")
3.96 m (13’−0")
5.28 m (17’−4")
Figure B.6: Frame 6 elevation: Existing building

8/13/2019 Kri05
http://slidepdf.com/reader/full/kri05 99/177
81
Appendix C Redesigned Building Frame Elevations and
Beam and Column Sizes

8/13/2019 Kri05
http://slidepdf.com/reader/full/kri05 100/177
82
41 2 3
W30x148
W30x148
W30x148
W30x148
W30x148
W30x173
W30x173
W30x173
W30x173
W30x173
W30x173
W30x191
W30x191
W30x191
W30x191
W30x191
W30x191
W30x148
W30x148
W30x148
W30x148
W30x148
W30x173
W30x173
W30x173
W30x173
W30x173
W30x173
W30x191
W30x191
W30x191
W30x191
W30x191
W14x109
W14x109
W14x68
W14x109
W14x109
W14x68
5 6
9.25 m 9.55 m
Depth (in) x Width (in) x Weight (lb/ft)Section Designation:
LEGEND: W − Wide−flange sectionB − Box section
E−W FRAME (1) ALONG GRID A: ELEVATION
Depth (in) x Weight (lb/ft)
B14x14x171
B14x14x171
B14x14x171
B16x16x227
B16x16x227
B16x16x227
B16x16x227
B18x18x282
B18x18x282
B18x18x282
B18x18x282
B20x20x352
B20x20x352
B20x20x352
B20x20x352
B22x22x430
B22x22x430 B30x22x644
B30x22x644
W27x281
W27x281
W27x281
W27x281
W27x258
W27x258
W27x258
W27x258
W27x258
W27x258
W24x229
W24x229
W24x207
W24x207
W24x207
W24x207 W24x207
W24x207
W24x207
W24x207
W24x229
W24x229
W27x258
W27x258
W27x258
W27x258
W27x258
W27x258
W27x281
W27x281
W27x281
W27x281
W30x148
W30x148
W30x148
W30x148
W30x148
W30x148
W30x173
W30x173
W30x173
W30x173
W30x173
W30x173
W30x191
W30x191
W30x191
W30x191
W30x191
B30x22x644
B14x14x171
B14x14x171
B14x14x171
B16x16x227
B16x16x227
B16x16x227
B16x16x227
B18x18x282
B18x18x282
B18x18x282
B18x18x282
B20x20x352
B20x20x352
B20x20x352
B20x20x352
B22x22x430
B30x22x644 B22x22x430
W30x191 W30x191
(30’−4") (31’−4") (31’−4")
9.55 m
(31’−4")
9.55 m
(30’−4")
9.25 m
Level Penthouse El. 70.41 m (231’−0")
Level 17F El. 65.63 m (215’−4")
Level 16F El. 61.67 m (202’−4")
Level 15F El. 57.71 m (189’−4")
Level 14F El. 53.75 m (176’−4")
Level 13F El. 49.78 m (163’−4")
Level 12F El. 45.82 m (150’−4")
Level 11F El. 41.86 m (137’−4")
Level 10F El. 37.90 m (124’−4")
Level 9F El. 33.93 m (111’−4")
Level 8F El. 29.97 m (98’−4")
Level 7F El. 26.01 m (85’−4")
Level 6F El. 22.05 m (72’−4")
Level 5F El. 18.09 m (59’−4")
Level 4F El. 14.12 m (46’−4")
Level 3F El. 10.16 m (33’−4")
Level 2F El. 6.20 m (20’−4")
Level 1F El. 0.00 m (0’−0")
3.96 m (13’−0")
3.96 m (13’−0")
6.20 m (20’−4")
3.96 m (13’−0")
3.96 m (13’−0")
3.96 m (13’−0")
3.96 m (13’−0")
3.96 m (13’−0")
3.96 m (13’−0")
3.96 m (13’−0")
3.96 m (13’−0")
3.96 m (13’−0")
3.96 m (13’−0")
3.96 m (13’−0")
3.96 m (13’−0")
3.96 m (13’−0")
5.28 m (17’−4")
4.78 m (15’−8")
Level ROOF El. 75.69 m (248’−4")
13.0 mm
9.5 mm
13.0 mm
13.0 mm
13.0 mm
13.0 mm
9.5 mm
9.5 mm
6.3 mm
6.3 mm
3.1 mm 3.1 mm
6.3 mm
6.3 mm
9.5 mm
9.5 mm
13.0 mm
13.0 mm
13.0 mm
13.0 mm
13.0 mm
9.5 mm
Doubler Plate
Thickness
Figure C.1: Frame 1 elevation: Redesigned building

8/13/2019 Kri05
http://slidepdf.com/reader/full/kri05 101/177
83
43
W14x283
W14x283
W14x233
W14x233
W14x176
W14x176
W14x145
W14x145
W14x120
W14x120
W14x109
W14x109
W14x455
W14x455
W14x68
W14x68
W14x68
W14x68
W14x283
W14x283
W14x233
W14x233
W14x176
W14x176
W14x145
W14x145
W14x120
W14x120
W14x109
W14x109
W14x455
W14x455
W14x68
W14x68
W14x68
W14x68
1 2 5
W24x207
W24x207
W24x207
W24x229
W24x229
W24x229
W24x229
W27x258
W27x258
W27x258
W27x258
W27x281
W27x281
W27x307
W27x307
B30x24x668
B30x24x668
W24x207
B14x14x171
B14x14x171
B14x14x171
B16x16x227
B16x16x227
B16x16x227
B16x16x227
B18x18x282
B18x18x282
B18x18x282
B18x18x282
B20x20x352
B20x20x352
B20x20x352
B20x20x352
B22x22x430
B22x22x430
B14x14x171
B14x14x171
B14x14x171
B14x14x171
B16x16x227
B16x16x227
B16x16x227
B16x16x227
B18x18x282
B18x18x282
B18x18x282
B18x18x282
B20x20x352
B20x20x352
B20x20x352
B20x20x352
B22x22x430
B22x22x430
W27x307
W24x207
W24x207
W24x207
W24x229
W24x229
W24x229
W24x229
W27x258
W27x258
W27x258
W27x258
W27x281
W27x281
W27x307
B30x24x668
B30x24x668
6
Depth (in) x Width (in) x Weight (lb/ft)Section Designation:
LEGEND: W − Wide−flange sectionB − Box section
E−W FRAME (2) ALONG GRID B: ELEVATION
Depth (in) x Weight (lb/ft)
W30x191
W30x191
W30x191
W30x191
W30x191
W30x173
W30x173
W30x173
W30x173
W30x148
W30x148
W30x124
W30x124
W30x124
W30x191
W30x148
W30x148
9.25 m
(30’−4")
9.55 m
(31’−4") (31’−4") (31’−4") (30’−4")
9.55 m 9.55 m 9.25 m
Level Penthouse El. 70.41 m (231’−0")
Level 17F El. 65.63 m (215’−4")
Level 16F El. 61.67 m (202’−4")
Level 15F El. 57.71 m (189’−4")
Level 14F El. 53.75 m (176’−4")
Level 13F El. 49.78 m (163’−4")
Level 12F El. 45.82 m (150’−4")
Level 11F El. 41.86 m (137’−4")
Level 10F El. 37.90 m (124’−4")
Level 9F El. 33.93 m (111’−4")
Level 8F El. 29.97 m (98’−4")
Level 7F El. 26.01 m (85’−4")
Level 6F El. 22.05 m (72’−4")
Level 5F El. 18.09 m (59’−4")
Level 4F El. 14.12 m (46’−4")
Level 3F El. 10.16 m (33’−4")
Level 2F El. 6.20 m (20’−4")
Level 1F El. 0.00 m (0’−0")
Level ROOF El. 75.69 m (248’−4")
6.20 m (20’−4")
3.96 m (13’−0")
3.96 m (13’−0")
3.96 m (13’−0")
3.96 m (13’−0")
3.96 m (13’−0")
3.96 m (13’−0")
3.96 m (13’−0")
3.96 m (13’−0")
3.96 m (13’−0")
3.96 m (13’−0")
3.96 m (13’−0")
3.96 m (13’−0")
3.96 m (13’−0")
3.96 m (13’−0")
4.78 m (15’−8")
3.96 m (13’−0")
5.28 m (17’−4")
Figure C.2: Frame 2 elevation: Redesigned building

8/13/2019 Kri05
http://slidepdf.com/reader/full/kri05 102/177
84
43
W14x283
W14x283
W14x233
W14x233
W14x176
W14x176
W14x145
W14x145
W14x120
W14x120
W14x109
W14x109
W14x455
W14x455
W14x68
W14x68
W14x68
W14x68
W14x283
W14x283
W14x233
W14x233
W14x176
W14x176
W14x145
W14x145
W14x120
W14x120
W14x109
W14x109
W14x455
W14x455
W14x68
W14x68
W14x68
W14x68
1 2 5
B30x24x668
B30x24x668
W27x258
W27x258
W24x207
W24x207
W24x207
W24x229
W24x229
W27x258
W27x258
W27x258
W27x258
W27x281
W27x281
W27x307
W27x307 W14x233
W14x233
W14x233
W14x233
W14x455
W14x455
W14x193
W14x176
W14x176
W14x176
W14x176
W14x176
W14x176
W14x176
W14x176
W14x193
W14x193
W14x193
W14x233
W14x233
W14x233
W14x233
W14x455
W14x455
W14x193
W14x176
W14x176
W14x176
W14x176
W14x176
W14x176
W14x176
W14x176
W14x193
W14x193
W14x193
W27x307
W24x207
W24x207
W24x207
W24x229
W24x229
W27x258
W27x258
W27x258
W27x258
W27x281
W27x281
W27x307
B30x24x668
B30x24x668
W27x258
W27x258
6
9.25 m 9.55 m
Depth (in) x Width (in) x Weight (lb/ft)Section Designation:
LEGEND: W − Wide−flange sectionB − Box section
E−W FRAME (3) ALONG GRID C: ELEVATION
Depth (in) x Weight (lb/ft)
(30’−4") (31’−4")
9.55 m 9.55 m
(31’−4")(31’−4")
9.25 m
(30’−4")Level ROOF El. 75.69 m (248’−4")
Level Penthouse El. 70.41 m (231’−0")
Level 17F El. 65.63 m (215’−4")
Level 16F El. 61.67 m (202’−4")
Level 15F El. 57.71 m (189’−4")
Level 14F El. 53.75 m (176’−4")
Level 13F El. 49.78 m (163’−4")
Level 12F El. 45.82 m (150’−4")
Level 11F El. 41.86 m (137’−4")
Level 10F El. 37.90 m (124’−4")
Level 9F El. 33.93 m (111’−4")
Level 8F El. 29.97 m (98’−4")
Level 7F El. 26.01 m (85’−4")
Level 6F El. 22.05 m (72’−4")
Level 5F El. 18.09 m (59’−4")
Level 4F El. 14.12 m (46’−4")
Level 3F El. 10.16 m (33’−4")
Level 2F El. 6.20 m (20’−4")
Level 1F El. 0.00 m (0’−0")
6.20 m (20’−4")
3.96 m (13’−0")
3.96 m (13’−0")
3.96 m (13’−0")
3.96 m (13’−0")
3.96 m (13’−0")
3.96 m (13’−0")
3.96 m (13’−0")
3.96 m (13’−0")
3.96 m (13’−0")
3.96 m (13’−0")
3.96 m (13’−0")
3.96 m (13’−0")
3.96 m (13’−0")
3.96 m (13’−0")
3.96 m (13’−0")
4.78 m (15’−8")
5.28 m (17’−4")
Figure C.3: Frame 3 elevation: Redesigned building

8/13/2019 Kri05
http://slidepdf.com/reader/full/kri05 103/177
85
4
B14x14x171
B14x14x171
B14x14x171
B16x16x227
B16x16x227
B16x16x227
B16x16x227
B18x18x282
B18x18x282
B18x18x282
B18x18x282
B20x20x352
B20x20x352
B20x20x352
B20x20x352
B22x22x430
B22x22x430
3
W14x283
W14x283
W14x233
W14x233
W14x176
W14x176
W14x145
W14x145
W14x120
W14x120
W14x109
W14x109
W14x455
W14x455
W14x68
W14x68
W14x68
W14x68
W14x283
W14x283
W14x233
W14x233
W14x176
W14x176
W14x145
W14x145
W14x120
W14x120
W14x109
W14x109
W14x455
W14x455
W14x68
W14x68
W14x68
W14x68
1 2
B14x14x171
B14x14x171
B14x14x171
B16x16x227
B16x16x227
B16x16x227
B16x16x227
B18x18x282
B18x18x282
B18x18x282
B18x18x282
B20x20x352
B20x20x352
B20x20x352
B20x20x352
B22x22x430
B22x22x430
B14x14x171
W27x307
W24x207
W24x207
W24x207
W24x229
W24x229
W24x229
W24x229
W27x258
W27x258
W27x258
W27x258
W27x281
W27x281
W27x307
B30x24x668
B30x24x668
65
Depth (in) x Width (in) x Weight (lb/ft)Section Designation:
LEGEND: W − Wide−flange sectionB − Box section
E−W FRAME (4) ALONG GRID D: ELEVATION
Depth (in) x Weight (lb/ft)
W30x191
W30x191
W30x191
W30x191
W30x191
W30x173
W30x173
W30x173
W30x173
W30x148
W30x148
W30x124
W30x124
W30x124
W30x148
W30x148
W30x191
(30’−4") (31’−4")
9.25 m 9.55 m 9.55 m
(31’−4")
9.55 m
(31’−4") (30’−4")
9.25 m
5.28 m (17’−4")
4.78 m (15’−8")
3.96 m (13’−0")
W24x207
B30x24x668
B30x24x668
W24x207
W24x207
W24x207
W24x229
W24x229
W24x229
W24x229
W27x258
W27x258
W27x258
W27x258
W27x307
W27x307
W27x281
W27x281
3.96 m (13’−0")
3.96 m (13’−0")
3.96 m (13’−0")
3.96 m (13’−0")
3.96 m (13’−0")
3.96 m (13’−0")
3.96 m (13’−0")
3.96 m (13’−0")
3.96 m (13’−0")
3.96 m (13’−0")
3.96 m (13’−0")
3.96 m (13’−0")
3.96 m (13’−0")
3.96 m (13’−0")
6.20 m (20’−4")
Level 1F El. 0.00 m (0’−0")
Level Penthouse El. 70.41 m (231’−0")
Level 17F El. 65.63 m (215’−4")
Level 16F El. 61.67 m (202’−4")
Level 15F El. 57.71 m (189’−4")
Level 14F El. 53.75 m (176’−4")
Level 13F El. 49.78 m (163’−4")
Level 12F El. 45.82 m (150’−4")
Level 11F El. 41.86 m (137’−4")
Level 10F El. 37.90 m (124’−4")
Level 9F El. 33.93 m (111’−4")
Level 8F El. 29.97 m (98’−4")
Level 7F El. 26.01 m (85’−4")
Level 6F El. 22.05 m (72’−4")
Level 5F El. 18.09 m (59’−4")
Level 4F El. 14.12 m (46’−4")
Level 3F El. 10.16 m (33’−4")
Level 2F El. 6.20 m (20’−4")
Level ROOF El. 75.69 m (248’−4")
Figure C.4: Frame 4 elevation: Redesigned building

8/13/2019 Kri05
http://slidepdf.com/reader/full/kri05 104/177
86
4
W30x148
W30x148
W30x148
W30x148
W30x148
W30x148
W30x173
W30x173
W30x173
W30x173
W30x173
W30x173
W30x191
W30x191
W30x191
W30x191
W30x191
1 2 3 5
W30x148
W30x148
W30x148
W30x148
W30x148
W30x173
W30x173
W30x173
W30x173
W30x173
W30x173
W30x191
W30x191
W30x191
W30x191
W30x191
W30x191
W30x148
W30x148
W30x148
W30x148
W30x148
W30x173
W30x173
W30x173
W30x173
W30x173
W30x173
W30x191
W30x191
W30x191
W30x191
W30x191
B14x14x171
B14x14x171
B14x14x171
B16x16x227
B16x16x227
B16x16x227
B16x16x227
B18x18x282
B18x18x282
B18x18x282
B18x18x282
B20x20x352
B20x20x352
B20x20x352
B20x20x352
B22x22x430
W14x109
W14x109
W14x68
W14x109
W14x109
W14x68
6
13.0 mm
9.5 mm
13.0 mm
13.0 mm
13.0 mm
13.0 mm
9.5 mm
9.5 mm
6.3 mm
6.3 mm
3.1 mm 3.1 mm
6.3 mm
6.3 mm
9.5 mm
9.5 mm
13.0 mm
13.0 mm
13.0 mm
13.0 mm
13.0 mm
9.5 mm
Doubler Plate
Thickness
9.25 m 9.55 m
Depth (in) x Width (in) x Weight (lb/ft)Section Designation:
LEGEND: W − Wide−flange sectionB − Box section
E−W FRAME (5) ALONG GRID E: ELEVATION
Depth (in) x Weight (lb/ft)
B14x14x171
B14x14x171
B14x14x171
B16x16x227
B16x16x227
B16x16x227
B16x16x227
B18x18x282
B18x18x282
B18x18x282
B18x18x282
B20x20x352
B20x20x352
B20x20x352
B20x20x352
B22x22x430
B22x22x430 B30x22x644
B30x22x644
B30x22x644
W27x281
W27x281
W27x281
W27x281
W27x258
W27x258
W27x258
W27x258
W27x258
W27x258
W24x229
W24x229
W24x207
W24x207
W24x207
W24x207 W24x207
W24x207
W24x207
W24x207
W24x229
W24x229
W27x258
W27x258
W27x258
W27x258
W27x258
W27x258
W27x281
W27x281
W27x281
W27x281
(30’−4") (31’−4")
9.55 m
(31’−4")
9.55 m
(31’−4")
9.25 m
(30’−4")Level ROOF El. 75.69 m (248’−4")
Level Penthouse El. 70.41 m (231’−0")
Level 17F El. 65.63 m (215’−4")
Level 16F El. 61.67 m (202’−4")
Level 15F El. 57.71 m (189’−4")
Level 14F El. 53.75 m (176’−4")
Level 13F El. 49.78 m (163’−4")
Level 12F El. 45.82 m (150’−4")
Level 11F El. 41.86 m (137’−4")
Level 10F El. 37.90 m (124’−4")
Level 9F El. 33.93 m (111’−4")
Level 8F El. 29.97 m (98’−4")
Level 7F El. 26.01 m (85’−4")
Level 6F El. 22.05 m (72’−4")
Level 5F El. 18.09 m (59’−4")
Level 4F El. 14.12 m (46’−4")
Level 3F El. 10.16 m (33’−4")
Level 2F El. 6.20 m (20’−4")
Level 1F El. 0.00 m (0’−0")
6.20 m (20’−4")
3.96 m (13’−0")
4.78 m (15’−8")
3.96 m (13’−0")
3.96 m (13’−0")
3.96 m (13’−0")
3.96 m (13’−0")
3.96 m (13’−0")
3.96 m (13’−0")
3.96 m (13’−0")
3.96 m (13’−0")
3.96 m (13’−0")
3.96 m (13’−0")
3.96 m (13’−0")
3.96 m (13’−0")
3.96 m (13’−0")
3.96 m (13’−0")
5.28 m (17’−4")
Figure C.5: Frame 5 elevation: Redesigned building

8/13/2019 Kri05
http://slidepdf.com/reader/full/kri05 105/177

8/13/2019 Kri05
http://slidepdf.com/reader/full/kri05 106/177
88
E
Depth (in) x Width (in) x Weight (lb/ft)Section Designation:
LEGEND: W − Wide−flange sectionB − Box section
Depth (in) x Weight (lb/ft)B C DA
W30x124
W30x148
W30x148
W30x173
W30x173
W30x173
W30x173
W30x191
W30x191
W30x191
W30x191
W30x191
W30x191
W30x124
W30x124
W30x148
W30x148
W30x124
W30x148
W30x148
W30x173
W30x173
W30x173
W30x173
W30x191
W30x191
W30x191
W30x191
W30x191
W30x191
W30x124
W30x124
W30x148
W30x148
B14x14x171
B14x14x171
B14x14x171
B16x16x227
B16x16x227
B16x16x227
B16x16x227
B18x18x282
B18x18x282
B18x18x282
B18x18x282
B20x20x352
B20x20x352
B20x20x352
B20x20x352
B22x22x430
B22x22x430
B14x14x171
B14x14x171
B14x14x171
B16x16x227
B16x16x227
B16x16x227
B16x16x227
B18x18x282
B18x18x282
B18x18x282
B18x18x282
B20x20x352
B20x20x352
B20x20x352
B20x20x352
B22x22x430
B22x22x430
B14x14x171
B14x14x171
B14x14x171
B14x14x171
B16x16x227
B16x16x227
B16x16x227
B16x16x227
B18x18x282
B18x18x282
B18x18x282
B18x18x282
B20x20x352
B20x20x352
B20x20x352
B20x20x352
B22x22x430
B22x22x430
N−S FRAME (7) ALONG GRID 2: ELEVATION
8.53 m9.25 m
B30x24x668
W27x307
W27x307
W27x281
W27x281
W27x258
W27x258
W27x258
W27x258
W27x229
W27x229
W24x229
W24x229
W24x207
W24x207
W24x207
B30x24x668
W14x233
W30x124
W30x124
W24x207
W14x455
W14x455
W14x233
W14x233
W14x233
W14x193
W14x193
W14x193
W14x193
W14x176
W14x176
W14x176
W14x176
W14x176
W14x176
W14x176
W14x176
4.78 m (15’−8")
3.96 m (13’−0")
6.20 m (20’−4")
Level 1F El. 0.00 m (0’−0")
Level 2F El. 6.20 m (20’−4")
Level 3F El. 10.16 m (33’−4")
Level 4F El. 14.12 m (46’−4")
Level 5F El. 18.09 m (59’−4")
Level 6F El. 22.05 m (72’−4")
Level 7F El. 26.01 m (85’−4")
Level 8F El. 29.97 m (98’−4")
Level 9F El. 33.93 m (111’−4")
Level 10F El. 37.90 m (124’−4")
Level 11F El. 41.86 m (137’−4")
Level 12F El. 45.82 m (150’−4")
Level 13F El. 49.78 m (163’−4")
Level 14F El. 53.75 m (176’−4")
Level 15F El. 57.71 m (189’−4")
Level 16F El. 61.67 m (202’−4")
Level 17F El. 65.63 m (215’−4")
Level Penthouse El. 70.41 m (231’−0")
Level ROOF El. 75.69 m (248’−4")(30’−4") (28’−0")
8.53 m 9.25 m
(30’−4")(28’−0")
3.96 m (13’−0")
3.96 m (13’−0")
3.96 m (13’−0")
3.96 m (13’−0")
3.96 m (13’−0")
3.96 m (13’−0")
3.96 m (13’−0")
3.96 m (13’−0")
3.96 m (13’−0")
3.96 m (13’−0")
3.96 m (13’−0")
3.96 m (13’−0")
3.96 m (13’−0")
3.96 m (13’−0")
5.28 m (17’−4")
Figure C.7: Frame 7 elevation: Redesigned building

8/13/2019 Kri05
http://slidepdf.com/reader/full/kri05 107/177
89
E
Depth (in) x Width (in) x Weight (lb/ft)Section Designation:
LEGEND: W − Wide−flange sectionB − Box section
Depth (in) x Weight (lb/ft)B C DA
W30x124
W30x148
W30x148
W30x173
W30x173
W30x173
W30x173
W30x191
W30x191
W30x191
W30x191
W30x191
W30x191
W30x124
W30x124
W30x148
W30x148
B14x14x171
B14x14x171
B14x14x171
B16x16x227
B16x16x227
B16x16x227
B16x16x227
B18x18x282
B18x18x282
B18x18x282
B18x18x282
B20x20x352
B20x20x352
B20x20x352
B20x20x352
B22x22x430
B22x22x430
B14x14x171
B14x14x171
B14x14x171
B16x16x227
B16x16x227
B16x16x227
B16x16x227
B18x18x282
B18x18x282
B18x18x282
B18x18x282
B20x20x352
B20x20x352
B20x20x352
B20x20x352
B22x22x430
B22x22x430
B14x14x171
W14x233
W14x455
W14x455
W14x233
W14x233
W14x233
W14x193
W14x193
W14x193
W14x193
W14x176
W14x176
W14x176
W14x176
W14x176
W14x176
W14x176
W14x176
W30x124
W30x148
W30x148
W30x173
W30x173
W30x173
W30x173
W30x191
W30x191
W30x191
W30x191
W30x191
W30x124
W30x124
W30x148
W30x148
B14x14x171
B14x14x171
B14x14x171
B16x16x227
B16x16x227
B16x16x227
B16x16x227
B18x18x282
B18x18x282
B18x18x282
B18x18x282
B20x20x352
B20x20x352
B20x20x352
B20x20x352
B22x22x430
W27x307
W27x307
W27x281
W27x281
W27x258
W27x258
W27x258
W27x258
W27x229
W27x229
W24x229
W24x229
W24x207
W24x207
W24x207
W24x207
B30x24x668
N−S FRAME (8) ALONG GRID 5: ELEVATION
8.53 m9.25 m
W30x124
W30x124
6.20 m (20’−4")
3.96 m (13’−0")
4.78 m (15’−8")
Level Penthouse El. 70.41 m (231’−0")
Level 17F El. 65.63 m (215’−4")
Level ROOF El. 75.69 m (248’−4")
Level 16F El. 61.67 m (202’−4")
Level 15F El. 57.71 m (189’−4")
Level 14F El. 53.75 m (176’−4")
Level 13F El. 49.78 m (163’−4")
Level 12F El. 45.82 m (150’−4")
Level 11F El. 41.86 m (137’−4")
Level 10F El. 37.90 m (124’−4")
Level 9F El. 33.93 m (111’−4")
Level 8F El. 29.97 m (98’−4")
Level 7F El. 26.01 m (85’−4")
Level 6F El. 22.05 m (72’−4")
Level 5F El. 18.09 m (59’−4")
Level 4F El. 14.12 m (46’−4")
Level 3F El. 10.16 m (33’−4")
Level 2F El. 6.20 m (20’−4")
Level 1F El. 0.00 m (0’−0")
(30’−4") (28’−0")
8.53 m
(28’−0")
9.25 m
(30’−4")
3.96 m (13’−0")
3.96 m (13’−0")
3.96 m (13’−0")
3.96 m (13’−0")
3.96 m (13’−0")
3.96 m (13’−0")
3.96 m (13’−0")
3.96 m (13’−0")
3.96 m (13’−0")
3.96 m (13’−0")
3.96 m (13’−0")
3.96 m (13’−0")
3.96 m (13’−0")
3.96 m (13’−0")
5.28 m (17’−4")
Figure C.8: Frame 8 elevation: Redesigned building

8/13/2019 Kri05
http://slidepdf.com/reader/full/kri05 108/177
90
E
Level 3F El. 33’−4"
Level 2F El. 20’−4"
13’−0"
20’−4"
Level 1F El. 0’−0"
Level Penthouse El. 231’−0"
Level 17F El. 215’−4"
Level 16F El. 202’−4"
Level 15F El. 189’−4"
Level 14F El. 176’−4"
Level 13F El. 163’−4"
Level 12F El. 150’−4"
Level 11F El. 137’−4"
Level 10F El. 124’−4"
Level 9F El. 111’−4"
Level 8F El. 98’−4"
Level 7F El. 85’−4"
Level 6F El. 72’−4"
Level 5F El. 59’4"
Level 4F El. 46’−4"
13’−0"
13’−0"
13’−0"
13’−0"
13’−0"
13’−0"
13’−0"
13’−0"
13’−0"
13’−0"
13’−0"
13’−0"
13’−0"
13’−0"
13’−0"
15’−8"
Level ROOF El. 248’−4"
Depth (in) x Width (in) x Weight (lb/ft)Section Designation:
LEGEND: W − Wide−flange sectionB − Box section
Depth (in) x Weight (lb/ft)
W14x109
W14x109
W14x68
W14x109
W14x109
W14x68
B C DA
W30x124
W30x132
W30x132
W30x148
W30x148
W30x173
W30x173
W30x173
W30x173
W30x173
W30x173
W30x191
W30x191
W30x191
W30x191
W30x191
W30x191
W30x124
W30x132
W30x132
W30x148
W30x148
W30x173
W30x173
W30x173
W30x173
W30x173
W30x173
W30x191
W30x191
W30x191
W30x191
W30x191
W30x191
B30x24x668
W27x307
W27x307
W27x281
W27x281
W27x258
W27x258
W27x258
W27x258
W27x229
W27x229
W24x229
W24x229
W24x207
W24x207
W24x207
B30x24x668
B14x14x171
B14x14x171
B14x14x171
B16x16x227
B16x16x227
B16x16x227
B16x16x227
B18x18x282
B18x18x282
B18x18x282
B18x18x282
B20x20x352
B20x20x352
B20x20x352
B20x20x352
B22x22x430
B22x22x430
Doubler Plate
Thickness
N−S FRAME (9) ALONG GRID 6: ELEVATION
30’−4"28’−0"28’−0"30’−4"
B30x24x668
W27x281
W27x281
W27x258
W27x258
W27x258
W27x258
W27x258
W27x258
W24x229
W24x229
W24x207
W24x207
W24x207
B30x24x668
W27x307
W27x307
13.0 mm
13.0 mm
13.0 mm
13.0 mm
13.0 mm
13.0 mm
9.5 mm
9.5 mm
6.3 mm
6.3 mm
3.1 mm
Figure C.9: Frame 9 elevation: Redesigned building

8/13/2019 Kri05
http://slidepdf.com/reader/full/kri05 109/177
91
Appendix D Scenario 1 (North-to-South Rupture):
Performance of Existing and Redesigned Building Models
Based on Plastic Rotations in Beams and Panel Zones
Plotted in Figures D.1 through D.3 are the percentage of connections 1 in the existing building where plastic rotations
exceed the IO, LS, and CP performance levels, respectively, when subjected to ground motion from scenario 1 (north-
to-south rupture) earthquake on the San Andreas fault. Corresponding results for the redesigned building are shown in
Figures D.4 through D.6.
-119˚ -118.75˚ -118.5˚ -118.25˚ -118˚ -117.75˚
33.75˚
34˚
34.25˚
4
4
4
8
8
8
8
8
1 2
12
1 2
1 2
1 2
16
16
1 6
1 6
16
1 6
16
2 0
2 0
2 0
2 0 2
0
2 0
2 02 4
2 4
2 4
2 4 2
4
2 4
24
2 8
2 8
2 8
2 8
2 8
2 8
2 8
2 8
3 2
3 2
3 2
3 2
3 2
32
3 2
3 2
3 2
3 2 3 2
32
3 6
3 6
3 6
36
3 6
3 6
36
3 6
3 6
3 6
40
40
4 0
4 0
4 0
4 0
-119˚ -118.75˚ -118.5˚ -118.25˚ -118˚ -117.75˚
33.75˚
34˚
34.25˚
0 4 8 12 16 20 24 28 32 36 40
Alhambra
Anaheim
Azusa
Baldwin ParkBeverly Hills
Brea
BurbankCanoga Park
Chatsworth
Compton
Diamon
DowneyEl Segundo
Encino
Fullerton
Hollywood
Huntington Beach
Inglewood
Irvine
La Canada
La Puente
Long Beach
Los AngelesMalibu
Monrovia
Montebello
North Hollywood
Northridge
Norwalk
Pasadena
Point Dume
San Fernando
Santa Ana
Santa Monica
Seal Beach
Simi ValleySunland
Thousand Oaks
Torrance
Whittier
Existing BuildingDamage Index (>IO)
Figure D.1: M w7.9 earthquake (north-to-south rupture) on the San Andreas fault – existing building performance:
Percentage of connections with plastic rotation exceeding the FEMA356 Immediate Occupancy (IO) level.
1Connections as defined here include the two ends each beam, and the one or two panel zones in each joint. Column ends are excluded as the
FEMA356 criteria for assessing column performance make a distinction between force-controlled and deformation-controlled columns and are not
amicable to presentation in a simple manner as can be done for beams and panel zones. The criteria for deformation-controlled columns (which
are defined as those carrying limited axial load) are based on the plastic rotations similar to beams and panel zones. However, in the case of
force-controlled columns yielding is not permissible, hence, there cannot be any performance levels associated with these columns.

8/13/2019 Kri05
http://slidepdf.com/reader/full/kri05 110/177
92
-119˚ -118.75˚ -118.5˚ -118.25˚ -118˚ -117.75˚
33.75˚
34˚
34.25˚
4
4
4
4
4
4
4
8
8
8
8
8
8
8
8
8
8
1 2
1 2
121 2
1 2
1 2
1 2
1 6
1 6
1 6
16
20
2 0
2 0
2 0
24
2 4
2 4
2 4
2 4
2 8
2 8
2 8 28
-119˚ -118.75˚ -118.5˚ -118.25˚ -118˚ -117.75˚
33.75˚
34˚
34.25˚
0 4 8 12 16 20 24 28 32 36 40
Alhambra
Anaheim
Azusa
Baldwin ParkBeverly Hills
Brea
BurbankCanoga Park
Chatsworth
Compton
Diamon
DowneyEl Segundo
Encino
Fullerton
Hollywood
Huntington Beach
Inglewood
Irvine
La Canada
La Puente
Long Beach
Los AngelesMalibu
Monrovia
Montebello
North Hollywood
Northridge
Norwalk
Pasadena
Point Dume
San Fernando
Santa Ana
Santa Monica
Seal Beach
Simi ValleySunland
Thousand Oaks
Torrance
Whittier
Existing BuildingDamage Index (>LS)
Figure D.2: M w7.9 earthquake (north-to-south rupture) on the San Andreas fault – existing building performance:
Percentage of connections with plastic rotation exceeding the FEMA356 Life Safety (LS) level.
-119˚ -118.75˚ -118.5˚ -118.25˚ -118˚ -117.75˚
33.75˚
34˚
34.25˚
4
4
44
4
4
4
4
4
8
8
8
8
8 8
8
8
1 2
1 2
16
1 6
1 6
1 6
2 0
2 0
2 0
2 0
2 0
2 0
2 4
2 4
2 4
2 4
-119˚ -118.75˚ -118.5˚ -118.25˚ -118˚ -117.75˚
33.75˚
34˚
34.25˚
0 4 8 12 16 20 24 28 32 36 40
Alhambra
Anaheim
Azusa
Baldwin ParkBeverly Hills
Brea
BurbankCanoga Park
Chatsworth
Compton
Diamon
DowneyEl Segundo
Encino
Fullerton
Hollywood
Huntington Beach
Inglewood
Irvine
La Canada
La Puente
Long Beach
Los AngelesMalibu
Monrovia
Montebello
North Hollywood
Northridge
Norwalk
Pasadena
Point Dume
San Fernando
Santa Ana
Santa Monica
Seal Beach
Simi ValleySunland
Thousand Oaks
Torrance
Whittier
Existing BuildingDamage Index (>CP)
Figure D.3: M w7.9 earthquake (north-to-south rupture) on the San Andreas fault – existing building performance:
Percentage of connections with plastic rotation exceeding the FEMA356 Collapse Prevention (CP) level.

8/13/2019 Kri05
http://slidepdf.com/reader/full/kri05 111/177
93
-119˚ -118.75˚ -118.5˚ -118.25˚ -118˚ -117.75˚
33.75˚
34˚
34.25˚
4
4
4
4
4
4
8
8
8
8
8
1 2
12
1 2
1 2
1 2
1 2
1 6
1 6
16
1 6
1 6
1 6
1 6
2 0
2 0
2 0
2 0
2 0
2 0
2 0
2 4
2 4
2 4
2 4
24
2 4
2 4
2 4
2 4
2 4
2 4
2 8
2 8
2 8
2 8
2 8
2 8
2 8
2 8
2 8
28
3 2
3 2
3 2
3 2
3 2
3 2
3 2
3 2
3 2
3 6
36
3 6
3 6
3 6
3 6
3 6
40
4 0
4 0
4 0
-119˚ -118.75˚ -118.5˚ -118.25˚ -118˚ -117.75˚
33.75˚
34˚
34.25˚
0 4 8 12 16 20 24 28 32 36 40
Alhambra
Anaheim
Azusa
Baldwin ParkBeverly Hills
Brea
BurbankCanoga Park
Chatsworth
Compton
Diamon
DowneyEl Segundo
Encino
Fullerton
Hollywood
Huntington Beach
Inglewood
Irvine
La Canada
La Puente
Long Beach
Los AngelesMalibu
Monrovia
Montebello
North Hollywood
Northridge
Norwalk
Pasadena
Point Dume
San Fernando
Santa Ana
Santa Monica
Seal Beach
Simi ValleySunland
Thousand Oaks
Torrance
Whittier
New BuildingDamage Index (>IO)
Figure D.4: M w7.9 earthquake (north-to-south rupture) on the San Andreas fault – redesigned building performance:
Percentage of connections with plastic rotation exceeding the FEMA356 Immediate Occupancy (IO) level.
-119˚ -118.75˚ -118.5˚ -118.25˚ -118˚ -117.75˚
33.75˚
34˚
34.25˚
4
4
4
8
8
8
8
12
1 2
1 2
12
1 2 1
6
1 6
-119˚ -118.75˚ -118.5˚ -118.25˚ -118˚ -117.75˚
33.75˚
34˚
34.25˚
0 4 8 12 16 20 24 28 32 36 40
Alhambra
Anaheim
Azusa
Baldwin ParkBeverly Hills
Brea
BurbankCanoga Park
Chatsworth
Compton
Diamon
DowneyEl Segundo
Encino
Fullerton
Hollywood
Huntington Beach
Inglewood
Irvine
La Canada
La Puente
Long Beach
Los AngelesMalibu
Monrovia
Montebello
North Hollywood
Northridge
Norwalk
Pasadena
Point Dume
San Fernando
Santa Ana
Santa Monica
Seal Beach
Simi ValleySunland
Thousand Oaks
Torrance
Whittier
New BuildingDamage Index (>LS)
Figure D.5: M w7.9 earthquake (north-to-south rupture) on the San Andreas fault – redesigned building performance:
Percentage of connections with plastic rotation exceeding the FEMA356 Life Safety (LS) level.
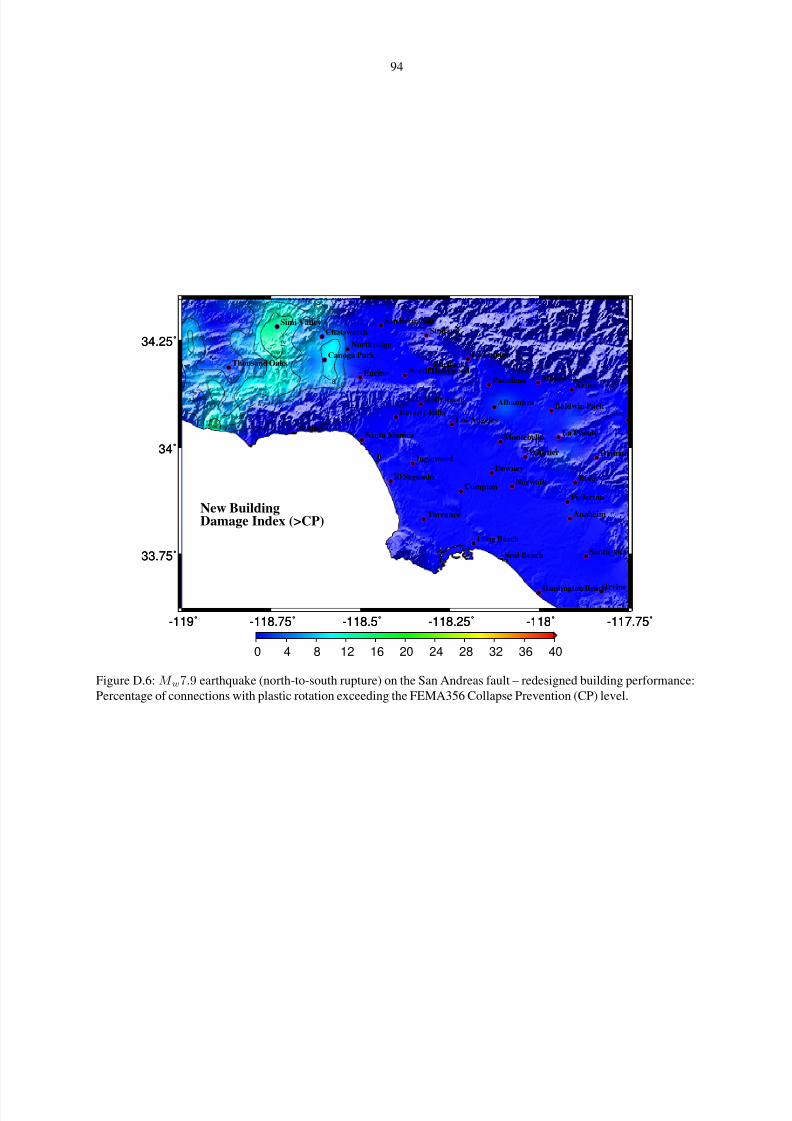
8/13/2019 Kri05
http://slidepdf.com/reader/full/kri05 112/177
94
-119˚ -118.75˚ -118.5˚ -118.25˚ -118˚ -117.75˚
33.75˚
34˚
34.25˚
4
4
4
8
8 8
8
1 2
1 2
-119˚ -118.75˚ -118.5˚ -118.25˚ -118˚ -117.75˚
33.75˚
34˚
34.25˚
0 4 8 12 16 20 24 28 32 36 40
Alhambra
Anaheim
Azusa
Baldwin ParkBeverly Hills
Brea
BurbankCanoga Park
Chatsworth
Compton
Diamon
DowneyEl Segundo
Encino
Fullerton
Hollywood
Huntington Beach
Inglewood
Irvine
La Canada
La Puente
Long Beach
Los AngelesMalibu
Monrovia
Montebello
North Hollywood
Northridge
Norwalk
Pasadena
Point Dume
San Fernando
Santa Ana
Santa Monica
Seal Beach
Simi ValleySunland
Thousand Oaks
Torrance
Whittier
New BuildingDamage Index (>CP)
Figure D.6: M w7.9 earthquake (north-to-south rupture) on the San Andreas fault – redesigned building performance:
Percentage of connections with plastic rotation exceeding the FEMA356 Collapse Prevention (CP) level.
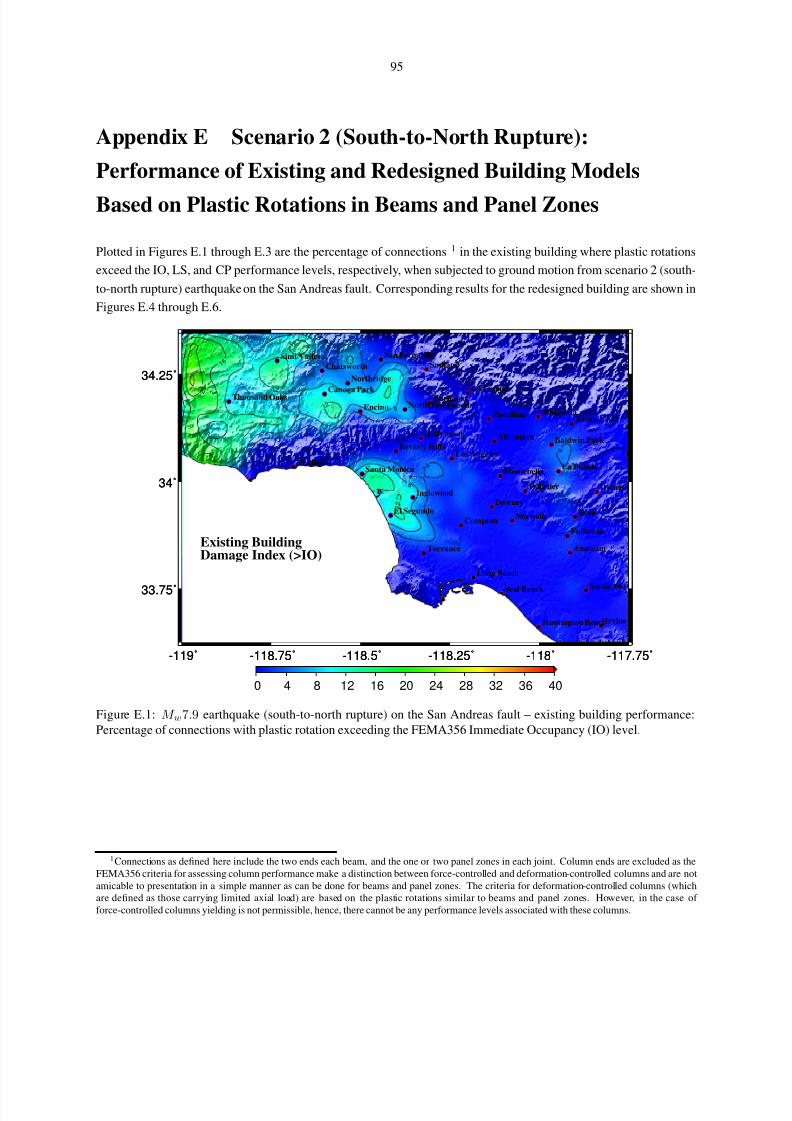
8/13/2019 Kri05
http://slidepdf.com/reader/full/kri05 113/177
95
Appendix E Scenario 2 (South-to-North Rupture):
Performance of Existing and Redesigned Building Models
Based on Plastic Rotations in Beams and Panel Zones
Plotted in Figures E.1 through E.3 are the percentage of connections 1 in the existing building where plastic rotations
exceed the IO, LS, and CP performance levels, respectively, when subjected to ground motion from scenario 2 (south-
to-north rupture) earthquake on the San Andreas fault. Corresponding results for the redesigned building are shown in
Figures E.4 through E.6.
-119˚ -118.75˚ -118.5˚ -118.25˚ -118˚ -117.75˚
33.75˚
34˚
34.25˚ 4
4
4
4
4
4
8
8
8
8
8
8
1 2
1 2
1 2
12
1 2
1 2
12
1 2
1 6
1 6
2
0
2 0
-119˚ -118.75˚ -118.5˚ -118.25˚ -118˚ -117.75˚
33.75˚
34˚
34.25˚
0 4 8 12 16 20 24 28 32 36 40
Alhambra
Anaheim
Azusa
Baldwin ParkBeverly Hills
Brea
BurbankCanoga Park
Chatsworth
Compton
Diamon
DowneyEl Segundo
Encino
Fullerton
Hollywood
Huntington Beach
Inglewood
Irvine
La Canada
La Puente
Long Beach
Los AngelesMalibu
Monrovia
Montebello
North Hollywood
Northridge
Norwalk
Pasadena
Point Dume
San Fernando
Santa Ana
Santa Monica
Seal Beach
Simi ValleySunland
Thousand Oaks
Torrance
Whittier
Existing BuildingDamage Index (>IO)
Figure E.1: M w7.9 earthquake (south-to-north rupture) on the San Andreas fault – existing building performance:
Percentage of connections with plastic rotation exceeding the FEMA356 Immediate Occupancy (IO) level.
1Connections as defined here include the two ends each beam, and the one or two panel zones in each joint. Column ends are excluded as the
FEMA356 criteria for assessing column performance make a distinction between force-controlled and deformation-controlled columns and are not
amicable to presentation in a simple manner as can be done for beams and panel zones. The criteria for deformation-controlled columns (which
are defined as those carrying limited axial load) are based on the plastic rotations similar to beams and panel zones. However, in the case of
force-controlled columns yielding is not permissible, hence, there cannot be any performance levels associated with these columns.
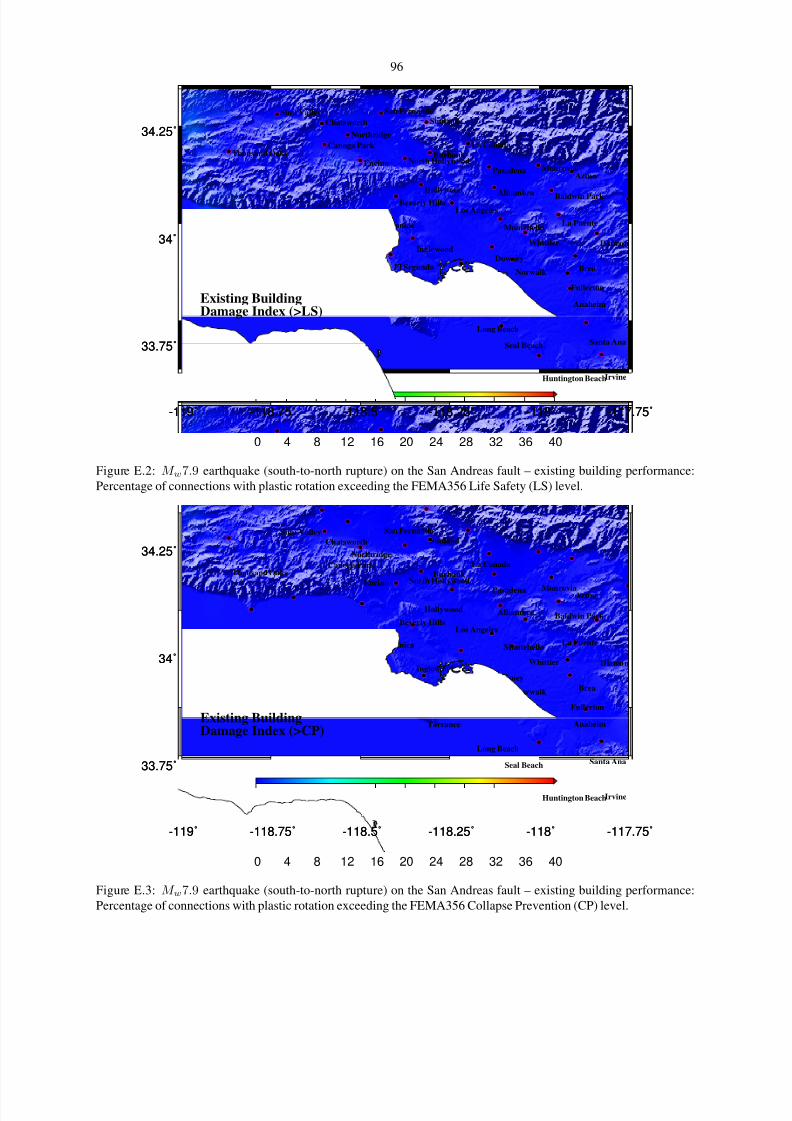
8/13/2019 Kri05
http://slidepdf.com/reader/full/kri05 114/177
96
-119˚ -118.75˚ -118.5˚ -118.25˚ -118˚ -117.75˚
33.75˚
34˚
34.25˚
-119˚ -118.75˚ -118.5˚ -118.25˚ -118˚ -117.75˚
33.75˚
34˚
34.25˚
0 4 8 12 16 20 24 28 32 36 40
Alhambra
Anaheim
Azusa
Baldwin ParkBeverly Hills
Brea
BurbankCanoga Park
Chatsworth
Compton
Diamon
DowneyEl Segundo
Encino
Fullerton
Hollywood
Huntington Beach
Inglewood
Irvine
La Canada
La Puente
Long Beach
Los AngelesMalibu
Monrovia
Montebello
North Hollywood
Northridge
Norwalk
Pasadena
Point Dume
San Fernando
Santa Ana
Santa Monica
Seal Beach
Simi ValleySunland
Thousand Oaks
Torrance
Whittier
Existing BuildingDamage Index (>LS)
Figure E.2: M w7.9 earthquake (south-to-north rupture) on the San Andreas fault – existing building performance:
Percentage of connections with plastic rotation exceeding the FEMA356 Life Safety (LS) level.
-119˚ -118.75˚ -118.5˚ -118.25˚ -118˚ -117.75˚
33.75˚
34˚
34.25˚
-119˚ -118.75˚ -118.5˚ -118.25˚ -118˚ -117.75˚
33.75˚
34˚
34.25˚
0 4 8 12 16 20 24 28 32 36 40
Alhambra
Anaheim
Azusa
Baldwin ParkBeverly Hills
Brea
BurbankCanoga Park
Chatsworth
Compton
Diamon
DowneyEl Segundo
Encino
Fullerton
Hollywood
Huntington Beach
Inglewood
Irvine
La Canada
La Puente
Long Beach
Los AngelesMalibu
Monrovia
Montebello
North Hollywood
Northridge
Norwalk
Pasadena
Point Dume
San Fernando
Santa Ana
Santa Monica
Seal Beach
Simi ValleySunland
Thousand Oaks
Torrance
Whittier
Existing BuildingDamage Index (>CP)
Figure E.3: M w7.9 earthquake (south-to-north rupture) on the San Andreas fault – existing building performance:
Percentage of connections with plastic rotation exceeding the FEMA356 Collapse Prevention (CP) level.
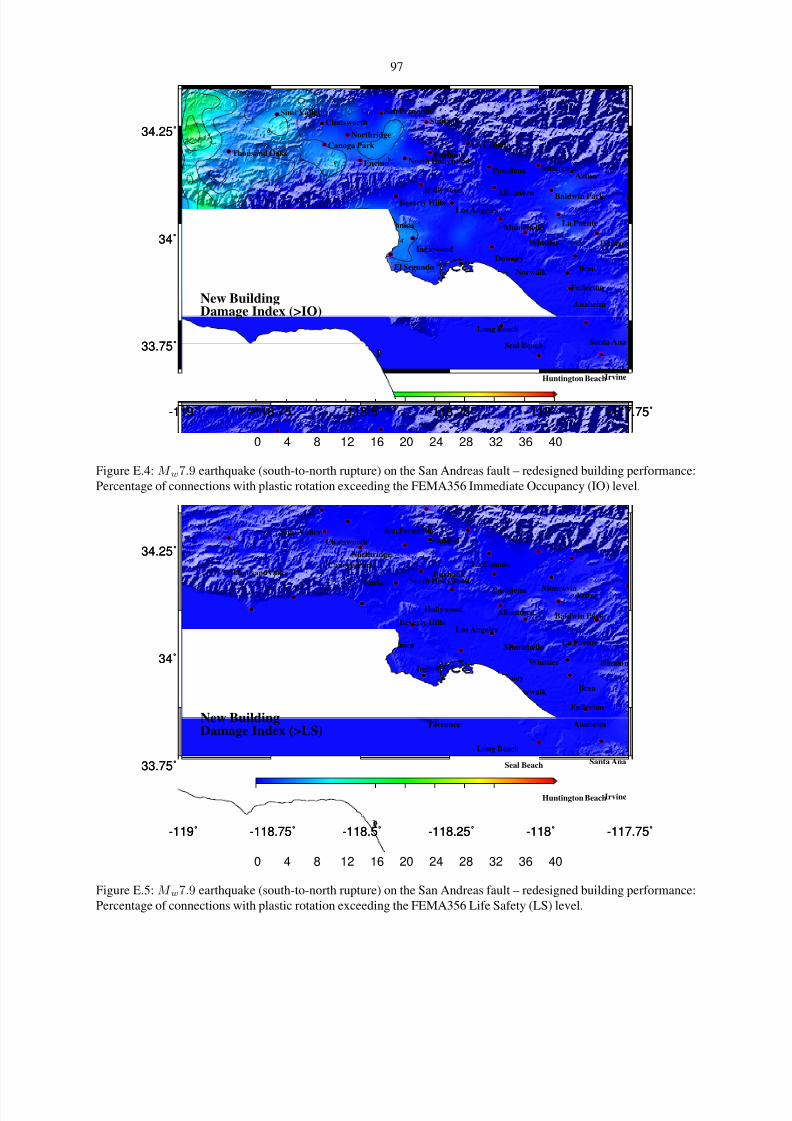
8/13/2019 Kri05
http://slidepdf.com/reader/full/kri05 115/177
97
-119˚ -118.75˚ -118.5˚ -118.25˚ -118˚ -117.75˚
33.75˚
34˚
34.25˚
4
4
4
4
4 4
8
8
1 2
1 6
-119˚ -118.75˚ -118.5˚ -118.25˚ -118˚ -117.75˚
33.75˚
34˚
34.25˚
0 4 8 12 16 20 24 28 32 36 40
Alhambra
Anaheim
Azusa
Baldwin ParkBeverly Hills
Brea
BurbankCanoga Park
Chatsworth
Compton
Diamon
DowneyEl Segundo
Encino
Fullerton
Hollywood
Huntington Beach
Inglewood
Irvine
La Canada
La Puente
Long Beach
Los AngelesMalibu
Monrovia
Montebello
North Hollywood
Northridge
Norwalk
Pasadena
Point Dume
San Fernando
Santa Ana
Santa Monica
Seal Beach
Simi ValleySunland
Thousand Oaks
Torrance
Whittier
New BuildingDamage Index (>IO)
Figure E.4: M w7.9 earthquake (south-to-north rupture) on the San Andreas fault – redesigned building performance:
Percentage of connections with plastic rotation exceeding the FEMA356 Immediate Occupancy (IO) level.
-119˚ -118.75˚ -118.5˚ -118.25˚ -118˚ -117.75˚
33.75˚
34˚
34.25˚
-119˚ -118.75˚ -118.5˚ -118.25˚ -118˚ -117.75˚
33.75˚
34˚
34.25˚
0 4 8 12 16 20 24 28 32 36 40
Alhambra
Anaheim
Azusa
Baldwin ParkBeverly Hills
Brea
BurbankCanoga Park
Chatsworth
Compton
Diamon
DowneyEl Segundo
Encino
Fullerton
Hollywood
Huntington Beach
Inglewood
Irvine
La Canada
La Puente
Long Beach
Los AngelesMalibu
Monrovia
Montebello
North Hollywood
Northridge
Norwalk
Pasadena
Point Dume
San Fernando
Santa Ana
Santa Monica
Seal Beach
Simi ValleySunland
Thousand Oaks
Torrance
Whittier
New BuildingDamage Index (>LS)
Figure E.5: M w7.9 earthquake (south-to-north rupture) on the San Andreas fault – redesigned building performance:
Percentage of connections with plastic rotation exceeding the FEMA356 Life Safety (LS) level.

8/13/2019 Kri05
http://slidepdf.com/reader/full/kri05 116/177
98
-119˚ -118.75˚ -118.5˚ -118.25˚ -118˚ -117.75˚
33.75˚
34˚
34.25˚
-119˚ -118.75˚ -118.5˚ -118.25˚ -118˚ -117.75˚
33.75˚
34˚
34.25˚
0 4 8 12 16 20 24 28 32 36 40
Alhambra
Anaheim
Azusa
Baldwin ParkBeverly Hills
Brea
BurbankCanoga Park
Chatsworth
Compton
Diamon
DowneyEl Segundo
Encino
Fullerton
Hollywood
Huntington Beach
Inglewood
Irvine
La Canada
La Puente
Long Beach
Los AngelesMalibu
Monrovia
Montebello
North Hollywood
Northridge
Norwalk
Pasadena
Point Dume
San Fernando
Santa Ana
Santa Monica
Seal Beach
Simi ValleySunland
Thousand Oaks
Torrance
Whittier
New BuildingDamage Index (>CP)
Figure E.6: M w7.9 earthquake (south-to-north rupture) on the San Andreas fault – redesigned building performance:
Percentage of connections with plastic rotation exceeding the FEMA356 Collapse Prevention (CP) level.

8/13/2019 Kri05
http://slidepdf.com/reader/full/kri05 117/177
99
Appendix F Details of the Performance of Existing and
Redesigned Building Models in 8 Southern Californian Cities
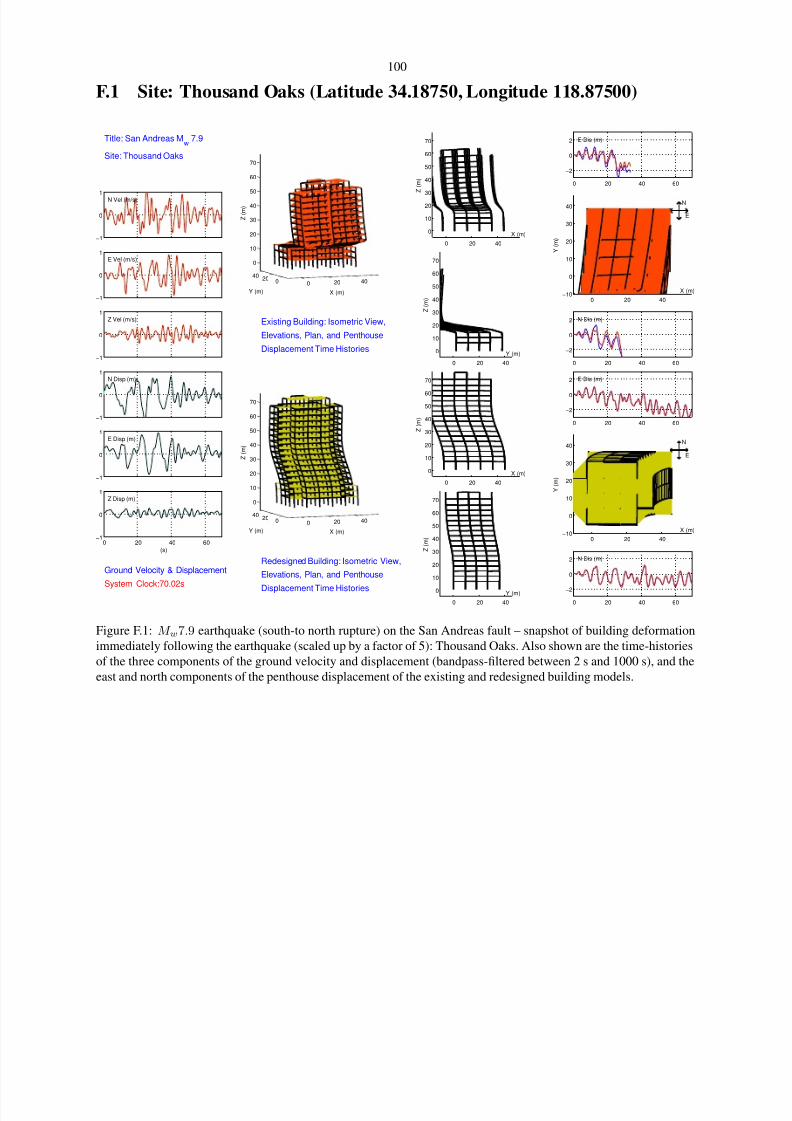
8/13/2019 Kri05
http://slidepdf.com/reader/full/kri05 118/177
100
F.1 Site: Thousand Oaks (Latitude 34.18750, Longitude 118.87500)
0 20 40020
40
0
10
20
30
40
50
60
70
X (m)Y (m)
Z ( m )
0 20 40
0
10
20
30
40
50
60
70
Y (m)
Z ( m )
0 20 40
0
10
20
30
40
50
60
70
X (m)
Z ( m )
0 20 40−10
0
10
20
30
40
E
N
X (m)
Y ( m )
Existing Building: Isometric View,
Elevations, Plan, and Penthouse
Displacement Time Histories
0 20 40 60
−2
0
2 E Dis (m)
0 20 40 60
−2
0
2 N Dis (m)
0 20 40020
40
0
10
20
30
40
50
60
70
X (m)Y (m)
Z ( m )
0 20 40
0
10
20
30
40
50
60
70
Y (m)
Z ( m )
0 20 40
0
10
20
30
40
50
60
70
X (m)
Z ( m )
0 20 40−10
0
10
20
30
40
E
N
X (m)
Y ( m )
Redesigned Building: Isometric View,
Elevations, Plan, and Penthouse
Displacement Time Histories
0 20 40 60
−2
0
2 E Dis (m)
0 20 40 60
−2
0
2 N Dis (m)
Title: San Andreas Mw 7.9
Site: Thousand Oaks
−1
0
1N Vel (m/s)
−1
0
1E Vel (m/s)
−1
0
1Z Vel (m/s)
−1
0
1N Disp (m)
−1
0
1E Disp (m)
0 20 40 60−1
0
1Z Disp (m)
(s)
Ground Velocity & Displacement
System Clock:70.02s
Figure F.1: M w7.9 earthquake (south-to north rupture) on the San Andreas fault – snapshot of building deformation
immediately following the earthquake (scaled up by a factor of 5): Thousand Oaks. Also shown are the time-histories
of the three components of the ground velocity and displacement (bandpass-filtered between 2 s and 1000 s), and the
east and north components of the penthouse displacement of the existing and redesigned building models.
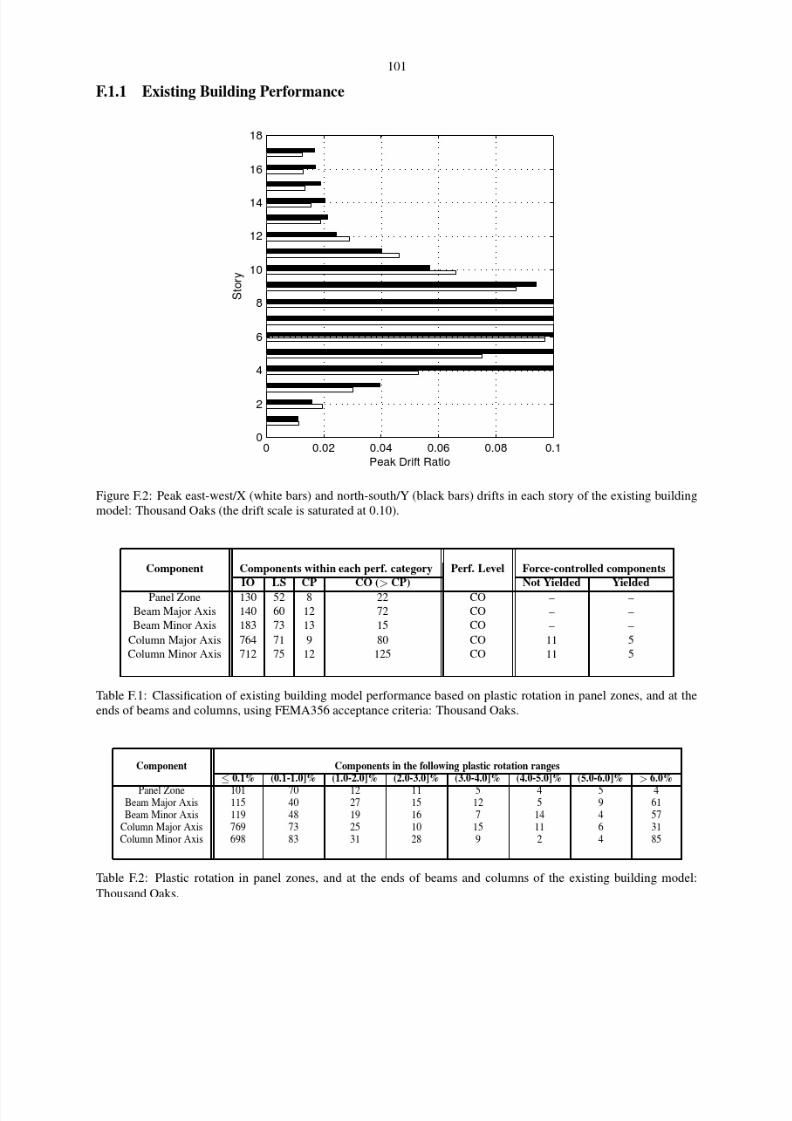
8/13/2019 Kri05
http://slidepdf.com/reader/full/kri05 119/177
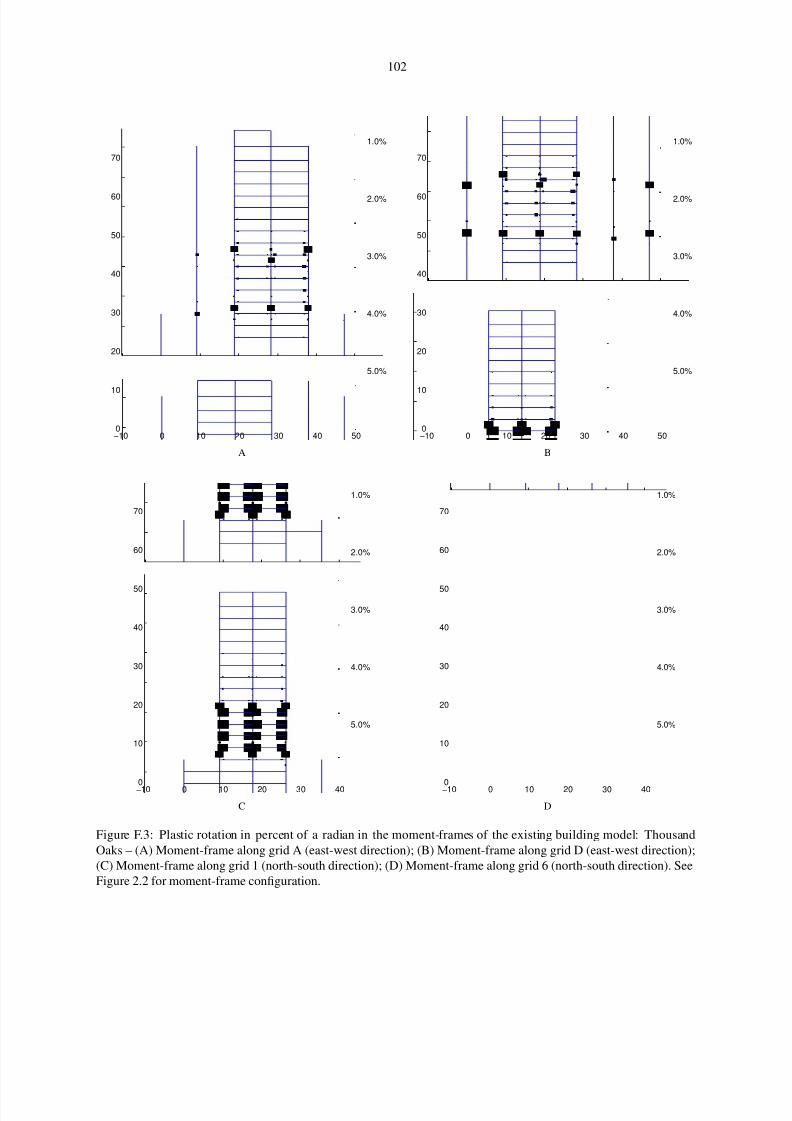
8/13/2019 Kri05
http://slidepdf.com/reader/full/kri05 120/177
102
−10 0 10 20 30 40 500
10
20
30
40
50
60
70
5.0%
4.0%
3.0%
2.0%
1.0%
A
−10 0 10 20 30 40 500
10
20
30
40
50
60
70
5.0%
4.0%
3.0%
2.0%
1.0%
B
−10 0 10 20 30 400
10
20
30
40
50
60
70
5.0%
4.0%
3.0%
2.0%
1.0%
C
−10 0 10 20 30 400
10
20
30
40
50
60
70
5.0%
4.0%
3.0%
2.0%
1.0%
D
Figure F.3: Plastic rotation in percent of a radian in the moment-frames of the existing building model: Thousand
Oaks – (A) Moment-frame along grid A (east-west direction); (B) Moment-frame along grid D (east-west direction);
(C) Moment-frame along grid 1 (north-south direction); (D) Moment-frame along grid 6 (north-south direction). See
Figure 2.2 for moment-frame configuration.

8/13/2019 Kri05
http://slidepdf.com/reader/full/kri05 121/177
103
−10 0 10 20 30 40 500
10
20
30
40
50
60
70
A
−10 0 10 20 30 40 500
10
20
30
40
50
60
70
B
−10 0 10 20 30 400
10
20
30
40
50
60
70
C
−10 0 10 20 30 400
10
20
30
40
50
60
70
D
Figure F.4: Beam bottom-flange weld fracture locations in the moment-frames of the existing building model: Thou-
sand Oaks – (A) Moment-frame along grid A (east-west direction); (B) Moment-frame along grid D (east-west direc-
tion); (C) Moment-frame along grid 1 (north-south direction); (D) Moment-frame along grid 6 (north-south direction).
See Figure 2.2 for moment-frame configuration.
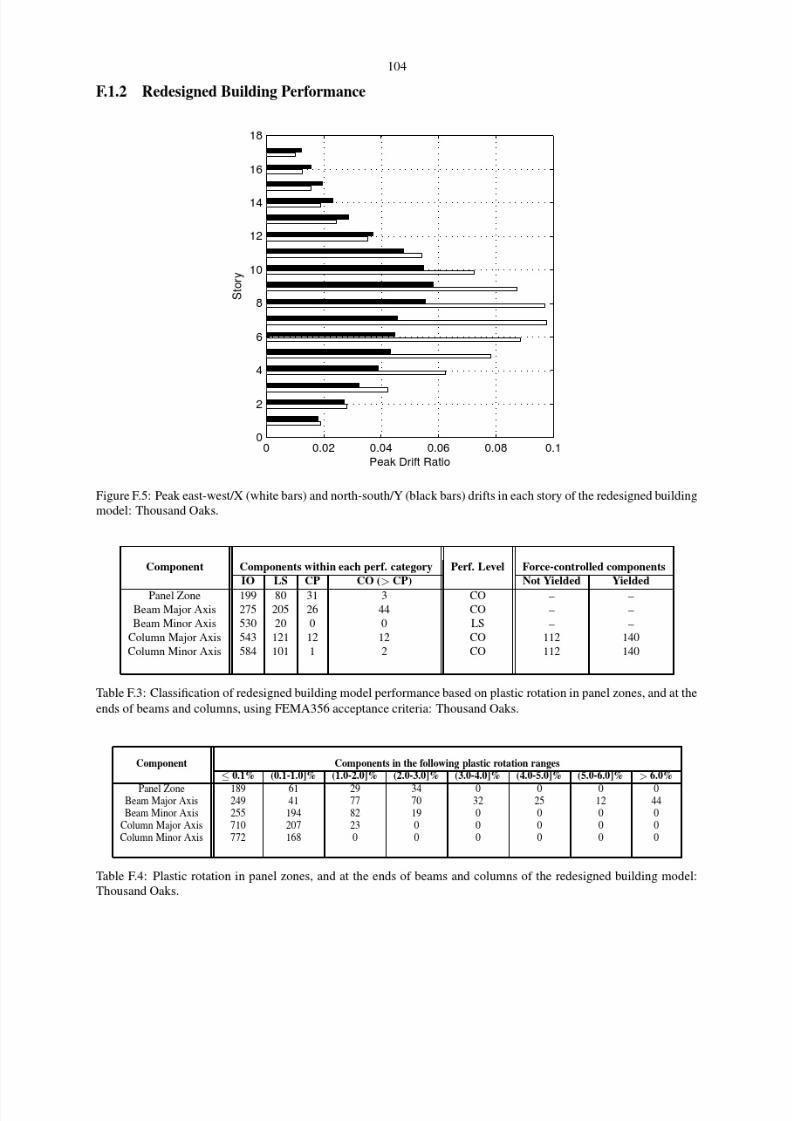
8/13/2019 Kri05
http://slidepdf.com/reader/full/kri05 122/177
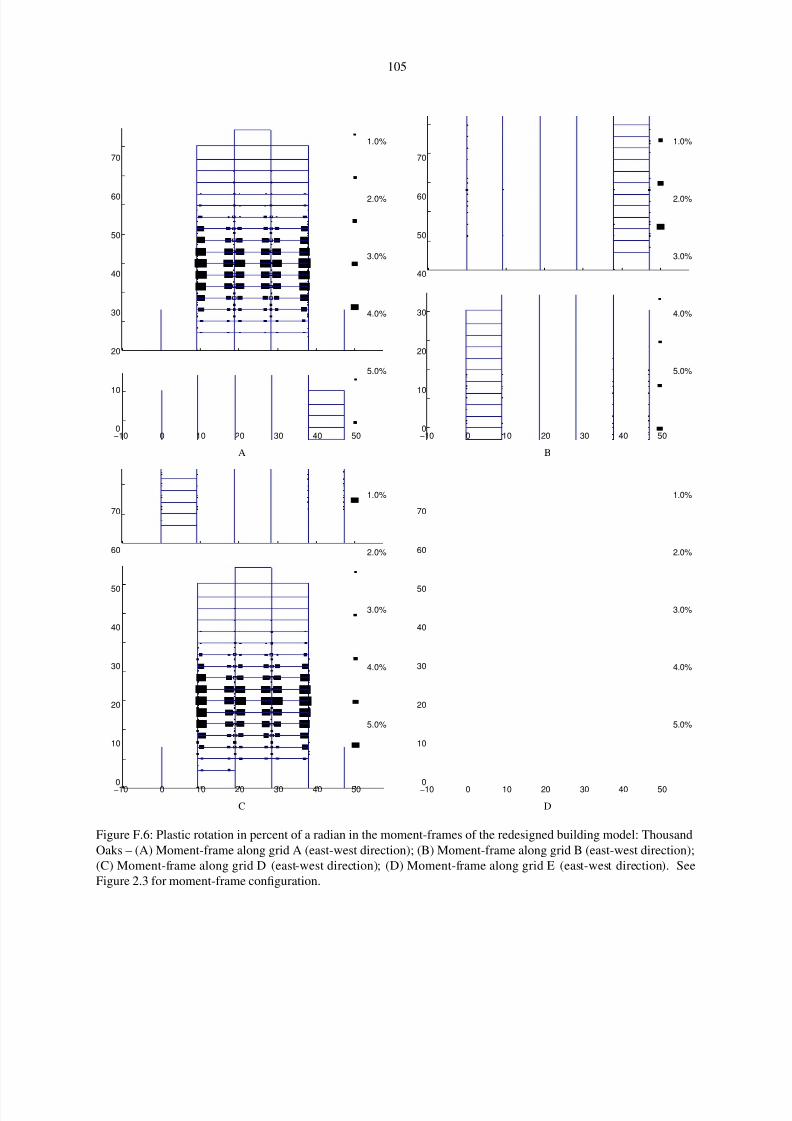
8/13/2019 Kri05
http://slidepdf.com/reader/full/kri05 123/177
105
−10 0 10 20 30 40 500
10
20
30
40
50
60
70
5.0%
4.0%
3.0%
2.0%
1.0%
A
−10 0 10 20 30 40 500
10
20
30
40
50
60
70
5.0%
4.0%
3.0%
2.0%
1.0%
B
−10 0 10 20 30 40 500
10
20
30
40
50
60
70
5.0%
4.0%
3.0%
2.0%
1.0%
C
−10 0 10 20 30 40 500
10
20
30
40
50
60
70
5.0%
4.0%
3.0%
2.0%
1.0%
D
Figure F.6: Plastic rotation in percent of a radian in the moment-frames of the redesigned building model: Thousand
Oaks – (A) Moment-frame along grid A (east-west direction); (B) Moment-frame along grid B (east-west direction);
(C) Moment-frame along grid D (east-west direction); (D) Moment-frame along grid E (east-west direction). See
Figure 2.3 for moment-frame configuration.

8/13/2019 Kri05
http://slidepdf.com/reader/full/kri05 124/177

8/13/2019 Kri05
http://slidepdf.com/reader/full/kri05 125/177
107
F.2 Site: Northridge (Latitude 34.21875, Longitude 118.53125)
0 20 40020
40
0
10
20
30
40
50
60
70
X (m)Y (m)
Z ( m )
0 20 40
0
10
20
30
40
50
60
70
Y (m)
Z ( m )
0 20 40
0
10
20
30
40
50
60
70
X (m)
Z ( m )
0 20 40−10
0
10
20
30
40
E
N
X (m)
Y ( m )
Existing Building: Isometric View,
Elevations, Plan, and Penthouse
Displacement Time Histories
0 20 40 60
−2
0
2 E Dis (m)
0 20 40 60
−2
0
2 N Dis (m)
0 20 40020
40
0
10
20
30
40
50
60
70
X (m)Y (m)
Z ( m )
0 20 40
0
10
20
30
40
50
60
70
Y (m)
Z ( m )
0 20 40
0
10
20
30
40
50
60
70
X (m)
Z ( m )
0 20 40−10
0
10
20
30
40
E
N
X (m)
Y ( m )
Redesigned Building: Isometric View,
Elevations, Plan, and Penthouse
Displacement Time Histories
0 20 40 60
−2
0
2 E Dis (m)
0 20 40 60
−2
0
2 N Dis (m)
Title: San Andreas Mw 7.9
Site: Northridge
−1
0
1N Vel (m/s)
−1
0
1E Vel (m/s)
−1
0
1Z Vel (m/s)
−1
0
1N Disp (m)
−1
0
1E Disp (m)
0 20 40 60−1
0
1Z Disp (m)
(s)
Ground Velocity & Displacement
System Clock:70.02s
Figure F.8: M w7.9 earthquake (south-to-north rupture) on the San Andreas fault – snapshot of building deformation
immediately following the earthquake (scaled up by a factor of 5): Northridge. Also shown are the time-histories of
the three components of the ground velocity and displacement (bandpass-filtered between 2 s and 1000 s), and the east
and north components of the penthouse displacement of the existing and redesigned building models.
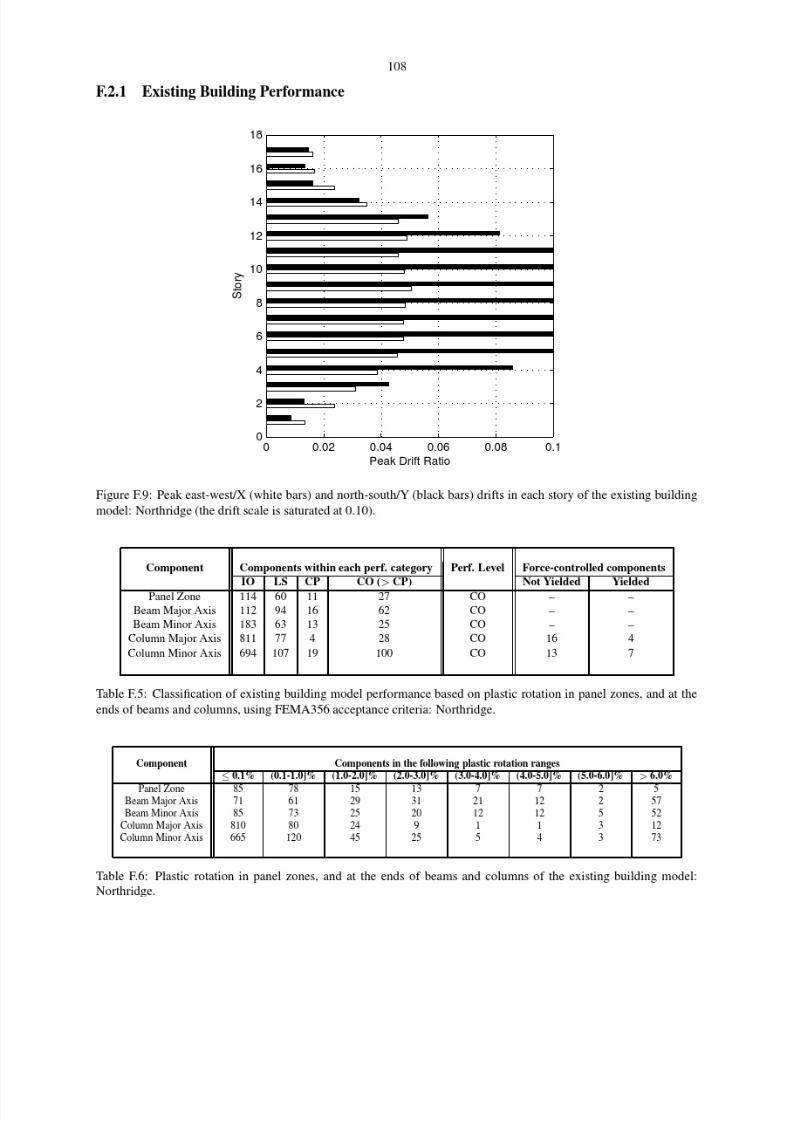
8/13/2019 Kri05
http://slidepdf.com/reader/full/kri05 126/177

8/13/2019 Kri05
http://slidepdf.com/reader/full/kri05 127/177

8/13/2019 Kri05
http://slidepdf.com/reader/full/kri05 128/177
110
−10 0 10 20 30 40 500
10
20
30
40
50
60
70
A
−10 0 10 20 30 40 500
10
20
30
40
50
60
70
B
−10 0 10 20 30 400
10
20
30
40
50
60
70
C
−10 0 10 20 30 400
10
20
30
40
50
60
70
D
Figure F.11: Beam bottom-flange weld fracture locations in the moment-frames of the existing building model:
Northridge – (A) Moment-frame along grid A (east-west direction); (B) Moment-frame along grid D (east-west direc-
tion); (C) Moment-frame along grid 1 (north-south direction); (D) Moment-frame along grid 6 (north-south direction).
See Figure 2.2 for moment-frame configuration.

8/13/2019 Kri05
http://slidepdf.com/reader/full/kri05 129/177

8/13/2019 Kri05
http://slidepdf.com/reader/full/kri05 130/177
112
−10 0 10 20 30 40 500
10
20
30
40
50
60
70
5.0%
4.0%
3.0%
2.0%
1.0%
A
−10 0 10 20 30 40 500
10
20
30
40
50
60
70
5.0%
4.0%
3.0%
2.0%
1.0%
B
−10 0 10 20 30 40 500
10
20
30
40
50
60
70
5.0%
4.0%
3.0%
2.0%
1.0%
C
−10 0 10 20 30 40 500
10
20
30
40
50
60
70
5.0%
4.0%
3.0%
2.0%
1.0%
D
Figure F.13: Plastic rotation in percent of a radian in the moment-frames of the redesigned building model: Northridge
– (A) Moment-frame along grid A (east-west direction); (B) Moment-frame along grid B (east-west direction); (C)
Moment-frame along grid D (east-west direction); (D) Moment-frame along grid E (east-west direction). See Figure
2.3 for moment-frame configuration.
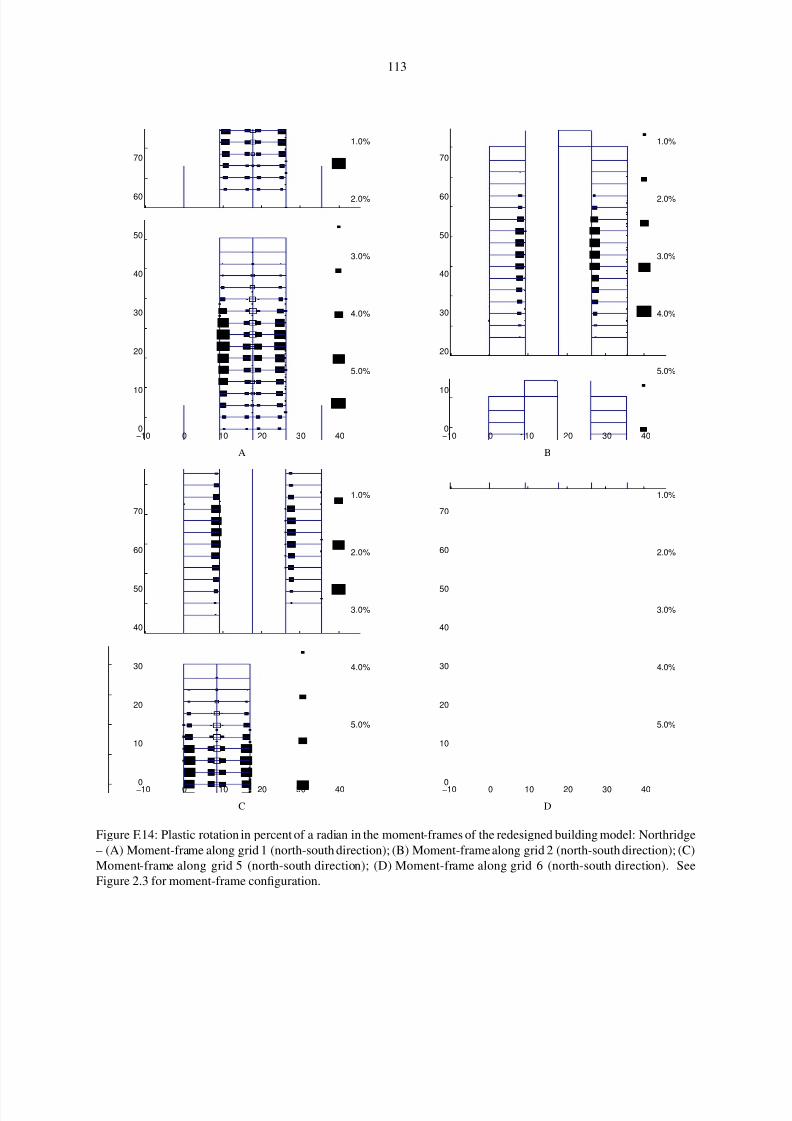
8/13/2019 Kri05
http://slidepdf.com/reader/full/kri05 131/177
113
−10 0 10 20 30 400
10
20
30
40
50
60
70
5.0%
4.0%
3.0%
2.0%
1.0%
A
−10 0 10 20 30 400
10
20
30
40
50
60
70
5.0%
4.0%
3.0%
2.0%
1.0%
B
−10 0 10 20 30 400
10
20
30
40
50
60
70
5.0%
4.0%
3.0%
2.0%
1.0%
C
−10 0 10 20 30 400
10
20
30
40
50
60
70
5.0%
4.0%
3.0%
2.0%
1.0%
D
Figure F.14: Plastic rotation in percent of a radian in the moment-frames of the redesigned building model: Northridge
– (A) Moment-frame along grid 1 (north-south direction); (B) Moment-frame along grid 2 (north-south direction); (C)
Moment-frame along grid 5 (north-south direction); (D) Moment-frame along grid 6 (north-south direction). See
Figure 2.3 for moment-frame configuration.
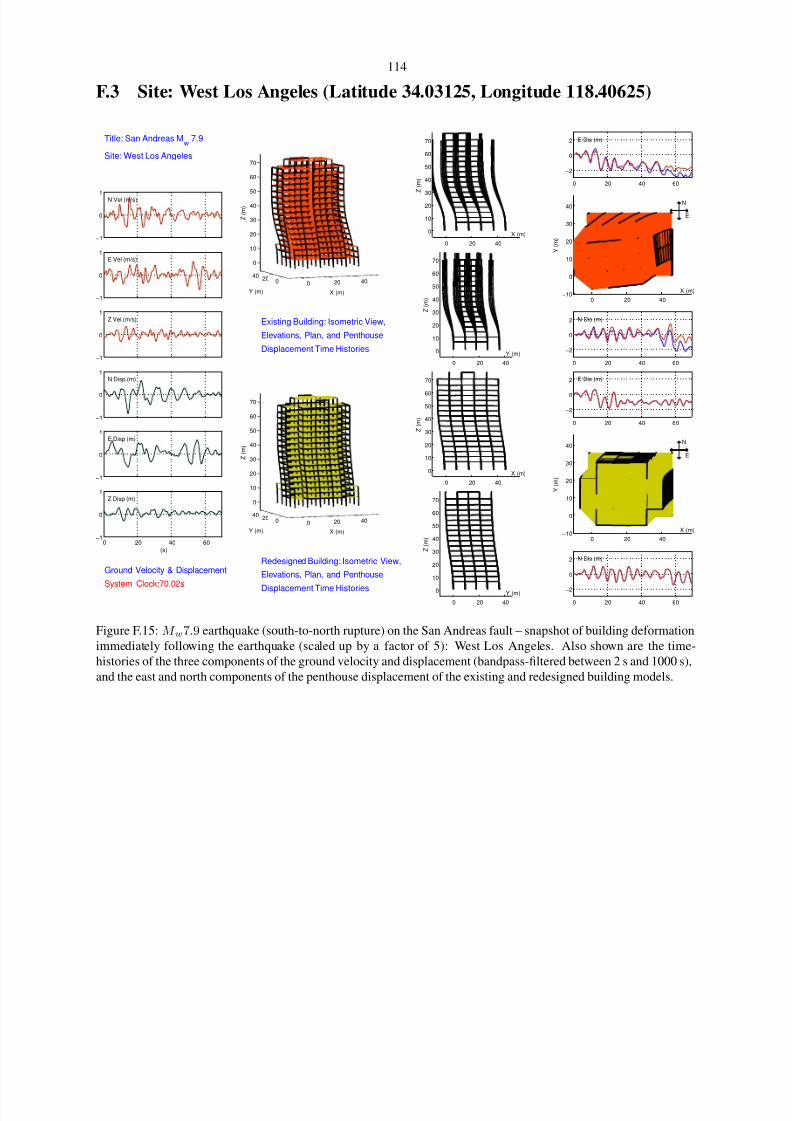
8/13/2019 Kri05
http://slidepdf.com/reader/full/kri05 132/177
114
F.3 Site: West Los Angeles (Latitude 34.03125, Longitude 118.40625)
0 20 40020
40
0
10
20
30
40
50
60
70
X (m)Y (m)
Z ( m )
0 20 40
0
10
20
30
40
50
60
70
Y (m)
Z ( m )
0 20 40
0
10
20
30
40
50
60
70
X (m)
Z ( m )
0 20 40−10
0
10
20
30
40
E
N
X (m)
Y ( m )
Existing Building: Isometric View,
Elevations, Plan, and Penthouse
Displacement Time Histories
0 20 40 60
−2
0
2 E Dis (m)
0 20 40 60
−2
0
2 N Dis (m)
0 20 40020
40
0
10
20
30
40
50
60
70
X (m)Y (m)
Z ( m )
0 20 40
0
10
20
30
40
50
60
70
Y (m)
Z ( m )
0 20 40
0
10
20
30
40
50
60
70
X (m)
Z ( m )
0 20 40−10
0
10
20
30
40
E
N
X (m)
Y ( m )
Redesigned Building: Isometric View,
Elevations, Plan, and Penthouse
Displacement Time Histories
0 20 40 60
−2
0
2 E Dis (m)
0 20 40 60
−2
0
2 N Dis (m)
Title: San Andreas Mw 7.9
Site: West Los Angeles
−1
0
1N Vel (m/s)
−1
0
1E Vel (m/s)
−1
0
1Z Vel (m/s)
−1
0
1N Disp (m)
−1
0
1E Disp (m)
0 20 40 60−1
0
1Z Disp (m)
(s)
Ground Velocity & Displacement
System Clock:70.02s
Figure F.15: M w7.9 earthquake (south-to-north rupture) on the San Andreas fault – snapshot of building deformation
immediately following the earthquake (scaled up by a factor of 5): West Los Angeles. Also shown are the time-
histories of the three components of the ground velocity and displacement (bandpass-filtered between 2 s and 1000 s),
and the east and north components of the penthouse displacement of the existing and redesigned building models.

8/13/2019 Kri05
http://slidepdf.com/reader/full/kri05 133/177

8/13/2019 Kri05
http://slidepdf.com/reader/full/kri05 134/177
116
−10 0 10 20 30 40 500
10
20
30
40
50
60
70
5.0%
4.0%
3.0%
2.0%
1.0%
A
−10 0 10 20 30 40 500
10
20
30
40
50
60
70
5.0%
4.0%
3.0%
2.0%
1.0%
B
−10 0 10 20 30 400
10
20
30
40
50
60
70
5.0%
4.0%
3.0%
2.0%
1.0%
C
−10 0 10 20 30 400
10
20
30
40
50
60
70
5.0%
4.0%
3.0%
2.0%
1.0%
D
Figure F.17: Plastic rotation in percent of a radian in the moment-frames of the existing building model: West Los An-
geles – (A) Moment-frame along grid A (east-west direction); (B) Moment-frame along grid D (east-west direction);
(C) Moment-frame along grid 1 (north-south direction); (D) Moment-frame along grid 6 (north-south direction). See
Figure 2.2 for moment-frame configuration.

8/13/2019 Kri05
http://slidepdf.com/reader/full/kri05 135/177
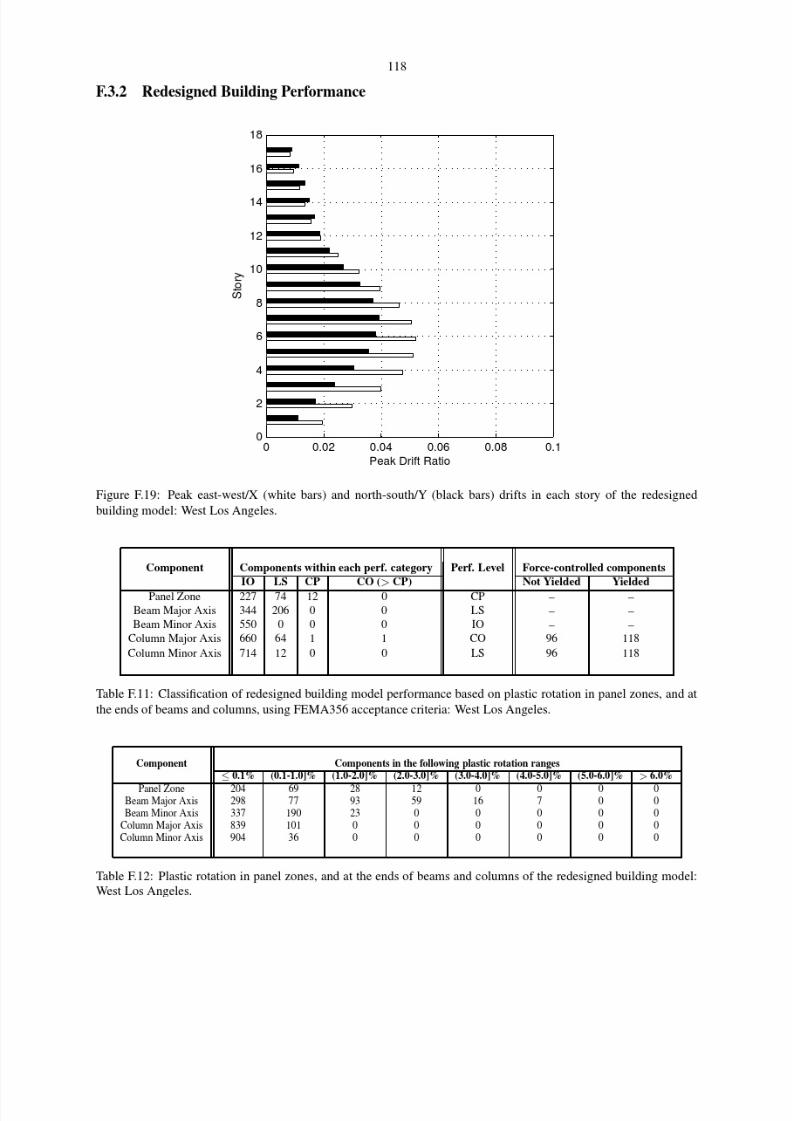
8/13/2019 Kri05
http://slidepdf.com/reader/full/kri05 136/177

8/13/2019 Kri05
http://slidepdf.com/reader/full/kri05 137/177
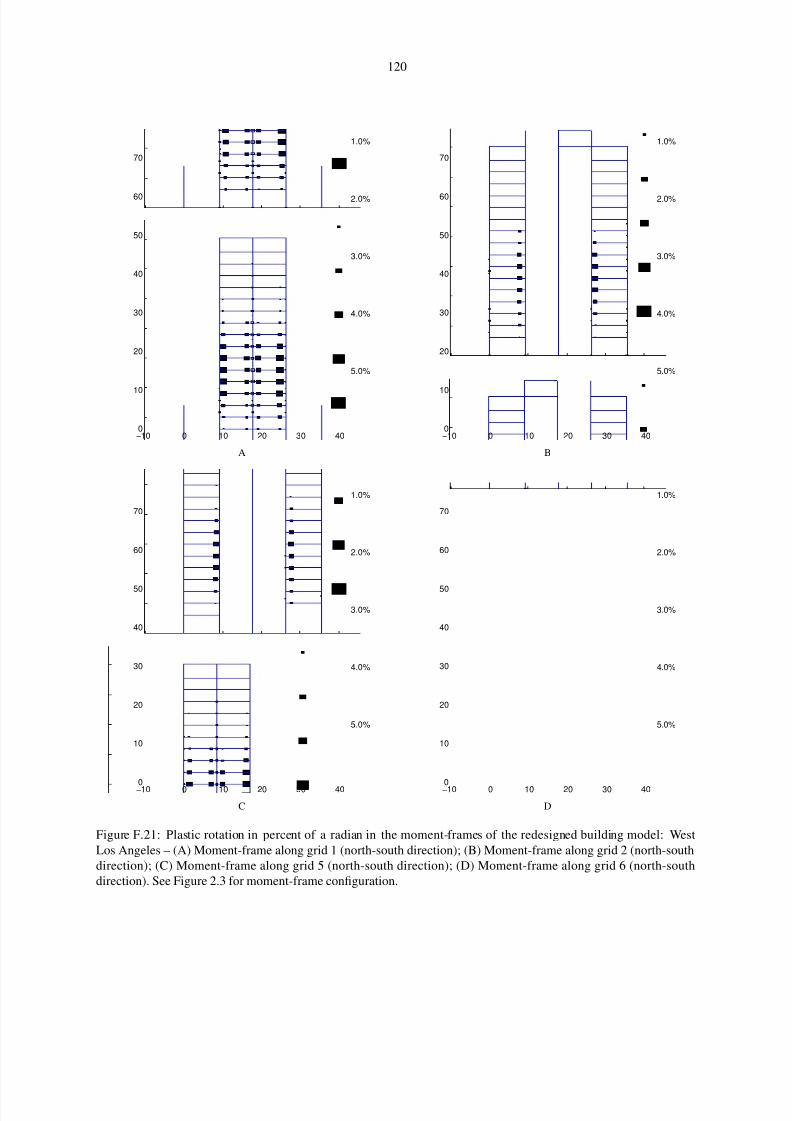
8/13/2019 Kri05
http://slidepdf.com/reader/full/kri05 138/177
120
−10 0 10 20 30 400
10
20
30
40
50
60
70
5.0%
4.0%
3.0%
2.0%
1.0%
A
−10 0 10 20 30 400
10
20
30
40
50
60
70
5.0%
4.0%
3.0%
2.0%
1.0%
B
−10 0 10 20 30 400
10
20
30
40
50
60
70
5.0%
4.0%
3.0%
2.0%
1.0%
C
−10 0 10 20 30 400
10
20
30
40
50
60
70
5.0%
4.0%
3.0%
2.0%
1.0%
D
Figure F.21: Plastic rotation in percent of a radian in the moment-frames of the redesigned building model: West
Los Angeles – (A) Moment-frame along grid 1 (north-south direction); (B) Moment-frame along grid 2 (north-south
direction); (C) Moment-frame along grid 5 (north-south direction); (D) Moment-frame along grid 6 (north-south
direction). See Figure 2.3 for moment-frame configuration.

8/13/2019 Kri05
http://slidepdf.com/reader/full/kri05 139/177
121
F.4 Site: Downtown Los Angeles (Latitude 34.06250, Longitude 118.25000)
0 20 40020
40
0
10
20
30
40
50
60
70
X (m)Y (m)
Z ( m )
0 20 40
0
10
20
30
40
50
60
70
Y (m)
Z ( m )
0 20 40
0
10
20
30
40
50
60
70
X (m)
Z ( m )
0 20 40−10
0
10
20
30
40
E
N
X (m)
Y ( m )
Existing Building: Isometric View,
Elevations, Plan, and Penthouse
Displacement Time Histories
0 20 40 60
−2
0
2 E Dis (m)
0 20 40 60
−2
0
2 N Dis (m)
0 20 40020
40
0
10
20
30
40
50
60
70
X (m)Y (m)
Z ( m )
0 20 40
0
10
20
30
40
50
60
70
Y (m)
Z ( m )
0 20 40
0
10
20
30
40
50
60
70
X (m)
Z ( m )
0 20 40−10
0
10
20
30
40
E
N
X (m)
Y ( m )
Redesigned Building: Isometric View,
Elevations, Plan, and Penthouse
Displacement Time Histories
0 20 40 60
−2
0
2 E Dis (m)
0 20 40 60
−2
0
2 N Dis (m)
Title: San Andreas Mw 7.9
Site: Downtown Los Angeles
−1
0
1N Vel (m/s)
−1
0
1E Vel (m/s)
−1
0
1Z Vel (m/s)
−1
0
1N Disp (m)
−1
0
1E Disp (m)
0 20 40 60−1
0
1Z Disp (m)
(s)
Ground Velocity & Displacement
System Clock:70.02s
Figure F.22: M w7.9 earthquake (south-to-north rupture) on the San Andreas fault – snapshot of building deformation
immediately following the earthquake (scaled up by a factor of 5): Downtown Los Angeles. Also shown are the time-
histories of the three components of the ground velocity and displacement (bandpass-filtered between 2 s and 1000 s),
and the east and north components of the penthouse displacement of the existing and redesigned building models.

8/13/2019 Kri05
http://slidepdf.com/reader/full/kri05 140/177

8/13/2019 Kri05
http://slidepdf.com/reader/full/kri05 141/177
123
−10 0 10 20 30 40 500
10
20
30
40
50
60
70
5.0%
4.0%
3.0%
2.0%
1.0%
A
−10 0 10 20 30 40 500
10
20
30
40
50
60
70
5.0%
4.0%
3.0%
2.0%
1.0%
B
−10 0 10 20 30 400
10
20
30
40
50
60
70
5.0%
4.0%
3.0%
2.0%
1.0%
C
−10 0 10 20 30 400
10
20
30
40
50
60
70
5.0%
4.0%
3.0%
2.0%
1.0%
D
Figure F.24: Plastic rotation in percent of a radian in the moment-frames of the existing building model: Downtown
Los Angeles – (A) Moment-frame along grid A (east-west direction); (B) Moment-frame along grid D (east-west
direction); (C) Moment-frame along grid 1 (north-south direction); (D) Moment-frame along grid 6 (north-south
direction). See Figure 2.2 for moment-frame configuration.

8/13/2019 Kri05
http://slidepdf.com/reader/full/kri05 142/177
124
−10 0 10 20 30 40 500
10
20
30
40
50
60
70
A
−10 0 10 20 30 40 500
10
20
30
40
50
60
70
B
−10 0 10 20 30 400
10
20
30
40
50
60
70
C
−10 0 10 20 30 400
10
20
30
40
50
60
70
D
Figure F.25: Beam bottom-flange weld fracture locations in the moment-frames of the existing building model: Down-
town Los Angeles – (A) Moment-frame along grid A (east-west direction); (B) Moment-frame along grid D (east-west
direction); (C) Moment-frame along grid 1 (north-south direction); (D) Moment-frame along grid 6 (north-south di-
rection). See Figure 2.2 for moment-frame configuration.
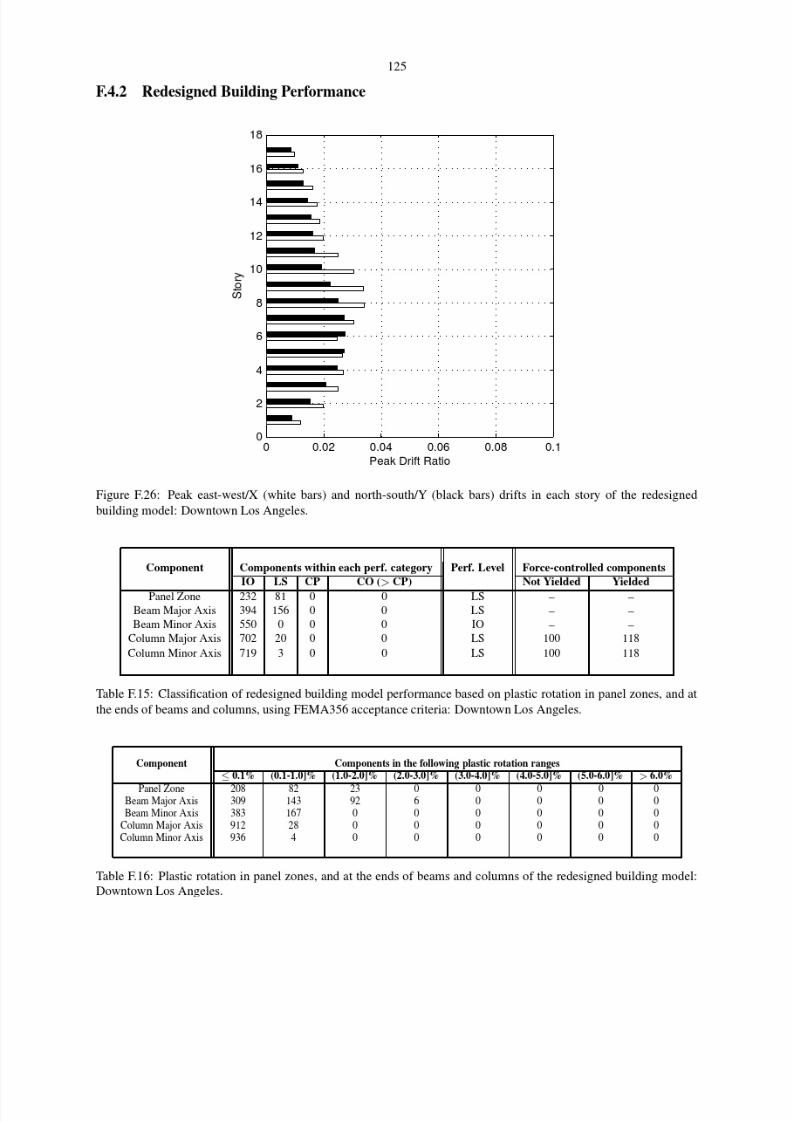
8/13/2019 Kri05
http://slidepdf.com/reader/full/kri05 143/177
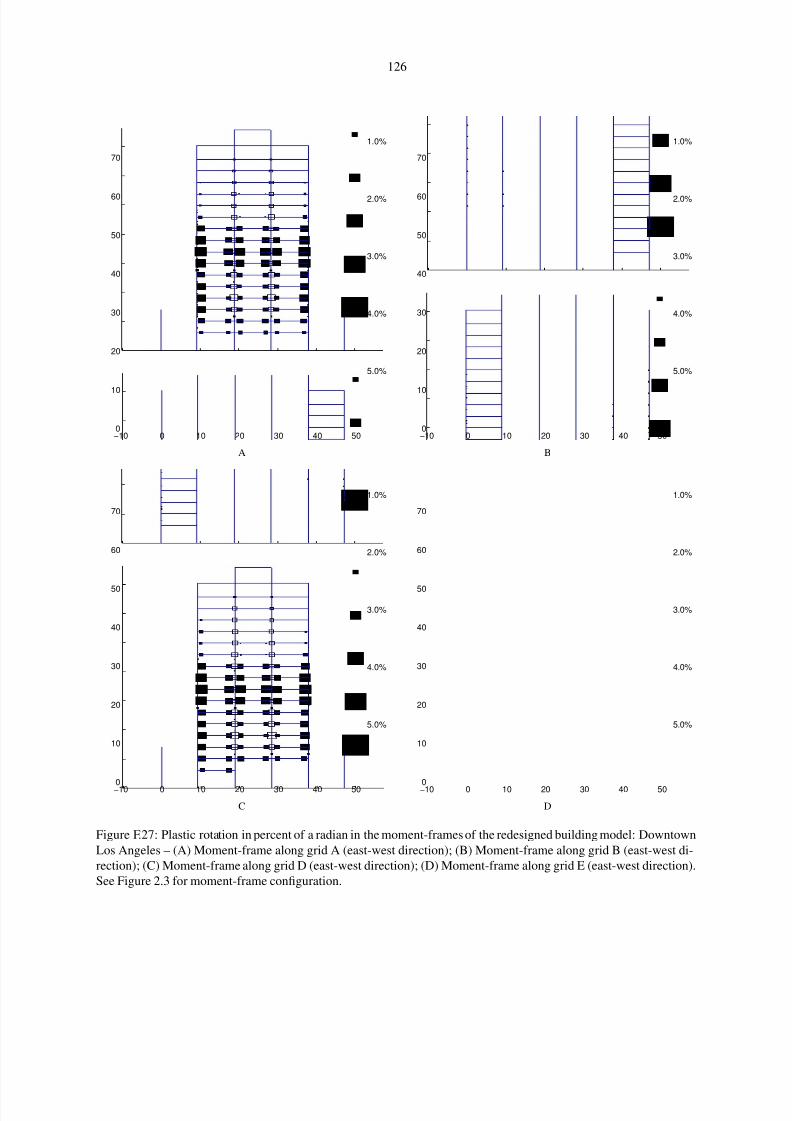
8/13/2019 Kri05
http://slidepdf.com/reader/full/kri05 144/177
126
−10 0 10 20 30 40 500
10
20
30
40
50
60
70
5.0%
4.0%
3.0%
2.0%
1.0%
A
−10 0 10 20 30 40 500
10
20
30
40
50
60
70
5.0%
4.0%
3.0%
2.0%
1.0%
B
−10 0 10 20 30 40 500
10
20
30
40
50
60
70
5.0%
4.0%
3.0%
2.0%
1.0%
C
−10 0 10 20 30 40 500
10
20
30
40
50
60
70
5.0%
4.0%
3.0%
2.0%
1.0%
D
Figure F.27: Plastic rotation in percent of a radian in the moment-frames of the redesigned building model: Downtown
Los Angeles – (A) Moment-frame along grid A (east-west direction); (B) Moment-frame along grid B (east-west di-
rection); (C) Moment-frame along grid D (east-west direction); (D) Moment-frame along grid E (east-west direction).
See Figure 2.3 for moment-frame configuration.

8/13/2019 Kri05
http://slidepdf.com/reader/full/kri05 145/177
127
−10 0 10 20 30 400
10
20
30
40
50
60
70
5.0%
4.0%
3.0%
2.0%
1.0%
A
−10 0 10 20 30 400
10
20
30
40
50
60
70
5.0%
4.0%
3.0%
2.0%
1.0%
B
−10 0 10 20 30 400
10
20
30
40
50
60
70
5.0%
4.0%
3.0%
2.0%
1.0%
C
−10 0 10 20 30 400
10
20
30
40
50
60
70
5.0%
4.0%
3.0%
2.0%
1.0%
D
Figure F.28: Plastic rotation in percent of a radian in the moment-frames of the redesigned building model: Downtown
Los Angeles – (A) Moment-frame along grid 1 (north-south direction); (B) Moment-frame along grid 2 (north-south
direction); (C) Moment-frame along grid 5 (north-south direction); (D) Moment-frame along grid 6 (north-south
direction). See Figure 2.3 for moment-frame configuration.

8/13/2019 Kri05
http://slidepdf.com/reader/full/kri05 146/177
128
F.5 Site: Baldwin Park (Latitude 34.09375, Longitude 118.00000)
0 20 40020
40
0
10
20
30
40
50
60
70
X (m)Y (m)
Z ( m )
0 20 40
0
10
20
30
40
50
60
70
Y (m)
Z ( m )
0 20 40
0
10
20
30
40
50
60
70
X (m)
Z ( m )
0 20 40−10
0
10
20
30
40
E
N
X (m)
Y ( m )
Existing Building: Isometric View,
Elevations, Plan, and Penthouse
Displacement Time Histories
0 20 40 60
−2
0
2 E Dis (m)
0 20 40 60
−2
0
2 N Dis (m)
0 20 40020
40
0
10
20
30
40
50
60
70
X (m)Y (m)
Z ( m )
0 20 40
0
10
20
30
40
50
60
70
Y (m)
Z ( m )
0 20 40
0
10
20
30
40
50
60
70
X (m)
Z ( m )
0 20 40−10
0
10
20
30
40
E
N
X (m)
Y ( m )
Redesigned Building: Isometric View,
Elevations, Plan, and Penthouse
Displacement Time Histories
0 20 40 60
−2
0
2 E Dis (m)
0 20 40 60
−2
0
2 N Dis (m)
Title: San Andreas Mw 7.9
Site: Baldwin Park
−1
0
1N Vel (m/s)
−1
0
1E Vel (m/s)
−1
0
1Z Vel (m/s)
−1
0
1N Disp (m)
−1
0
1E Disp (m)
0 20 40 60−1
0
1Z Disp (m)
(s)
Ground Velocity & Displacement
System Clock:63.54s
Figure F.29: M w7.9 earthquake (south-to-north rupture) on the San Andreas fault – snapshot of building deformation
immediately following the earthquake (scaled up by a factor of 5): Baldwin Park. Also shown are the time-histories
of the three components of the ground velocity and displacement (bandpass-filtered between 2 s and 1000 s), and the
east and north components of the penthouse displacement of the existing and redesigned building models.

8/13/2019 Kri05
http://slidepdf.com/reader/full/kri05 147/177
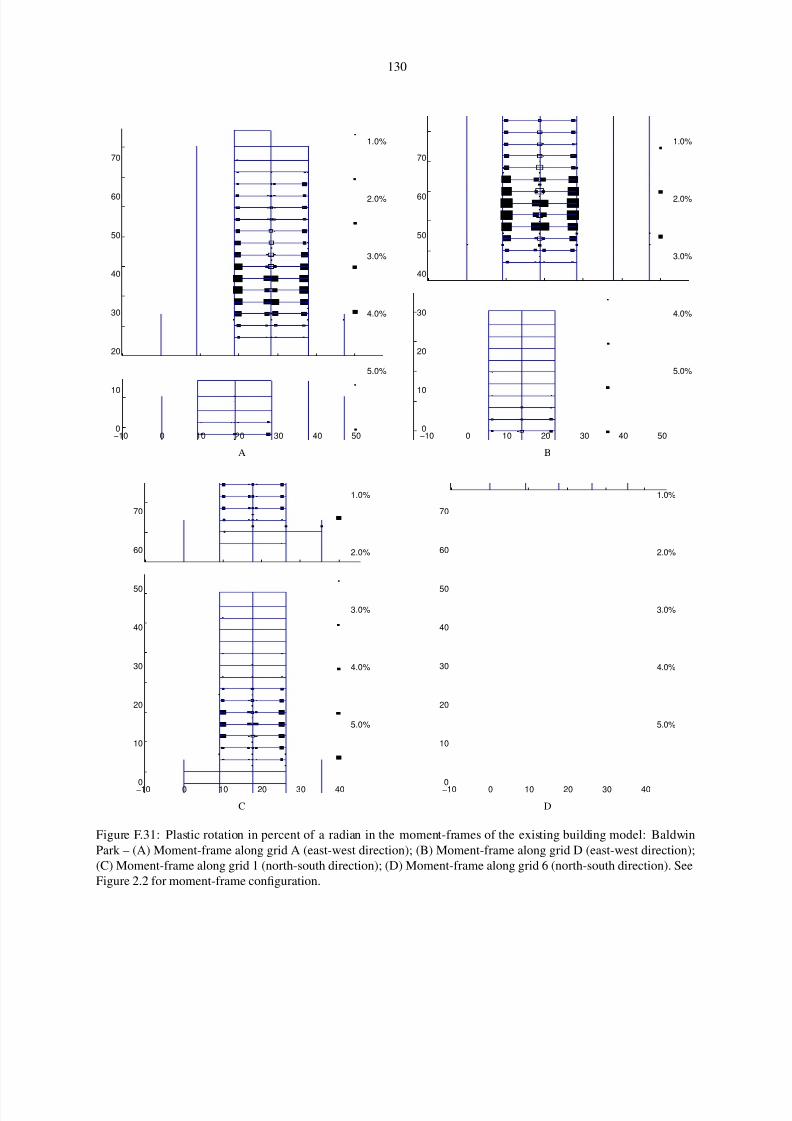
8/13/2019 Kri05
http://slidepdf.com/reader/full/kri05 148/177
130
−10 0 10 20 30 40 500
10
20
30
40
50
60
70
5.0%
4.0%
3.0%
2.0%
1.0%
A
−10 0 10 20 30 40 500
10
20
30
40
50
60
70
5.0%
4.0%
3.0%
2.0%
1.0%
B
−10 0 10 20 30 400
10
20
30
40
50
60
70
5.0%
4.0%
3.0%
2.0%
1.0%
C
−10 0 10 20 30 400
10
20
30
40
50
60
70
5.0%
4.0%
3.0%
2.0%
1.0%
D
Figure F.31: Plastic rotation in percent of a radian in the moment-frames of the existing building model: Baldwin
Park – (A) Moment-frame along grid A (east-west direction); (B) Moment-frame along grid D (east-west direction);
(C) Moment-frame along grid 1 (north-south direction); (D) Moment-frame along grid 6 (north-south direction). See
Figure 2.2 for moment-frame configuration.
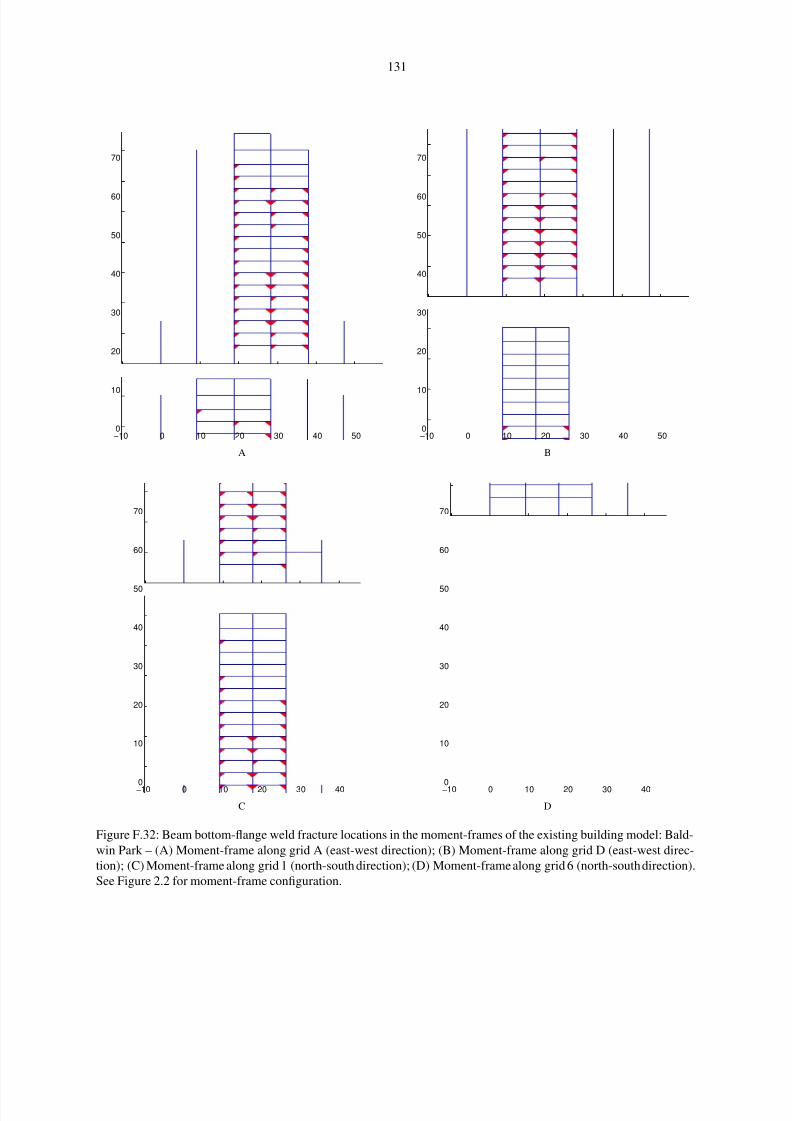
8/13/2019 Kri05
http://slidepdf.com/reader/full/kri05 149/177
131
−10 0 10 20 30 40 500
10
20
30
40
50
60
70
A
−10 0 10 20 30 40 500
10
20
30
40
50
60
70
B
−10 0 10 20 30 400
10
20
30
40
50
60
70
C
−10 0 10 20 30 400
10
20
30
40
50
60
70
D
Figure F.32: Beam bottom-flange weld fracture locations in the moment-frames of the existing building model: Bald-
win Park – (A) Moment-frame along grid A (east-west direction); (B) Moment-frame along grid D (east-west direc-
tion); (C) Moment-frame along grid 1 (north-south direction); (D) Moment-frame along grid 6 (north-south direction).
See Figure 2.2 for moment-frame configuration.

8/13/2019 Kri05
http://slidepdf.com/reader/full/kri05 150/177

8/13/2019 Kri05
http://slidepdf.com/reader/full/kri05 151/177
133
−10 0 10 20 30 40 500
10
20
30
40
50
60
70
5.0%
4.0%
3.0%
2.0%
1.0%
A
−10 0 10 20 30 40 500
10
20
30
40
50
60
70
5.0%
4.0%
3.0%
2.0%
1.0%
B
−10 0 10 20 30 40 500
10
20
30
40
50
60
70
5.0%
4.0%
3.0%
2.0%
1.0%
C
−10 0 10 20 30 40 500
10
20
30
40
50
60
70
5.0%
4.0%
3.0%
2.0%
1.0%
D
Figure F.34: Plastic rotation in percent of a radian in the moment-frames of the redesigned building model: Baldwin
Park – (A) Moment-frame along grid A (east-west direction); (B) Moment-frame along grid B (east-west direction);
(C) Moment-frame along grid D (east-west direction); (D) Moment-frame along grid E (east-west direction). See
Figure 2.3 for moment-frame configuration.
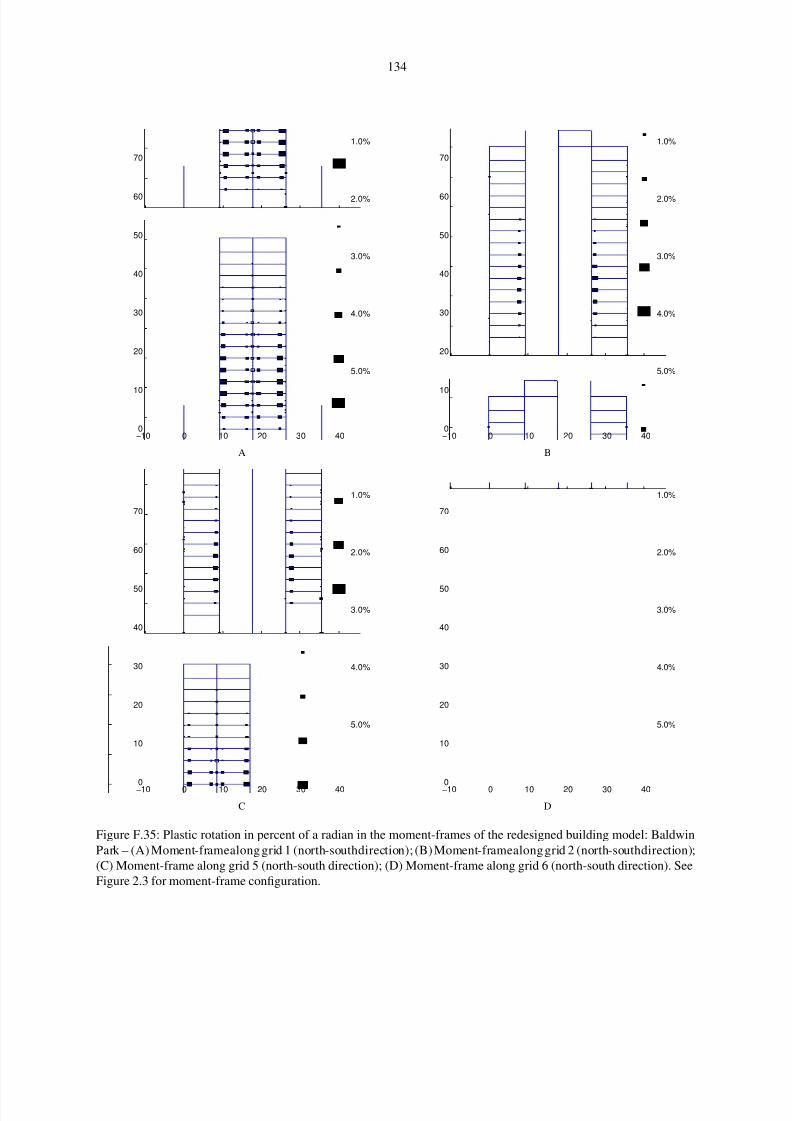
8/13/2019 Kri05
http://slidepdf.com/reader/full/kri05 152/177
134
−10 0 10 20 30 400
10
20
30
40
50
60
70
5.0%
4.0%
3.0%
2.0%
1.0%
A
−10 0 10 20 30 400
10
20
30
40
50
60
70
5.0%
4.0%
3.0%
2.0%
1.0%
B
−10 0 10 20 30 400
10
20
30
40
50
60
70
5.0%
4.0%
3.0%
2.0%
1.0%
C
−10 0 10 20 30 400
10
20
30
40
50
60
70
5.0%
4.0%
3.0%
2.0%
1.0%
D
Figure F.35: Plastic rotation in percent of a radian in the moment-frames of the redesigned building model: Baldwin
Park – (A) Moment-framealong grid 1 (north-southdirection); (B) Moment-framealong grid 2 (north-southdirection);
(C) Moment-frame along grid 5 (north-south direction); (D) Moment-frame along grid 6 (north-south direction). See
Figure 2.3 for moment-frame configuration.

8/13/2019 Kri05
http://slidepdf.com/reader/full/kri05 153/177
135
F.6 Site: Anaheim (Latitude 33.84375, Longitude 117.90625)
0 20 40020
40
0
10
20
30
40
50
60
70
X (m)Y (m)
Z ( m )
0 20 40
0
10
20
30
40
50
60
70
Y (m)
Z ( m )
0 20 40
0
10
20
30
40
50
60
70
X (m)
Z ( m )
0 20 40−10
0
10
20
30
40
E
N
X (m)
Y ( m )
Existing Building: Isometric View,
Elevations, Plan, and Penthouse
Displacement Time Histories
0 20 40 60
−2
0
2 E Dis (m)
0 20 40 60
−2
0
2 N Dis (m)
0 20 40020
40
0
10
20
30
40
50
60
70
X (m)Y (m)
Z ( m )
0 20 40
0
10
20
30
40
50
60
70
Y (m)
Z ( m )
0 20 40
0
10
20
30
40
50
60
70
X (m)
Z ( m )
0 20 40−10
0
10
20
30
40
E
N
X (m)
Y ( m )
Redesigned Building: Isometric View,
Elevations, Plan, and Penthouse
Displacement Time Histories
0 20 40 60
−2
0
2 E Dis (m)
0 20 40 60
−2
0
2 N Dis (m)
Title: San Andreas Mw 7.9
Site: Anaheim
−1
0
1N Vel (m/s)
−1
0
1E Vel (m/s)
−1
0
1Z Vel (m/s)
−1
0
1N Disp (m)
−1
0
1E Disp (m)
0 20 40 60−1
0
1Z Disp (m)
(s)
Ground Velocity & Displacement
System Clock:70.02s
Figure F.36: M w7.9 earthquake south-to-north rupture) on the San Andreas fault – snapshot of building deformation
immediately following the earthquake (scaled up by a factor of 5): Anaheim. Also shown are the time-histories of the
three components of the ground velocity and displacement (bandpass-filtered between 2 s and 1000 s), and the east
and north components of the penthouse displacement of the existing and redesigned building models.

8/13/2019 Kri05
http://slidepdf.com/reader/full/kri05 154/177

8/13/2019 Kri05
http://slidepdf.com/reader/full/kri05 155/177
137
−10 0 10 20 30 40 500
10
20
30
40
50
60
70
5.0%
4.0%
3.0%
2.0%
1.0%
A
−10 0 10 20 30 40 500
10
20
30
40
50
60
70
5.0%
4.0%
3.0%
2.0%
1.0%
B
−10 0 10 20 30 400
10
20
30
40
50
60
70
5.0%
4.0%
3.0%
2.0%
1.0%
C
−10 0 10 20 30 400
10
20
30
40
50
60
70
5.0%
4.0%
3.0%
2.0%
1.0%
D
Figure F.38: Plastic rotation in percent of a radian in the moment-frames of the existing building model: Anaheim
– (A) Moment-frame along grid A (east-west direction); (B) Moment-frame along grid D (east-west direction); (C)
Moment-frame along grid 1 (north-south direction); (D) Moment-frame along grid 6 (north-south direction). See
Figure 2.2 for moment-frame configuration.

8/13/2019 Kri05
http://slidepdf.com/reader/full/kri05 156/177
138
−10 0 10 20 30 40 500
10
20
30
40
50
60
70
A
−10 0 10 20 30 40 500
10
20
30
40
50
60
70
B
−10 0 10 20 30 400
10
20
30
40
50
60
70
C
−10 0 10 20 30 400
10
20
30
40
50
60
70
D
Figure F.39: Beam bottom-flange weld fracture locations in the moment-frames of the existing building model: Ana-
heim – (A) Moment-frame along grid A (east-west direction); (B) Moment-frame along grid D (east-west direction);
(C) Moment-frame along grid 1 (north-south direction); (D) Moment-frame along grid 6 (north-south direction). See
Figure 2.2 for moment-frame configuration.
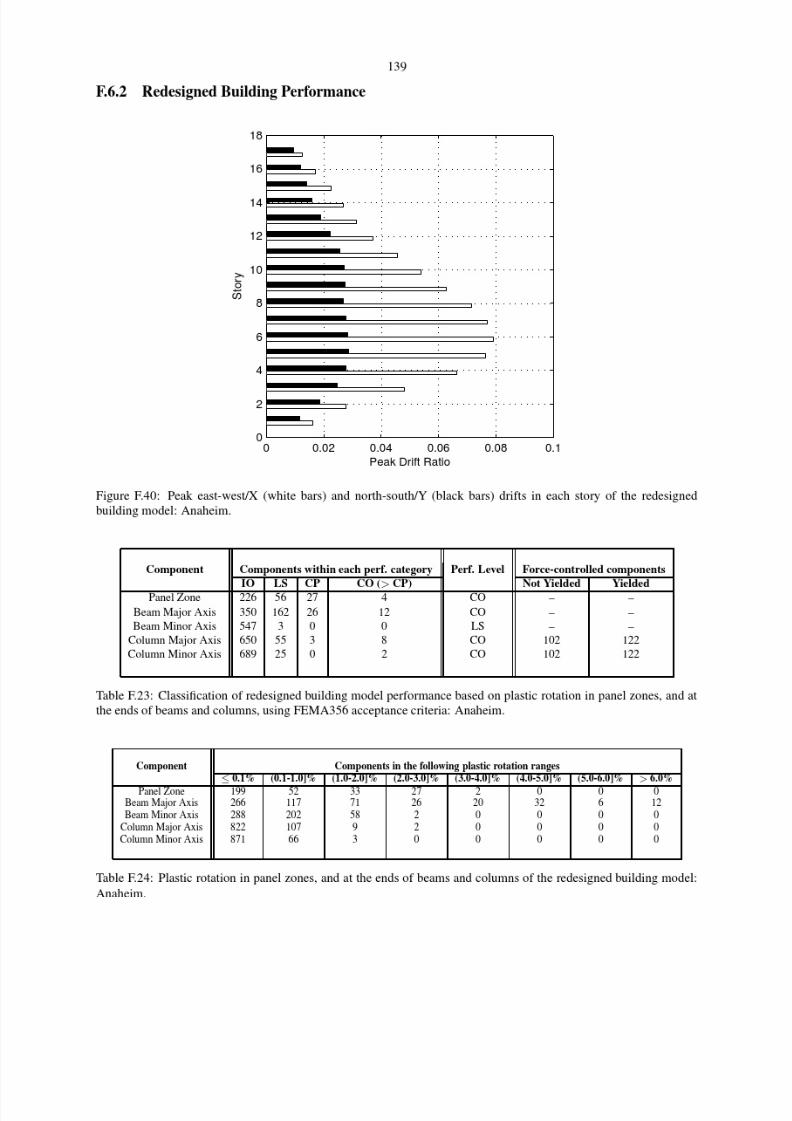
8/13/2019 Kri05
http://slidepdf.com/reader/full/kri05 157/177

8/13/2019 Kri05
http://slidepdf.com/reader/full/kri05 158/177
140
−10 0 10 20 30 40 500
10
20
30
40
50
60
70
5.0%
4.0%
3.0%
2.0%
1.0%
A
−10 0 10 20 30 40 500
10
20
30
40
50
60
70
5.0%
4.0%
3.0%
2.0%
1.0%
B
−10 0 10 20 30 40 500
10
20
30
40
50
60
70
5.0%
4.0%
3.0%
2.0%
1.0%
C
−10 0 10 20 30 40 500
10
20
30
40
50
60
70
5.0%
4.0%
3.0%
2.0%
1.0%
D
Figure F.41: Plastic rotation in percent of a radian in the moment-frames of the redesigned building model: Anaheim
– (A) Moment-frame along grid A (east-west direction); (B) Moment-frame along grid B (east-west direction); (C)
Moment-frame along grid D (east-west direction); (D) Moment-frame along grid E (east-west direction). See Figure
2.3 for moment-frame configuration.

8/13/2019 Kri05
http://slidepdf.com/reader/full/kri05 159/177
141
−10 0 10 20 30 400
10
20
30
40
50
60
70
5.0%
4.0%
3.0%
2.0%
1.0%
A
−10 0 10 20 30 400
10
20
30
40
50
60
70
5.0%
4.0%
3.0%
2.0%
1.0%
B
−10 0 10 20 30 400
10
20
30
40
50
60
70
5.0%
4.0%
3.0%
2.0%
1.0%
C
−10 0 10 20 30 400
10
20
30
40
50
60
70
5.0%
4.0%
3.0%
2.0%
1.0%
D
Figure F.42: Plastic rotation in percent of a radian in the moment-frames of the redesigned building model: Anaheim
– (A) Moment-frame along grid 1 (north-south direction); (B) Moment-frame along grid 2 (north-south direction);
(C) Moment-frame along grid 5 (north-south direction); (D) Moment-frame along grid 6 (north-south direction). See
Figure 2.3 for moment-frame configuration.

8/13/2019 Kri05
http://slidepdf.com/reader/full/kri05 160/177
142
F.7 Site: Long Beach (Latitude 33.78125, Longitude 118.18750)
0 20 40020
40
0
10
20
30
40
50
60
70
X (m)Y (m)
Z ( m )
0 20 40
0
10
20
30
40
50
60
70
Y (m)
Z ( m )
0 20 40
0
10
20
30
40
50
60
70
X (m)
Z ( m )
0 20 40−10
0
10
20
30
40
E
N
X (m)
Y ( m )
Existing Building: Isometric View,
Elevations, Plan, and Penthouse
Displacement Time Histories
0 20 40 60
−2
0
2 E Dis (m)
0 20 40 60
−2
0
2 N Dis (m)
0 20 40020
40
0
10
20
30
40
50
60
70
X (m)Y (m)
Z ( m )
0 20 40
0
10
20
30
40
50
60
70
Y (m)
Z ( m )
0 20 40
0
10
20
30
40
50
60
70
X (m)
Z ( m )
0 20 40−10
0
10
20
30
40
E
N
X (m)
Y ( m )
Redesigned Building: Isometric View,
Elevations, Plan, and Penthouse
Displacement Time Histories
0 20 40 60
−2
0
2 E Dis (m)
0 20 40 60
−2
0
2 N Dis (m)
Title: San Andreas Mw 7.9
Site: Long Beach
−1
0
1N Vel (m/s)
−1
0
1E Vel (m/s)
−1
0
1Z Vel (m/s)
−1
0
1N Disp (m)
−1
0
1E Disp (m)
0 20 40 60−1
0
1Z Disp (m)
(s)
Ground Velocity & Displacement
System Clock:70.02s
Figure F.43: M w7.9 earthquake (south-to-north rupture) on the San Andreas fault – snapshot of building deformation
immediately following the earthquake (scaled up by a factor of 5): Long Beach. Also shown are the time-histories of
the three components of the ground velocity and displacement (bandpass-filtered between 2 s and 1000 s), and the east
and north components of the penthouse displacement of the existing and redesigned building models.
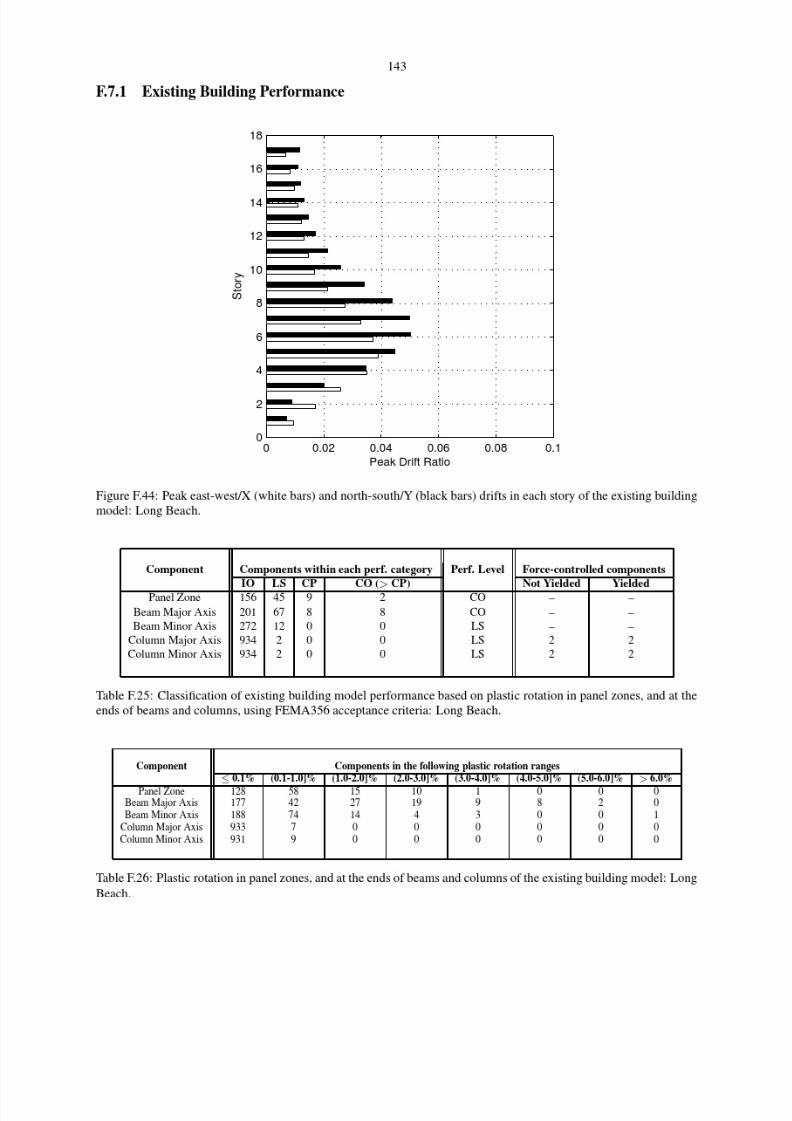
8/13/2019 Kri05
http://slidepdf.com/reader/full/kri05 161/177

8/13/2019 Kri05
http://slidepdf.com/reader/full/kri05 162/177
144
−10 0 10 20 30 40 500
10
20
30
40
50
60
70
5.0%
4.0%
3.0%
2.0%
1.0%
A
−10 0 10 20 30 40 500
10
20
30
40
50
60
70
5.0%
4.0%
3.0%
2.0%
1.0%
B
−10 0 10 20 30 400
10
20
30
40
50
60
70
5.0%
4.0%
3.0%
2.0%
1.0%
C
−10 0 10 20 30 400
10
20
30
40
50
60
70
5.0%
4.0%
3.0%
2.0%
1.0%
D
Figure F.45: Plastic rotation in percent of a radian in the moment-frames of the existing building model: Long Beach
– (A) Moment-frame along grid A (east-west direction); (B) Moment-frame along grid D (east-west direction); (C)
Moment-frame along grid 1 (north-south direction); (D) Moment-frame along grid 6 (north-south direction). See
Figure 2.2 for moment-frame configuration.
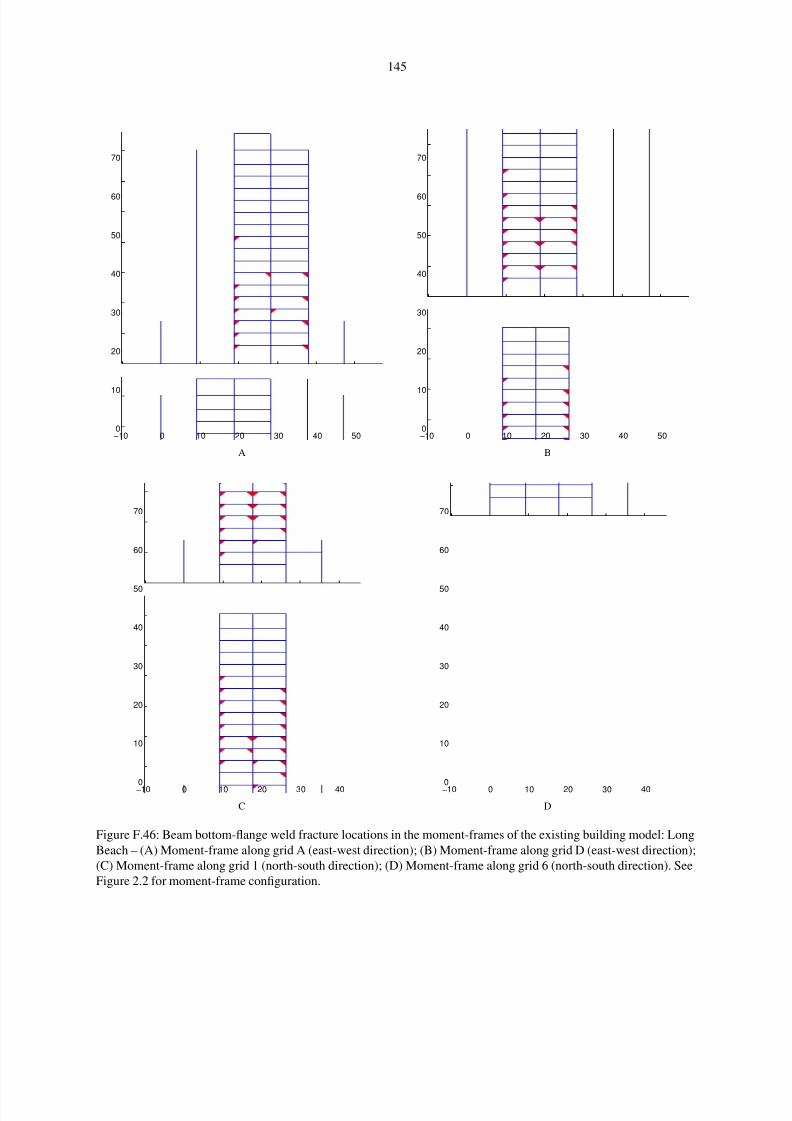
8/13/2019 Kri05
http://slidepdf.com/reader/full/kri05 163/177
145
−10 0 10 20 30 40 500
10
20
30
40
50
60
70
A
−10 0 10 20 30 40 500
10
20
30
40
50
60
70
B
−10 0 10 20 30 400
10
20
30
40
50
60
70
C
−10 0 10 20 30 400
10
20
30
40
50
60
70
D
Figure F.46: Beam bottom-flange weld fracture locations in the moment-frames of the existing building model: Long
Beach – (A) Moment-frame along grid A (east-west direction); (B) Moment-frame along grid D (east-west direction);
(C) Moment-frame along grid 1 (north-south direction); (D) Moment-frame along grid 6 (north-south direction). See
Figure 2.2 for moment-frame configuration.

8/13/2019 Kri05
http://slidepdf.com/reader/full/kri05 164/177

8/13/2019 Kri05
http://slidepdf.com/reader/full/kri05 165/177
147
−10 0 10 20 30 40 500
10
20
30
40
50
60
70
5.0%
4.0%
3.0%
2.0%
1.0%
A
−10 0 10 20 30 40 500
10
20
30
40
50
60
70
5.0%
4.0%
3.0%
2.0%
1.0%
B
−10 0 10 20 30 40 500
10
20
30
40
50
60
70
5.0%
4.0%
3.0%
2.0%
1.0%
C
−10 0 10 20 30 40 500
10
20
30
40
50
60
70
5.0%
4.0%
3.0%
2.0%
1.0%
D
Figure F.48: Plastic rotation in percent of a radian in the moment-frames of the redesigned building model: Long
Beach – (A) Moment-frame along grid A (east-west direction); (B) Moment-frame along grid B (east-west direction);
(C) Moment-frame along grid D (east-west direction); (D) Moment-frame along grid E (east-west direction). See
Figure 2.3 for moment-frame configuration.

8/13/2019 Kri05
http://slidepdf.com/reader/full/kri05 166/177
148
−10 0 10 20 30 400
10
20
30
40
50
60
70
5.0%
4.0%
3.0%
2.0%
1.0%
A
−10 0 10 20 30 400
10
20
30
40
50
60
70
5.0%
4.0%
3.0%
2.0%
1.0%
B
−10 0 10 20 30 400
10
20
30
40
50
60
70
5.0%
4.0%
3.0%
2.0%
1.0%
C
−10 0 10 20 30 400
10
20
30
40
50
60
70
5.0%
4.0%
3.0%
2.0%
1.0%
D
Figure F.49: Plastic rotation in percent of a radianin the moment-frames of the redesigned building model: Long Beach
– (A) Moment-frame along grid 1 (north-south direction); (B) Moment-frame along grid 2 (north-south direction); (C)
Moment-frame along grid 5 (north-south direction); (D) Moment-frame along grid 6 (north-south direction). See
Figure 2.3 for moment-frame configuration.

8/13/2019 Kri05
http://slidepdf.com/reader/full/kri05 167/177
149
F.8 Site: Santa Ana (Latitude 33.75000, Longitude 117.87500)
0 20 40020
40
0
10
20
30
40
50
60
70
X (m)Y (m)
Z ( m )
0 20 40
0
10
20
30
40
50
60
70
Y (m)
Z ( m )
0 20 40
0
10
20
30
40
50
60
70
X (m)
Z ( m )
0 20 40−10
0
10
20
30
40
E
N
X (m)
Y ( m )
Existing Building: Isometric View,
Elevations, Plan, and Penthouse
Displacement Time Histories
0 20 40 60
−2
0
2 E Dis (m)
0 20 40 60
−2
0
2 N Dis (m)
0 20 40020
40
0
10
20
30
40
50
60
70
X (m)Y (m)
Z ( m )
0 20 40
0
10
20
30
40
50
60
70
Y (m)
Z ( m )
0 20 40
0
10
20
30
40
50
60
70
X (m)
Z ( m )
0 20 40−10
0
10
20
30
40
E
N
X (m)
Y ( m )
Redesigned Building: Isometric View,
Elevations, Plan, and Penthouse
Displacement Time Histories
0 20 40 60
−2
0
2 E Dis (m)
0 20 40 60
−2
0
2 N Dis (m)
Title: San Andreas Mw 7.9
Site: Santa Ana
−1
0
1N Vel (m/s)
−1
0
1E Vel (m/s)
−1
0
1Z Vel (m/s)
−1
0
1N Disp (m)
−1
0
1E Disp (m)
0 20 40 60−1
0
1Z Disp (m)
(s)
Ground Velocity & Displacement
System Clock:70.02s
Figure F.50: M w7.9 earthquake (south-to-north rupture) on the San Andreas fault – snapshot of building deformation
immediately following the earthquake (scaled up by a factor of 5): Santa Ana. Also shown are the time-histories of
the three components of the ground velocity and displacement (bandpass-filtered between 2 s and 1000 s), and the east
and north components of the penthouse displacement of the existing and redesigned building models.
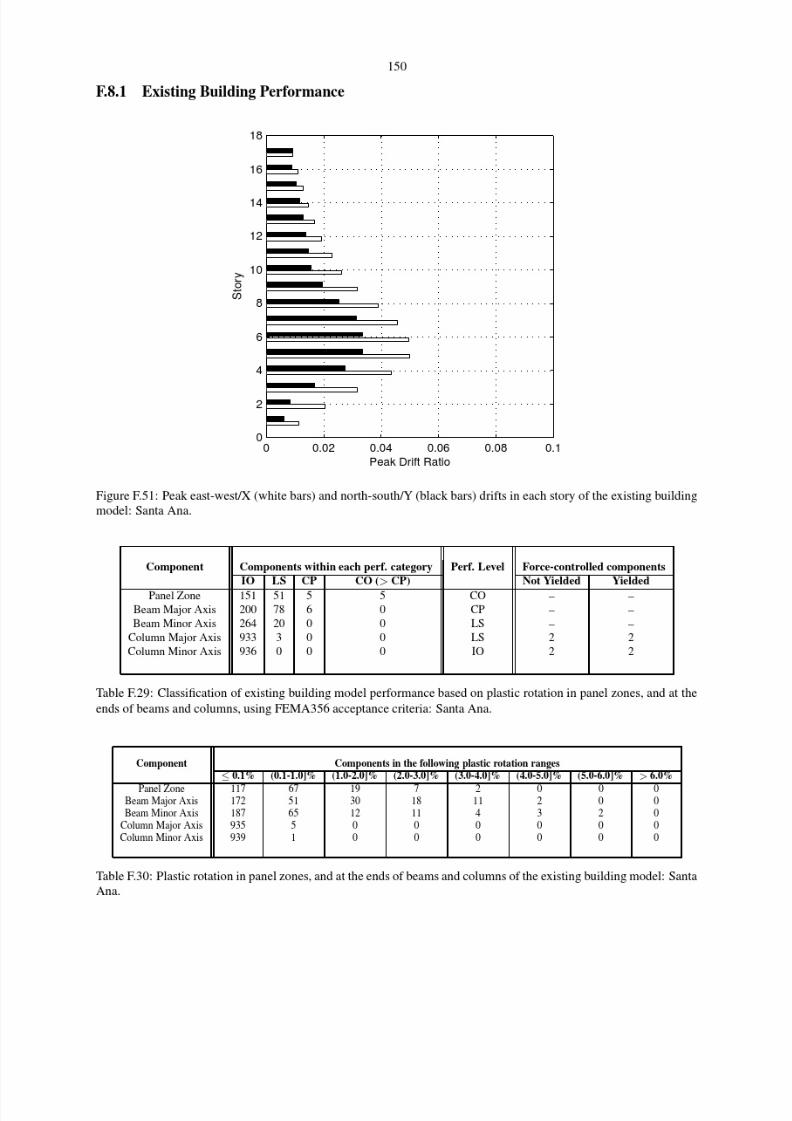
8/13/2019 Kri05
http://slidepdf.com/reader/full/kri05 168/177
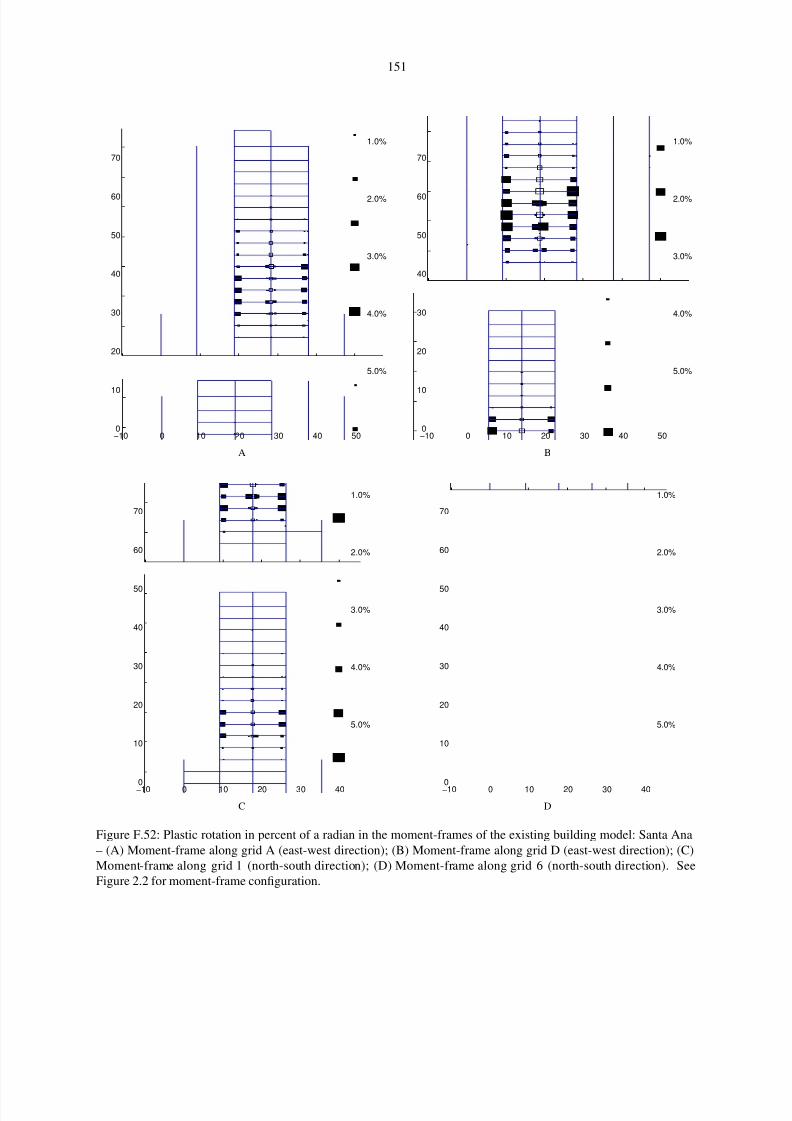
8/13/2019 Kri05
http://slidepdf.com/reader/full/kri05 169/177
151
−10 0 10 20 30 40 500
10
20
30
40
50
60
70
5.0%
4.0%
3.0%
2.0%
1.0%
A
−10 0 10 20 30 40 500
10
20
30
40
50
60
70
5.0%
4.0%
3.0%
2.0%
1.0%
B
−10 0 10 20 30 400
10
20
30
40
50
60
70
5.0%
4.0%
3.0%
2.0%
1.0%
C
−10 0 10 20 30 400
10
20
30
40
50
60
70
5.0%
4.0%
3.0%
2.0%
1.0%
D
Figure F.52: Plastic rotation in percent of a radian in the moment-frames of the existing building model: Santa Ana
– (A) Moment-frame along grid A (east-west direction); (B) Moment-frame along grid D (east-west direction); (C)
Moment-frame along grid 1 (north-south direction); (D) Moment-frame along grid 6 (north-south direction). See
Figure 2.2 for moment-frame configuration.

8/13/2019 Kri05
http://slidepdf.com/reader/full/kri05 170/177
152
−10 0 10 20 30 40 500
10
20
30
40
50
60
70
A
−10 0 10 20 30 40 500
10
20
30
40
50
60
70
B
−10 0 10 20 30 400
10
20
30
40
50
60
70
C
−10 0 10 20 30 400
10
20
30
40
50
60
70
D
Figure F.53: Beam bottom-flange weld fracture locations in the moment-frames of the existing building model: Santa
Ana – (A) Moment-frame along grid A (east-west direction); (B) Moment-frame along grid D (east-west direction);
(C) Moment-frame along grid 1 (north-south direction); (D) Moment-frame along grid 6 (north-south direction). See
Figure 2.2 for moment-frame configuration.

8/13/2019 Kri05
http://slidepdf.com/reader/full/kri05 171/177

8/13/2019 Kri05
http://slidepdf.com/reader/full/kri05 172/177
154
−10 0 10 20 30 40 500
10
20
30
40
50
60
70
5.0%
4.0%
3.0%
2.0%
1.0%
A
−10 0 10 20 30 40 500
10
20
30
40
50
60
70
5.0%
4.0%
3.0%
2.0%
1.0%
B
−10 0 10 20 30 40 500
10
20
30
40
50
60
70
5.0%
4.0%
3.0%
2.0%
1.0%
C
−10 0 10 20 30 40 500
10
20
30
40
50
60
70
5.0%
4.0%
3.0%
2.0%
1.0%
D
Figure F.55: Plastic rotation in percent of a radian in the moment-frames of the redesigned building model: Santa Ana
– (A) Moment-frame along grid A (east-west direction); (B) Moment-frame along grid B (east-west direction); (C)
Moment-frame along grid D (east-west direction); (D) Moment-frame along grid E (east-west direction). See Figure
2.3 for moment-frame configuration.

8/13/2019 Kri05
http://slidepdf.com/reader/full/kri05 173/177
155
−10 0 10 20 30 400
10
20
30
40
50
60
70
5.0%
4.0%
3.0%
2.0%
1.0%
A
−10 0 10 20 30 400
10
20
30
40
50
60
70
5.0%
4.0%
3.0%
2.0%
1.0%
B
−10 0 10 20 30 400
10
20
30
40
50
60
70
5.0%
4.0%
3.0%
2.0%
1.0%
C
−10 0 10 20 30 400
10
20
30
40
50
60
70
5.0%
4.0%
3.0%
2.0%
1.0%
D
Figure F.56: Plastic rotation in percent of a radian in the moment-frames of the redesigned building model: Santa Ana
– (A) Moment-frame along grid 1 (north-south direction); (B) Moment-frame along grid 2 (north-south direction);
(C) Moment-frame along grid 5 (north-south direction); (D) Moment-frame along grid 6 (north-south direction). See
Figure 2.3 for moment-frame configuration.
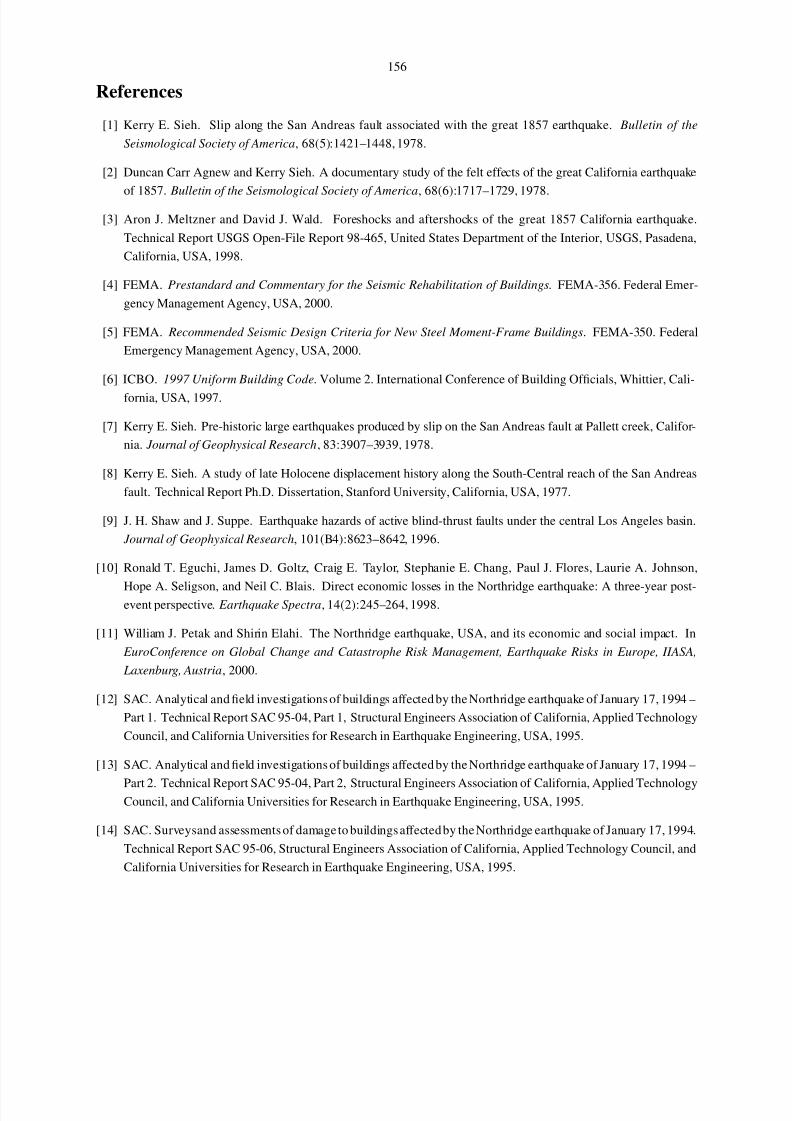
8/13/2019 Kri05
http://slidepdf.com/reader/full/kri05 174/177

8/13/2019 Kri05
http://slidepdf.com/reader/full/kri05 175/177
157
[15] EQE. The Northridge earthquake of January 17, 1994: Report of data collection and analysis, Part A: Damage
and inventory data. Technical Report EQE Project No. 36386.02, EQE International Inc. and The Geographic
Information Systems Group of the Governor’s Office of Emergency Services, California, USA, 1995.
[16] T. Heaton, J. Hall, D. Wald, and M. Halling. Response of high-rise and base-isolated buildings to a hypothetical
M w 7.0 blind thrust earthquake. Science, 267:206–211, 1995.
[17] J. Hall, T. Heaton, M. Halling, and D. Wald. Near-source ground motion and its effects on flexible buildings.
Earthquake Spectra, 11(4):569–605, 1995.
[18] John F. Hall. Seismic response of steel frame buildings to near-source ground motions. Earthquake Engineering
and Structural Dynamics, 27:1445–1464, 1998.
[19] K. B. Olsen, R. J. Archuleta, and J. R. Matarese. Three dimensional simulation of a magnitude 7.75 earthquake
on the San Andreas fault. Science, 270:1628–1632, 1995.
[20] Robert W. Graves. Three-dimensional finite-difference modeling of the San Andreas fault: Source parameteri-
zation and ground-motion levels. Bulletin of the Seismological Society of America, 88(4):881–897, 1998.
[21] Chen Ji, David J. Wald, and Don V. Helmberger. Source description of the 1999 Hector Mine, California,earthquake – Part I: Wavelet domain inversion theory and resolution analysis. Bulletin of the Seismological
Society of America, 92(4):1192–1207, 2002.
[22] Chen Ji, Y. Tan, Don Helmberger, and Jeroen Tromp. Modeling teleseismic P and SH static offsets for great
strike-slip earthquakes. In Proceedings of the American Geophysical Union Fall Meeting, USA, 2003.
[23] Dimitri Komatitsch, Qinya Liu, Jeroen Tromp, Peter Suss, Christiane Stidham, and John H. Shaw. Simulations of
ground motion in the Los Angeles basin based upon the spectral element method. Bulletin of the Seismological
Society of America, 94:187–206, 2004.
[24] Qinya Liu, Jascha Polet, Dimitri Komatitsch, and Jeroen Tromp. Spectral-element moment tensor inversions for
earthquakes in Southern California. Bulletin of the Seismological Society of America, 94(5):1748–1761, 2004.
[25] Dimitri Komatitsch and Jeroen Tromp. Introduction to the spectral element method for three-dimensional seismic
wave propagation. Geophys. J. Int., 139:806–822, 1999.
[26] Swaminathan Krishnan. Three-dimensional nonlinear analysis of tall irregular steel buildings subject to strong
ground motion. Technical Report EERL 2003-01, Earthquake Engineering Research Laboratory, California
Institute of Technology, Pasadena, California, USA, 2003.
[27] Anders Carlson. Three-dimensional nonlinear inelastic analysis of steel moment-frame buildings damaged by
earthquake excitations. Technical Report EERL 99-02, Earthquake Engineering Research Laboratory, California
Institute of Technology, Pasadena, California, USA, 1999.
[28] ICBO. 1982 Uniform Building Code. Volume 2. International Conference of Building Officials, Whittier, Cali-fornia, USA, 1982.
[29] M. P. Suss and J. H. Shaw. P-wave seismic velocity structure derived from sonic logs and industry reflection data
in the Los Angeles basin. Journal of Geophysical Research, 108(B3):Article no. 2170, 2003.
[30] Swaminathan Krishnan. FRAME3D – A program for three-dimensional nonlinear time-history analysis of steel
buildings: User guide. Technical Report EERL 2003-03, Earthquake Engineering Research Laboratory, Califor-
nia Institute of Technology, Pasadena, California, USA, 2003.

8/13/2019 Kri05
http://slidepdf.com/reader/full/kri05 176/177
158
[31] Swaminathan Krishnan and John F. Hall. Modeling steel frame buildings in three dimensions – Part I: Panel zone
and plastic hinge beam elements. Journal of Engineering Mechanics, ASCE (Scheduled for publication in April
2006), 2006.
[32] Swaminathan Krishnan and John F. Hall. Modeling steel frame buildings in three dimensions – Part II: Elastofiber
beam element and examples. Journal of Engineering Mechanics, ASCE (Scheduled for publication in April
2006), 2006.
[33] Norman A. Haskell. Crustal reflection of plane SH waves. Journal of Geophysical Research, pages 4147–4150,
1996.
[34] J. G. Anderson, Y. Lee, Y. Zeng, and S. M. Day. Control of strong motion by the upper 30 meters. Bulletin of
the Seismological Society of America, 86:1749–1759, 1996.
[35] M.D. Trifunac, M.I. Todorovska, and T.Y. Hao. Full-scale experimental studies of soil-structure interaction – a
review. In Proceedings of the Second US–Japan Workshop on Soil-Structure Interaction, Tsukuba City, Japan,
52 pages (published on CD-ROM), 2001.
[36] Jonathan P. Stewart, Raymond B. Seed, and Gregory L. Fenves. Empirical evaluation of inertial soil-structure
interaction effects. Technical Report PEER-98/07, Pacific Earthquake Engineering Center, University of Califor-
nia, Berkeley, California, USA, 1998.
[37] Giorgio Serino. Dynamic soil-structure interaction in building response from earthquake records. Technical
Report UCB/SEMM-1989/01, Department of Civil Engineering, University of California, Berkeley, California,
USA, 1989.
[38] Gregory L. Fenves and Giorgio Serino. Soil-structure interaction in buildings from earthquake records. Earth-
quake Spectra, 6(4):641–655, 1990.
[39] M.D. Trifunac, T.Y. Hao, and M.I. Todorovska. Response of a 14-story reinforced concrete structure to nine
earthquakes: 61 years of observation in the Hollywood storage building. Technical Report CE 01-02, Department
of Civil Engineering, University of Southern California, Los Angeles, California, USA, 2001.
[40] S. H. Hartzell, P. Liu, and C. Mendoza. The 1994 Northridge, California, earthquake: Investigation of rupture
velocity, rise time, and high-frequency radiation. Journal of Geophysical Research, 101(B9):20091–20108,1996.
[41] David J. Wald, Thomas H. Heaton, and Ken W. Hudnut. A dislocation model of the 1994 Northridge, California,
earthquake determined from strong-motion, GPS, and leveling-line data. Bulletin of the Seismological Society of
America, 86:S49–S70, 1996.
[42] R. Darragh, T. Cao, V. Graizer, A. Shakal, and M. Huang. Los Angeles code-instrumented building records from
the Northridge, California earthquake of January 17 1994: Processed release No. 1. Technical Report OSMS
94-17, California Strong Motion Instrumentation Program, California Department of Conservation, Division of
Mines and Geology (now California Geological Survey), California, USA, 1994.
[43] FEMA. Recommended Specifications and Quality Assurance Guidelines for Steel Moment-Frame Construction
for Seismic Applications. FEMA-353. Federal Emergency Management Agency, USA, 2000.
[44] Kerry E. Sieh, Minze Stuiver, and David Brillinger. A more precise chronology of earthquakes produced by the
San Andreas fault in southern California. Journal of Geophysical Research, 94:603–623, 1989.

8/13/2019 Kri05
http://slidepdf.com/reader/full/kri05 177/177
159
[45] Ray J. Weldon, Thomas E. Fumal, Glenn P. Biasi, and Katharine M. Scharer. Past and future earthquakes on the
San Andreas fault. Science, 308:966–967, 2005.
[46] Donna Eberhart-Phillips, Peter J. Haeussler, Jeffrey T. Freymueller, Arthur D. Frankel, Charles M. Rubin, Patricia
Craw, Natalia A. Ratchkovski, Greg Anderson, Gary A. Carver, Anthony J. Crone, Timothy E. Dawson, Hilary
Fletcher, Roger Hansen, Edwin L. Harp, Ruth A. Harris, David P. Hill, Sigrun Hreinsdottir, Randall W. Jibson,
Lucile M. Jones, Robert Kayen, David K. Keefer, Christopher F. Larsen, Seth C. Moran, Stephen F. Personius,George Plafker, Brian Sherrod, Kerry Sieh, Nicholas Sitar, and Wesley K. Wallace. The 2002 Denali fault
earthquake, Alaska: A large magnitude, slip-partitioned event. Science, 300:1113–1118, 2003.
[47] Chen Ji, Don V. Helmberger, T. Song, K. F. Ma, and David J. Wald. Co-seismic slip distribution and tectonic
implication of the 1999 Chi-Chi, Taiwan, earthquake. Geophysical Research Letters, 28(23):4379–4382, 2001.
[48] Shui-Beih Yu, Long-Chen Kuo, Ya-Ju Hsu, Hsuan-Han Su, Chi-Ching Lui, Chin-Shyong Hou, Jiin-Fa Lee,
Teng-Chang Lai, Chih-Chung Liu, Cheng-Lun Liu, Teh-Fu Tseng, Chun-Shyong Tsai, and Tzay-Chyn Shin.
Preseismic deformation and coseismic displacements associated with the 1999 Chi-Chi, Taiwan, earthquake.
Bulletin of the Seismological Society of America, 91(5):995–1012, 2001.
[49] H. Magistrale, K. McLaughlin, and S. Day. A geology based 3-D velocity model of the Los Angeles basinsediments. Bulletin of the Seismological Society of America, 86:1161–1166, 1996.
[50] H. Magistrale, S. Day, R. Clayton, and R. Graves. The SCEC southern California reference three-dimensional
seismic velocity model version 2 Bulletin of the Seismological Society of America 90(6B):S65–S76 2000


