Embed Size (px)
Citation preview
7/27/2019 Kyoto Protocol rev.doc
http://slidepdf.com/reader/full/kyoto-protocol-revdoc 1/23
Kyoto ProtocolFrom Wikipedia, the free encyclopedia
Participation in the Kyoto Protocol, as of December 2011,
Green = Countries that have signed and ratified the treaty
(Annex I & II countries in dark green)
Grey = Countries that have not yet decided [citation needed ][vague]
Brown = No intention to ratify at this stage. [1]
Blue = Canada, which withdrew from the Protocol in December 2011.[2]
Kyoto Parties with first period (2008-2012) greenhouse gas emissions limitations targets and the percentage
change in their carbon dioxide emissions from fuel combustion between 1990 and 2009. For more detailed
country/region information, see Kyoto Protocol and government action.
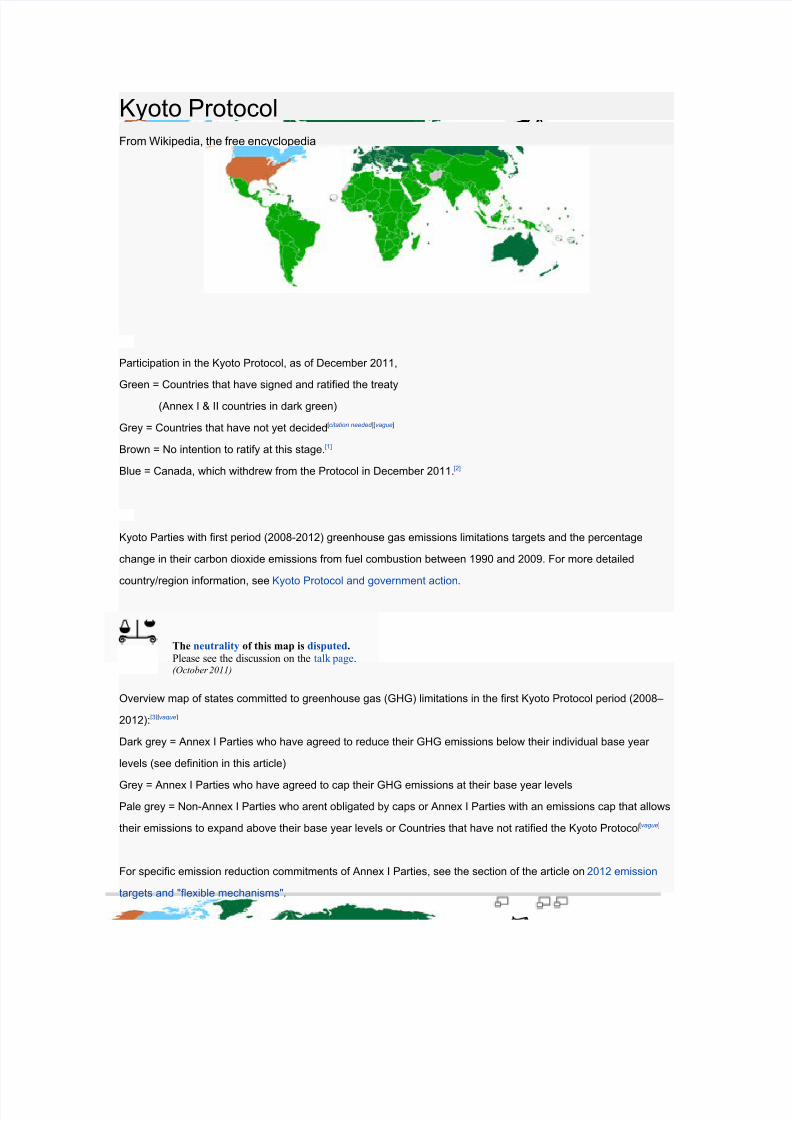
The neutrality of this map is disputed.
Please see the discussion on the talk page.(October 2011)
Overview map of states committed to greenhouse gas (GHG) limitations in the first Kyoto Protocol period (2008–
2012):[3][vague]
Dark grey = Annex I Parties who have agreed to reduce their GHG emissions below their individual base year
levels (see definition in this article)
Grey = Annex I Parties who have agreed to cap their GHG emissions at their base year levels
Pale grey = Non-Annex I Parties who arent obligated by caps or Annex I Parties with an emissions cap that allows
their emissions to expand above their base year levels or Countries that have not ratified the Kyoto Protocol [vague]
For specific emission reduction commitments of Annex I Parties, see the section of the article on 2012 emission
targets and "flexible mechanisms".
7/27/2019 Kyoto Protocol rev.doc
http://slidepdf.com/reader/full/kyoto-protocol-revdoc 2/23
EU-region as a whole has in accordance with the Kyoto Protocol committed itself to a 8% reduction, however many
memberstates (like Greece,Spain,Ireland and Sweden) have in the internal EU-distribution agreement not
committed themselves to any reduction. While France has committed itself not to expand its emissions (0%
reduction)[4]. As to Greenland: is partly committed through Denmark. However nothing states that Greenland has
committed itself to a reduction towards Denmark.
The Kyoto Protocol is a protocol to the United Nations Framework Convention on Climate
Change (UNFCCC or FCCC), aimed at fighting global warming. The UNFCCC is an
international environmental treaty with the goal of achieving the "stabilization of greenhouse
gas concentrations in the atmosphere at a level that would prevent dangerous anthropogenic
interference with the climate system."[5]
The Protocol was initially adopted on 11 December 1997 in Kyoto, Japan, and entered into force on 16
February 2005. As of September 2011, 191 states have signed and ratified the protocol.[6] The only
remaining signatory not to have ratified the protocol is the United States. Other states yet to ratify
Kyoto include Afghanistan, Andorra and South Sudan, after Somalia ratified the protocol on 26 July
2010.
Under the Protocol, 37 countries (" Annex I countries") commit themselves to a reduction of four
greenhouse gases (GHG) (carbon dioxide, methane, nitrous oxide, sulphur hexafluoride) and two
groups of gases (hydrofluorocarbons and perfluorocarbons) produced by them, and all member
countries give general commitments. Annex I countries agreed to reduce their collective greenhouse
gas emissions by 5.2% from the 1990 level. Emission limits do not include emissions by international
aviation and shipping, but are in addition to the industrial gases, chlorofluorocarbons, or CFCs, which
are dealt with under the 1987 Montreal Protocol on Substances that Deplete the Ozone Layer .
The benchmark 1990 emission levels accepted by the Conference of the Parties of UNFCCC (decision
2/CP.3) were the values of "global warming potential" calculated for the IPCC Second Assessment
Report.[7] These figures are used for converting the various greenhouse gas emissions into
comparable CO2 equivalents (CO2-eq) when computing overall sources and sinks.
The Protocol allows for several "flexible mechanisms", such as emissions trading, theclean
development mechanism (CDM) and joint implementation to allow Annex I countries to meet their
GHG emission limitations by purchasing GHG emission reductions credits from elsewhere, through
financial exchanges, projects that reduce emissions in non-Annex I countries, from other Annex I
countries, or from annex I countries with excess allowances.
Each Annex I country is required to submit an annual report of inventories of all anthropogenic
greenhouse gas emissions from sources and removals from sinks under UNFCCC and the Kyoto
Protocol. These countries nominate a person (called a "designated national authority") to create and
7/27/2019 Kyoto Protocol rev.doc
http://slidepdf.com/reader/full/kyoto-protocol-revdoc 3/23
manage its greenhouse gas inventory. Virtually all of the non-Annex I countries have also established
a designated national authority to manage its Kyoto obligations, specifically the "CDM process" that
determines which GHG projects they wish to propose for accreditation by the CDM Executive Board.
Contents
[hide]
1 Background
2 Objectives
3 2012 emission targets and "flexible mechanisms"
o 3.1 Flexible mechanisms
3.1.1 International Emissions Trading
3.1.1.1 Asia
3.1.1.2 Europe
3.1.1.3 North America
3.1.1.4 Oceania
3.1.1.5 Intergovernmental Emissions Trading
3.1.1.6 Green Investment Scheme
3.1.2 Clean Development Mechanism
3.1.3 Joint Implementation
o 3.2 Stabilization of GHG concentrations
4 Details of the agreement
o 4.1 Common but differentiated responsibility
4.1.1 Emissions
o 4.2 Financial commitments
o 4.3 Revisions
o 4.4 Enforcement
o 4.5 Negotiations
4.5.1 Base year
4.5.2 Emissions cuts
4.5.3 Flexibility mechanisms 4.5.4 Compliance
4.5.5 2000 onwards
o 4.6 Ratification process
5 Government action and emissions
o 5.1 Annex I
7/27/2019 Kyoto Protocol rev.doc
http://slidepdf.com/reader/full/kyoto-protocol-revdoc 4/23
5.1.1 Projections
5.1.2 Annex I Parties with targets
5.1.3 Annex I Parties without Kyoto targets
o 5.2 Non-Annex I
6 Cost estimates
7 Views on the Protocol
8 Withdrawal
9 Successor
10 See also
11 References
12 Further reading
13 External links
[edit]Background
Main article: Global warming
See also: global climate model#Projections of future climate change and Scientific opinion on climate
change
The view that human activities are likely responsible for most of the observed increase in global mean
temperature ("global warming") since the mid-20th century is an accurate reflection of current scientific
thinking (NRC, 2001, p. 3,[8] 2008, p. 2).[9] Human-induced warming of the climate is expected to
continue throughout the 21st century and beyond (NRC, 2008, p. 2).
IPCC (2007) produced a range of projections of what the future increase in global mean temperature
might be.[10] Projections spanned a range due to socio-economic uncertainties, e.g., over
future greenhouse gas (GHG) emission levels, and uncertainties with regard to physical science
aspects, e.g., the climate sensitivity. For the time period 2090–2099, measured from global mean
temperature in the period 1980–1999, the "likely" range (as assessed to have a greater than 66%
probability of being correct, based on expert judgement) across the six SRES "marker" emissions
scenarios was projected as an increase in global mean temperature of 1.1 to 6.4 °C.
The scientific question of what constitutes a "safe" level of atmospheric greenhouse gas
concentrations has been asked (NRC, 2001, p. 4). This question cannot be answered directly since it
requires value judgements of, for example, what would be an acceptable risk to human welfare. In
general, however, risks increase with both the rate and magnitude of future climate change.
[edit]Objectives
7/27/2019 Kyoto Protocol rev.doc
http://slidepdf.com/reader/full/kyoto-protocol-revdoc 5/23
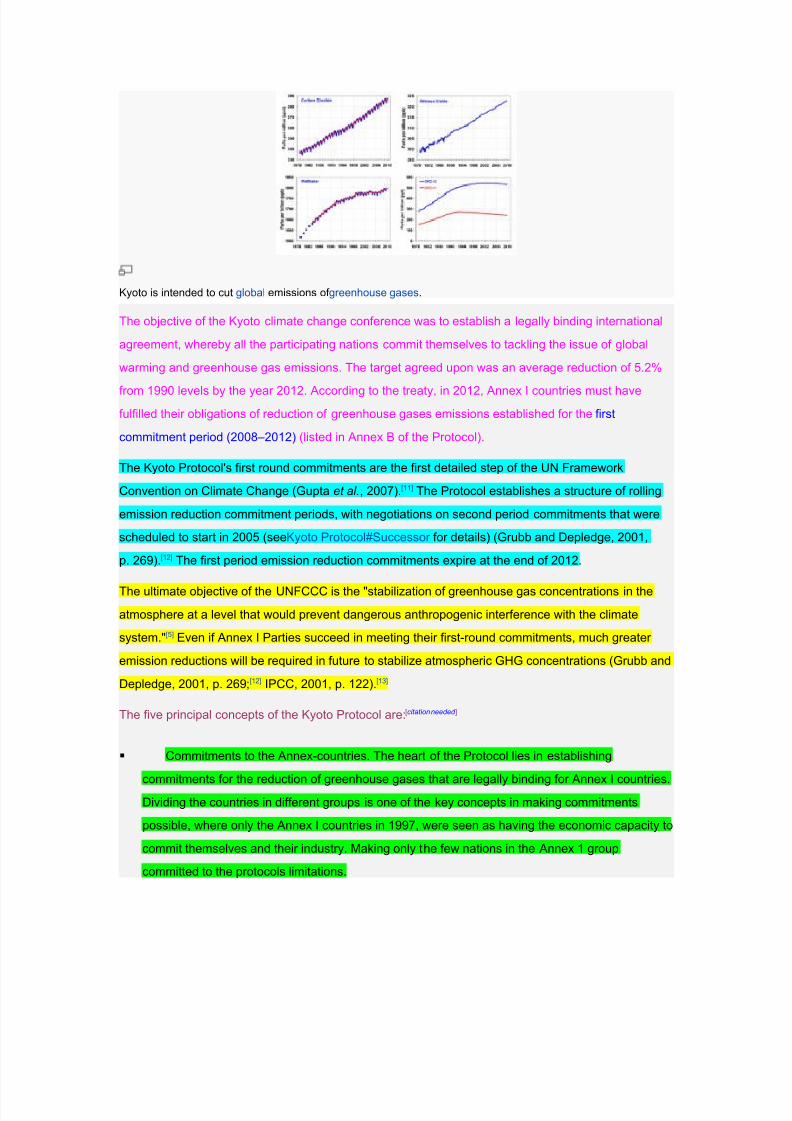
Kyoto is intended to cut global emissions of greenhouse gases.
The objective of the Kyoto climate change conference was to establish a legally binding international
agreement, whereby all the participating nations commit themselves to tackling the issue of global
warming and greenhouse gas emissions. The target agreed upon was an average reduction of 5.2%
from 1990 levels by the year 2012. According to the treaty, in 2012, Annex I countries must have
fulfilled their obligations of reduction of greenhouse gases emissions established for the first
commitment period (2008–2012) (listed in Annex B of the Protocol).
The Kyoto Protocol's first round commitments are the first detailed step of the UN Framework
Convention on Climate Change (Gupta et al., 2007).[11] The Protocol establishes a structure of rolling
emission reduction commitment periods, with negotiations on second period commitments that were
scheduled to start in 2005 (seeKyoto Protocol#Successor for details) (Grubb and Depledge, 2001,
p. 269).[12] The first period emission reduction commitments expire at the end of 2012.
The ultimate objective of the UNFCCC is the "stabilization of greenhouse gas concentrations in the
atmosphere at a level that would prevent dangerous anthropogenic interference with the climate
system."[5] Even if Annex I Parties succeed in meeting their first-round commitments, much greater
emission reductions will be required in future to stabilize atmospheric GHG concentrations (Grubb and
Depledge, 2001, p. 269;[12] IPCC, 2001, p. 122).[13]
The five principal concepts of the Kyoto Protocol are: [citation needed ]
Commitments to the Annex-countries. The heart of the Protocol lies in establishing
commitments for the reduction of greenhouse gases that are legally binding for Annex I countries.
Dividing the countries in different groups is one of the key concepts in making commitments
possible, where only the Annex I countries in 1997, were seen as having the economic capacity to
commit themselves and their industry. Making only the few nations in the Annex 1 group
committed to the protocols limitations.
7/27/2019 Kyoto Protocol rev.doc
http://slidepdf.com/reader/full/kyoto-protocol-revdoc 6/23
Implementation. In order to meet the objectives of the Protocol, Annex I countries are required to
prepare policies and measures for the reduction of greenhouse gases in their respective countries. In
addition, they are required to increase the absorption of these gases and utilize all mechanisms
available, such as joint implementation, the clean development mechanism and emissions trading, in
order to be rewarded with credits that would allow more greenhouse gas emissions at home.
Minimizing Impacts on Developing Countries by establishing an adaptation fund for climate
change.
• Accounting, Reporting and Review in order to ensure the integrity of the Protocol.
Compliance. Establishing a Compliance Committee to enforce compliance with the
commitments under the Protocol.
[edit]2012 emission targets and "flexible mechanisms"
Thirty-nine of the forty Annex I countries have ratified the Protocol. Of these, thirty-four have
committed themselves to a reduction of greenhouse gases (GHG) produced by them to targets that
are set in relation to their 1990 emission levels, in accordance with Annex B of the Protocol. The
targets apply to the four greenhouse gases carbon dioxide, methane, nitrous oxide, sulphur
hexafluoride, and two groups of gases, hydrofluorocarbons and perfluorocarbons. The six GHG are
translated into CO2 equivalents in determining reductions in emissions. These reduction targets are in
addition to the industrial gases, chlorofluorocarbons, or CFCs, which are dealt with under the
1987 Montreal Protocol on Substances that Deplete the Ozone Layer.
Under the Protocol, only the Annex I countries have committed themselves to national or joint
reduction targets, (formally called "quantified emission limitation and reduction objectives" (QELRO) –
Article 4.1) that range from a joint reduction of 8% for the European Union and others, to 7% for the
United States (non-binding as the US is not a signatory), 6% for Japan and 0% for Russia. The treaty
permits emission increases of 8% for Australia and 10% for Iceland. [14] Emission limits do not include
emissions by international aviation and shipping.
Annex I countries under the Kyoto Protocol, their 2012 commitments (% of 1990) and 1990 emission
levels (% of all Annex I countries) [show]
Annex I countries can achieve their targets by allocating reduced annual allowances to major
operators within their borders, or by allowing these operators to exceed their allocations by offsetting
any excess through a mechanism that is agreed by all the parties to the UNFCCC, such as by
buying emission allowancesfrom other operators which have excess emissions credits.
7/27/2019 Kyoto Protocol rev.doc
http://slidepdf.com/reader/full/kyoto-protocol-revdoc 7/23
38 of the 39 Annex I countries have agreed to cap their emissions in this way, two others are required
to do so under their conditions of accession into the EU, and one more (Belarus) is seeking to
become an Annex I country.
[edit]Flexible mechanisms
The Protocol defines three "flexibility mechanisms" that can be used by Annex I countries in meeting
their emission reduction commitments (Bashmakov et al.., 2001, p. 402).[15] The flexibility mechanisms
are International Emissions Trading (IET), the Clean Development Mechanism (CDM), and Joint
Implementation (JI). IET allows Annex I countries to "trade" their emissions ( Assigned Amount Units,
AAUs, or "allowances" for short). For IET, the economic basis for providing this flexibility is that
the marginal cost of emission abatement differs among countries. Trade could potentially allow the
Annex I countries to meet their emission reduction commitments at a reduced cost. This is because
trade allows emissions to be abated first in countries where the costs of abatement are lowest, thus
increasing the efficiency of the Kyoto agreement.
The CDM and JI are called "project-based mechanisms," in that they generate emission reductions
from projects. The difference between IET and the project-based mechanisms is that IET is based on
the setting of a quantitative restriction of emissions, while the CDM and JI are based on the idea of
"production" of emission reductions (Toth et al.., 2001, p. 660).[16] The CDM is designed to encourage
production of emission reductions in non-Annex I countries, while JI encourages production of
emission reductions in Annex I countries.
The production of emission reductions generated by the CDM and JI can be used by Annex B
countries in meeting their emission reduction commitments. The emission reductions produced by the
CDM and JI are both measured against a hypothetical baseline of emissions that would have occurred
in the absence of a particular emission reduction project. The emission reductions produced by the
CDM are called Certified Emission Reductions (CERs); reductions produced by JI are called Emission
Reduction Units (ERUs). The reductions are called "credits" because they are emission reductions
credited against a hypothetical baseline of emissions.[citation needed ]
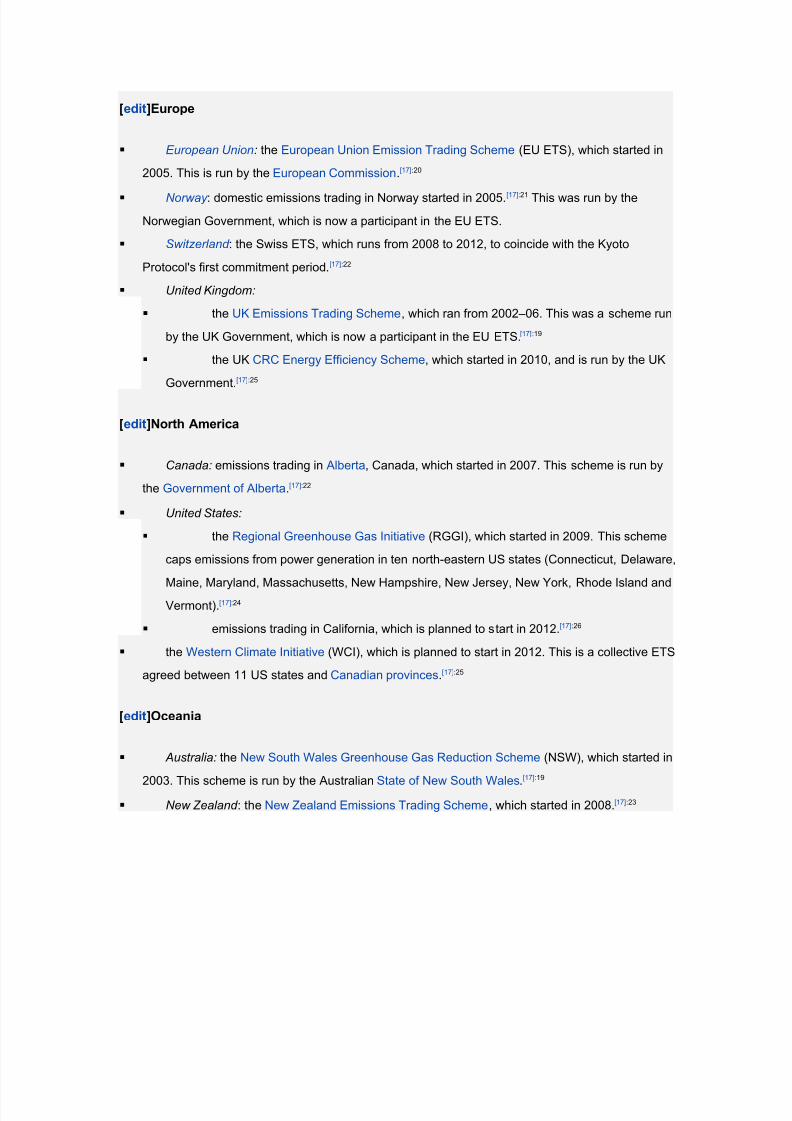
[edit]International Emissions Trading
Main articles: Emissions trading and Carbon emission trading
A number of emissions trading schemes (ETS) have been, or are planned to be, implemented.[17]:19–26
[edit]Asia
Japan: emissions trading in Tokyo started in 2010. This scheme is run by the Tokyo
Metropolitan Government.[17]:24
7/27/2019 Kyoto Protocol rev.doc
http://slidepdf.com/reader/full/kyoto-protocol-revdoc 8/23
[edit]Europe
European Union: the European Union Emission Trading Scheme (EU ETS), which started in
2005. This is run by the European Commission.[17]:20
Norway : domestic emissions trading in Norway started in 2005. [17]:21 This was run by the
Norwegian Government, which is now a participant in the EU ETS.
Switzerland : the Swiss ETS, which runs from 2008 to 2012, to coincide with the Kyoto
Protocol's first commitment period.[17]:22
United Kingdom:
the UK Emissions Trading Scheme, which ran from 2002–06. This was a scheme run
by the UK Government, which is now a participant in the EU ETS.[17]:19
the UK CRC Energy Efficiency Scheme, which started in 2010, and is run by the UK
Government.[17]:25
[edit]North America
Canada: emissions trading in Alberta, Canada, which started in 2007. This scheme is run by
the Government of Alberta.[17]:22
United States:
the Regional Greenhouse Gas Initiative (RGGI), which started in 2009. This scheme
caps emissions from power generation in ten north-eastern US states (Connecticut, Delaware,
Maine, Maryland, Massachusetts, New Hampshire, New Jersey, New York, Rhode Island and
Vermont).[17]:24
emissions trading in California, which is planned to start in 2012. [17]:26
the Western Climate Initiative (WCI), which is planned to start in 2012. This is a collective ETS
agreed between 11 US states and Canadian provinces.[17]:25
[edit]Oceania
Australia: the New South Wales Greenhouse Gas Reduction Scheme (NSW), which started in
2003. This scheme is run by the Australian State of New South Wales.
[17]:19
New Zealand : the New Zealand Emissions Trading Scheme, which started in 2008.[17]:23
7/27/2019 Kyoto Protocol rev.doc
http://slidepdf.com/reader/full/kyoto-protocol-revdoc 9/23
Intergovernmental Emissions Trading
The design of the European Union Emissions Trading Scheme (EU ETS) implicitly allows for trade of
national Kyoto obligations to occur between participating countries (Carbon Trust, 2009, p. 24).
[18] Carbon Trust (2009, pp. 24–25) found that other than the trading that occurs as part of the EU ETS,
no intergovernmental emissions trading had taken place.[18] One of the environmental problems with
IET is the large surplus of allowances that are available. Russia, Ukraine, and the new EU-12 member
states (the Kyoto Parties Annex I Economies-in-Transition, abbreviated "EIT": Belarus, Bulgaria,
Croatia, Czech Republic, Estonia, Hungary, Latvia, Lithuania, Poland, Romania, Russian Federation,
Slovakia, Slovenia, and Ukraine)[19]:59 have a surplus of allowances, while many OECD countries have
a deficit (Carbon Trust, 2009, p. 24). Some of the EITs with a surplus regard it as potential
compensation for the trauma of their economic restructuring. OECD countries with a deficit could meettheir Kyoto commitments by buying allowances from transition countries with a surplus. Unless other
commitments were made to reduce the total surplus in allowances, such trade would not actually result
in emissions being reduced (Carbon Trust, 2009, p. 25).
Green Investment Scheme
A Green Investment Scheme (GIS) refers to a plan for achieving environmental benefits from trading
‘hot air’ under the Kyoto Protocol. The Green Investment Scheme (GIS), a mechanism in the
framework of International Emission Trade (IET), is designed to achieve greater flexibility in reaching
the targets of the Kyoto Protocol while preserving environmental integrity of IET. Under the GIS a Party
to the Protocol expecting that the development of its economy will not exhaust its Kyoto quota, can sell
the excess of its Kyoto quota units (AAUs) to another Party. The proceeds from the AAU sales should
be “greened”, i.e. channeled to the development and implementation of the projects either acquiring
the greenhouse gases emission reductions (hard greening) or building up the necessary framework for
this process (soft greening). [18]:25
[edit]Clean Development Mechanism
Between 2001, which was the first year Clean Development Mechanism (CDM) projects could be
registered, and 2012, the end of the Kyoto commitment period, the CDM is expected to produce some
1.5 billion tons of carbon dioxide equivalent (CO2e) in emission reductions.[20] Most of these
reductions are through renewable energy, energy efficiency, and fuel switching (World Bank, 2010,
p. 262). By 2012, the largest potential for production of CERs are estimated in China (52% of total
CERs) and India (16%). CERs produced in Latin America and the Caribbean make up 15% of the
potential total, with Brazil as the largest producer in the region (7%).
7/27/2019 Kyoto Protocol rev.doc
http://slidepdf.com/reader/full/kyoto-protocol-revdoc 10/23
Joint Implementation
The formal crediting period for Joint Implementation (JI) was aligned with the first commitment
period of the Kyoto Protocol, and did not start until January 2008 (Carbon Trust, 2009, p. 20).[18] In November 2008, only 22 JI projects had been officially approved and registered. The total
projected emission savings from JI by 2012 are about one tenth that of the CDM. Russia accounts for
about two-thirds of these savings, with the remainder divided up roughly equally between the Ukraine
and the EU's New Member States. Emission savings include cuts in methane, HFC, and N2O
emissions.
Stabilization of GHG concentrations
IPCC (2001, p. 122) assessed how the Kyoto first-round emission reduction commitments might be
consistent with a long-term aim of stabilizing GHG concentrations in the atmosphere.[13] For a
450 ppmv target (energy-related CO2), some analysts suggested that the first-round Kyoto
commitments were inadequately stringent (IPCC, 2001, p. 122; Morita et al., 2001, pp. 152–153).
[21] The first-round Kyoto commitments were assessed to be consistent with emission trajectories
that achieve stabilization at 550 ppmv or higher. Other analysts suggested that the first-round
commitments could be weaker and still allow for a long-term 450 ppmv target (IPCC, 2001, p. 122).
Details of the agreement
According to a press release from the United Nations Environment Program:
"After 10 days of tough negotiations, ministers and other high-level officials from 160 countries
reached agreement this morning on a legally binding Protocol under which industrialized countries will
reduce their collective emissions of greenhouse gases by 5.2%. The agreement aims to lower overall
emissions from a group of six greenhouse gases by 2008–12, calculated as an average over these
five years. Cuts in the three most important gases – carbon dioxide (CO2), methane (CH4),
and nitrous oxide (N2O) – will be measured against a base year of 1990. Cuts in three long-lived
industrial gases – hydrofluorocarbons (HFCs), perfluorocarbons (PFCs), and sulphur
hexafluoride (SF6) – can be measured against either a 1990 or 1995 baseline."
National limitations range from 8% reductions for the European Union and others, to 7% for the US,
6% for Japan, 0% for Russia, and permitted increases of 8% for Australia and 10% for Iceland. [14]
The agreement supplements the United Nations Framework Convention on Climate
Change (UNFCCC) adopted at the Earth Summit in Rio de Janeiro in 1992, which did not set any
limitations or enforcement mechanisms. All parties to UNFCCC can sign or ratify the Kyoto Protocol,
7/27/2019 Kyoto Protocol rev.doc
http://slidepdf.com/reader/full/kyoto-protocol-revdoc 11/23
while non-parties to UNFCCC cannot. The Kyoto Protocol was adopted at the third session of the
Conference of Parties to the UNFCCC (COP 3) in 1997 in Kyoto, Japan. Most provisions of the Kyoto
Protocol apply to developed countries, listed in Annex I to UNFCCC.
National emission targets exclude international aviation and shipping. Kyoto Parties can use land use,
land use change, and forestry (LULUCF) in meeting their targets (Dessai, 2001, p. 3). [22] LULUCF
activities are also called "sink" activities. Changes in sinks and land use can have an effect on the
climate (IPCC, 2007).[23] Particular criteria apply to the definition of forestry under the Kyoto Protocol.
Forest management, cropland management, grazing land management, and revegetation are all
eligible LULUCF activities under the Protocol (Dessai, 2001, p. 9). Annex I Parties use of forestry
management in meeting their targets is capped.
Common but differentiated responsibility
UNFCCC adopts a principle of "common but differentiated responsibilities." The parties agreed that:
1. the largest share of historical and current global emissions of greenhouse gases originated in
developed countries;
2. per capita emissions in developing countries are still relatively low;
3. the share of global emissions originating in developing countries will grow to meet social and
development needs.[24]
[edit]Emissions
See also Greenhouse gas#Greenhouse gas emissions
Per-capita emissions are a country's total emissions divided by its population (Banuri et al.., 1996,
p. 95).[25] Per-capita emissions in the industrialized countries are typically as much as ten times the
average in developing countries (Grubb, 2003, p. 144).[26] This is one reason industrialized countries
accepted responsibility for leading climate change efforts in the Kyoto negotiations. In Kyoto, the
countries that took on quantified commitments for the first period (2008–12) corresponded roughly to
those with per-capita emissions in 1990 of two tonnes of carbon or higher. In 2005, the top-20 emitters
comprised 80% of total GHG emissions (PBL, 2010. See also the notes in the following section on the
top-ten emitters in 2005).[27] Countries with a Kyoto target made up 20% of total GHG emissions.
Another way of measuring GHG emissions is to measure the total emissions that have accumulated in
the atmosphere over time (IEA, 2007, p. 199).[28] Over a long time period, cumulative emissions
provide an indication of a country's total contribution to GHG concentrations in the atmosphere.
The International Energy Agency (IEA, 2007, p. 201) compared cumulative energy-related
CO2 emissions for several countries and regions.[28] Over the time period 1900–2005, the US
7/27/2019 Kyoto Protocol rev.doc
http://slidepdf.com/reader/full/kyoto-protocol-revdoc 12/23
accounted for 30% of total cumulative emissions; the EU, 23%; China, 8%; Japan, 4%; and India, 2%.
The rest of the world accounted for 33% of global, cumulative, energy-related CO2 emissions.
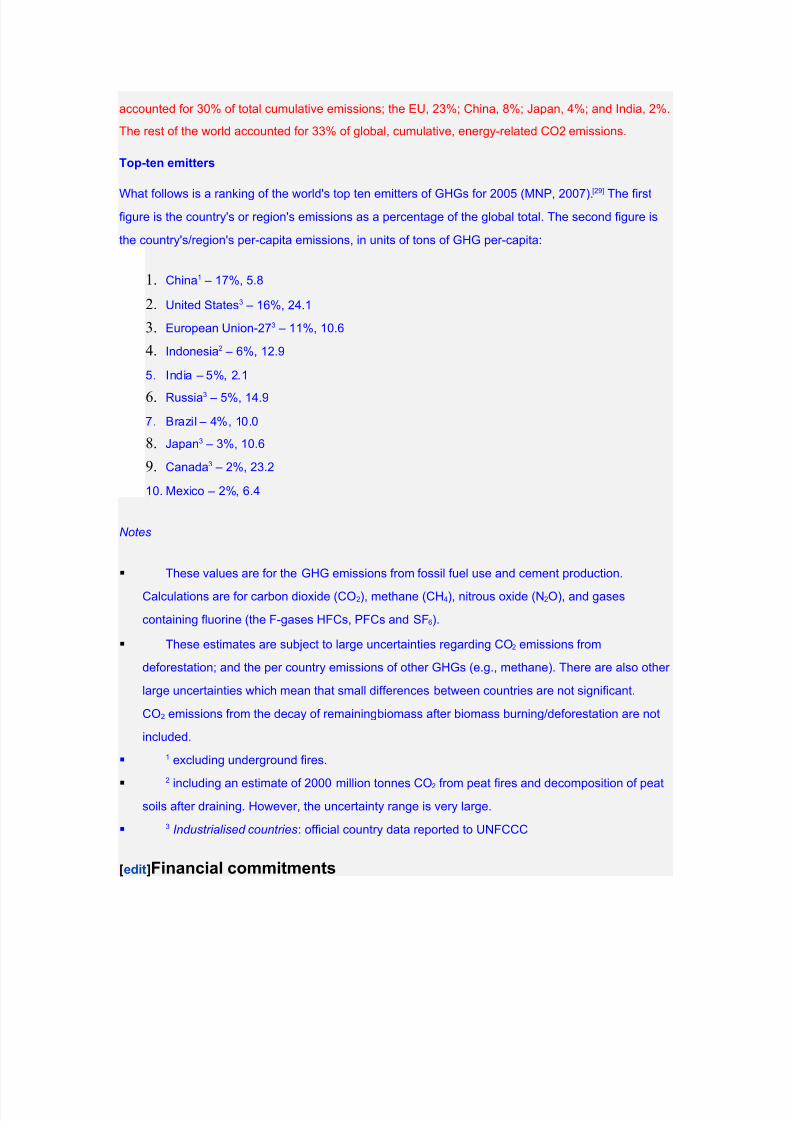
Top-ten emitters
What follows is a ranking of the world's top ten emitters of GHGs for 2005 (MNP, 2007).[29]
The first
figure is the country's or region's emissions as a percentage of the global total. The second figure is
the country's/region's per-capita emissions, in units of tons of GHG per-capita:
1. China1 – 17%, 5.8
2. United States3 – 16%, 24.1
3. European Union-273 – 11%, 10.6
4. Indonesia2 – 6%, 12.9
5. India – 5%, 2.1
6. Russia3 – 5%, 14.9
7. Brazil – 4%, 10.0
8. Japan3 – 3%, 10.6
9. Canada3 – 2%, 23.2
10. Mexico – 2%, 6.4
Notes
These values are for the GHG emissions from fossil fuel use and cement production.
Calculations are for carbon dioxide (CO2), methane (CH4), nitrous oxide (N2O), and gases
containing fluorine (the F-gases HFCs, PFCs and SF6).
These estimates are subject to large uncertainties regarding CO2 emissions from
deforestation; and the per country emissions of other GHGs (e.g., methane). There are also other
large uncertainties which mean that small differences between countries are not significant.
CO2 emissions from the decay of remainingbiomass after biomass burning/deforestation are not
included.
1 excluding underground fires.
2
including an estimate of 2000 million tonnes CO2 from peat fires and decomposition of peat
soils after draining. However, the uncertainty range is very large.
3 Industrialised countries: official country data reported to UNFCCC
[edit]Financial commitments
7/27/2019 Kyoto Protocol rev.doc
http://slidepdf.com/reader/full/kyoto-protocol-revdoc 13/23
The Protocol also reaffirms the principle that developed countries have to pay billions of dollars, and
supply technology to other countries for climate-related studies and projects. The principle was
originally agreed in UNFCCC. One of them is called The Adaptation Fund"[30]", that has been
established by the Parties to the Kyoto Protocol of the UN Framework Convention on Climate Change
to finance concrete adaptation projects and programmes in developing countries that are Parties to the
Kyoto Protocol.
Revisions
The protocol left several issues open to be decided later by the sixth Conference of Parties
(COP). COP6 attempted to resolve these issues at its meeting in the Hague in late 2000, but was
unable to reach an agreement due to disputes between the European Union on the one hand (which
favoured a tougher agreement) and the United States, Canada, Japan and Australia on the other
(which wanted the agreement to be less demanding and more flexible).
In 2001, a continuation of the previous meeting (COP6bis) was held in Bonn where the required
decisions were adopted. After some concessions, the supporters of the protocol (led by the European
Union) managed to get Japan and Russia in as well by allowing more use of carbon dioxide sinks.
COP7 was held from 29 October 2001 through 9 November 2001 in Marrakech to establish the final
details of the protocol.
The first Meeting of the Parties to the Kyoto Protocol (MOP1) was held in Montreal from 28
November to 9 December 2005, along with the 11th conference of the Parties to the UNFCCC
(COP11). See United Nations Climate Change Conference.
On 3 December 2007, Australia ratified the protocol during the first day of the COP13 in Bali.
Of the signatories, 36 developed C.G. countries (plus the EU as a party in the European
Union)agreed to a 10% emissions increase for Iceland; but, since the EU's member states each
have individual obligations,[31] much larger increases (up to 27%) are allowed for some of the less
developed EU countries (see below Kyoto Protocol#Increase in greenhouse gas emission
since 1990).[32] Reduction limitations expire in 2013.
Enforcement
If the enforcement branch determines that an annex I country is not in compliance with its emissions
limitation, then that country is required to make up the difference during the second commitment
period plus an additional 30%. In addition, that country will be suspended from making transfers under
an emissions trading program.[33]
Negotiations
7/27/2019 Kyoto Protocol rev.doc
http://slidepdf.com/reader/full/kyoto-protocol-revdoc 14/23
Article 4.2 of the UNFCCC commits industrialized countries to "[take] the lead" in reducing emissions
(Grubb, 2003, p. 144).[26] The initial aim was for industrialized countries to stabilize their emissions at
1990 levels by the year 2000. The failure of key industrialized countries to move in this direction was a
principal reason why Kyoto moved to binding commitments.
At the first UNFCCC Conference of the Parties in Berlin, the G77 (a lobbying group that represents
133 developing countries, of which China is an associate (Dessai, 2001, p. 4)) [22] was able to push for
a mandate where it was recognized that (Liverman, 2008, p. 12):[34]
developed nations had contributed most to the then-current concentrations of GHGs in the
atmosphere
developing country emissions per-capita were still relatively low
and that the share of global emissions from developing countries would grow to meet their
development needs.
This mandate was recognized in the Kyoto Protocol in that developing countries were not subject to
emission reduction commitments in the first Kyoto commitment period. However, the large potential for
growth in developing country emissions made negotiations on this issue tense (Grubb, 2003, pp. 145–
146). In the final agreement, the Clean Development Mechanism was designed to limit emissions in
developing countries, but in such a way that developing countries do not bear the costs for limiting
emissions. The general assumption was that developing countries would face quantitative
commitments in later commitment periods, and at the same time, developed countries would meet
their first round commitments.
[edit]Base year
The choice of the 1990 main base year remains in Kyoto, as it does in the original Framework
Convention. The desire to move to historical emissions was rejected on the basis that good data was
not available prior to 1990. The 1990 base year also favoured several powerful interests including the
UK, Germany and Russia (Liverman, 2008, p. 12).[34] This is because the UK and Germany had high
CO2 emissions in 1990.
In the UK following 1990, emissions had declined because of a switch from coal to gas ("dash for
gas"), which has lower emissions than coal. This was due to the UK's privatization of coal mining and
its switch to natural gas supported by North sea reserves. Germany benefitted from the 1990 base
year because of its reunification between West and East Germany. East Germany's emissions fell
dramatically following the collapse of East German industry after the fall of the Berlin Wall. Germany
could therefore take credit for the resultant decline in emissions.
7/27/2019 Kyoto Protocol rev.doc
http://slidepdf.com/reader/full/kyoto-protocol-revdoc 15/23
Japan promoted the idea of flexible baselines, and favoured a base year of 1995 for HFCs. Their HFC
emissions had grown in the early 1990s as a substitute for CFCs banned in the Montreal Protocol
(Liverman, 2008, p. 13). Some of the former Soviet satellites wanted a base year to reflect their
highest emissions prior to their industrial collapse.
EIT countries are privileged by being able to choose their base-year nearly freely. [citation needed ] However
the oldest base-year accepted is 1986.[citation needed ]
Emissions cuts
The G77 wanted strong uniform emission cuts across the developed world of 15% (Liverman, 2008,
p. 13).[34] Countries, such as the US, made suggestions to reduce their responsibility to reduce
emissions. These suggestions included:
the inclusion of carbon sinks (e.g., by including forests, that absorb CO2 from the
atmosphere).
and having net current emissions as the basis for responsibility, i.e., ignoring historical
emissions.
The US originally proposed for the second round of negotiations on Kyoto commitments to follow the
negotiations of the first (Grubb, 2003, p. 148). [26] In the end, negotiations on the second period were
set to open no later than 2005. Countries over-achieving in their first period commitments can "bank"
their unused allowances for use in the subsequent period.
The EU initially argued for only three GHGs to be included – CO2, CH4, and N2O – with other gases
such as HFCs regulated separately (Liverman, 2008, p. 13). The EU also wanted to have a "bubble"
commitment, whereby it could make a collective commitment that allowed some EU members to
increase their emissions, while others cut theirs. The most vulnerable nations – the Alliance of Small
Island States (AOSIS) – pushed for deep uniform cuts by developed nations, with the goal of having
emissions reduced to the greatest possible extent.
The final days of negotiation of the Protocol saw a clash between the EU and the US and Japan
(Grubb, 2003, p. 149). The EU aimed for flat-rate reductions in the range of 10–15% below 1990
levels, while the US and Japan supported reductions of 0–5%. Countries that had supported
differentiation had different ideas as to how it should be calculated, and many different indicators were
proposed: relating to GDP, energy intensity (energy use per unit of economic output), etc. According to
Grubb (2003, p. 149), the only common theme of these indicators was that each proposal suited the
interests of the country making the proposal.
7/27/2019 Kyoto Protocol rev.doc
http://slidepdf.com/reader/full/kyoto-protocol-revdoc 16/23
The final commitments negotiated in the Protocol are the result of last minute political compromises
(Liverman, 2008, pp. 13–14). These include an 8% cut from the 1990 base year for the EU, 7% for the
US, 6% for Canada and Japan, no cut for Russia, and an 8% increase for Australia. This sums to an
overall cut of 5.2% below 1990 levels. Since Australia and the US did not ratify the treaty (although
Australia has since done), the cut is reduced from 5.2% to about 2%.
Considering the growth of some economies and the collapse of others since 1990, the range of implicit
targets is much greater (Aldy et al., 2003, p. 7).[35] The US faced a cut of about 30% below "business-
as-usual" (BAU) emissions (i.e., predicted emissions should there be no attempt to limit emissions),
while Russia and other economies in transition faced targets that allowed substantial increases in their
emissions above BAU. On the other hand, Grubb (2003, p. 151) pointed out that the US, having per-
capita emissions twice that of most other OECD countries, was vulnerable to the suggestion that it had
huge potential for making reductions. From this viewpoint, the US was obliged to cut emissions back
more than other countries.
Flexibility mechanisms
Negotiations over the flexibility mechanisms included in the Protocol proved controversial (Grubb,
2003, p. 153).[26] Japan and some EU member states wanted to ensure that any emissions trading
would be competitive and transparent. Their intention was to prevent the US from using its political
leverage to gain preferential access to the likely surplus in Russian emission allowances. The EU was
also anxious to prevent the US from avoiding domestic action to reduce its emissions. Developing
countries were concerned that the US would use flexibility to its own advantage, over the interests of
weaker countries.
Compliance
The protocol defines a mechanism of "compliance" as a "monitoring compliance with the commitments
and penalties for non-compliance."[36] According to Grubb (2003, p. 157), the explicit consequences of
non-compliance of the treaty are weak compared to domestic law.[26] Yet, the compliance section of the
treaty was highly contested in the Marrakesh Accords. According to Grubb (2003), Japan made some
unsuccessful efforts to "water-down" the compliance package.
2000 onwards
When George W. Bush was elected US president in 2000, he was asked by US Senator Hagel what
his administration's position was on climate change. Bush replied that he took climate change "very
seriously," but that he opposed the Kyoto treaty, because "it exempts 80% of the world, including
major population centers such as China and India, from compliance, and would cause serious harm to
the US economy" (Dessai, 2001, p. 5). [22] Almost all world leaders (e.g., China, Japan, South Africa,
7/27/2019 Kyoto Protocol rev.doc
http://slidepdf.com/reader/full/kyoto-protocol-revdoc 17/23
Pacific islands) expressed their disappointment over President Bush's decision not to support the
treaty (Dessai, 2001, p. 6).
In order for the Protocol to enter into legal effect, it was required that the Protocol was ratified by 55
Parties including 55% of 1990 Annex I emissions (Dessai, 2001, p. 3). [22] The US accounted for 36% of
emissions in 1990, and without US ratification, only an EU+Russia+Japan+small party coalition could
place the treaty into legal effect. A deal was reached in the Bonn climate talks (COP-6.5), held in 2001.
According to the EU, the Kyoto Protocol had been saved (Dessai, 2001, p. 8). For the G77/China, the
Bonn agreement represented the "triumph of multilateralism over unilateralism" (Dessai, 2001, p. 8).
Ratification process
This section requires expansion.
The Protocol was adopted by COP 3 on 11 December 1997 in Kyoto, Japan. It was opened on 16
March 1998 for signature by parties to UNFCCC.
[show]
Article 25 of the Protocol specifies that the Protocol enters into force "on the ninetieth day after the
date on which not less than 55 Parties to the Convention, incorporating Parties included in Annex I
which accounted in total for at least 55% of the total carbon dioxide emissions for 1990 of the Annex I
countries, have deposited their instruments of ratification, acceptance, approval or accession."
The EU and its Member States ratified the Protocol in May 2002.[37] Of the two conditions, the "55
parties" clause was reached on 23 May 2002 when Icelandratified the Protocol. The ratificationby Russia on 18 November 2004 satisfied the "55%" clause and brought the treaty into force, effective
16 February 2005, after the required lapse of 90 days.
As of November 2009, 187 countries and one regional economic organization (the EC) have ratified
the agreement, representing over 63.9% of the 1990 emissions from Annex I countries. [38]
Government action and emissions
7/27/2019 Kyoto Protocol rev.doc
http://slidepdf.com/reader/full/kyoto-protocol-revdoc 18/23
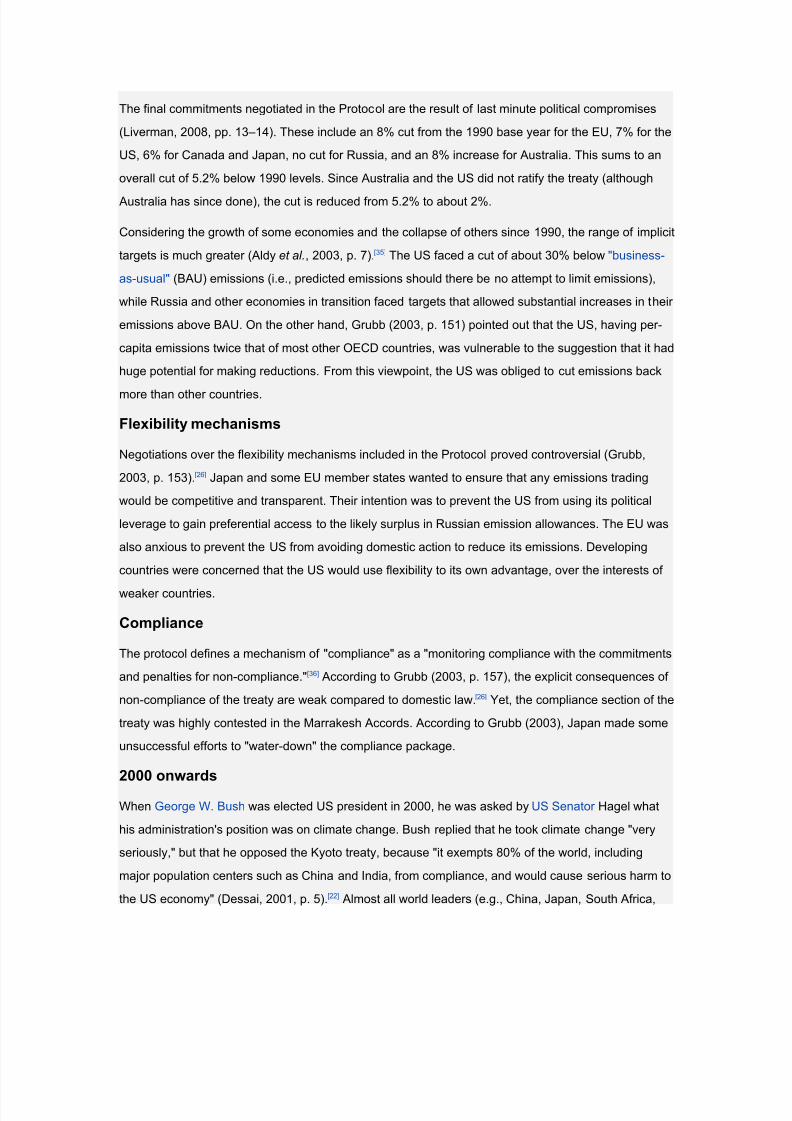
Fossil-Fuel Carbon Dioxide Emissions Annex B vs Non-Annex B 1990–2007
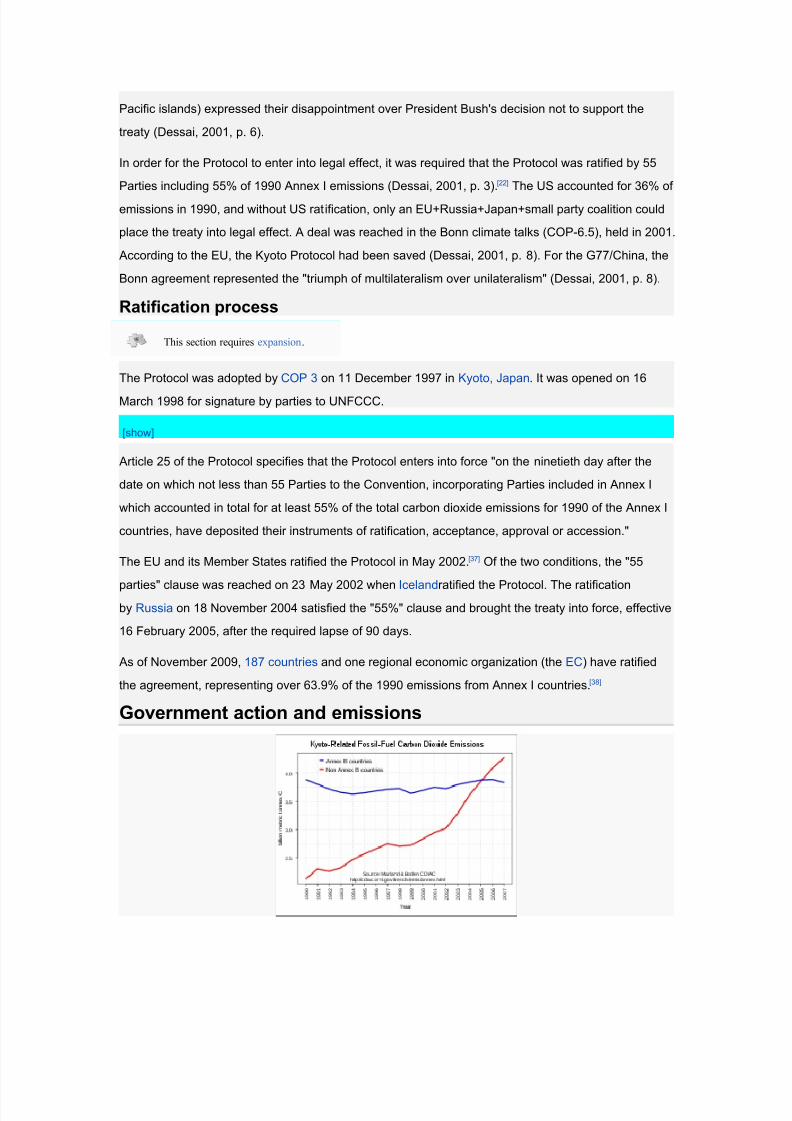
Carbon emissions from various global regions during the period 1800–2000 AD
Main article: Kyoto Protocol and government action
See also: List of countries by carbon dioxide emissions per capita, List of countries by carbon dioxide
emissions, and List of countries by ratio of GDP to carbon dioxide emissions
Annex I
Total aggregate GHG emissions excluding emissions/removals from land use, land use change and
forestry (LULUCF, i.e., carbon storage in forests and soils) for all Annex I Parties taken together
(including the USA) decreased from 19.0 to 17.8 thousand teragrams (Tg, which is equal to
109 kg) CO2 equivalent, a decline of 6.0% during the 1990-2008 period.[39]:3 Several factors have
contributed to this decline.[39]:14 The first is due to the economic restructuring in the Annex I Economies
in Transition[39]:14
(the EITs – see Intergovernmental Emissions Trading for the list of EITs). Over theperiod 1990-1999, emissions fell by 40% in the EITs following the collapse of central planning in the
former Soviet Union and east European countries.[40]:25 This lead to a massive contraction of their
heavy industry-based economies, with associated reductions in their fossil fuel consumption and
emissions.[18]:24
Emissions growth in Annex I Parties have also been limited due to policies and measures (PaMs).
[39]:14 In particular, PaMs were strengthened after 2000, helping to enhance energy efficiency and
develop renewable energy sources. [39]:14 Energy use also decreased during the economic crisis in
2007-2008.[39]:14
Projections
UNFCCC (2011)[39]:14 made projections of changes in emissions of the Annex I Parties and the
effectiveness of their PaMs. It was noted that their projections should be interpreted with caution.
[39]:7 For the 39 Annex I Parties, UNFCCC (2011) projected that existing PaMs would lead to annual
emissions in 2010 of 17.5 thousand Tg CO2 eq, excluding LULUCF, which is a decrease of 6.7% from
7/27/2019 Kyoto Protocol rev.doc
http://slidepdf.com/reader/full/kyoto-protocol-revdoc 19/23
the 1990 level.[39]:14 Annual emissions in 2020 excluding LULUCF were projected to reach 18.9
thousand Tg CO2 eq, which is an increase of 0.6% on the 1990 level.[39]:14
UNFCCC (2011)[39]:14 made an estimate of the total effect of implemented and adopted PaMs.
Projected savings were estimated relative to a reference (baseline) scenario where PaMs are not
implemented. PaMs were projected to deliver emissions savings relative to baseline of about 1.5
thousand Tg CO2 eq by 2010, and 2.8 thousand Tg CO2 eq by 2020.[39]:14 In percentage terms, and
using annual emissions in the year 1990 as a reference point, PaMs were projected to deliver at least
a 5.0% reduction relative to baseline by 2010, and a 10.0% reduction relative to baseline in 2020.
[39]:14 Scenarios reviewed by UNFCCC (2011)[39]:14 still suggested that total Annex I annual emissions
would increase out to 2020 (see the preceding paragraph).
Annex I Parties with targets
Collectively the group of industrialized countries committed to a Kyoto target, i.e., the Annex I
countries excluding the USA, have a target of reducing their GHG emissions by 4.2% on average for
the period 2008-2012 relative to the base year, which in most cases is 1990.[40]:24 According to
Olivier et al. (2011),[40]:24 the Kyoto Parties with a target will comfortably exceed their collective target,
with a projected average reduction of 16% for 2008-2012. This projection excludes both LULUCF and
credits generated by the Clean Development Mechanism (CDM).[40]:24
As noted in the preceding section, between 1990-1999, there was a large reduction in the emissions of
the EITs.[40]:25 The reduction in the EITs is largely responsible for the total (aggregate) reduction
(excluding LULUCF) in emissions of the Annex I countries, excluding the USA. [40]:25 Emissions of the
Annex II countries (Annex I minus the EIT countries) have experienced a limited increase in emissions
from 1990-2006, followed by stabilization and a more marked decrease from 2007 onwards. [40]:25
The emissions reductions in the early nineties by the 12 EIT countries who have since joined the EU,
assist the present EU-27 in meeting its collective Kyoto target. [40]:25 At the end of 2010, the EU-15 was
on track to achieve its Kyoto target, but three EU-15 Member States (Austria, Italy and Luxembourg)
were not on track to meet their burden-sharing targets. [41]:8 Other countries not on course to meet their
Kyoto target include Liechtenstein,[41]:8 Switzerland,[41]:8 Australia, Canada, New Zealand and Spain.
[40]:25 In order to meet their targets, these countries would need to purchase emissions credits from
other Kyoto countries.[40]:25 As noted in the section on Intergovernmental Emissions Trading, purchasing
surplus credits from the EIT countries would not actually result in total emissions being reduced. An
alternative would be the purchase of CDM credits or the use of the Green Investment Scheme.
Annex I Parties without Kyoto targets
7/27/2019 Kyoto Protocol rev.doc
http://slidepdf.com/reader/full/kyoto-protocol-revdoc 20/23
Belarus, Malta, and Turkey are Annex I Parties but do not have Kyoto targets. [41] The US has a Kyoto
target of a 6% reduction relative to the 1990 level, but has not ratified the treaty. [40]:25 Emissions in the
US have increased 11% since 1990, and according to Olivier et al. (2011),[40]:25 it will be unable to meet
its original Kyoto target.
If the US had ratified the Kyoto Protocol, the average percentage reduction in total GHG emissions for
the Annex I group would have been a 5.2% reduction relative to the base year. [40]:26 Including the US in
their calculation, Olivier et al. (2011)[40]:26 projected that the Annex I countries would collectively achieve
a 7% reduction relative to the base year, which is lower than the original target of a 5.2% reduction.
This projection excludes expected purchases of emissions credits.[40]:26
Non-Annex I
UNFCCC (2005) compiled and synthesized information reported to it by non-Annex I Parties. [42] Most
non-Annex I Parties belonged in the low-income group, with very few classified as middle-income.
Most Parties included information on policies relating to sustainable development. Sustainable
development priorities mentioned by non-Annex I Parties included poverty alleviation and access to
basic education and health care (UNFCCC, 2005, p. 6). Many non-Annex I Parties are making efforts
to amend and update their environmental legislation to include global concerns such as climate
change (UNFCCC, 2005, p. 7).
A few Parties, e.g., South Africa and Iran, stated their concern over how efforts to reduce emissions
could affect their economies. The economies of these countries are highly dependent on income
generated from the production, processing, and export of fossil fuels.
Emissions
GHG emissions, excluding land use change and forestry (LUCF), reported by 122 non-Annex I Parties
for the year 1994 or the closest year reported, totalled 11.7 billion tonnes (billion = 1,000,000,000) of
CO2-eq. CO2 was the largest proportion of emissions (63%), followed by methane (26%) and nitrous
oxide (N2O) (11%).
The energy sector was the largest source of emissions for 70 Parties, whereas for 45 Parties the
agriculture sector was the largest. Per capita emissions (in tonnes of CO2-eq, excluding LUCF)
averaged 2.8 tonnes for the 122 non-Annex I Parties.
The Africa region's aggregate emissions were 1.6 billion tonnes, with per capita emissions of
2.4 tonnes.
The Asia and Pacific region's aggregate emissions were 7.9 billion tonnes, with per capita
emissions of 2.6 tonnes.
7/27/2019 Kyoto Protocol rev.doc
http://slidepdf.com/reader/full/kyoto-protocol-revdoc 21/23
The Latin America and Caribbean region's aggregate emissions were 2 billion tonnes, with per
capita emissions of 4.6 tonnes.
The "other" region includes Albania, Armenia, Azerbaijan, Georgia, Malta, Republic of
Moldova, and the former Yugoslav Republic of Macedonia. Their aggregate emissions were
0.1 billion tonnes, with per capita emissions of 5.1 tonnes.
Parties reported a high level of uncertainty in LUCF emissions, but in aggregate, there appeared to
only be a small difference of 1.7% with and without LUCF. With LUCF, emissions were
11.9 billion tonnes, without LUCF, total aggregate emissions were 11.7 billion tonnes.
Trends
In several large developing countries and fast growing economies (China, India, Thailand, Indonesia,
Egypt, and Iran) GHG emissions have increased rapidly (PBL, 2009). [43] For example, emissions in
China have risen strongly over the 1990–2005 period, often by more than 10% year. Emissions per-
capita in non-Annex I countries are still, for the most part, much lower than in industrialized countries.
Non-Annex I countries do not have quantitative emission reduction commitments, but they are
committed to mitigation actions. China, for example, has had a national policy programme to reduce
emissions growth, which included the closure of old, less efficient coal-fired power plants.
Cost estimates
Barker et al. (2007, p. 79) assessed the literature on cost estimates for the Kyoto Protocol. [44] Due to
non-US participation in the Kyoto treaty, costs estimates were found to be much lower than those
estimated in the previous IPCC Third Assessment Report. Without US participation, and with full use of
the Kyoto flexible mechanisms, costs were estimated at less than 0.05% of Annex B GDP. This
compared to earlier estimates of 0.1–1.1%. Without use of the flexible mechanisms, costs without US
participation were estimated at less than 0.1%. This compared to earlier estimates of 0.2–2%. These
cost estimates were viewed as being based on much evidence and high agreement in the literature.
Views on the Protocol
Gupta et al. (2007) assessed the literature on climate change policy. They found that no authoritative
assessments of the UNFCCC or its Protocol asserted that these agreements had, or will, succeed in
solving the climate problem.[11] In these assessments, it was assumed that the UNFCCC or its Protocol
would not be changed. The Framework Convention and its Protocol include provisions for future policy
actions to be taken.
World Bank (2010, p. 233) commented on how the Kyoto Protocol had only had a slight effect on
curbing global emissions growth.[20] The treaty was negotiated in 1997, but by 2005, energy-related
7/27/2019 Kyoto Protocol rev.doc
http://slidepdf.com/reader/full/kyoto-protocol-revdoc 22/23
emissions had grown 24%. World Bank (2010) also stated that the treaty had provided only limited
financial support to developing countries to assist them in reducing their emissions and adapting to
climate change.
Some of the criticism of the Protocol has been based on the idea of climate justice (Liverman, 2008,
p. 14).[34] This has particularly centred on the balance between the low emissions and high vulnerability
of the developing world to climate change, compared to high emissions in the developed world.
Some environmentalists have supported the Kyoto Protocol because it is "the only game in town," and
possibly because they expect that future emission reduction commitments may demand more stringent
emission reductions (Aldy et al.., 2003, p. 9).[35] In 2001, sixteen national science academies [45] stated
that ratification of the Protocol represented a "small but essential first step towards stabilising
atmospheric concentrations of greenhouse gases."[46] Some environmentalists and scientists have
criticized the existing commitments for being too weak (Grubb, 2000, p. 5). [47]
The lack of quantitative emission commitments for developing countries led to the governments of the
United States, and also Australia under Prime Minister John Howard deciding not to ratify the treaty
(Stern 2007, p. 478).[48] Australia, under former Prime Minister Kevin Rudd, has since ratified the
treaty,[49][50] which took effect in March, 2008.[51]
In May 2010 the Hartwell Paper was published by the London School of Economics. The authors
argued that after what they regard as the failure of the 2009Copenhagen Climate Summit, the Kyoto
Protocol "has failed to produce any discernable real world reductions in emissions of greenhouse
gases in fifteen years" and that this failure opened an opportunity for a re-orientation towards a climate
policy based on human dignity instead of human sinfulness.[52][53]
Withdrawal
The Canadian government invoked Canada's legal right to formally withdraw from the Kyoto Protocol
on December 12, 2011. The country joined Russia and Japan who all refused to sign on to the
extension of the protocol. The move could also lead to other nations withdrawing from the Protocol. [54]
Successor
Main article: Post–Kyoto Protocol negotiations on greenhouse gas emissions
In the non-binding 'Washington Declaration' agreed on 16 February 2007, Heads of governments from
Canada, France, Germany, Italy, Japan, Russia, United Kingdom, the United States,
Brazil, China, India, Mexico and South Africa agreed in principle on the outline of a successor to the
Kyoto Protocol. They envisage a global cap-and-trade system that would apply to both industrialized
nations and developing countries, and hoped that this would be in place by 2009
7/27/2019 Kyoto Protocol rev.doc
http://slidepdf.com/reader/full/kyoto-protocol-revdoc 23/23
On 7 June 2007, leaders at the 33rd G8 summit agreed that the G8 nations would "aim to at least
halve global CO2 emissions by 2050". The details enabling this to be achieved would be negotiated by
environment ministers within the United Nations Framework Convention on Climate Change in a
process that would also include the major emerging economies.[57]
A round of climate change talks under the auspices of the United Nations Framework Convention on
Climate Change (UNFCCC) (Vienna Climate Change Talks 2007) concluded in 31 August 2007 with
agreement on key elements for an effective international response to climate change. [58]
A key feature of the talks was a United Nations report that showed how efficient energy use could yield
significant cuts in emissions at low cost.
The talks were meant to set the stage for a major international meeting to be held in Nusa Dua, Bali,
which started on 3 December 2007.[59]
The Conference was held in December 2008 in Poznań, Poland. One of the main topics on this
meeting was the discussion of a possible implementation of avoideddeforestation also known
as Reducing emissions from deforestation and forest degradation (REDD) into the future Kyoto
Protocol.[60]
After the lack of progress leading to a binding commitment or an extension of the Kyoto
commitment period in climate talks at COP 15 in Copenhagen, Denmark in 2009, there were
and will be several further rounds of negotiation COP 16 in Cancun, Mexico in 2010, COP 17
in South Africa in 2011, and in Qatar in 2012 (COP 18). Because any treaty change will
require the ratification of the text by various countries' legislatures before the end of thecommitment period on 31 December 2012, it is likely that agreements in South Africa or
South Korea/Qatar will be too late to prevent a gap between the commitment periods.