Embed Size (px)
Citation preview

81
Lampiran 1. Analisis Data
1. Hasil Pengamatan Bakteri Gram Negatif
Tabel 1 Hasil Pengamatan Morfologi Isolat Bakteri Gram Negatif
Foto Pengamatan Morfologi Keterangan
Isolat AA
Perbesaran 400x
Bentuk kokus/bulat
Isolat AH
Perbesaran 400x
Bentuk basil/batang
Isolat BA
Perbesaran 400x
Bentuk kokus/bulat

82
Lanjutan Tabel 4.1
Isolat BE
Perbesaran 400x
Bentuk kokus/bulat
Isolat DA
Perbesaran 400x
Bentuk basil/batang
Isolat DH
Perbesaran 400x
Bentuk kokus/bulat

83
2. Data Hasil Penetasan Telur NSK G. rostochiensis (Wollenweber).
Tabel 2. Data Hasil Penetasan Telur NSE G. rostochiensis (Wollenweber).
Perlakuan Ulangan Total
Penetasan
Telur (%)
Rata-rata
Penetasan
Telur (δ)
(%)
s
(std.dev) Filtrat
bakteri
Endofit
Lama
Perendaman
(Hari Ke-)
I
(%)
II
(%)
III
(%)
Kontrol
(Air
Kran)
3
6
9
12
15
18
2
2
0
0
0
0
2
4
0
0
0
0
2
2
0
0
0
0
6
8
0
0
0
0
2
2,67
0
0
0
0
0
1,55
0
0
0
0
Isolat
AA
3
6
9
12
15
18
0
0
0
0
0
0
0
0
0
0
0
0
0
0
0
0
0
0
0
0
0
0
0
0
0
0
0
0
0
0
0
0
0
0
0
0
Isolat
AH
3
6
9
12
15
18
0
0
0
0
0
0
0
0
0
0
0
0
0
0
0
0
0
0
0
0
0
0
0
0
0
0
0
0
0
0
0
0
0
0
0
0
Isolat
BA
3
6
9
12
15
18
0
0
0
0
0
0
0
0
0
0
0
0
0
0
0
0
0
0
0
0
0
0
0
0
0
0
0
0
0
0
0
0
0
0
0
0
Isolat
BE
3
6
9
12
15
18
0
0
0
0
0
0
0
0
0
0
0
0
0
0
0
0
0
0
0
0
0
0
0
0
0
0
0
0
0
0
0
0
0
0
0
0
Isolat
DA
3
6
9
12
15
18
0
0
0
0
0
0
0
0
0
0
0
0
0
0
0
0
0
0
0
0
0
0
0
0
0
0
0
0
0
0
0
0
0
0
0
0
84
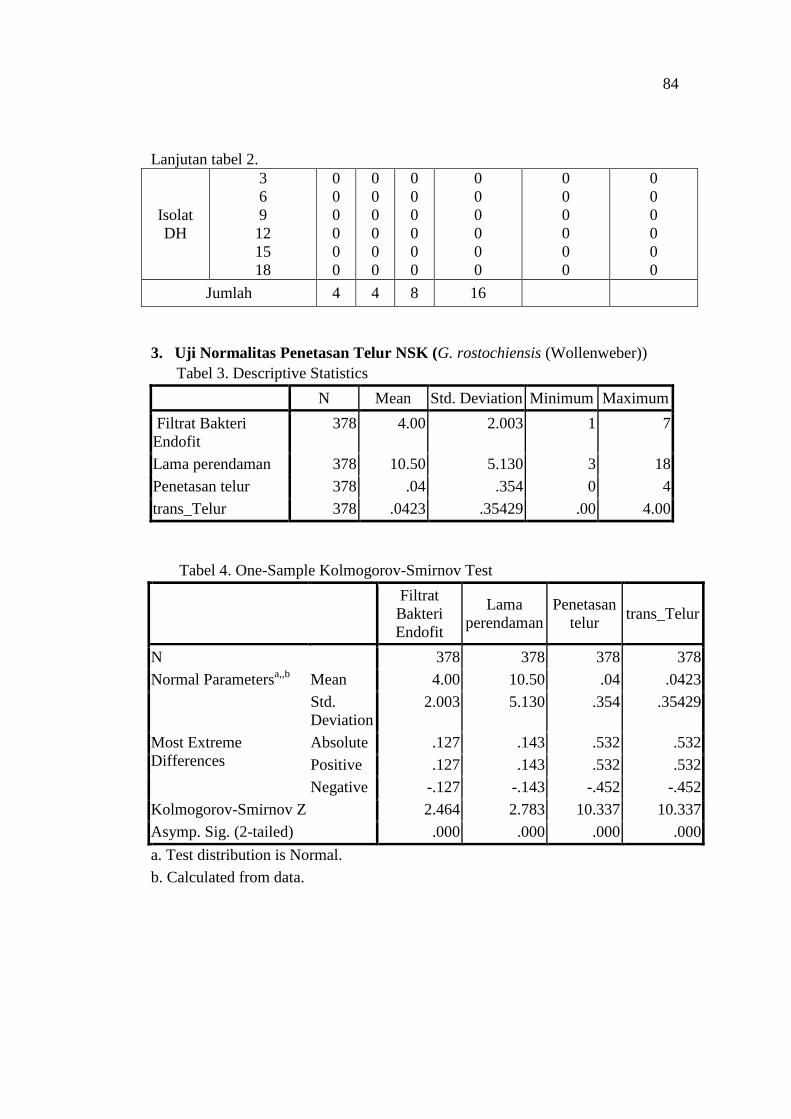
Lanjutan tabel 2.
Isolat
DH
3
6
9
12
15
18
0
0
0
0
0
0
0
0
0
0
0
0
0
0
0
0
0
0
0
0
0
0
0
0
0
0
0
0
0
0
0
0
0
0
0
0
Jumlah 4 4 8 16
3. Uji Normalitas Penetasan Telur NSK (G. rostochiensis (Wollenweber))
Tabel 3. Descriptive Statistics
N Mean Std. Deviation Minimum Maximum
Filtrat Bakteri
Endofit
378 4.00 2.003 1 7
Lama perendaman 378 10.50 5.130 3 18
Penetasan telur 378 .04 .354 0 4
trans_Telur 378 .0423 .35429 .00 4.00
Tabel 4. One-Sample Kolmogorov-Smirnov Test
Filtrat
Bakteri
Endofit
Lama
perendaman
Penetasan
telur trans_Telur
N 378 378 378 378
Normal Parametersa,,b
Mean 4.00 10.50 .04 .0423
Std.
Deviation
2.003 5.130 .354 .35429
Most Extreme
Differences
Absolute .127 .143 .532 .532
Positive .127 .143 .532 .532
Negative -.127 -.143 -.452 -.452
Kolmogorov-Smirnov Z 2.464 2.783 10.337 10.337
Asymp. Sig. (2-tailed) .000 .000 .000 .000
a. Test distribution is Normal.
b. Calculated from data.

85
4. Uji Kruskal-Wallis Penetasan Telur NSK (G. rostochiensis (Wollenweber))
Tabel 5. Descriptive Statistics
N Mean
Std.
Deviation Minimum Maximum
Filtrat Bakteri
Endofit
378 4.00 2.003 1 7
Lama perendaman 378 10.50 5.130 3 18
trans_Telur 378 .0423 .35429 .00 4.00
Tabel 6. Ranks Kruskal-Wallis Test
trans_
Telur N Mean Rank
Filtrat Bakteri
Endofit
.00 372 192.11
2.00 4 27.50
4.00 2 27.50
Total 378
Lama perendaman .00 372 191.53
2.00 4 63.50
4.00 2 63.50
Total 378
Tabel 7. Test Statisticsa,b
Filtrat
Bakteri
Endofit
Lama
perendaman
Chi-Square 13.681 8.339
df 2 2
Asymp. Sig. .001 .015
a. Kruskal Wallis Test
b. Grouping Variable: trans_Telur

86
5. Uji Analisis Probit Penetasan Telur NSK (G. rostochiensis (Wollenweber)).
Tabel 8. Convergence Information
Number of
Iterations
Optimal
Solution
Found
PROBIT 10 Yes
Tabel 9. Parameter Estimates
Parameter Estimate
Std.
Error Z Sig.
95% Confidence
Interval
Lower
Bound
Upper
Bound
PROBITa Penetasan telur -.517 .322 -1.608 .108 -1.148 .113
Interceptb 3 Hari .649 .213 3.039 .002 .435 .862
6 Hari .677 .219 3.087 .002 .458 .896
9 Hari .566 .205 2.760 .006 .361 .771
12 Hari .566 .205 2.760 .006 .361 .771
15 Hari .566 .205 2.760 .006 .361 .771
18 Hari .566 .205 2.760 .006 .361 .771
a. PROBIT model: PROBIT(p) = Intercept + BX
b. Corresponds to the grouping variable Waktu.
Tabel 10. Chi-Square Tests
Chi-Square dfa Sig.
PROBIT Pearson Goodness-of-Fit
Test
88.749 101 .803b
a. Statistics based on individual cases differ from statistics based on aggregated
cases.
b. Since the significance level is less than .950, a heterogeneity factor is used in
the calculation of confidence limits.

87
Tabel 11. Cell Counts and Residuals
Number Waktu Penetasan
telur
Number
of
Subjects
Observed
Responses
Expected
Responses Residual Probability
PROBIT 1 3 1.000 1 1 .552 .448 .552
2 3 1.000 2 1 1.105 -.105 .552
3 3 1.000 3 1 1.657 -.657 .552
4 3 .000 1 1 .742 .258 .742
5 3 .000 2 1 1.483 -.483 .742
6 3 .000 3 1 2.225 -1.225 .742
7 3 .000 1 1 .742 .258 .742
8 3 .000 2 1 1.483 -.483 .742
9 3 .000 3 1 2.225 -1.225 .742
10 3 .000 2 2 1.483 .517 .742
11 3 .000 3 2 2.225 -.225 .742
12 3 .000 2 2 1.483 .517 .742
13 3 .000 3 2 2.225 -.225 .742
14 3 .000 2 2 1.483 .517 .742
15 3 .000 3 2 2.225 -.225 .742
16 3 .000 3 3 2.225 .775 .742
17 3 .000 3 3 2.225 .775 .742
18 3 .000 3 3 2.225 .775 .742
19 6 1.000 1 1 .563 .437 .563
20 6 2.000 2 1 .721 .279 .360
21 6 1.000 3 1 1.690 -.690 .563
22 6 .000 1 1 .751 .249 .751
23 6 .000 2 1 1.502 -.502 .751
24 6 .000 3 1 2.252 -1.252 .751
25 6 .000 1 1 .751 .249 .751
26 6 .000 2 1 1.502 -.502 .751
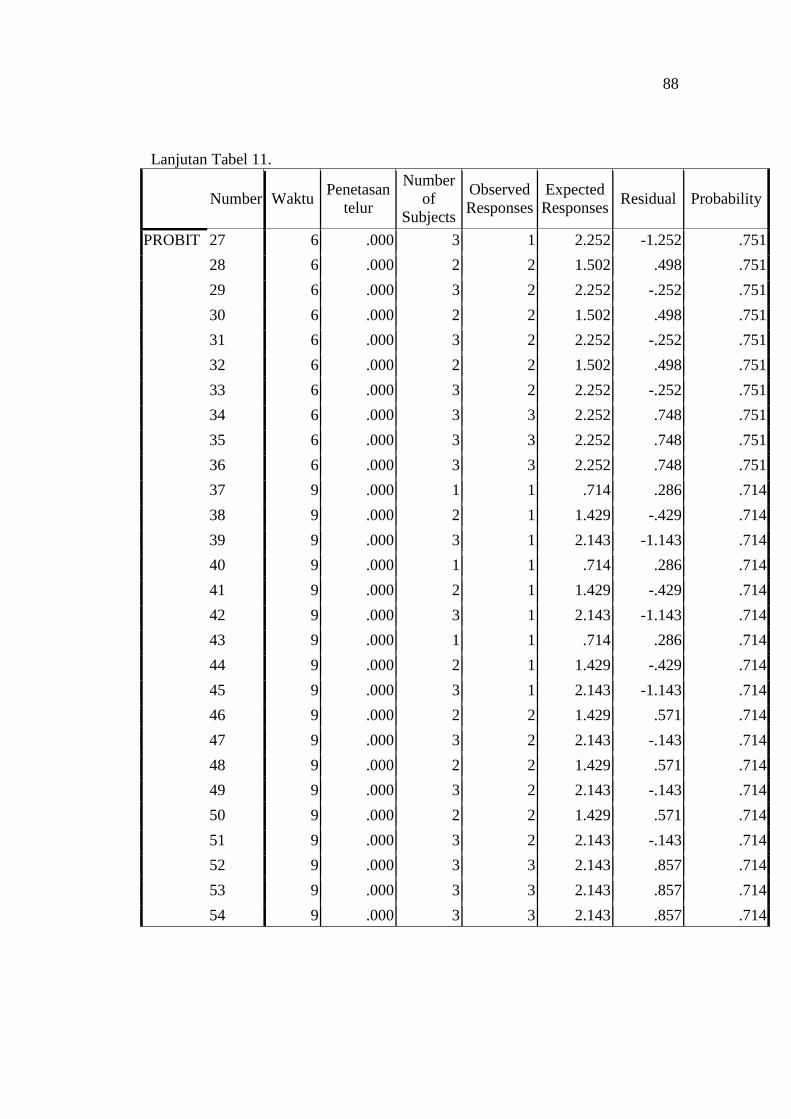
88
Lanjutan Tabel 11.
Number Waktu Penetasan
telur
Number
of
Subjects
Observed
Responses
Expected
Responses Residual Probability
PROBIT 27 6 .000 3 1 2.252 -1.252 .751
28 6 .000 2 2 1.502 .498 .751
29 6 .000 3 2 2.252 -.252 .751
30 6 .000 2 2 1.502 .498 .751
31 6 .000 3 2 2.252 -.252 .751
32 6 .000 2 2 1.502 .498 .751
33 6 .000 3 2 2.252 -.252 .751
34 6 .000 3 3 2.252 .748 .751
35 6 .000 3 3 2.252 .748 .751
36 6 .000 3 3 2.252 .748 .751
37 9 .000 1 1 .714 .286 .714
38 9 .000 2 1 1.429 -.429 .714
39 9 .000 3 1 2.143 -1.143 .714
40 9 .000 1 1 .714 .286 .714
41 9 .000 2 1 1.429 -.429 .714
42 9 .000 3 1 2.143 -1.143 .714
43 9 .000 1 1 .714 .286 .714
44 9 .000 2 1 1.429 -.429 .714
45 9 .000 3 1 2.143 -1.143 .714
46 9 .000 2 2 1.429 .571 .714
47 9 .000 3 2 2.143 -.143 .714
48 9 .000 2 2 1.429 .571 .714
49 9 .000 3 2 2.143 -.143 .714
50 9 .000 2 2 1.429 .571 .714
51 9 .000 3 2 2.143 -.143 .714
52 9 .000 3 3 2.143 .857 .714
53 9 .000 3 3 2.143 .857 .714
54 9 .000 3 3 2.143 .857 .714
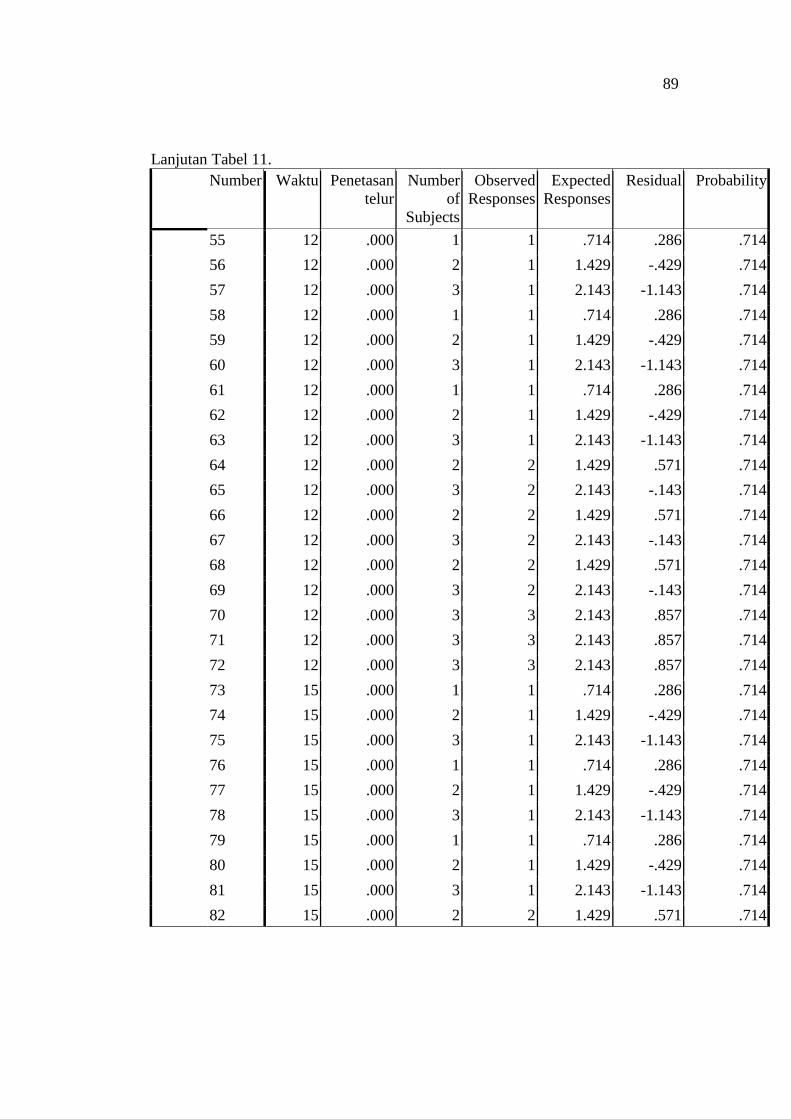
89
Lanjutan Tabel 11.
Number Waktu Penetasan
telur
Number
of
Subjects
Observed
Responses
Expected
Responses
Residual Probability
55 12 .000 1 1 .714 .286 .714
56 12 .000 2 1 1.429 -.429 .714
57 12 .000 3 1 2.143 -1.143 .714
58 12 .000 1 1 .714 .286 .714
59 12 .000 2 1 1.429 -.429 .714
60 12 .000 3 1 2.143 -1.143 .714
61 12 .000 1 1 .714 .286 .714
62 12 .000 2 1 1.429 -.429 .714
63 12 .000 3 1 2.143 -1.143 .714
64 12 .000 2 2 1.429 .571 .714
65 12 .000 3 2 2.143 -.143 .714
66 12 .000 2 2 1.429 .571 .714
67 12 .000 3 2 2.143 -.143 .714
68 12 .000 2 2 1.429 .571 .714
69 12 .000 3 2 2.143 -.143 .714
70 12 .000 3 3 2.143 .857 .714
71 12 .000 3 3 2.143 .857 .714
72 12 .000 3 3 2.143 .857 .714
73 15 .000 1 1 .714 .286 .714
74 15 .000 2 1 1.429 -.429 .714
75 15 .000 3 1 2.143 -1.143 .714
76 15 .000 1 1 .714 .286 .714
77 15 .000 2 1 1.429 -.429 .714
78 15 .000 3 1 2.143 -1.143 .714
79 15 .000 1 1 .714 .286 .714
80 15 .000 2 1 1.429 -.429 .714
81 15 .000 3 1 2.143 -1.143 .714
82 15 .000 2 2 1.429 .571 .714

90
Lanjutan Tabel 11.
Number Waktu Penetasan
telur
Number
of
Subjects
Observed
Responses
Expected
Responses Residual Probability
83 15 .000 3 2 2.143 -.143 .714
84 15 .000 2 2 1.429 .571 .714
85 15 .000 3 2 2.143 -.143 .714
86 15 .000 2 2 1.429 .571 .714
87 15 .000 3 2 2.143 -.143 .714
88 15 .000 3 3 2.143 .857 .714
89 15 .000 3 3 2.143 .857 .714
90 15 .000 3 3 2.143 .857 .714
91 18 .000 1 1 .714 .286 .714
92 18 .000 2 1 1.429 -.429 .714
93 18 .000 3 1 2.143 -1.143 .714
94 18 .000 1 1 .714 .286 .714
95 18 .000 2 1 1.429 -.429 .714
96 18 .000 3 1 2.143 -1.143 .714
97 18 .000 1 1 .714 .286 .714
98 18 .000 2 1 1.429 -.429 .714
99 18 .000 3 1 2.143 -1.143 .714
100 18 .000 2 2 1.429 .571 .714
101 18 .000 3 2 2.143 -.143 .714
102 18 .000 2 2 1.429 .571 .714
103 18 .000 3 2 2.143 -.143 .714
104 18 .000 2 2 1.429 .571 .714
105 18 .000 3 2 2.143 -.143 .714
106 18 .000 3 3 2.143 .857 .714
107 18 .000 3 3 2.143 .857 .714
108 18 .000 3 3 2.143 .857 .714

91
Tabel 12. Confidence Limits PROBITa
Lama
perendaman Probability
95% Confidence Limits for
Penetasan telur
Estimate
Lower
Bound Upper Bound
3 Hari .010 5.750 . .
.020 5.224 . .
.030 4.889 . .
.040 4.638 . .
.050 4.433 . .
.060 4.259 . .
.070 4.106 . .
.080 3.970 . .
.090 3.845 . .
.100 3.731 . .
.150 3.257 . .
.200 2.881 . .
.250 2.558 . .
.300 2.268 . .
.350 1.999 . .
.400 1.744 . .
.450 1.497 . .
.500 1.254 . .
.550 1.011 . .
.600 .764 . .
.650 .509 . .
.700 .240 . .
.750 -.050 . .
.800 -.373 . .
.850 -.749 . .
.900 -1.223 . .
.910 -1.338 . .
.920 -1.462 . .
.930 -1.599 . .

92
Lanjutan Tabel 12.
Lama
perendaman Probability
95% Confidence Limits for Penetasan telur
Estimate Lower Bound Upper Bound
.940 -1.751 . .
.950 -1.925 . .
.960 -2.130 . .
.970 -2.381 . .
.980 -2.716 . .
.990 -3.243 . .
6 Hari .010 5.805 . .
.020 5.278 . .
.030 4.944 . .
.040 4.692 . .
.050 4.488 . .
.060 4.314 . .
.070 4.161 . .
.080 4.024 . .
.090 3.900 . .
.100 3.786 . .
.150 3.312 . .
.200 2.935 . .
.250 2.612 . .
.300 2.322 . .
.350 2.053 . .
.400 1.798 . .
.450 1.551 . .
.500 1.308 . .
.550 1.066 . .
.600 .819 . .
.650 .564 . .
.700 .295 . .
.750 .005 . .
.800 -.318 . .
.850 -.695 . .
.900 -1.169 . .

93
Lanjutan Tabel 12.
Lama
perendaman Probability
95% Confidence Limits for Penetasan telur
Estimate Lower Bound Upper Bound
.910 -1.283 . .
.920 -1.407 . .
.930 -1.544 . .
.940 -1.697 . .
.950 -1.871 . .
.960 -2.075 . .
.970 -2.327 . .
.980 -2.661 . .
.990 -3.188 . .
9 Hari .010 5.590 . .
.020 5.064 . .
.030 4.729 . .
.040 4.478 . .
.050 4.273 . .
.060 4.099 . .
.070 3.946 . .
.080 3.810 . .
.090 3.685 . .
.100 3.571 . .
.150 3.097 . .
.200 2.721 . .
.250 2.398 . .
.300 2.108 . .
.350 1.839 . .
.400 1.584 . .
.450 1.337 . .
.500 1.094 . .
.550 .851 . .
.600 .604 . .
.650 .349 . .

94
Lanjutan Tabel 12
Lama
perendaman Probability
95% Confidence Limits for Penetasan telur
Estimate Lower Bound Upper Bound
.700 .080 . .
.750 -.210 . .
.800 -.533 . .
.850 -.909 . .
.900 -1.383 . .
.910 -1.498 . .
.920 -1.622 . .
.930 -1.759 . .
.940 -1.911 . .
.950 -2.085 . .
.960 -2.290 . .
.970 -2.541 . .
.980 -2.876 . .
.990 -3.403 . .
12 Hari .010 5.590 . .
.020 5.064 . .
.030 4.729 . .
.040 4.478 . .
.050 4.273 . .
.060 4.099 . .
.070 3.946 . .
.080 3.810 . .
.090 3.685 . .
.100 3.571 . .
.150 3.097 . .
.200 2.721 . .
.250 2.398 . .
.300 2.108 . .
.350 1.839 . .
.400 1.584 . .
.450 1.337 . .
.500 1.094 . .
.550 .851 . .

95
Lanjutan Tabel 12.
Lama
perendaman Probability
95% Confidence Limits for Penetasan telur
Estimate Lower Bound Upper Bound
.600 .604
.700 .080 . .
.650 .349 . .
.700 .080 . .
.750 -.210 . .
.800 -.533 . .
.850 -.909 . .
.900 -1.383 . .
.910 -1.498 . .
.920 -1.622 . .
.930 -1.759 . .
.940 -1.911 . .
.950 -2.085 . .
.960 -2.290 . .
.970 -2.541 . .
.980 -2.876 . .
.990 -3.403 . .
15 Hari .010 5.590 . .
.020 5.064 . .
.030 4.729 . .
.040 4.478 . .
.050 4.273 . .
.060 4.099 . .
.070 3.946 . .
.080 3.810 . .
.090 3.685 . .
.100 3.571 . .
.150 3.097 . .
.200 2.721 . .
.250 2.398 . .
.300 2.108 . .
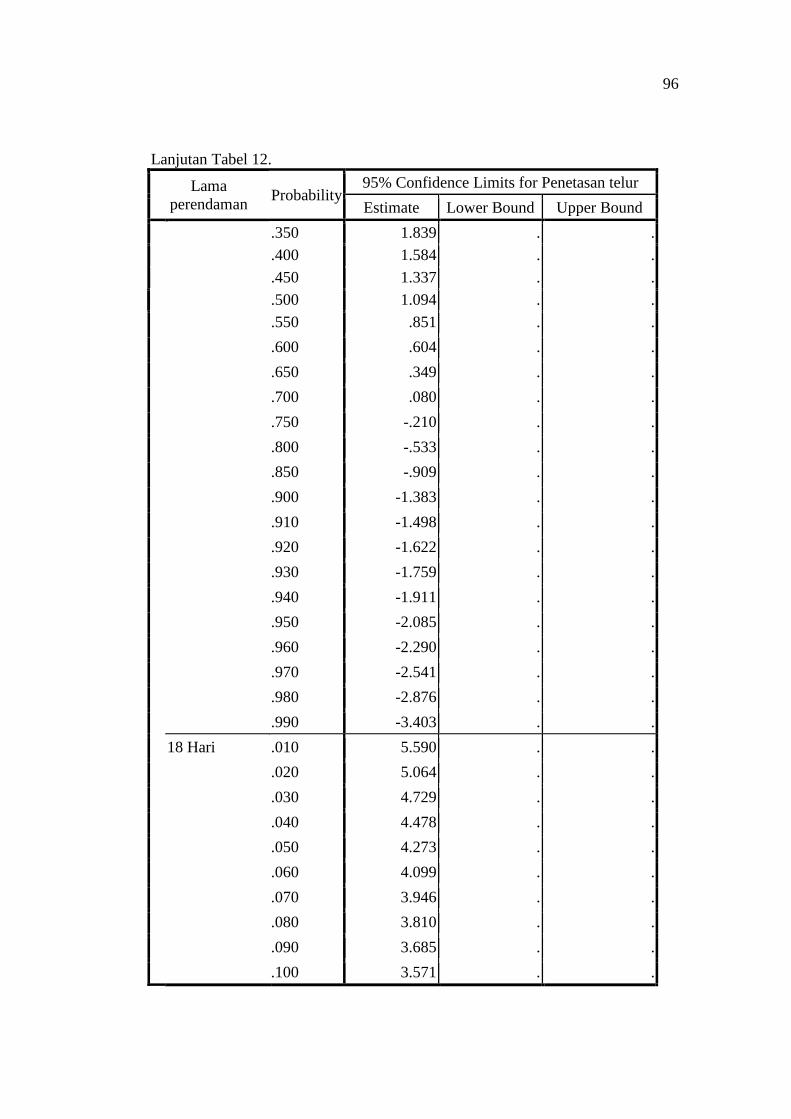
96
Lanjutan Tabel 12.
Lama
perendaman Probability
95% Confidence Limits for Penetasan telur
Estimate Lower Bound Upper Bound
.350 1.839 . .
.400 1.584 . .
.450 1.337 . .
.500 1.094 . .
.550 .851 . .
.600 .604 . .
.650 .349 . .
.700 .080 . .
.750 -.210 . .
.800 -.533 . .
.850 -.909 . .
.900 -1.383 . .
.910 -1.498 . .
.920 -1.622 . .
.930 -1.759 . .
.940 -1.911 . .
.950 -2.085 . .
.960 -2.290 . .
.970 -2.541 . .
.980 -2.876 . .
.990 -3.403 . .
18 Hari .010 5.590 . .
.020 5.064 . .
.030 4.729 . .
.040 4.478 . .
.050 4.273 . .
.060 4.099 . .
.070 3.946 . .
.080 3.810 . .
.090 3.685 . .
.100 3.571 . .

97
Lanjutan Tabel 12.
Lama
perendaman
Probabilit
y
95% Confidence Limits for Penetasan telur
Estimate Lower Bound Upper Bound
.150 3.097
.200 2.721
.250 2.398
.300 2.108
.350 1.839 . .
.400 1.584 . .
.450 1.337 . .
.500 1.094 . .
.550 .851 . .
.600 .604 . .
.650 .349 . .
.700 .080 . .
.750 -.210 . .
.800 -.533 . .
.850 -.909 . .
.900 -1.383 . .
.910 -1.498 . .
.920 -1.622 . .
.930 -1.759 . .
.940 -1.911 . .
.950 -2.085 . .
.960 -2.290 . .
.970 -2.541 . .
.980 -2.876 . .
.990 -3.403 . .
a. A heterogeneity factor is used.

98
Tabel 13. Relative Median Potency Estimates
(I)
Lama
perend
aman
(J)
Lama
perend
aman
95% Confidence Limits
Estimate Lower Bound Upper Bound
PROBIT 3 6 -.055 . .
9 .160 . .
12 .160 . .
15 .160 . .
18 .160 . .
6 3 .055 . .
9 .215 . .
12 .215 . .
15 .215 . .
18 .215 . .
9 6 -.215 . .
3 -.160 . .
12 -8.270E-11 . .
15 -1.658E-10 . .
18 -1.658E-10 . .
12 6 -.215 . .
3 -.160 . .
9 8.270E-11 . .
15 -8.313E-11 . .
18 -8.313E-11 . .
15 6 -.215 . .
3 -.160 . .
9 1.658E-10 . .
12 8.313E-11 . .
18 .000 . .
18 6 -.215 . .
3 -.160 . .
9 1.658E-10 . .
12 8.313E-11 . .
15 .000 . .
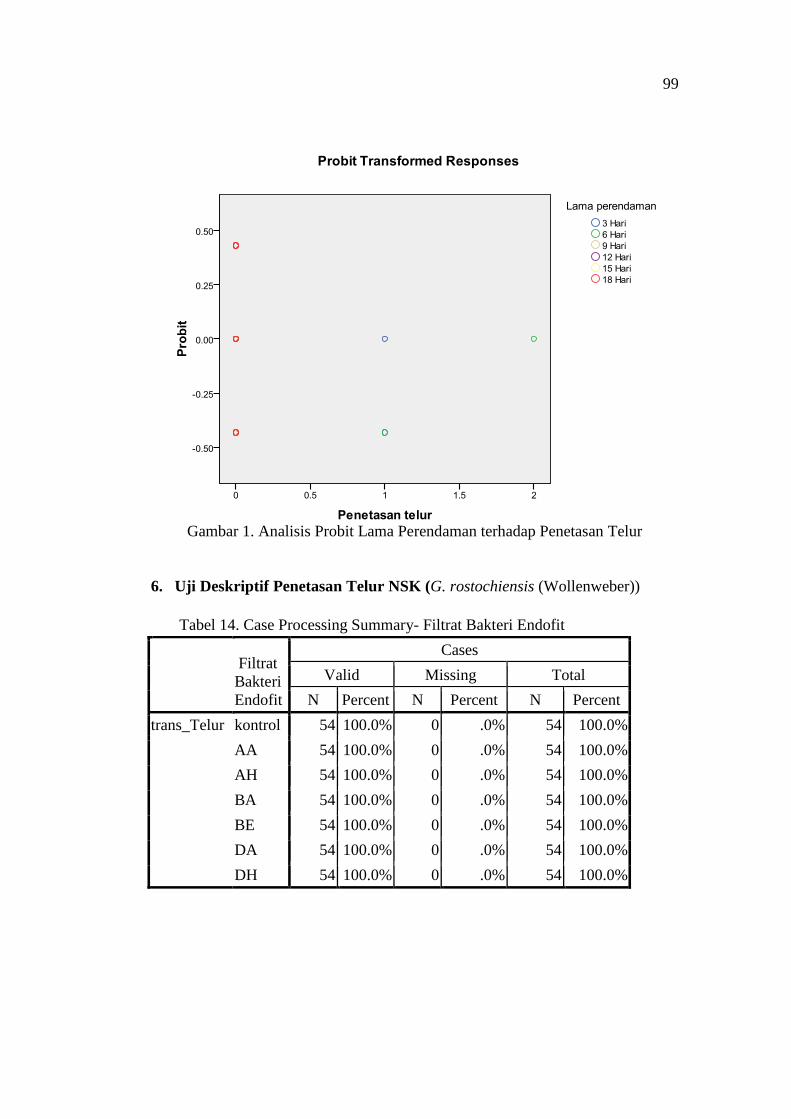
99
Gambar 1. Analisis Probit Lama Perendaman terhadap Penetasan Telur
6. Uji Deskriptif Penetasan Telur NSK (G. rostochiensis (Wollenweber))
Tabel 14. Case Processing Summary- Filtrat Bakteri Endofit
Filtrat
Bakteri
Endofit
Cases
Valid Missing Total
N Percent N Percent N Percent
trans_Telur kontrol 54 100.0% 0 .0% 54 100.0%
AA 54 100.0% 0 .0% 54 100.0%
AH 54 100.0% 0 .0% 54 100.0%
BA 54 100.0% 0 .0% 54 100.0%
BE 54 100.0% 0 .0% 54 100.0%
DA 54 100.0% 0 .0% 54 100.0%
DH 54 100.0% 0 .0% 54 100.0%

100
Tabel 15. Descriptivesa,b,c,d,e,f
Filtrat Bakteri Endofit Statistic Std. Error
trans_Telur kontrol Mean .1296 .05318
95% Confidence
Interval for Mean
Lower Bound .0230
Upper Bound .2363
5% Trimmed Mean .0679
Median .0000
Variance .153
Std. Deviation .39076
Minimum .00
Maximum 2.00
Range 2.00
Interquartile Range .00
Skewness 3.197 .325
Kurtosis 10.527 .639
a. trans_Telur is constant when Filtrat Bakteri Endofit = AA. It has been omitted.
b. trans_Telur is constant when Filtrat Bakteri Endofit = AH. It has been omitted.
c. trans_Telur is constant when Filtrat Bakteri Endofit = BA. It has been omitted.
d. trans_Telur is constant when Filtrat Bakteri Endofit = BE. It has been omitted.
e. trans_Telur is constant when Filtrat Bakteri Endofit = DA. It has been omitted.
f. trans_Telur is constant when Filtrat Bakteri Endofit = DH. It has been omitted.
Tabel 16. Percentilesa,b,c,d,e,f
Filtrat
Bakteri
Endofit
Percentiles
5 10 25 50 75 90 95
Weighted
Average
(Definition 1)
trans_Telur kontrol .0000 .0000 .0000 .0000 .0000 1.0000 1.0000
Tukey's
Hinges
trans_Telur kontrol
.0000 .0000 .0000
a. trans_Telur is constant when Filtrat Bakteri Endofit = AA. It has been omitted.
b. trans_Telur is constant when Filtrat Bakteri Endofit = AH. It has been omitted.
c. trans_Telur is constant when Filtrat Bakteri Endofit = BA. It has been omitted.
d. trans_Telur is constant when Filtrat Bakteri Endofit = BE. It has been omitted.
e. trans_Telur is constant when Filtrat Bakteri Endofit = DA. It has been omitted.
f. trans_Telur is constant when Filtrat Bakteri Endofit = DH. It has been omitted.

101

102
Tabel 17. Case Processing Summary-Lama perendaman
Lama
perenda
man
Cases
Valid Missing Total
N Percent N Percent N Percent
trans_Telur 3 Hari 63 100.0% 0 .0% 63 100.0%
6 Hari 63 100.0% 0 .0% 63 100.0%
9 Hari 63 100.0% 0 .0% 63 100.0%
12 Hari 63 100.0% 0 .0% 63 100.0%
15 Hari 63 100.0% 0 .0% 63 100.0%
18 Hari 63 100.0% 0 .0% 63 100.0%
Tabel 18. Descriptivesa,b,c,d
Lama perendaman
Lama perendaman Statistic Std. Error
trans_Telur 3 Hari Mean .0476 .02705
95% Confidence
Interval for Mean
Lower Bound -.0064
Upper Bound .1017
5% Trimmed Mean .0000
Median .0000
Variance .046
Std. Deviation .21467
Minimum .00
Maximum 1.00
Range 1.00
Interquartile Range .00
Skewness 4.353 .302
Kurtosis 17.502 .595
6 Hari Mean .0635 .03835
95% Confidence
Interval for Mean
Lower Bound -.0132
Upper Bound .1402
5% Trimmed Mean .0000
Median .0000
Variance .093
Std. Deviation .30443

103
Lanjutan Tabel 18.
Minimum .00
Maximum 2.00
Range 2.00
Interquartile Range .00
Skewness 5.248 .302
Kurtosis 29.126 .595
a. trans_Telur is constant when Lama perendaman = 9 Hari. It has been omitted.
b. trans_Telur is constant when Lama perendaman = 12 Hari. It has been omitted.
c. trans_Telur is constant when Lama perendaman = 15 Hari. It has been omitted.
d. trans_Telur is constant when Lama perendaman = 18 Hari. It has been omitted.

104

105
Tabel 19. Descriptivesa,b,c,d,e,f
Lama perendaman
Filtrat Bakteri Endofit Statistic Std. Error
trans_Telur kontrol Mean .1296 .05318
95% Confidence
Interval for Mean
Lower Bound .0230
Upper Bound .2363
5% Trimmed Mean .0679
Median .0000
Variance .153
Std. Deviation .39076
Minimum .00
Maximum 2.00
Range 2.00
Interquartile Range .00
Skewness 3.197 .325
Kurtosis 10.527 .639
a. trans_Telur is constant when Filtrat Bakteri Endofit = AA. It has been omitted.
b. trans_Telur is constant when Filtrat Bakteri Endofit = AH. It has been omitted.
c. trans_Telur is constant when Filtrat Bakteri Endofit = BA. It has been omitted.
d. trans_Telur is constant when Filtrat Bakteri Endofit = BE. It has been omitted.
e. trans_Telur is constant when Filtrat Bakteri Endofit = DA. It has been omitted.
f. trans_Telur is constant when Filtrat Bakteri Endofit = DH. It has been omitted.
Tabel 20. Percentilesa,b,c,d
Lama
perendaman
Percentiles
5 10 25 50 75 90 95
Weighted
Average
(Definition 1)
trans_Telur 3 Hari .0000 .0000 .0000 .0000 .0000 .0000 .8000
6 Hari .0000 .0000 .0000 .0000 .0000 .0000 .8000
Tukey's
Hinges
trans_Telur 3 Hari .0000 .0000 .0000
6 Hari .0000 .0000 .0000
a. trans_Telur is constant when Lama perendaman = 9 Hari. It has been omitted.
b. trans_Telur is constant when Lama perendaman = 12 Hari. It has been omitted.
c. trans_Telur is constant when Lama perendaman = 15 Hari. It has been omitted.
d. trans_Telur is constant when Lama perendaman = 18 Hari. It has been omitted.

106
7. Uji Regresi
Tabel 21. Variables Entered/Removed
Model
Variables
Entered
Variables
Removed Method
1 Lama
perendaman,
Filtrat Bakteri
Endofita
. Enter
a. All requested variables entered.
Tabel 22. Model Summary
Model R R Square
Adjusted R
Square
Std. Error of
the Estimate
1 .227a .052 .046 .14979
a. Predictors: (Constant), Lama perendaman, Filtrat
Bakteri Endofit
Tabel 23. ANOVAb
Model
Sum of
Squares df Mean Square F Sig.
1 Regression .457 2 .228 10.184 .000a
Residual 8.413 375 .022
Total 8.870 377
a. Predictors: (Constant), Lama perendaman, Filtrat Bakteri Endofit
b. Dependent Variable: trans_Telur
Tabel 24. Coefficientsa
Model
Unstandardized
Coefficients
Standardized
Coefficients
t Sig. B Std. Error Beta
1 (Constant) .117 .023 5.004 .000
Filtrat Bakteri
Endofit
-.014 .004 -.181 -3.606 .000
Lama perendaman -.004 .002 -.137 -2.714 .007
a. Dependent Variable: trans_Telur

107
Lampiran 2. Mekanisme Penelitian
Gambar 13. Diagram Pengujian Penetasan Telur NSE G. rostochiensis
(Wollenweber).
Hasil
Sampel Bakteri
Sampel Sista
Disterilisasi
etil alkohol 70% dan
aquades steril 5 kali
Direndam aquades
steril
selama 1 minggu
Sista Dipecah
Diambil telurnya
Dihitung dibawah
mikroskop
Disterilisasi
streptomisin sulfat
600 ppm 1 jam
dan aquades steril 30
detik
Hasil
Media TSB 100 ml
Diperendaman 27
oC
selama 72 jam
kecepatan 150 rpm
Pengamatan
Makroskopis
Kaca preparat
Pewarnaan Gram
Diamati dibawah
mikroskop
perbesaran 1000x
Perlakuan
Disentrifus
13.000 rpm 4oC
selama 15 menit
Difilter
“Minisart 0,2 µm”
Hasil
Pengamatan hari ke-3,
6, 9, 12, 15, dan 18

108

109