Embed Size (px)
Citation preview

1
INVESTING IN THE FUTUREof Healthcare
Jefferies 2015 Global Healthcare Conference
June 1, 2015

2
SAFE HARBOR
This presentation includes “forward-looking statements” within the meaning of securities laws of applicable jurisdictions.
Forward-looking statements can generally be identified by the use of forward-looking words such as “may”, “will”, “would”,
“could”, “expect”, “intend”, “plan”, “aim”, “estimate”, “target”, “anticipate”, “believe”, “continue”, “objectives”, “outlook”,
“guidance” or other similar words, and include statements regarding MPT’s plans, strategies, objectives, targets, future
expansion and development activities and expected financial performance. Forward-looking statements involve known and
unknown risks, uncertainties and other factors that may cause the actual results of the Company or future events to differ
materially from those expressed in or underlying such forward-looking statements, including without limitation: the
satisfaction of all conditions to, and the timely closing (if at all) of the MEDIAN acquisition and sale-leaseback transactions;
the Company’s financing of the transactions described herein; the capacity of MEDIAN and the Company’s other tenants to
meet the terms of their agreements; expected rent coverage; Normalized FFO per share; expected payout ratio, the
amount of acquisitions of healthcare real estate, if any; capital markets conditions, the repayment of debt arrangements;
statements concerning the additional income to the Company as a result of ownership interests in certain hospital
operations and the timing of such income; the payment of future dividends, if any; completion of additional debt
arrangement, and additional investments; national and international economic, business, real estate and other market
conditions; the competitive environment in which the Company operates; the execution of the Company's business plan;
financing risks; the Company's ability to maintain its status as a REIT for federal income tax purposes; acquisition and
development risks; potential environmental and other liabilities; and other factors affecting the real estate industry generally
or healthcare real estate in particular; and the value of our real estate assets, which may limit our ability to dispose of
assets at attractive prices or obtain or maintain equity or debt financing secured by our properties or on an unsecured
basis, and the factors referenced under the section captioned “Item 1.A Risk Factors” in our annual report on Form 10-K for
the year ended December 31, 2014. Actual results, performance or achievements may vary materially from any projections
and forward looking statements and the assumptions on which those statements are based. Readers are cautioned not to
place undue reliance on forward-looking statements, and MPT disclaims any responsibility to update such information.
3
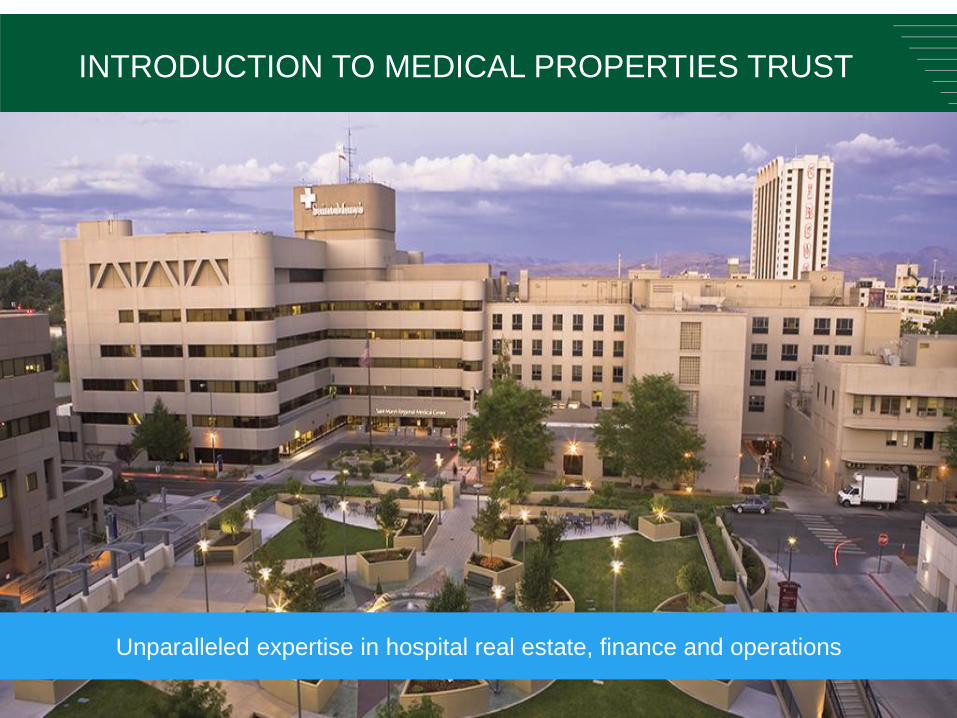
INTRODUCTION TO MEDICAL PROPERTIES TRUST
Unparalleled expertise in hospital real estate, finance and operations

4
FOCUSING EXCLUSIVELY ON THE MOST CRITICALcomponents of healthcare delivery
MPT FOCUSES ON
the heart of healthcare:
• General Acute Care hospitals
• Long Term Acute Care hospitals
• Inpatient Rehabilitation hospitals
SKILLED
NURSING
facilities
INPATIENT
REHAB
hospitals
MEDICAL
office
ASSISTEDliving
HOMEHEALTH
care
GENERAL
ACUTE CARE
hospitals
LTAC
hospitals
INDEPENDENTliving

5
PORTFOLIO OVERVIEW
Note: Portfolio statistics as of March 31, 2015 and assume fully funded commitments and consummation of the MEDIAN transaction.
(1) Includes 3 medical office buildings and 6 wellness centers.
1

6
INVESTMENT THESIS
Stable and predictable income from essential community assets

7
ALWAYS A NEED
FOR HOSPITALS
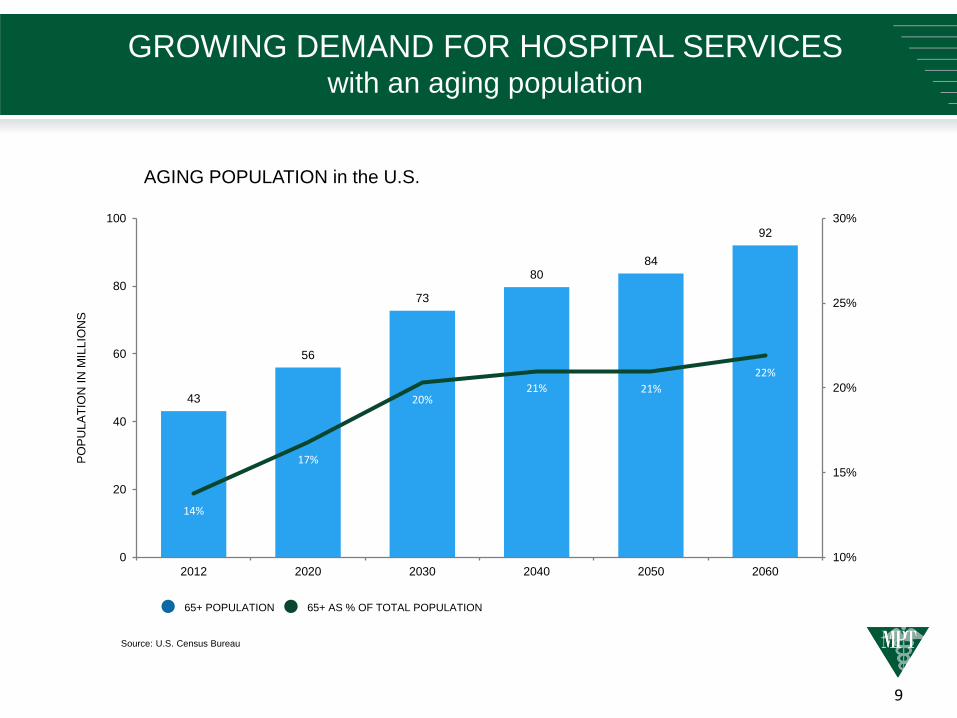
• An aging population will result in increased demand for hospital services
• Healthcare will continue to evolve, but hospitals will remain foundational
to the effective delivery and coordination of care
CRITICAL PART OF
COMMUNITY
INFRASTRUCTRE
HOSPITAL
ECONOMICS
• Specialized physical plant is essential to the diagnosis and treatment
of acute illness
• Hospitals are big employers in local communities ~ 4.8 million full-time
equivalent hospital workers in the U.S.
• Physical relocation is often impractical
• Physician and patients are resistant to new locations
• Highest yielding healthcare real estate
• Well run hospitals generate strong margins
• Lease payments represent minor portion of net revenue
• Hospitals economics are improving
• CMS projects hospital expenditures will increase at 6% CAGR over
next 10 years
HOSPITALS ARE NEEDED IN THEIR COMMUNITIES and current dynamics are highly favorable

8
HIGHER RENTAL YIELDS and lease coverages from hospitals
• Hospitals provide the highest rental yields in healthcare real estate
• Superior lease coverage compared to other healthcare property types
2014 RETURNS
from Healthcare Real Estate1
LEASE COVERAGE
by Property Type2
11%
10%
9%
0%
2%
4%
6%
8%
10%
12%
LTACH Acute Care IRF
4.3
2.01.9
1.4
1.2
0.0
0.5
1.0
1.5
2.0
2.5
3.0
3.5
4.0
4.5
5.0
AcuteCare
IRF LTACH SkilledNursing
SeniorHousing
(1) Actual MPT Real Estate returns through December 31, 2014.
(2) MPT TTM lease coverage as of February 28, 2015 for mature portfolio (properties in portfolio at least one year). Lease coverage ratios are
derived solely from the financial information provided to us by our tenants. We do not independently audit or otherwise verify this information.
Senior Housing average and Skilled Nursing average are calculated as the average of lease coverage for the HCN, HCP and VTR in respective
property types. Lease coverage defined as EBITDAR divided by rent payment under the lease.
9
43
56
73
8084
92
14%
17%
20%21% 21%
22%
10%
15%
20%
25%
30%
0
20
40
60
80
100
2012 2020 2030 2040 2050 2060
PO
PU
LA
TIO
N I
N M
ILL
ION
S
AGING POPULATION in the U.S.
Source: U.S. Census Bureau
65+ POPULATION 65+ AS % OF TOTAL POPULATION
GROWING DEMAND FOR HOSPITAL SERVICESwith an aging population
10
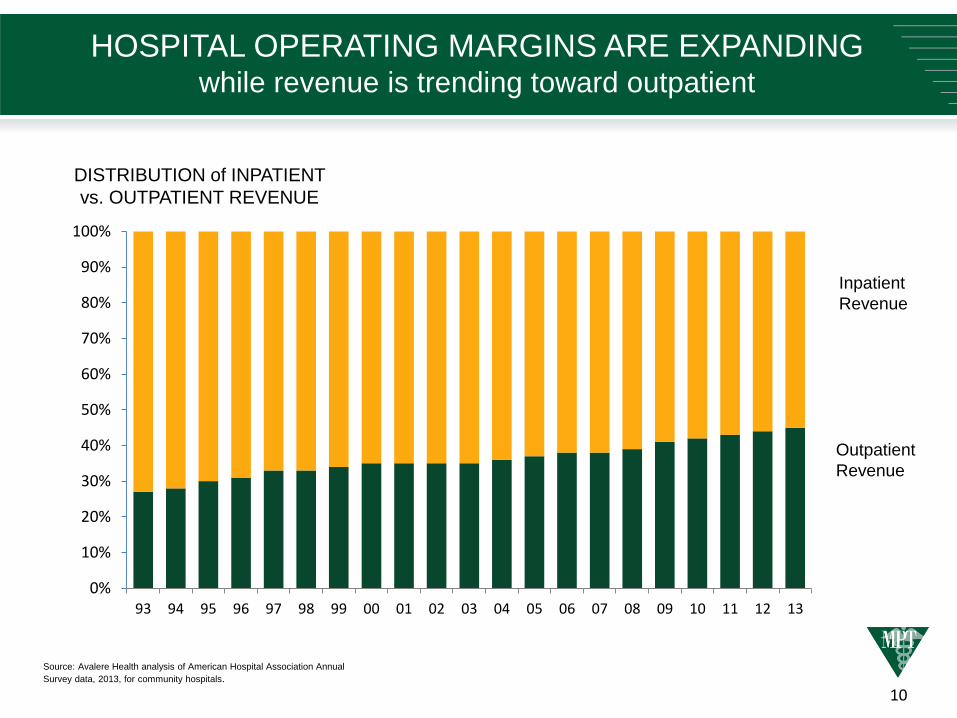
HOSPITAL OPERATING MARGINS ARE EXPANDING while revenue is trending toward outpatient
Source: Avalere Health analysis of American Hospital Association Annual
Survey data, 2013, for community hospitals.
0%
10%
20%
30%
40%
50%
60%
70%
80%
90%
100%
93 94 95 96 97 98 99 00 01 02 03 04 05 06 07 08 09 10 11 12 13
DISTRIBUTION of INPATIENT
vs. OUTPATIENT REVENUE
Inpatient
Revenue
Outpatient
Revenue

11
DISCIPLINED PORTFOLIO MANAGEMENTand a comprehensive investment process
Solid shareholder returns from a well-diversified and growing portfolio

12
HISTORY OF ATTRACTIVE shareholder returns
16.5%
20.8%
10.0%
12.0%
14.0%
16.0%
18.0%
20.0%
22.0%
RMS
89%
83%
79%
50%
60%
70%
80%
90%
2012 2013 2014
4.5% 4.5%
5.7%
6.4%
0.0%
1.0%
2.0%
3.0%
4.0%
5.0%
6.0%
7.0%
CURRENT DIVIDEND Yield MPT PAYOUT Ratio AVERAGE ANNUAL
Total Return (2012 - Q1 2015)
(1) Peer yields from Bloomberg as of May 28,2015. MPT yield based on Q1 annualized dividend and share price as of May 28, 2015.
(2) Based on annualized share price performance between 12/30/11 and 3/31/15 inclusive of dividend reinvestment, sourced from FactSet.
(3) RMS is the MSCI US REIT Total Return Index.
Source: Bloomberg, FactSet
3
1
2

13
5%
19%
17%
11%11%
7%
5%
3%2%
2%
2%
16%
Note: Mix based on investment amounts. Property type diversification by investment based on both U.S. and European investments. All measures are pro forma for uncompleted
acquisitions and development commitments, including the acquisition of MEDIAN.
27 Operators
STRONG PORTFOLIO DIVERSIFICATIONgenerates reliable cash flow
Property Type Breakdown Operator Breakdown
54%
1%5%
IASIS
ADEPTUS/FC
RHM
PRIME
ERNEST
MEDIAN
ALECTO
IJKG/HUMC
LHP
KINDRED
18 OTHER OPERATORS
NON RE ASSETS
9%
31%
OTHER
NON RE ASSETS
GENERAL ACUTE CARE
LONG-TERM ACUTE
INPATIENT REHABILITATION
176 Properties
International Geographic Mix
UNITED STATES
GERMANY
UNITED KINGDOM
77%
22%
1%
3 Countries

14
MPT’S OPERATOR REVENUE comes from reliable payors
(1) Based on MPT US portfolio.
(2) Based on breakdown of total German rehab market.
(3) Includes private insurance, employers insurance for civil servants, accident insurance, self pay and others.
(4) Based on payor breakdown for MPT’s facility in the UK.
PAYOR MIX- United States1
38%
37%
13%
11%1%
MEDICARE MEDICAID OTHER
MANAGED CARE SELF PAY
PAYOR MIX-
Germany Rehab2
31%39%
30%
PENSION FUNDS
STATUTORY HEALTH
INSURANCE
OTHER
PAYOR MIX- UK4
35%
65%
NATIONAL HEALTH SERVICE
PRIVATE3

15
CONTINUED DIVERSIFICATIONhas reduced property concentration
CONCENTRATION BY Largest Property
16%
9%
6%7%
4%3%
2.9% 2.6%
0%
5%
10%
15%
20%
20
04
20
06
20
08
20
10
20
12
20
13
20
14
20
15
PF
Low near-term lease maturity levels provide MPT
with stable, predictable cash flows, with no single property
accounting for > 2.6% of MPT’s portfolio
(1) 2015 PF property concentration is pro-forma for uncompleted acquisitions, including the acquisition of MEDIAN.
Note: The MEDIAN Transactions and asset development commitments are fully funded.
1
16
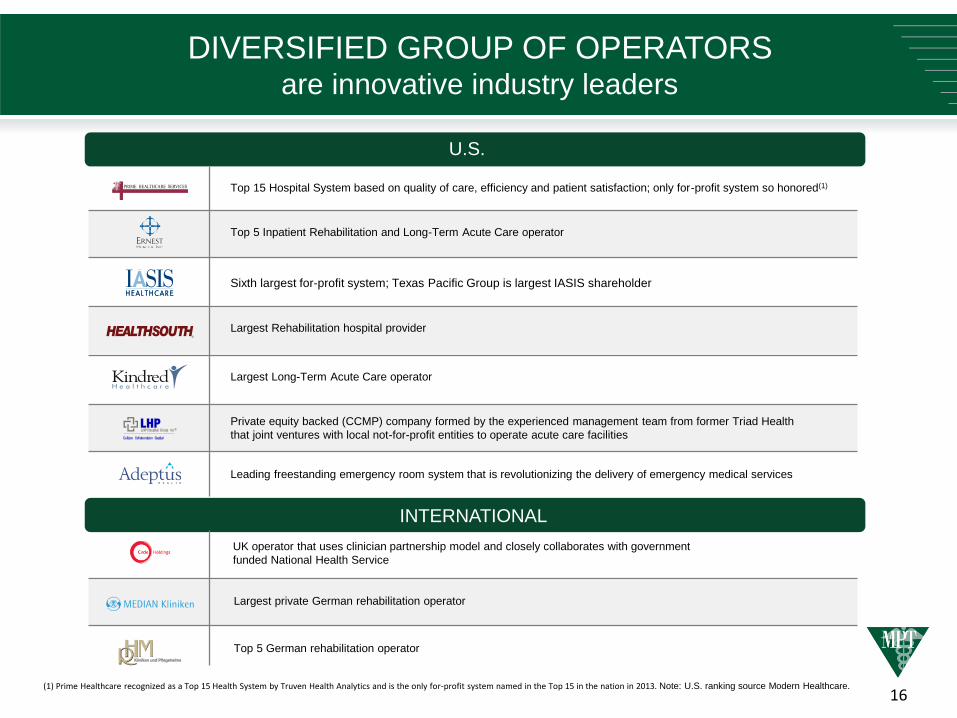
DIVERSIFIED GROUP OF OPERATORSare innovative industry leaders
U.S.
INTERNATIONAL
(1) Prime Healthcare recognized as a Top 15 Health System by Truven Health Analytics and is the only for-profit system named in the Top 15 in the nation in 2013. Note: U.S. ranking source Modern Healthcare.
Top 15 Hospital System based on quality of care, efficiency and patient satisfaction; only for-profit system so honored(1)
Top 5 Inpatient Rehabilitation and Long-Term Acute Care operator
Sixth largest for-profit system; Texas Pacific Group is largest IASIS shareholder
Largest Rehabilitation hospital provider
Largest Long-Term Acute Care operator
Private equity backed (CCMP) company formed by the experienced management team from former Triad Health
that joint ventures with local not-for-profit entities to operate acute care facilities
Leading freestanding emergency room system that is revolutionizing the delivery of emergency medical services
UK operator that uses clinician partnership model and closely collaborates with government
funded National Health Service
Largest private German rehabilitation operator
Top 5 German rehabilitation operator
17
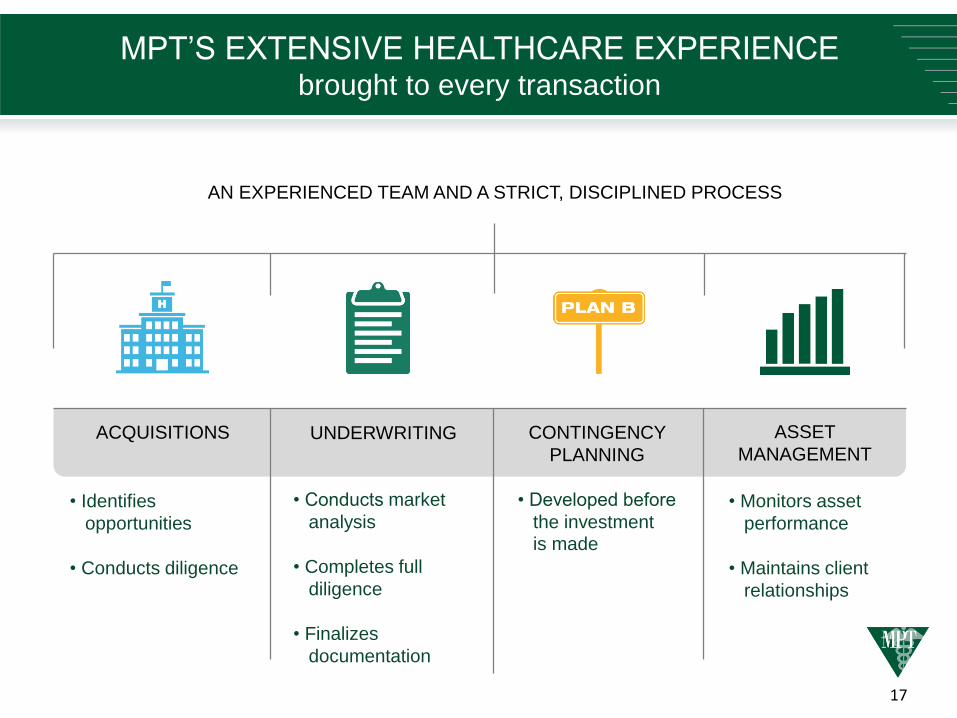
MPT’S EXTENSIVE HEALTHCARE EXPERIENCEbrought to every transaction
AN EXPERIENCED TEAM AND A STRICT, DISCIPLINED PROCESS
ACQUISITIONS UNDERWRITING CONTINGENCY
PLANNING
ASSET
MANAGEMENT
• Monitors asset
performance
• Maintains client
relationships
• Identifies
opportunities
• Conducts diligence
• Developed before
the investment is made
• Conducts market
analysis
• Completes full
diligence
• Finalizes
documentation

18
AN EXEMPLARY INVESTMENT track record
MPT’S UNDERWRITING EXPERIENCE
and Lease Provisions Protect
Against Losses
• Deep industry knowledge
(MPT knows hospitals)
• Investing in critical community
infrastructure (“Hospitals needed
by the community don’t fail”)
• Underwriting conservatively
(We always have a “Plan B”)
• Lease Defaults Provide
Opportunity to Reset Rates
TOTAL REAL ESTATE INVESTMENTS
<1% Credit Losses over 10 Years
41▀
1
(1) Does not include MEDIAN transactions.

19
STRONG EXTERNAL GROWTH from robust acquisition activity
$0.66 $0.71
$0.90 $0.96
$1.06
$0.00
$0.20
$0.40
$0.60
$0.80
$1.00
$1.20
2010 2011 2012 2013 2014
$213
$331
$801
$700
$1,378
$416
$0
$200
$400
$600
$800
$1,000
$1,200
$1,400
$1,600
2010 2011 2012 2013 2014 YTD2015
MPT’s disciplined acquisition strategy has driven Normalized
FFO per share growth of 12.6% per annum since 2010.
Acquisitions continue to be immediately accretive to FFO.
INVESTMENTS/COMMITMENTS ($mm) NORMALIZED FFO Per Share

20
98% OF LEASES AND MORTGAGE LOANS HAVE FIXED OR CPI LINKED RENT ESCALATORS
0% to 5% increase in CPI, MPT Rents increase:
Total Leases and Mortgage Loans Pro Forma Escalated Rate
Investment Value1
Percent of Investments Escalation Provisions
$2,581,000,000 60% Full CPI (92% have a floor of 1% to 2.65%)
$1,187,000,000 27% CPI-based, most with collars ranging from 1% floor to 5% ceiling
$480,000,000 11% Fixed increases, averaging 2.4%
$67,000,000 2% Flat
$4,315,000,000
$4.3 BILLION 1.4% - 4.0%
Note: Rents would increase based on 2015 rent; Investment value includes construction in progress and assumes fully funded development projects.
(1) Value based on undepreciated book value as of March 31, 2015 and is inclusive of MEDIAN real estate transaction and completed development projects.
1
STABLE & PREDICTABLE INTERNAL GROWTH

21
0%
1%
0%
1%
2%
0%
4%
11%
4%
1%
4%
0.0%
2.0%
4.0%
6.0%
8.0%
10.0%
12.0%
WELL-COVERED LEASES WITH long-term maturities
Provide long-term, inflation-protected cash
returns from critical community assets
Average annual lease maturities
through 2021 < 1.2% per annum
LEASE MATURITY Schedule
95% of 2022
Maturities under
Master Lease
Master Lease
elections are all
or none
OPERATOR OPTIONS AT MATURITY
MOST OFTEN: Elect to extend
Typically 5 years at contractual escalations
OCCASIONALLY: Elect to repurchase
Typically at the greater of fair value
or MPT’s investment
RARELY: Elect to vacate
Typically obligated to transition
business to a new operator
(1) Lease maturity schedule is pro-forma for MEDIAN transaction as of March 31, 2015.
1

22
• $723MM of revolver capacity available
for investments as of March 31, 2015
• 100% of non-credit facility debt is fixed
rate or swapped to fixed rate
• Well-staggered debt maturities
• Company’s Senior Notes recently
upgraded by S&P to investment grade2
• Long term net leverage target of 40-
45%
• Net Debt / Adjusted EBITDA target of
5.5x
• Targeting investment grade ratings
(1) As of March 31, 2015. Senior unsecured notes due 2020 are €200 million. Debt due in 2022 excludes debt premium.
(2) On December 1, 2014 S&P upgraded MPT’s corporate credit rating to BB+ from BB, with a stable outlook, post announcement of the acquisition of MEDIAN. Rating of Senior
Notes was also raised to BBB- from BB.
$125$215
$450
$350$300$302
$723
$125
$0
$100
$200
$300
$400
$500
$600
$700
$800
$900
$1,000
$1,100
2015 2016 2017 2018 2019 2020 2021 2022 2023 2024
Senior unsecured notes Secured loans Credit Facility Available Term Loans
PRUDENT CAPITAL STRUCTURE
DEBT MATURITIES ($ in million)1

23
SUSTAINABLE GROWTH IN THE U.S.and internationally
Increased capital needs and a growing acceptance of sale leaseback model

24
Continue to penetrate and lead
the U.S. hospital market
Deepen investments in
hospital operations
Expand into new markets
at home and abroad
Add new, high-acuity sectors that
complement our portfolio
78+ Million “Baby Boomers”
8,000/day will turn 65 through 2029
More than 60% have at least one chronic disease
Maintain as limited part of total investments
Small investments relative to the associated triple net lease component
Licensed ER Hospitals
Free-standing high traffic physician staffed Emergency facilities
All are passive
Western Europe
MPT’S GROWTH STRATEGIES

25
GOVERNMENT INITIATIVE / EVENT
INTERNATIONAL DIVERSIFICATON REDUCES RISKof disruptions in U.S. hospital M&A activity
Health Maintenance Organization (HMO) Act of 1973
Diagnosis-related Groups (DRGs) implemented by HCFA (now CMS)
Health Security Act “HillaryCare”
Balanced Budget Amendment
U.S. Presidential Elections
Patient Protection and Affordable Care Act (PPACA)
1973
1983
1993
1997
2008
2010

26
United States Western Europe(1)
GovernmentVery stable
Democratic process to elect political leaders
Very stable
Democratic process to elect political leaders
Demographics
Laws Affordable Care Act – movement towards universal care Universal healthcare and reimbursement mandated by law
Opportunities
for Growth
Continued opportunities for growth primarily through acquisition and
development of private and for-profit hospitals
Increasing opportunities for growth as private for-profit hospital operators
recognize the benefits of sale/leaseback financing model to fund facility
improvements, technology upgrades, staff additions and new construction
Germany UK
Payors
Medicare – Federal government sponsored
Medicaid – State and Federal government sponsored
Commercial insurance - Private
Statutory Health Insurance (SHI)
Pension Funds (DRV) – National
and Regional funds that pay for
rehabilitation services
Private Health Insurance – limited
to higher earners
National Health Service (NHS) –
Single payor government system
Private Health Insurance
Coverage
Coverage depends on individual’s ability to pay and/or plan
benefits
Insurance primarily offered through employers and government
German law mandates universal
access and coverage; SHI and DRV
covers 90% of German population
In the UK, defined healthcare
benefits are free to all residents of
the UK through the NHS
Physicians
Combination of private practice and employment model
Rate determined by government and negotiated health plans
German physicians are employed
doctors
While most physicians are employed
by NHS, they are free to admit
patients to private healthcare
facilities.
Hospital
Ownership
(1) Countries constituting Western Europe from UCLA Center for European and Eurasian Studies - web.international.ucla.edu/euro/countries/westeurope.
(2) 2012 population estimates from The World Bank - data.worldbank.org/indicator/SP.POP.TOTL.
21%
58%
21%
Public Not-for-profit
Private Not-for-profit
Private For-profit
314M Total(2)
Under 65
65+
413M Total(2)
87% 13% 19%81%
50%
33%
17%
92%
0%
8%
ATTRACTIVE HEALTHCARE MARKETS
throughout Western Europe

27
APPENDIX
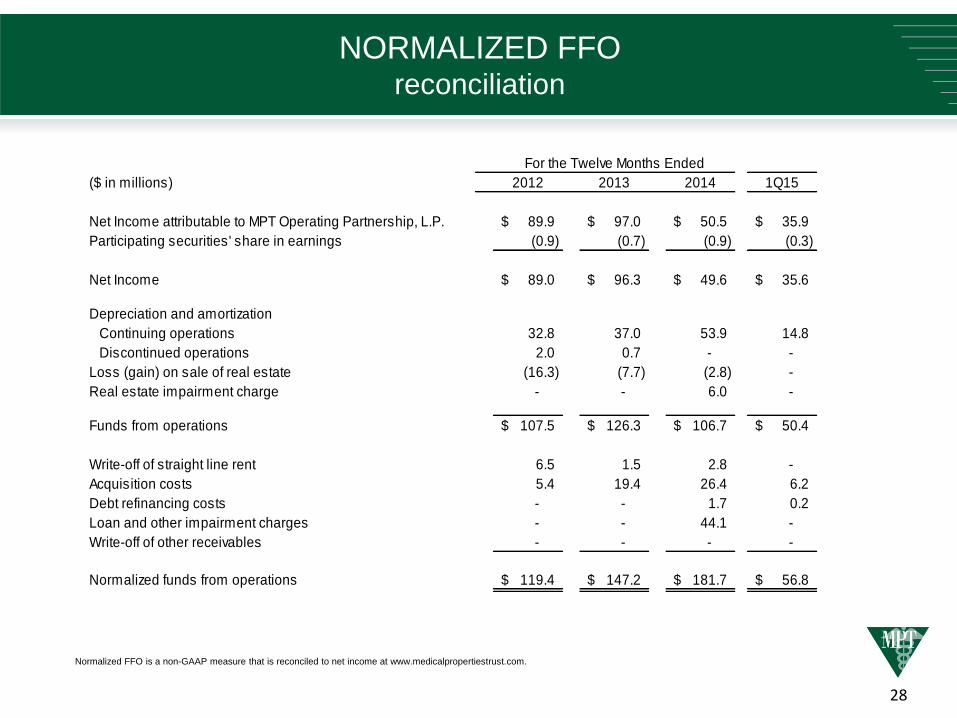
Normalized FFO Reconciliation
28
Normalized FFO is a non-GAAP measure that is reconciled to net income at www.medicalpropertiestrust.com.
($ in millions) 2012 2013 2014 1Q15
Net Income attributable to MPT Operating Partnership, L.P. 89.9$ 97.0$ 50.5$ 35.9$
Participating securities' share in earnings (0.9) (0.7) (0.9) (0.3)
Net Income 89.0$ 96.3$ 49.6$ 35.6$
Depreciation and amortization
Continuing operations 32.8 37.0 53.9 14.8
Discontinued operations 2.0 0.7 - -
Loss (gain) on sale of real estate (16.3) (7.7) (2.8) -
Real estate impairment charge - - 6.0 -
Funds from operations 107.5$ 126.3$ 106.7$ 50.4$
Write-off of straight line rent 6.5 1.5 2.8 -
Acquisition costs 5.4 19.4 26.4 6.2
Debt refinancing costs - - 1.7 0.2
Loan and other impairment charges - - 44.1 -
Write-off of other receivables - - - -
Normalized funds from operations 119.4$ 147.2$ 181.7$ 56.8$
For the Twelve Months Ended
NORMALIZED FFOreconciliation

29