Embed Size (px)
Citation preview

Page C1
London Airspace Consultation Part C
Proposed Changes to London Gatwick Routes between 4,000ft and 7,000ft
over parts of Hampshire, Sussex, Surrey and Kent Contents 1 Introduction ........................................................................................... 2 2 Today’s Airspace Usage............................................................................ 4
Runway directions ..................................................................................... 5 Today’s Gatwick arrivals ........................................................................... 10 Today’s Gatwick departures ...................................................................... 10 Traffic to/from other airports ..................................................................... 11
3 Objectives and Justification for Proposed Changes at 4,000ft to 7,000ft ........ 11 Point Merge for Gatwick Airport ................................................................. 11 Point Merge enhances safety ..................................................................... 12 Point Merge reduces delays ....................................................................... 12 Point Merge reduces the area regularly overflown at lower altitudes ................ 13 Point Merge reduces stepped descent ......................................................... 13 Point Merge reduces stepped climb ............................................................ 14 Point Merge enables a reduction in average fuel and CO2 per flight ................. 14 Point merge would change the location of flight paths ................................... 16 Opportunity for Respite Routes .................................................................. 18 Limitations on Route Flexibility .................................................................. 20
4 Local Considerations for Route Positioning ................................................ 20 How to use the maps and data to assess potential effect ............................... 20 Altitude Data .......................................................................................... 21 Tranquillity ............................................................................................. 22 Assumptions ........................................................................................... 22 General characteristics of proposed changes ................................................ 22 Gatwick Airport arrival routes .................................................................... 23 Gatwick Airport departure routes ............................................................... 23 Time sensitive routes and procedures ......................................................... 24 Phase 2 changes ..................................................................................... 25

Page C2
1 Introduction
1.1 This part of the consultation document relates to proposed changes to Gatwick arrival and departure routes through the intermediate airspace (between 4,000ft and 7,000ft1) to the south of the airport.
1.2 These changes have potential effects across the geographic area outlined in black in Figure C1. Figure C1 also shows the neighbouring areas being considered in this consultation. If an area of interest is on, or near, a boundary between two parts, then consideration should be given to the consultation material covering both areas. You may also wish to use our postcode search facility at: www.londonairspaceconsultation.co.uk which will automatically highlight the parts of the consultation document most relevant to that postcode.
1.3 The design and performance of the intermediate airspace being considered in the LAMP consultation is an important issue for both the overall air traffic network and the airport2; this part of the consultation is therefore co-sponsored by NATS and Gatwick Airport.
1.4 NB Farnborough Airport is independently developing the route structures used by its flights. While these Farnborough Airport led changes are beyond the scope of LAMP Phase 1, they will affect some of the same geographic areas covered in this London Airspace Consultation. We would encourage you to go to www.tagfarnborough.com for details of proposals being generated by Farnborough Airport, in addition to considering/responding to this consultation.
1.5 Other air traffic flows, such as Heathrow departures, may also use some of the airspace at higher altitudes over the black outlined area in Figure C1. This proposal is not considering changes to any flows in this area other than Gatwick arrivals and departures. Should any changes be sought for the other flows they would be subject to separate design and consultation at a later date.
1.6 Part A of the consultation document should be read first, as it sets the context for the proposed changes and for the consultation, including a description of the design objectives for airspace change at various heights and what will happen after this consultation.
1 All altitudes stated in the consultation document are above mean sea level 2 Gatwick Airport have a particular interest in local solutions to best manage noise effect for aircraft up to 7,000ft

Page C3

Page C4
1.7 Considerable care has been taken to make this consultation accessible to anyone who may wish to respond. The design and operation of airspace is, by its nature, a complex and technical issue. In order to help readers fully understand the rationale behind the changes being proposed we have, where we feel it appropriate and necessary, gone into some technical details and used relevant terminology. Any technical terms used are summarised in a glossary at Appendix B.
1.8 We aim to provide an understanding of the potential effect of the proposed changes; and to provide an opportunity to feed relevant information into the on-going design process.
1.9 In Part C, in relation to proposed changes in the black-bounded area in Figure C1 (above), we address:
Today’s airspace usage; this section provides a description of today’s flight paths including maps of where they are generally seen
The objectives and justification for the proposed changes; this section describes the kind of route system we are seeking to implement and the potential benefits and impacts. At this stage, we cannot say exactly where the local benefits and impacts will be, so with respect to our objectives we ask you to consider and feedback on the generic effects of the proposed changes rather than impacts on specific places
Local considerations for route positioning; this section describes potential local effects. It asks for your feedback on any location that requires special consideration in the on-going design process, and why we should consider it special. This will help us assess the effects of various design options and identify an optimal solution
1.10 Part G of the consultation document provides additional detail on some of the subjects covered in Part C which may be of interest, but is not required to answer the questions. References to Part G are provided (generally via footnotes) where it provides additional information.
1.11 Questions are highlighted within this document in yellow. You can answer these using the online questionnaire at www.londonairspaceconsultation.co.uk or via the postal address provided in Part A.
2 Today’s Airspace Usage
2.1 Today’s Gatwick airport flight paths are illustrated in Figures C2 to C5. These plots show all flights, not just those between 4,000ft and 7,000ft. We have not limited the altitude of the plots because aircraft above 7,000ft may still be noticeable in and around the area of interest, and because we want to give you a sense of the overall traffic pattern – where flights are going to and coming from. We have provided a series of maps in Appendix E for those wishing to see a more detailed view of aircraft positions at various altitudes.
2.2 The black arrows in Figures C2 to C5 illustrate the general direction of the predominant departure flows and the blue arrows show the same for arrivals. The blue arrows showing a circuit denote the holds (see paragraph 2.6). The purple-outlined areas define the extent of the Noise Preferential Route (NPR). These have a ceiling of 4,000ft and are shown here for reference only. For

Page C5
changes below 4,000ft see Part B of the consultation document. Figures C3 and C5 are replicas of C2 and C4 respectively, but with Areas of Outstanding Natural Beauty (AONBs) and National Park boundaries shown.
2.3 We have provided additional detail in Appendices to the consultation document:
Appendix C provides a pictorial overview of the route network and air traffic flows over London and the South East
Appendix E provides a series of maps showing the location of flight paths at various altitudes
Appendix G provides detailed tables of current and forecast route usage
Appendix I provides details of the traffic samples used to create the maps in this section
Runway directions
2.4 The wind direction on any given day (or hour) dictates which direction the runway is used for take-off and landing. This in turn has a major influence on the traffic patterns in surrounding airspace. If the wind is from the west3, aircraft take off and land in a ‘westerly’ direction. This means that departures take off heading to the west of the airport and arrivals line up towards the airport from the east. When the runway is used in this direction it is referred to as ‘Runway 26’ because the heading that the aircraft fly is 260°.
2.5 If the wind is from the east (less frequent) aircraft take off and land in the opposite direction using Runway 08. Because the prevailing wind is from the west the split in runway usage is typically around 73% Runway 26 and 27% Runway 084.
3 Any wind with a ‘westerly’ component, for example if it was coming from the northwest or southwest, is considered westerly for the purposes of specifying runway direction 4 Source: Gatwick Masterplan 2012

Page C6

Page C7

Page C8

Page C9

Page C10
Today’s Gatwick arrivals
2.6 Gatwick Airport arrivals are currently managed through the use of holding stacks, where aircraft can circle at busy times while waiting to land; these are generally referred to as ‘holds’. These exist in the network at 7,000ft and above but they are relevant here because they have a major influence on the traffic pattern below 7,000ft.
2.7 If several aircraft arrive at the same time they are instructed to circle in the hold, stacked one above the other at 1,000ft intervals. Air traffic control typically peels the aircraft off from the lowest altitude of the hold and directs it towards the runway. Once an aircraft has vacated the lowest altitude of the hold, air traffic control can descend all the aircraft above one at a time to the next lowest vacant altitude, like the rungs of a ladder5.
2.8 Air traffic control direct aircraft off the hold into an efficient stream or ‘sequence’ for landing. An efficient sequence is where aircraft are safely spaced, ensuring the runway is fully utilised and that flights are not unnecessarily delayed in the air.
2.9 Ensuring that the spacing between aircraft is optimal reduces the time aircraft spend queuing to land; in turn this reduces passenger delay, CO2 emissions and the local noise/visual impact of aircraft spending more time in the air than necessary. It also reduces delay on the ground at Gatwick Airport as an efficient landing sequence is key to minimising departure delay.
2.10 Air traffic control currently arrange aircraft into the required sequence by manually varying their routes (known as ‘tactical vectoring’ or ‘vectoring’) as the aircraft descend from 7,000ft towards the runway; some aircraft are given longer flight paths, and some shorter, so that the spacing between them when they finally line up to land is just right. This variance means that aircraft flight paths from 7,000ft do not follow a single path and can be spread over a wide area, as shown by the wide spread of arrivals in Figures C2 and C4.
Today’s Gatwick departures
2.11 The flight densities shown in Figures C2 and C4 also show the Gatwick Airport departures through the region.
2.12 There is a set of fixed routes for departing aircraft. Aircraft on the routes to the south6 from either runway are constrained to 5,000ft - 6,000ft to keep below the arrival routes, the holds and Heathrow departures. Air traffic control therefore try to direct aircraft off the routes heading south once they are above 4,000ft7, to give them further climb as soon as possible.
5 A short video including an explanation of holding is available on the consultation website at www.londonairspaceconsultation.co.uk 6 This affects the departure routes heading out over the south coast referred to in air traffic control terms as the BOGNA, HARDY and Seaford (SFD) routes. 7 Below 4,000ft aircraft Gatwick departures must be kept on their noise preferential routes – see Part B for discussion of NPRs

Page C11
2.13 For Runway 26 departures (Figure C4) this leads to these departures being lower than is optimal8 and spread out over a large area once past 4,000ft. This is demonstrated in Figure C4 by the traffic density of the departure route heading south, which fades from red on passing Horsham – this indicates that traffic has reached 4,000ft and is being dispersed rather than following a common flight path.
2.14 Runway 08 departures to the south show much more consistency with a clear red density out to beyond Lewes (at the bottom of the map in Figure C2). This route is also constrained at 6,000ft below Gatwick Airport arrivals; however, because the departure flow has to pass between the holds shown in Figure C2 there is little opportunity for air traffic control to give alternative heading instructions; hence the traffic remains on the published route more often (and so the red density showing a high concentration of flight paths on Figure C2 extends much further to the south than for Runway 26).
Traffic to/from other airports
2.15 Figures C2 to C5 only show Gatwick traffic flows; traffic to/from other airports may be seen overflying these areas, in particular Heathrow departures, although these aircraft are mostly at higher altitudes. We are not proposing changes to any of these other traffic flows at this time.
2.16 Traffic to/from Farnborough airport also utilises some of this airspace; Farnborough Airport is independently developing the route structures used by its flights – see Paragraph 1.4 for more on Farnborough Airport changes.
3 Objectives and Justification for Proposed Changes at 4,000ft to 7,000ft
3.1 This section describes our objectives for changing the routes used by air traffic to/from Gatwick Airport; it describes what we are trying to achieve and the generic benefits/impacts that would result; we then seek your view on these objectives. Specific local considerations are discussed in Section 4, while fuel burn implications for specific routes and effects on specific aviation users are discussed in Part G.
3.2 We have been working for some time on developing the best approach for using PBN9 to improve the way in which we manage air traffic. The conclusion of this work is that a system based on ‘Point Merge’ for Gatwick airport arrivals can best realise the benefits available from PBN.
Point Merge for Gatwick Airport
3.3 Point Merge is a system by which the aircraft in a queue to land fly an extended flight path around an arc instead of holding in circles. They fly along the arc until the next slot in the landing sequence is free, at which time air traffic control (ATC) will turn the aircraft off the arc into the landing sequence.
8 Aircraft at low altitudes will burn more fuel than those at higher altitudes and will generally also have a greater noise impact. 9 See Part A for an overview of modern navigational technology (referred to as PBN) and its relevance to this proposal.

Page C12
Extending the flight path in this way means that aircraft queue one behind another, rather than one above another.
3.4 The Point Merge airspace for Gatwick arrivals is all above 7,000ft, and is therefore described in detail in Part D of the consultation document. However, it would also enable the following generic benefits to the operation of airspace between 4,000ft and 7,000ft:
Enhanced safety
Reduced delays
Fewer areas overflown at lower altitudes
Reduction in stepped descent
Reduction in stepped climb
Reduced average fuel and CO2 per flight
3.5 Point Merge will change the local noise and visual impacts of aviation as it will change the spread of flight paths across the sky from what is seen today; some areas may be overflown more, others less and some will not notice any significant change. Other than this potential change in local effects, which may be positive or negative, we are aware of no other detrimental environmental consequences.
3.6 The potential benefits and impacts are discussed in more detail below. Further details of operational benefits and issues are also provided in Part G.
Point Merge enhances safety
3.7 Holds and the associated vectoring required to develop the landing sequence (see Section 2) are a particularly complex operation. Although it is complex, this system has been in use worldwide for many decades. It is, however, generally accepted that a reduction in complexity will enhance safety. Point Merge is a more predictable system where the aircraft flight paths are less complex; its introduction therefore offers the opportunity to further enhance the safety of the air traffic network.
Point Merge reduces delays
3.8 The number of aircraft that the air traffic controllers can manage in any given hour is limited for safety reasons – complexity is a key factor that determines what the limit is for a given sector of airspace. Once it is predicted that the limit will be reached, additional flights due to pass through the sector are delayed until such time that they can be safely accommodated.
3.9 Point Merge helps sort the air traffic into an efficient sequence at higher altitudes, reducing the complexity of the operation and therefore increasing the number of aircraft the controller can safely handle. This is referred to as an increase in the airspace capacity which also means a reduced likelihood of delay for arriving aircraft and their passengers.
3.10 Delay was becoming a significant issue until the economic downturn in 2008 depressed traffic levels. Air traffic levels are now recovering, albeit slowly, and without a change to the way in which air traffic is managed we will see an increase in delays as traffic levels grow.

Page C13
3.11 Testing has shown that the improved system efficiency that Point Merge enables will be able to accommodate forecast air traffic growth10 to 2025 without significant delay. NATS operates under the terms of our Air Traffic Services Licence, which requires us to be capable of meeting, on a continuing basis, any reasonable level of overall demand for air traffic control services. Airspace change is required to accommodate growing demand; growth in the overall number of flights is therefore assumed with or without this proposed airspace change.
Point Merge reduces the area regularly overflown at lower altitudes
3.12 Air traffic control vary aircraft flight paths between the hold and the runway in order to generate the optimum sequence for landing. As a consequence aircraft flight paths from the hold to the runway are spread over a wide area (see Paragraph 2.10).
3.13 Point Merge not only provides a queuing area, it also helps ATC sort the aircraft into an efficient sequence at higher altitudes than today (above 8,000ft, compared to the vectoring which occurs today on leaving the holds at 7,000ft and below). In turn this means that flight paths to the runway can be flown more consistently, with distinct environmental benefits:
The spread of traffic is much less, so the extent of the area where aircraft are regularly flying directly overhead is smaller - this is in line with Government guidance (see Appendix A);
The routes can be positioned to reduce overflight of populations and/or environmentally sensitive areas below 7,000ft;
Consideration can be given to additional routes for respite purposes.
Point Merge reduces stepped descent
3.14 Point Merge provides more predictability for flight crew compared to today’s approach environment in which pilots follow specific instructions from ATC rather than follow a fixed route.
3.15 More predictability means the flight crew can plan a more gradual descent rather than a ‘stepped’ descent where aircraft descend in stages, often with long periods of level flight at low altitudes. Minimising stepped descent can reduce noise impact and improve fuel efficiency; saving fuel means less CO2. It can offer such an efficiency improvement that it can often present an overall benefit even if aircraft flight paths are extended in order to achieve it11,12.
3.16 Gatwick Airport airspace changes alone would not guarantee continuous descent; however, Point Merge would reduce the extent of stepped descents and increase the likelihood of continuous descent in the short term. It would also pave the way for it to become more common in the future as
10 The forecast growth used to underpin the analysis presented in this document can be found at Appendix G. 11 A short video explaining the benefits of airspace change – including those from continuous climbs and descents - can be found at www.londonairspaceconsultation.co.uk. 12 Overall CO2 efficiency is discussed in 3.22 to 3.26. Further details and a route by route analysis are provided in Part G.

Page C14
neighbouring airspace is changed, and wider changes to the air traffic management system are put in place.
Point Merge reduces stepped climb
3.17 Aircraft operate more efficiently at higher altitudes meaning less fuel is burned, therefore emitting less CO2 into the atmosphere. Aircraft at higher altitudes are also less likely to cause local impact from noise or visual intrusion. It is therefore in everyone’s interest that departing aircraft can climb efficiently to higher altitudes, minimising ‘steps’ where they have to stop climbing and fly level for a period, often at lower altitudes13.
3.18 Today’s routes for Gatwick Airport southbound departures14 have a number of climb restrictions, most notably where they pass under or near the existing holds; here the departing aircraft must plan to stop climbing at around 6,000ft until they have passed safely under the hold.
3.19 Replacing the holds with the Point Merge system would reduce the likelihood of these altitude restrictions, and allow Gatwick Airport departures to climb to high altitudes more efficiently. It would, however, mean changing the positioning of the southbound departure routes above 4,000ft (Point Merge will not affect departure routes below 4,000ft; however, changes to these routes are being considered for other reasons – see Part B).
3.20 By facilitating climb in this way, Point Merge would enable aircraft to more quickly achieve 7,000ft where noise is considered less of a nuisance (see Government guidance at Appendix A), climbing more quickly to efficient cruising altitudes also provides a contribution to the fuel and CO2 savings discussed below. Continuous climb offers such an efficiency improvement that it can often present an overall benefit even if aircraft flight paths are extended in order to achieve it15.
3.21 The positioning of Gatwick Airport departure routes below 4,000ft and above 7,000ft is discussed in Parts B and D respectively of the consultation document.
Point Merge enables a reduction in average fuel and CO2 per flight
3.22 We have undertaken computer based simulation modelling to assess the potential fuel benefits that the implementation of Point Merge would enable across the network, including changes to the arrival routes feeding into the Point Merge system and changes to neighbouring departure routes. This has estimated that the fleet operating today at Gatwick Airport would plan to carry between 7,100 and 14,200 tonnes (t) per year less fuel in 201616. Given forecast traffic increases, this estimated saving is expected to rise to between 8,000t and 16,000t in 2025. The range is wide because we have not yet
13 See footnote 11 on page C13 14 These are the departure routes heading out over the south coast referred to in air traffic control terms as the BOGNA, HARDY and Seaford (SFD) routes – see Part G for more details. 15 See footnote 12 16 This is the total reduction in planned fuel across the fleet for all journeys – arrivals and departures - in 2016. For more detail in fuel planning including how the proposal affects individual route efficiency see Part G.

Page C15
established the final position of the routes which will be established with the benefit of the feedback from this consultation. See Appendix G for details of forecast traffic.
3.23 The savings in planned fuel give an indication of the potential CO2 savings as the amount of CO2 emitted is directly proportional to the amount of fuel burned; 1 tonne less fuel burned means 3.18 tonnes less CO2 released into the atmosphere17 and so the above fuel figures indicate potential CO2 savings of up to 51,000t per annum18. However, it may be that some of this CO2 saving is already being realised, as air traffic control often navigate aircraft off their planned route – for instance, to provide shortcuts19,20. Therefore the future savings in planned fuel (described in the previous paragraph) may not translate fully into savings of CO2.
3.24 Once we have undertaken detailed design work considering all the consultation feedback, we will undertake further analysis to determine the expected effect of Point Merge on average CO2 per flight21. While we are not able to quantify the benefit at this stage, we will ensure that the reduction in planned fuel means that average CO2 emitted per flight would reduce.
3.25 We will be faced with choices in terms of positioning the routes; these choices depend on operational factors, in particular safety and efficiency, and on environmental factors such as minimising overflight of certain areas whilst also minimising fuel burned and associated CO2 emissions.
3.26 We have to consider whether flying a longer route to avoid a particular area outweighs the cost in terms of fuel and CO2. On average, adding one nautical mile22 to a typical Gatwick Airport flight such as an Airbus A319 at 6,000ft will result in an extra 11kg fuel burned per flight. If this was applied to all Gatwick Airport flights, it would relate to approximately 2,800t more fuel (8,900t of CO2) per year in 2016 rising to over 3,200t fuel (10,100t CO2) in 2025. In addition to the environmental costs, financially this would cost the airlines (and ultimately their passengers) £1.8m per annum in 2016 rising to £2.1m per annum by 202523.
17 The mass of CO2 emitted is greater than the mass of fuel burnt because the oxygen component of CO2 is drawn from the atmosphere rather than the fossil fuel itself (which provides the carbon component). 18 These figures represent the saving as a result of the proposed change compared with the ‘do-nothing’ scenario, assuming the same number of flights for both scenarios. They do not represent a reduction in the overall amount of CO2 – the main factor in overall CO2 is the growth in the number of flights; this is beyond the scope of this consultation (see Part A Section 3). 19 Aircraft plan their route along a defined route structure. This route structure is generally designed such that neighbouring routes do not cross one another at the same level. This can mean that, in places, published routes are lengthened to avoid one another. If there is no traffic on nearby routes then there may be no reason to follow the lengthened route. In these circumstances ATC can consider giving the aircraft an instruction to go direct to a point further along their route, thereby providing a shortcut. 20 As airspace gets busier ATC tend to rely more on the route structure as there is less space and time to provide alternative instructions. Therefore we expect this ATC intervention to gradually become less common in the future as traffic grows. However, some intervention will always occur; for example shortcuts are always an option during periods of light traffic such as at night. This would be the case for both the current airspace structure and with a new Point Merge structure. 21 Estimating the likelihood and effect of air traffic control intervention requires assessment of the detailed design; therefore this estimation cannot occur until after consultation and subsequent design work has been undertaken. 22 Aviation measures distances in nautical miles. One nautical mile (nm) is 1,852 metres. One road mile (‘statute mile’) is 1,609 metres, making a nautical mile about 15% longer than a statute mile. 23 Using a typical aviation fuel cost of £650 per tonne. The figures shown are rounded.

Page C16
Altering routes to fly around environmentally sensitive areas rather than overhead is likely to mean more fuel burn and more CO2 emissions because the altered route would usually be longer. In general, which should take precedence - minimising overflight of sensitive areas by flying a longer route around them, or flying the direct route overhead the area to keep the route shorter and minimise fuel burn and CO2? Flying longer routes around environmentally sensitive areas should always
have greater precedence than flying overhead on shorter routes which minimise fuel burn/ CO2
Flying longer routes around environmentally sensitive areas should generally
have greater precedence than flying overhead on shorter routes which minimise fuel burn/ CO2
Flying longer routes around environmentally sensitive areas should be given
equal weighting to flying overhead on shorter routes which minimise fuel burn/ CO2
Flying shorter routes which minimise fuel burn/CO2 should generally have
precedence over flying longer routes around environmentally sensitive areas Flying shorter routes which minimise fuel burn/CO2 should always have
precedence over flying longer routes around environmentally sensitive areas Don’t know What, if any, factors should be taken into account when determining the appropriate balance of flying around environmentally sensitive areas versus overhead (for instance the altitude of the aircraft may be a factor, or the frequency/timing of flight)?
Please go to the online questionnaire at www.londonairspaceconsultation.co.uk to give your answers to these questions
Point Merge would change the location of flight paths
3.27 Part A of the consultation document describes how the introduction of PBN will inevitably result in some changes to where aircraft flight paths are seen in the future, regardless of whether the system is based on Point Merge or otherwise. The application of Point Merge would, however, influence the general characteristics of the new traffic patterns for both arrivals and departures.
3.28 Figures C2 and C4 show how flight paths today can be seen over the whole area of interest; this will continue to be the case, although the areas in which they are concentrated is likely to change. Overall we expect Point Merge to mean a reduction in local impact because of the generic benefits from reduced flight path dispersal, and more continuous climb/descent as described above. However, whilst many areas would experience less impact (fewer flights overhead, or flights overhead at higher altitudes), some others would

Page C17
experience more as traffic patterns shift (ie the brightly coloured areas in Figures C2 and C4 would shift and become more concentrated around the new PBN routes24).
3.29 Questions on what should influence the positioning of the Point Merge routes are the subject of Section 4. However, in addition to feedback on local matters, this consultation is seeking feedback on whether the objective of changing today’s route system to one based on Point Merge is justified, given the generic benefits and impacts described in this document. Answering this question does not prevent you from providing information on local sensitivities in answer to the questions presented later in Section 4; for example you may support the objective of Point Merge but have strong views on areas that should be avoided. Equally you may have information that we have not considered that leads you to oppose Point Merge in principle, regardless of local issues. Please use the question below to express your view on the general principle and the question in Section 4 to provide specific local information.
3.30 This part of the consultation document is specific to environmental stakeholders beneath the intermediate airspace between 4,000ft and 7,000ft; there are additional benefits and impacts relating to Point Merge that specifically affect network airspace above 7,000ft, and which specifically affect the aviation community; more detail on these can be found in Parts D and G respectively of the consultation document.
This proposal is seeking to change the way aircraft use airspace by developing a system for managing arrivals based on Point Merge, rather than the holding stacks/vectoring currently in use. Please indicate the extent to which you support or oppose our objective of providing a future arrival system based around Point Merge. Please provide any additional information you think is relevant to our objective to redesign arrival routes around a Point Merge system. NB separate questions are provided in Section 4 to identify specific local considerations relating to the positioning of the routes associated with Point Merge.
Please go to the online questionnaire at www.londonairspaceconsultation.co.uk to give
your answers to these questions
24 If this proposal is accepted, we expect that change to observed flight paths would be spread over a period of time. This will be partly due to the phasing outlined in Part A, but also because the airspace structure is part of a wider system including the aircraft, engineering systems and the air traffic controllers themselves. Although changes to the route structure happen instantaneously, the operation of airspace would evolve over time as the different systems and working practices possible in a PBN environment are adopted. The likelihood of gradual change is discussed in more detail in Part G. This means that new routes would have an immediate effect in places and a more gradual one in others.

Opp
3.31 Respa paroutweepredbelo
Figure C6 Figure C7
3.32 The predaddiinter
Singlsolutioexperithe ov
portunity
pite routesarticular dites in line k, which w
dictability aow.
6: Respite
7 Respite r
PBN techndictability otional resprmediate a
e route n: Area Y ences all verflight
for Resp
s are wherrection. Twith an ag
would givearound po
routes co
routes con
nology undoffered bypite routesairspace (4
Singsolutioexperithe o
P
ite Route
re more thThis meangreed schee the popuotential im
ncept for
ncept for a
derpinningy Point Mers for Gatw4,000ft to
le route n: Area A iences all verflight
Page C18
es
han one ros that all aedule, for lations bepact. This
departure
arrivals
g the chanrge, provid
wick Airpor 7,000ft) o
Respitsolution: Oshared,
area afdou
oute is impaircraft woexample bneath the s is illustra
es
nges in thisde the opprt arrival aoutlined in
te route Overflight isbut overall ffected is ubled
plementedould alternby time an routes a dated in Fig
s proposalportunity tnd depart
n black in
Respso
Ovesharoveraffedo
d for air tranate use ond/or day degree of
gures C6 a
l, and the to considetures in thFigure C1
pite route lution: rflight is red, but rall area ected is oubled
affic in f the of the and C7
er e .

Page C19
3.33 However, developing additional routes for respite purposes may not be practical in all circumstances. For example it is not currently an option to vary the final approach itself. Additional routes also take up more space and make the airspace more complex; the route system around Gatwick Airport is already congested which limits the operational practicality of developing additional respite routes. There are also potential limitations as a result of the impact of multiple routes on aircraft and air crew. It is therefore not likely to be operationally feasible to consider respite routes as a possibility on all routes; however they may be a possibility on a limited number of routes if they are deemed to be particularly beneficial given local circumstances.
3.34 Additional routes also have some disadvantages; environmentally it would mean that the overall area subject to regular overflight would be approximately double what it would be with a single route solution - albeit following a predictable schedule (see Figures C6 and C7). Additional routes for respite purposes may also be longer in which case there may be fuel and CO2 implications – see paragraph 3.25 to 3.26.
3.35 In Section 4 below, you can provide information on local issues that may influence where and how respite routes might be applied. Here, we would like your feedback on the objective of providing respite routes given the generic benefits and impacts discussed above.
This proposal is considering extra routes to enable periods of respite. This would mean implementing two routes in a particular direction instead of one, with a schedule for using each route to provide periods of relative respite for people living in the area beneath the routes. While this would provide respite, it would also increase the geographic area regularly exposed to noise. Please indicate the extent to which you support or oppose this objective of providing respite routes, given that it potentially impacts more people in order to offer respite. Please consider this for respite routes below 4,000ft, and/or respite routes between 4,000ft and 7,000ft. Please state the reasons why you support or oppose the objective of providing respite routes below 4,000ft and/or between 4,000ft and 7,000ft. NB a separate question is provided in Section 4 to identify specific local considerations.
Please go to the online questionnaire at www.londonairspaceconsultation.co.uk to give your answers to these questions

Page C20
Limitations on Route Flexibility
3.36 There are limitations to what can be achieved in terms of general route positioning to reduce overflight of particular areas. These relate to:
Manoeuvrability - aircraft fly at high speeds; this limits how tightly, and how often, aircraft can turn in order for the route to be considered flyable and safe (this is governed by international design standards)
Balancing conflicting requirements - for example, flying a longer route in order to reduce the number of people affected by noise from low altitude traffic, versus the environmental impact of additional CO2 emissions and financial fuel cost of doing so (see paragraph 3.26).
Local environmental trade-offs – avoiding overflight of one area would mean overflight of neighbouring ones. In particular avoiding overflight of a town will necessitate flying over neighbouring countryside which may be valued for its relative tranquillity. Part A describes the generic framework for determining how to position routes given the priorities for routes at certain altitudes. The question presented in section 4 seeks information on local issues that we should consider when applying the priorities and determining the position of routes.
4 Local Considerations for Route Positioning
4.1 The application of PBN and Point Merge for Gatwick Airport would result in changing traffic patterns; some areas would experience more flights overhead, some fewer, and some would experience little change. We are consulting early in the design process and have not yet fixed the position of the routes, so that your feedback on local issues can be considered in determining the position of these routes.
4.2 All the maps presented in this section are available to view on the website at www.londonairspaceconsultation.co.uk; these online maps can be interrogated using the postcode search function. You can also zoom in on maps and switch easily between the current day traffic picture and the consultation swathes for the new routes.
How to use the maps and data to assess potential effects
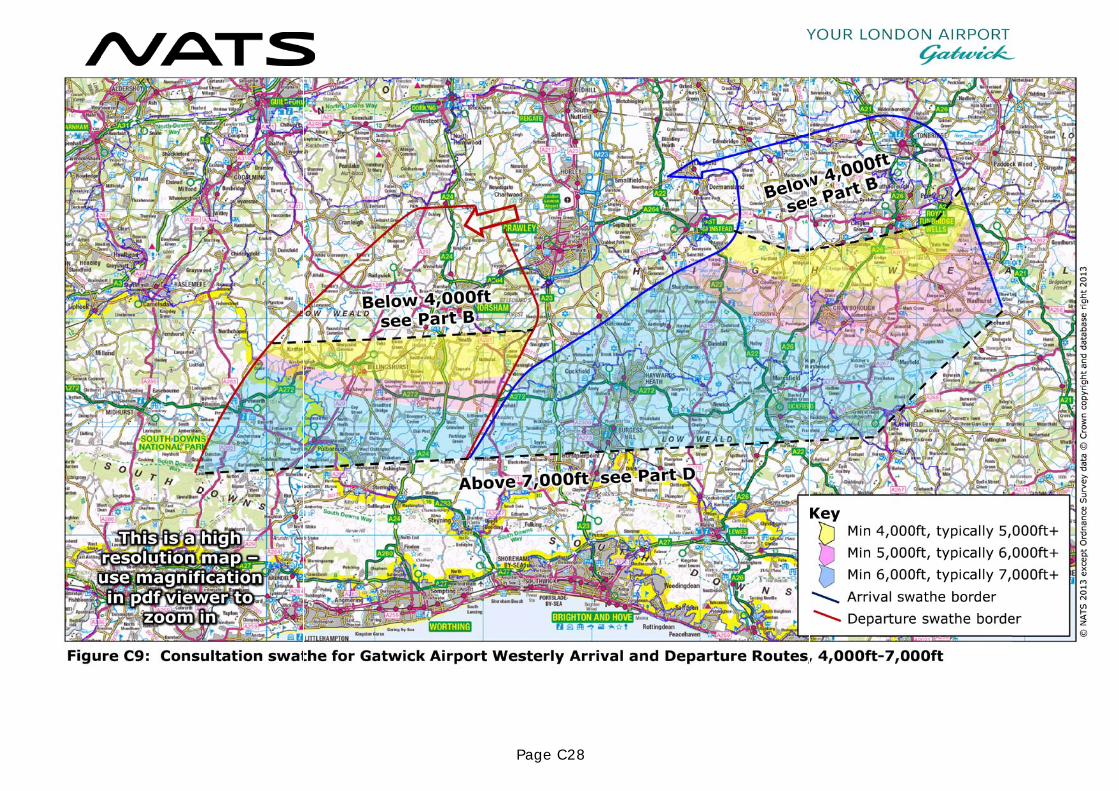
4.3 We provide information to help answer the questions “Would the change mean more overflights? And if so how many aircraft and what is the potential effect?” This information is in the form of maps and data that indicate potential noise and visual impacts across a consultation swathe covering all the options for the positioning of the new PBN routes described in this document (it does not cover existing routes/flight paths that are not subject to change). The consultation swathes themselves are shown in the maps found in Figures C8 and C9, with supporting data provided on the preceding page. Figures C8 and C9 may be directly compared to the maps in Figures C2 and C4 which show today’s air traffic flows.
4.4 The noise and visual impact experienced at a given location will depend on where the route is positioned within the consultation swathe; high concentrations of traffic would be directly overhead only a small proportion of the overall area. We are asking you to consider that the routes in question

Page C21
could be positioned anywhere within the consultation swathe, and to be mindful therefore that anywhere within the consultation swathe has the potential for noise and visual impact.
4.5 Information on the scale of potential impact is presented; this information describes:
The potential number of aircraft that would fly on the route and which may be overhead subject to the final route position within the consultation swathe; a summary is provided on the data page preceding these maps and Appendix G provides further detail
The altitude these aircraft would be25; this is shown by the shading on the maps themselves; this information is discussed in more detail in the paragraphs below
A measurement of how loud aircraft at that height would sound at ground level (a metric referred to as Lmax) – this would also be dependent on the aircraft types expected; a summary is provided on the data page preceding these maps with links to further detail
Altitude Data
4.6 The altitude information presented on the maps shows a worst case altitude and an indication of typical altitude for aircraft during normal operations26. The worst case represents the lowest altitude we would normally expect an aircraft to be on the flight path in question. For example, the start of the ‘minimum 4,000ft’ height band on a map for a departure route is the area by which we would normally expect all aircraft to have reached 4,000ft. This would include the worst case of a slow climbing aircraft. Slow climbers are generally the larger/older aircraft types such as A340 – most aircraft significantly outperform these slow climbers and would therefore be higher.
4.7 The typical altitude is shown to indicate that most aircraft will be significantly above the worst case; however, determining typical altitudes for aircraft across a wide swathe for a future airspace design is not an exact science. We have therefore erred on the side of caution with these typical values and so even they do not represent the true range of altitudes that aircraft may be. Additional maps showing the range of typical heights achieved today is provided in Appendix E; in general we expect the proposed changes to mean that for a given location aircraft will be at the same or higher altitudes than shown today in Appendix E.
4.8 Whilst this variation in altitudes would happen in reality it is difficult to represent in a consultation document; we therefore suggest that as a default, stakeholders should consider the potential impact of aircraft at the minimum altitude shown in Figures C8 and C9.
25 The maps show altitude which is height above mean sea level. Stakeholders should take account of the elevation of any area of interest when considering the maps and this data table. For example, if an area of interest is marked in the map beneath changes with minimum altitude of 5,000ft, but the ground level is 500ft, the actual minimum height the aircraft above the ground would be 4,500ft. 26 Excluding any variation for safety reasons, or unusual circumstances such as extreme weather.

Page C22
Tranquillity
4.9 Another factor that may determine the significance of a potential impact is tranquillity. CAA guidance for airspace change does not provide a method for assessing tranquillity. Any assessment will therefore be subjective and dependent on the specific location in question. The Government guidance (see Appendix A) specifically mentions AONBs and National Parks and so we have highlighted them on the maps in Figures C3 and C5 for comparison with the consultation swathes in Figures C8 and C9; you may wish to consider the potential effect on tranquillity when providing feedback.
Assumptions
4.10 In order to ensure you do not underestimate the potential impact on a particular location we ask you to assume that all aircraft are kept on the route in question rather than being vectored off it by air traffic control; in reality vectoring would still happen some of the time. This assumption, combined with the worst case assumptions regarding altitude described above, means that the potential impact may be overestimated. In turn, the result of this may be more feedback for us. However, we believe that this assumption is prudent and favourable over one which risks that potential effects are underestimated.
4.11 It is also important to emphasise that the consultation swathes presented are much wider than the routes which will be positioned within them. The maximum number of overflights shown would apply only to the areas below the eventual route position; most of the consultation swathe will therefore have fewer overflights than today27.
General characteristics of proposed changes
4.12 Part A describes how we are consulting at a relatively early stage in the design process. This means we have not yet decided on the position of the routes we are seeking to change, and so we are presenting the wide consultation swathes which encompass all the options. The following paragraphs present the consultation swathes and describe the key factors that determine where they sit. The consultation swathes are all much wider than the routes that need to be positioned within them; hence we still have flexibility to consider different options based on feedback to this consultation.
4.13 The traffic data shown on the page preceding Figures C8 and C9 shows a forecast of the average hourly number of flights across generic daytime and night-time periods as defined in the CAA guidance (see Appendix A); these periods are respectively 0700-2300 and 2300-0700. This data presents headline traffic numbers which can help stakeholders quickly assess the potential impact. A full traffic breakdown can be found in Appendix G.
27 The new routes will tend to concentrate traffic. If more air traffic is concentrated on or around the route, it means there would be fewer to overfly adjacent areas.

Page C23
Gatwick Airport arrival routes
4.14 Figures C8 and C9 show the consultation swathes for positioning the proposed arrival routes which would take aircraft from the Point Merge route system down to 4,000ft. The Point Merge system will deliver traffic at 7,000ft in roughly the same areas as achieved by today’s holds, and therefore these consultation swathes cover a similar area to that highlighted by the brighter colours in Figures C2 and C4. While we have generally followed the existing traffic spread we have also extended it slightly in places to ensure that we present options for overflight of either rural or more populated areas.
4.15 The consultation swathe for an arrival route at a minimum of 8,000ft that brings air traffic from the north to the holds/Point Merge to the south of the airport (see Part D) partially overlaps the swathes shown in Figures C8 and C9. This higher altitude route comes roughly from Haslemere heading in a south/southeasterly direction. The local impact of an aircraft on this route would be less than for the lower altitude routes and there would be fewer flights on it. Any feedback on the proposed changes regarding routes below 7,000ft will also be fed into the design process for higher altitude changes over the same area; in order to keep the consultation as straightforward as possible we have not provided separate maps and data for this route.
Gatwick Airport departure routes
4.16 Figures C8 and C9 also show the consultation swathes for departure routes for Runway 08 and Runway 26 respectively. We expect that all departures off Runway 08 will pass 4,000ft shortly after passing East Grinstead28. From here we will seek a route alignment to take the departures around the eastern edge of the Point Merge route system which will be positioned somewhere to the south. We do not yet know where the Point Merge routes will be positioned (this is discussed in Part D) so the departure consultation swathe is wide, with the western extent not dissimilar to today’s departure route alignment, and the eastern extent reaching beyond Crowborough. While the positioning of the departure route within this consultation swathe will be influenced by the position of the Point Merge system to the south, it is sufficiently wide to ensure that there will still be flexibility to take account of local feedback.
4.17 For Runway 26 (Figure C9) the yellow consultation swathe for southbound departures covers a broad area from just west of the A23, spreading eastwards past Billingshurst. This area is much wider than the end of today’s NPR which passes west of Horsham (see Figure C4). We are consulting across this broad swathe because Gatwick Airport is considering realignment of the Runway 26 departure routes below 4,000ft (see Part B), and therefore the point at which traffic would pass 4,000ft into the intermediate airspace,
28 The 4,000ft-7,000ft consultation swathe shown in C6 begins before the end of the NPR shown in Figure C2. We are building an airspace design to last to 2025 at least (see Part A) and therefore it is being developed using aircraft performance characteristics for modern aircraft. The NPR was defined decades ago using performance assumptions that are not representative of the vast majority of today’s fleet. The NPRs are owned by the Government; as part of this airspace change the airport will raise with the Government (and /or the CAA as their representative) opportunities to redefine existing NPRs to more accurately represent aircraft performance. Any changes will, however, be the decision of the Government and/or the CAA.

Page C24
potentially via a new NPR, is not yet known; our consultation swathe above 4,000ft is therefore wide to cover all the options29.
4.18 From 4,000ft we will seek a route alignment to take the departures around the western edge of the Point Merge route system, which will be positioned somewhere in the region to the south of the airport. As with Runway 08 departures we have drawn the Runway 26 consultation swathe to be sufficiently wide to ensure that there will still be flexibility to take account of any local feedback.
Please indicate which, if any, place(s) or area(s) within the consultation swathes you think require special consideration in the on-going design process. Please describe the characteristics of these locations, stating whether they should be considered due to concerns about noise impact, visual impact and/or any other impact. Please refer to the consultation swathes highlighted on the maps in Figures C8 and C9.
Please go to the online questionnaire at www.londonairspaceconsultation.co.uk to give your answers to these questions
Time sensitive routes and procedures
4.19 We have asked for feedback on the objective of providing respite routes (see paragraphs 3.31 to 3.35); however, the application of respite routes may be particularly relevant to specific areas within the consultation swathes shown in Figures C8 and C9. For example, a popular tourist attraction may be particularly sensitive at weekends and on public holidays but less so at night. Alternatively, the impact on population centres may be more acute at night when there is less background noise.
In what, if any, geographic locations should options be considered for altering routes for respite purposes? What should the criteria be?
Please go to the online questionnaire at www.londonairspaceconsultation.co.uk to give your answers to these questions
29 Unlike Runway 08, we are unable to identify how the NPR for Runway 26 departures may be shortened because the airport are considering complete redesign of Runway 26 departure routes below 4,000ft (see Part B). The result of this consultation and design work will dictate what the low altitude route structure will look like and how it would deliver traffic into the intermediate airspace above 4,000ft. For the purposes of this consultation we have therefore drawn the consultation area based on the extent of the existing NPR – should later design work highlight opportunities to shorten the NPR we will raise them with the Government and/or the CAA.
Page C25
Phase 2 changes
4.20 Part A of the consultation document describes how this consultation is part of a phased development of airspace across a wide region of London and the South East.
4.21 This consultation is relevant for the Phase 1 proposals, and is also relevant for any further development of the same airspace required for Phase 2. Reconsultation on the areas covered here is not required for Phase 2 unless the Phase 2 design work identifies new effects that we have not captured in this consultation document. In the event of any new effects we will add them to the Phase 2 consultation. Regardless of this we will continue to engage with key representative bodies (such as consultative committees, planning authorities and aviation groups) as part of the Phase 2 development programme to ensure that the design process is transparent.
Please provide any other information that you feel is relevant to the on-going development of the airspace covered by this consultation.
Please go to the online questionnaire at www.londonairspaceconsultation.co.uk to give your answers to these questions

Page C26
Notes for Figures C8 and C9 The coloured shading on Figure C8 denotes the consultation swathe for positioning the Gatwick Airport Runway 08 arrival and departure routes between 4,000ft and 7,000ft.
Figure C9 presents the same information for Runway 26.
The final positions of the routes within these areas will be determined after consultation feedback has been analysed. The position of the routes will determine how areas within the shaded regions are impacted; areas beneath the final routes would expect more overflights than today, and areas away from the routes would expect fewer.
Table C1 shows the potential number of flights that could pass directly overhead if the route was positioned overhead – this table applies to both Figures C8 and C9. This is a pessimistic prediction as it assumes all aircraft are kept on the route in question rather than being vectored off it by air traffic control; which in reality would occur some of the time. A detailed traffic breakdown is provided in Appendix G.
Route 2016 2020 2025 Arrival daytime (0700-2300) 20 21 23 Arrival night time (2300-0700) 4 4 5 Southbound departure route daytime (0700-2300)
6 6 7
Southbound departure route night time (2300-0700)
2 2 2
Table C1: Forecast for Gatwick route usage – numbers are hourly averages - see Appendix G for a more detailed traffic breakdown
Table C2 provides Lmax noise information for the typical and noisiest aircraft regularly flying to/from Gatwick. More noise information can be found in Appendix J. Lmax is the maximum noise at ground level from an aircraft flying directly overhead. The Lmax values may be compared to Table C3 for everyday equivalents. Additional overflight videos are provided on the webpage to help stakeholders understand what aircraft at various altitudes may look and sound like.
Aircraft type % of flights
4,000ft-5,000ft
5,000ft-6,000ft
6,000ft- 7,000ft
Typical Arrival A320/B737 series30
72.2% 59 – 61 dBA
57 - 59 dBA
56 - 57 dBA
Noisiest Arrival B747-400
1.5% 64 - 67 dBA
61 - 64 dBA
59 - 61 dBA
Typical Departure A320/B737 series
72.2% 63 - 66 dBA
60 - 63 dBA
59-60 dBA
Noisiest Departure B747-400
1.5% 72-75 dBA
69-72 dBA
67-69 dBA
Table C2: Typical Noise (Lmax) at various heights31
Noise Noise level (dBA) Chainsaw, 1m distance 110 Disco, 1m from speaker 100 Diesel truck pass-by, 10m away 90 Kerbside of busy road, 5m away 80 Vacuum cleaner, distance 1m 70 Conversational speech, 1m 60 Quiet office 50 Room in quiet, suburban area 40 Table C3: Tables of Lmax Equivalents Source: Airports Commission, based substantially on www.sengpielaudio.com/TableOfSoundPressureLevels.htm
30 Includes the following aircraft types: Airbus A318/319/320/321, Boeing 737-600/700/800/900 (Ancon category, 125-180 seat single-aisle 2-eng jet) 31 This table shows Lmax at a height above ground level. Local elevation should be taken into account. See footnote 25

Page C27
Page C28