Embed Size (px)
Citation preview

Measuring Credit Risk of CBs andDeriving Term Structure of Default
Probabilities一橋大学研究集会【金融工学からERM】へ
Takeaki KariyaGraduate School of Business
Advanced Mathematical SciencesMeiji University
(Jointly with Y.Yamamura, K.Inui, Z.Wang)[email protected]
1Credit Spread

Problem of Measuring Credit Risk
• Credit risk = Probability that a firm breaks a financialcontract
• Basic information on credit risk: Backward looking vsForward lookingForward looking
• Price spread vs Yield spread
• Effectiveness of Agency’s Rating
• Term Structure of Default Probabilities (TSDP)
2Credit Spread
( ){ ( ) ( ) : 0 }k k kM kp s P s s s
( )kp s
s

Basic information on credit riskForward-Looking vs Backward-Looking
Backward-Looking:model using past time series data overa period, generated under different environments
-interest rates:statistical or econometric model
-credit data: past defaults and non-defaults, intensitymodel, classification, transition, logit-probit model
Forward-Looking :model using current (cross-sectional)market data, which includes investors’ future views,projection and perspectives on economic and financialmovements of firms, given past time series information
―current interest rates, bond prices, swap rates
-current CBs (corporate bonds)、CDS, stocks
3NUS RMI Workshop 2012.11

GB Prices and Attributes
• GBs are priced by two types of investors ; holdingmotive and trading motive
• Prices are affected by such attributes as maturity andcoupon preferences ?
• Institutional investors are mostly of holding motivefor income in ALM where duration (coupon andfor income in ALM where duration (coupon andmaturity) and CF pattern are important
• The presence of the attribute effects in prices will denythe no-arbitrage theory in math finance that dependson a logic of trading motive.
4Credit Spread
H0:Hypothesis of No Attribute Effect

• The sum of individually discounted future coupons
and principal is not equal to the bond price!
• A-effects are directly included in prices.
• To test H0, we need a model for bond prices:
Rejection of H0 ⇒ Rejection of the no-arbitrage theory in math finance
To test H we need a model for bond prices:
Traditionally yields are derived from bond prices and H0
is tested in a regression model for yields .
It is difficult to derive yields independent of attributes.
• Nelson-Siegel ModelCredit Spread 5
Price Model vs Interest Rate Model

Yield Approach• Price is a convex function of YTM (Yield to Maturity)
• YTM is a function of price, coupon and maturity, and is aconvex function of price.
• A mean yield curve is derived from individual yields of
( )
1
( )(1 ) g m
M gsYT M
g g g m gm
P C s r
• A mean yield curve is derived from individual yields ofindividual bond prices, and spreads are analyzed by
• MTi is maturity dummy where MTi =1 if the yield belongs to[i,i+1) in years.
6Credit Spread
+ ݅ ݅
9
=݅1

逼迫期には満期7年(7年以上8年未
満)の国債スプレッドが小さくなっている.回復期は6から8年のゾーンが相対的に低く
-0.035
-0.030
-0.025
-0.020
-0.015
-0.010
-0.005
0.000
0.005
0.010
0.015
MT1
MT2
MT3
MT4
MT5
MT6
MT7
MT8
MT9
Uptern Eco.
Downtern Eco.
Financial Crisis
Post Fin. Crisis
Averaged Coefficients ofmaturity effect
Credit Spread 7
(15.00)
(10.00)
(5.00)
0.00
5.00
10.00
15.00
t values of coupon

Hypothesis of No Attribute Effectand GB-Equivalent CB price
H:No Attribute Effect
1) What is GBECB ?
2)Investors’ behaviors in GB market2)Investors’ behaviors in GB market
3)Maturity effect and coupon effect
8Credit Spread
( )
1
( ) ( ) ( 1, , )M g
g g gj g gjj
P C s D s g G
0( ) ex p ( )
s
g g uD s f d u
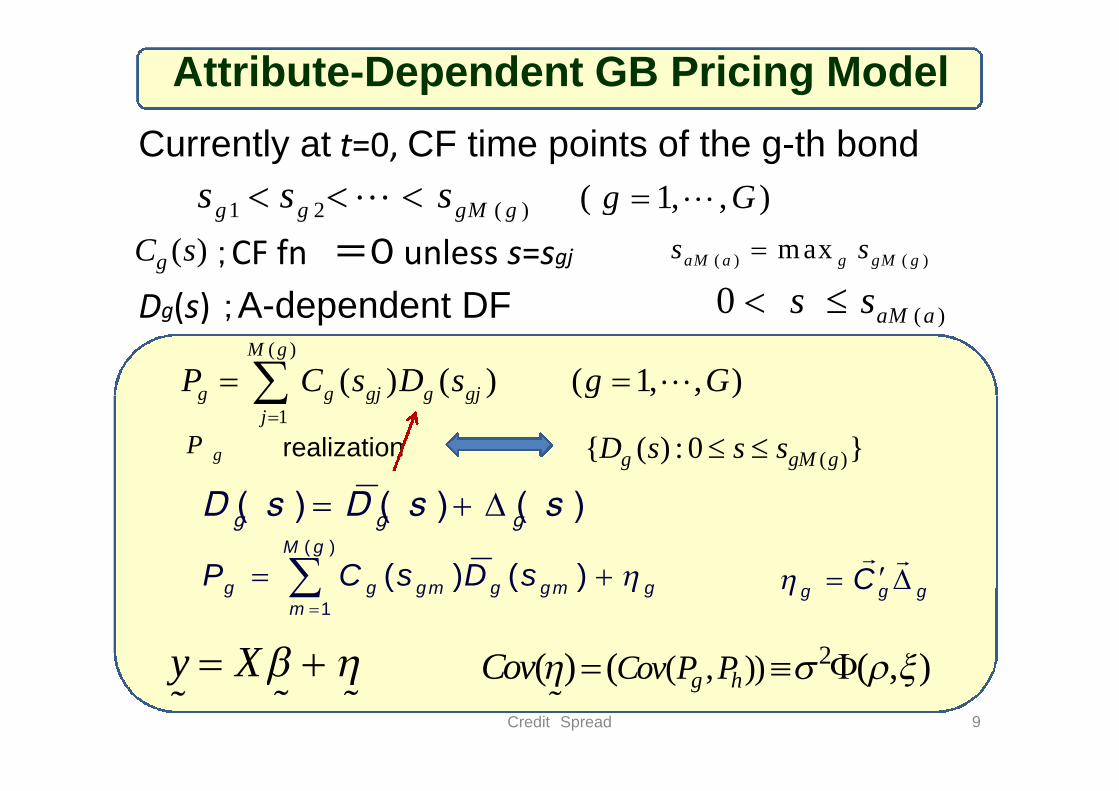
Attribute-Dependent GB Pricing Model
Currently at t=0, CF time points of the g-th bond
;CF fn =0 unless s=sgj
Dg(s) ;A-dependent DF
1 2 ( )g g gM gs s s ( 1, , )g G
( )gC s
( )0 aM as s ( ) ( )maxaM a g gM gs s
( )
( ) ( ) ( 1, , )M g
g g gj g gjP C s D s g G
Credit Spread 9
1
( ) ( ) ( 1, , )g g gj g gjj
P C s D s g G
( ){ ( ) : 0 }g gM gD s s s gP realization
( ) ( ) ( )g g g
D s D s s
( )
1
( ) ( )M g
g g gm g gm gm
P C s D s
g g gC
y X
2( , ))( ) ( ( , )g hCov P PCov

M0 : (1,0,0); basic model with no attributesM1 : (1,1,0): M0 + maturity effect,M2 : (1,0,1); M0 + coupon effectM3 :(1,1,1); M0 +maturity effect+coupon effect
A-dependent Mean Discount FunctionPolynomial Approximation
1 2 3( , , )w w w
( ) 1 ( )D s w z w z w z s
,
zg1=1, zg2 : maturity, zg3 : coupon
Credit Spread 10
11 1 1 12 2 2 13 3 3
1 1 1 2 2 2 3 3 3
( ) 1 ( )
( )
g g g g
pp g p g p g
D s w z w z w z s
w z w z w z s
0( ) [ ( ) ] [ e x p ( ) ]
g js
g g j g g j g sD s E D s E f d s
1log ( )sR D s
s Term structure of interest rates

Covariance Structure
2
2
( )
e x p ( ) ( )g h
g h
s s g h
2( , ) ( , ) ghg h g h ghCov P P Cov
( ) ( )
1 1
( ) ( )M g M m
g g jg h h h mj m
C s C s
Kariya&Kurata(2004)Generalized Least Squares Wiley
Credit Spread 11
2( ) ( )e x p ( ) ( )
g h
g M g h M hs s g h
A-dependent cov structure: Duration effect is naturallyintroduced
y X
1( , ) [ ] '[ ( , )] [ ]y X y X
2 2( ) ( , ) ( )gh ghCov
GLSEatimation

GLSV
I II III IV
Performances of 4 models
月次分析2005.09から2010.08
Polynomial order:p=6
Credit Spread 12
RSD

F ratios of noattribute effects
JGB
F ratio =[{QSR(0) – QSR(1)}/#]/[QSR(1)/df],
[{QSR(0) – QSR(1)}/#] > 2[QSR(1)/df].
0
2
4
6
8
1005/09
05/11
06/01
06/03
06/05
06/07
06/09
06/11
07/01
07/03
07/05
07/07
07/09
07/11
08/01
08/03
08/05
08/07
08/09
08/11
09/01
09/03
09/05
09/07
09/09
09/11
10/01
10/03
10/05
10/07
(a)F ratios of M0 vs M1
6
8
10
(b)F ratios of M0 vs M2
Maturity effect
Credit Spread 13
0
2
4
05/09
05/11
06/01
06/03
06/05
06/07
06/09
06/11
07/01
07/03
07/05
07/07
07/09
07/11
08/01
08/03
08/05
08/07
08/09
08/11
09/01
09/03
09/05
09/07
09/09
09/11
10/01
10/03
10/05
10/07
0
2
4
6
8
10
05/09
05/11
06/01
06/03
06/05
06/07
06/09
06/11
07/01
07/03
07/05
07/07
07/09
07/11
08/01
08/03
08/05
08/07
08/09
08/11
09/01
09/03
09/05
09/07
09/09
09/11
10/01
10/03
10/05
10/07
(c)F ratios of M1 vs M3
Coupon effect
M1 vs M3

F-ratios of no attributeeffects based on
USGB
F ratio =[{QSR(0) – QSR(1)}/#]/[QSR(1)/df],
[{QSR(0) – QSR(1)}/#] > 2[QSR(1)/df].
Hypothesis of no maturity effectPI:Upturn
14
Hypothesis of no coupon effect
M1 vs M3

CB Credit Risk Price SpreadTSDP:Term Structure of DP
2010.8 Cross-Sectional Analysis
1)Definition of CRPS
2)Rating Information will improve on credit2)Rating Information will improve on credit
analysis to make credit homogeneous group?
3) Industry categorization will help?
15Credit Spread
Direct trigger of Defaults is lack of financial liquidityPL-Black firms listed in TSE got defaulted(Real Estate)

CB-Credit Risk Price Spread
• CRPS of individual CB
=CB price-GB-equivalent CB price
= CB price-GBECB with same maturity and coupon( )
( ) ( ) ( ) ( )
1
ˆ ˆ, ( ) ( )M k
i i i ik k k k k k j k k j
j
y V P P C s D s
M0 Spread vs M3 Spread
• Standardized CRPS(uncertainty standardization)
1j
16Credit Spread
( 0,3)i
(3) (3)( )/k k kM ky s

486
676
537
649
400
500
600
700
800
M0
M3
Distribution of CRPS:1 yen split
96
30 22
44
82 85
153
227
373
257
176
0
50
100
150
200
250
300
350
400
-4未満 -4 -3.6 -3.2 -2.8 -2.4 -2 -1.6 -1.2 -0.8 -0.4
0.4 yen split0.4 yen split
Credit Spread 17
213 4 5 14 19 26
72
190
29214 3 6 14 18 30
73
190
00
100
200
300
-10未満 -10 -9 -8 -7 -6 -5 -4 -3 -2 -1 0以上
M3
M0defect

Credit-homogeneous grouping
• Industry, Rating;is it empirically effective?
• Cluster Analysis
• Standardized CRPS defines x-rule.
• Ranking categorization: Logit-Probit analysis
( ) ( ( ,1), ( ,2), , ( , ); (1), (2), , ( ))I k F x k x k x k N z z z L
• Effective ?
is time-dependent. And many factors affect default andnon-default results.
Credit Spread 18
( ) ( ( ,1), ( ,2), , ( , ); (1), (2), , ( ))t t t t t t t tI k F x k x k x k N z z z L
( ) 1,2, ,tI k H
( , ) {( ( ,1), ( ,2), , ( , ); (1), (2), , ( )) : ( ) }t t t t t t t tA k j x k x k x k N z z z L I k j

R&I Rating Groups
Rating does not providehomogeneous information on
( 3 )( )( , )kM k ks y
Credit Spread 19
homogeneous information ondefault risk

-6
-5
-4
-3
-2
-1
0
0 5 10 15
1
2
3
4
Industry 1
-7
-6
-5
-4
-3
-2
-1
0
0 5 10 15
1
2
3
4
Industry 2
-6
-5
-4
-3
-2
-1
0
0 5 10 15
1
2
3
4
Industry 3
-6
-5
-4
-3
-2
-1
0
0 5 10 15
1
2
3
4
Industry 4
-6
-5
-4
-3
-2
-1
0
0 5 10 15
1
2
3
4
Industry 5
-6
-5
-4
-3
-2
-1
0
0 5 10 15
1
2
3
4
Industry 6
-6
-5
-4
-3
-2
-1
0
0 5 10 15
1
2
3
4
Industry 7
-6
-5
-4
-3
-2
-1
0
0 5 10 15
1
2
3
4
Industry 8
1 F00ds 2 Cnstrn 3 Mtrls 4 Auto
5 Metals 6 Mchn 7 Utensil 8 ICT
Credit Spread 20
-6
-5
-4
-3
-2
-1
0
0 5 10 15
1
2
3
4
Industry 9
-20
-18
-16
-14
-12
-10
-8
-6
-4
-2
0
0 5 10 15
1
2
3
4
Industry 13
-70
-60
-50
-40
-30
-20
-10
0
0 5 10 15
1
2
3
4
Industry 14
-20
-18
-16
-14
-12
-10
-8
-6
-4
-2
0
0 5 10 15
1
2
3
4
Industry 15
-6
-5
-4
-3
-2
-1
0
0 5 10 15
1
2
3
4
IIndustry 11
-20
-18
-16
-14
-12
-10
-8
-6
-4
-2
0
0 5 10 15
IIndustry 10
-6
-6
-5
-4
-3
-2
-1
0
0 5 10 15
1
2
3
Industry 12
×4
11 Trading9 Epwr/G
14 NonB
12 Retails
13 Bank
10 Trns/D
15 R Rstate
Industry-wiseCRPS-Plot

-3
-2.5
-2
-1.5
-1
-0.5
0
0 2 4 6 8 10
2006.9
-3
-2.5
-2
-1.5
-1
-0.5
0
0 2 4 6 8 10
2007.8
-1.5
-1
-0.5
0
-1.5
-1
-0.5
0
(1) (2)
(3) (4)
Changes of CRPS in E-Power Industry;Business Cycles
Credit Spread 21
-3
-2.5
-2
-1.5
0 2 4 6 8 10
2008.8
-3
-2.5
-2
-1.5
0 2 4 6 8 10
2009.8
-3
-2.5
-2
-1.5
-1
-0.5
0
0 2 4 6 8 10
20010.8
(5)
Electric Power

CRPS-Plots for International Distribution and Metal Industries
Credit Spread 22
International Distributers (Trading,or “Sougoshosha”)
Metal

-4
-3
-2
-1
0
0 2 4 6 8 10Itochu En
Itochu A
Marubeni A-
Mitsui&Co AA-
Mitsubishi AA-
Sumitomo AA-
Sojitsu BBB
N.Pulp A-
Toyoda A+International Distribution
Credit Spread 23
-4
-4
-3
-2
-1
0
0 2 4 6 8 10
DOWA A-JFE AA-Fujikura AFurukawa B3+Mitui M A-Mitsbsh M B3+Smtm MSmtm MinSmtm E AA-Nppn Stl AA-Kobe Stl ADaido Stl A-Nisshin StlHitachi M A
Metal

(1) (2) (3)
3 stage cluster analysis:14groups ( 3 ) ( 3 )( )/k k k M ky s
Credit Spread 24
1 2 3 4 5 6 7 8 9 10 11 12 13 14 合計債権数 988 351 80 38 37 10 7 1 7 10 9 2 4 1 1545最大値 -0.033 -0.303 -0.620 -0.826 -1.051 -1.367 -1.589 -2.165 -2.471 -3.048 -4.619 -12.224 -15.588 -17.578最小値 -0.302 -0.614 -0.810 -1.027 -1.301 -1.480 -1.898 -2.165 -2.820 -3.809 -5.854 -13.854 -16.019 -17.578
NoMaxMin
total

1st 1 2 3(CG11) 4(CG12) 5(CG13) 6(CG14) Total #
# of CBs 1504 25 9 2 4 1 1545
Max -0.33 -15.89 -46.19 -122.24 -155.88 -175.78
Min -14.80 -38.09 -58.54 -138.54 -160.19 -175.78
2nd 1 2 3(CG7) 4(CG8) 5(CG9) 6(CG(10) Total
# of CBs 1339 165 7 1 7 10 1529
Max -0.33 -6.20 -15.89 -21.65 -24.71 -30.48
Min -6.14 -14.80 -18.98 -21.65 -28.20 -38.09
3rd 1(CG1) 2(CG2) 3(CG3) 4(CG4) 5(CG5) 6(CG6) Total
# of CBs 988 351 80 38 37 10 1504
Max -0.33 -3.03 -6.20 -8.26 -10.51 -13.67
Min -3.02 -6.14 -8.10 -10.27 -13.01 -14.80
Credit Spread 25
Min -3.02 -6.14 -8.10 -10.27 -13.01 -14.80
Final Cluster Groups
CG1 CG2 CG3 CG4 CG5 CG6 CG7
# of CBs 988 351 80 38 37 10 7
Max -0.33 -3.03 -6.20 -8.26 -10.51 -13.67 -15.89
Min -3.02 -6.14 -8.10 -10.27 -13.01 -14.80 -18.98
CG8 CG9 CG10 CG11 CG12 CG13 CG14 total
1 7 10 9 2 4 1 1545
-21.65 -24.71 -30.48 -46.19 -122.24 -155.88 -175.78
-21.65 -28.20 -38.09 -58.54 -138.54 -160.19 -175.78
Credit-homogeneous Groups via 3 Stage Cluster Analysis

( 3 )( )( , )kM k ks y
アイフル
All cluster groups・CRPS-Plot
Credit Spread 26
,
CRPS-Plot for CGs

FIR 1 FIR 2 FIR 3 FIR 4 FIR 5
FG 0.5Yen # FG 1Yen # FG M1Yen # FG 1.5Yen # FG 2Yen #
1 [-0.5,0) 10 1 [-1,0) 42 1 [-1,0) 42 1 [-1.5,0) 213 1 [-2,0) 618
2 [-1.0,-0.5) 32 2 [-2,-1) 576 2 [-2,-1) 576 2 [-3.0,-1.5) 773 2 [-4,-2) 526
3 [-1.5,-1.0) 171 3 [-3,-2) 368 3 [-3,-2) 368 3 [-4.5,-3.0) 214 3 [-6,-4) 186
4 [-2.0,-1.5) 405 4 [-4,-3) 158 4 [-4,-3) 158 4 [-6.0,-4.5) 130 4 [-8,-6) 86
5 [-2.5,-2.0) 223 5 [-5,-4) 111 5 [-5,-4) 111 5 [-7.5,-6.0) 64 5 [-10,-8) 35
6 [-3.0,-2.5) 145 6 [-6,-5) 75 6 [-6,-5) 75 6 [-9.0,-7.5) 41 6 (-∞,-10) 94
7 [-3.5,-3.0) 81 7 [-7,-6) 46 7 [-8,-6) 86 7 [-10.5,-9.0) 22
8 [-4.0,-3.5) 77 8 [-8,-7) 40 8 [-11,-8) 48 8 (-∞,-10.5) 88
FIR(Fixed Interval Rating) based on S-CRPS measure ζ:2010.8
Credit Spread 27
8 [-4.0,-3.5) 77 8 [-8,-7) 40 8 [-11,-8) 48 8 (-∞,-10.5) 88
9 [-4.5,-4.0) 56 9 [-9,-8) 19 9 [-15,-11) 40
10 [-5.0,-4.5) 55 10 [-10,-9) 16 10 (-∞,-15) 41
11 [-5.5,-5.0) 36 11 (-∞,-10) 94
12 [-6.0,-5.5) 39
13 [-7.0,-6.0) 46
14 [-8.0,-7.0) 40
15 [-9.0,-8.0) 19
16 [-10.0,-9.0) 16
17 (-∞,-10) 94
OurFIRGr
(3) (3)( )/k k kM ky s

Market Grouping via FIR 3 (Total 1545 CBs)
R&IF1
(0,-1]
F2
(-1,-2]
F3
(-2,-3]
F4
(-3,-4]
F5
(-4,-5]
F6
(-5,-6]
F7
(-6,-8]
F8
(-8,-11]
F9
(-11,-15]
F10
(-15,∞)Total # CBs
AAA 0.0 22.2 77.8 0.0 0.0 0.0 0.0 0.0 0.0 0.0 100 9
AA+ 6.6 84.9 8.5 0.0 0.0 0.0 0.0 0.0 0.0 0.0 100 497
AA 0.8 52.1 45.4 1.7 0.0 0.0 0.0 0.0 0.0 0.0 100 119
AA- 3.5 27.9 66.3 1.7 0.0 0.0 0.6 0.0 0.0 0.0 100 172
A+ 0.6 12.8 52.0 14.0 7.8 6.1 3.4 3.4 0.0 0.0 100 179
FIR vs R&I Rating Cross Table: Distribution
Credit Spread 28
A 0.0 0.7 13.8 46.7 9.9 3.9 7.9 8.6 8.6 0.0 100 152
A- 0.0 0.6 8.6 25.3 27.2 11.1 9.9 6.2 2.5 8.6 100 162
BBB+ 0.0 0.0 1.1 5.3 20.0 14.7 27.4 9.5 9.5 12.6 100 95
BBB 0.0 0.0 0.0 0.0 9.6 28.8 34.6 9.6 11.5 5.8 100 52
BBB- 0.0 0.0 0.0 0.0 0.0 0.0 0.0 0.0 0.0 100 100 1
CCC+ 0.0 0.0 0.0 0.0 0.0 0.0 0.0 0.0 0.0 100 100 7
None 1.0 17.0 22.0 11.0 14.0 11.0 7.0 5.0 8.0 4.0 100 100
# of CBs 42 576 368 158 111 75 86 48 40 41 100 1545

-6
-4
-2
0
0 2 4 6 8 10 12
G1
G2
G3
G4
G5
F1
F2
F3
F4
F5
F6
Credit-homogeneous Groups via FIR grouping:2010.8
Credit Spread 29
-14
-12
-10
-8
G5
G6
G7
G8
G9
F7
F8
F9

( )
1
( ) ( )
M k
k k k j k k jj
V C s D s
CB Pricing Model
( ) ( ) ( )kk kD s D s s
CB Pricing Model Expected CFs
1
( ) ( )[1 ( )]
100 [ ( ) ( )]
k mj k mj k mj
k k mj k mj
C s C s p s
p s p s
StochasticDiscount Fn
Credit Spread 30
1
( : ( )) ( ) ( : ( ), )J
k k
j
p s i k w j p s i k j
1)(,0)(1
J
jkk jwjw
21 2( ; , ) ij ij ij q
qp s i j s s s
Kariya(2012)

TSDPs of Cluster Groups:Recovery Rate =0
Code Industry# of CBsin Gr 1
# of CBsin Gr 2
1 Food 24 18
3 Construction 16 9
4 Material /chemistry 41 46
6 Auto 30 23
7 Metal 49 30
8 Machinery 19 13
9 Electric Utensil 44 27 0.8
0.9
CG8
CG9
Credit Spread 31
9 Electric Utensil 44 27
10 ICT 53 7
11 Electric Power/Gas 459 2
12 Transportation/Log 124 81
13 Trading 56 42
14 Retail 6 1
15 Banks 1 18
16 Financial 14 22
17 Real Estate 52 12-0.1
0
0.1
0.2
0.3
0.4
0.5
0.6
0.7
0 1 2 3 4 5 6 7 8 9 10
CG9
CG10
CG11
CG12
CG13
CG14

0.04
0.06
0.08
0.1
0.12
0.14
CG1
CG2
CG3
CG4
CG5
CG6
CG7
TSDPs for Cluster groups: γ=0
TSDPs for Cluster Groups:2010.8, γ=0
Credit Spread 32
-0.02
0
0.02
0.04
0 1 2 3 4 5 6 7 8 9 10
CG1 CG2 CG3 CG4 CG5 CG69yrs 2.0 3.5 5.9 10.1 10.2 13.110yrs 2.1 4.1 6.7 10.2
Default Probabilities for CGs

CG1×Indusry:TSDPs
0.02
0.025
0.03
0.035
0.04
食品
建設・資材
素材・化学
自動車・輸送機
鋼鉄・非鉄
機械
0.02
0.025
0.03
0.035
0.04
電気・精密
情報通信、サービス
運輸・物流
商社
金融(除く銀行)
不動産
Credit Spread 33
0
0.005
0.01
0.015
0 2 4 6 8 100
0.005
0.01
0.015
0 2 4 6 8 10

TSDPs in the Electric Power Industry:2010.8
Credit Spread 34

TSDPs
Changes of TSDPs ofTEPCO
Credit Spread 35
2009.2TSDPs
of TEPCO
2007.8 2008..8 2009.8

0.02
0.025
0.03
0.035
0.04Mitsubishi Corp.
Mitsui & Co.
Sumitomo Corp.
Itochu Corp.
Marubeni Corp.
Sojitz Corp.
MBS SuS MiT ITo MBN SJT
2yrs 0.30 0.34 0.37 0.63 0.75 1.32
3yrs 0.62 0.66 0.70 1.00 1.38 2.39
4yrs 0.87 0.92 1.01 1.37 1.95
5yrs 1.05 1.12 1.26 1.75 2.51
6yrs 1.23 1.31 1.45 2.19
TSDPs of individual firms in the Trading Industry:2010.8
Credit Spread 36
0
0.005
0.01
0.015
0 1 2 3 4 5 6 7 8 9 10
6yrs 1.23 1.31 1.45 2.19
7yrs 1.47 1.59 1.66 2.69
8yrs 1.84 2.00 2.07 3.23
9yrs 2.30 2.55 3.00 3.68
10yrs
2.73 3.14 3.78

Changes of TSDPs ofMitsubishi Corp
Credit Spread 37

TSDP of Spain relative to Germany
• The measure of CRPS was defined relative to theinvestors’ behaviors in bond pricing market that dependon maturity and coupon attributes.
• It directly provides useful information on credit risk ofCBs evaluated in the CB market.
• Effectiveness of using Rating and Industry categories
Summary
• Effectiveness of using Rating and Industry categorieswas rather limited in our credit risk analysis.
• Based on the standardized CRPS, homogeneous clustergroups were constructed and R&I ratings was shown tobe not comparable over different industries
• TSDPs were derived for analyzing cluster homogeneousgroups and individual firms via Kariya(2012).
Credit Spread 39

ReferencesKariya,T.(2012) A CB (corporate bond) pricing model for deriving
default probabilities and recovery rates. To appear
Kariya, T. and Kurata, H. (2004) Generalized Least Squares, JohnWiley, New York.
Kariya,T., Wang,J., Wang,Z., Doi,E., and Yamamura,Y.(2012)Empirically Effective Bond Pricing Model and Analysis on TermStructures of Implied Interest Rates in Financial Crisis Asia-PacificFinancial Markets 19:259–292Financial Markets 19:259–292
Kariya,T., Yamamura,Y., Inui,K., and wang, Z. (2012) Measuring creditrisk price spreads of CBs and deriving term structures of defaultprobabilities
Duan, J.C., J. Sun and T. Wang(2011) Multiperiod Corporate DefaultPrediction-A forward Intensity Approach, RMI working paperNo.10/07, National University of Singapore
Duffie, D. (2011). Measuring Corporate Default Risk. ClarendonLectures in Finance, Oxford University PressCredit Spread 40