Embed Size (px)
Citation preview
7/31/2019 Meksika’ nın Yucatan Şehrinde Tehlikeli Atık Arıtma Tesisleri ve Düzenli Depolama Sahasında Bertaraf Konumlandırı…
http://slidepdf.com/reader/full/meksika-nin-yucatan-sehrinde-tehlikeli-atik-aritma-tesisleri-ve-duezenli 1/13
Springer
Environ Earth Sci (2011) 63:351-362 DOI
10.1007/S12665-010-0706-0
ORIGINAL ARTICLE,
M. R. Sauri-Riancho • D. D. Cabanas-Vargas • M.
Echeverría-Victoria * M. Gamboa-Marrufo -R. Centeno-
Lara • R. I. Méndez-Novelo
Received: 23 November 2009/Accepted: 12 August 2010/Published online: 29 August 2010 ©
Springer-Verlag 2010
Abstract In this work, geographic information systems (GIS) and
multi-criteria decision analysis (MCDA) were used in order toidentify the appropriate location for hazardous waste (HW)
treatment facilities and final disposal sites in the State of Yucatan,
Mexico. For HW-treatment facilities, in addition to the distance to
generators and treatment facilities, geographic conditions of the
site, such as vegetation, soil type, accessibility, distance to urban
or rural communities, and all the boundary elements as
agricultural or livestock areas, were considered in GIS and
MCDA. Final disposal was taken into account only for those HW
that could not be avoided or treated. In order to find the most
suitable areas, the Mexican Official Norm NOM-055-
SEMARNAT-2003 criteria were observed too. It was found that
the most suitable zones for HW-treatment facilities were at thecentre of the State, whereas the most recommended areas for HW
final disposal sites were at the south.
Keywords Hazardous waste • Waste treatment • Waste disposal
■ Geographic information systems ■ Multi-criteria decision
analysis
Introduction
During the last 50 years, rapid technological and economic
growth has changed human way of life and made modern society
face complex decision-making problems. Among these, waste
generation increase and its composition changes can be identified,
so appropriate waste management represents a challenge to all
modern societies.
M. R. Sauri-Riancho (El) ■ D. D. Cabanas-Vargas ■
M. Echeverría-Victoria ■ M. Gamboa-Marrufo ■
R. Centeno-Lara ■ R. I. Méndez-Novelo
Faculty of Engineering, Autonomous University of Yucatan,
Av. Industrias No-Contaminantes x Periférico Norte,
Tablaje Catastral 12685, CP. 97111 Mérida, Yucatán, Mexico
e-mail: [email protected]
One of the most important issues related to waste management
is the appropriate location of treatment facilities and disposalsites. These tasks require processing significant amounts of
spatial information, including environmental, social, economic
and engineering data. Collecting and analyzing these spatial data
is time consuming and tedious. Thus, a computerized geographic
information system (GIS) has being used in recent years in order
to facilitate sitting-related tasks (Wei-Yea and Jehng-Jung 2002).
The term GIS can be defined as a technology of handling
geographic information formed by electronic equipment
(hardware) suitably programmed (software) which allow to
handle a series of spatial data (geographic information) and to
make complex analysis with these data (Ortiz 2003).
The GIS possibilities are not limited to the management of related data bases and the study of the phenomena with spatial
incidence; in addition, it is a powerful work tool specially
designed to simulate future situations, therefore, facilitating
decision making (Rodriguez 2000). Environmental data bases
usually contain a great diversity of data, most of which are
explicitly or implicitly spatially located. Consequently, the
capture of environmental data, analysis, handling and
presentation, are eased by the application of a GIS. Moreover,
environmental problems solutions imply the integration of
different sets of data which are usually large. The size and
complexity of these data bases need the application of the GIS
technology (Longley et al. 1991).
GISs have been used in many studies in the initial screening
process in order to identify suitable potential sites for new waste
management facilities through a process of "sieve mapping".
Such studies have included models that incorporate
environmental, engineering, planning and economic criteria
which include various sitting constraints such as soil or geological
type, distance from roads or urban areas, noise/nuisance,
topography, hydrology and land use, etc. using GIS-based overlay
techniques. Higgs (2006) gives as examples, amongst others,
studies carried out since 1980s (Lane and McDonald 1983; Jensen
and Christensen 1986) up to date. Likewise, with the development
of "new ways of spatial data visualization", analytic tools, which
include models of multi-criteria decision analysis (MCDA), have
arisen.
7/31/2019 Meksika’ nın Yucatan Şehrinde Tehlikeli Atık Arıtma Tesisleri ve Düzenli Depolama Sahasında Bertaraf Konumlandırı…
http://slidepdf.com/reader/full/meksika-nin-yucatan-sehrinde-tehlikeli-atik-aritma-tesisleri-ve-duezenli 2/13
Environ Earth Sei (2011) 63:351-362
£l Springer
2
MCDA is a group of systematic processes that analyze and
solve problems which involve complex decisions. Its purpose is to
assist with decision-making processes and its main objective
consists on searching a number of alternative solutions under
multiple criteria and conflict objectives (Pozzobon and Gutiérrez
2003). This type of analysis is characterized by the integration o f
diverse variables which all together influence the solution of the
problem (Sener et al. 2006). MCDA consists of a series of
techniques that allow a range of criteria relating to a particular
issue to be scored, weighted and then ranked by a group of experts
(Higgs 2006).
Amongst the MCDA techniques, the Simple Additive
Weighting (SAW) method is probably the best known and most
widely used. The possibility of an index formulation of a system,
when the decision maker does not have a thorough understanding
of the functional relationships among its components, is presented
by this method. A score in the SAW method is obtained by adding
contributions from each attribute. Since two items with different
measurement units cannot be added, a common numerical scaling
system such as normalization is required to permit addition among
attribute values. The total score for each alternative then can becomputed by multiplying the comparable rating for each attribute
by the importance weight assigned to the attribute and then
summing these products over all the attributes (Yoon and Hwang
1995).
Hazardous wastes management in Mexico
Mexican legislation classifies wastes in urban solid wastes,
special wastes, and hazardous wastes (HW). HW are defined as
"those wastes which pose some corrosive, reactive, explosive,
toxic or inflammable characteristics, as well as those withinfectious agents which confer them dangerousness; bottles,
containers, packaging and soils which have been contaminated
when transferred to a different site, according with what it is
established in this Law" (LGPIR 2003). For practical purposes,
the NOM-052-SEMARNAT-2005 establishes the hazardous
wastes characteristics, their identification process, classification,
and gives different lists of HW. Hazardous wastes generation is
traditionally related to the industrial development of a country or
its geographical zone. The Mexican Norm NOM-055-
SEMARNAT-2003 establishes all the requirements which have to
be fulfilled by the HW-disposal sites (excepting radioactive
wastes).According to the Mexican Environmental and Natural
Resources Secretariat, SEMARNAT, in 2000, there were 27,280
industries which were officially registered in Mexico as HW
generators (SEMARNAT 2002); it was estimated that the whole
country generated a total of 3,705,846.21 tons per year of these
wastes. Likewise, the existing infrastructure for the HW
management has been developed in the country during the last 30
years. In 2006, there were 13 authorized companies for reusing
HW: 11 for solvents, 1 for hydrocarbons sludge and 1 for used oil
and lubricants. Also in that year, 75 companies had authorization
to recycle dirty drums, 73 to recycle dirty solvents, 14 for
photographic fixative liquids, 94 for used lubricants, 39 formetals, and 12 for other types of residues. On the other hand, in
2007, 105 companies had the authorization to gather HW and 19
companies to gather biological-infectious hazardous wastes
(BIHW). In that year, 24 companies had the authorization of
SEMARNAT for treating oils and materials contaminated with
polychlorinated biphenyls (PCBs), 56 companies for "in situ"
treatment of industrial HW, and 75 for BIHW (52 "in situ" and 23
"ex situ"). For HW disposal, only five companies were authorized
(SEMARNAT 2006, 2008a).
The State-of-Yucatan local conditionsand HW management
The State of Yucatan is not an industrial zone of Mexico. Up to
December 31, 2007, there were 1,603 industries officially
registered as HW generators. During the year 2004, 940,908 L
and 4,278,020 kg of HW were generated. Nevertheless, the
National Register of Emissions and Contaminants Transference
(RETC) only reported 19 industries in Yucatan during 2005
(SEMARNAT 2008a); these industries only represent part of the
industrial sector of the State. In 2006, 3,039 companies were
identified as potential sources of HW, but it was not possible to
classify and quantify the HW produced (Cabanas-Vargas 2009).
Nevertheless, according to the list of potential HW generators
(Cabanas-Vargas 2009) and previous studies (Mejia et al. 2002),
it was assumed that most common HW in Yucatan were BIHW,
used oils, solid wastes impregnated with hydrocarbons (cleaning
cloths, tows, burlaps, filters, etc.), some chemicals like
photographic-developing and
7/31/2019 Meksika’ nın Yucatan Şehrinde Tehlikeli Atık Arıtma Tesisleri ve Düzenli Depolama Sahasında Bertaraf Konumlandırı…
http://slidepdf.com/reader/full/meksika-nin-yucatan-sehrinde-tehlikeli-atik-aritma-tesisleri-ve-duezenli 3/13
Environ Earth Sci (2011) 63:351-362
Springer
3
photographic-fixative liquids, empty containers which formerly
contained chemicals or paintings, and old car batteries.
Nowadays, BIHW and used oil are treated in appropriate facilities
and the old car batteries are taken to other parts of Mexico to be
recycled. It seems that other types of HW generated are being
disposed without any control.
The infrastructure for HW management in the State of Yucatan
is not enough; in 2007, 12 companies had the official
authorization for collecting and transporting HW, but 3 were not
operating. There was only one HW-treating facility which was for
treating BIHW (SEMARNAT 2008b). There was also a cement
factory which received used oil in order to use it as alternative
fuel. The companies which are officially registered as other HW
generators (different from BIHW and used oils) have to send their
HW to the north part of Mexico in order to be disposed , making
its disposal highly expensive.
Taking into account the list of potential HW generators
obtained in 2006, and although HW quantities and characteristics
are not fully known, treatment facilities could apply some of the
following technologies; thermal treatment (with heat recovery) for
solid wastes impregnated with hydrocarbons; activated carbonadsorption or ionic exchange for liquid HW, depending if the
residual liquids content is organic or inorganic; and/or
stabilization-solidification treatment for the residuals of previous
treatments. This way, only those HW that could not be treated
with these technologies would have to be sent to other parts of the
country. The entire infrastructure for treating and disposing HW
is located at the centre and north part of Mexico, and given that
the geographical location of Yucatan makes transportation costs
very high, this work is the first attempt to find areas within the
State of Yucatan in order to install HW-treatment facilities and
one HW confinement site.
Problems caused by an inadequate HW management areparticularly important in the State of Yucatan due to its geology .
The Yucatan peninsula is a large limestone platform and forms
the northern part of the Gulf Coastal Plain Province of Mexico
(Escolero et al. 2000). It is classified as a Karstic region
characterized by an almost flat platform, mainly made of
limestone which is very permeable. The high permeability of
karstic terrains results in many practical problems including,
according to Escolero et al. (2002): scarcity and poor
predictability of ground water supplies; instability of the ground
(due to the presence of sinkholes); ,and an unreliable waste
disposal environment.
In this work , results from the application of GIS an MCDA to
find appropriate areas for HW-treating facilities and disposal sites
in the State of Yucatan, Mexico are presented. Nevertheless, due
to the natural hydrogeologic conditions, strict engineering actions
are required in order to isolate HW in the final disposal site,
which is only considered for those HW that can not be avoided,
minimized, recycled or treated.
Methodology
The first part of this work was to identify the main technical,
socioeconomic and environmental criteria which can influence
the location and operation of the HW-treatment facilities and
HW-disposal sites. All related geographical information of the
State of Yucatan was compiled in order to be incorporated to the
GIS and to the MCDA: maps, locations of communities, roads,
vegetation and soil types, and availability of electricity, drinking
water, and others.
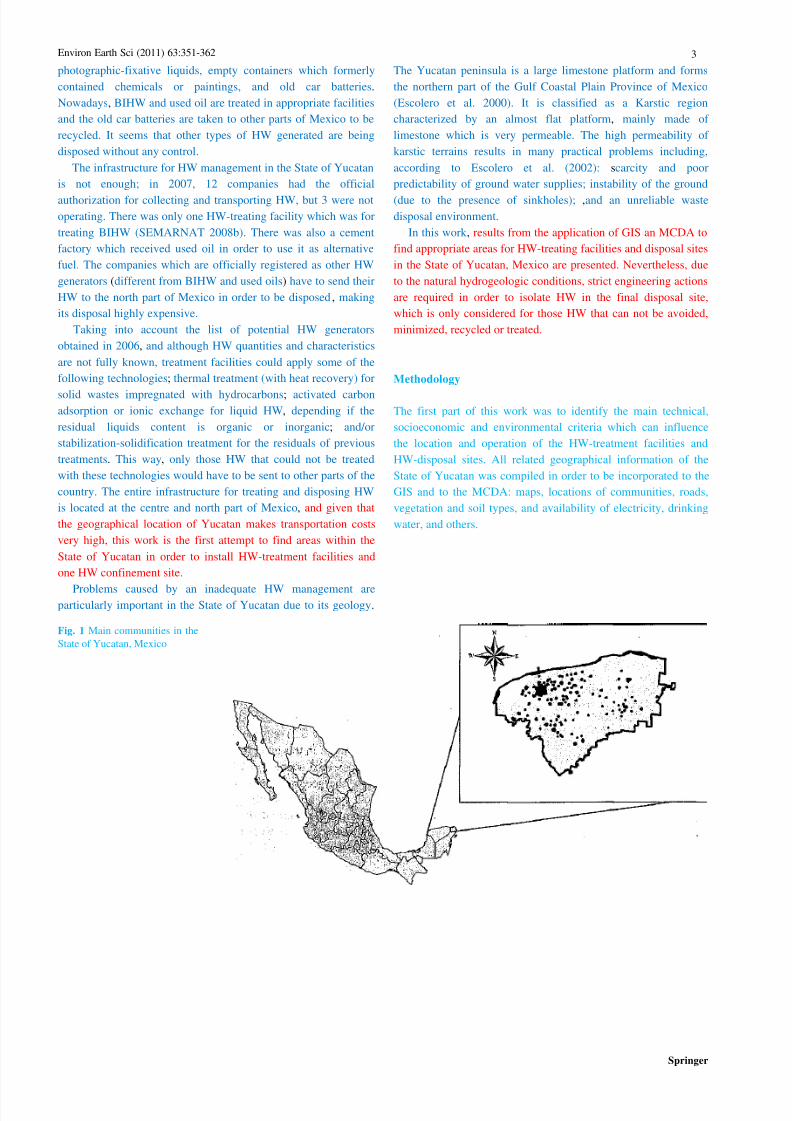
Fig. 1 Main communities in the
State of Yucatan, Mexico
7/31/2019 Meksika’ nın Yucatan Şehrinde Tehlikeli Atık Arıtma Tesisleri ve Düzenli Depolama Sahasında Bertaraf Konumlandırı…
http://slidepdf.com/reader/full/meksika-nin-yucatan-sehrinde-tehlikeli-atik-aritma-tesisleri-ve-duezenli 4/13
Environ Earth Sci (2011) 63:351-36
Springer
4
Table 1 Minimum conditions that have to be met by a HW-disposal site
(Nom-055-Semarnat-2003)
Table 1 continued
Buffer zone from stabilized HW-
disposal cells (within the HW-
disposal site land)
Protected natural areas
Minimum distance from the HW-disposal site closest point to the
highways and principal roads rights of way
(including buffer zone)
Minimum distance from the HW-
disposal site closest point to the railway
right of way
Minimum distance from the HW-
disposal site closest point to the power
lines right of way, excepting those used in
the HW-disposal site
Minimum distance from the HW-
disposal site closest point to gas pipes,
pipelines and ductworks rights of way
Minimum distance from the HW-disposal site closest point to the
communication nets (telephone, telegraph,
etc.) rights of way excepting those used in
the HW-disposal site
Minimum distance from the HW-
disposal site closest point to aqueducts and
water channels rights of way
Minimum distance from the HW-disposal
site closest point to communities with
more than 1,000 inhabitants
Minimum distance measured from the
closest point of the perimeter of the HW-
disposal site, including its buffer zones, to:
airports, wharfs, ground transport stations,hospitals, prisons, social readaptation
centres, schools, temples, wells or water
supply areas, or historic and/or cultural
patrimony buildings
Minimum distance measured 2,000 m
from the closest point of the perimeter of
the HW-disposal site, including its buffer
zones, to the closest point of-the perimeter
of the facilities where highly risky
activities are performed
Climatic and hydrologic aspects
Floodable zones with a return
period of 100 years or greater Restricted
Swamps, marshs and wetlands Restricted
Minimum distance from 1,000 m
superficial water bodies with
continuous flow, measured from
the site perimeter closest pointincluding its buffer zone, to the
closest maximum extraordinary
water level point
Geologic aspects
Geologic fractures
If the area is close to a geologic
fracture, it has to be
demonstrated with quantitative
studies that the site is safe within
the geologic, hydrologic and the
slopes stability point of view
Zones with unstable slopes, like Restricted
those with decompressed hillsides
and slider soils due to static or dynamic movements
Zones where differential Restricted
settlements which could cause
geologic, soil and/or structural
fractures
Hydrologic aspects
Areas with fractured or A natural stratum or lithological
granulated soil unit with a 10 m-thickness and
permeability coefficient of . k = 1
x 10"9 m/s (or equivalent) is
required. In the case where the
permeability is not met in natural
conditions, engineering solutions to
achieve equivalent conditions could
be used Technologies applications and equivalent systems
Competent authority has to approve engineering actions or works
guaranteeing that its effects meet all the geologic and hydrologic
requirements
In order to address the best areas to locate the HW-treatment
facilities and HW-disposal sites, the GIS (by means of ArcView
3.3) and the MCDA (with the SAW method) were used. In this
case, in addition to the distances between the potential sources of
HW and treatment facilities criterion, the geographical conditions
of the area, vegetation, soil type, accessibility, distance to urban
and/or rural communities, and all the limiting criteria like
agriculture or livestock zones were taken into account when GIS
and MCDA were applied.
100 m
100 m
500 m
100 m
500 m
100 m measured from the
confined cells limit
Restricted for HW-disposal
sites location
100 m
5,000 m (established by the
General Law for Waste
Prevention and Integral
Management and its
corresponding code)
1,000 m
7/31/2019 Meksika’ nın Yucatan Şehrinde Tehlikeli Atık Arıtma Tesisleri ve Düzenli Depolama Sahasında Bertaraf Konumlandırı…
http://slidepdf.com/reader/full/meksika-nin-yucatan-sehrinde-tehlikeli-atik-aritma-tesisleri-ve-duezenli 5/13
Environ Earth Sci (2011) 63:351-362
Ö Springer
5
Topographic charts from the National Institute of Statistics and
Geography (INEGI) were used in this work. These charts aie
maps showing different criteria for locating HW disposal and
treatment facilities in the state, such as the location of the main
communities, which is presented in Fig. 1. The geographic
information charts from INEGI were fed to the GIS at scales
1:50,000 or 1:25,000. To do this, the following criteria were
considered. Location of main roads, power lines, urban
communities, diverse constructions, water bodies, aqueducts and
channels, natural conservation areas, inundation zones, airports,
archaeological zones, wells, "cenotes" (groundwater wells) and
waterwheels (used for water supply), hydrocarbons conduction
lines (Mexican Petroleum National Company, PEMEX lines). In
addition, a map obtained from the Water National Commission
(CNA) showing the water table depth, was also fed to the GIS.
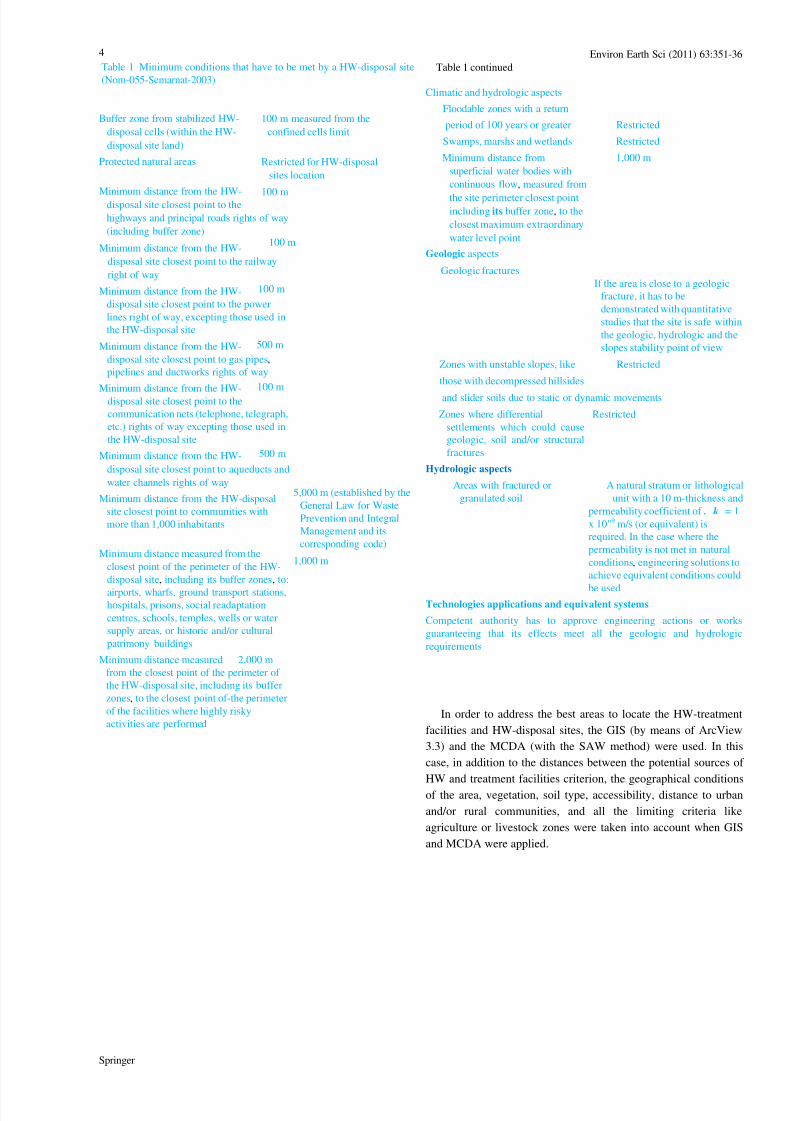
In order to determine the more appropriate areas for the HW-
disposal site locations, the Official Mexican Norm NOM-055-
SEMARNAT-2003, was used. All the suggestions given in this
norm were taken into account and areas where the norm prohibits
its disposal were identified as unsuitable areas. Those restrictions
are given in Table 1, and Fig. 2 illustrates the ones considered forthe State of Yucatan. As Mexican legislation does not include
recommendations for HW-treatment facilities location, the same
norm recommendations were employed with the exception of the
minimum distances to communities, airports and archaeological
zones.
An important geological aspect considered by this norm
requests a stratum or lithological unit with a 10 m-thickness and
permeability coefficient of k — 1 x 10~9 m/s and it also advices
that in the case where the permeability is not met in natural
conditions, engineering solutions to achieve equivalent conditions
could be used. Due to the soil karstic conditions in Yucatan, its
permeability is very high; therefore, an engineering solution has
to be applied to it in order to locate there a HW-disposal site.
The identification of the most suitable areas for locating both,
HW-treating facilities and HW-disposal sites, was performed
using the distances to all the criteria previously mentioned and an
MCDA, using the SAW method. The latter is one of the most
used methods for decision making when various criteria are
involved; some examples can be found in Sener et al. (2006) and
Yang et al. (2008). All the analysis and geographical data
manipulation was performed using the ArcView GIS 3.3 software.
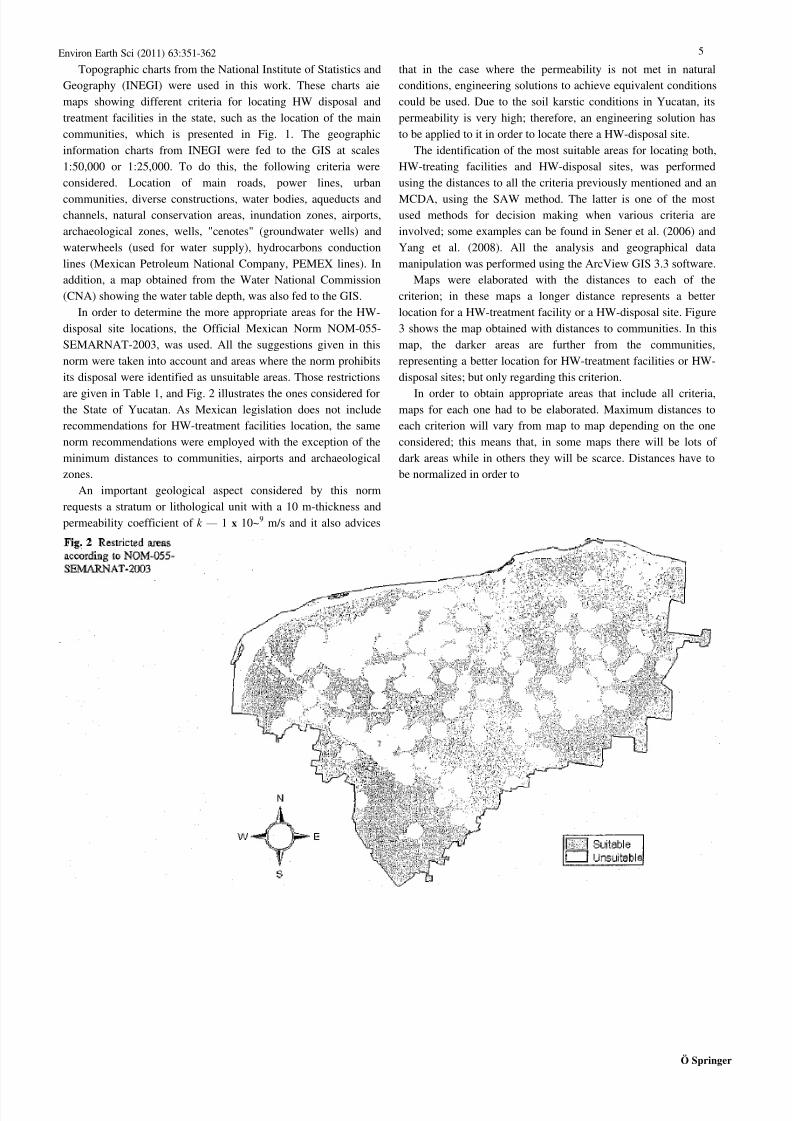
Maps were elaborated with the distances to each of the
criterion; in these maps a longer distance represents a better
location for a HW-treatment facility or a HW-disposal site. Figure
3 shows the map obtained with distances to communities. In this
map, the darker areas are further from the communities,
representing a better location for HW-treatment facilities or HW-
disposal sites; but only regarding this criterion.
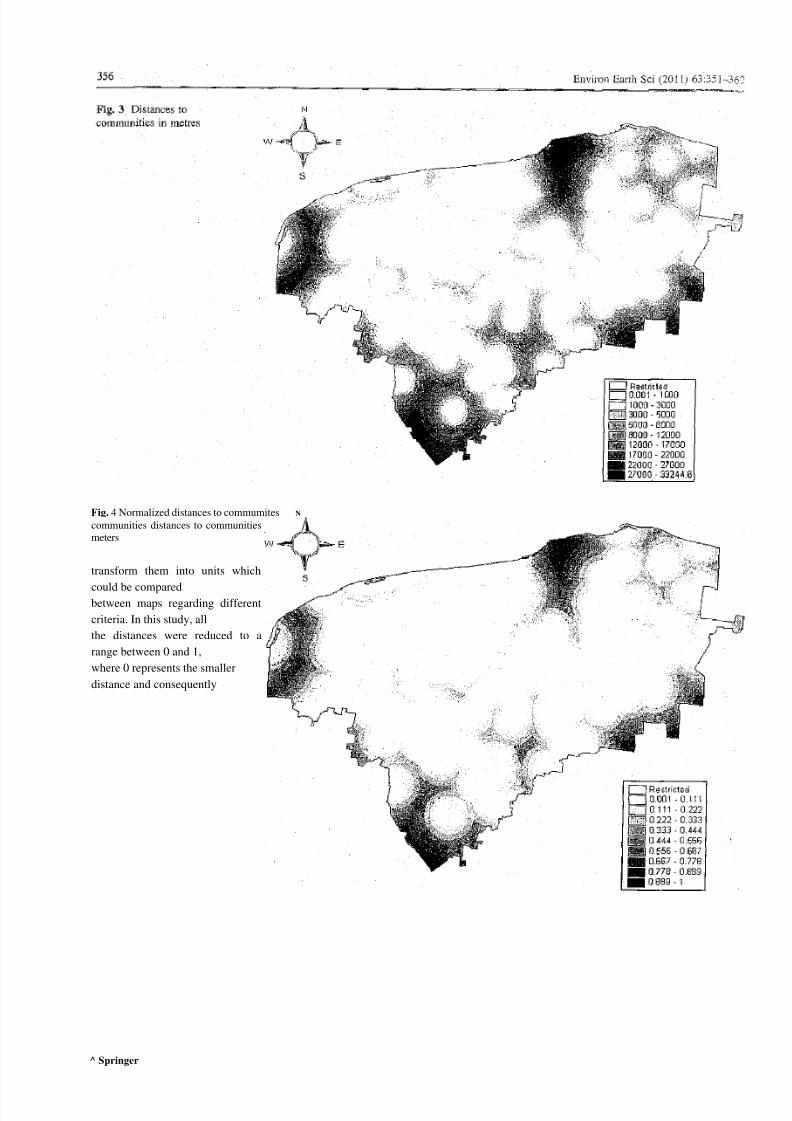
In order to obtain appropriate areas that include all criteria,maps for each one had to be elaborated. Maximum distances to
each criterion will vary from map to map depending on the one
considered; this means that, in some maps there will be lots of
dark areas while in others they will be scarce. Distances have to
be normalized in order to
7/31/2019 Meksika’ nın Yucatan Şehrinde Tehlikeli Atık Arıtma Tesisleri ve Düzenli Depolama Sahasında Bertaraf Konumlandırı…
http://slidepdf.com/reader/full/meksika-nin-yucatan-sehrinde-tehlikeli-atik-aritma-tesisleri-ve-duezenli 6/13
^ Springer
communities distances to communities
meters
transform them into units which
could be compared the less suitable area and 1 represents the longest distancebetween maps regarding different
criteria. In this study, all and hence, a more suitable area. Figure 4 shows the map
the distances were reduced to a
range between 0 and 1, with the normalized distance to communities; this figure
where 0 represents the smaller
distance and consequently corresponds to information in Fig. 3.
Fig. 4 Normalized distances to commumites N
7/31/2019 Meksika’ nın Yucatan Şehrinde Tehlikeli Atık Arıtma Tesisleri ve Düzenli Depolama Sahasında Bertaraf Konumlandırı…
http://slidepdf.com/reader/full/meksika-nin-yucatan-sehrinde-tehlikeli-atik-aritma-tesisleri-ve-duezenli 7/13
Environ Earth Sei (2011) 63:351-362
^ Springer
7
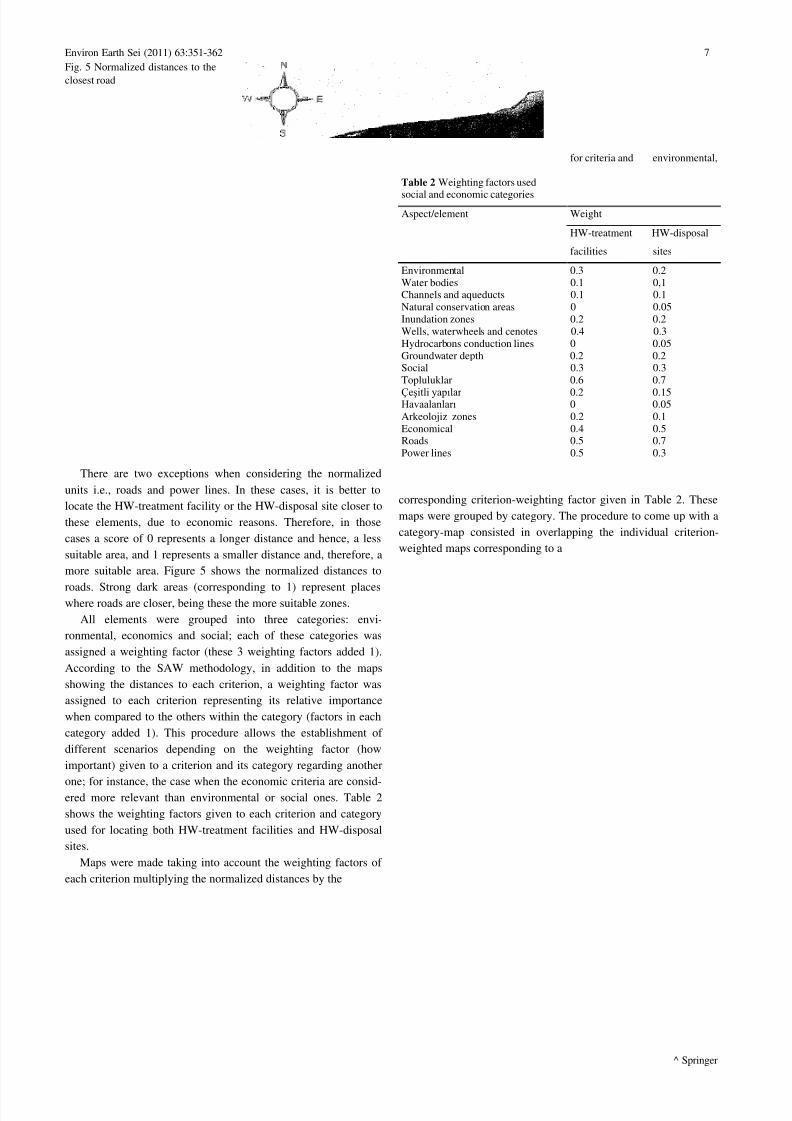
There are two exceptions when considering the normalized
units i.e., roads and power lines. In these cases, it is better to
locate the HW-treatment facility or the HW-disposal site closer to
these elements, due to economic reasons. Therefore, in those
cases a score of 0 represents a longer distance and hence, a less
suitable area, and 1 represents a smaller distance and, therefore, a
more suitable area. Figure 5 shows the normalized distances to
roads. Strong dark areas (corresponding to 1) represent placeswhere roads are closer, being these the more suitable zones.
All elements were grouped into three categories: envi-
ronmental, economics and social; each of these categories was
assigned a weighting factor (these 3 weighting factors added 1).
According to the SAW methodology, in addition to the maps
showing the distances to each criterion, a weighting factor was
assigned to each criterion representing its relative importance
when compared to the others within the category (factors in each
category added 1). This procedure allows the establishment of
different scenarios depending on the weighting factor (how
important) given to a criterion and its category regarding another
one; for instance, the case when the economic criteria are consid-ered more relevant than environmental or social ones. Table 2
shows the weighting factors given to each criterion and category
used for locating both HW-treatment facilities and HW-disposal
sites.
Maps were made taking into account the weighting factors of
each criterion multiplying the normalized distances by the
Table 2 Weighting factors used
for criteria and environmental,
social and economic categories
Aspect/element Weight
HW-treatment HW-disposal
facilities sites
Environmental 0.3 0.2
Water bodies 0.1 0,1Channels and aqueducts 0.1 0.1
Natural conservation areas 0 0.05
Inundation zones 0.2 0.2
Wells, waterwheels and cenotes 0.4 0.3
Hydrocarbons conduction lines 0 0.05
Groundwater depth 0.2 0.2Social 0.3 0.3
Topluluklar 0.6 0.7
Çeşitli yapılar 0.2 0.15Havaalanları 0 0.05
Arkeolojiz zones 0.2 0.1
Economical 0.4 0.5Roads 0.5 0.7
Power lines 0.5 0.3
corresponding criterion-weighting factor given in Table 2. These
maps were grouped by category. The procedure to come up with a
category-map consisted in overlapping the individual criterion-
weighted maps corresponding to a
Fig. 5 Normalized distances to the
closest road
7/31/2019 Meksika’ nın Yucatan Şehrinde Tehlikeli Atık Arıtma Tesisleri ve Düzenli Depolama Sahasında Bertaraf Konumlandırı…
http://slidepdf.com/reader/full/meksika-nin-yucatan-sehrinde-tehlikeli-atik-aritma-tesisleri-ve-duezenli 8/13
Environ Earth Sci (2011) 63:351-3628
category by adding the values corresponding to each area of the
map. As it was done with criterion maps, category maps were
produced taking into account the category-weighting factops
following the same procedure. Finally, the three category-
weighted maps were also overlapped to obtain the map with the
final scores for locating areas for HW-treatment facilities and
HW-disposal sites.
Results and discussion £
Figures 6, 7, 8, 9, 10 and 11 show the resulting maps for the
three categories weighted maps: environmental, economical and
social, for locating HW-treatment facilities (Figs. 6, 8, 10) and
HW-disposal sites (Figs. 7, 9, 11). For the environmental-
weighted maps category,
7/31/2019 Meksika’ nın Yucatan Şehrinde Tehlikeli Atık Arıtma Tesisleri ve Düzenli Depolama Sahasında Bertaraf Konumlandırı…
http://slidepdf.com/reader/full/meksika-nin-yucatan-sehrinde-tehlikeli-atik-aritma-tesisleri-ve-duezenli 9/13
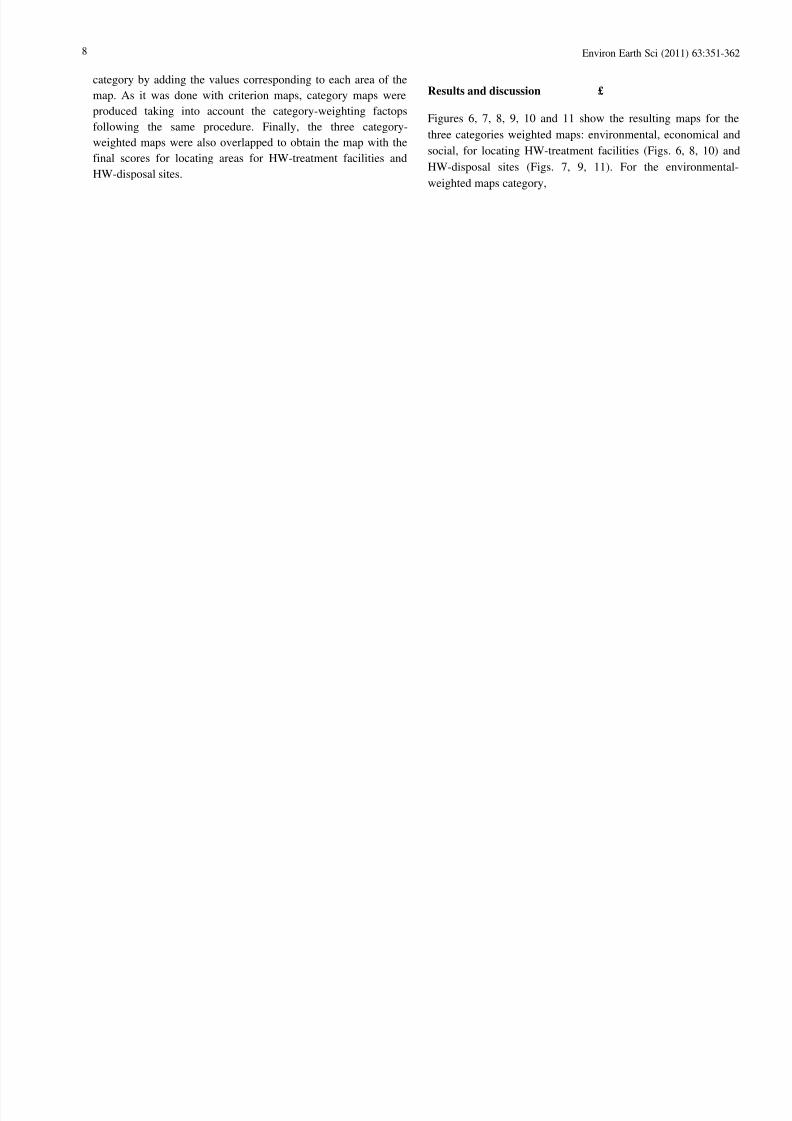
Environ Earth Sci (2011) 63:351-3629
Fig. 6 Environmental category-
weighted map for HW-treatment
facilities location
7/31/2019 Meksika’ nın Yucatan Şehrinde Tehlikeli Atık Arıtma Tesisleri ve Düzenli Depolama Sahasında Bertaraf Konumlandırı…
http://slidepdf.com/reader/full/meksika-nin-yucatan-sehrinde-tehlikeli-atik-aritma-tesisleri-ve-duezenli 10/13
Environ Earth Sci (2011) 63:351-362
£l Springer
10
Fig. 6 and 7 differ significantly; Fig. 7 shows that there are more
sites which are restricted (represented by white areas) for locating
HW-disposal sites, according to the NOM-055-SEMARNAT-
2003,, than those taken into account for the HW-treatment
facilities location (Fig. 6). Within this category,; water, depth
was one of the most important elements and, .therefore, the best
suitable areas (shown in dark colours) for both HW-treatment
facilities and HW-disposal sites are those located at the south part
of the state, where the water table is deeper.
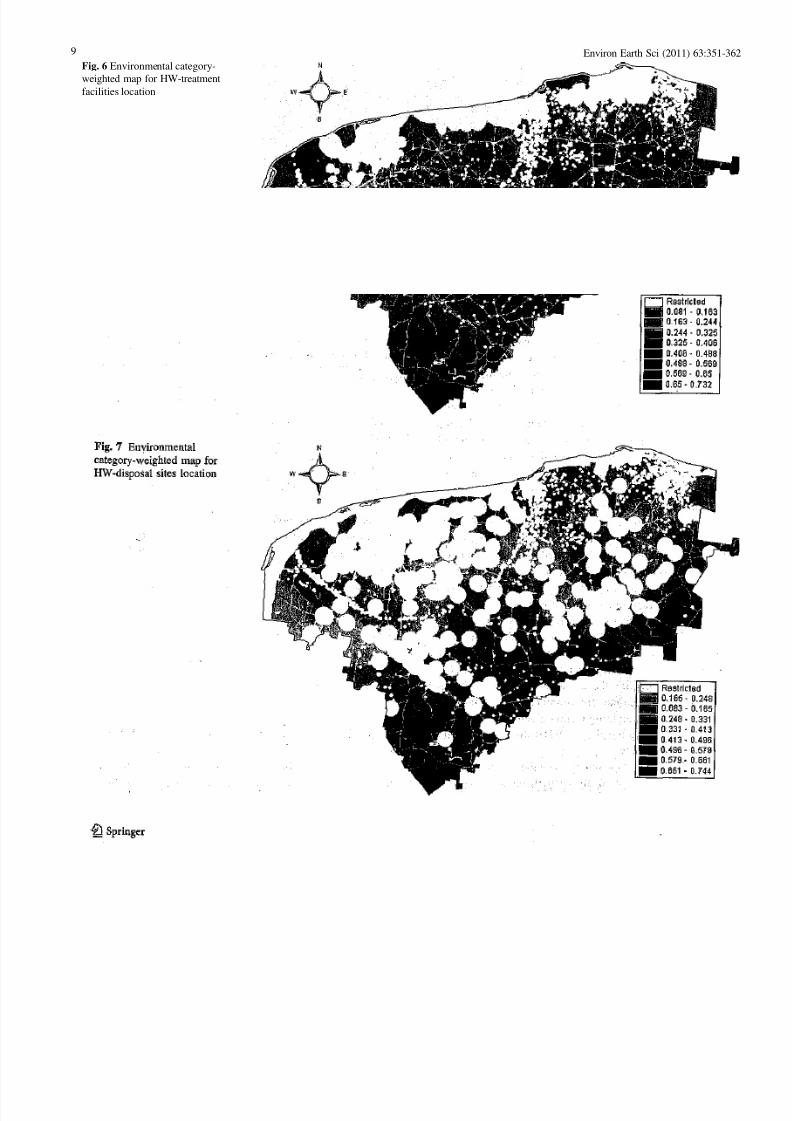
More differences can be observed between Figs. 8 and 9, for
the economic-weighted maps category; there are also fewer
suitable sites for HW-disposal sites than those for
Fig. 8 Economical category-
weighted map for HW-treatment
facilities location
Fig. 9 Economical category-
weighted map for HW-disposal
sites location
Restricted
0.111 - 0.221
0.221 - 0.332
mm0.332 - 0.442
0.442 - 0.553
7/31/2019 Meksika’ nın Yucatan Şehrinde Tehlikeli Atık Arıtma Tesisleri ve Düzenli Depolama Sahasında Bertaraf Konumlandırı…
http://slidepdf.com/reader/full/meksika-nin-yucatan-sehrinde-tehlikeli-atik-aritma-tesisleri-ve-duezenli 11/13
Environ Earth Sci (2011) 63:351-362
Springer
11
HW-treatment facilities. This is due to the fact that, as it was
mentioned before, closer areas to communities, roads and power
lines were considered better for HW-treatment facilities location
whereas for HW-disposal sites, there are restrictions regarding
these elements. According to the economic-weighted maps
category, the best areas are not at the south part of the State due
to the distance from the HW generation centres.
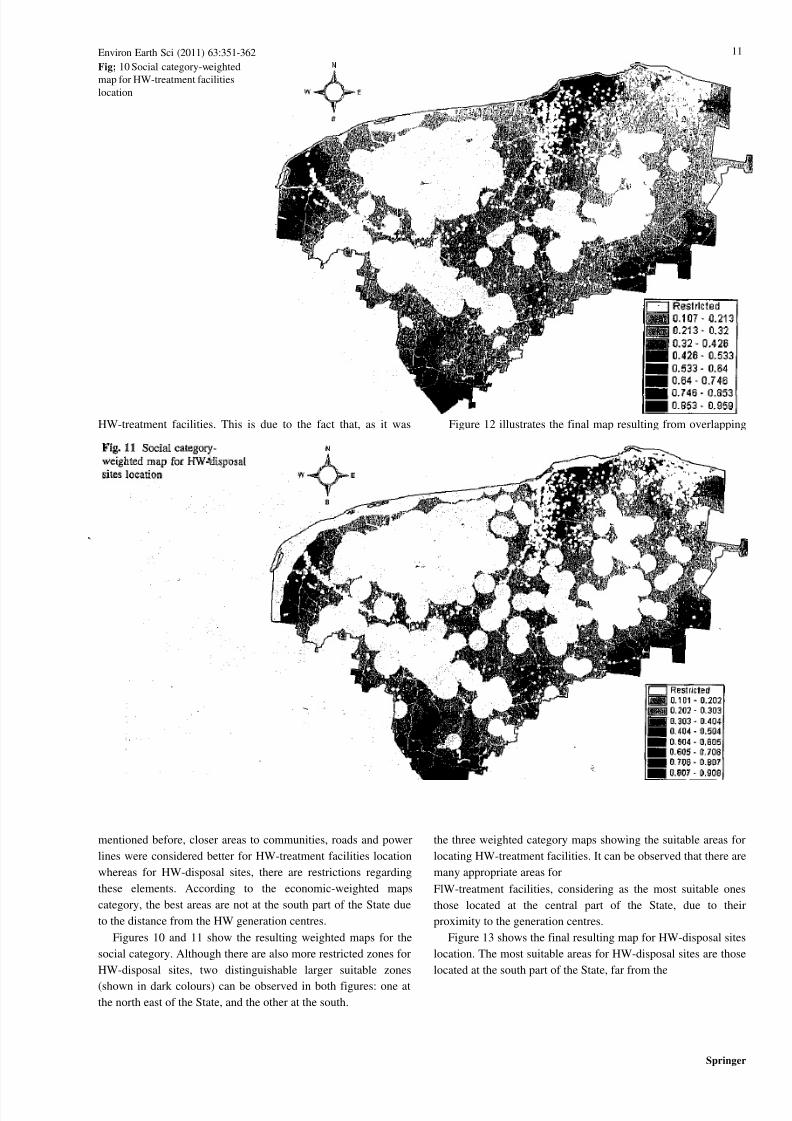
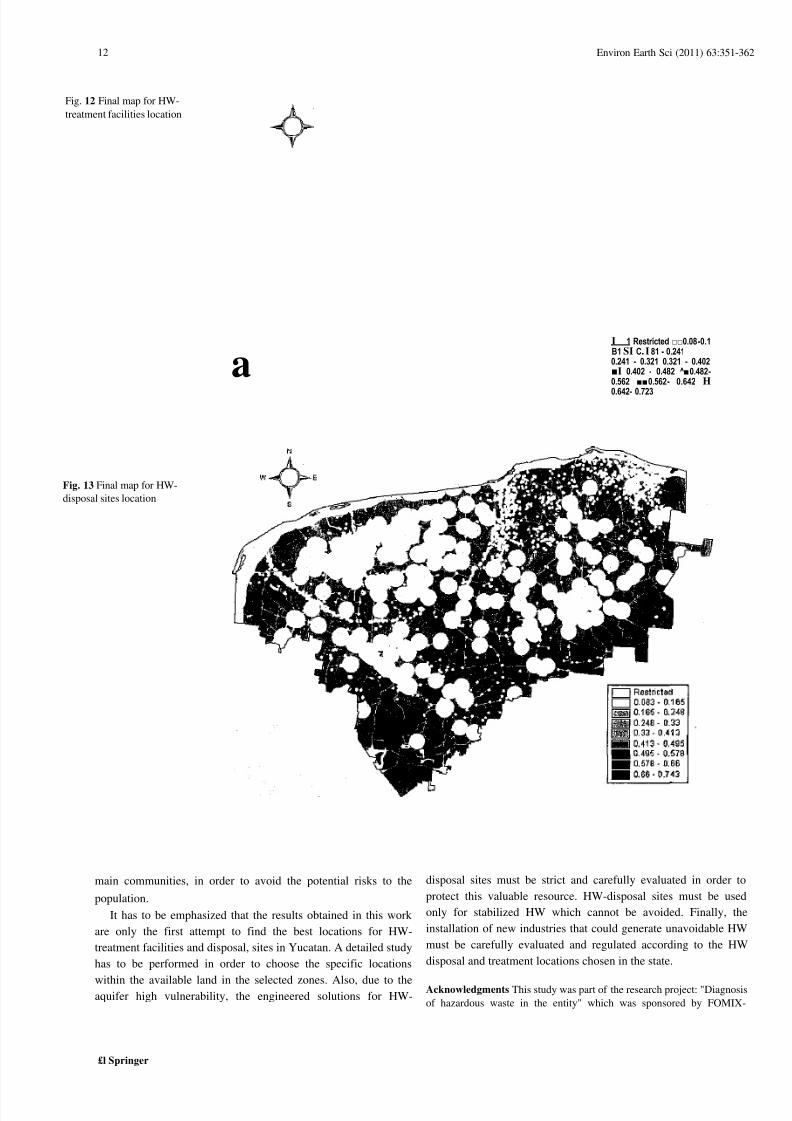
Figures 10 and 11 show the resulting weighted maps for the
social category. Although there are also more restricted zones for
HW-disposal sites, two distinguishable larger suitable zones
(shown in dark colours) can be observed in both figures: one at
the north east of the State, and the other at the south.
Figure 12 illustrates the final map resulting from overlapping
the three weighted category maps showing the suitable areas for
locating HW-treatment facilities. It can be observed that there are
many appropriate areas for
FlW-treatment facilities, considering as the most suitable ones
those located at the central part of the State, due to their
proximity to the generation centres.
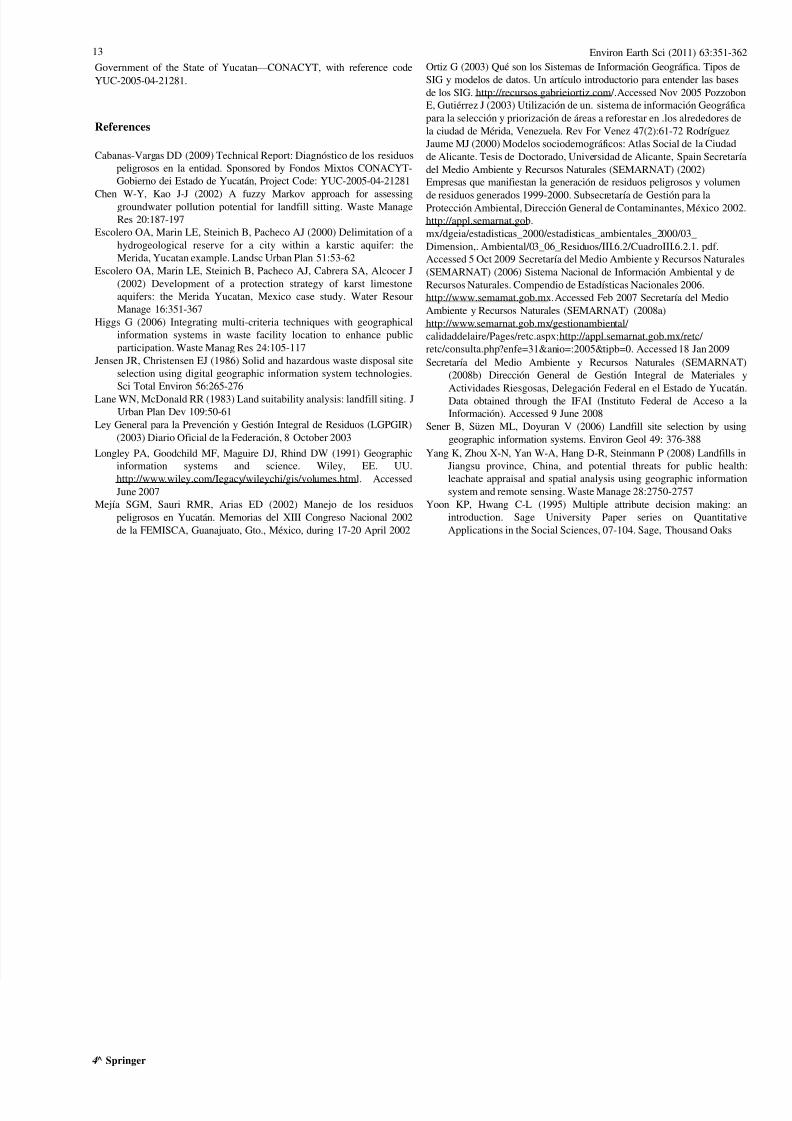
Figure 13 shows the final resulting map for HW-disposal sites
location. The most suitable areas for HW-disposal sites are those
located at the south part of the State, far from the
Fig; 10 Social category-weighted
map for HW-treatment facilities
location
7/31/2019 Meksika’ nın Yucatan Şehrinde Tehlikeli Atık Arıtma Tesisleri ve Düzenli Depolama Sahasında Bertaraf Konumlandırı…
http://slidepdf.com/reader/full/meksika-nin-yucatan-sehrinde-tehlikeli-atik-aritma-tesisleri-ve-duezenli 12/13
Environ Earth Sci (2011) 63:351-362
£l Springer
12
I 1 Restricted □□0.08-0.1
B1 SI C. I 81 - 0.241
0.241 - 0.321 0.321 - 0.402
■I 0.402 - 0.482 ^■0.482-
0.562 ■■0.562- 0.642 H
0.642- 0.723
main communities, in order to avoid the potential risks to the
population.
It has to be emphasized that the results obtained in this work
are only the first attempt to find the best locations for HW-
treatment facilities and disposal, sites in Yucatan. A detailed study
has to be performed in order to choose the specific locations
within the available land in the selected zones. Also, due to theaquifer high vulnerability, the engineered solutions for HW-
disposal sites must be strict and carefully evaluated in order to
protect this valuable resource. HW-disposal sites must be used
only for stabilized HW which cannot be avoided. Finally, the
installation of new industries that could generate unavoidable HW
must be carefully evaluated and regulated according to the HW
disposal and treatment locations chosen in the state.
Acknowledgments This study was part of the research project: "Diagnosis
of hazardous waste in the entity" which was sponsored by FOMIX-
a
Fig. 12 Final map for HW-
treatment facilities location
Fig. 13 Final map for HW-
disposal sites location
7/31/2019 Meksika’ nın Yucatan Şehrinde Tehlikeli Atık Arıtma Tesisleri ve Düzenli Depolama Sahasında Bertaraf Konumlandırı…
http://slidepdf.com/reader/full/meksika-nin-yucatan-sehrinde-tehlikeli-atik-aritma-tesisleri-ve-duezenli 13/13
Environ Earth Sci (2011) 63:351-362
4̂ Springer
13
Government of the State of Yucatan — CONACYT, with reference code
YUC-2005-04-21281.
References
Cabanas-Vargas DD (2009) Technical Report: Diagnóstico de los residuos
peligrosos en la entidad. Sponsored by Fondos Mixtos CONACYT-
Gobierno dei Estado de Yucatán, Project Code: YUC-2005-04-21281
Chen W-Y, Kao J-J (2002) A fuzzy Markov approach for assessinggroundwater pollution potential for landfill sitting. Waste Manage
Res 20:187-197
Escolero OA, Marin LE, Steinich B, Pacheco AJ (2000) Delimitation of a
hydrogeological reserve for a city within a karstic aquifer: the
Merida, Yucatan example. Landsc Urban Plan 51:53-62
Escolero OA, Marin LE, Steinich B, Pacheco AJ, Cabrera SA, Alcocer J
(2002) Development of a protection strategy of karst limestone
aquifers: the Merida Yucatan, Mexico case study. Water Resour
Manage 16:351-367
Higgs G (2006) Integrating multi-criteria techniques with geographical
information systems in waste facility location to enhance public
participation. Waste Manag Res 24:105-117
Jensen JR, Christensen EJ (1986) Solid and hazardous waste disposal site
selection using digital geographic information system technologies.
Sci Total Environ 56:265-276
Lane WN, McDonald RR (1983) Land suitability analysis: landfill siting. J
Urban Plan Dev 109:50-61
Ley General para la Prevención y Gestión Integral de Residuos (LGPGIR)
(2003) Diario Oficial de la Federación, 8 October 2003
Longley PA, Goodchild MF, Maguire DJ, Rhind DW (1991) Geographic
information systems and science. Wiley, EE. UU.
http://www.wiley.com/Iegacy/wileychi/gis/volumes.html. Accessed
June 2007
Mejía SGM, Sauri RMR, Arias ED (2002) Manejo de los residuos
peligrosos en Yucatán. Memorias del XIII Congreso Nacional 2002
de la FEMISCA, Guanajuato, Gto., México, during 17-20 April 2002
Ortiz G (2003) Qué son los Sistemas de Información Geográfica. Tipos de
SIG y modelos de datos. Un artículo introductorio para entender las bases
de los SIG. http://recursos.gabrieiortiz.com/.Accessed Nov 2005 Pozzobon
E, Gutiérrez J (2003) Utilización de un. sistema de información Geográfica
para la selección y priorización de áreas a reforestar en .los alrededores de
la ciudad de Mérida, Venezuela. Rev For Venez 47(2):61-72 Rodríguez
Jaume MJ (2000) Modelos sociodemográficos: Atlas Social de la Ciudad
de Alicante. Tesis de Doctorado, Universidad de Alicante, Spain Secretaría
del Medio Ambiente y Recursos Naturales (SEMARNAT) (2002)
Empresas que manifiestan la generación de residuos peligrosos y volumen
de residuos generados 1999-2000. Subsecretaría de Gestión para laProtección Ambiental, Dirección General de Contaminantes, México 2002.
http://appl.semarnat.gob.
mx/dgeia/estadisticas_2000/estadisticas_ambientales_2000/03_
Dimension,. Ambiental/03_06_Residuos/III.6.2/CuadroIII.6.2.1. pdf.
Accessed 5 Oct 2009 Secretaría del Medio Ambiente y Recursos Naturales
(SEMARNAT) (2006) Sistema Nacional de Información Ambiental y de
Recursos Naturales. Compendio de Estadísticas Nacionales 2006.
http://www.semamat.gob.mx.Accessed Feb 2007 Secretaría del Medio
Ambiente y Recursos Naturales (SEMARNAT) (2008a)
http://www.semarnat.gob.mx/gestionambiental/
calidaddelaire/Pages/retc.aspx;http://appl.semarnat.gob.mx/retc/
retc/consulta.php?enfe=31&anio=:2005&tipb=0. Accessed 18 Jan 2009
Secretaría del Medio Ambiente y Recursos Naturales (SEMARNAT)
(2008b) Dirección General de Gestión Integral de Materiales y
Actividades Riesgosas, Delegación Federal en el Estado de Yucatán.Data obtained through the IFAI (Instituto Federal de Acceso a la
Información). Accessed 9 June 2008
Sener B, Süzen ML, Doyuran V (2006) Landfill site selection by using
geographic information systems. Environ Geol 49: 376-388
Yang K, Zhou X-N, Yan W-A, Hang D-R, Steinmann P (2008) Landfills in
Jiangsu province, China, and potential threats for public health:
leachate appraisal and spatial analysis using geographic information
system and remote sensing. Waste Manage 28:2750-2757
Yoon KP, Hwang C-L (1995) Multiple attribute decision making: an
introduction. Sage University Paper series on Quantitative
Applications in the Social Sciences, 07-104. Sage, Thousand Oaks